Article

Study on the Influence of Different Slope Perforations on the Hydrodynamic Performance of Ship Stabilizing Fins

1
School of Naval Architecture and Maritime, Zhejiang Ocean University, Zhoushan 316022, China
2
School of Naval Architecture, Ocean and Energy Power Engineering, Wuhan University of Technology, Wuhan 430010, China
*
Authors to whom correspondence should be addressed.
J. Mar. Sci. Eng. 2026, 14(10), 882; https://doi.org/10.3390/jmse14100882
Submission received: 27 March 2026 / Revised: 27 April 2026 / Accepted: 8 May 2026 / Published: 10 May 2026
(This article belongs to the Section Ocean Engineering)

Abstract

The hydrodynamic characteristics of fin stabilizers are investigated in this paper. Numerical simulations are conducted via a computational fluid dynamics (CFD) method for a fin stabilizer based on the NACA0018 airfoil, and the influence mechanisms of parameters including perforation size, structural configuration, and perforated chamfer angle on the hydrodynamic performance of the fin stabilizer are systematically analyzed. In combination with model experiments on roll stabilizing fins carried out in a towing tank, the feasibility of the numerical simulation method is verified through comparative testing. A solid theoretical basis for the optimal design of high-performance fin stabilizers is provided by this study, and important engineering application value is obtained for improving the navigational safety and adaptability of ships.

1. Introduction

Wind and waves are the main external factors that cause ships to sway. When a ship is sailing at sea, the impact of waves and the force of the wind can cause the hull to produce motions such as roll, pitch, and heave [1]. This instability not only threatens the safety of crew members and cargo, but also affects the navigation efficiency of the ship and the normal operation of equipment. Severe swaying can cause the ship to lose stability and even result in capsizing accidents [2]. Ship swaying increases navigation resistance and reduces propulsion efficiency, leading to increased fuel consumption and decreased speed. In addition, swaying can affect the maneuverability of the ship, making navigation more difficult. Ship swaying can have a negative impact on the normal operation of on-board equipment [3].
Therefore, anti-roll technology has important application value in ship design and navigation. Anti-roll technology can effectively reduce the amplitude of ship sway and improve its stability, thereby reducing the probability of capsizing accidents [4]. Anti-roll technology can reduce vibration and uneven stress on ship-borne equipment, ensuring its normal operation [5]. This is particularly important for long-distance ships, as it can significantly improve passenger satisfaction and ship competitiveness.
Common anti-roll technology includes bilge keel anti-roll, anti-roll tank, anti-roll fin, gyro anti-roll device, anti-roll rudder, etc. The anti-roll fin is the most widely used active anti-roll device, which mainly reduces the ship’s roll amplitude by adjusting the angle of the fin to generate a force moment opposite to the direction of the ship’s roll. The anti-roll effect can reach 80–90%, suitable for ships traveling at medium and high speeds. Since the beginning of the 20th century, anti-roll fin technology has matured and has high reliability [6].
From the perspective of fluid mechanics, the lift generation mechanism of stabilizing fins is similar to that of the wings of fixed-wing aircraft. When the fin forms an angle of attack with the incoming flow, a pressure difference occurs on its surface according to Bernoulli’s principle: the flow velocity on the upper surface increases and the pressure decreases, while the flow velocity on the lower surface is slower and the pressure is higher. This pressure difference is the source of lift [7,8]. Stabilizing fins use this lift to apply a symmetrical stabilizing moment to the hull, thereby offsetting the rolling moment caused by ocean waves and significantly suppressing ship rolling [9]. The effectiveness of stabilizing fins is highly dependent on the water flow velocity, as it directly affects the pressure distribution on the fin surface. The direction of lift can be controlled by adjusting the angle of attack of the fin: a positive angle of attack generates upward lift, while a negative angle of attack generates downward lift [10].
Jiao et al. conducts tank tests on an S175 containership model and adopts the PPO algorithm to control flap-type fin stabilizers, verifying the excellent oblique wave anti-rolling performance and application potential of the intelligent control scheme [11]. Xu et al. experimentally investigates the anti-rolling control of a ship at zero speed using a flap-type fin stabilizer and deep reinforcement learning algorithm [12]. Zhou et al. design, fabricate and assemble a containership model integrated with a flap-type fin stabilizer anti-rolling system [13].
At present, most optimizations of fin stabilizers focus on active control strategies and the addition of structural features [14]. Thus, this study attempts to extend the perforation design to the field of fin stabilizers, focusing on investigating the influence of perforations on the hydrodynamic performance.
This article uses the NACA0018 airfoil as the prototype fin stabilizer, and studies the impact of perforation on the hydrodynamic performance of the fin stabilizer through pool experiments and numerical simulations. By studying the lift and drag forces and lift and drag coefficients generated by straight-walled perforation with different diameter on the fin stabilizer at the same speed, the lift and drag forces and lift and drag coefficients generated by oblique-angle perforations with different slopes on the fin stabilizer at the same speed and diameter, and the lift and drag forces and lift and drag coefficients generated by different speeds on the fin stabilizer with the same slope and perforation diameter.

2. Hydrodynamic Forces and Coefficients

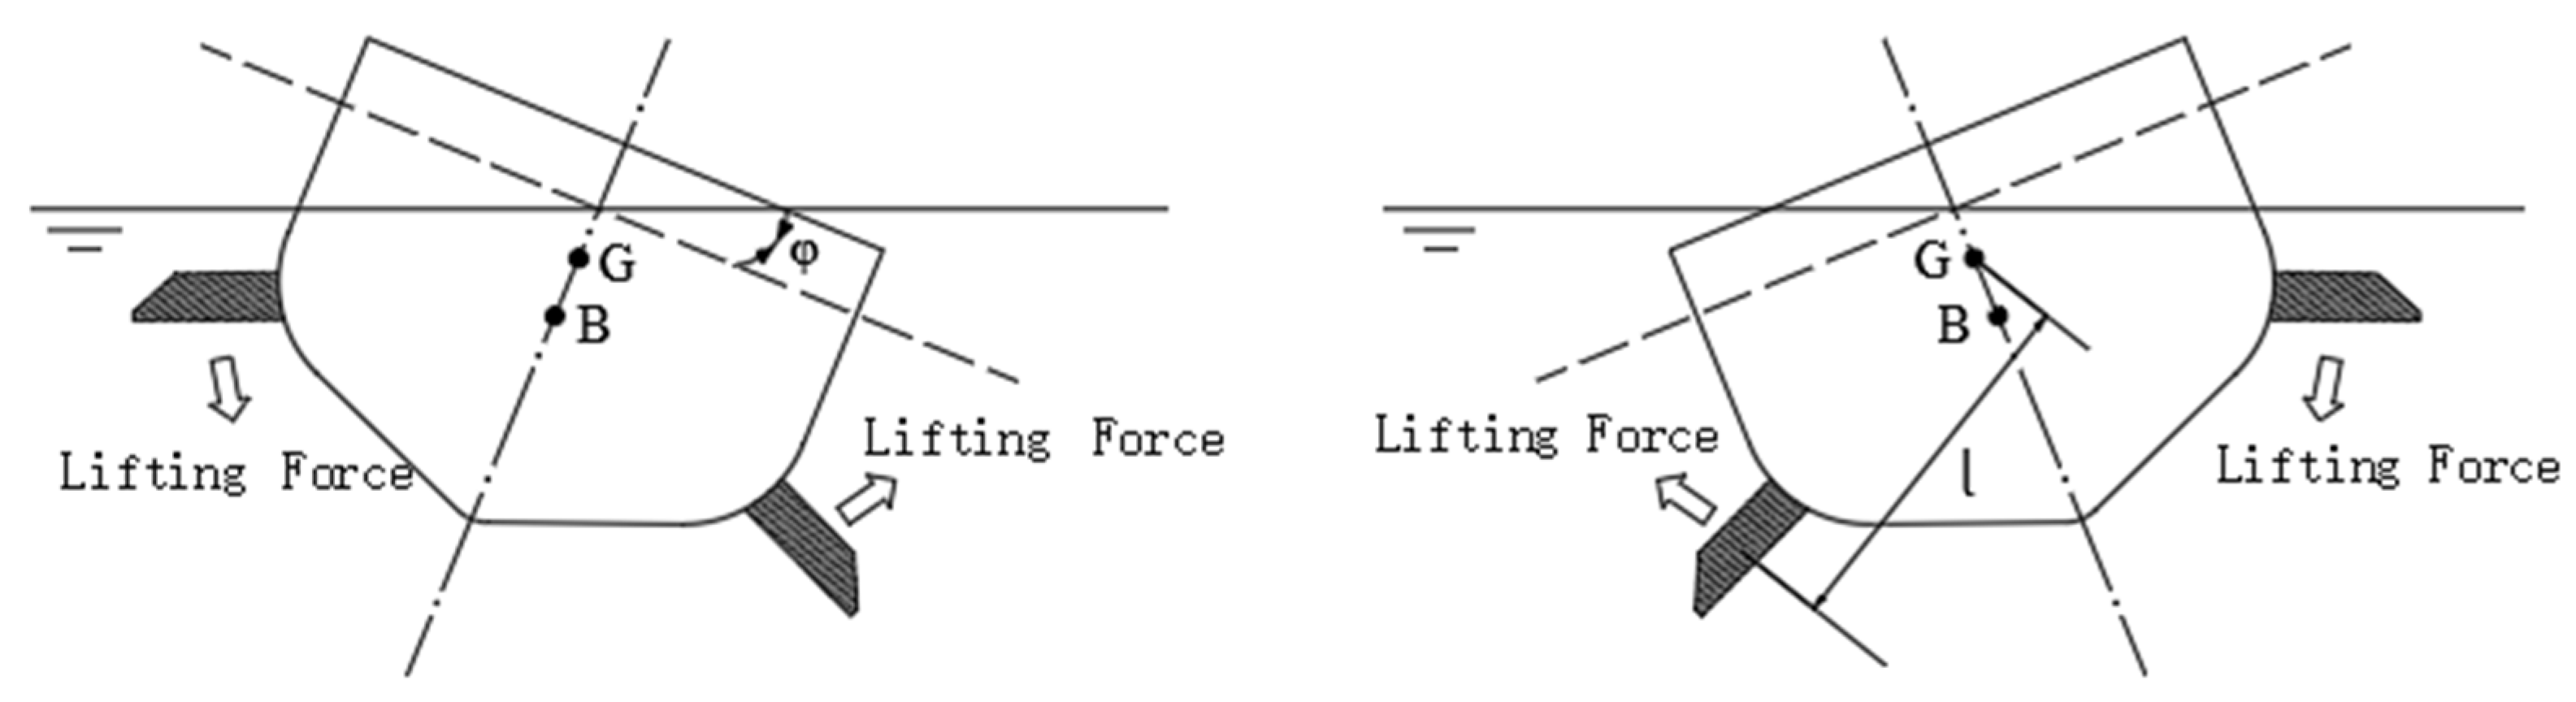
The stabilizing fin is designed with reference to the wings of fixed-wing aircraft. Its fin surface shape resembles the wings of a small aircraft. Each stabilizing fin system is equipped with two fins of exactly the same size, symmetrically installed on both sides of the ship. Common anti-roll fin devices are generally installed at the bilge of the bow or stern, commonly with a pair installed at the stern, or two pairs at the bow and stern. As shown in Figure 1, the water flowing through the upper and lower surfaces of the fin causes the stabilizing fin to generate lift, thereby generating a righting moment to counteract the roll disturbance moment, thus reducing the ship’s roll.
This study employs numerical simulation to investigate the effects of varying fin angles, perforation configurations, and chamfered perforation designs on the hydrodynamic performance of NACA0018 airfoil-based anti-roll fins.
The lift coefficient C L and drag coefficient C D are dimensionless parameters that describe the lift and drag characteristics of the stabilizing fin, respectively. Their calculation formulas are
C L = L 1 2 ρ ν 2 S
C D = D 1 2 ρ ν 2 S
where L , D represents the lift generated by the stabilizing fin, respectively, N ; ρ represents the density of water, k g / m 3 ; ν represents the velocity of the water flow relative to the stabilizing fin, m / s ; S represents the reference area of the stabilizing fin, m 2 ; C L and C D represents the lift coefficient of the stabilizing fin, respectively.
The lift-to-drag ratio is a crucial parameter for assessing the performance of stabilizing fins. It is defined as the ratio of lift to drag:
L / D =   C L C D

3. Numerical Calculation Model

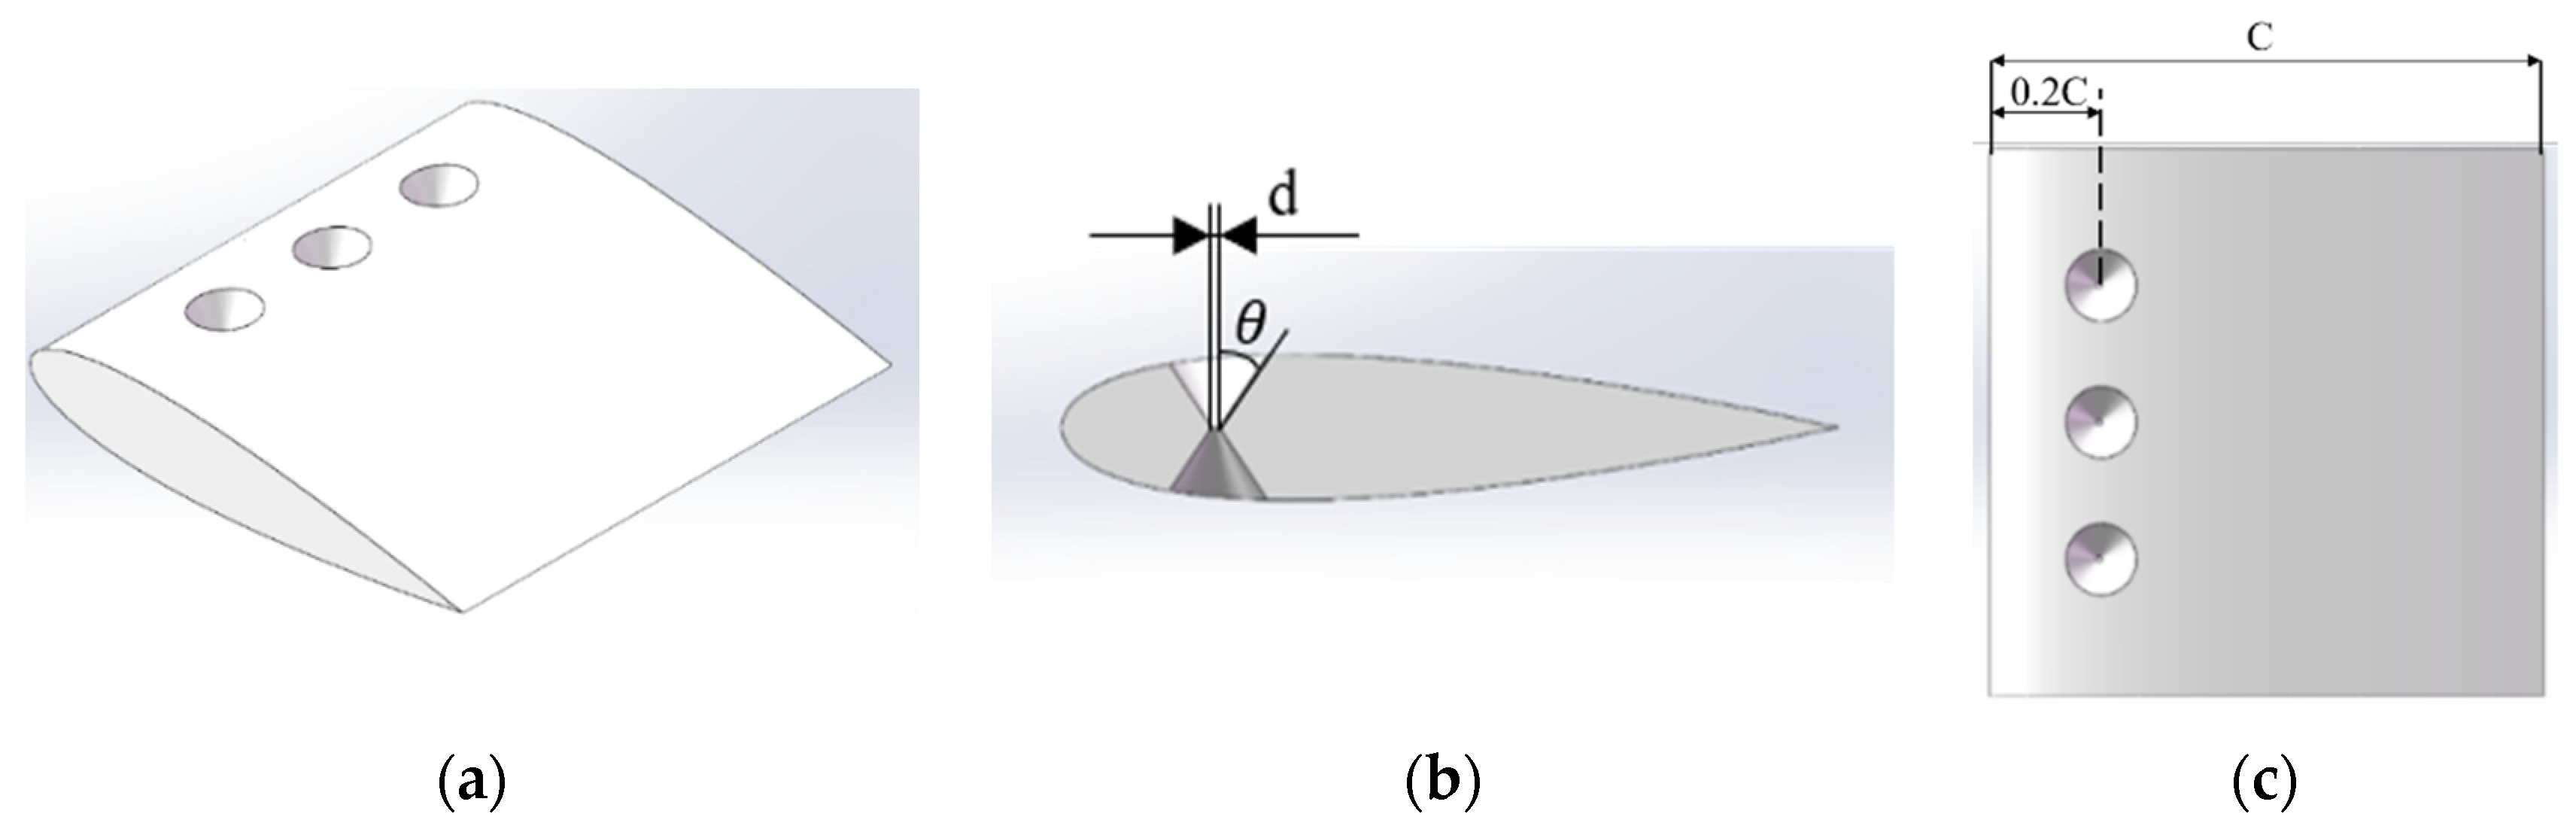
Three-dimensional modeling software is utilized to develop a series of anti-roll fin models featuring distinct perforation patterns and diameters. A representative fin model incorporating a 1% chord length (C) perforation diameter and 35° chamfered perforation is adopted as the benchmark specimen, as illustrated in Figure 2. The anti-roll fin features a span length of 1 m and a chord length of 1 m. The perforations are uniformly distributed along the spanwise direction, with centers located at 0.2 C from the leading edge.
Numerical simulations of the NACA0018 airfoil-based anti-roll fin prototype were performed using STAR-CCM+ (version 2210). The fluid domain was modeled as a three-dimensional, incompressible, constant-density flow field. To account for the potentially unsteady flow behavior around the fin, the simulations were performed within the framework of three-dimensional unsteady RANS, and the governing equations were solved using an implicit unsteady scheme. Turbulence closure was provided by the standard k-ε model. Prism-layer meshes were generated near the fin surface, and an appropriate near-wall treatment was adopted. Based on this numerical framework, the lift and drag forces of different fin configurations were predicted over a range of incoming flow velocities.
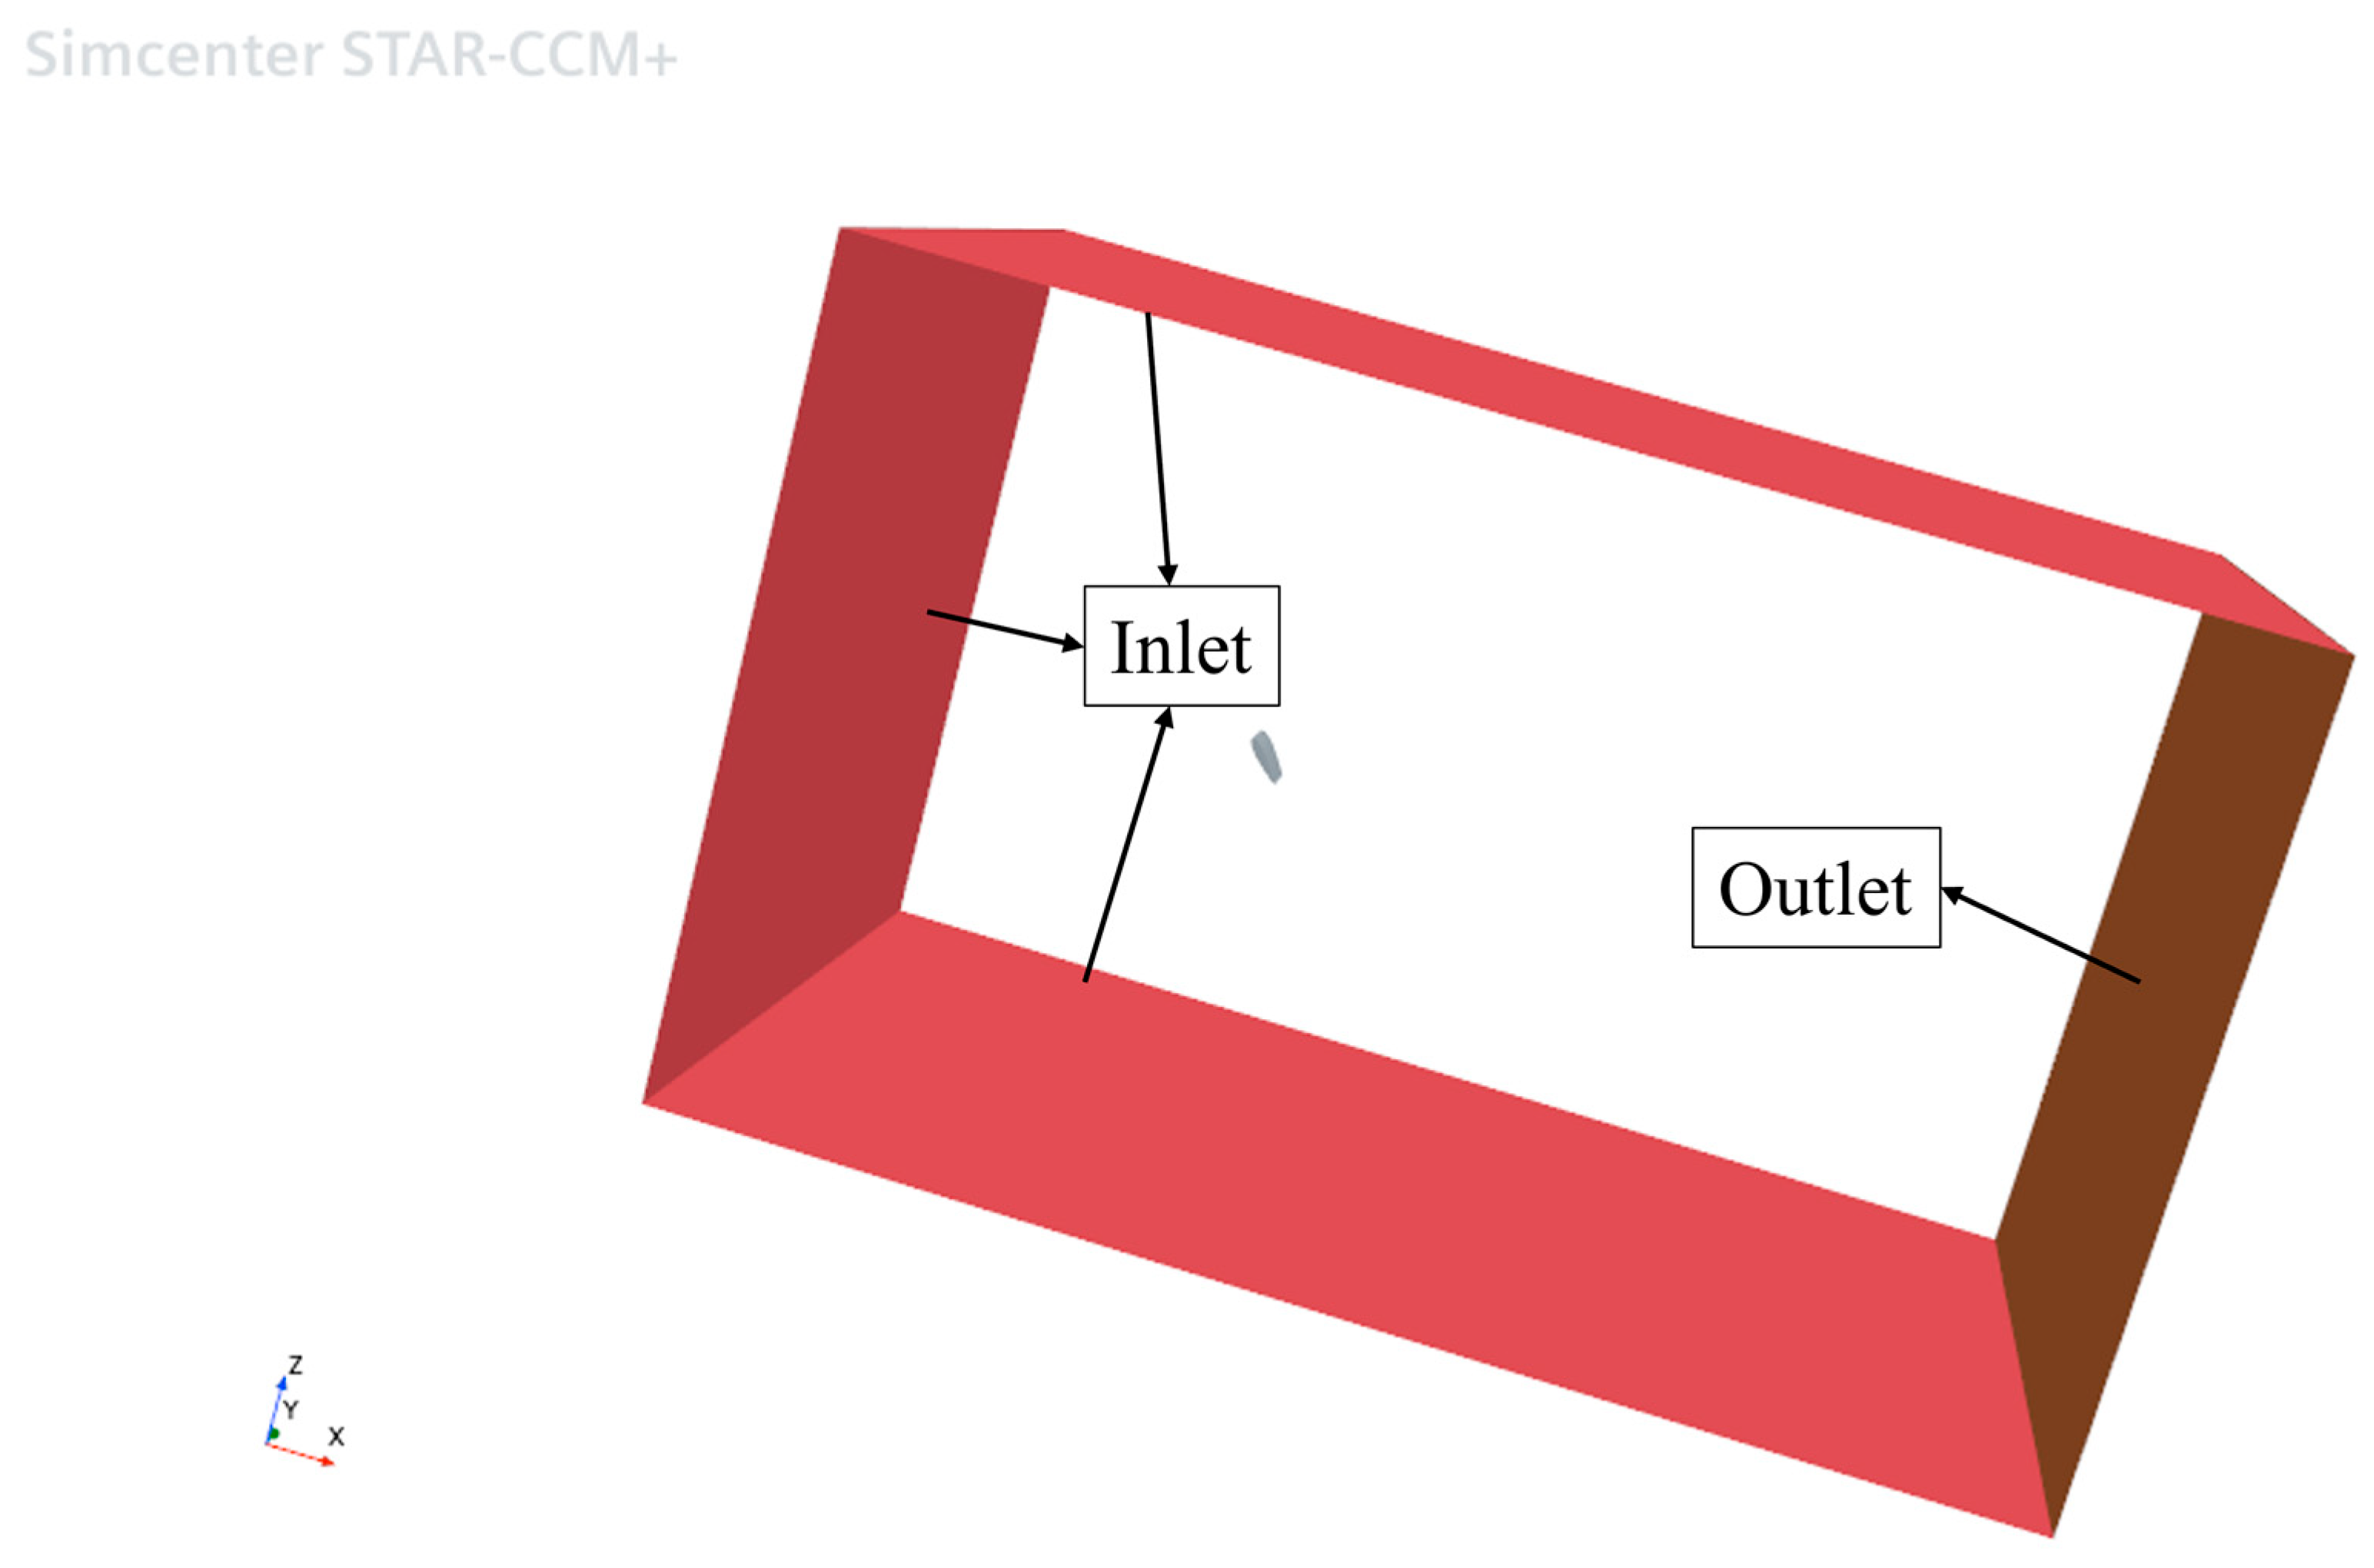
The computational domain was designed as a rectangular enclosure, with the coordinate origin positioned at the center of the fin stabilizer’s leading edge, and the fin model placed at the geometric center of the domain. Prism-layer meshes were generated near the fin surface, and an appropriate near-wall treatment was adopted. For boundary conditions, the anti-roll fin surface was specified as a no-slip rigid wall boundary. The upstream face of the computational domain was set as a velocity inlet; the downstream face was designated as a pressure outlet boundary. All remaining lateral faces of the domain were defined as symmetry boundaries, as schematically illustrated in Figure 3.
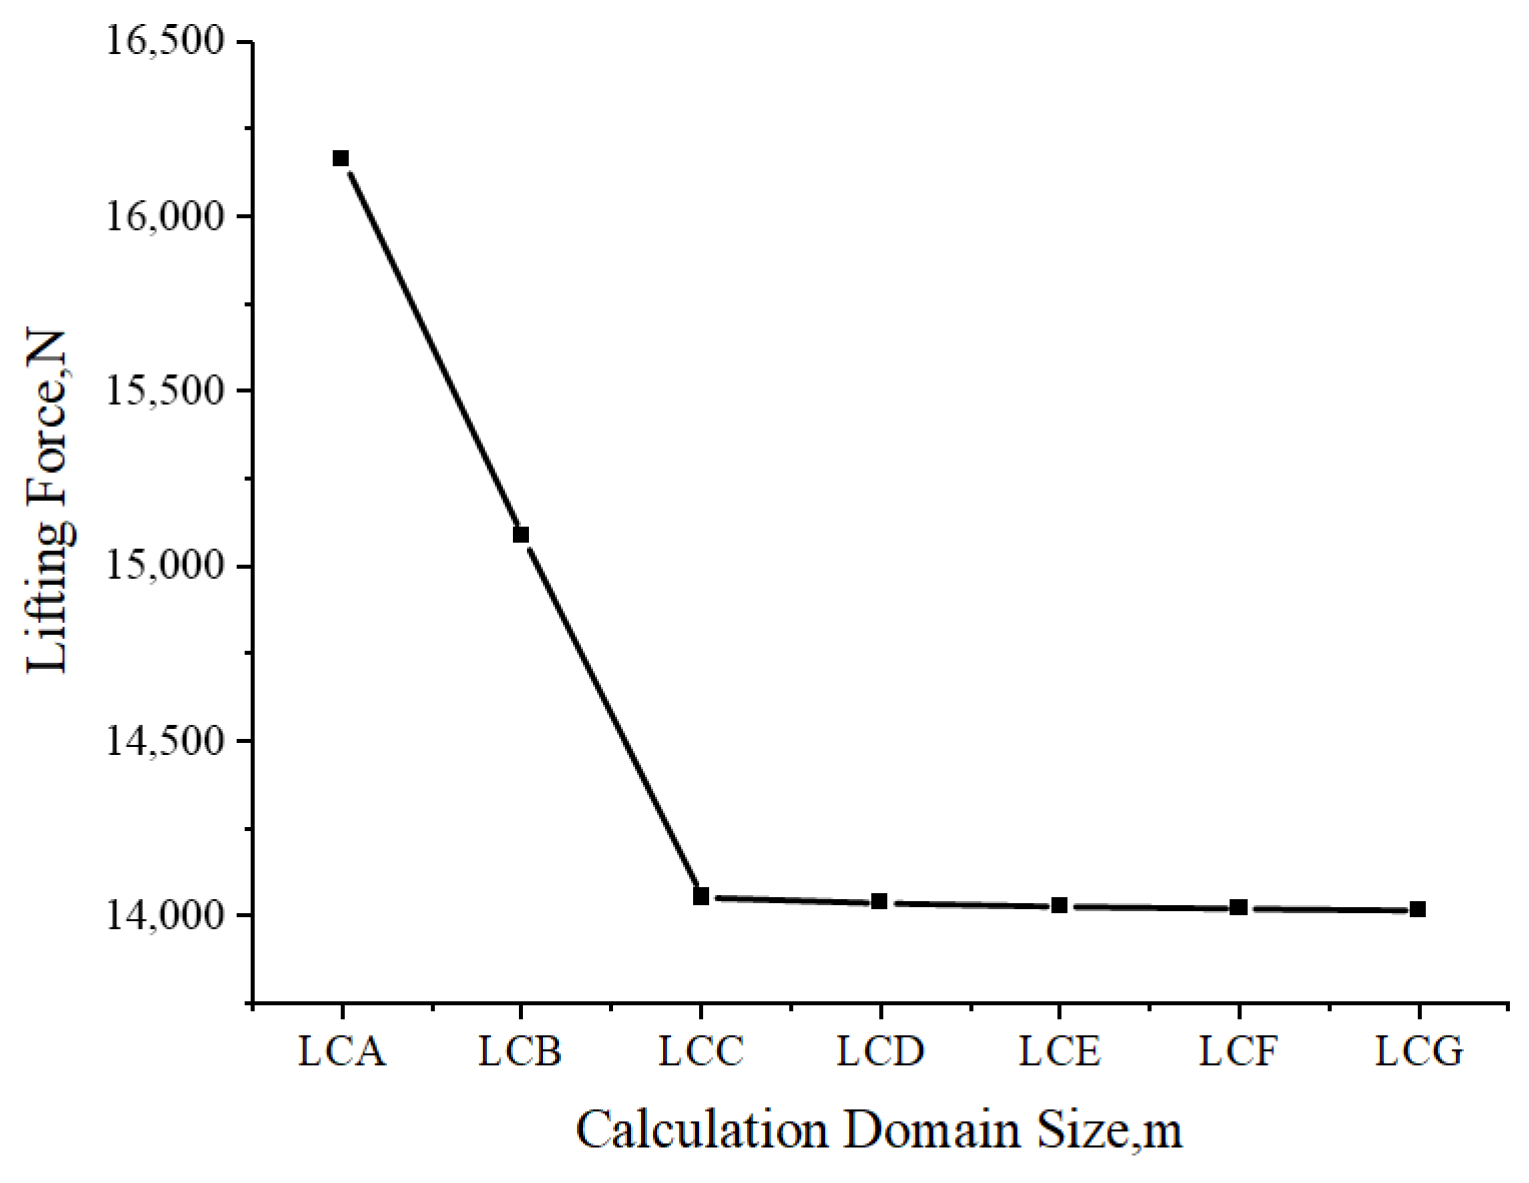
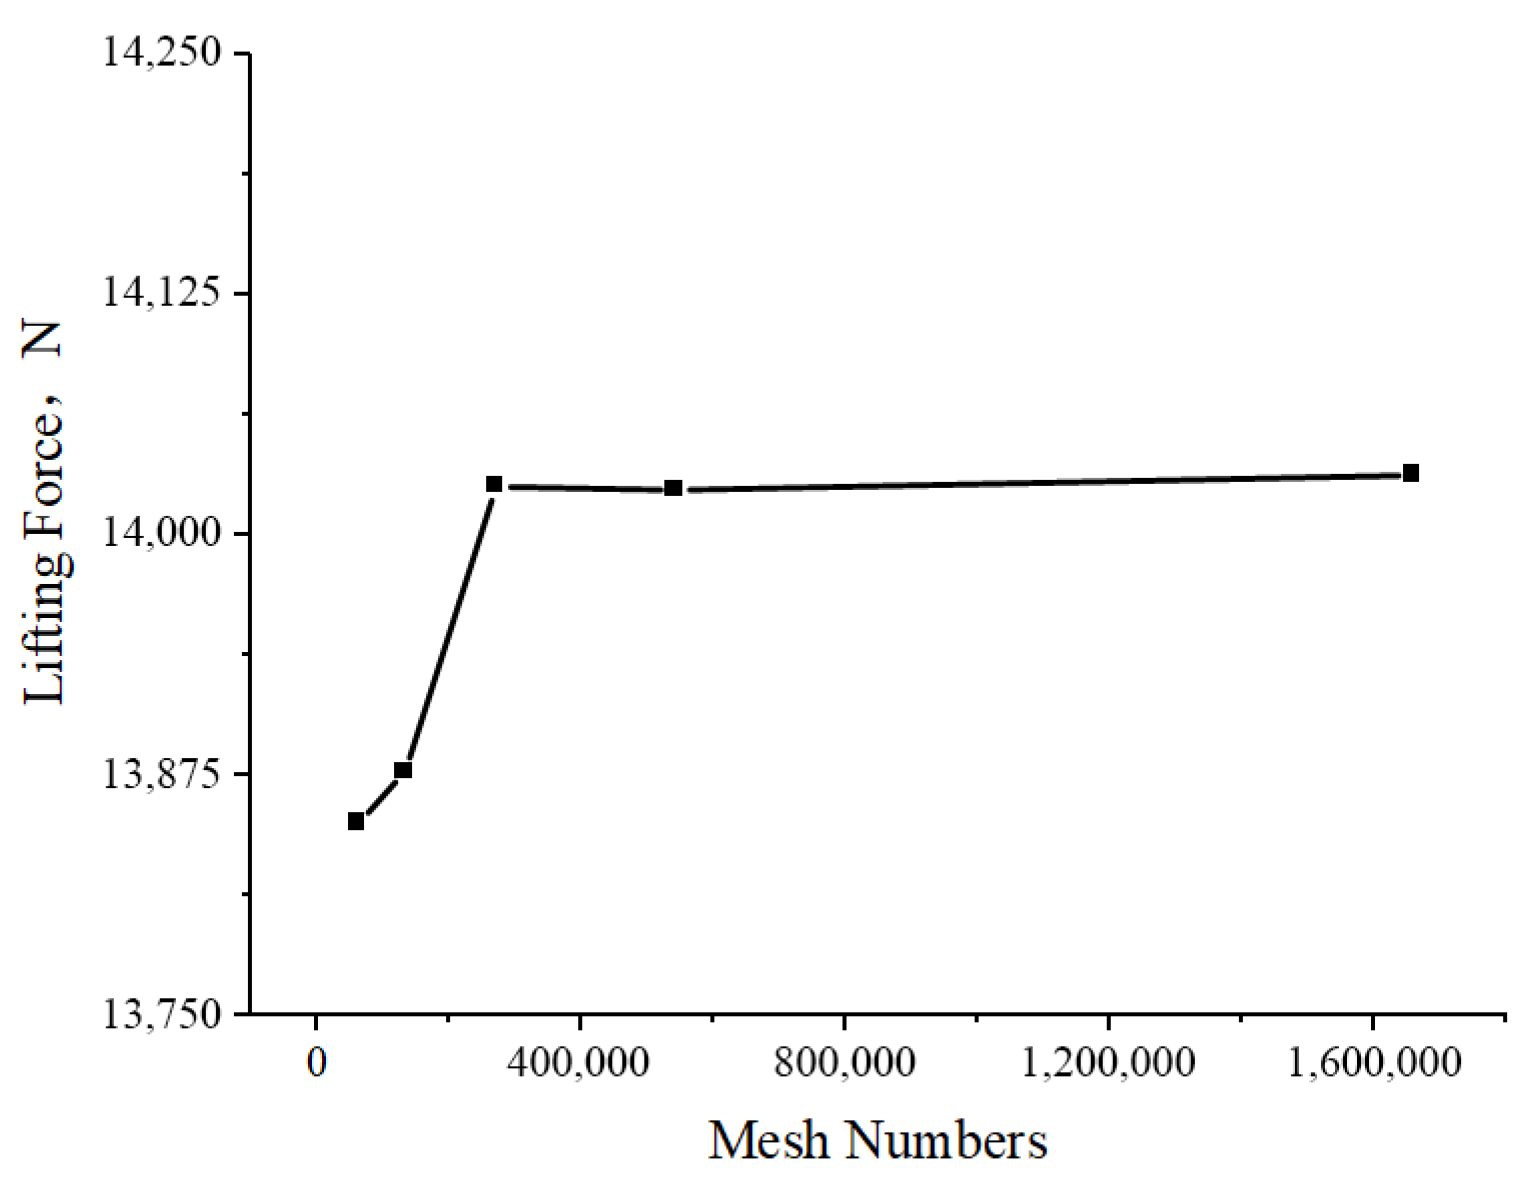
To ensure the reliability and validity of the numerical simulation framework, a rigorous independence study was conducted for both computational domain size and mesh density at a fixed fin angle of 10°, via iterative numerical analyses across varying domain dimensions and grid cell counts. Seven distinct computational domain scales were tested sequentially, designated as LCA (16 m × 6 m × 6 m), LCB (18 m × 8 m × 8 m), LCC (20 m × 10 m × 10 m), LCD (22 m × 12 m × 12 m), LCE (24 m × 14 m × 14 m), LCF (26 m × 16 m × 16 m), and LCG (28 m × 18 m × 18 m). Figure 4 plots the lift force output of the fin stabilizer across these varying domain scales under identical boundary conditions. Balancing computational accuracy and operational efficiency, the LCF domain configuration was selected as the optimal standard for all subsequent simulations. Additionally, a grid convergence study was performed using five graded mesh densities, with total cell counts of 62,125, 132,789, 270,787, 541,574, and 1,657,878, respectively. Corresponding lift force data for each mesh density, tested under consistent boundary parameters, is presented in Figure 5.
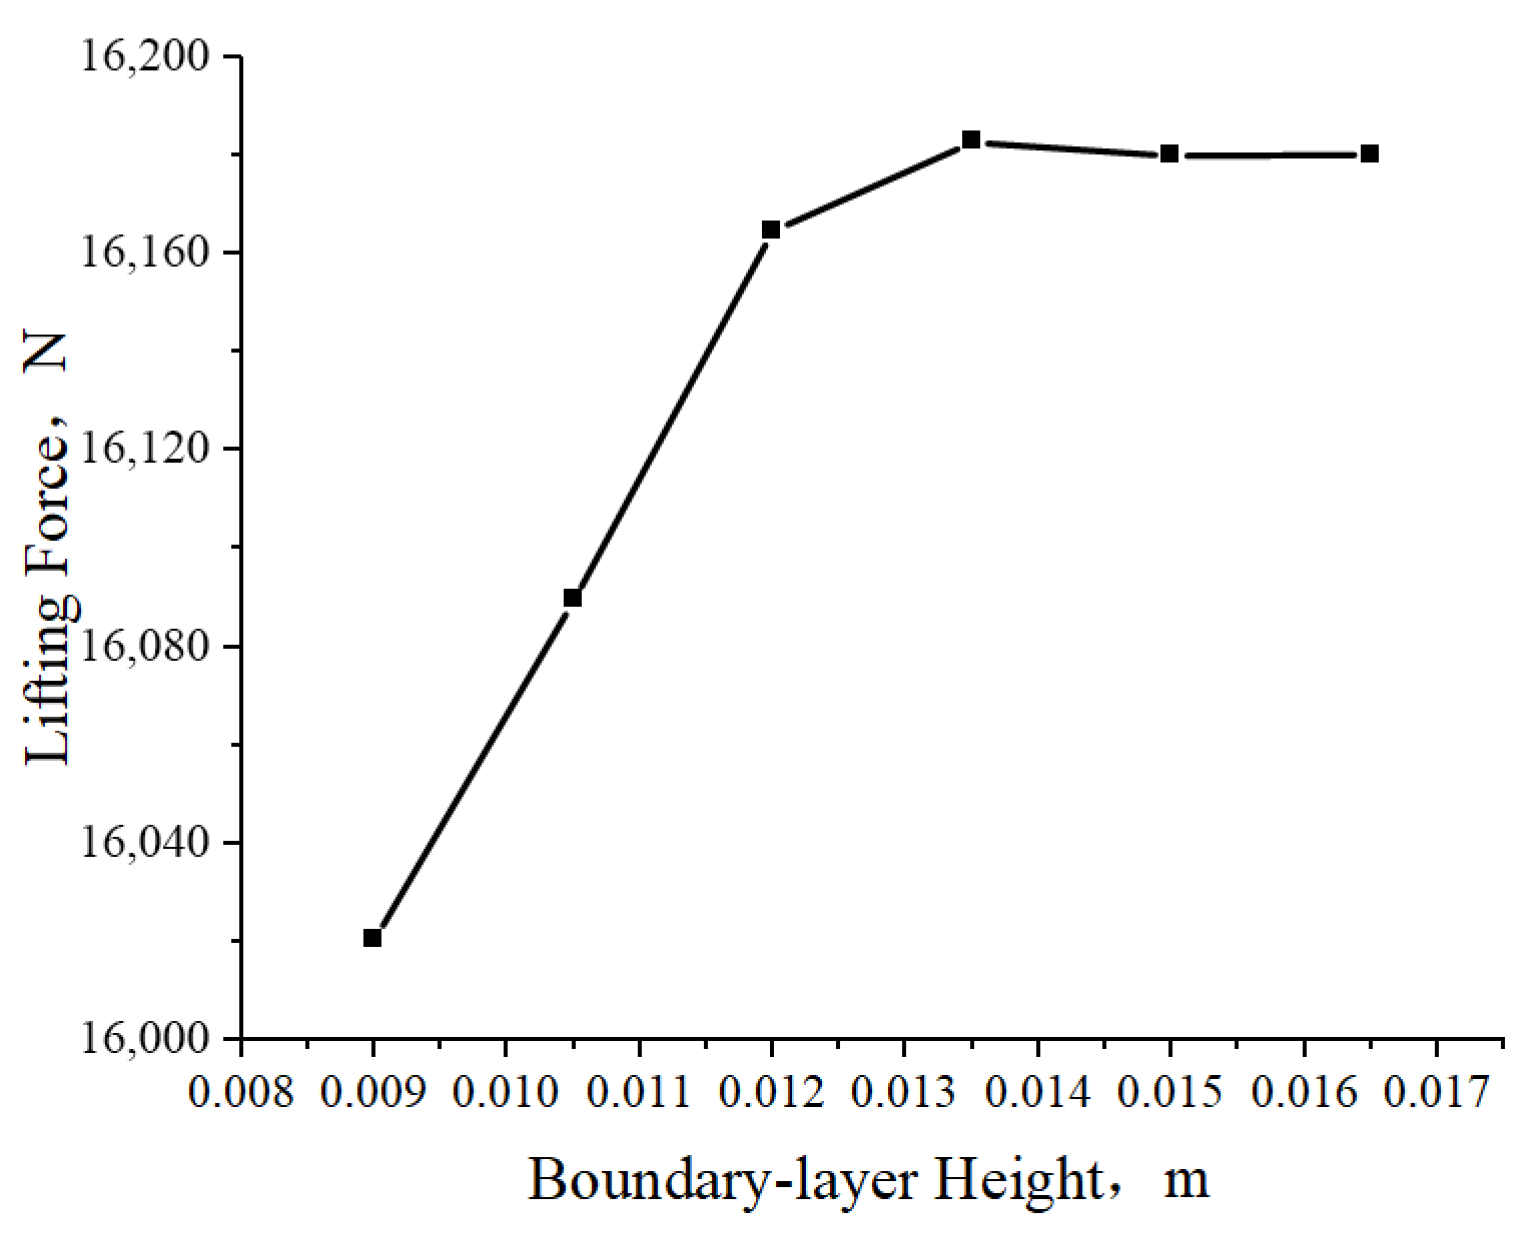
On the basis of the above independence tests and convergence analyses, the final numerical simulation setup is finalized as follows: the computational domain is sized at 26 m × 16 m × 16 m, paired with a total grid count of 270,787 cells. Based on the above mesh-sensitivity study, an additional sensitivity study was performed. Using the selected mesh scheme, six boundary-layer thicknesses, i.e., 0.009 m, 0.0105 m, 0.012 m, 0.0135 m, 0.015 m, and 0.0165 m, were tested. The results are presented in Figure 6.
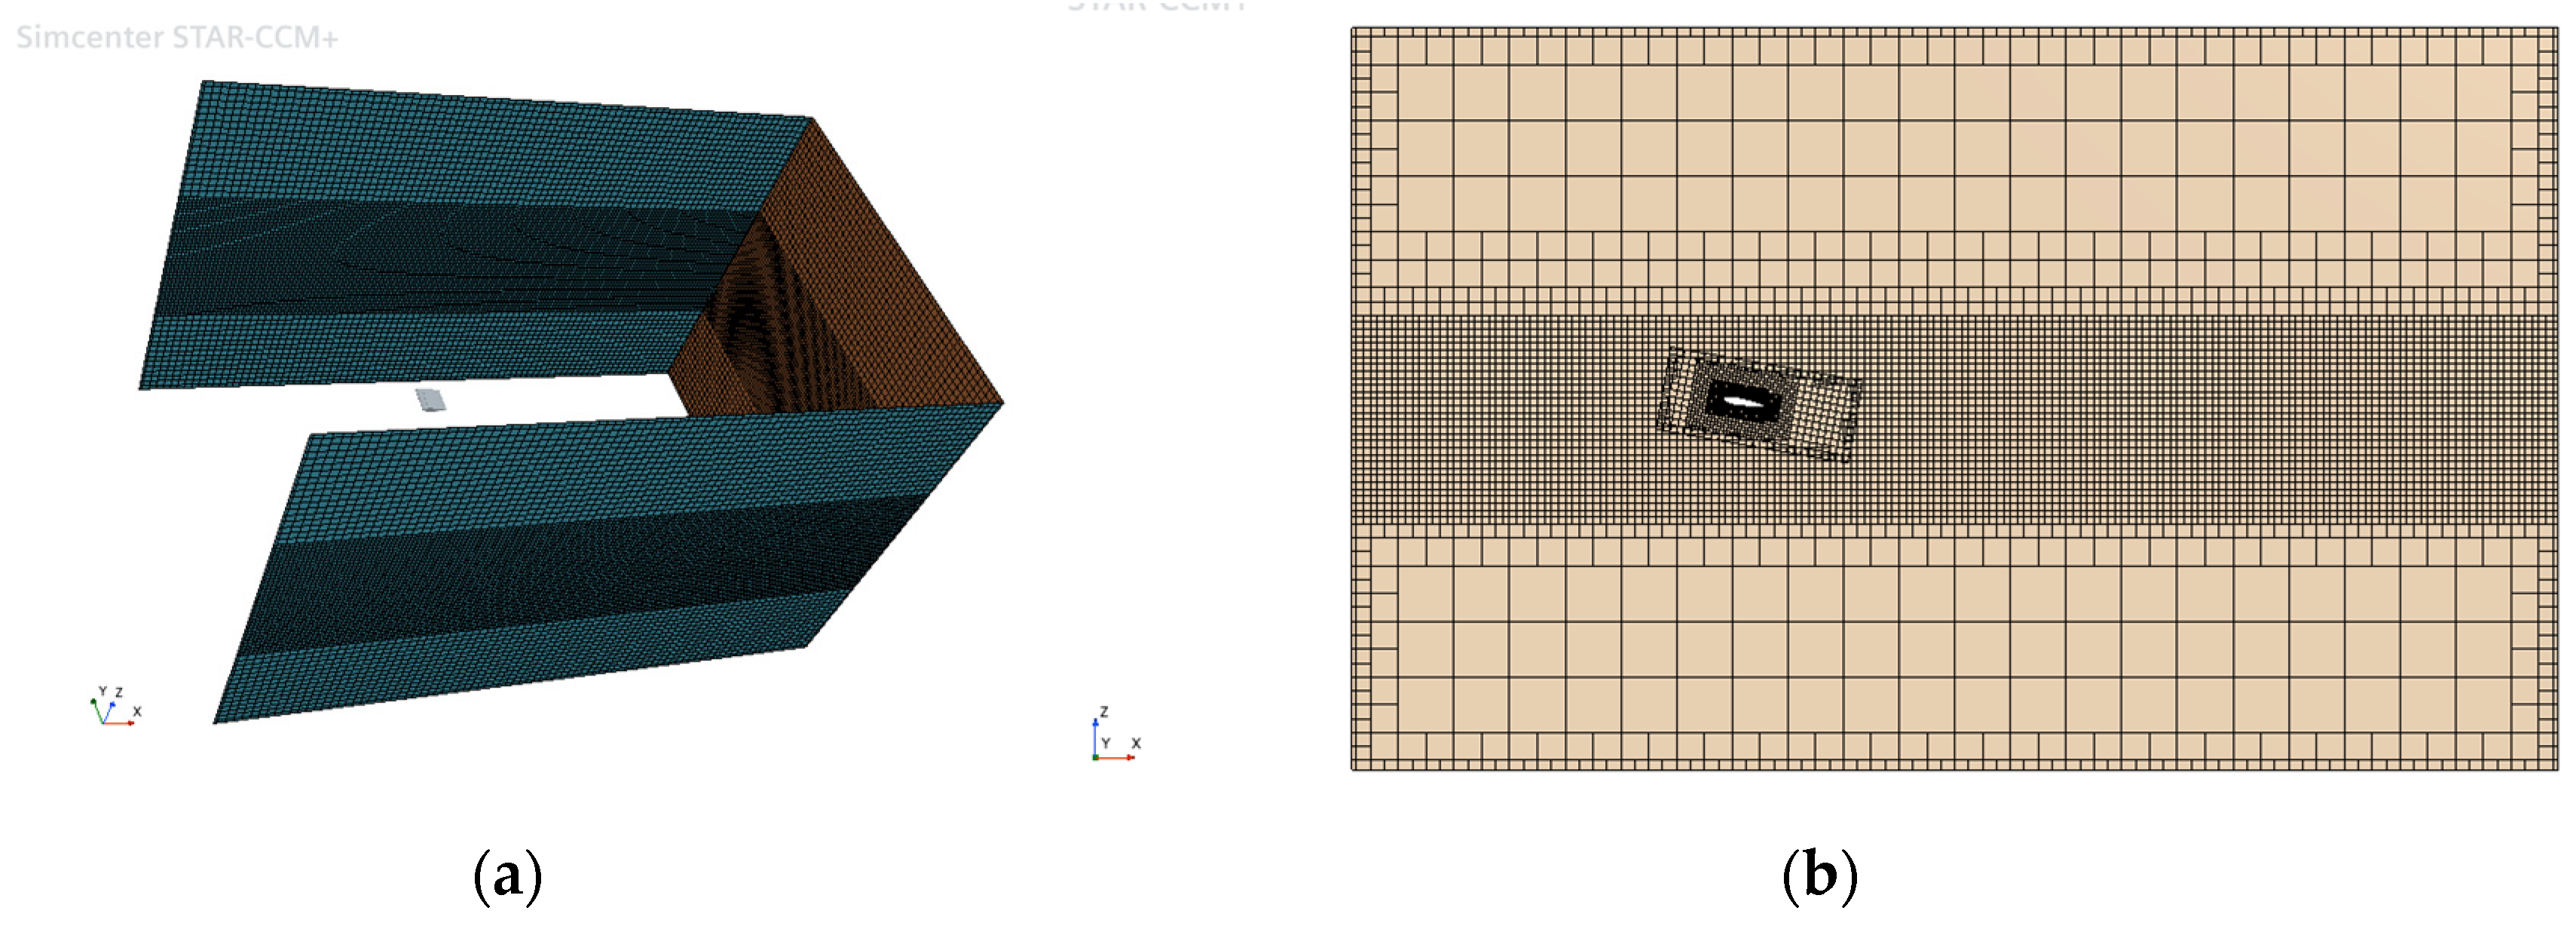
The predicted lift values became essentially stable once the boundary-layer thickness exceeded 0.0135 m. Considering computational efficiency, a boundary-layer thickness of 0.015 m was adopted in the subsequent simulations. The finalized numerical mesh layout adopted for all subsequent simulations is displayed in Figure 7. The time step was set to 0.01 s, with 10 inner iterations performed at each time step. Convergence was assessed by monitoring both the residuals and the temporal histories of lift and drag. The force statistics were collected only after the solution reached a stable or periodic state.

4. Experimental Works

To further investigate the hydrodynamic performance of the stabilizer fin and provide experimental support for the numerical results, physical model tests were conducted in a towing tank. Considering the actual dimensions of the experimental platform and the installation constraints of the towing system, a geometric scale ratio of 3:10 was adopted. The tests were carried out in a towing tank with a length of 130 m, a width of 6 m, and a water depth of 3.5 m.
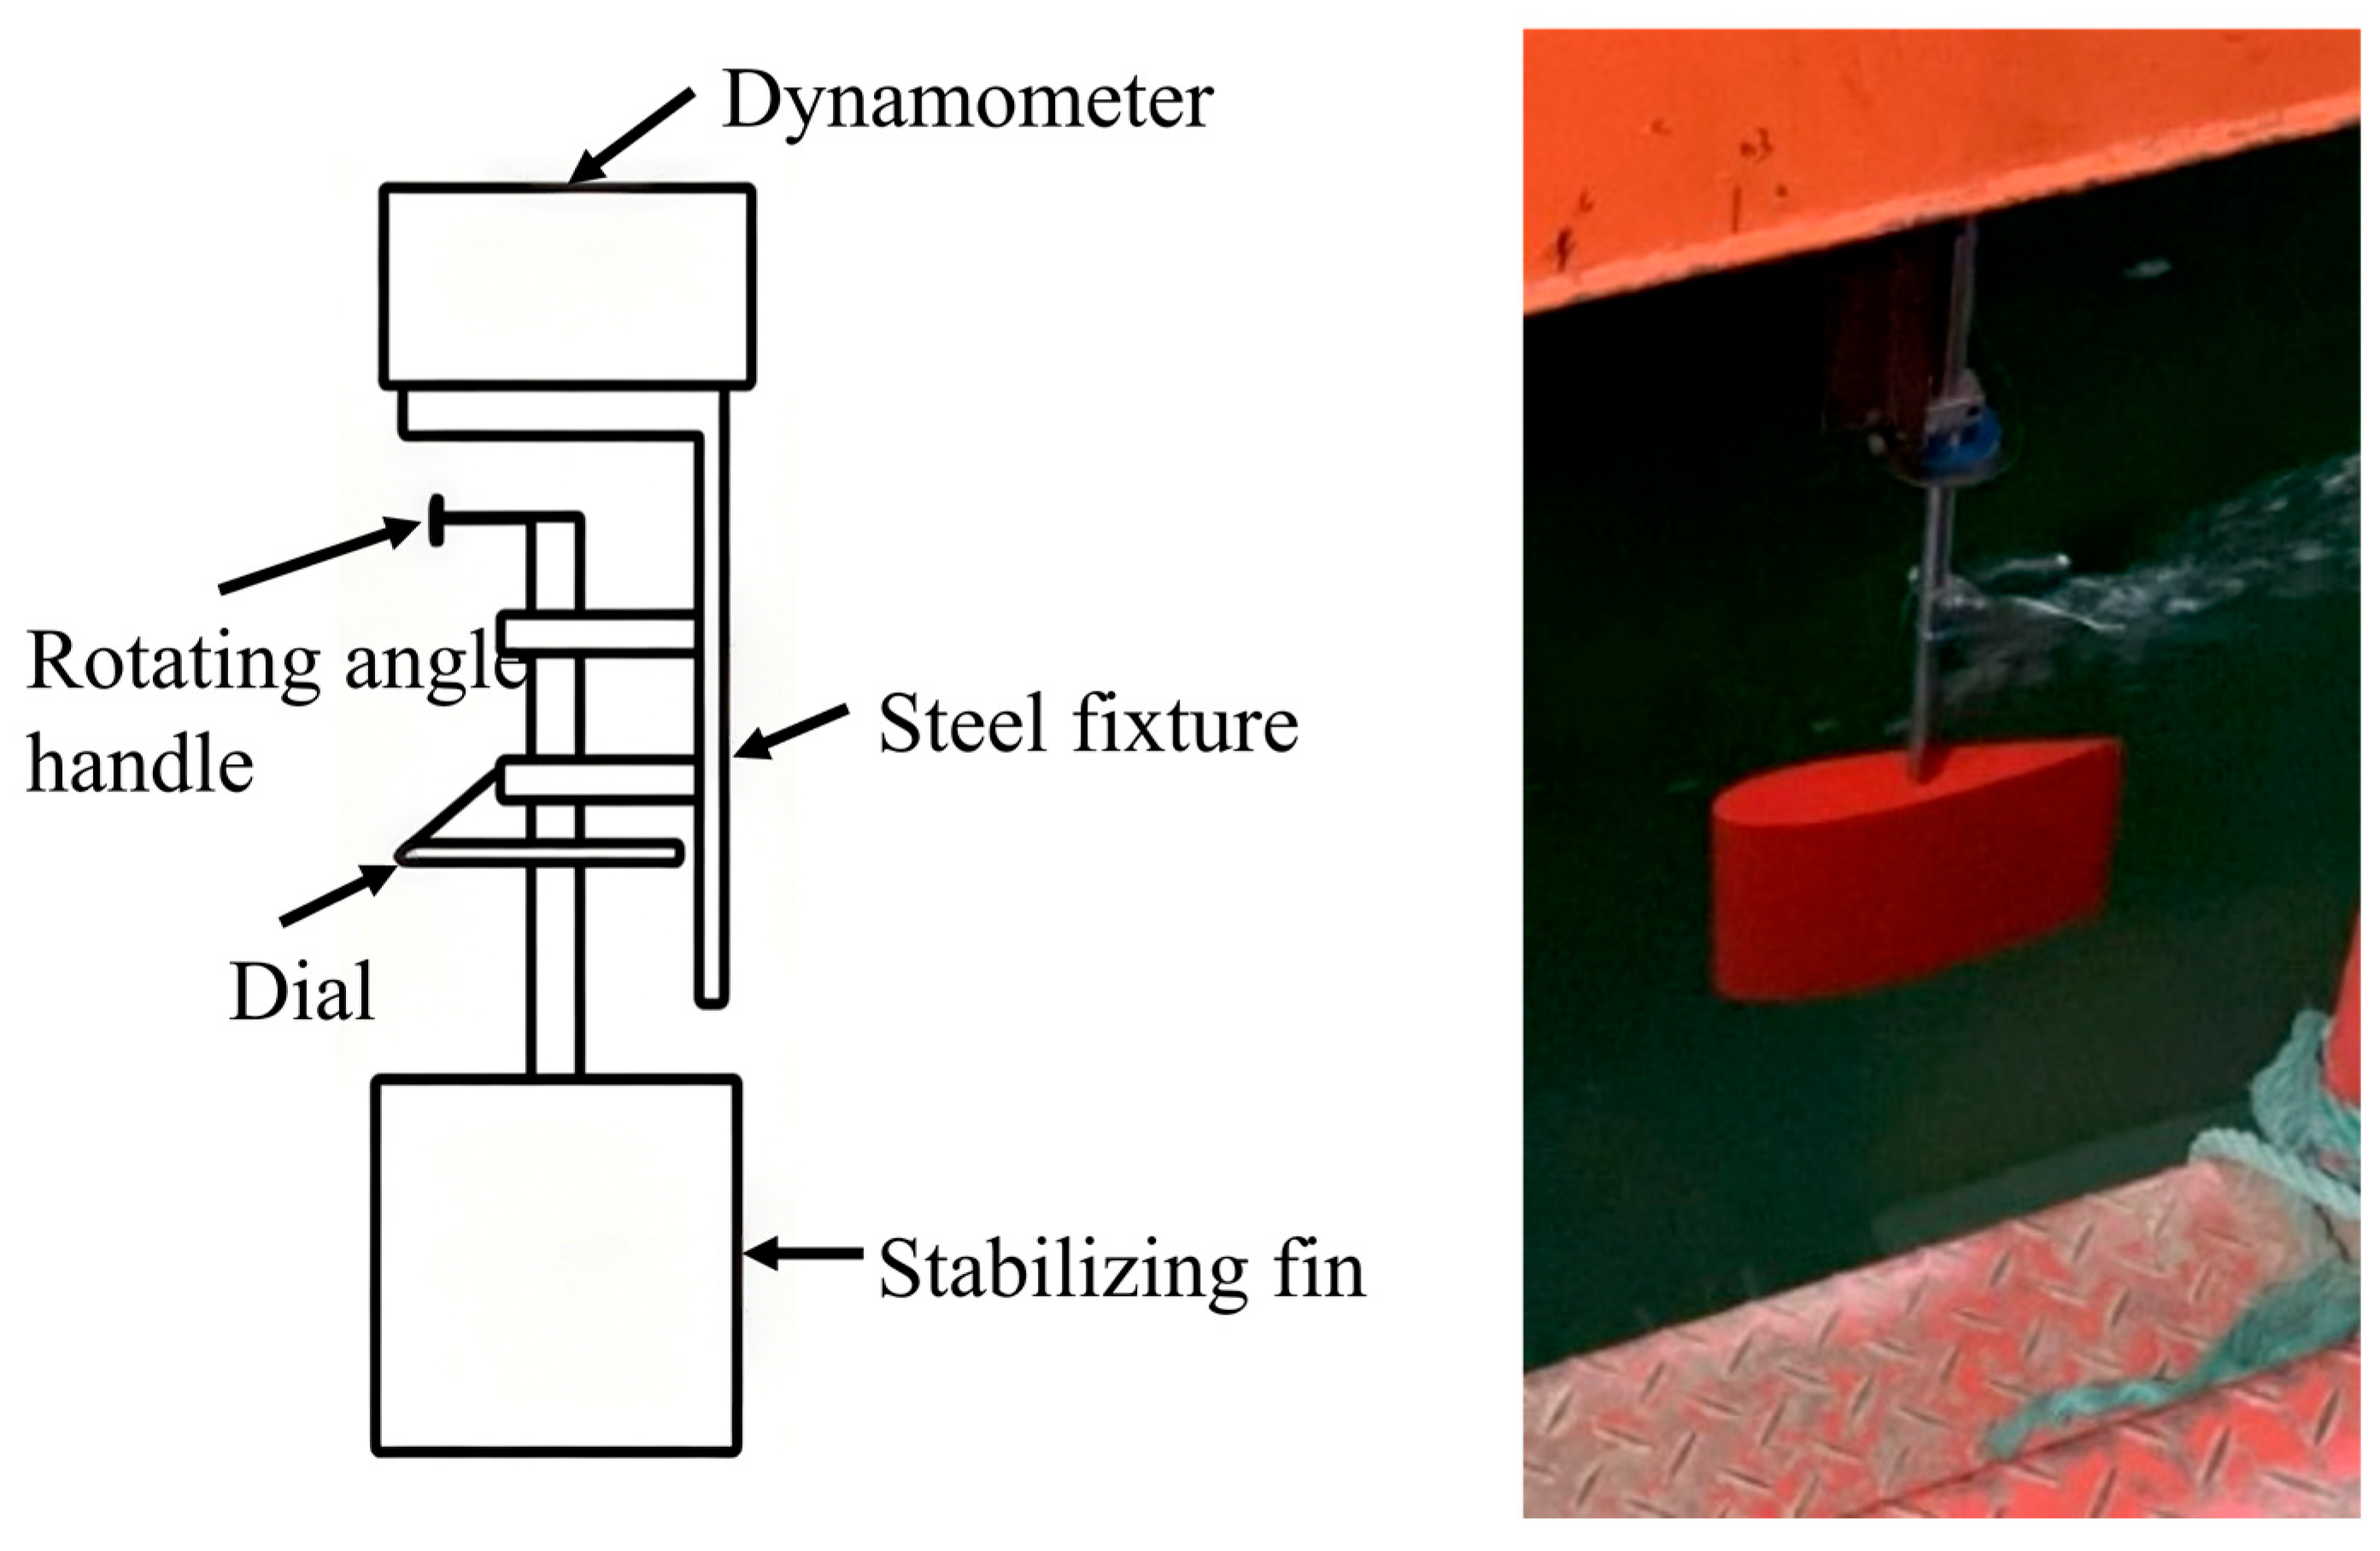
The fin model was manufactured by 3D printing using photosensitive resin. The model was fixed by solid steel tubes and connected to a six-component force sensor through heavy-duty steel clamps. The six-component force sensor was used to directly measure the hydrodynamic forces acting on the fin, including lift and drag. An angle dial was installed on the clamp assembly to adjust and maintain the prescribed fin angle during each test. A schematic of the experimental setup is shown in Figure 8.
Based on the numerical results, two representative fin configurations were selected for experimental validation: the conventional stabilizer fin without perforation and the perforated stabilizer fin with a hole diameter of 1%C and a chamfer angle of 35°. The purpose of the physical model tests was to evaluate the relative hydrodynamic differences between these two configurations and to verify the reliability of the numerical predictions. After the model was mounted on the towing carriage, different inflow conditions were generated by adjusting the carriage speed. Four model-scale towing speeds were tested, namely 0.5 m/s, 0.7 m/s, 0.9 m/s, and 1.1 m/s. For each working condition, the force signals were recorded after the towing speed became stable, and the mean lift and drag values were obtained from the stable portion of the time histories.
The lift-to-drag ratio (L/D) serves as a core performance metric for fin stabilizers. Maximizing this ratio while maintaining satisfactory anti-roll performance contributes to higher energy efficiency and lower propulsion losses for marine vessels. Data collected via the six-component force gauge include three-dimensional force components and three-directional bending moments. Notable noise interference is inevitably present in the raw dataset due to overall mechanical vibrations generated during trailer towing operations. Additionally, experimental limitations associated with towing tank dimensions and environmental conditions induce wave reflection off the tank walls, creating minor secondary waves that interfere with both the stabilizer fin and the force gauge. To address these disturbances, signal filtering is performed via Fast Fourier Transform, followed by approximation using the integral function to extract the stable mid-segment of the raw curve. Following the removal of most noise interference, refined, smooth lift–drag curves are generated, which are adopted as the valid lift–drag data for the corresponding operating condition.
Fin angle is plotted on the horizontal axis, while lift and drag forces are taken as the vertical axes. Accordingly, the relationships between fin angle and the corresponding hydrodynamic forces at a constant flow velocity are obtained, from which the lift coefficient, drag coefficient, and lift-to-drag ratio are further derived.

5. Result and Discussion

5.1. Hydrodynamic Performance of the Stabilizing Fin with Different Diameter of Perforations

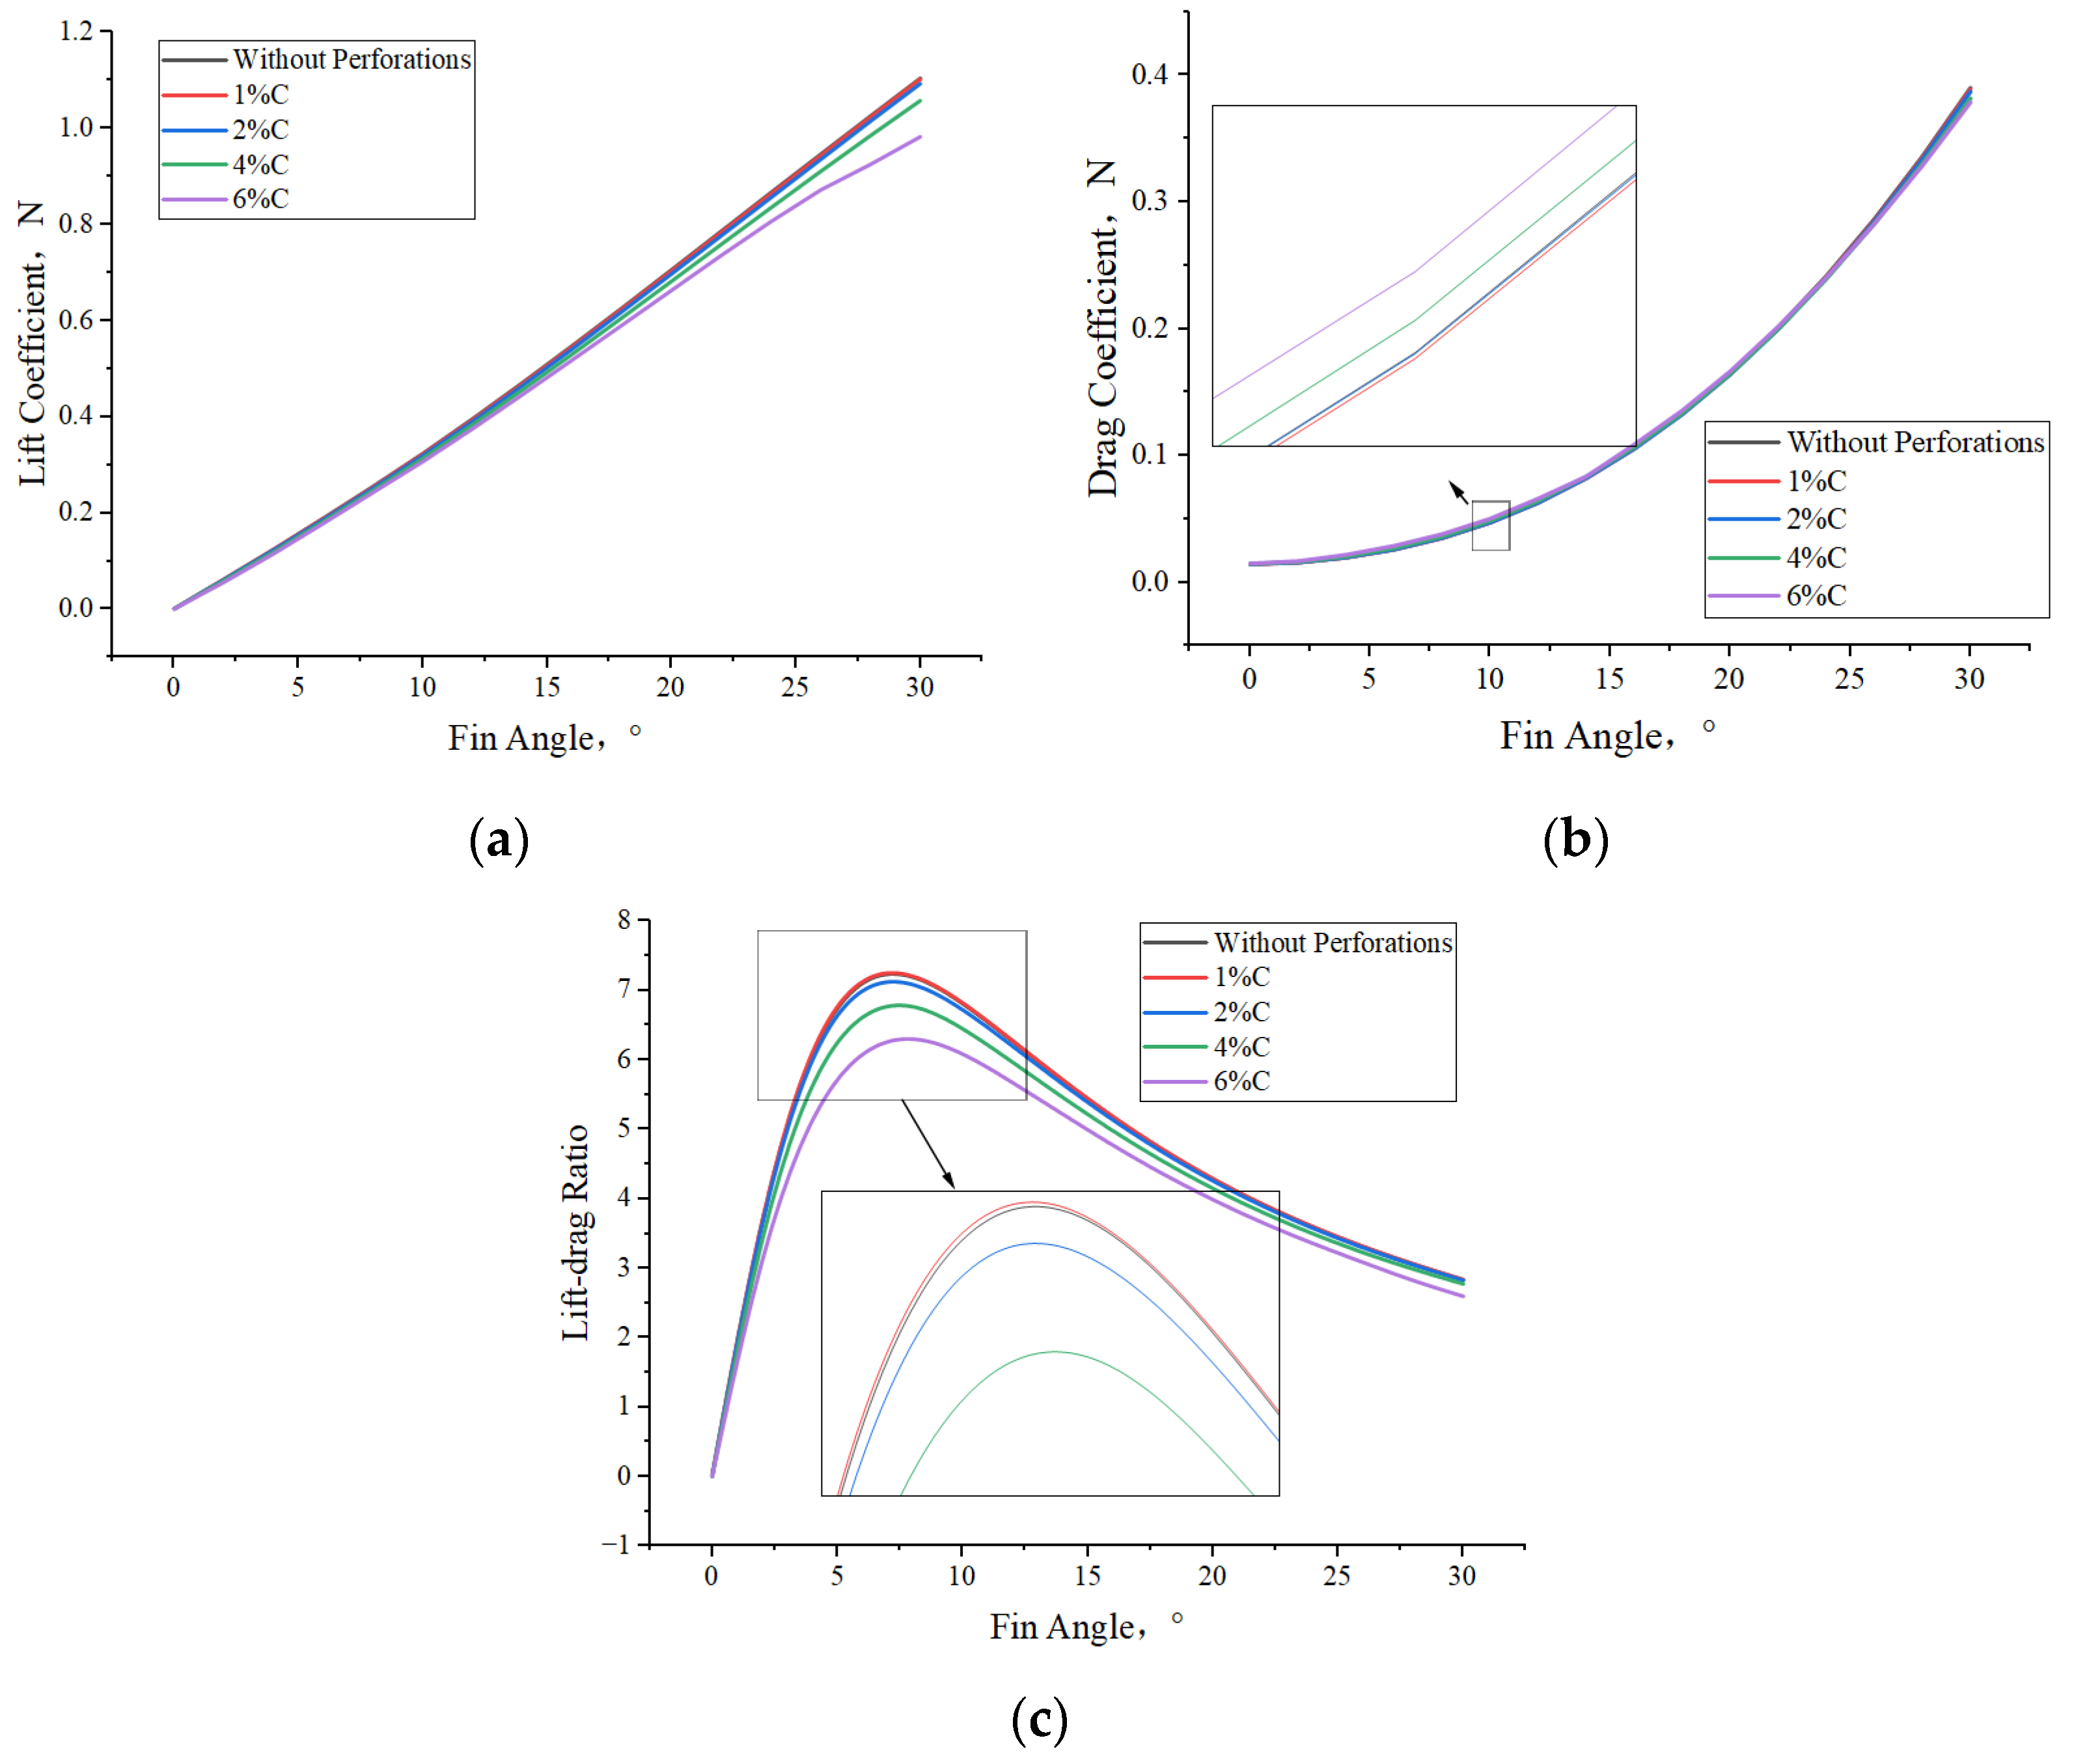
To examine the effects of varying perforation diameters on the hydrodynamic characteristics of the stabilizer fin, numerical simulations are performed on five test models at a uniform incoming flow velocity and across a range of fin angles. These models consist of one unperforated baseline fin and four perforated fins with distinct diameters (1%, 2%, 4%, and 6% chord length).
The inflow velocity used for the preliminary hydrodynamic evaluation was selected with reference to typical service speeds of container ships and LNG carriers. A representative full-scale velocity of 10 m/s, corresponding to approximately 19.44 knots, was adopted as the design inflow condition for comparing the hydrodynamic forces of different fin configurations. It should be noted that this velocity was used as an engineering reference condition, rather than a direct representation of the exact local inflow velocity at the fin stabilizer. The detailed simulation conditions are listed in Table 1.
Numerical simulation data for the stabilizer fin at varied fin angles and perforation diameters are presented in Figure 9.
As the fin angle increases, the lift coefficient increases continuously for all cases with a relatively stable growth trend, whereas the drag coefficient exhibits a more pronounced nonlinear increase, especially at larger angles. The lift-to-drag ratio first increases and then decreases, indicating the existence of an optimal angle range in which the fin can achieve better overall hydrodynamic efficiency.
For the lift coefficient, the non-perforated case remains the highest throughout the investigated range, while the 1%C perforation case is the closest to the non-perforated configuration. As the perforation diameter further increases, the lift coefficient gradually decreases, with the reductions for the 4%C and 6%C cases being the most significant. Moreover, as the fin angle increases, the differences between the 4%C and 6%C cases and the non-perforated, 1%C, and 2%C cases become larger, indicating that larger perforations more significantly weaken lift generation at medium and high angles.
For the drag coefficient, when the fin angle is lower than about 22°, the 1%C perforation case gives the lowest drag coefficient, the 2%C case remains close to the non-perforated case, and the drag coefficient generally increases with increasing perforation diameter. However, when the fin angle exceeds about 22°, the trend changes: the non-perforated case shows the largest drag coefficient, and the drag coefficient gradually decreases as the perforation diameter increases. This indicates that the influence of perforation on drag is strongly angle-dependent. At relatively small angles, perforation may introduce additional drag, whereas at larger angles, larger perforations tend to suppress further drag growth.
The lift-to-drag ratio further reflects the overall hydrodynamic efficiency. In general, the 1%C perforation case provides the best lift-to-drag ratio, although it remains very close to that of the non-perforated case, indicating only a limited efficiency advantage of the small perforation. As the perforation diameter increases, the lift-to-drag ratio gradually decreases, with the larger-perforation cases showing the most obvious deterioration. This suggests that although larger perforations may reduce drag at high angles, the associated loss of lift is more significant, resulting in poorer overall hydrodynamic performance.
Overall, the increase in fin angle gradually amplifies the performance differences among the various perforation configurations. The prototype fin exhibits the highest lift performance, while the 1%C perforation achieves the best overall balance by maintaining a lift level close to that of the prototype fin while obtaining the highest lift-to-drag ratio. As the perforation diameter increases, lift weakens continuously and the lift-to-drag ratio declines, indicating that excessively large perforations are unfavorable for improving the hydrodynamic performance of the anti-roll fin.

5.2. Hydrodynamic Performance of the Stabilizing Fin with Different Chamfer of Perforations

For the straight-walled perforated anti-roll fins, the 1% chord-length perforation model shows the relatively best overall hydrodynamic performance among the investigated perforation cases. Although the prototype fin gives the highest lift coefficient, the 1% perforated model remains closest to it in lift, while exhibiting lower drag at small fin angles and a slightly higher lift-to-drag ratio. Therefore, the 1% perforated model and the prototype fin were selected for the subsequent numerical simulations of chamfered perforations to further investigate the effect of chamfering on the hydrodynamic performance of perforated fin stabilizers. A 2% chord length diameter model is also included for chamfering simulation tests. To further explore the effect of perforation angle on fin stabilizer hydrodynamic performance, numerical simulations are conducted on 13 fin stabilizer models at a constant flow velocity, covering varied fin angles, chamfer angles, and the unperforated prototype fin. The detailed simulation scheme is presented in Table 2.
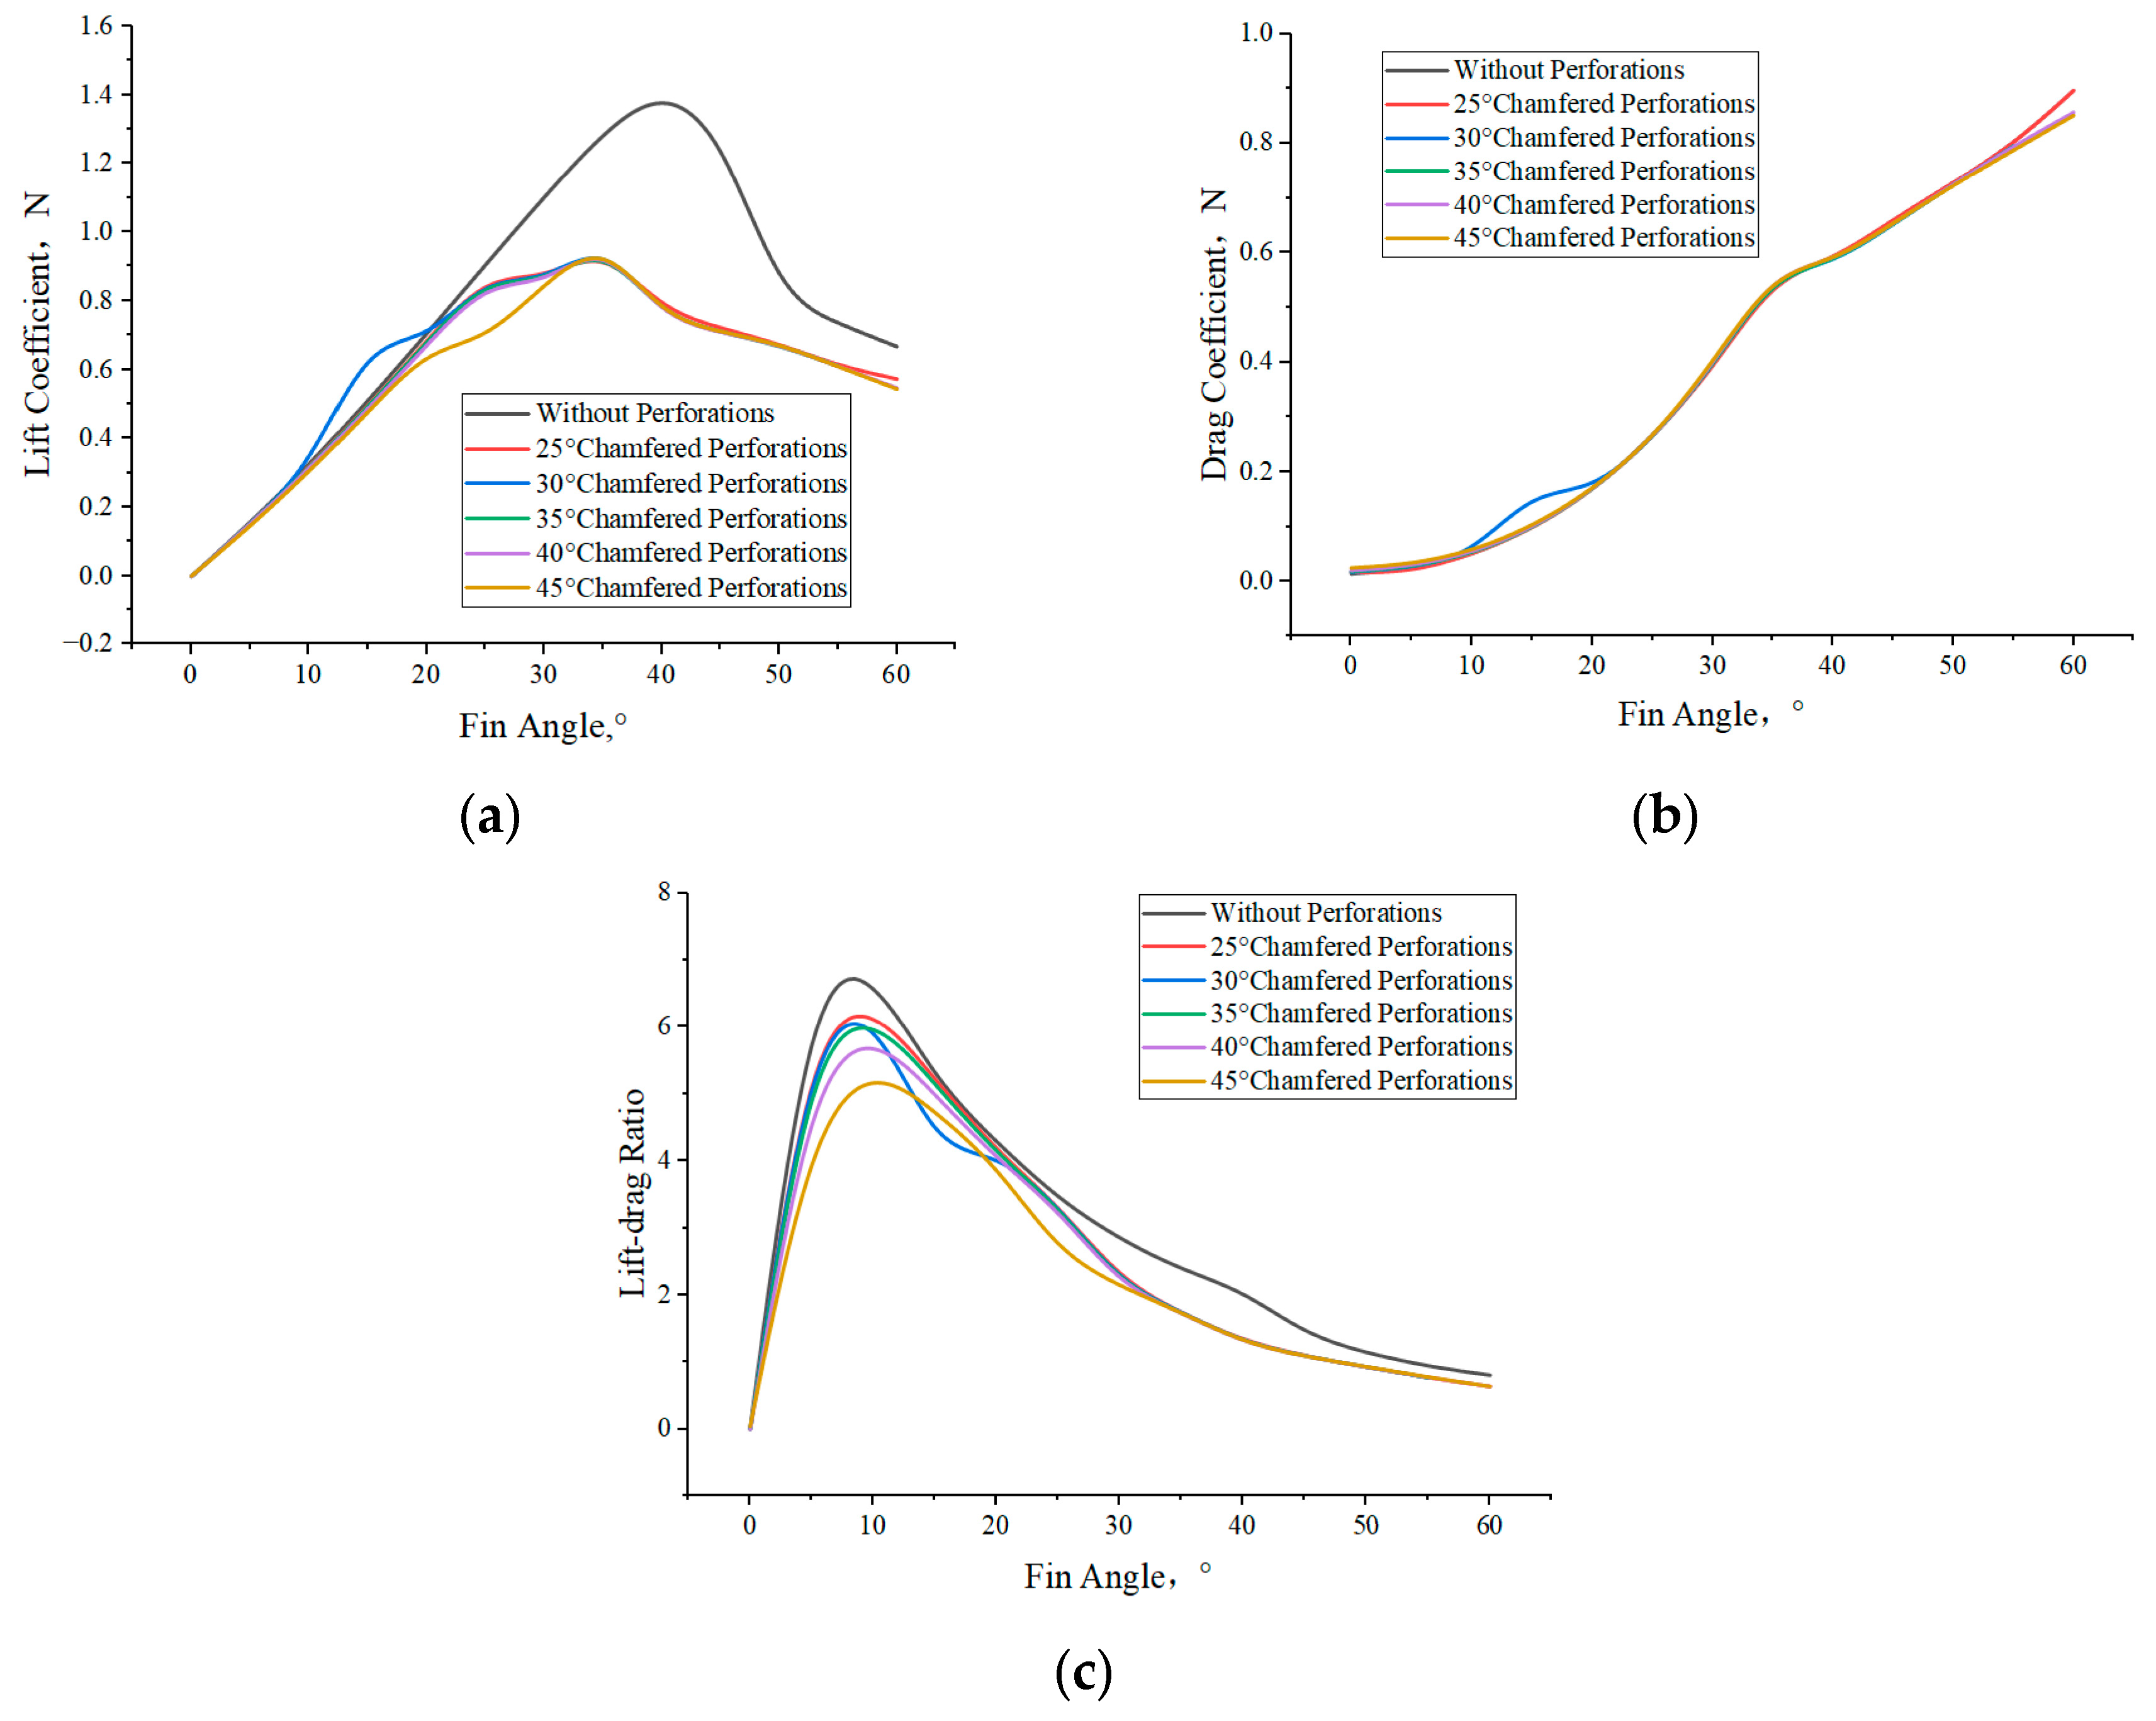
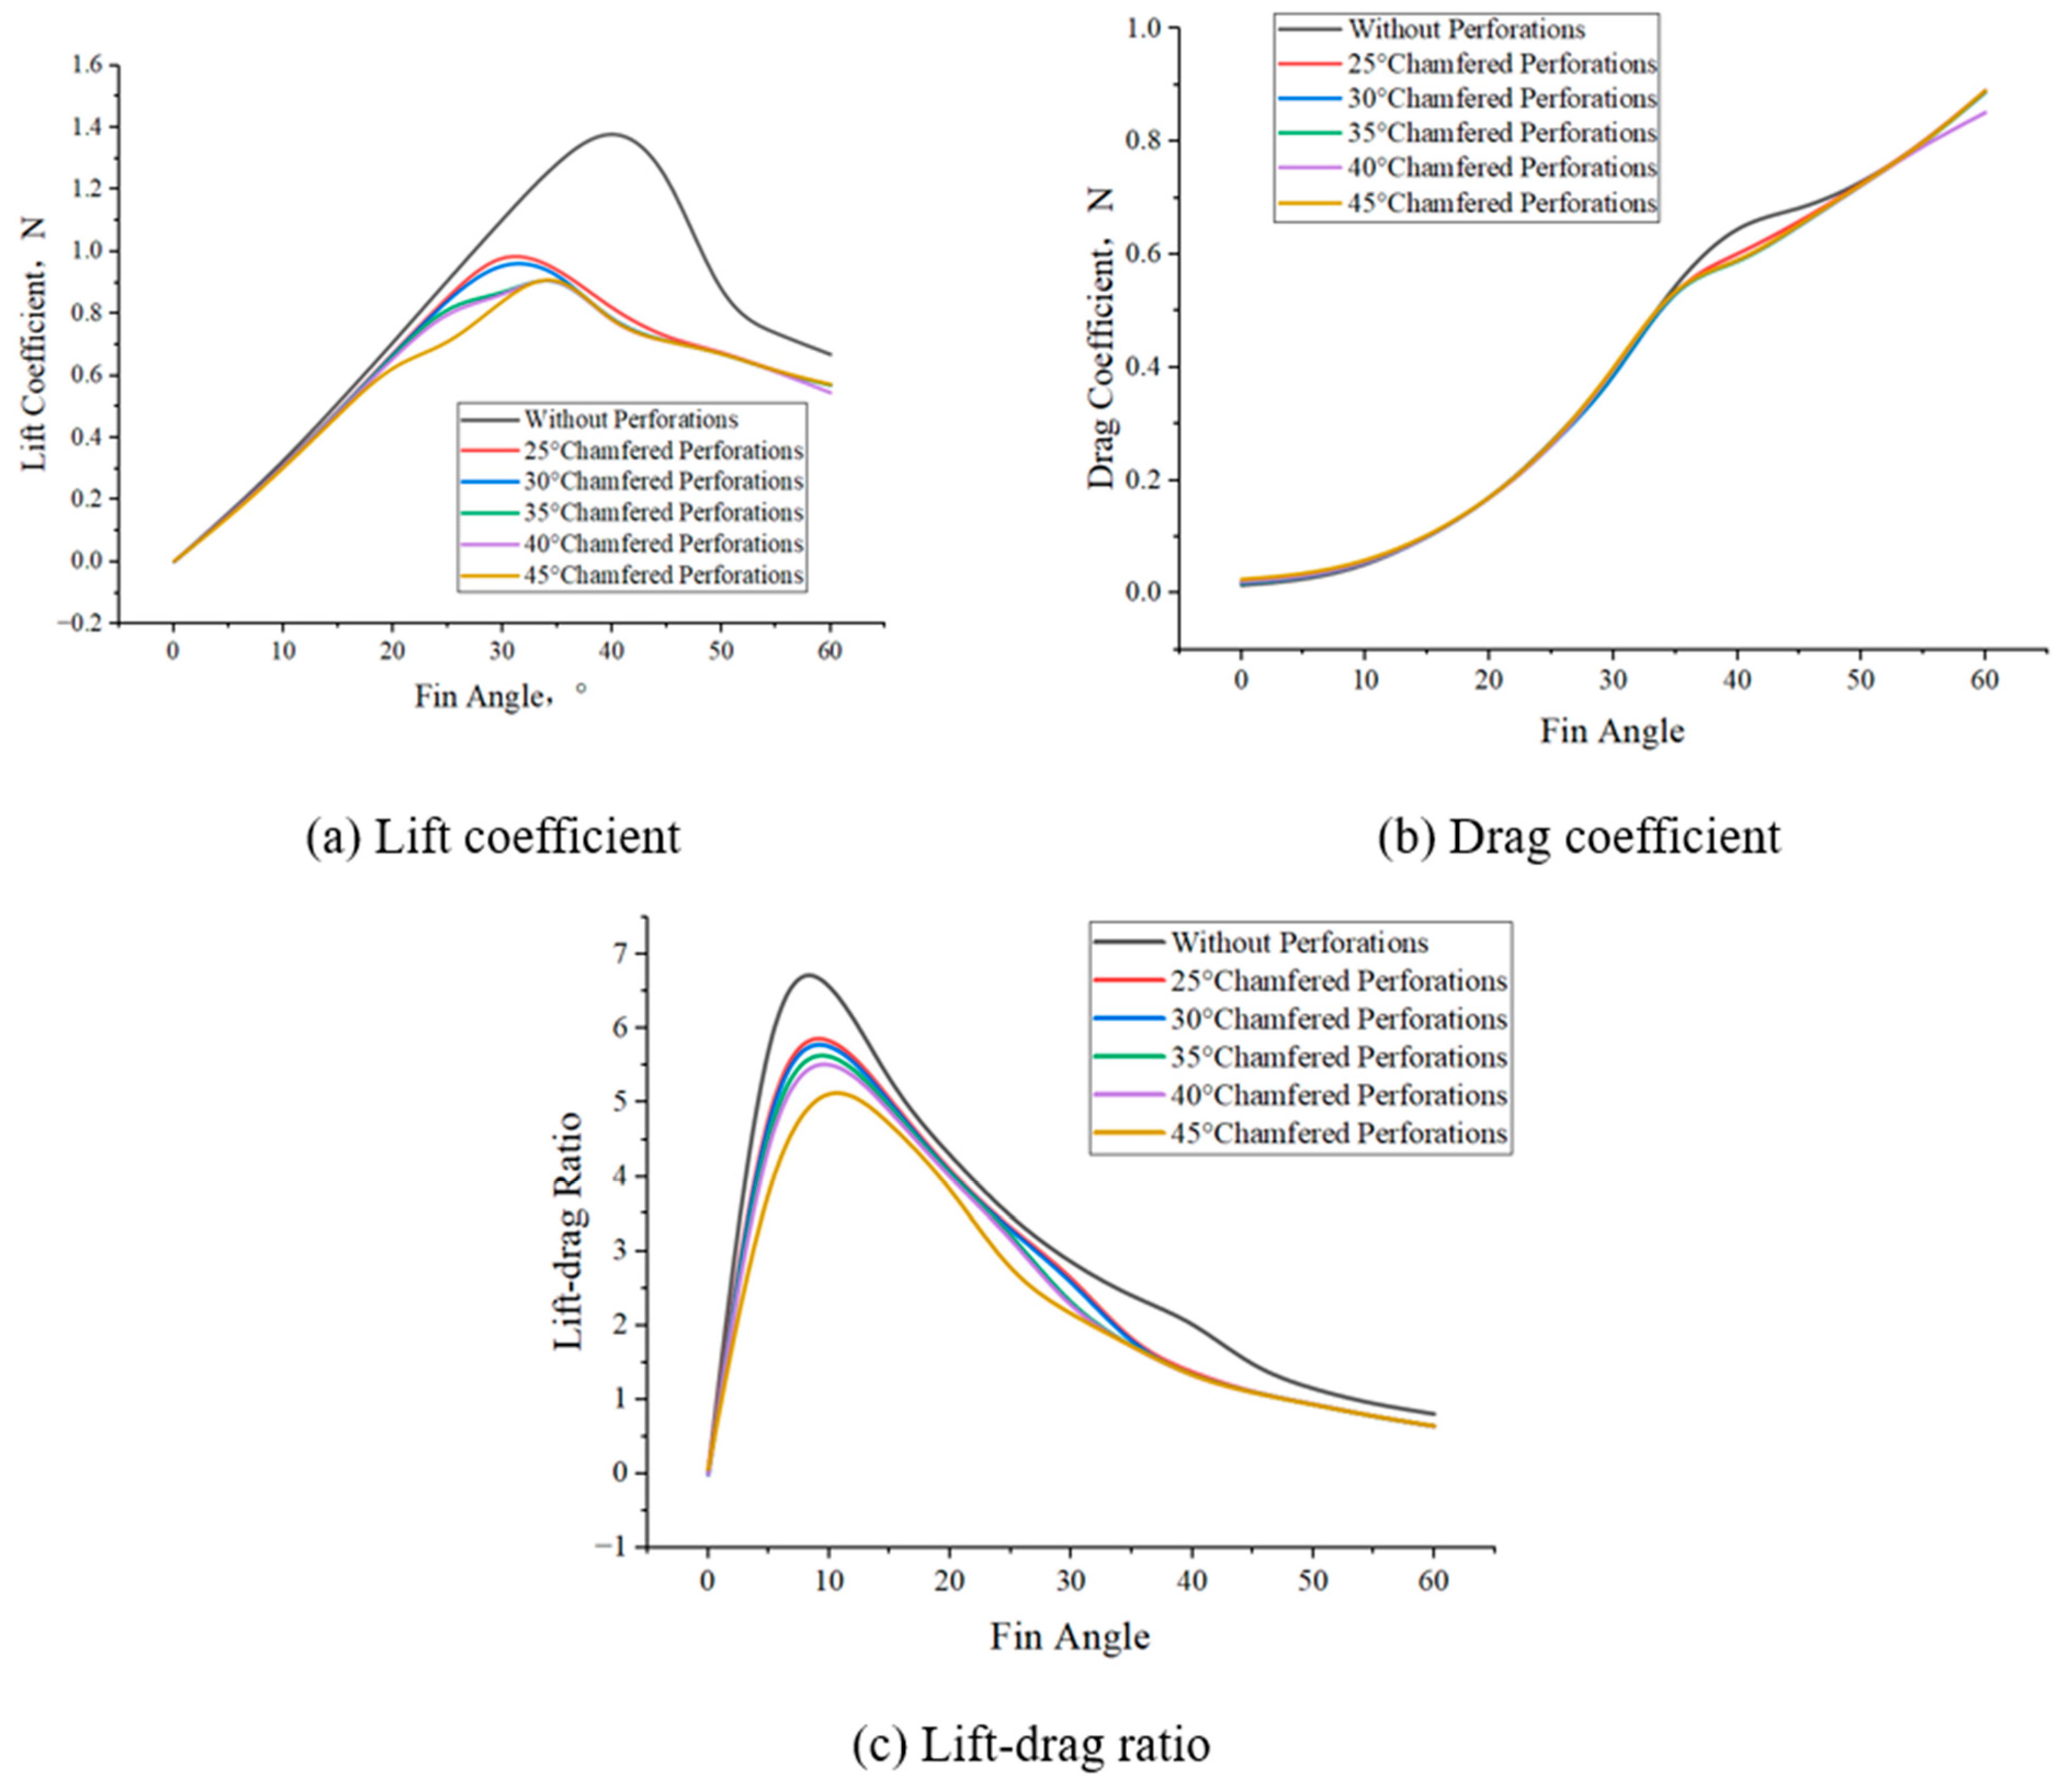
In this section, further numerical simulations are carried out to explore the effects of chamfering, with the range of fin angles extended to 0° to 60°. Numerical simulation results are illustrated in Figure 10 and Figure 11, and key trends and findings are summarized below based on a comparative analysis of the simulated data.
The 1% and 2% perforated anti-roll fins with different chamfer angles exhibit consistent overall hydrodynamic trends. As the fin angle increases, the lift coefficient first increases and then decreases, with the peak generally occurring around 35–40°. The drag coefficient increases continuously with fin angle and shows a pronounced nonlinear growth trend. The lift-to-drag ratio first rises rapidly and then gradually decreases, with the peak mainly appearing at around 10°, indicating that the fin achieves relatively high overall hydrodynamic efficiency at small angles.
Compared with the non-perforated case, the chamfered perforated fins generally show lower lift coefficients and lower lift-to-drag ratios over most of the investigated angle range, indicating that the perforation and chamfer treatments do not outperform the prototype fin in terms of overall hydrodynamic performance. For the lift coefficient, the non-perforated case remains the highest overall. Among the chamfered perforated cases, the 25° chamfer provides relatively higher lift levels for both the 1% and 2% perforation diameters, followed by the 30° chamfer. As the chamfer angle further increases, the lift coefficient gradually decreases, and the 45° chamfer gives the lowest values, indicating that an excessively large chamfer angle significantly weakens lift generation. For the drag coefficient, the differences among the various chamfered cases are generally smaller than those observed for the lift coefficient, indicating that the influence of chamfer angle on drag is relatively limited.
The lift-to-drag ratio further highlights the difference in overall hydrodynamic efficiency among the chamfered cases. For both the 1% and 2% perforation diameters, the 25° chamfer achieves the highest lift-to-drag ratio among the chamfered configurations, while the 30° chamfer remains close to it. As the chamfer angle increases further, the lift-to-drag ratio gradually decreases, and the 45° chamfer again performs the worst. This indicates that a moderate chamfer angle is beneficial for achieving a better balance between lift retention and drag control, whereas an excessively large chamfer causes greater lift loss and thus deteriorates the overall hydrodynamic performance.
Overall, the influence of chamfer angle on the hydrodynamic performance of perforated anti-roll fins is clearly non-monotonic. Among the chamfered perforated configurations considered here, the 25° chamfer exhibits the relatively best overall performance for both the 1% and 2% perforation diameters. However, its overall hydrodynamic performance still does not exceed that of the prototype fin.
Figure 10. Numerical simulation results of the effect of chamfer angle on the hydrodynamic performance of the stabilizer fin with 1%C perforation. (a) Lift coefficient, (b) drag coefficient, (c) lift–drag ratio.
Jmse 14 00882 g010
Figure 11. Numerical simulation results of the effect of chamfer angle on the hydrodynamic performance of the stabilizer fin with 2%C perforation. (a) Lift coefficient, (b) drag coefficient, (c) lift–drag ratio.
Jmse 14 00882 g011

5.3. Hydrodynamic Performance of the Stabilizing Fin with Different Speed

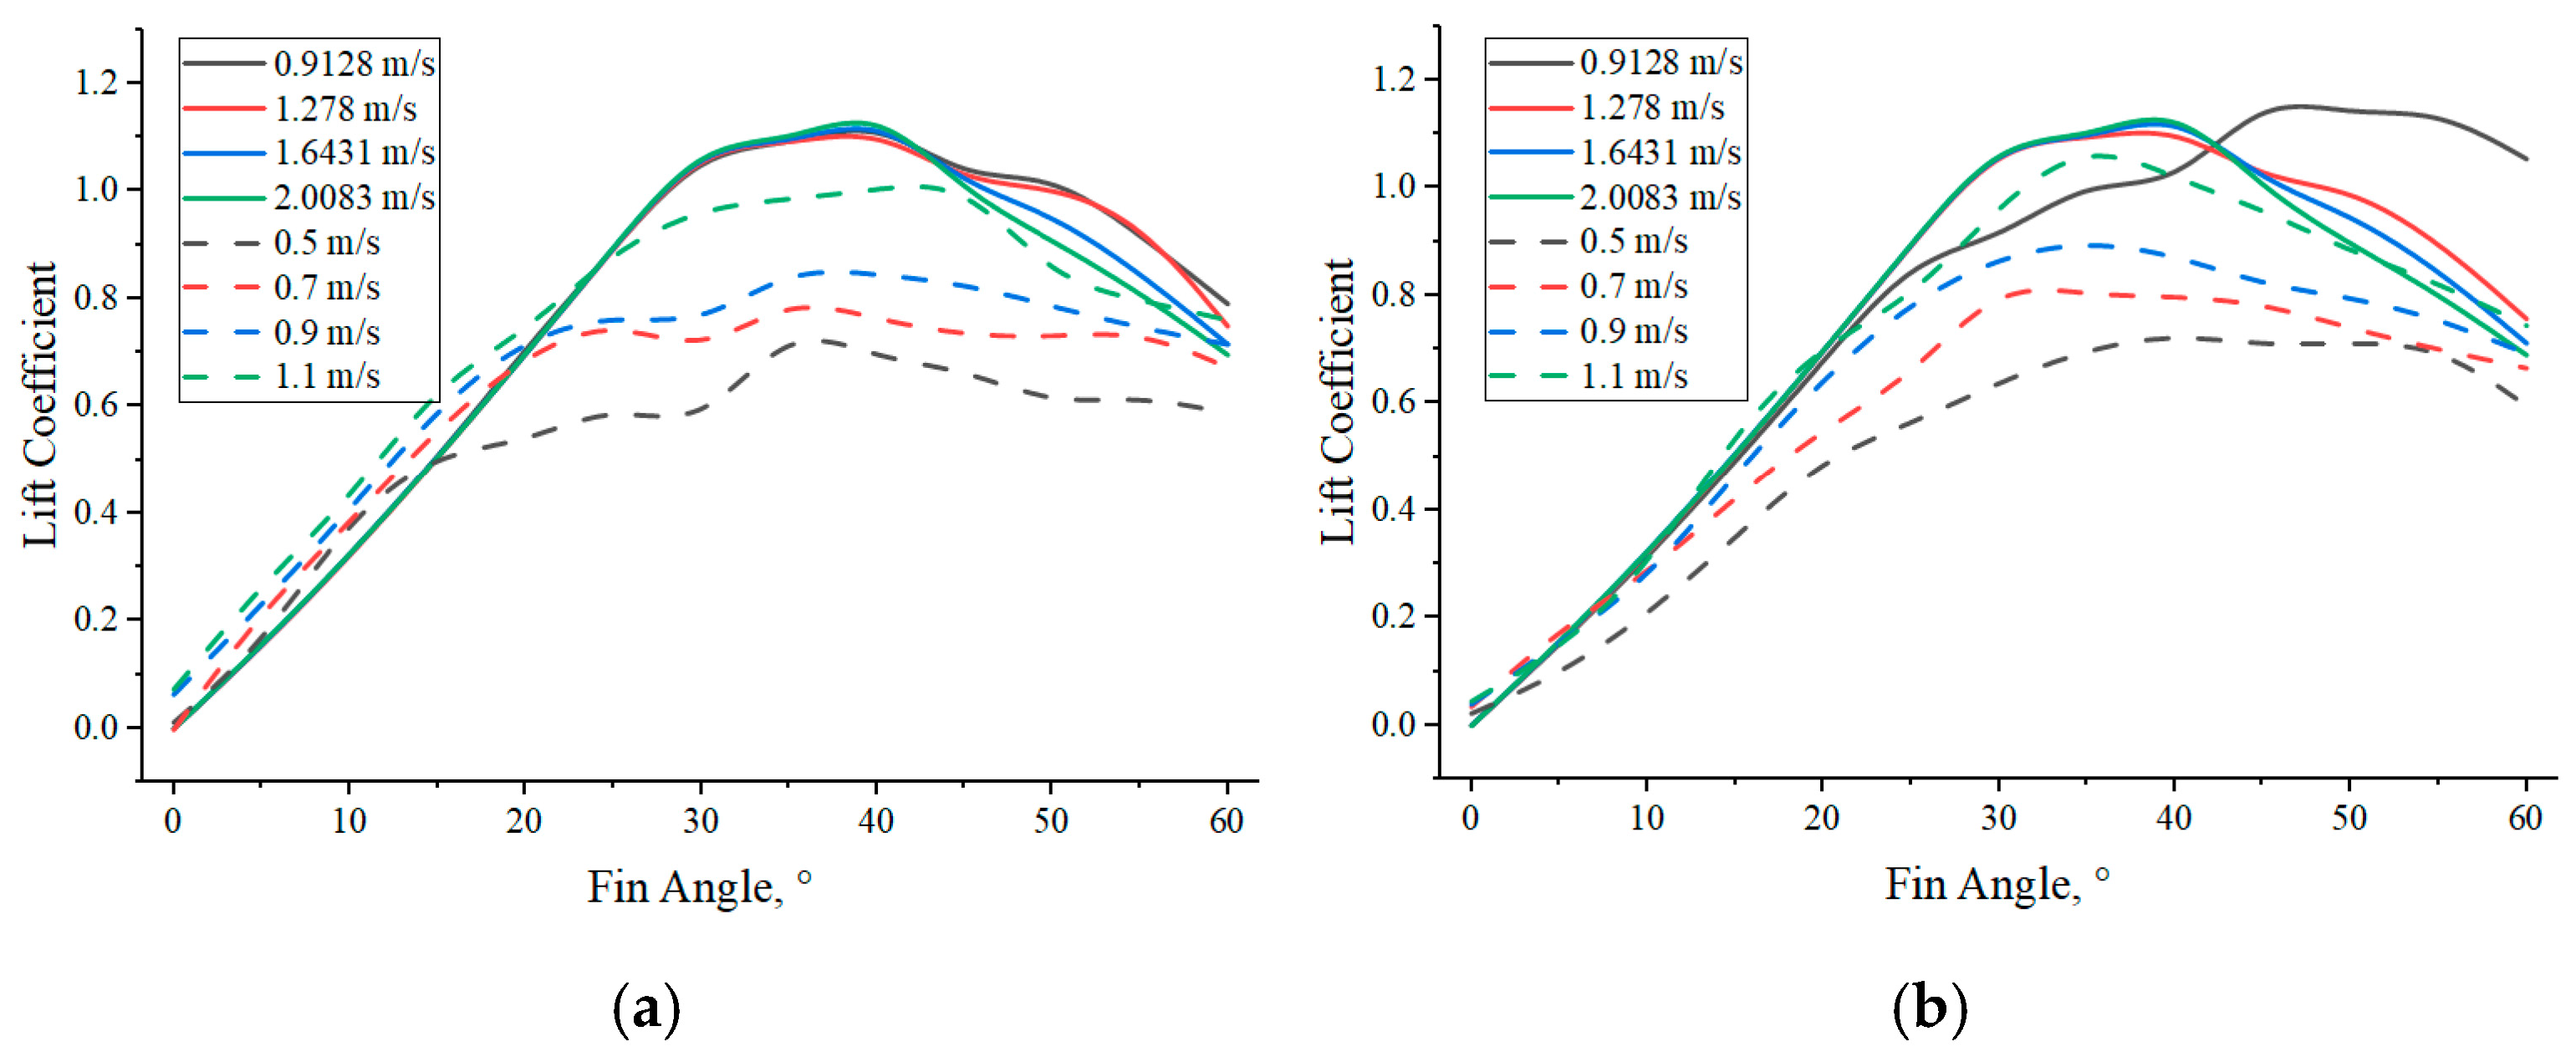
The experimental conditions and measurement procedures have been described in detail in the experimental methodology section. To further investigate the hydrodynamic response of the fin stabilizer under different flow velocities in combination with the experimental results, the model-scale experiment velocities were converted into the corresponding full-scale inflow velocities according to Froude similarity. Based on the geometric scale ratio of 3:10, the model-scale test velocities of 0.5, 0.7, 0.9, and 1.1 m/s were converted into the corresponding full-scale inflow velocities of 0.9128, 1.2780, 1.6431, and 2.0083 m/s according to Froude similarity. These converted full-scale velocities were then adopted in the subsequent numerical simulations.
Based on the previous parametric analysis, the perforated fin with a hole diameter of 1% chord length and a chamfer angle of 35° exhibited relatively favorable overall hydrodynamic performance among the perforated configurations. Therefore, this perforated chamfered model, together with the prototype fin as the reference case, was selected for the subsequent velocity-dependent numerical simulations. By performing simulations under different full-scale inflow velocities, the influence of the chamfered perforation design on the hydrodynamic performance of the fin stabilizer was further examined. The detailed simulation conditions are listed in Table 3.
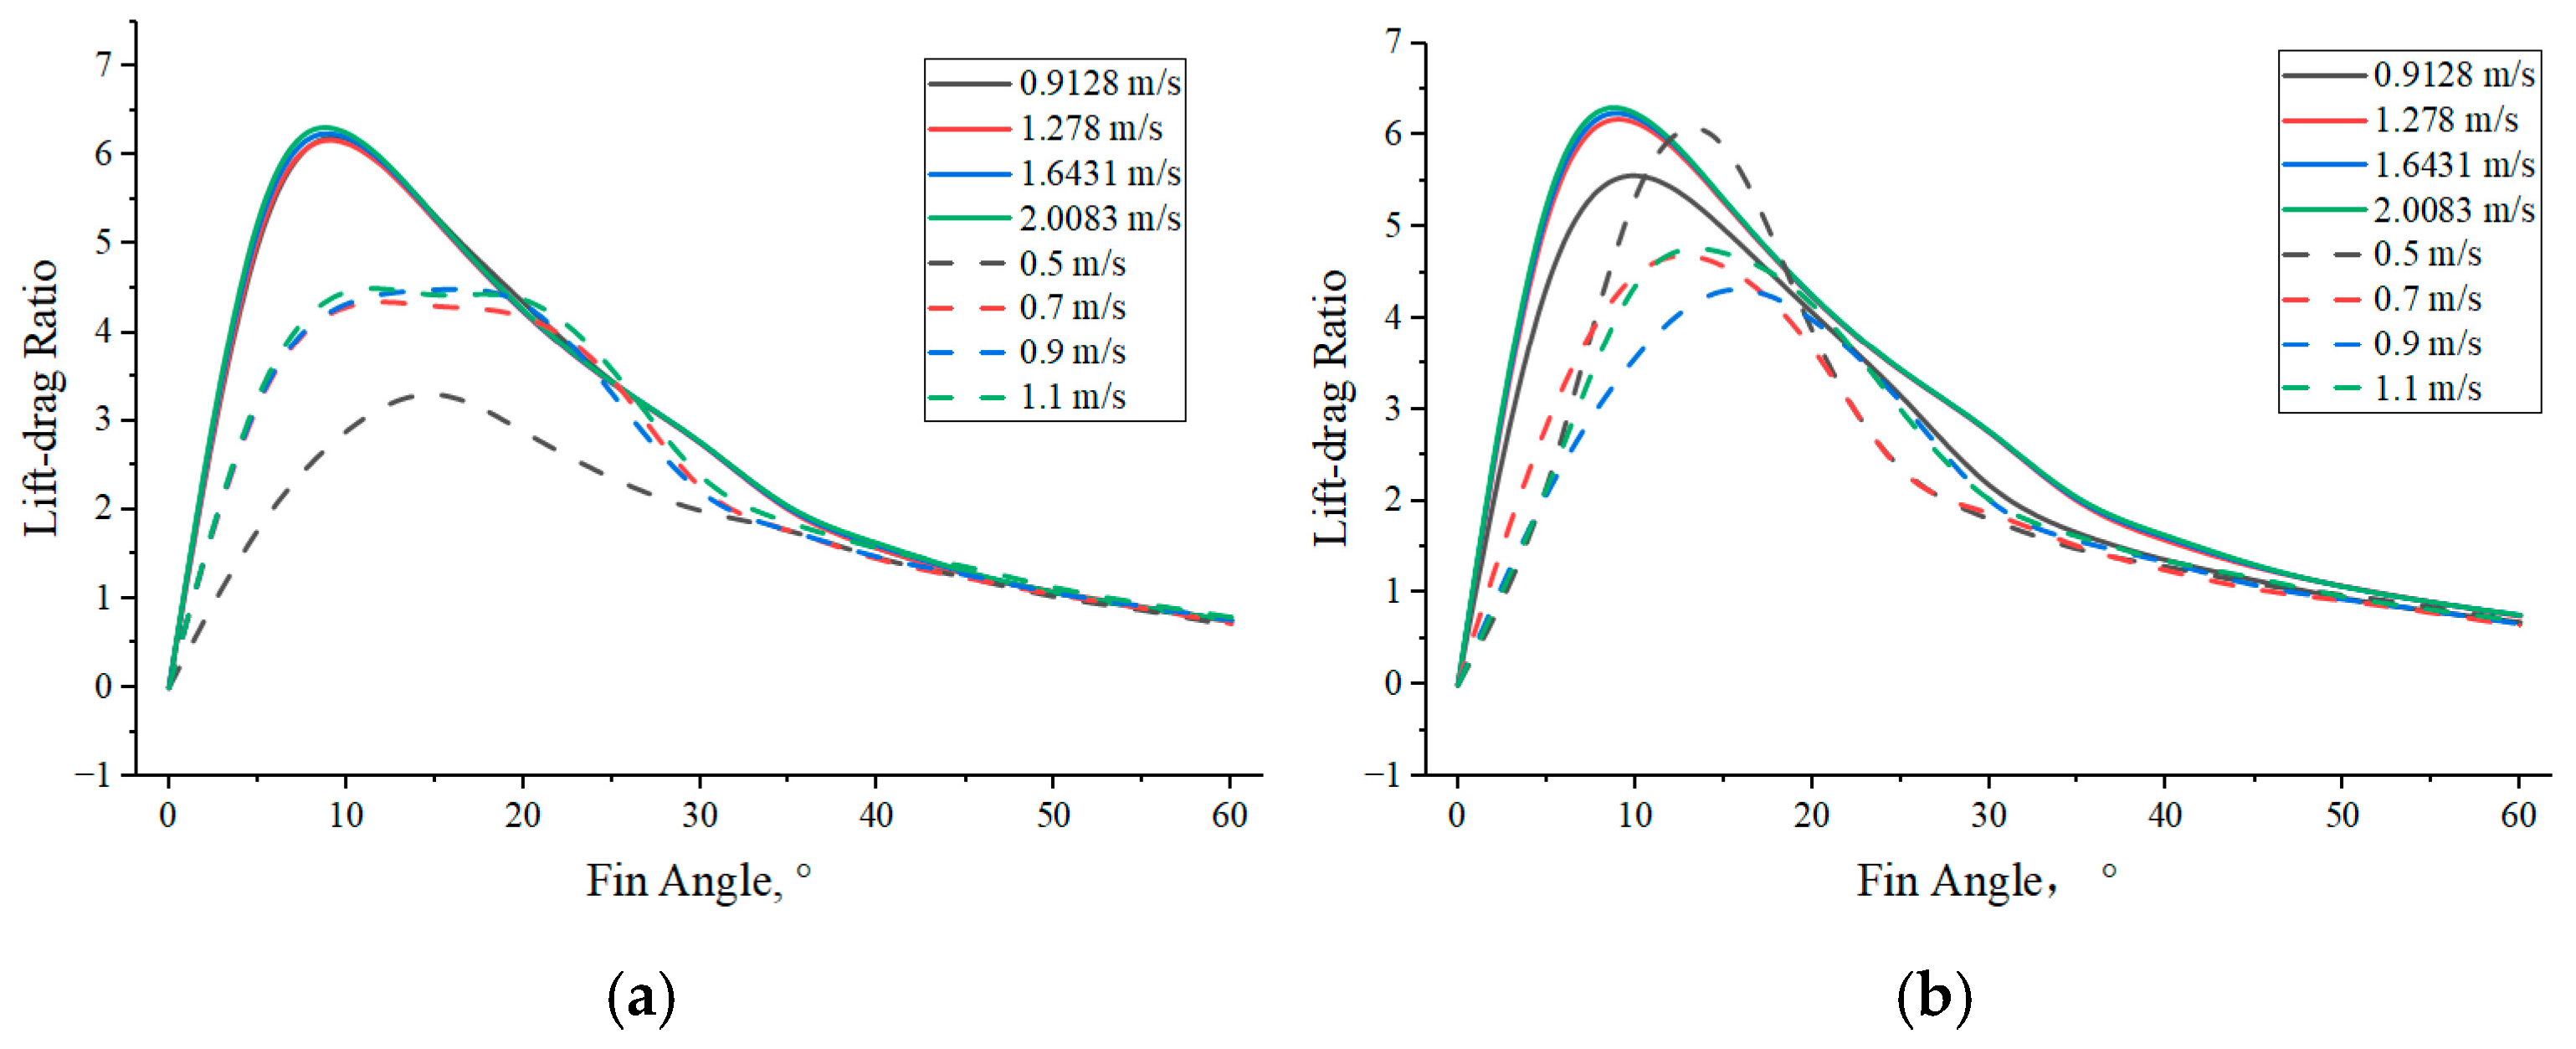
Figure 12, Figure 13 and Figure 14 present the hydrodynamic performance of the fin stabilizer with a 1% chord length perforation diameter at varied flow velocities, focusing on comparative analyses of variations in the lift coefficient, drag coefficient, and lift-to-drag ratio.
Figure 12. Comparison of lift coefficient between simulation and experiment. (a) Prototype, (b) 35° chamfer.
Jmse 14 00882 g012
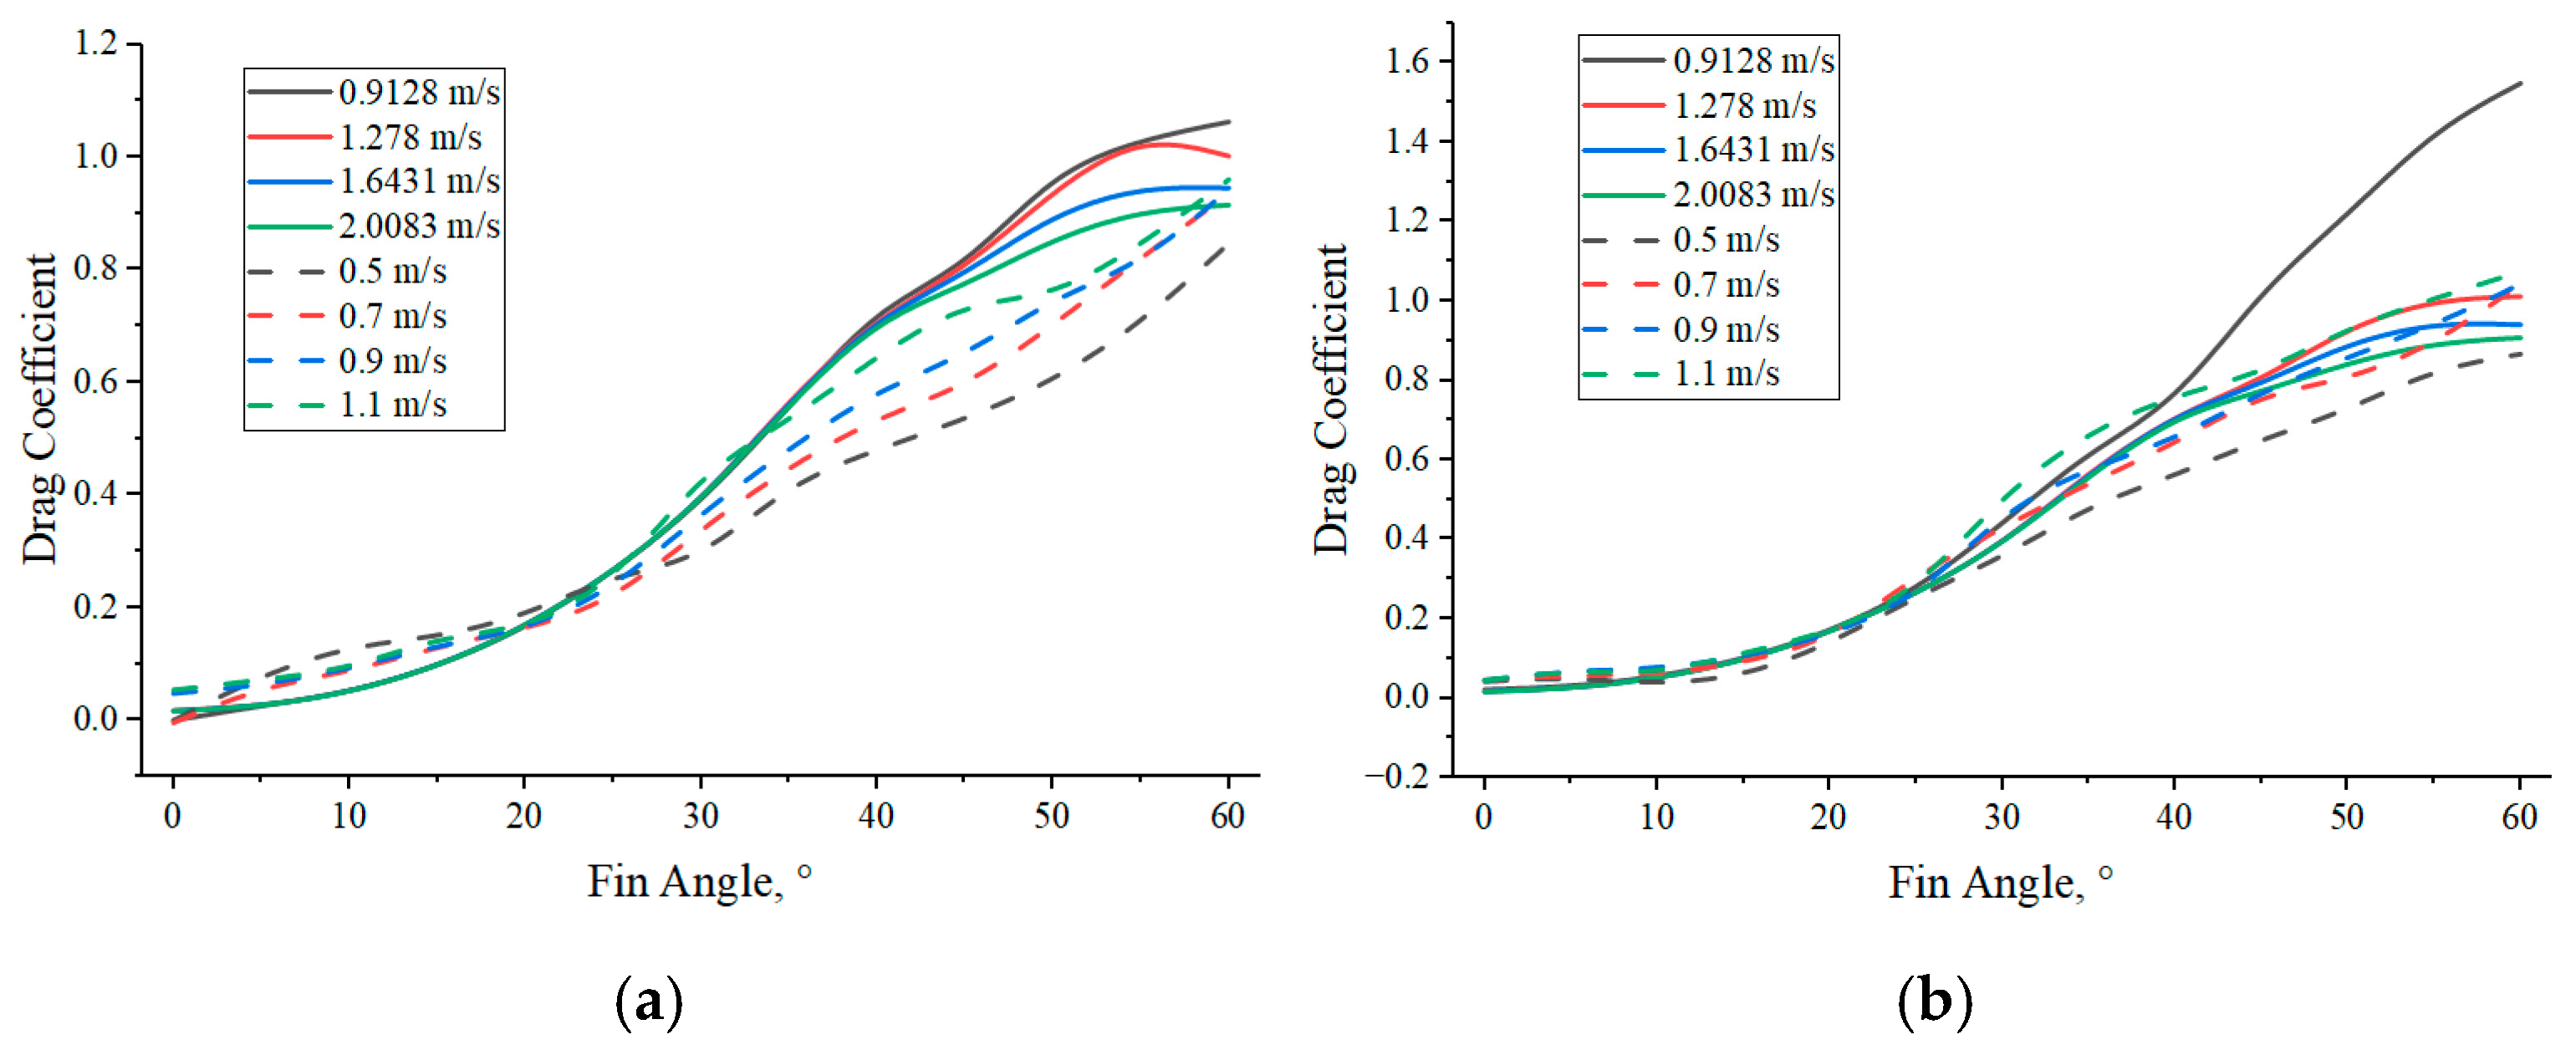
As shown in Figure 12, the prototype fin stabilizer and the 35°-chamfered perforated fin stabilizer exhibit generally similar variation patterns under different flow velocities. In both cases, the lift coefficient first increases and then decreases with increasing fin angle, although some differences can still be observed within specific angle ranges. At the flow velocity of 0.9128 m/s, when the fin angle is smaller than 25°, the lift coefficients of the 35°-chamfered fin and the prototype fin are essentially comparable. When the fin angle lies between 25° and 45°, the lift coefficient of the prototype fin is higher than that of the 35°-chamfered fin. However, once the fin angle exceeds 45°, the lift coefficient of the prototype fin becomes lower than that of the 35°-chamfered fin. Apart from this particular condition, the lift-coefficient curves of the two fins remain generally close under the other flow velocities, with only relatively minor differences. Regarding the effect of flow velocity, for the prototype fin, the lift coefficients at different velocities remain close to each other when the fin angle is below 45°. Once the fin angle exceeds 45°, however, the differences among the various velocity cases gradually become more pronounced, and the lift coefficient decreases with increasing flow velocity. For the 35°-chamfered fin, except for the 0.9128 m/s case, the variation pattern at the other velocities is broadly consistent with that of the prototype fin.
Overall, the two fins show similar lift characteristics in the small- and medium-angle ranges, whereas at large fin angles the effects of flow velocity and chamfer geometry on the lift coefficient become more evident. The 35° chamfer exhibits a certain advantage under some large-angle conditions, although the overall improvement remains limited.
From the comparison between the experimental and numerical results, the two sets of results are consistent in terms of their overall variation trend: in both cases, the lift coefficient increases first and then decreases with increasing fin angle, and higher flow velocities generally correspond to higher lift levels. This indicates that the numerical model can reasonably capture the basic variation law of fin lift with respect to fin angle and flow velocity. At the same time, however, it should also be noted that the experimental results are overall lower than the numerical predictions, and they show a greater degree of dispersion among different flow velocities. This suggests that noticeable discrepancies still exist between the two sets of results. Therefore, the comparison between the numerical and experimental results in the present study is more appropriate as a qualitative validation of the overall trend.
As shown in Figure 13, the drag coefficient increases continuously with increasing fin angle, and the growth becomes more pronounced at large fin angles, indicating that drag is more sensitive to fin angle in this range. At the flow velocity of 0.9128 m/s, when the fin angle is smaller than 25°, the drag coefficients of the 35°-chamfered fin and the prototype fin remain close to each other. Once the fin angle exceeds 25°, the drag coefficient of the 35°-chamfered fin becomes higher than that of the prototype fin, and the difference between the two cases gradually increases with increasing fin angle. Apart from this condition, the drag-coefficient curves of the two fins remain generally close under the other flow velocities.
Figure 13. Comparison of drag coefficient between simulation and experiment. (a) Prototype, (b) 35° chamfer.
Jmse 14 00882 g013
Regarding the effect of flow velocity, for the prototype fin, the drag coefficients at different velocities remain close when the fin angle is below 45°. Once the fin angle exceeds 45°, the differences among the various velocity cases become more pronounced, and the drag coefficient decreases with increasing flow velocity. For the 35°-chamfered fin, except for the 0.9128 m/s case, the variation pattern at the other velocities is generally consistent with that of the prototype fin. This suggests that the effects of flow velocity and chamfer geometry on drag become more evident in the large-angle range.
From the comparison between the experimental and numerical results, the two sets of results are broadly consistent in overall trend, namely that the drag coefficient increases with fin angle. This indicates that the numerical model can reasonably reproduce the basic variation law of fin drag with respect to fin angle. However, the experimental results are generally lower than the numerical predictions and show a greater degree of dispersion among different flow velocities, indicating that noticeable discrepancies still exist. Therefore, the present comparison of drag coefficients is more appropriate as a qualitative validation of the overall trend.
As an important indicator for comprehensively evaluating the hydrodynamic efficiency of the anti-roll fin, the lift-to-drag ratio shown in Figure 14 exhibits a similar overall trend for both the prototype fin and the 35°-chamfered fin under different flow velocities: it increases rapidly at first and then gradually decreases with increasing fin angle. This indicates that the fin possesses relatively high overall hydrodynamic efficiency in the small-angle range, whereas as the fin angle further increases, the influence of drag growth gradually becomes dominant, leading to a reduction in the lift-to-drag ratio.
Figure 14. Comparison of lift–drag ratio between simulation and experiment. (a) Prototype, (b) 35° chamfer.
Jmse 14 00882 g014
Comparing the two fin configurations, the prototype fin and the 35°-chamfered fin exhibit generally similar lift-to-drag-ratio trends. At the flow velocity of 0.9128 m/s, the prototype fin shows a consistently higher lift-to-drag ratio than the 35°-chamfered fin. Under the other, higher flow-velocity conditions, however, the lift-to-drag-ratio curves of the two fins remain generally close, with only relatively minor differences. This indicates that the 35° chamfer treatment does not improve the overall hydrodynamic efficiency of the fin stabilizer. Overall, the difference between the two models is mainly concentrated in the low-velocity condition, whereas at higher velocities the lift-to-drag-ratio results become much closer.
Regarding the effect of flow velocity, the numerical results of the prototype fin remain generally close under different velocities, indicating that the lift-to-drag ratio is relatively insensitive to flow velocity in the numerical simulations. In contrast, the experimental results show more obvious differences among the different flow velocities, especially around the peak region, where the degree of scatter is larger. Except for the 0.9128 m/s case, the overall variation trend in the experimental results at the other velocities is generally consistent with that of the numerical results. It should be noted that the experimentally obtained lift-to-drag ratios are generally lower than the numerical predictions, indicating that a certain discrepancy still exists in magnitude between the two sets of results. Therefore, the experimental–numerical comparison of the lift-to-drag ratio in the present study is more appropriate as a qualitative validation of the overall variation trend rather than a strict one-to-one quantitative validation.
The discrepancies between the experimental results and the numerical simulations may mainly arise from the following factors. First, inevitable alignment and measurement errors may be introduced during model installation, fin-angle adjustment, and sensor assembly. Second, free-surface effects, sidewall interference, and disturbances caused by the supporting structure in the towing tank cannot be fully reproduced in the numerical model. Third, although the scaled experiments were conducted based on Froude similarity, Reynolds-number similarity cannot be satisfied simultaneously between the model-scale tests and the full-scale numerical simulations, and scale effects are therefore unavoidable. Under the combined influence of these factors, the experimental results are generally lower than the numerical predictions. Accordingly, the experimental–numerical comparison presented in this study is more appropriate as a qualitative validation of the overall trend.
The present study focuses on the hydrodynamic performance of a fixed fin stabilizer under uniform inflow conditions, with particular emphasis on the effects of different perforation and chamfer configurations on the lift, drag, and lift-to-drag ratio. This treatment is helpful for identifying the fundamental influence of fin geometry on hydrodynamic response under well-controlled conditions; however, it still has certain limitations when compared with the actual operating environment of fin stabilizers. In practice, fin stabilizers mainly operate under wave-induced rolling conditions, where the local inflow is strongly unsteady, the angle of attack varies continuously with ship motion and wave action, and dynamic inflow, phase coupling, and additional nonlinear effects all play important roles. Therefore, the conclusions obtained in this study based on fixed-fin and quasi-steady inflow conditions are more suitable as a reference for the fundamental hydrodynamic characteristics of fin stabilizers, but they cannot fully represent the transient response and roll-reduction performance under realistic wave conditions. Future work will further incorporate wave effects, ship roll motion, and dynamic angle-of-attack corrections, together with unsteady numerical simulations and experimental methods, in order to investigate the hydrodynamic performance of fin stabilizers under more realistic operating conditions.
In the present study, the perforation design was restricted to a representative configuration consisting of three circular through-holes aligned along the spanwise direction, in order to isolate the effects of perforation diameter and chamfer angle. It should be noted that other perforation layouts and shapes, such as staggered holes, elliptical openings, or longitudinal groove-like perforations, are also possible.


6. Conclusions

The hydrodynamic performance of fin stabilizers is systematically analyzed in this study via numerical simulation and theoretical analysis, with particular focus on their performance under varying hole patterns and fin angles. Several critical conclusions regarding the design and optimization of fin stabilizers are drawn through numerical simulation, and a scientific foundation is provided for the further enhancement of their operational performance. The specific conclusions are presented as follows.
(1)
Fin angle enlargement widens performance discrepancies across perforation schemes, with the prototype fin delivering maximum lift and the 1%C perforation offering optimal overall balance, whereas larger perforation diameters cause sustained drops in lift and lift-to-drag ratio.
(2)
The chamfer angle exerts a non-monotonic effect on the hydrodynamic performance of perforated anti-roll fins, and the 25° chamfer performs best among tested schemes yet remains inferior to the prototype fin.
(3)
Under different flow-velocity conditions, the prototype fin and the 35°-chamfered perforated fin exhibit generally similar hydrodynamic response patterns. The effects of flow velocity and chamfer geometry become more evident mainly at large fin angles and low flow velocities, while the 35° chamfer does not show a clear overall performance advantage over the prototype fin.

Author Contributions

Conceptualization, W.W.; Methodology, W.W., J.H. and Z.D.; Software, J.H. and C.Z.; Validation, J.H.; Resources, W.W.; Writing—original draft, W.W. and J.H.; Writing—review & editing, W.W., J.Z., C.Z., Z.D. and Y.X.; Supervision, Y.X.; Funding acquisition, W.W. All authors have read and agreed to the published version of the manuscript.

Funding

This research was funded by Zhoushan Science and Technology Bureau: 2024C03002; Zhoushan Science and Technology Bureau: 2025C03009.

Data Availability Statement

The original contributions presented in this study are included in the article. Further inquiries can be directed to the corresponding authors..

Acknowledgments

The authors would like to thank the reviewers for their valuable comments and suggestions, which helped to improve the quality of this manuscript.

Conflicts of Interest

The authors declare no conflict of interest.

References

  1. Lin, W.; Yang, S.; Chen, G.; Wang, Q.; Xu, X. Review of the impact of ship’s rocking vibration on heat transfer and refrigeration systems. J. Refrig. 2014, 35, 8–15. [Google Scholar]
  2. Sutulo, S.; Guedes, S.C. Review on ship manoeuvrability criteria and standards. J. Mar. Sci. Eng. 2021, 9, 904. [Google Scholar] [CrossRef]
  3. Usman, M.; Abdallah, S.; Imran, M. Nonlinear and Stability Analysis of a Ship with General Roll-Damping Using an Asymptotic Perturbation Method. Math. Comput. Appl. 2021, 26, 33. [Google Scholar] [CrossRef]
  4. Mallouppas, G.; Yfantis, E.A. Decarbonization in ship industry: A review of research, technology development, and innovation proposals. J. Mar. Sci. Eng. 2021, 9, 415. [Google Scholar] [CrossRef]
  5. Demir, U. Evaluation of Operational Factors for the Energy Efficiency Optimization of High-Speed Roro Vessels by Trim Optimization. In Proceedings of the 14th International Exergy, Energy, and Environment Symposium, Istanbul, Turkey, 23–27 December 2019. [Google Scholar]
  6. Han, B.; Zhang, N.; Guo, J.; Guo, X. Research on anti-roll methods for marine nuclear-powered platforms. J. Nav. Sci. Technol. 2018, 40, 71–75. [Google Scholar]
  7. Liang, L.; Cheng, Q.; Li, J.; Le, Z.; Cai, P.; Jiang, Y. Design of the roll and heel reduction controller on ship’s turning motion. Ocean Eng. 2023, 284, 115093. [Google Scholar] [CrossRef]
  8. Yang, H.; Huang, Z.; Zhong, J. The Influence of Finlet on the Performance of Ship’s Anti-roll Fin. J. Dalian Marit. Univ. 2021, 47, 35–44. [Google Scholar]
  9. Su, X.; Gao, Y.; Zhao, R. Roll attitude controller design for ships at zero speed. Int. J. Fuzzy Syst. 2018, 20, 611–620. [Google Scholar] [CrossRef]
  10. Zhang, R.; Huang, L.; Ma, R.; Peng, G.; Ruan, Z.; Wang, C.; Zhao, H.; Li, B.; Wang, K. Numerical investigation on the effects of heel on the aerodynamic performance of wing sails. Ocean Eng. 2024, 305, 117897. [Google Scholar] [CrossRef]
  11. Jiao, J.; Zou, Y.; Xu, W.; Yang, Z. Experimental investigation of anti-roll performance of a ship with flap-type fin stabilizers in oblique waves at zero speed. Ocean Eng. 2025, 342, 123010. [Google Scholar] [CrossRef]
  12. Xu, W.; Jiao, J.; Xu, G.; Zhang, M.; Zou, Y. Intelligent control of flap-type fin stabilizer for ship roll motion reduction. Ocean Eng. 2025, 323, 120630. [Google Scholar] [CrossRef]
  13. Zou, Y.; Xu, W.; Jiao, J. Sea trial of anti-rolling performance of a zero-speed ship model in coastal waves using PPO-based reinforcement learning control of flapping fins. Ocean Eng. 2026, 355, 125195. [Google Scholar] [CrossRef]
  14. Sun, M.; Ye, H.; Liu, J.; Luan, T.; Lian, H. Analysis of lift-drag characteristics and design of collaborative anti-rolling control system for variable-diameter Magnus rotating roll stabilizer. Ocean Eng. 2025, 324, 120713. [Google Scholar] [CrossRef]
Figure 1. Schematic diagram of anti-roll principle.
Jmse 14 00882 g001
Figure 2. Stabilizer fin with 35° chamfered perforations. (a) Perspective view, (b) section view, (c) top view.
Jmse 14 00882 g002
Figure 3. Schematic diagram of boundary conditions.
Jmse 14 00882 g003
Figure 4. Lift of the prototype fin at 10° angle of attack for different computational domain sizes.
Jmse 14 00882 g004
Figure 5. Lift of the prototype fin at 10° angle of attack for different mesh densities.
Jmse 14 00882 g005
Figure 6. Lift of the prototype fin at 10° angle of attack for different boundary layer.
Jmse 14 00882 g006
Figure 7. Schematic diagram of the stabilizer fin numerical simulation grid. (a) Overall grid diagram, (b) grid sectional view.
Jmse 14 00882 g007
Figure 8. Schematic diagram of the experimental setup.
Jmse 14 00882 g008
Figure 9. Numerical simulation results of the effect of straight-walled perforation on the hydrodynamic performance of the stabilizer fin. (a) Lift coefficient, (b) drag coefficient, (c) lift–drag ratio.
Jmse 14 00882 g009
Table 1. Numerical simulation conditions for the effect of straight-walled perforation.
Fin AnglePattern of HolesSpeed
0–30° (2° intervals)Prototype 10 m/s
1%C diameter straight wall perforation
2%C diameter straight wall perforation
4%C diameter straight wall perforation
6%C diameter straight wall perforation
Table 2. Summary of numerical simulation conditions.
Fin AnglePattern of HolesSpeed
0–60°
(5° intervals)
Prototype10 m/s
1%C diameter 25°~45° chamfered perforation
2%C diameter 25°~45° chamfered perforation
Table 3. Summary of conditions schemes.
Fin AnglePattern of HolesSimulated SpeedExperiment Speed
0°~60°
(5° intervals)
prototype0.9128 m/s, 1.2780 m/s, 1.6431 m/s, 2.0083 m/s0.5 m/s, 0.7 m/s, 0.9 m/s, 1.1 m/s
1%C hole diameter 35° chamfer perforation
Disclaimer/Publisher’s Note: The statements, opinions and data contained in all publications are solely those of the individual author(s) and contributor(s) and not of MDPI and/or the editor(s). MDPI and/or the editor(s) disclaim responsibility for any injury to people or property resulting from any ideas, methods, instructions or products referred to in the content.