Article

Analysis on Phase Polarity of Mandrel Fiber-Optic Vector Hydrophones Based on Phase Generated Carrier Technique

College of Meteorology and Oceanology, National University of Defense Technology, Changsha 410073, China
*
Author to whom correspondence should be addressed.
J. Mar. Sci. Eng. 2025, 13(9), 1825; https://doi.org/10.3390/jmse13091825
Submission received: 17 August 2025 / Revised: 5 September 2025 / Accepted: 19 September 2025 / Published: 20 September 2025
(This article belongs to the Section Ocean Engineering)

Abstract

In ocean engineering, the demand for fiber-optic vector hydrophones (FOVHs) is increasing. The performance of a FOVH depends on phase consistency between its pressure and acceleration channels, which should match the acoustic field’s properties. Phase polarity, which refers to the alignment of the output signal with the acoustic field direction, is critical. Incorrect phase polarity during sensor assembly can disrupt phase consistency and invalidate directional measurements. This study investigates phase polarity in mandrel FOVHs that use the Phase Generated Carrier (PGC) technique. We develop a theoretical model combining the PGC algorithm with elastic mechanics to analyze the response of acoustic signals. Our model shows that correct demodulated signal polarity requires a specific physical setup: the pressure sensor’s long arm should be on the inner mandrel and the short arm on the outer, while the accelerometer’s positive axis should follow the vector from the long to its short arm. These results are validated through standing wave tube experiments and lake tests. This research provides practical guidelines for the installation and calibration of FOVHs, ensuring phase consistency in underwater acoustic sensing.

1. Introduction

Fiber-optic vector hydrophones (FOVHs) combine an acoustic pressure sensor with three orthogonal vector sensors [1]. These systems offer high sensitivity, immunity to electromagnetic interference, and suitability for large-scale array deployments [2,3]. FOVHs capture both acoustic pressure and particle velocity data at a single point, enabling directional beamforming and spatial gain [2,4]. Consequently, FOVHs are widely used in underwater target detection [5], resource exploration [6], and seismic monitoring [7].
In recent years, many studies have focused on improving sensitivity and bandwidth, particularly using push–pull mandrel designs [8,9,10]. However, phase information is also vital for accurate target localization. For instance, the acceleration channel is directional, but a reference pressure channel is needed to resolve front–back ambiguity. In the far field, pressure and velocity should be in phase [11]. Deviations from this phase relationship suggest potential sensor installation or response issues.
Despite its importance, the phase behavior of FOVHs remains underexplored. Previous studies have noted factors like asymmetric suspension structures [12] and low signal-to-noise ratios [13] that contribute to phase errors. Other reports describe erratic phase behavior near acoustic sources and reflective boundaries [14,15]. Li and Chen examined polarity in fiber-optic pressure sensors and accelerometers and noted π-radian shifts introduced by opposite polarities [16,17]. However, these studies only examine pressure sensors and accelerometers in isolation. A comprehensive study on integrated FOVH systems is lacking. The phase inconsistency may result from the interaction of sensor installation, mechanical design, and demodulation methods.
Polarity refers to the directionality of the sensor output. In pressure sensors with positive polarity, a positive signal corresponds to medium compression, while a negative signal indicates rarefaction. In accelerometers, a positive signal denotes that acceleration aligns with the sensor’s preset direction. Correct phase polarity is essential for FOVHs and polarity needs to match the intrinsic relationship between acoustic pressure and particle motion. Improper polarity leads to inaccurate phase references and reduces localization accuracy.
This study aims to address this gap by analyzing phase polarity in mandrel FOVHs using phase-generated carrier (PGC) demodulation. We derive the theoretical phase relationship between acoustic pressure and acceleration, then build a model combining PGC with elastic mechanics to predict phase responses for pressure and acceleration channels under various optical fiber coiling configurations. Finally, we validate the model through lab and field experiments. The results give clear rules for sensor coiling and axis definition. Our work offers clear guidelines for FOVHs assembly and calibration so that arrays meet the phase-consistency required for underwater sensing and target localization.

2. Theoretical Framework

2.1. Phase Relationship Between Sound Pressure and Particle Acceleration

In a uniform, isotropic and inviscid medium, Euler’s equation for small-amplitude harmonic motion is [11]
p = ρ 0 v t ,
where is the gradient operator, p is pressure, ρ 0 is the static density, v is the particle velocity vector, and t is the time. A complete solution for the acoustic field is p = p 0 r e j ( ω t k r ) , where p 0 is the reference pressure, j is the imaginary unit, ω is the angular frequency of acoustic waves, k is the wave number, and r is the distance. Solving this for a harmonic field gives the following relationship:
v = 1 j ω ρ 0 p = 1 ρ 0 c 0 1 j k r p r ^ ,
where c 0 the speed of sound and r ^ is the vector representing the direction of wave propagation.
In the far field ( k r 1 ) , pressure and velocity are in the following phase:
ρ 0 c 0 v = p r ^ .
With a = v ˙ = j ω v , we obtain the following:
p r ^ = ρ 0 c 0 j ω a = ρ 0 c 0 ω a e i π 2 .
This shows that particle acceleration leads acoustic pressure by π / 2 radians. This is the relationship that the output of the sound pressure sensor and the accelerometer of FOVH need to follow.

2.2. Phase Characteristics of PGC Demodulation Signals

Figure 1 shows a Michelson interferometric hydrophone that uses PGC. A laser at optical frequency υ t = υ 0 + Δ υ cos ω 0 t enters the Michelson interferometer (MI) within the dashed box, forming the sensing probe of the fiber-optic hydrophone. Two output ports of the fiber coupler connect to single-mode fibers terminated with Faraday rotation mirrors (FRMs) to suppress polarization fading. Acoustic pressure modulates the optical phase difference (OPD) of the two sensing arms.
Generally, the OPD between the MI’s two sensing arms can be expressed as [16]
ϕ ( t ) = 4 π n L 1 + Δ L 1 ( L 2 + Δ L 2 ) c ( υ 0 + Δ υ cos ω 0 t ) = 4 π n c L 1 + Δ L 1 ( L 2 + Δ L 2 ) Δ υ cos ω 0 t + 4 π n c ( Δ L 1 Δ L 2 ) υ 0 + 4 π n c ( L 1 L 2 ) υ 0 = C cos ω 0 t + ϕ s + ϕ 0 ,
where n is the refractive index, c is the speed of light, L 1 and L 2 represent the initial lengths of the two fibers, Δ L 1 and Δ L 2 are the small acoustic-induced changes ( L 1 + Δ L 1 L 1 , L 2 + Δ L 2 L 2 ). The term C = 4 π n c L 1 L 2 Δ υ represents the PGC modulation depth, and ϕ 0 = 4 π n c ( L 1 L 2 ) υ 0 is the initial phase.
The acoustic signal-induced OPD is given by
ϕ s ( t ) = 4 π n c ( Δ L 1 Δ L 2 ) υ 0 .
Effective PGC modulation requires a non-zero difference in arm lengths and C is generally greater than zero. Thus, L 1 is the long arm of the MI (LA), L 2 is the short arm of the MI (SA). Thus, the acoustic signal-induced OPD can be expressed as
ϕ s ( t ) = ϕ long ( t ) ϕ short ( t ) .
This indicates that the demodulation signal is positively correlated with the optical path in the LA ϕ long and negatively correlated with the optical path in the SA ϕ short . It is the basis for analyzing the demodulation polarity of FOVH.

2.3. Elastic Mechanics Characteristics of Pressure Sensor

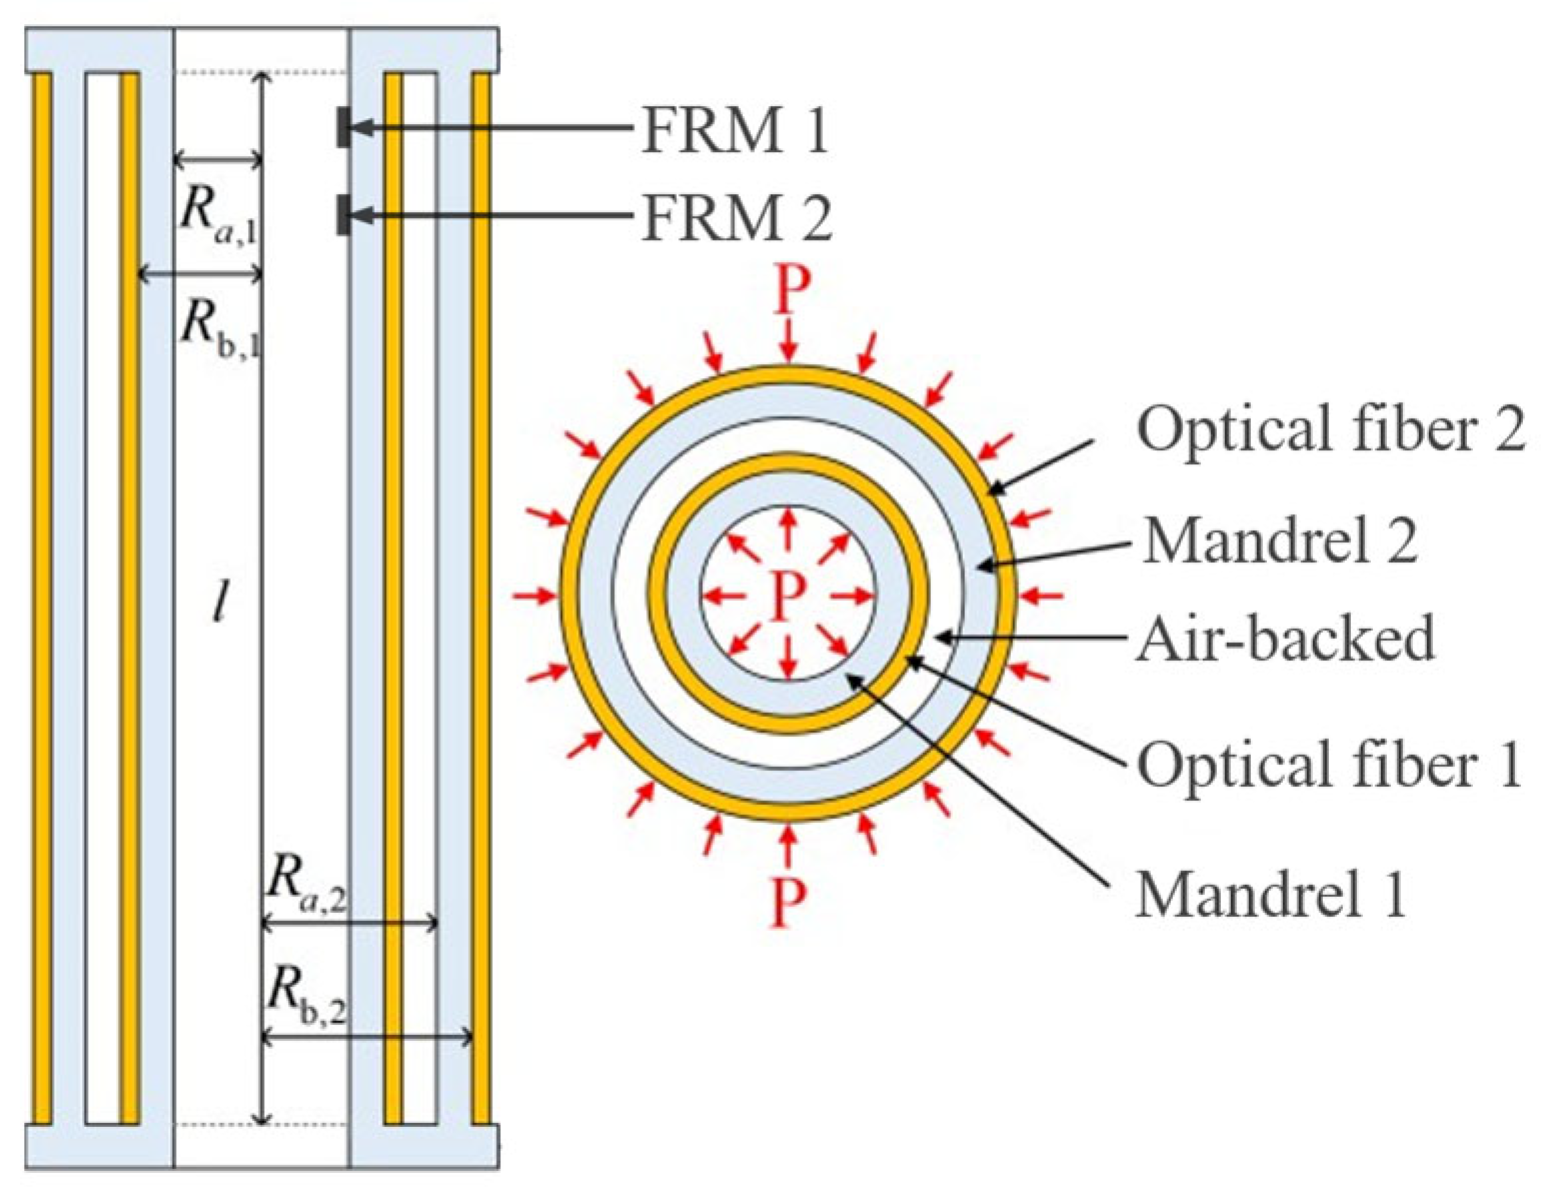
The pressure sensor consists of two thin-walled elastic mandrels arranged coaxially, as shown in Figure 2. Fiber 1 is coiled on the inner mandrel (tube 1), and fiber 2 is coiled on the outer mandrel (tube 2). The outer surface of tube 2 and the inner surface of tube 1 are subjected to water loading, while the opposite surfaces are air-backed, creating differential pressures.
Under increasing pressure, tube 1 expands radially, while tube 2 contracts. These strains change the lengths and phases of the coiled fibers. Using thin-shell theory and the photoelastic effect, the relationship between the OPD of the two sensing fibers and acoustic pressure can be succinctly expressed as [10]
Δ ϕ in ( t ) = M 1 P ( t )   ,
Δ ϕ out ( t ) = - M 2 P ( t )   ,
where M 1 and M 2 are the positive sensitivity coefficients of the inner and outer fiber-mandrel combinations, determined by geometry and material constants. These coefficients are given by
M 1 = 4 π n L 1 λ 1 + μ E R a , 1 2 ( 2 2 μ ) R b , 1 2 R a , 1 2   1 1 2 n 2 [ P 12 μ f ( P 11 + P 12 ) ] ,
M 2 = 4 π n L 2 λ 1 + μ E R a , 2 2 + ( 1 2 μ ) R b , 2 2 R b , 2 2 R a , 2 2 1 1 2 n 2 [ P 12 μ f ( P 11 + P 12 ) ] ,
where n is the refractive index of the fiber, λ is the wavelength of light, L 1 and L 2 are the length of the fiber coiled around the inner and outer mandrel, E and μ are the Young modulus and Poisson ratio of the mandrel, R a , 1 and R b , 1 are the inner and outer radius of the inner mandrel; R a , 2 and R b , 2 are the inner and outer radius of the outer mandrel; P 11 and P 12 are the fiber strain-optic coefficients; μ f is the fiber Poisson ratio.
Since the PGC demodulation signal equals the optical path in the LA minus the SA, correct polarity requires coiling the LA on the inner mandrel and the SA on the outer mandrel. The demodulation signal ϕ p becomes
ϕ p ( t ) = M 1 + M 2 P ( t )   .
Reversing the coiling (placing the LA on the outer mandrel and the SA on the inner mandrel) causes the demodulation signal to become negatively correlated with the acoustic pressure, introducing a 180° phase shift in the system response. This configuration is a critical design error and should be avoided during sensor assembly.

2.4. Elastic Mechanics Characteristics of Accelerometer

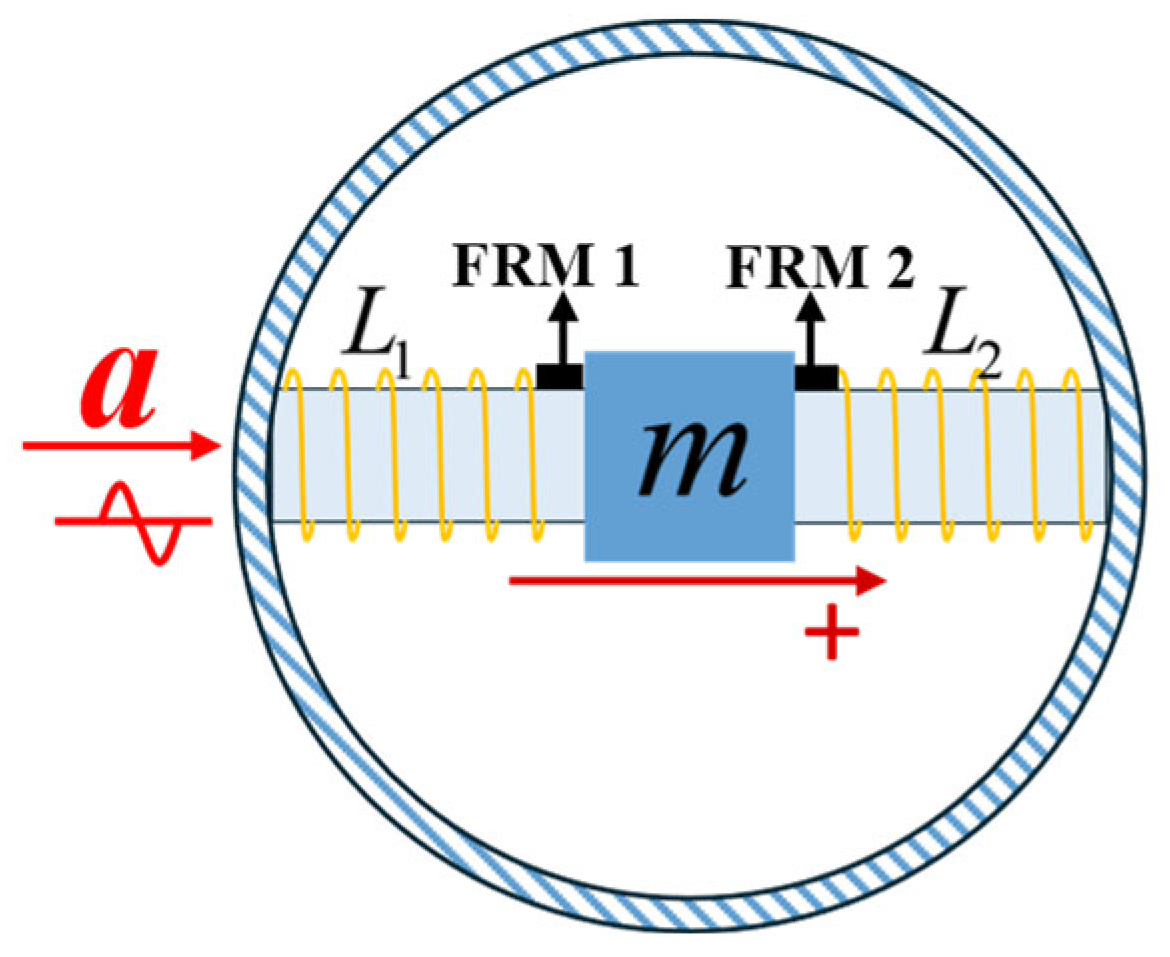
The accelerometer uses a push–pull structure with a central proof mass between two identical elastic mandrels (Figure 3). The fibers on the two mandrels form the sensing arms of an unbalanced MI. This assembly features a neutral buoyancy design, allowing free movement with fluid particles under acoustic wave excitation. The push–pull configuration results in opposite phase responses in the two sensing fibers, making the definition of the positive axis essential.
Define the positive axis as the vector from the mandrel coiled with fiber L 1 to the mandrel coiled with L 2 , as shown in Figure 3. Positive acceleration compresses the left mandrel and stretches the right mandrel. Mandrel-generated strains transfer to the coiled fibers. The compressed mandrel undergoes axial shortening with Poisson-effect-induced radial expansion, increasing coiled fiber length and producing phase shift Δ ϕ 1 ( t ) . Conversely, the stretched mandrel experiences axial elongation with radial contraction, decreasing coiled fiber length and generating phase shift Δ ϕ 2 ( t ) . According to the elastic mechanics model of the accelerometer [9],
Δ ϕ 1 ( t ) = B 1 a t ,
Δ ϕ 2 ( t ) = - B 2 a t ,
where B 1 and B 2 are sensitivity coefficients determined by the geometry and material properties of the mandrels. B i = 2 n μ m λ E R 2 L i 1 1 2 n 2 [ P 12 μ f ( P 11 + P 12 ) ] ( i = 1 , 2 ), where R is the mandrel radius and m is the proof mass.
Since the PGC demodulation signal equals the optical path in the LA minus the SA, correct polarity requires L 1 as the LA and L 2 as the SA. The demodulation signal ϕ a becomes
ϕ a ( t ) = B 1 + B 2 a ( t )   .
According to the derivation assumption shown in Figure 3, when L 1 is the LA and L 2 is the SA, the positive axis points from the LA mandrel to the SA mandrel. This configuration maintains proper correspondence between accelerometer polarity and measured acceleration direction. The accelerometer produces positive output signals when the acceleration direction matches the preset polarity direction, and negative output signals when the direction is reversed.
In summary, the inherent positive direction of push–pull mandrel accelerometers basde on PGC technique extends from the LA mandrel toward the SA mandrel.

2.5. Three-Dimensional FOVH Polarity Configuration

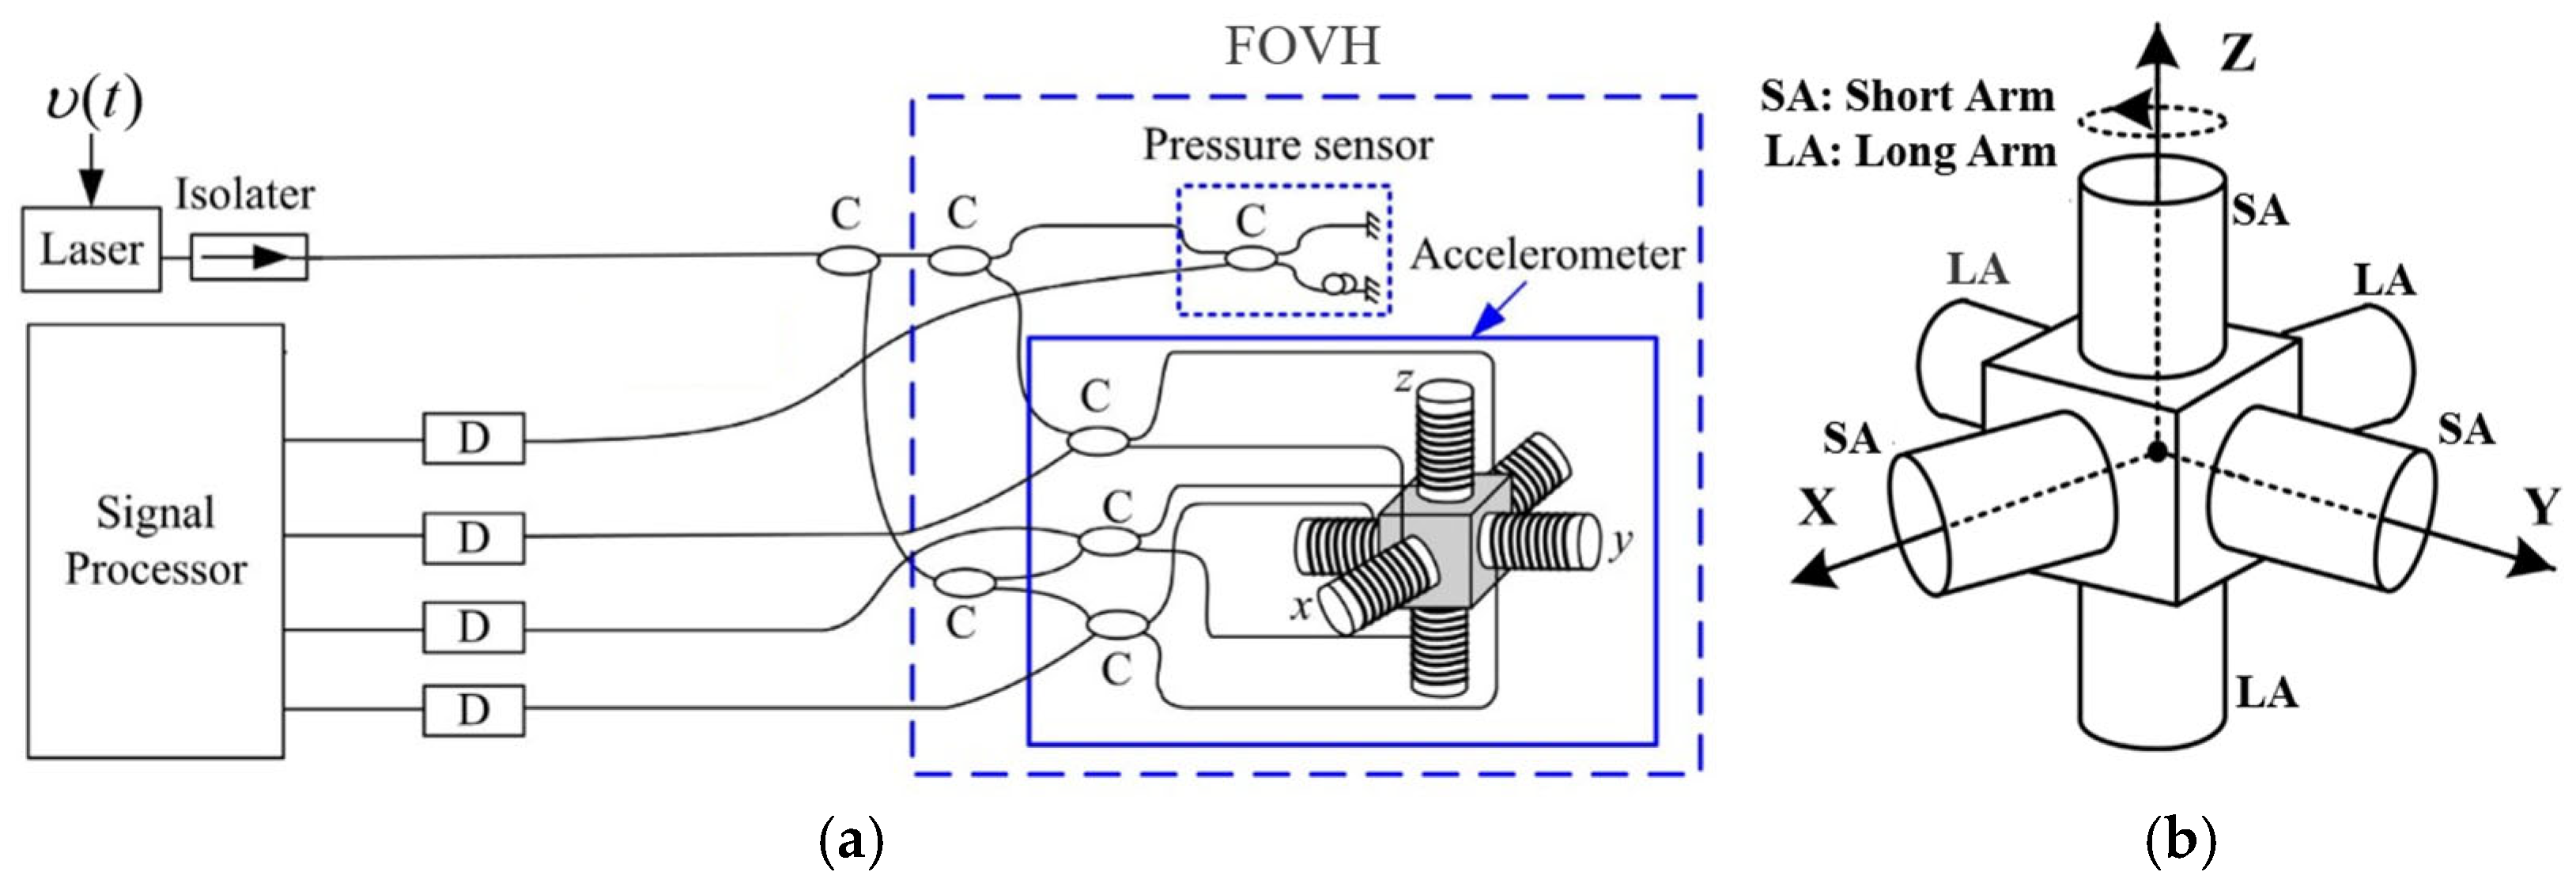
A single-element FOVH based on PGC technique combines a pressure sensor and a three-axis accelerometer, as shown in Figure 4a. The geographic target coordinates are derived by transforming the reference coordinate system using three-dimensional attitude information from auxiliary compass recordings. Accurate target bearing estimation requires the proper definition of the FOVH reference coordinate system.
From the analysis of the photoelectric detection algorithm and the elastic mechanical influences on demodulation signals, we have established the impact of fiber coiling configurations on the output signal polarity of fiber-optic hydrophones. Thus, we define the following polarity conventions for 3D FOVHs.
For pressure sensors: coil the LA on inner mandrel and the SA on outer mandrel. For accelerometers: define the positive axis from the LA mandrel to the SA mandrel for each axis. The positive axes are installed orthogonally following the right-hand rule, with the reference coordinate system’s +X, +Y, and +Z axes corresponding to the directions from the LAs to the SAs of the three-component accelerometer, as shown in Figure 4b.
Under plane wave conditions, when the LA mandrel faces the acoustic source direction (acoustic intensity direction aligned with proposed positive direction), the acceleration channel leads the acoustic pressure channel by 90°. Conversely, when acoustic intensity direction aligns with negative direction, the acceleration channel lags the acoustic pressure channel by 90°.

3. Experiments and Results

3.1. Sensors Fabrication

To experimentally validate the proposed phase characteristics, we fabricated FOVH probes following Figure 2 and Figure 3. For comparative testing, two sets of pressure sensors and accelerometers were Produced. In the first set, the LA was coiled on the inner mandrel and the SA on the outer mandrel. In the second set, this configuration was inverted, with the SA placed on the inner mandrel and the LA on the outer one.
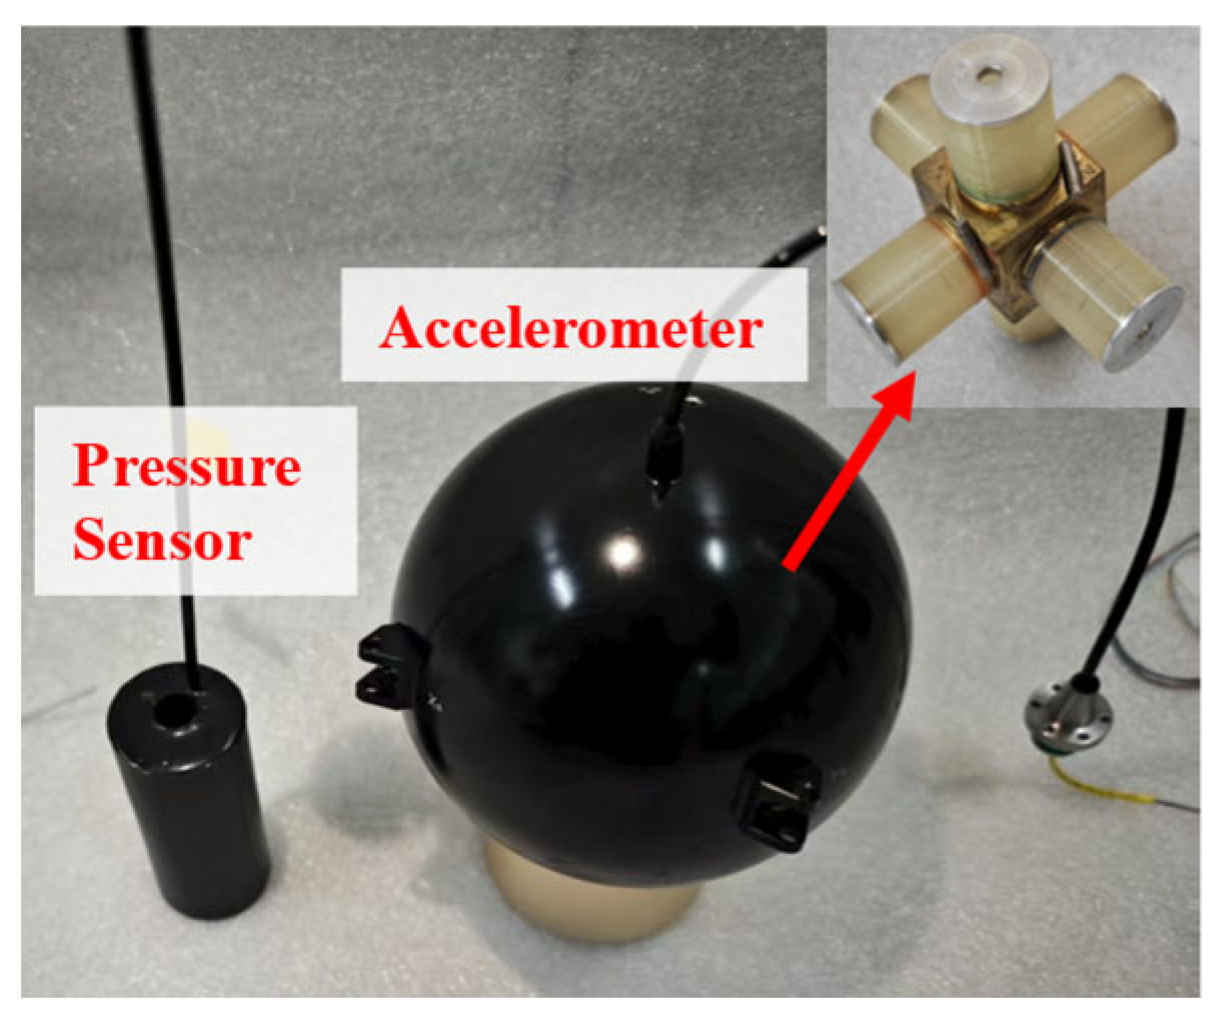
The accelerometers were fabricated with opposing definitions for their positive axes. In one-dimensional scenarios, these two definitions could be equivalent by simply inverting the sensor. However, in three-dimensional systems, the reference coordinate system should follow the right-hand rule of the Cartesian coordinate system, making the two configurations non-interchangeable. In the first accelerometer, the positive direction is defined as the vector pointing from the LA mandrel to the SA mandrel. In the second accelerometer, the positive direction is defined as pointing from the SA mandrel to the LA mandrel. The fabricated pressure sensors and accelerometers are shown in Figure 5, and the design parameters of the FOVH probe are listed in Table 1.

3.2. Experiments in a Standing Wave Tube

Theoretically, accurate polarity calibration of the hydrophone should be carried out under plane wave conditions, avoiding reflected waves. In practice, standing wave conditions offer a more accessible laboratory setup. We calibrated polarity in a standing-wave tube using the equivalence between plane and standing waves.
Figure 6 shows the schematic of the standing wave tube experimental setup. This configuration calibrates one accelerometer axis at a time. A 10 mW laser diode (LD, Orion™ serial, RIO) was used as the light source, with PGC internal modulation applied via a signal generator. A symmetrical 2 × 2 coupler splits the light between the pressure sensor and the accelerometer. After passing through the coupler inside the probe, the light enters the asymmetric Michelson interferometer, where it is reflected by the Faraday rotator before being output from the coupler. The acoustically modulated interference signals from the sensors were directed to photodetectors (PD1, PD2), which converted the optical signals into electrical signals. A digital acquisition card (DAC) sampled each channel at 32 kHz and transmitted the data to a personal computer (PC). The source at the bottom of the tube emitted sinusoids with signal-to-noise ratios exceeding 20 dB.
The pressure sensor, accelerometer, and a reference piezoelectric hydrophone (PH, sensitivity: −190.8 dB ref 1 V / μ P a , made by Hangzhou Applied Acoustics Research Institute, Hangzhou, China) were placed 10 cm below the surface to share the same acoustic field [18].
To compute the pressure sensitivity of the pressure sensor, we compared it with the PH. The PH output served as a reference for comparing the acoustic pressure sensitivity and phase output of both sensors under different configurations. The pressure sensitivity M P is calculated as [19]
M P = M 0 Δ ϕ P U ,
where M 0 is the PH sensitivity, U is the PH output voltage, and Δ ϕ P is the sensor phase at the drive frequency.
For the accelerometer channel, standing-wave impedance differs from plane waves. The pressure sensitivity M P - a of the accelerometer is [20]
M P - a = M 0 Δ ϕ a U tan k d ,
where Δ ϕ a is the accelerometer output phase, k is the wave number, and d is the hydrophone depth.
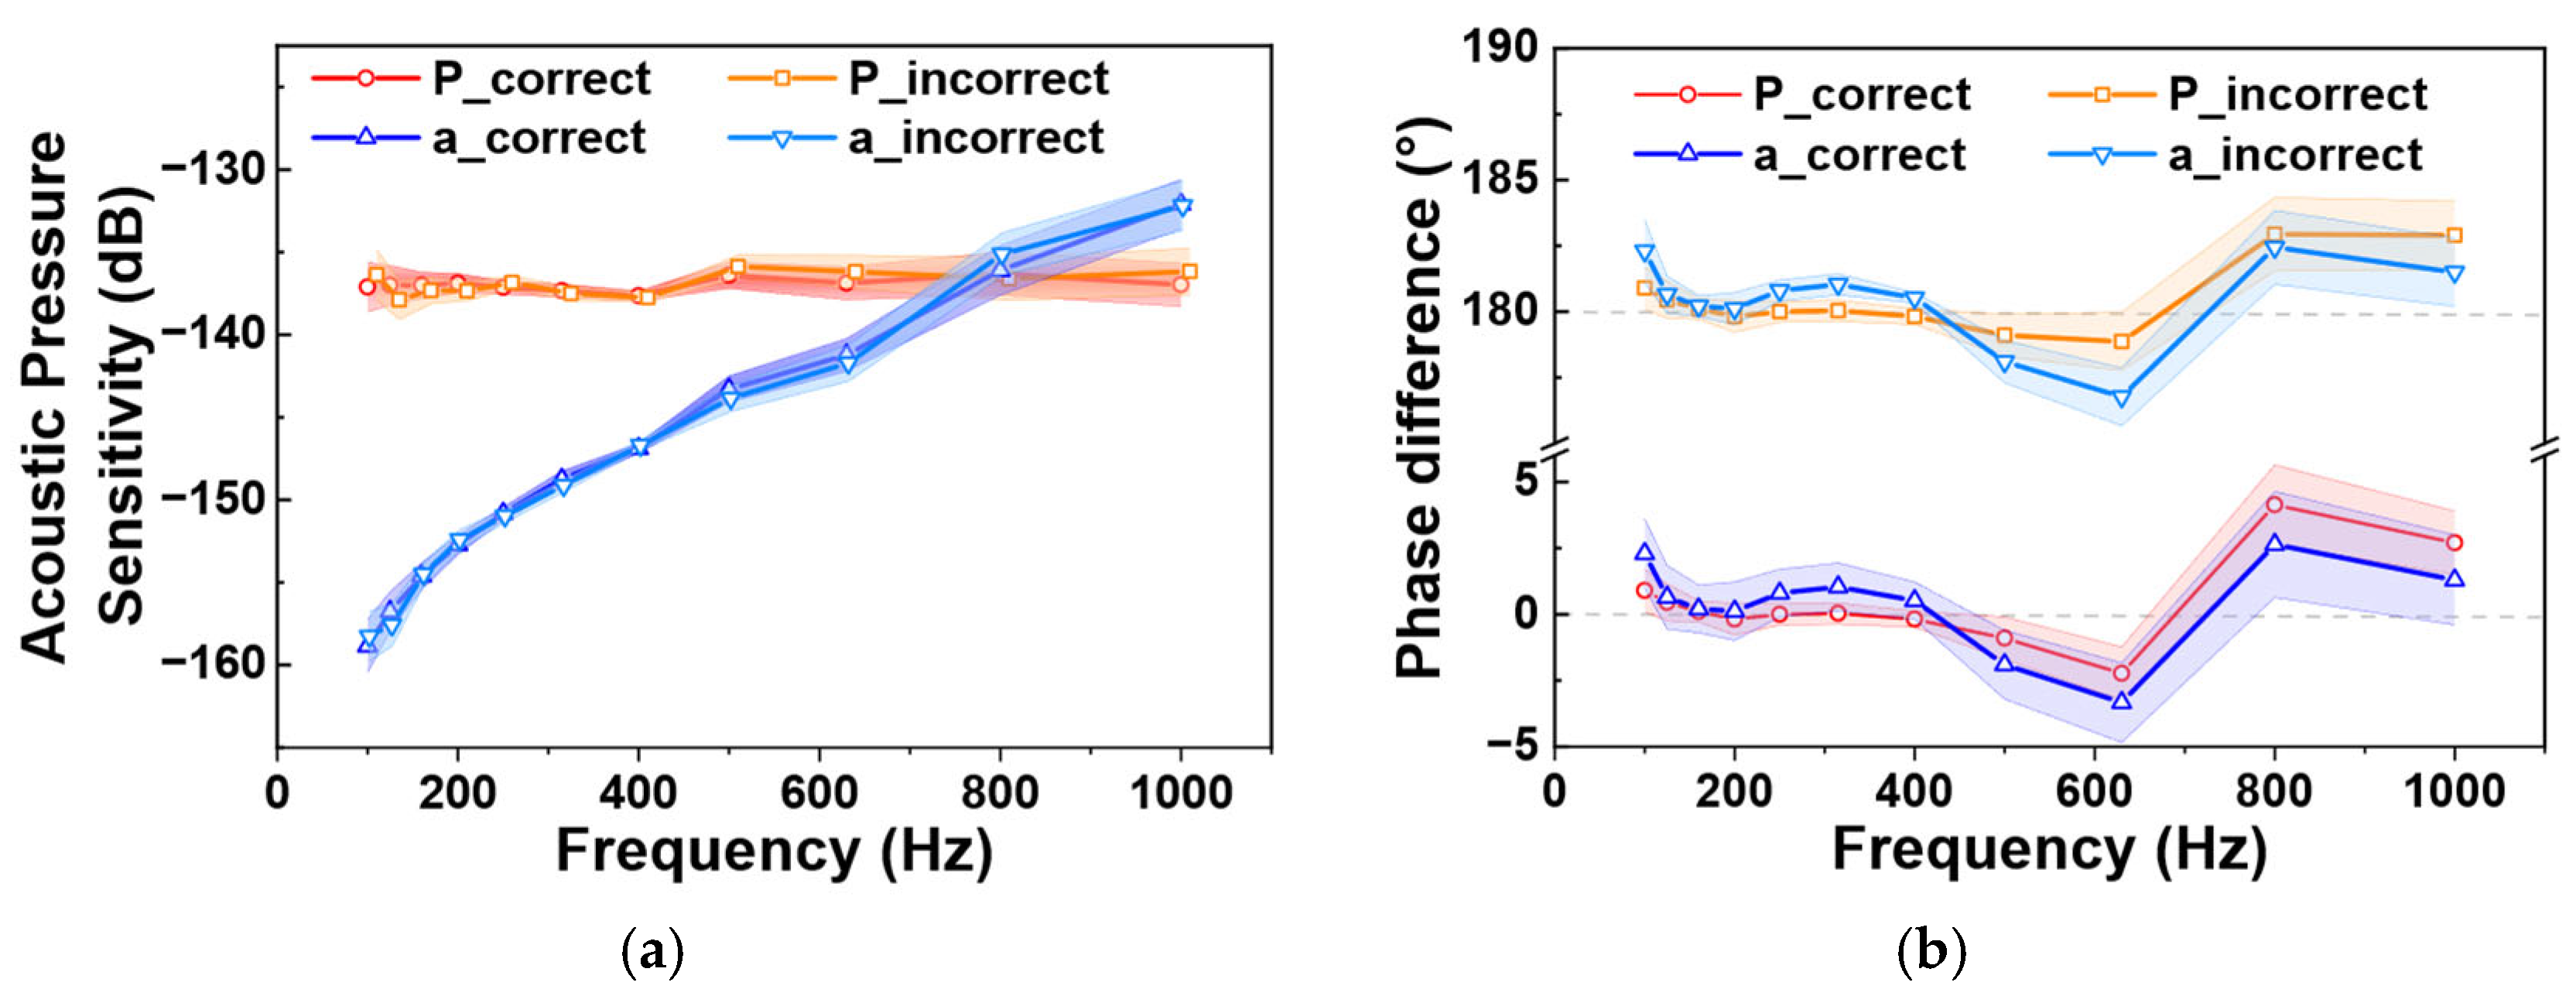
The configurations for the pressure sensor and accelerometer are defined as follows: P_correct represents the pressure sensor configuration where the LA is coiled on the inner mandrel and SA on the outer mandrel; P_incorrect represents the reverse configuration. For the accelerometer, a_correct denotes that the positive direction of the accelerometer extends from the LA mandrel toward the SA mandrel. (LA near-source, SA far-source); a_incorrect represents the opposite orientation. Table 2 summarizes these configurations.
We measured one axis at a time and show z-axis results as representative (Figure 7). Ten independent repeat experiments were conducted under identical conditions to quantify measurement uncertainty. Figure 7a shows the acoustic pressure sensitivities for all four configurations (units: dB ref 1 μ Pa ). Using fast Fourier transform, we extracted phase information at the acoustic emission frequency and calculated phase differences between the sensors and the PH reference, with error bars representing the standard deviation (SD), as shown in Figure 7b (units: degrees).
Figure 7 shows that P_correct and P_incorrect have nearly identical sensitivities (≈−137 dB re 1 μPa) but differ by 180° in phase. Critically, the P_correct configuration yields phase difference of 0.52° ± 0.7° at 400 Hz. Only P_correct accurately measures acoustic pressure with phase shifts within ±5°.
For acceleration, standing-wave theory predicts pressure and acceleration are in phase when upward is defined as positive [21,22]. Figure 7 confirms consistent acoustic pressure sensitivities for both the A_incorrect and A_correct configurations, with sensitivity increasing with frequency. The A_correct output remains near zero phase relative to the reference, while A_incorrect flips by 180°. Therefore, only A_correct accurately maps the measured quantity’s amplitude and direction.
Minor system deviations likely arise from slight acoustic center misalignments [23] or suspension effects [20]. While these phase deviations may limit performance in high-frequency applications or those requiring exceptional phase accuracy, they remain within acceptable ranges for underwater target detection, especially below 2 kHz. The experimental data sufficiently supports our conclusions despite these uncertainties.
The standing wave experiments validate our theoretical model. For pressure sensors, correct polarity requires coiling the LA on the inner mandrel and the SA on the outer mandrel. For accelerometers, the direction from the LA mandrel to the SA mandrel must be preset as positive to ensure accurate acceleration direction mapping. These calibrated FOVHs were subsequently used for field validation.

3.3. Tests in a Lake

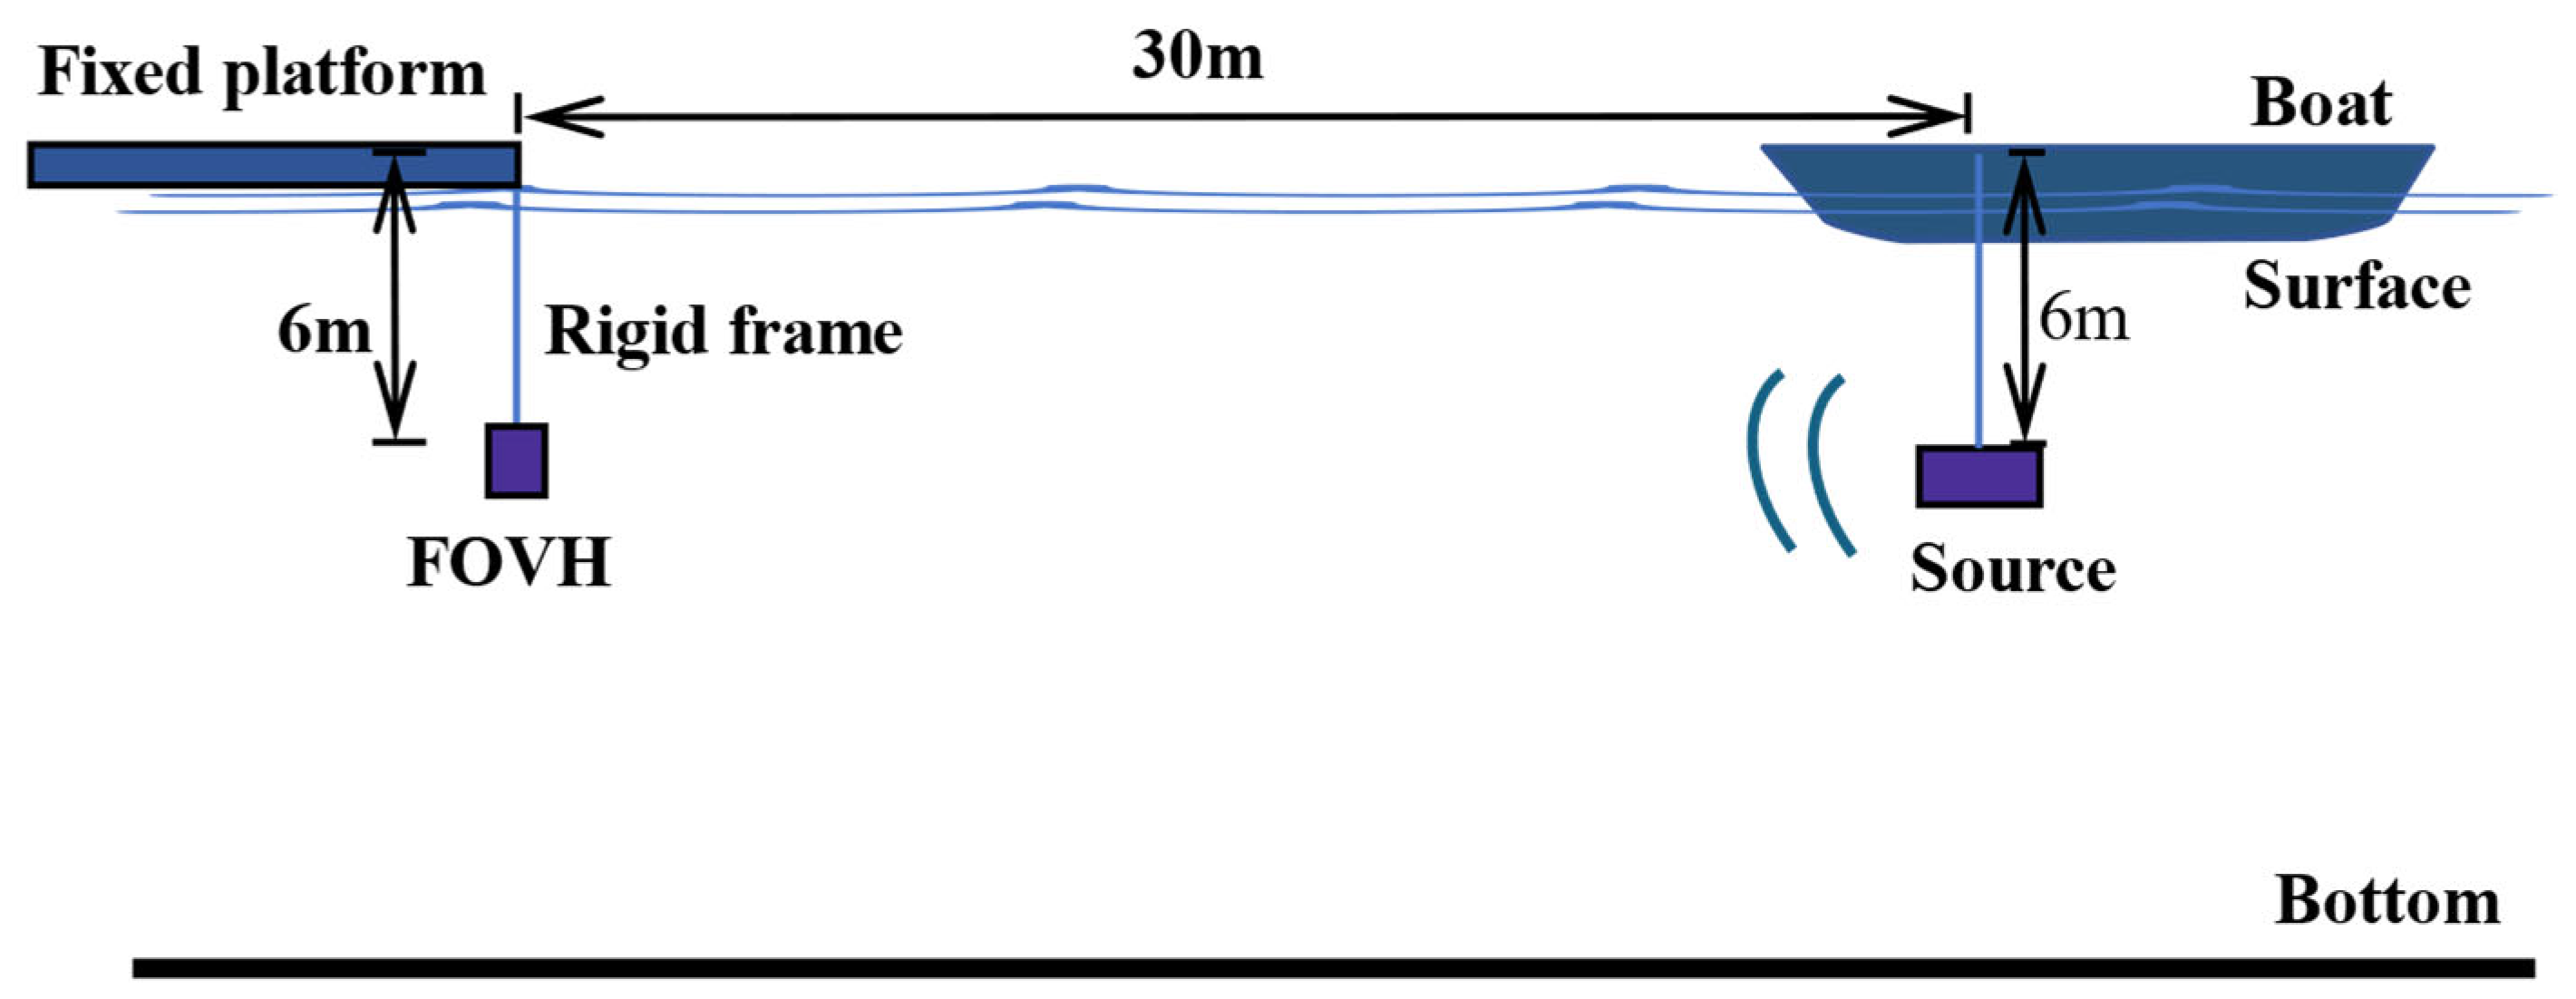
We conducted field experiments at Qingyang Lake (Hunan Province, China) to verify the FOVH phase polarity under plane wave conditions. Figure 8 shows the experimental configuration. The water depth at the site was 30 m. The FOVH was placed 6 m below a fixed platform, secured by a rigid frame to maintain a constant axial orientation, and kept over 20 m from the shore. The source was placed 30 m from the sensor at 6 m depth.
To support the plane-wave assumption, we used two checks. First, we reduced boundary reflections by time-windowing a six-cycle sinusoidal pulse transmitted every 5 s. Processing retained only the first five cycles—the direct arrival before shore echoes—so the analyzed segment approximates free-field propagation. Second, the source–receiver separation r and frequency f satisfy the far-field criterion k r 1 , where k = 2 π f / c is the acoustic wavenumber and c = 1500 m/s is the sound speed in water. For f > 100   Hz , k r > 12.5 , which is consistent with plane waves. Together, these steps establish plane-wave conditions suitable for phase-polarity analysis in the lake environment.
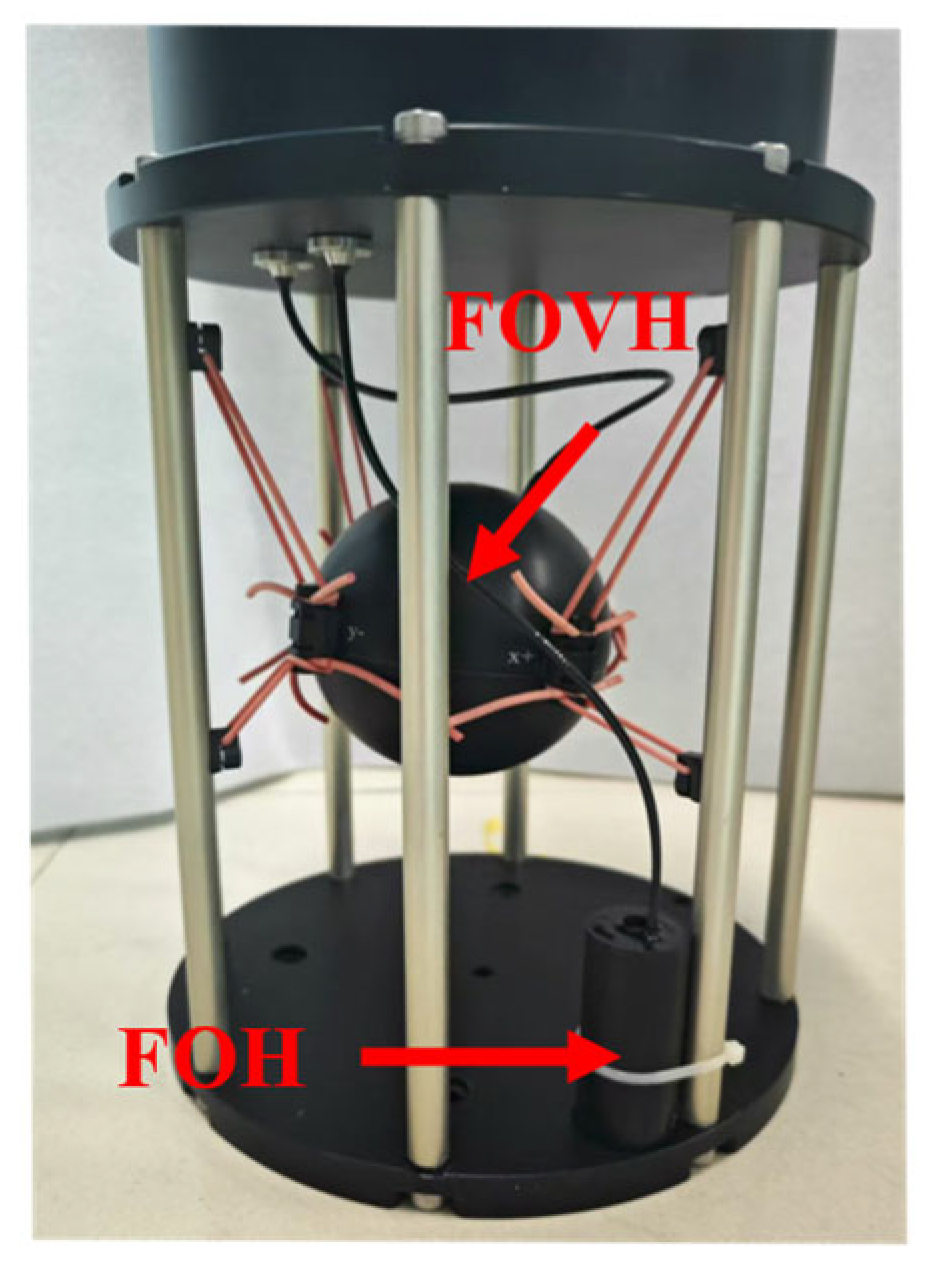
The pressure sensor and accelerometer were integrated into one frame, with their acoustic centers within 15 cm, as shown in Figure 9. The accelerometer was suspended by rubber bands to maintain stable underwater orientation. Based on the laboratory results (Section 3.2), we fixed the pressure sensor configuration (LA on the inner mandrel, SA on the outer mandrel) and evaluated the FOVH polarity.
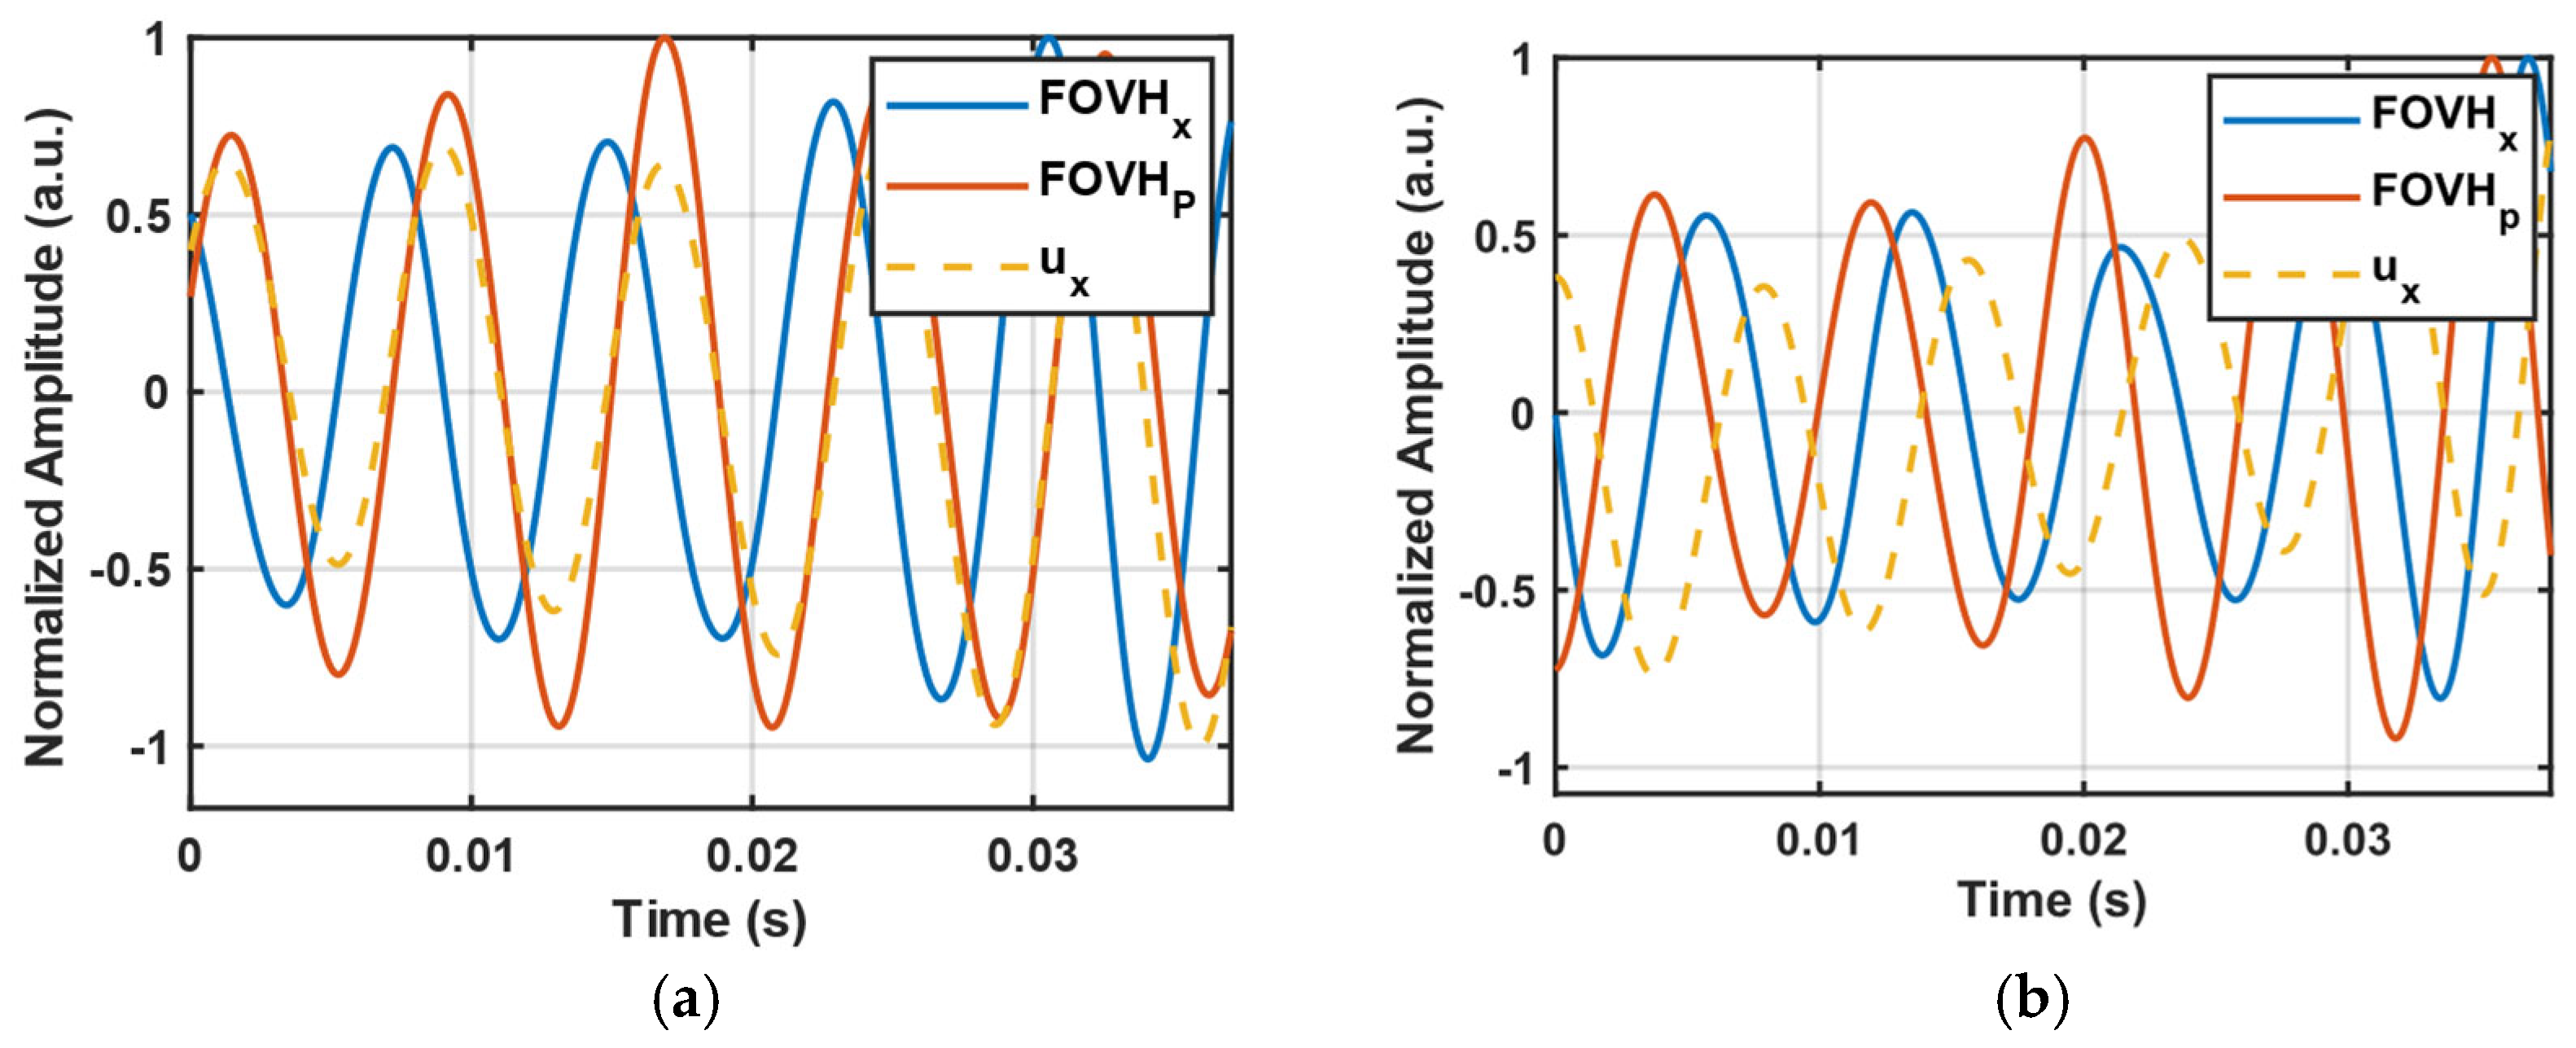
Section 2.1 explains that, according to the plane wave theory, acoustic pressure and particle velocity are in-phase, and the acceleration leads them by π / 2 , provided that the radial direction outward from the sound source is defined as the positive direction. Figure 10 shows the results at 125 Hz, where FOVH x represents the accelerometer’ x-channel output and u x is its integral. Figure 10a,b show outputs when the x-channel’s LA mandrel faces toward and away from the source, respectively. The vertical axes show normalized channel amplitudes, and the horizontal axes represent time.
Figure 10a shows that when the LA faces the source, the accelerometer output leads pressure by π / 2 and the integral of acceleration (velocity estimate) is in phase with pressure. In contrast, Figure 10b shows that when the SA faces the source, the accelerometer lags pressure by π / 2 and the integrated signal is out of phase.
Incorrect polarity results in opposite directional algorithm outputs. The average acoustic intensity is estimated as [16]
I ¯ t = 1 T 0 T p t v t d t ,
where p t is acoustic pressure (detected by pressure sensor), v t is particle velocity (from integrating the accelerometer outputs), and T is the time window. When the LA faces the source, the accelerometer integral and pressure sensor output are in phase, yielding a positive I ¯ , which points along the preset positive axis. When the SA faces the source, these signals are anti-phase, producing a negative I ¯ , which points in the opposite direction.
Minor errors may arise from residual reflections and slight frequency drift in the source, but these do not affect the overall polarity conclusion.
Figure 11 presents multi-frequency results of phase differences between pressure sensor and accelerometer at various positions, with error bars representing the standard deviation. Ten independent trials were conducted at each position. Positions ① and ② along the LA direction of y-axis yield a 90° phase difference between accelerometer’s y-channel and the pressure sensor outputs, confirming that the accelerometer’s positive axis is defined by the vector from the LA to the SA. Positions ① and ② along the LA and SA directions of x-axis produce phase differences of +90° and −90°, respectively, further validating this polarity convention.
At a constant sampling rate, higher frequencies result in faster phase changes between adjacent sampling points. Thus, higher frequencies lead to greater measurement errors in the output phase difference between the two systems, as calculated via cross-correlation. For instance, at a sampling rate of 32 kHz, when the frequency is 1000 Hz, the phase difference between adjacent sampling points is 11.25°, whereas at 125 Hz, it is 1.41°. In this test, the SD at 1000 Hz was 18°, and at 125 Hz it was 6°, which aligns with the predicted trend based on theory.
Although environmental disturbances and sampling errors may have affected the results, the experimental data sufficiently supports our conclusions despite these uncertainties.

4. Discussion

The polarity in mandrel FOVH originates from the combination of an air-backed pressure sensor and a push–pull accelerometer. The sealed cavity between the two mandrels deforms differentially under the same acoustic pressure, creating an intrinsic push–pull pair. This deformation increases sensitivity by enlarging the OPD between the sensing arms. Notably, only the fiber coiled on the inner mandrel responds positively to pressure, and this coiling pattern determines the polarity of the pressure channel.
The accelerometer operates under similar principles. Fibers coiled on elastic mandrels at opposite ends of the inertial mass stretch in opposite directions during acceleration. This geometry enhances the system’s resonant frequency and establishes polarity. Only the fiber coiled on mandrel facing the acoustic source will stretch in the positive direction of acceleration.
PGC demodulation subtracts the optical path of the SA from that of the LA. To ensure correct polarity, we define two simple rules. For pressure sensors, coil the LA on the inner mandrel and the SA on the outer mandrel. For accelerometers, define the vector from the LA to the SA as the positive axis.
These straightforward rules eliminate the need for external reference sources or complex data processing. They also apply to other demodulation schemes, such as heterodyne and 3 × 3 technique.
The separation between the pressure sensor and the accelerometer can lead to phase errors, especially at higher frequencies. The acoustic centers of the pressure and accelerometer sensors were within 15 cm. When aligned with the direction of sound wave propagation, at 1000 Hz, the phase difference after traveling 15 cm is 36°, and at 125 Hz, it is 4.5°. Therefore, this type of separated FOVH is more suitable for low-frequency detection.

5. Conclusions

In this work, we present a model that defines the polarity of mandrel FOVHs, which employ PGC demodulation. The model links the polarity of the demodulated signal to the sensing arm configuration. Experimental validations through tank and lake tests confirm that proper polarity requires the LA of the pressure sensor to be coiled on the inner mandrel and the SA on the outer mandrel. For accelerometers, the positive axis must be defined along the vector from the LA mandrel to the SA mandrel. This research provides a solid hardware foundation for phase consistency in FOVH systems, ensuring better performance for underwater acoustic sensing, particularly for accurate target localization. By following the outlined polarity conventions, FOVH array systems can achieve higher accuracy and reliability in underwater sensing applications.

Author Contributions

Conceptualization, Y.L. and J.W.; data curation, Y.L.; formal analysis, Y.L.; funding acquisition, J.W.; methodology, R.L.; project administration, J.W. and Z.M.; software, Y.L. and J.W.; supervision, Z.M.; validation, Y.L., R.L., J.F. and J.Z.; visualization, Y.L.; writing—original draft, Y.L.; writing—review and editing, J.W. and M.C. All authors have read and agreed to the published version of the manuscript.

Funding

This research was funded by the National Key Research and Development Program of China [2022YFB3205300], the National Natural Science Foundation of China [Grant 42476189] and the Postgraduate Scientific Research Innovation Project of Hunan Province [CX20240135].

Data Availability Statement

The data underlying the results presented in this paper are not publicly available at this time but may be obtained from the authors upon reasonable request.

Conflicts of Interest

The authors declare no conflicts of interest.

Abbreviations

The following abbreviations are used in this manuscript:
FOVHFiber-optic vector hydrophone
PHPiezoelectric hydrophone
PGCPhase-generated carrier
FRMFaraday rotation mirrors
MIMichelson interferometer
LALong sensing arm of the MI
SAShort sensing arm of the MI
OPDoptical phase difference
PDPhotodetector
SDStandard deviation

References

  1. Wang, J.; Luo, H.; Meng, Z.; Hu, Y. Experimental Research of an All-Polarization-Maintaining Optical Fiber Vector Hydrophone. J. Light. Technol. 2012, 30, 1178–1184. [Google Scholar] [CrossRef]
  2. Meng, Z.; Chen, W.; Wang, J.; Hu, X.; Chen, M.; Zhang, Y. Recent Progress in Fiber-Optic Hydrophones. Photonic Sens. 2021, 11, 109–122. [Google Scholar] [CrossRef]
  3. Yu, Z.; Cai, Y.; Mo, D. Comparative Study on Noise Reduction Effect of Fiber Optic Hydrophone Based on LMS and NLMS Algorithm. Sensors 2020, 20, 301. [Google Scholar] [CrossRef] [PubMed]
  4. Sun, G.; Yang, D.; Zhang, L. Research on the Method for Measuring Radiated Noise by an Underwater Target in Low Frequency Band Based on the Vector Hydrophone. Acta Acust. 2002, 27, 429–434. [Google Scholar] [CrossRef]
  5. Fan, H.; Nie, W.; Yao, S.; An, L.; Yu, F.; Zhang, Y.; Wu, Q. A High-Order Time-Delay Difference Estimation Method for Signal Enhancement in the Distorted Towed Hydrophone Array. J. Acoust. Soc. Am. 2024, 156, 1996–2008. [Google Scholar] [CrossRef]
  6. Ashry, I.; Mao, Y.; Wang, B.; Hveding, F.; Bukhamsin, A.Y.; Ng, T.K.; Ooi, B.S. A Review of Distributed Fiber–Optic Sensing in the Oil and Gas Industry. J. Light. Technol. 2022, 40, 1407–1431. [Google Scholar] [CrossRef]
  7. Janneh, M.; Bruno, F.A.; Guardato, S.; Donnarumma, G.P.; Iannaccone, G.; Gruca, G.; Werzinger, S.; Gunda, A.; Rijnveld, N.; Cutolo, A.; et al. Field Demonstration of an Optical Fiber Hydrophone for Seismic Monitoring at Campi-Flegrei Caldera. Opt. Laser Technol. 2023, 158, 108920. [Google Scholar] [CrossRef]
  8. Guang, D.; Sun, X.; Shi, J.; Wu, X.; Zhang, G.; Zuo, C.; Zhu, P.; Yu, B. Sensitivity Improvement of Fiber Optic Interferometric Hydrophone Based on Composite Structure. Opt. Express 2024, 32, 47721–47734. [Google Scholar] [CrossRef]
  9. Liu, Z.; Gao, K.; Sun, Y.; Huang, F.; Ye, Q.; Cai, H. High-Performance Compact Fiber Optic Interferometric Accelerometer Based on a Novel Push–Pull Structure. IEEE Trans. Instrum. Meas. 2024, 73, 9508208. [Google Scholar] [CrossRef]
  10. Yang, Y.; Luo, Z.; Wang, Z.; Zhang, Y.; Chang, T.; Yu, M.; Cheng, L.; Wu, C.; Cui, H.-L. High-Performance Fiber Optic Interferometric Hydrophone Based on Push–Pull Structure. IEEE Trans. Instrum. Meas. 2021, 70, 9511313. [Google Scholar] [CrossRef]
  11. Bozzi, F.D.A.; Jesus, S.M. Vector Sensor Beam Steering for Underwater Acoustic Communications. Proc. Mtgs. Acoust. 2020, 42, 070002. [Google Scholar]
  12. Zhu, J.; Wang, J.; Wang, X.; Wu, Y.; Hu, Z.; Hu, Y. Influence Analysis of an Asymmetrical Suspension System on Triaxial Signals’ Phase Differences of Fiber Optic Vector Hydrophones. In Proceedings of the SPIE Proceedings; Wang, L., Zhou, Z., Eds.; SPIE: Beijing, China, 2016; Volume 10152, p. 1015208. [Google Scholar]
  13. Wang, C.; Ma, S.; Meng, Z.; Wang, J.; Chen, Y. Analysis of Phase Difference of Acceleration Fiber Optic Vector Hydrophone Based on Signal-to-Noise Ratio. In Proceedings of the 2019 18th International Conference on Optical Communications and Networks (ICOCN), Huangshan, China, 5–8 August 2019; pp. 1–3. [Google Scholar]
  14. Peter, H.D.; Julien, B.; David, R.D. On the Equivalence of Scalar-Pressure and Vector-Based Acoustic Dosage Measures as Derived from Time-Limited Signal Waveforms. J. Acoust. Soc. Am. 2024, 155, 3291–3301. [Google Scholar]
  15. Oppeneer, V.O.; de Jong, C.A.F.; Binnerts, B.; Wood, M.A.; Ainslie, M.A. Modelling Sound Particle Motion in Shallow Water. J. Acoust. Soc. Am. 2023, 154, 4004–4015. [Google Scholar] [CrossRef]
  16. Chen, Y.; Wang, J.; Luo, H.; Meng, Z. Research of the Polarity Characteristic for an Optical Fiber Accelerometer Demodulated by Phase Generated Carrier Technology. Optik 2014, 125, 3748–3751. [Google Scholar] [CrossRef]
  17. Li, Y.; Wang, J.; Chen, M.; Liang, R.; Chen, Y.; Meng, Z.; Hu, X.; Lu, Y. Analysis of Photoelectric Detection Phase Polarity of Fiber-Optic Hydrophones Based on 3 × 3 Coupler Demodulation Technique. Photonics 2025, 12, 535. [Google Scholar] [CrossRef]
  18. Malarkodi, A.; Latha, G.; Sridhar, P.; Bøgholm, N.V. Design Considerations and Establishment of a Low Frequency Hydrophone Calibration Setup Using the Principle of Vibrating Water Column. Int. J. Acoust. Vib. 2018, 23, 44–48. [Google Scholar] [CrossRef]
  19. Li, Z.; Wang, C.; Gui, X.; Fu, X.; Wang, Y.; Wang, Z.; Wang, Y. A High-Performance Fiber-Optic Hydrophone for Large Scale Arrays. J. Light. Technol. 2023, 41, 4201–4210. [Google Scholar] [CrossRef]
  20. Zhang, H.; Chen, H.; Zhang, H.; Wang, P. Sensitivity Correction of Co-Vibrating Vector Hydrophone in Standing Wave Tube by Numerical Calculation. Acta Acust. 2023, 48, 532–540. [Google Scholar] [CrossRef]
  21. Hu, L.; Liu, Q.; Zhang, H.; Wang, J.; Lu, Y.; Chen, D.; Chen, J. A Very Low-Frequency 3-D Vector Hydrophone Based on an Electrochemical Vibration Sensor. IEEE Sens. J. 2025, 25, 14709–14716. [Google Scholar] [CrossRef]
  22. Jiao, J.; He, Y.; Leong, T.; Kentish, S.E.; Ashokkumar, M.; Manasseh, R.; Lee, J. Experimental and Theoretical Studies on the Movements of Two Bubbles in an Acoustic Standing Wave Field. J. Phys. Chem. B 2013, 117, 12549–12555. [Google Scholar] [CrossRef]
  23. Chen, M.-H.; Lin, W.-W.; Shih, S.-T. Analysis of Fibre Optic Michelson Interferometric Sensor Distortion Caused by the Imperfect Properties of Its 3 × 3 Coupler. IEE Proc. Optoelectron. 1997, 144, 377–382. [Google Scholar] [CrossRef]
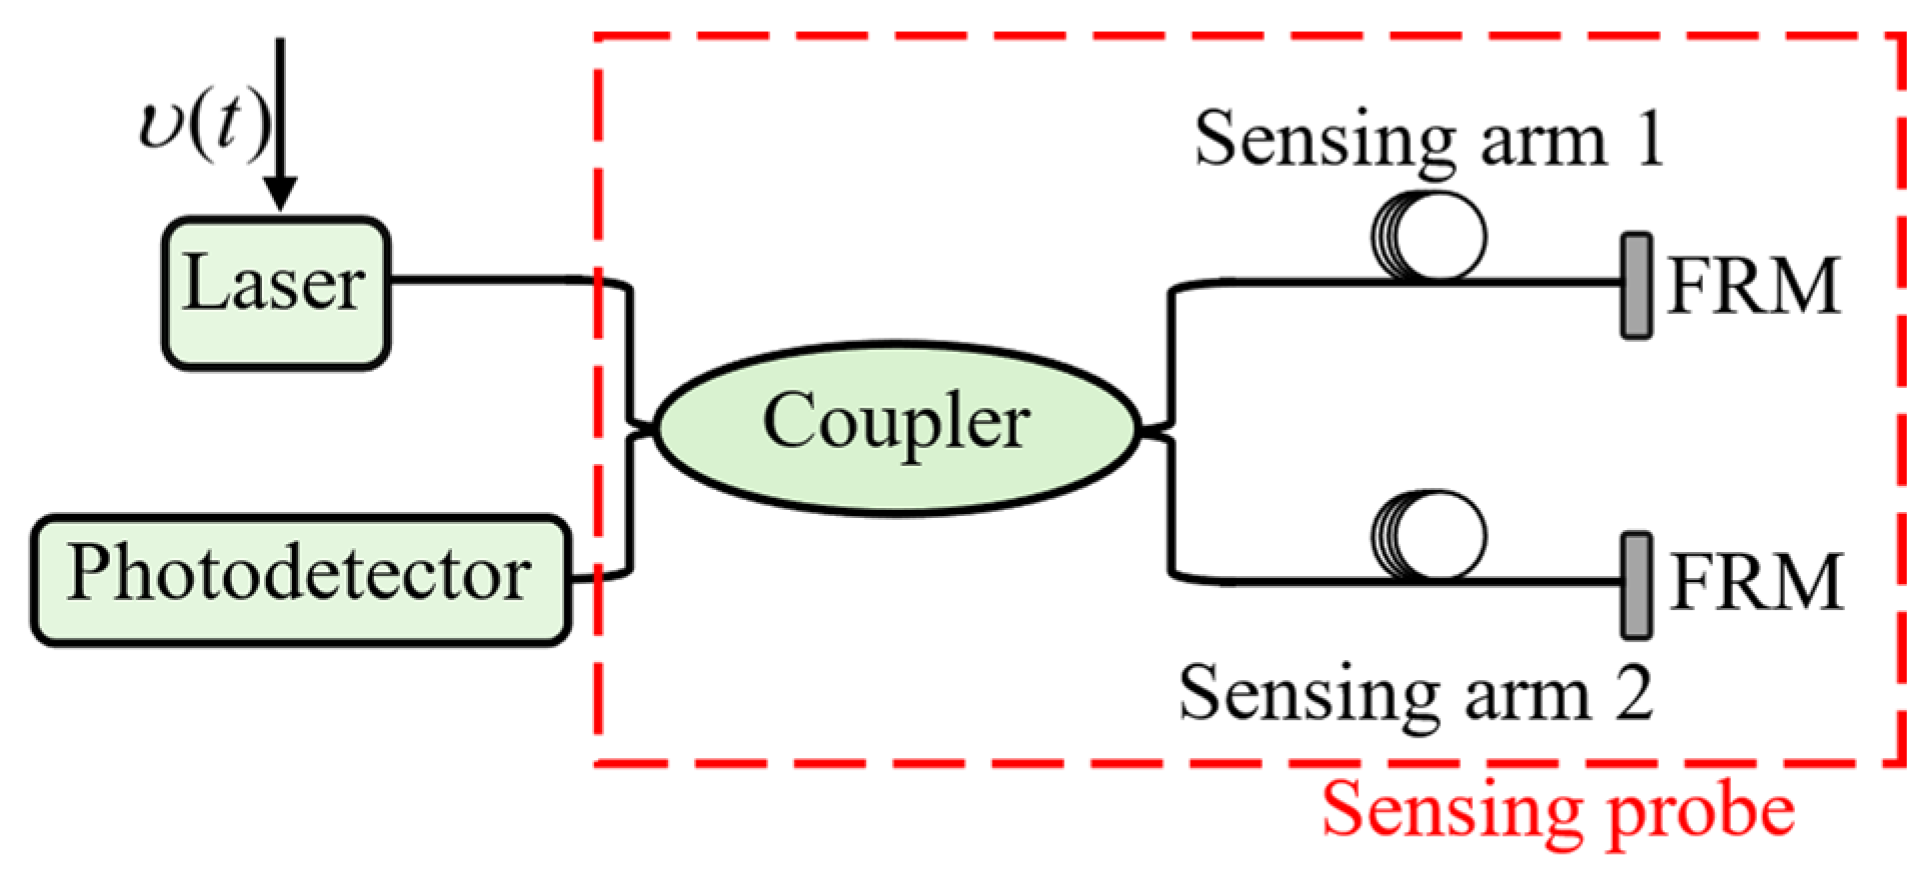
Figure 1. Optical Path Diagram of a Fiber-optic MI sensors based on PGC Technique.
Jmse 13 01825 g001
Figure 2. Pressure Sensor Structural Diagram. Side view (left) and top view (right).
Jmse 13 01825 g002
Figure 3. Accelerometer structural schematic.
Jmse 13 01825 g003
Figure 4. Three-dimensional vector hydrophone system composition and polarity definition. (a) Single-element vector hydrophone system composition, (b) Single-element vector hydrophone polarity definition.
Jmse 13 01825 g004
Figure 5. Photograph of the FOVH probe.
Jmse 13 01825 g005
Figure 6. Schematic of the standing wave tube experimental configuration.
Jmse 13 01825 g006
Figure 7. Pressure sensor and accelerometer responses under correct and incorrect polarity configurations. (a) Acoustic pressure sensitivities for all four configurations, (b) Phase differences between the sensors and the PH.
Jmse 13 01825 g007
Figure 8. Schematic diagram of the field experiment.
Jmse 13 01825 g008
Figure 9. Photograph of the integrated sensor assembly.
Jmse 13 01825 g009
Figure 10. Time-domain results under correct and incorrect polarity configurations. (a) The LA mandrel faces the source, (b) The SA mandrel faces the source.
Jmse 13 01825 g010
Figure 11. Phase differences between pressure sensor and accelerometer at various positions. Δ φ a x p is the phase difference between the accelerometer’s x-channel and the pressure sensor outputs. Δ φ a y p is the phase difference between the accelerometer’s y-channel and the pressure sensor outputs.
Jmse 13 01825 g011
Table 1. Design Parameters of FOVH Probes.
SymbolIndicatorValuesUnits
E 1 Young’s modulus of the mandrel of pressure sensor70GPa
E 2 Young’s modulus of the mandrel of accelerometer3.25GPa
μ 1 Poisson’s ratio of the mandrel of pressure sensor0.33-
μ 2 Poisson’s ratio of the mandrel of accelerometer0.22-
n refractive index of the fiber1.457-
λ center wavelength of Laser1550nm
R a , 1 inner radius of inner mandrel of pressure sensor7.5mm
R a , 2 inner radius of outer mandrel of pressure sensor8.1mm
R b , 1 outer radius of inner mandrel of pressure sensor9mm
R b , 2 outer radius of outer mandrel of pressure sensor9.6mm
R radius of the mandrel of accelerometer10.0mm
L 1 the length of the LA in pressure sensors and accelerometers68.52m
L 2 the length of the SA in pressure sensors and accelerometers68.00m
P 11 fiber strain-optic coefficient0.116-
P 12 fiber strain-optic coefficient0.255-
μ f Poisson’s ratio of the fiber0.17-
Table 2. Sensing Arm Configurations for Pressure Sensors and Accelerometers.
Sensing ArmPressure Sensor ConfigurationsAccelerometer Configurations
P_CorrectP_IncorrectA_CorrectA_Incorrect
LAInner mandrelOuter mandrelNear-sourceFar-source
SAOuter mandrelInner mandrelFar-sourceNear-source
Disclaimer/Publisher’s Note: The statements, opinions and data contained in all publications are solely those of the individual author(s) and contributor(s) and not of MDPI and/or the editor(s). MDPI and/or the editor(s) disclaim responsibility for any injury to people or property resulting from any ideas, methods, instructions or products referred to in the content.