1. Introduction
Improving energy efficiency in maritime transport is a key objective in the global transition toward more sustainable logistics and reduced environmental impact. In recent years, international regulations such as the Energy Efficiency Design Index (EEDI) and operational measures like the Ship Energy Efficiency Management Plan (SEEMP) have driven growing attention toward propulsion optimization, fuel consumption reduction, and vessel performance monitoring [
1,
2,
3,
4]. In this context, harbor and escort tugs—despite their relatively small size—play a critical role in port operations and short-range navigation, often under highly dynamic and demanding conditions. Moreover, these vessels typically operate in densely populated coastal urban areas, where their environmental footprint—particularly in terms of pollutant emissions—adds to the existing load borne by port cities [
5,
6,
7].
Among the various propulsion systems available, the Voith-Schneider propeller (VSP) stands out for its high maneuverability and immediate thrust vector control, making it especially suitable for tugs operating in restricted environments [
8]. However, the unique kinematics of the VSP system also pose specific challenges in terms of energy efficiency, particularly regarding the optimal selection of propeller pitch and RPM across different speed regimes. Recent numerical studies have confirmed the sensitivity of VSP hydrodynamic performance to changes in operating parameters, reinforcing the need for full-scale data to guide optimization efforts [
9,
10].
The Voith-Schneider Propeller (VSP), technically classified as a cycloidal propulsion system, consists of a set of vertical blades mounted on a rotating disk. Unlike conventional propellers, each blade continuously adjusts its pitch as the disk rotates, allowing the generation of thrust in any horizontal direction without changing the orientation of the vessel. This mechanism provides full 360-degree thrust vectoring through mechanical control of blade angles.
While the hydrodynamic behavior and control strategies of cycloidal propulsion systems have been extensively studied through simulations and towing tank experiments [
9,
10], the availability of empirical data from full-scale operational settings remains limited. Most previous research has focused on idealized or controlled environments, often neglecting the complexity and variability of real navigational conditions. This empirical gap restricts the practical applicability of theoretical findings, especially when seeking to optimize energy performance under actual service demands. Recent studies have highlighted the importance of incorporating full-scale real-world measurements to improve the reliability of performance assessments and support operational decision-making in complex marine systems [
3,
11]. Additionally, recent research has explored the use of numerical simulations to optimize the efficiency of Voith-Schneider propulsion systems [
12], reinforcing the relevance of nonlinear hydrodynamic behavior and control sensitivity.
Although digital twin applications in the maritime sector have grown significantly in recent years, most published studies focus on general-purpose ships, maintenance optimization, or hull performance modeling [
13,
14,
15]. Some recent developments have addressed full-electric harbor crafts using integrated systems models [
16], but empirical or digital twin-based studies specific to Voith-Schneider propulsion systems in tugboats remain scarce. For instance, while experimental hydrodynamic analyses of ASD tugs exist [
17], equivalent real-time or data-driven frameworks for VSP-equipped vessels are lacking. These simulation-based approaches underscore the value of full-scale empirical data as a foundation for future digital twin frameworks aimed at supporting energy-aware operational strategies in tugboat applications [
18,
19].
Given the scarcity of digital twin studies specifically targeting VSP-equipped tugboats, this work offers a novel contribution by applying full-scale empirical data to support the development of operational efficiency models suitable for integration into future decision-support systems for harbor towing.
This study addresses this gap by presenting a methodology based on full-scale trials aboard a Voith-Schneider tugboat. Using synchronized measurements of vessel speed, fuel consumption, propeller pitch, and RPM, we aim to identify the operational configurations that maximize energy efficiency across the full range of service conditions. The main contributions include (i) the development of interpolated fuel consumption and efficiency maps, (ii) the definition of optimal propulsion regimes segmented by speed range, and (iii) the provision of practical guidelines for improving energy management in port operations. By relying on empirical data and applying visual analytics, this approach provides a replicable framework for enhancing the operational efficiency of vessels equipped with VSP systems.
2. Materials and Methods
This study was conducted using a Voith Water Tractor-type tugboat equipped with a cycloidal propulsion system (VSP)(Voith Turbo Schneider Propulsion GmbH & Co. KG, Heidenheim an der Brenz, Germany). The name of the vessel is not disclosed for operational confidentiality reasons; however, the relevant technical specifications are provided. The tug has an overall length of 29.5 m, a beam of 8.5 m, and a gross tonnage of approximately 300 GT. It is powered by two Caterpillar 3508 engines delivering a total power of 1600 kW, coupled to a dual cycloidal propulsion system. The VSP system allows for independent control of both the propeller’s revolutions per minute (rpm) and the propeller pitch, enabling a detailed analysis of energy efficiency under different propulsion configurations.
2.1. Test Area and Environmental Conditions
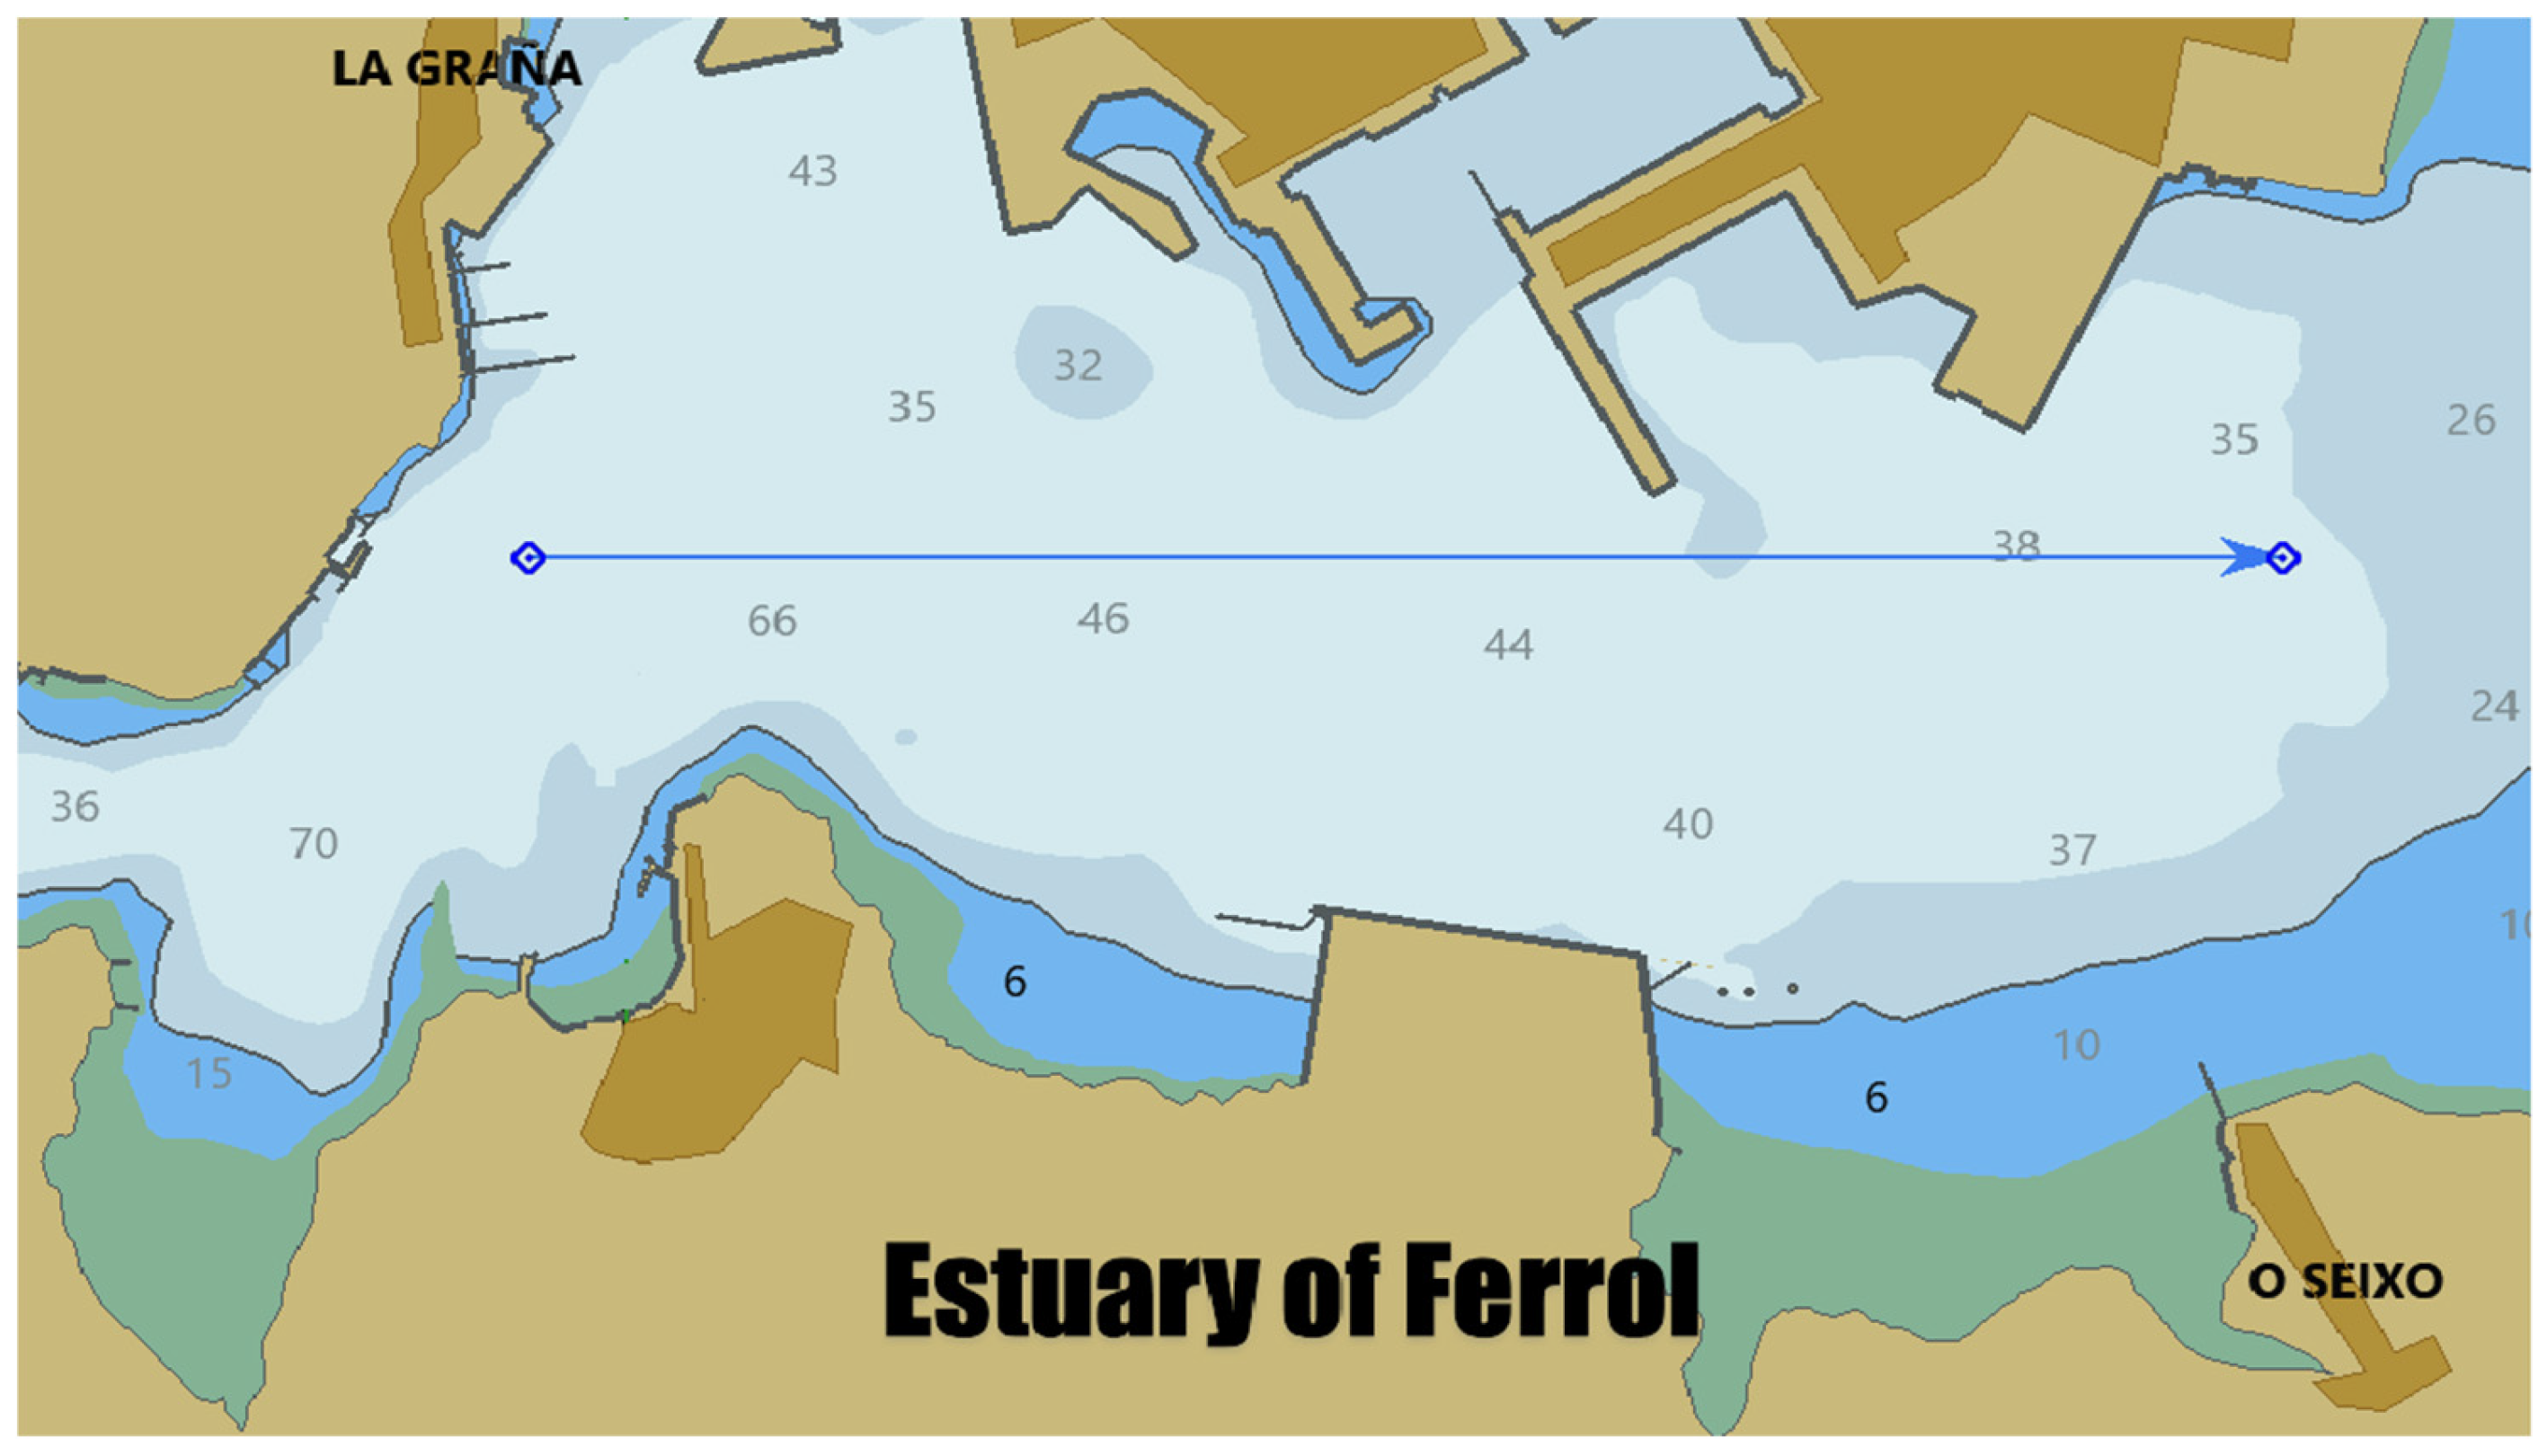
The measurements were conducted in the estuary of Ferrol, located in the northwest of Spain, an estuarine environment selected for its natural protection from ocean swell and relatively stable tidal conditions. This location was chosen to minimize the influence of environmental disturbances, effectively functioning as an open-air experimental basin.
Figure 1 shows the track followed by the tug during the trials, where round-trip runs were carried out along the same axis for each propulsion setting.
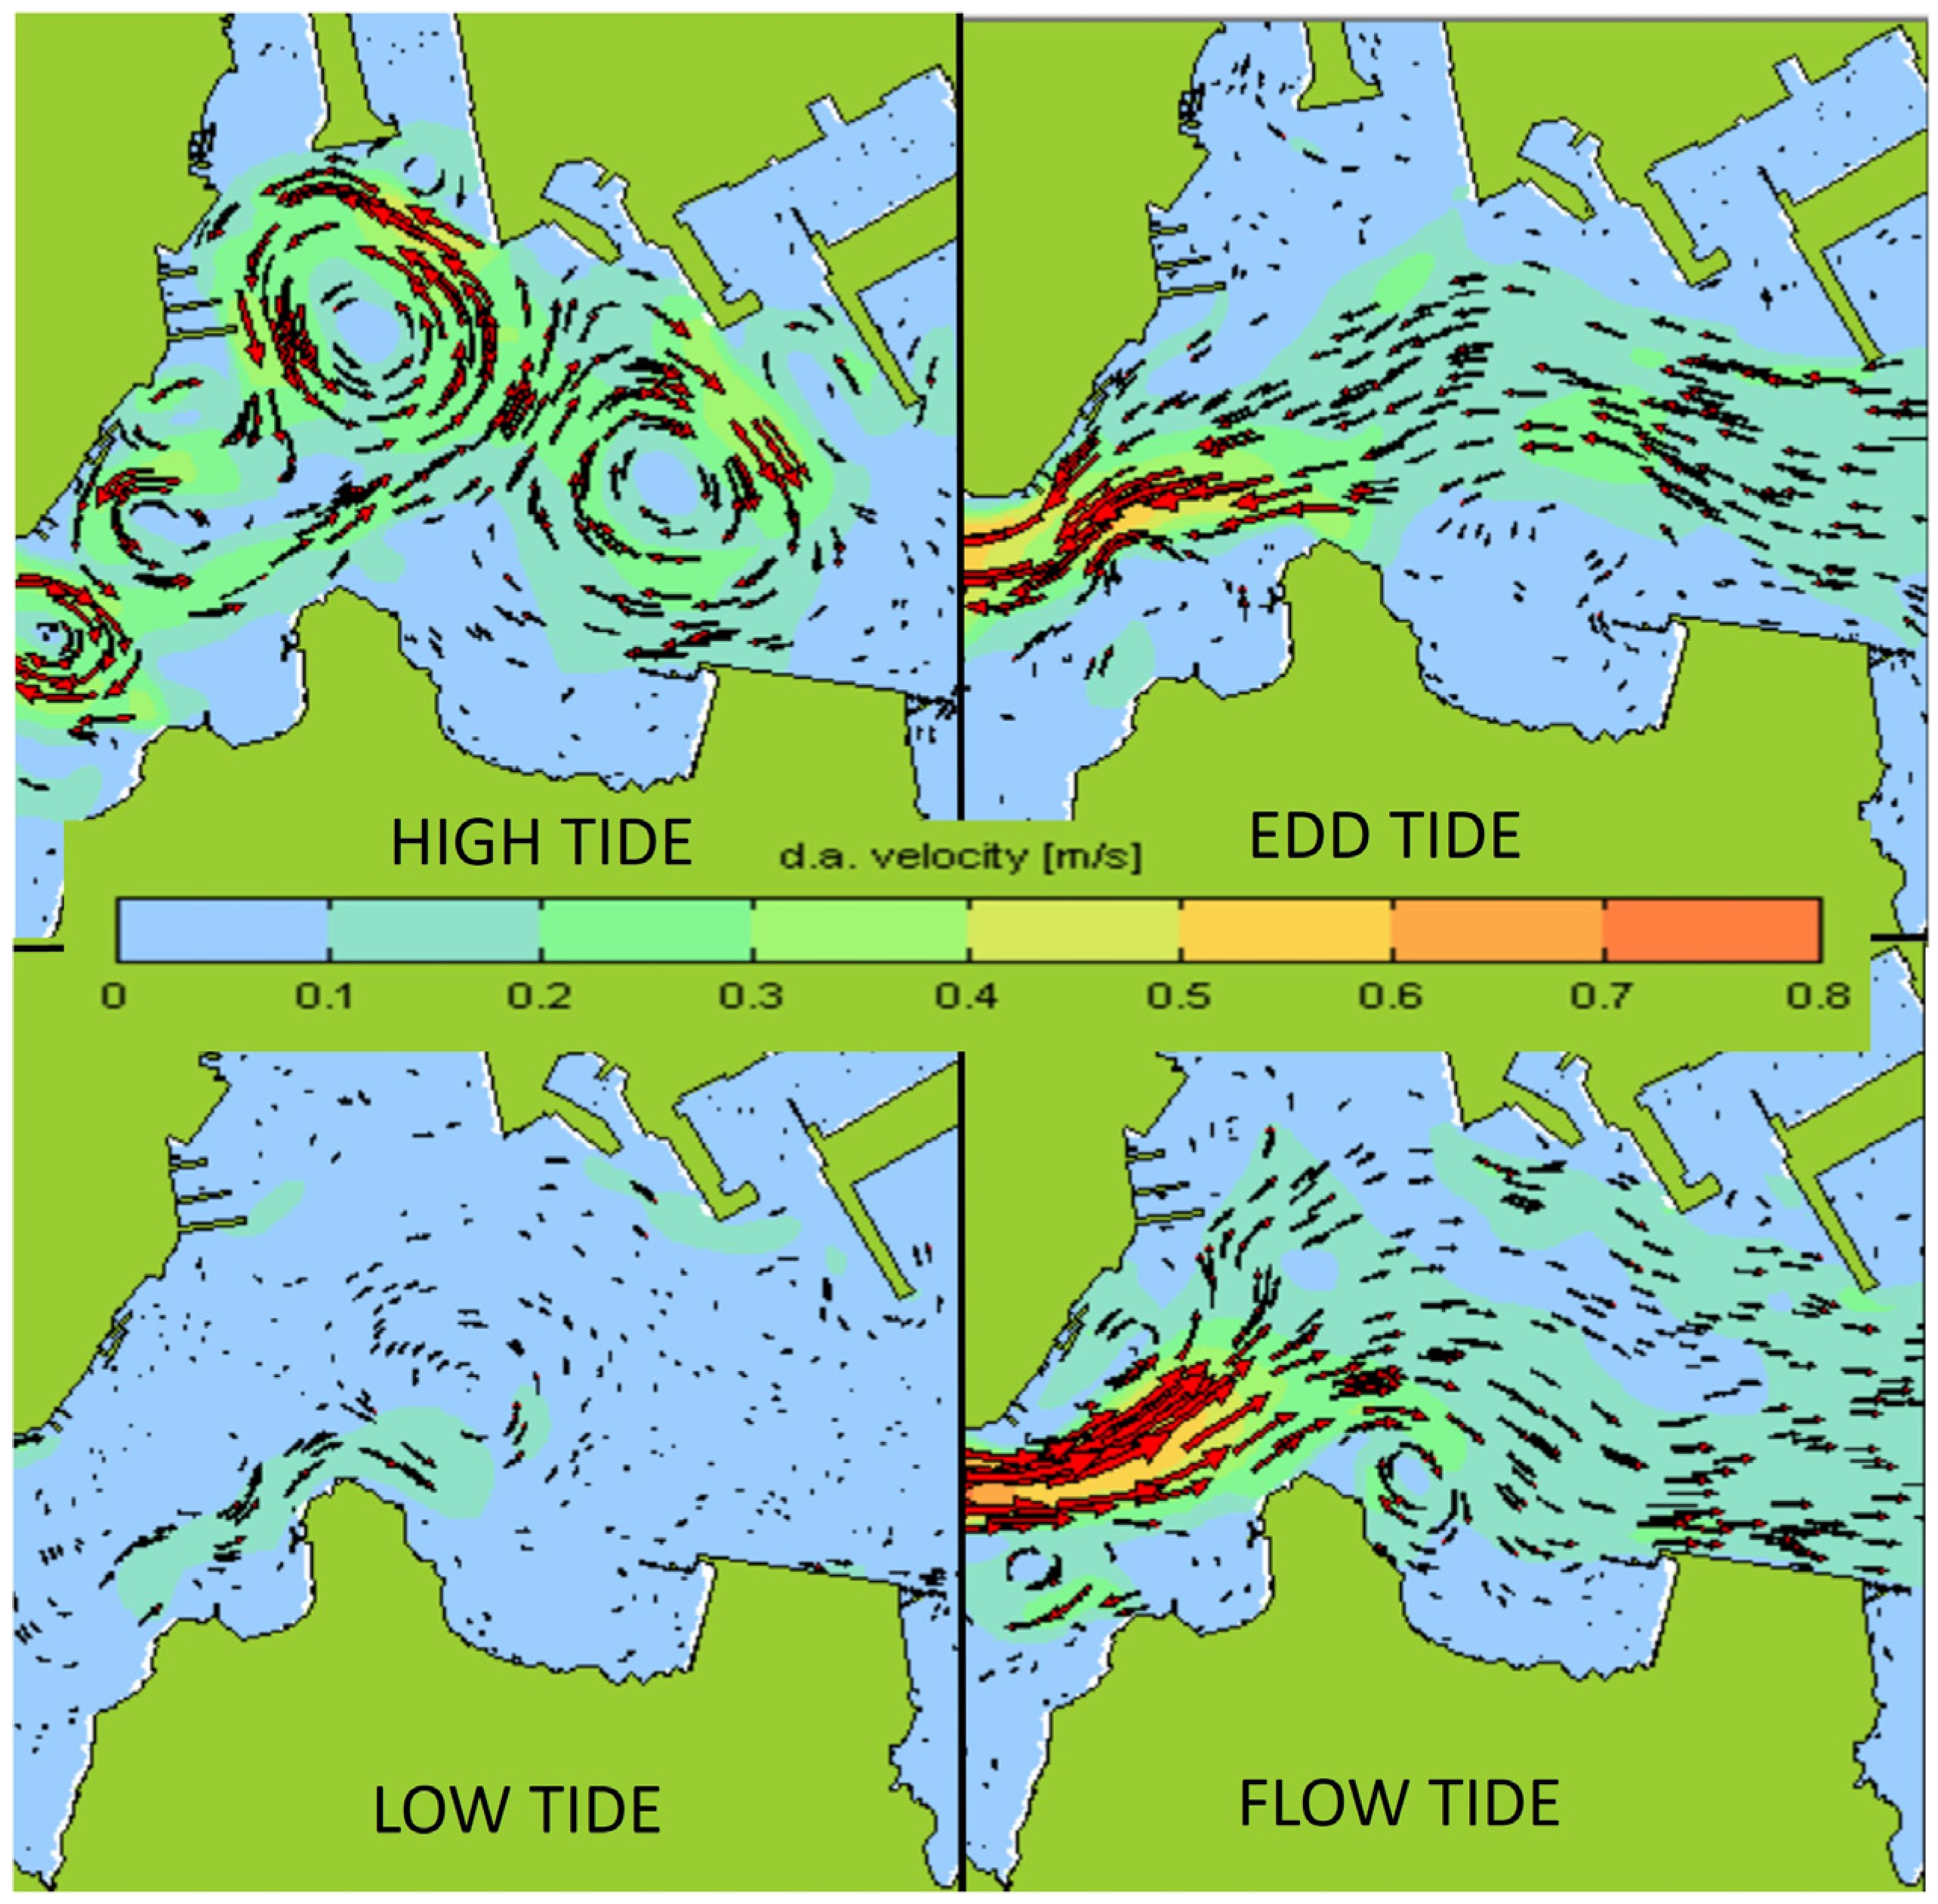
Figure 2 illustrates the typical behavior of tidal currents in the area, which was used as a reference to select time windows with minimal hydrodynamic interference.
The four tide charts presented in
Figure 2 correspond to average tidal cycles in the port of Ferrol. Spring tides—typically occurring near the new and full moons—were deliberately avoided due to their stronger currents and greater hydrodynamic impact on the vessel’s movement.
All tests were conducted during slack tide periods to minimize tidal current interference. These slack windows generally occur near high and low tide. In this study, data were collected specifically around low tide slack periods, which exhibited near-zero current velocities and unstable flow directions, providing the most hydrodynamically neutral conditions for performance measurements. All trials were also carried out under light wind conditions.
For each operating point—defined by a specific combination of RPM and propeller pitch—two runs were conducted: one outbound and one return leg, in opposite directions relative to the wind and current. This procedure allowed for external influences to be compensated through averaging. Moreover, no active directional control was applied during navigation. The vessel proceeded in a straight line under free drift, avoiding any thrust vectoring inputs that could have introduced additional resistance or influenced fuel consumption.
2.2. Instrumentation and Data Acquisition
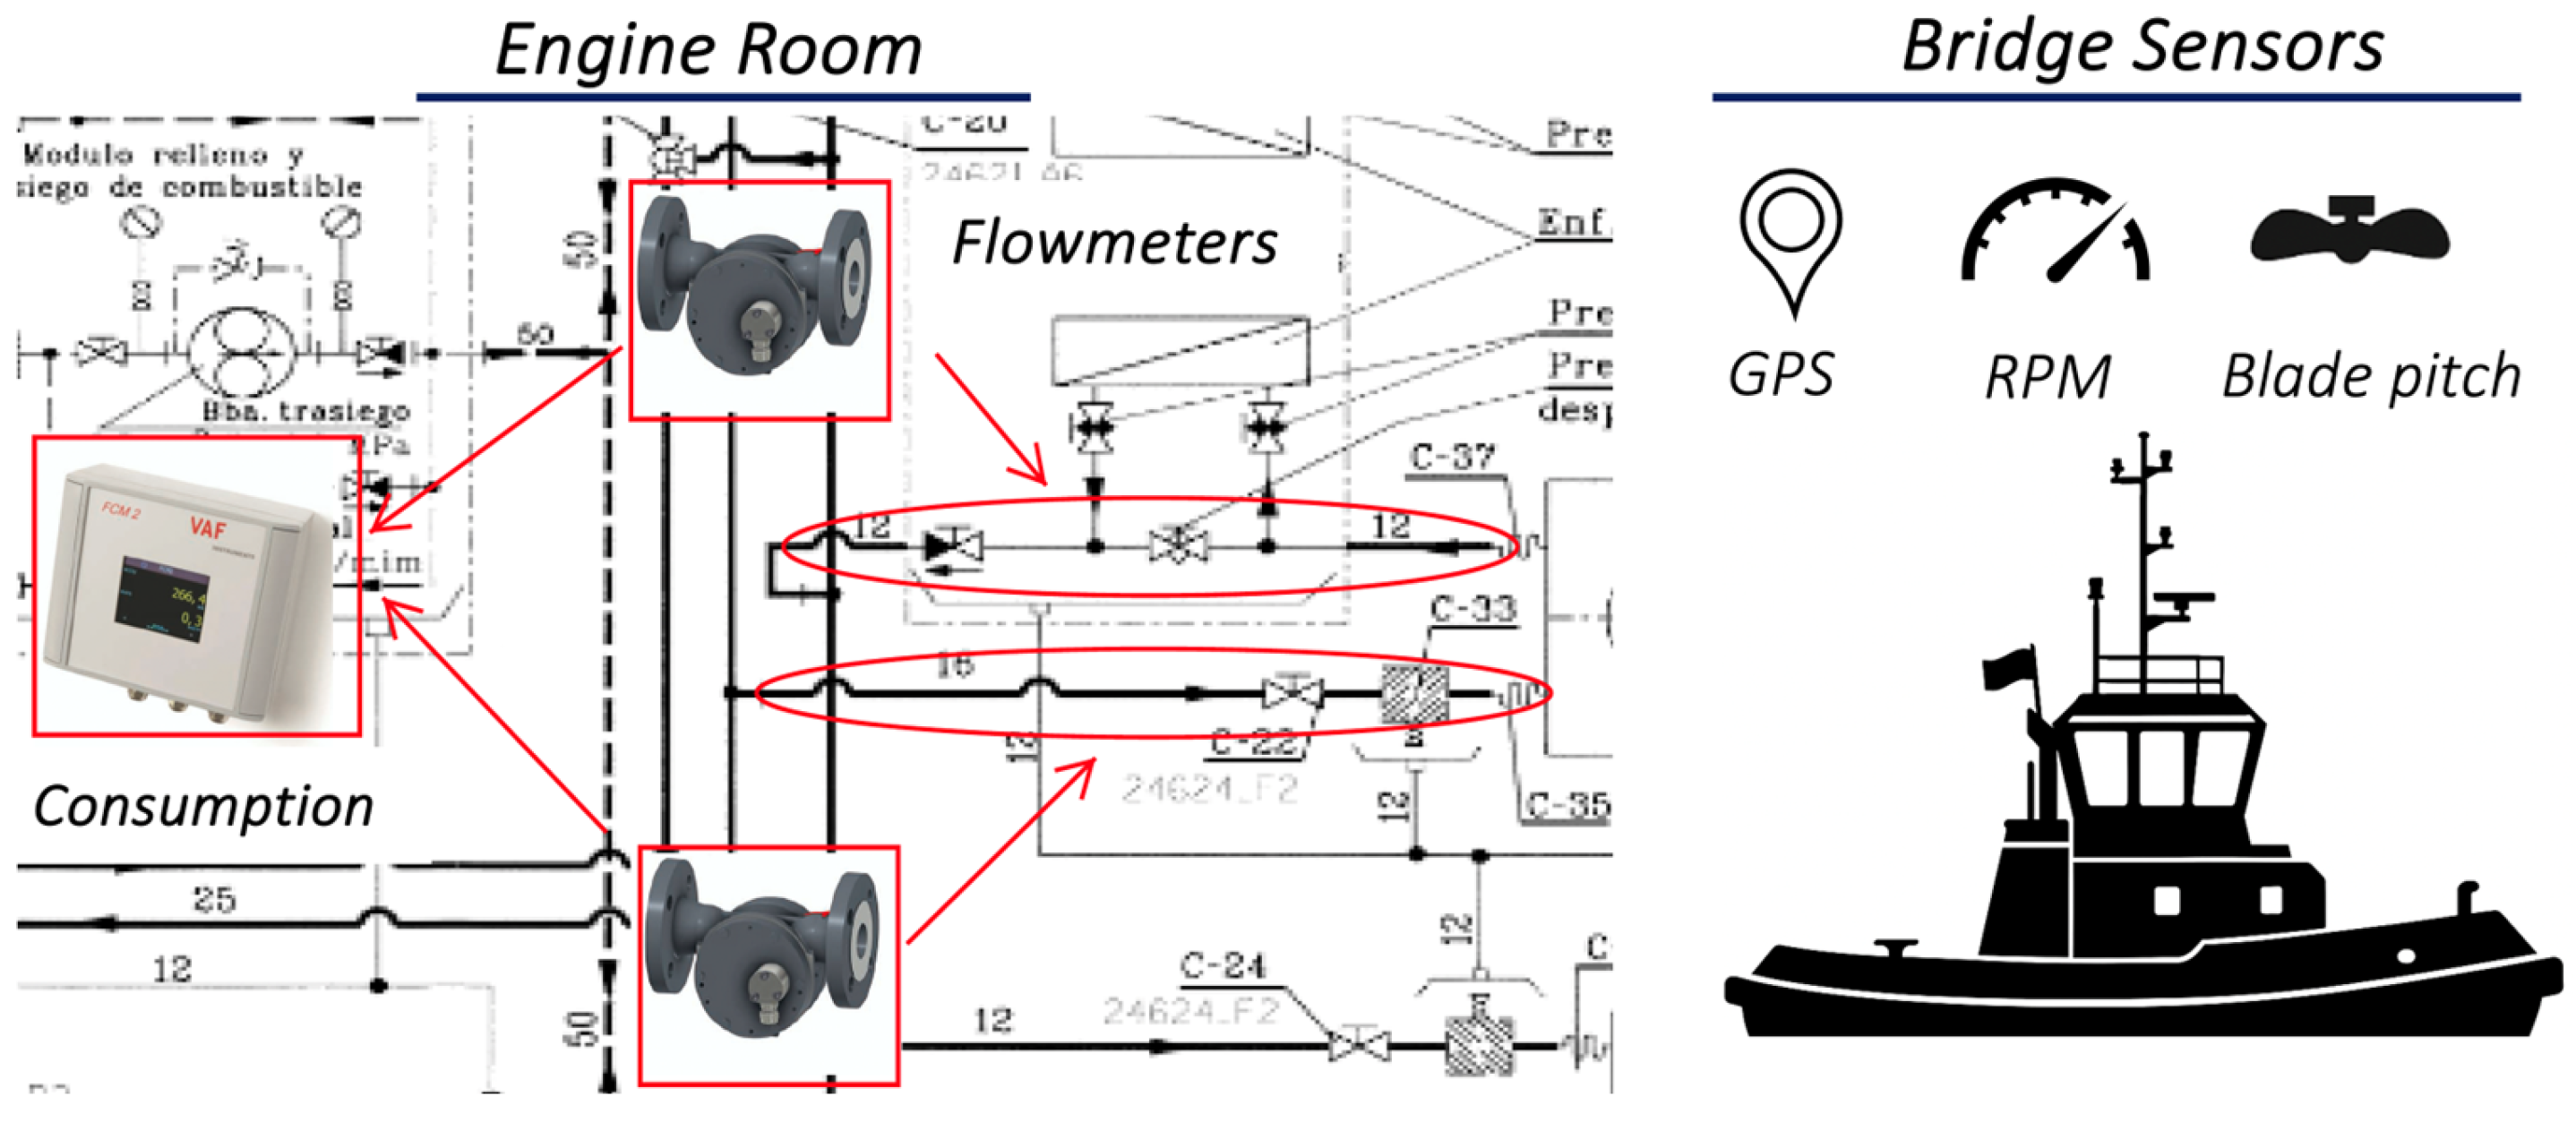
Fuel consumption was measured using two positive displacement flowmeters (J5015PT2, DN15, maximum capacity 50.0 L/min, ±0.2% accuracy) (Oval Corporation, Tokyo, Japan), installed on the inlet and return fuel lines of each engine. The selection and installation of these flowmeters required careful consideration of flow range, available space, and compatibility with marine diesel fuel. During early testing, one of the sensors experienced temporary clogging due to fuel contamination, emphasizing the need for pre-filtration and regular maintenance access. These operational issues were mitigated by installing upstream protective filters and ensuring physical accessibility for inspection. Effective fuel consumption was measured using two displacement flowmeters installed in the fuel supply and return lines. The FCM2 monitoring unit recorded both flow rates and automatically computed the net fuel consumption by calculating the difference between them. It also logged additional parameters such as fuel temperature in real time. The vessel’s average speed during each test run was measured using its on-board GPS-based navigation system, while the values of propeller pitch and RPM were recorded from the bridge during each trial.
Figure 3 provides a simplified schematic of the on-board data acquisition system used during the tests.
2.3. Measurement Protocol
Nine RPM settings were defined, ranging from 700 to 1500 rpm in 100 rpm intervals, which corresponds to the operational range of the Caterpillar 3508 engine installed on the tugboat, along with ten distinct propeller pitch positions, resulting in a complete matrix of operating combinations. For each test configuration—defined as a unique combination of RPM and propeller pitch—three full round-trip runs were performed within the designated test area.
To ensure repeatability and minimize the influence of transient variations, six independent measurements were obtained for each configuration (three outbound and three return runs), and the average values were used to define the representative result for each measured variable. This procedure helped reduce the influence of external factors such as wind, residual currents, and engine load fluctuations, thereby enhancing the reliability of the data used in subsequent analysis. The experimental strategy aligns with established recommendations for full-scale performance testing under real operating conditions [
20]. For each run, data recording for fuel consumption began approximately one minute after the vessel had reached a steady-state speed in order to avoid transient effects associated with acceleration and stabilization phases.
Although the vessel is equipped with two identical main engines operating symmetrically, fuel consumption was monitored only on the port-side engine. Since the load was evenly distributed and both engines operated under identical control settings during straight-line navigation, the measurements were considered representative of the overall propulsion system behavior. All efficiency calculations and consumption maps were based on this single-engine data, under the assumption of symmetric performance.
2.4. Data Processing and Analysis
Data processing was performed using Python 3.12.4. Propulsive efficiency was calculated as the ratio between the vessel’s average speed (in knots) and fuel consumption (in L/min), following a simplified metric commonly used in operational performance studies [
21]. This operational ratio, while not equivalent to conventional efficiency indicators based on delivered thrust or shaft power, offers a practical method for assessing relative performance under real navigation conditions.
In Voith-Schneider propulsion systems, the installation of torque sensors presents significant technical challenges due to the enclosed hydromechanical configuration, which prevents direct access to a traditional transmission shaft. Moreover, thrust measurements can only be obtained through bollard pull tests conducted in static and controlled environments, which do not reflect the vessel’s behavior under dynamic sailing conditions.
The main advantage of this simplified metric lies in its ability to consistently compare different propulsion configurations using data readily available on board, especially in vessels without advanced instrumentation. However, its main limitation is that it does not account for internal mechanical losses or actual thrust output and therefore should not be interpreted as an absolute measure of propulsive efficiency. It should be understood as a relative indicator, primarily suited for internal optimization within the same vessel, although its comparative value may extend to similar tugboats equipped with VSP systems and comparable dimensional and operational profiles.
To visualize the relationships between variables and capture the overall behavior of the propulsion system, interpolated surfaces were generated using cubic interpolation implemented through the griddata() function from the SciPy library [
22]. These interpolations were performed over a regular 100 × 100 mesh constructed using the observed ranges of vessel speed and propeller pitch.
To validate the consistency of the experimental data and justify the use of average values in the analysis, the repeatability of each test point was assessed using statistical dispersion metrics. For each combination of RPM and propeller pitch, the standard deviation (STDEV) and the standard error of the mean (SEM) were calculated based on the six replicated measurements (three outbound and three return runs). The mean STDEV across all test configurations was 0.537 knots for vessel speed and 0.0187 kg/h for fuel consumption, while the corresponding SEM values were 0.219 knots and 0.0078 kg/h, respectively. These levels of dispersion are considered acceptable for full-scale trials conducted under real navigation conditions and confirm that the average values derived from the six measurements reliably represent the vessel’s performance under each tested configuration. This enabled the creation of contour plots, iso-consumption maps, and three-dimensional efficiency surfaces using standard visualization tools [
23]. The resulting data were segmented by speed range to identify optimal operating zones, and the most efficient configurations within each range were extracted to support comparative evaluation and operational guidance.
3. Results
This section presents the results derived from the analysis of the data recorded during the sea trials. Graphical representations are used to characterize the influence of propeller pitch and RPM on vessel speed and fuel consumption. Subsequently, propulsive efficiency curves were calculated, and interpolated surfaces were generated to identify optimal operating zones. Finally, the most efficient combinations were selected for each speed range, allowing for a detailed classification of the propulsion system’s energy performance.
3.1. Relationship Between Propeller Pitch and Vessel Speed
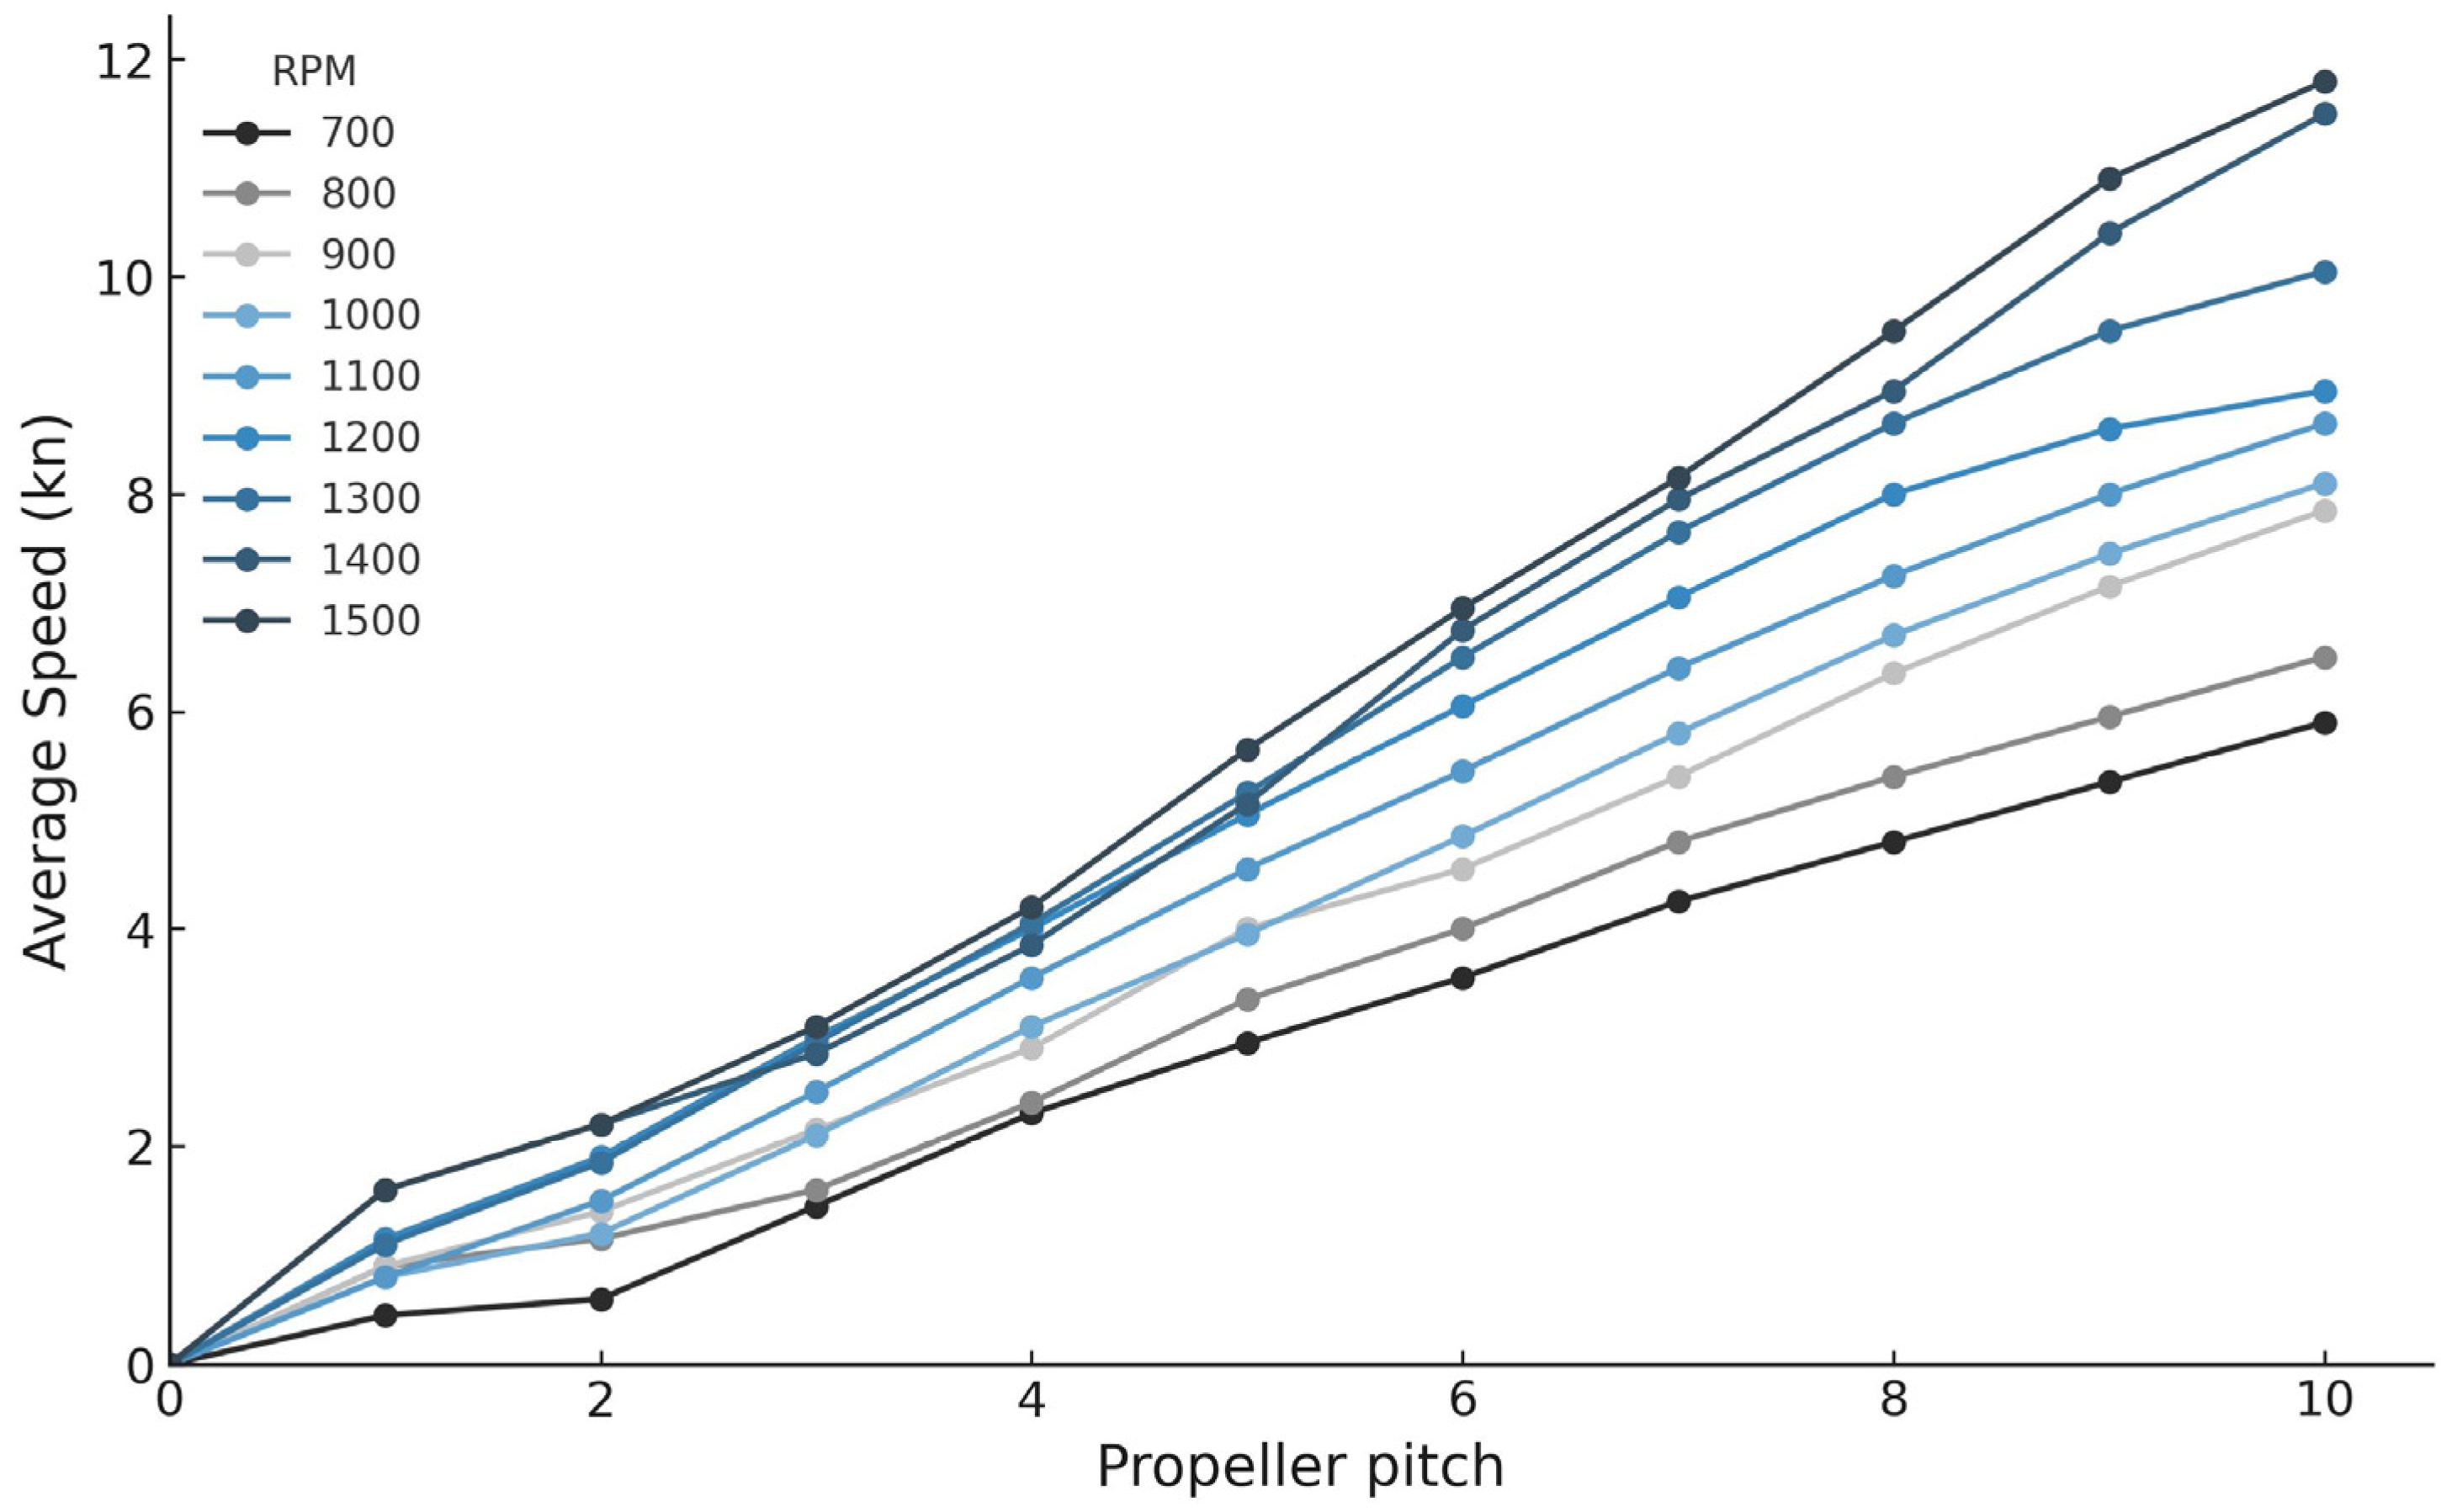
Figure 4 shows the evolution of vessel speed as a function of propeller pitch across different engine speeds. A clear nonlinear trend is observed: at each RPM level, increasing the propeller pitch results in a higher average speed, although with a progressively reduced gain at higher pitch values. This diminishing return effect is more evident at low rpm (e.g., 700–900), where speed tends to stabilize beyond 6–7. In contrast, at higher rpm values (1300–1500), the increase in speed remains more linear over the full pitch range. These results highlight the combined influence of propeller pitch and engine speed on propulsion behavior and support a detailed optimization strategy based on operational conditions. This nonlinear behavior, as well as the saturation trend observed at higher propeller pitches, is consistent with hydrodynamic principles described in the technical literature on marine propellers [
21].
These findings support the need to identify pitch thresholds that optimize vessel performance without incurring unnecessary energy input, a critical consideration for energy-efficient tug operation.
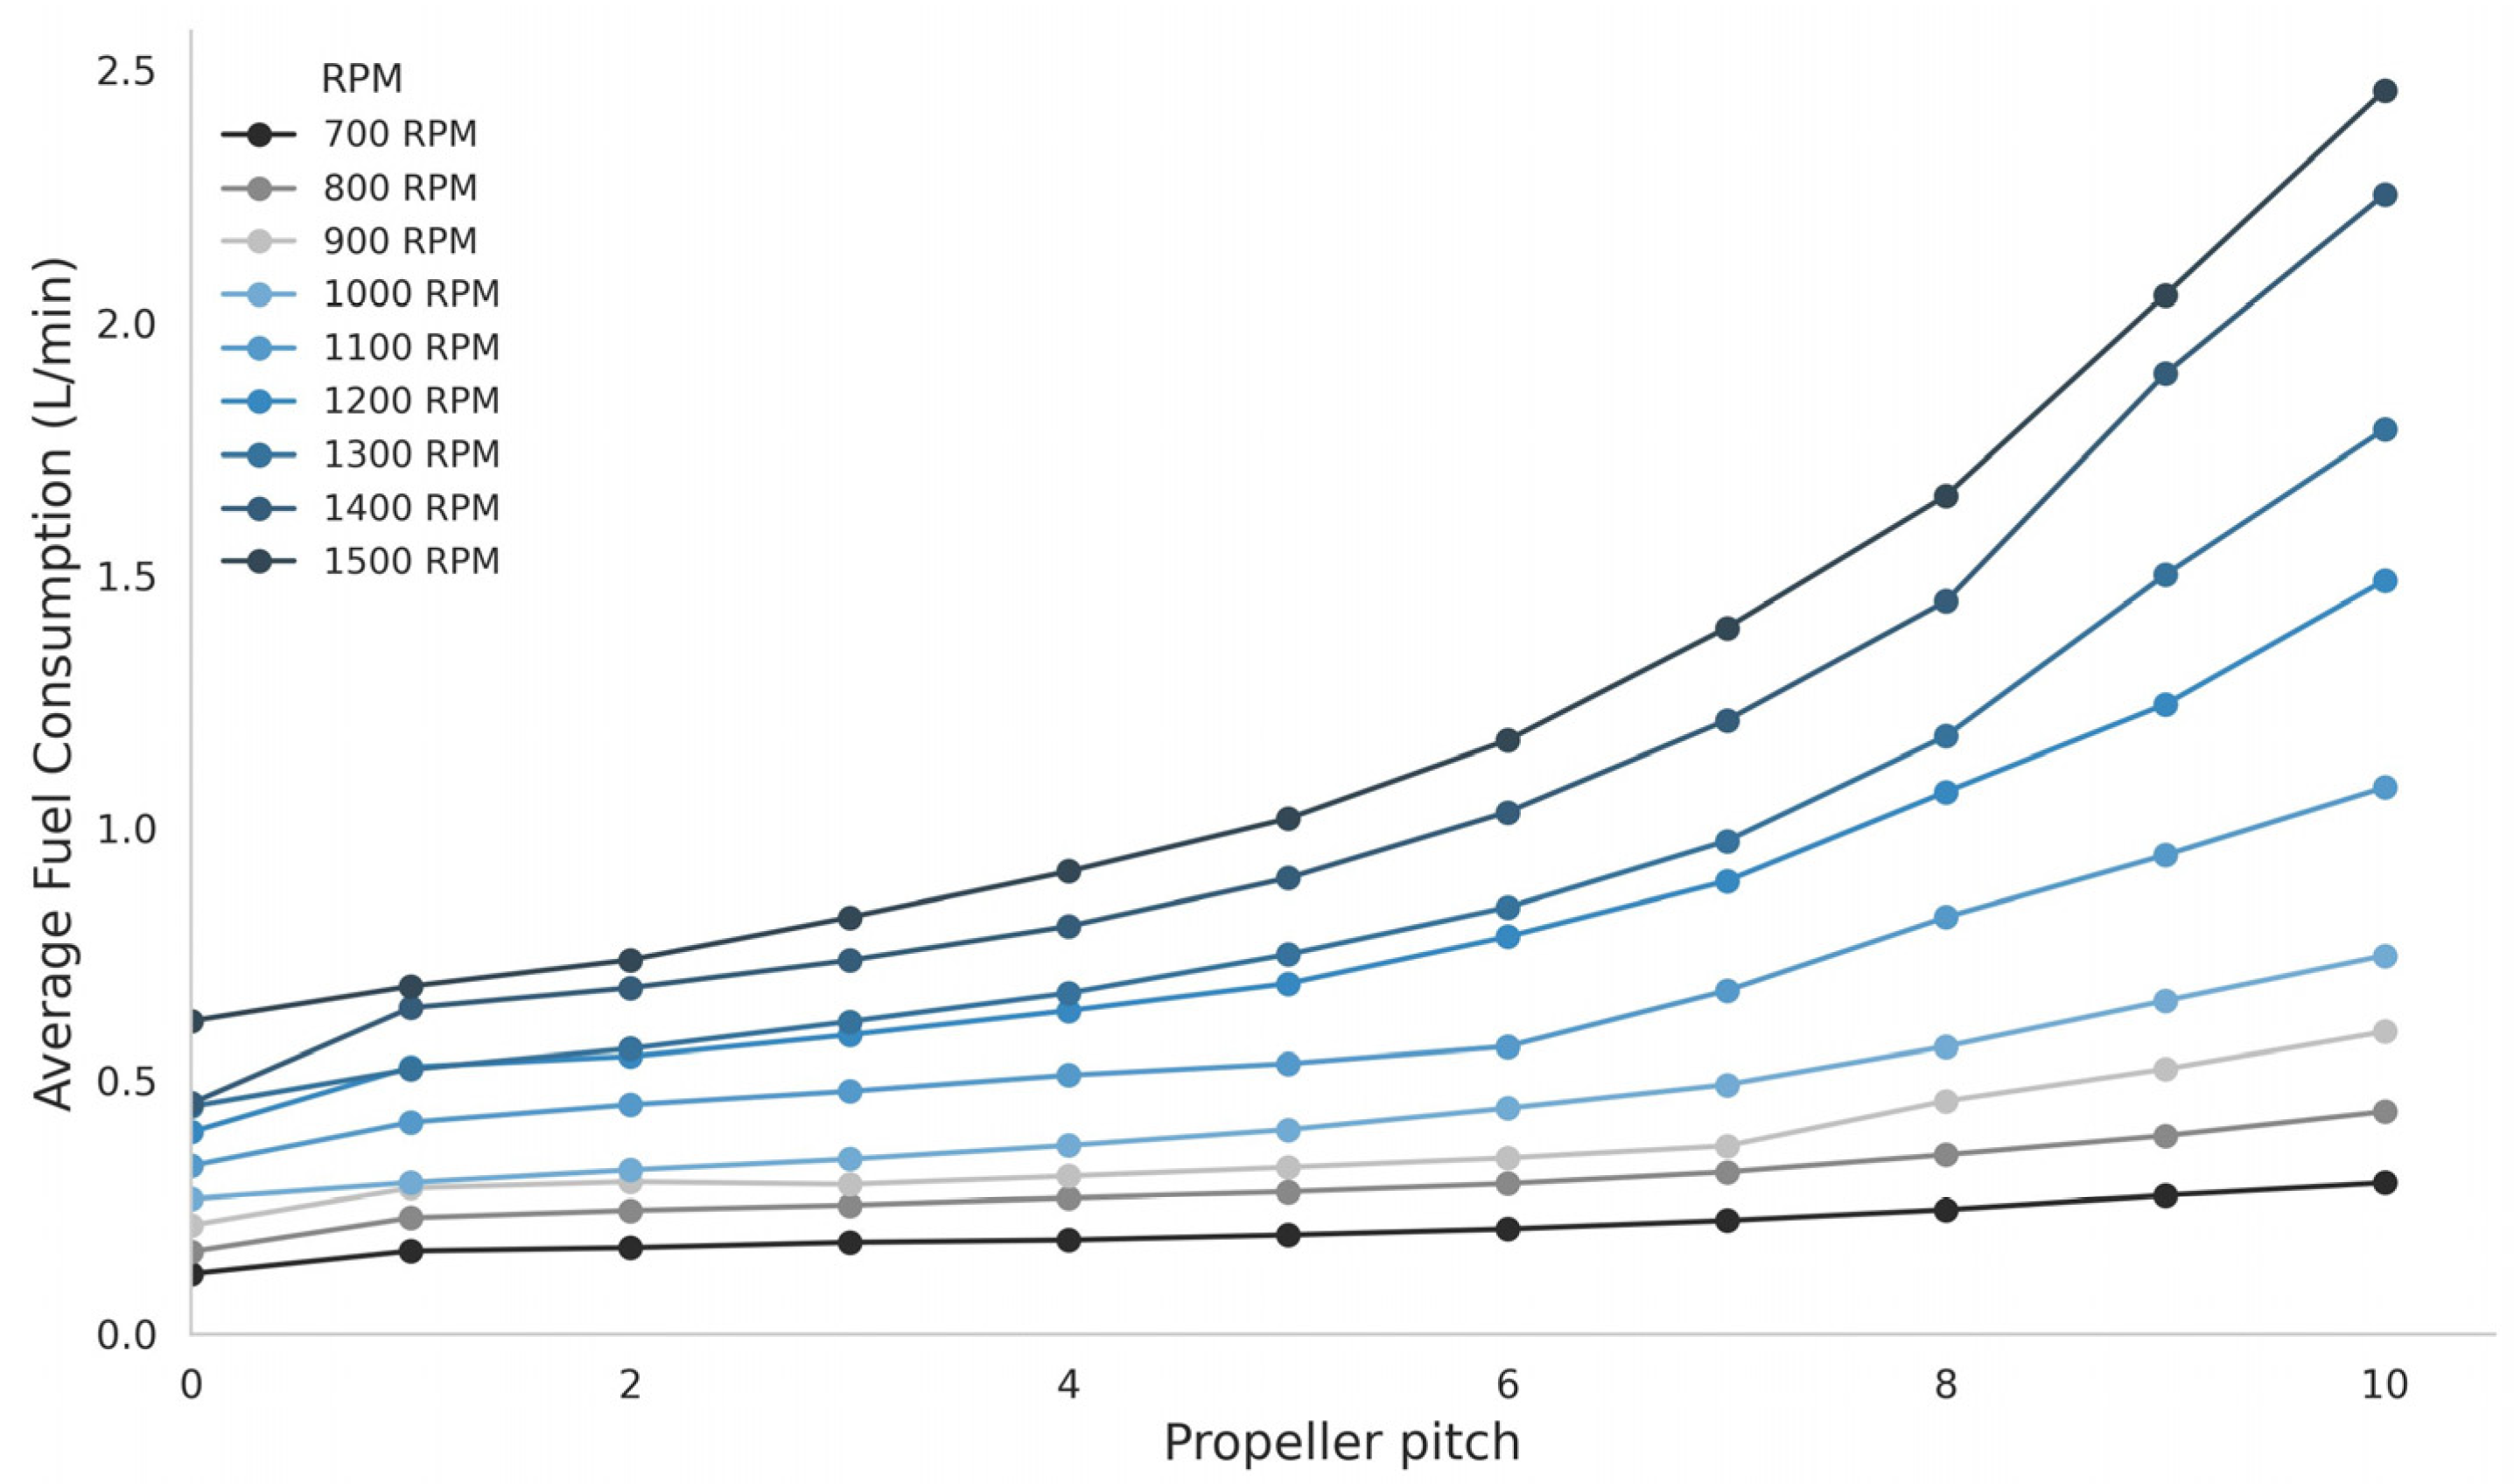
3.2. Relationship Between Propeller Pitch and Fuel Consumption
Figure 5 presents the variation in average fuel consumption as a function of propeller pitch across the different RPM settings. In all cases, fuel consumption increases progressively with pitch, although the rate of increase varies depending on the engine speed. At low rpm (700–900), the rise in consumption is more moderate and tends to stabilize beyond a certain pitch threshold. In contrast, at higher rpm values (1300–1500), consumption increases more sharply and continuously across the entire pitch range, with a noticeable change in slope occurring beyond. This behavior suggests a growing propulsive load and a potential decrease in energy efficiency at high-pitch settings. These results are essential for identifying operating settings that minimize fuel usage and support energy-efficient performance. This increasing and nonlinear fuel consumption behavior, associated with both propeller pitch and RPM, is consistent with experimental observations of cycloidal propulsion systems under varying operating conditions [
10].
Understanding these consumption trends is essential to prevent operational regimes where increased propeller pitch yields diminishing returns in speed but disproportionately higher fuel usage [
11].
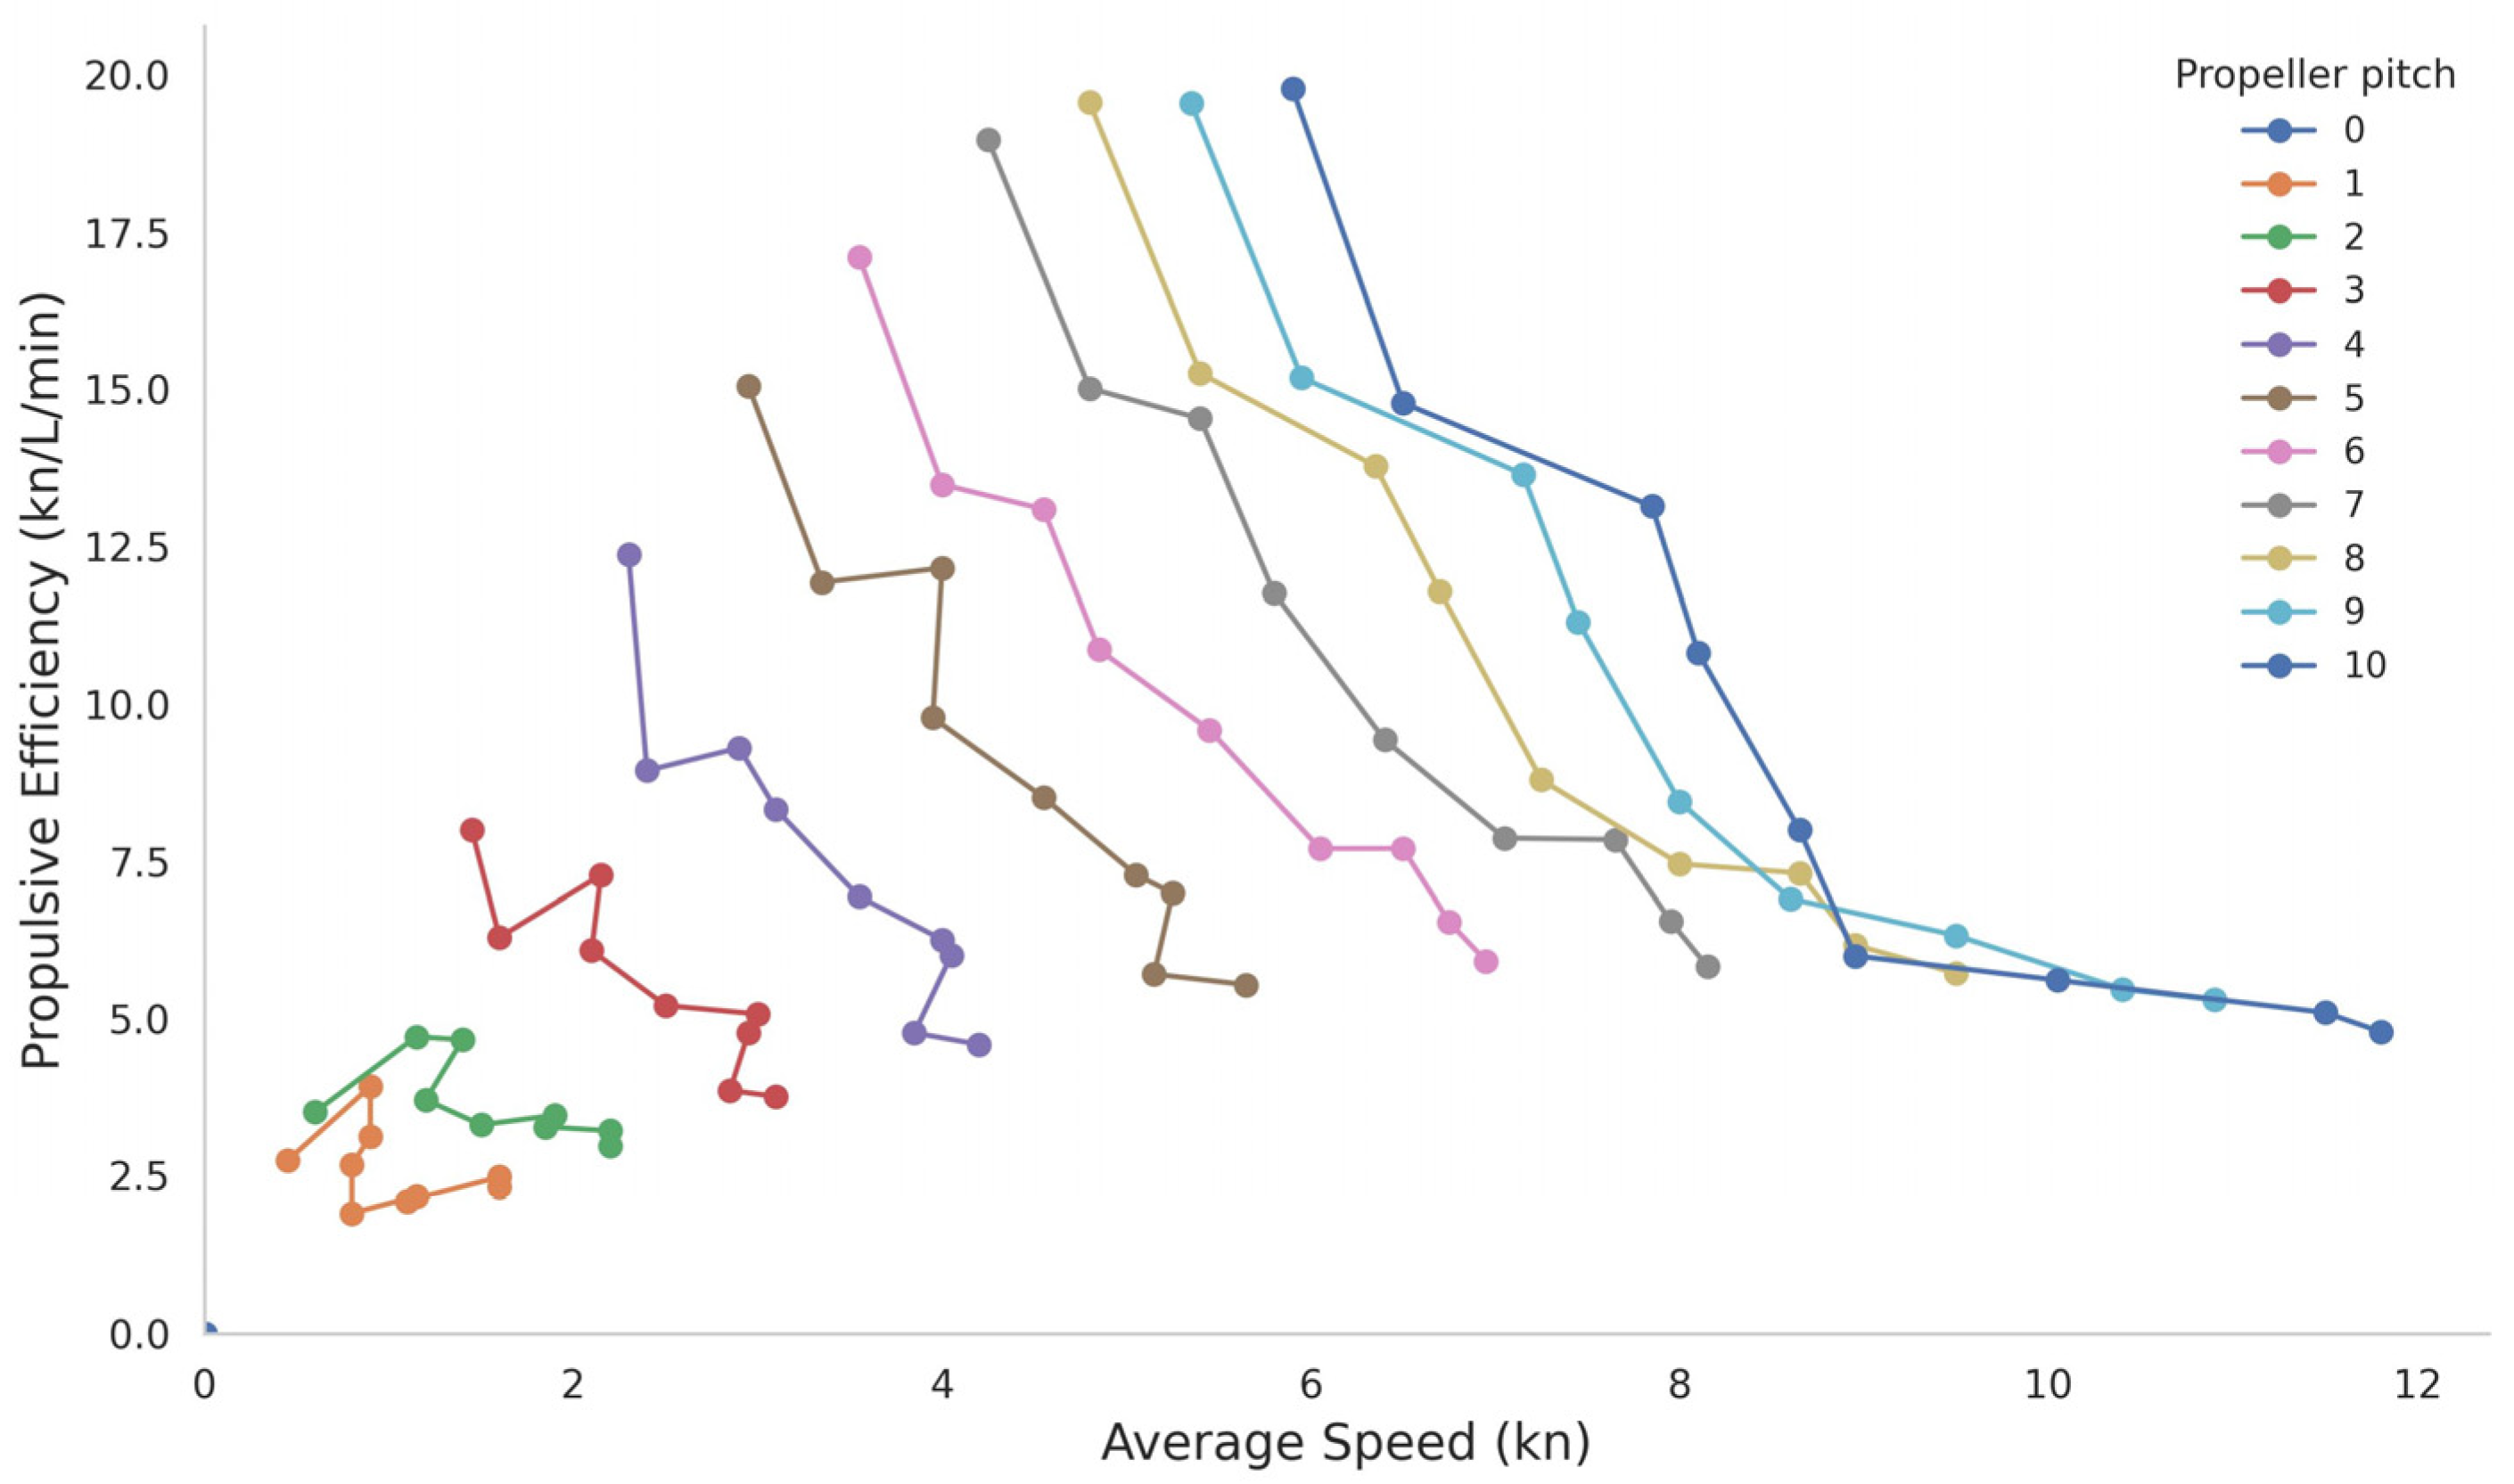
3.3. Propulsive Efficiency Curves as a Function of Vessel Speed
Figure 6 presents the propulsive efficiency, defined as the ratio between average speed and fuel consumption, as a function of vessel speed for each propeller pitch considered. Each curve represents a fixed propeller pitch, and each data point along the curve corresponds to a different engine RPM, ranging from 700 rpm (leftmost point) to 1500 rpm (rightmost point). In general, efficiency increases with speed up to a certain point, reaches a local maximum, and then tends to stabilize or slightly decrease.
Intermediate propeller pitches (between 6 and 8) exhibit the highest efficiency values, particularly within the speed range of 3 to 6 knots, where the propulsion system achieves a favorable balance between speed and fuel consumption. In contrast, low propeller pitches (1 to 3) show reduced efficiency across all speeds due to their limited ability to generate effective propulsive response. At the other extreme, higher propeller pitches (9 and 10) display a progressive decline in efficiency at higher speeds, likely due to the substantial increase in fuel consumption required to maintain those regimes.
This representation enables the direct identification of optimal combinations of speed and propeller pitch and serves as a valuable tool for designing energy-efficient operational strategies.
Propulsive efficiency, defined as the ratio of speed to fuel consumption, offers a simple yet useful metric for evaluating the operational performance of the system in relative terms, in line with other methodological approaches aimed at improving energy performance under real-world sailing conditions [
3,
11,
24].
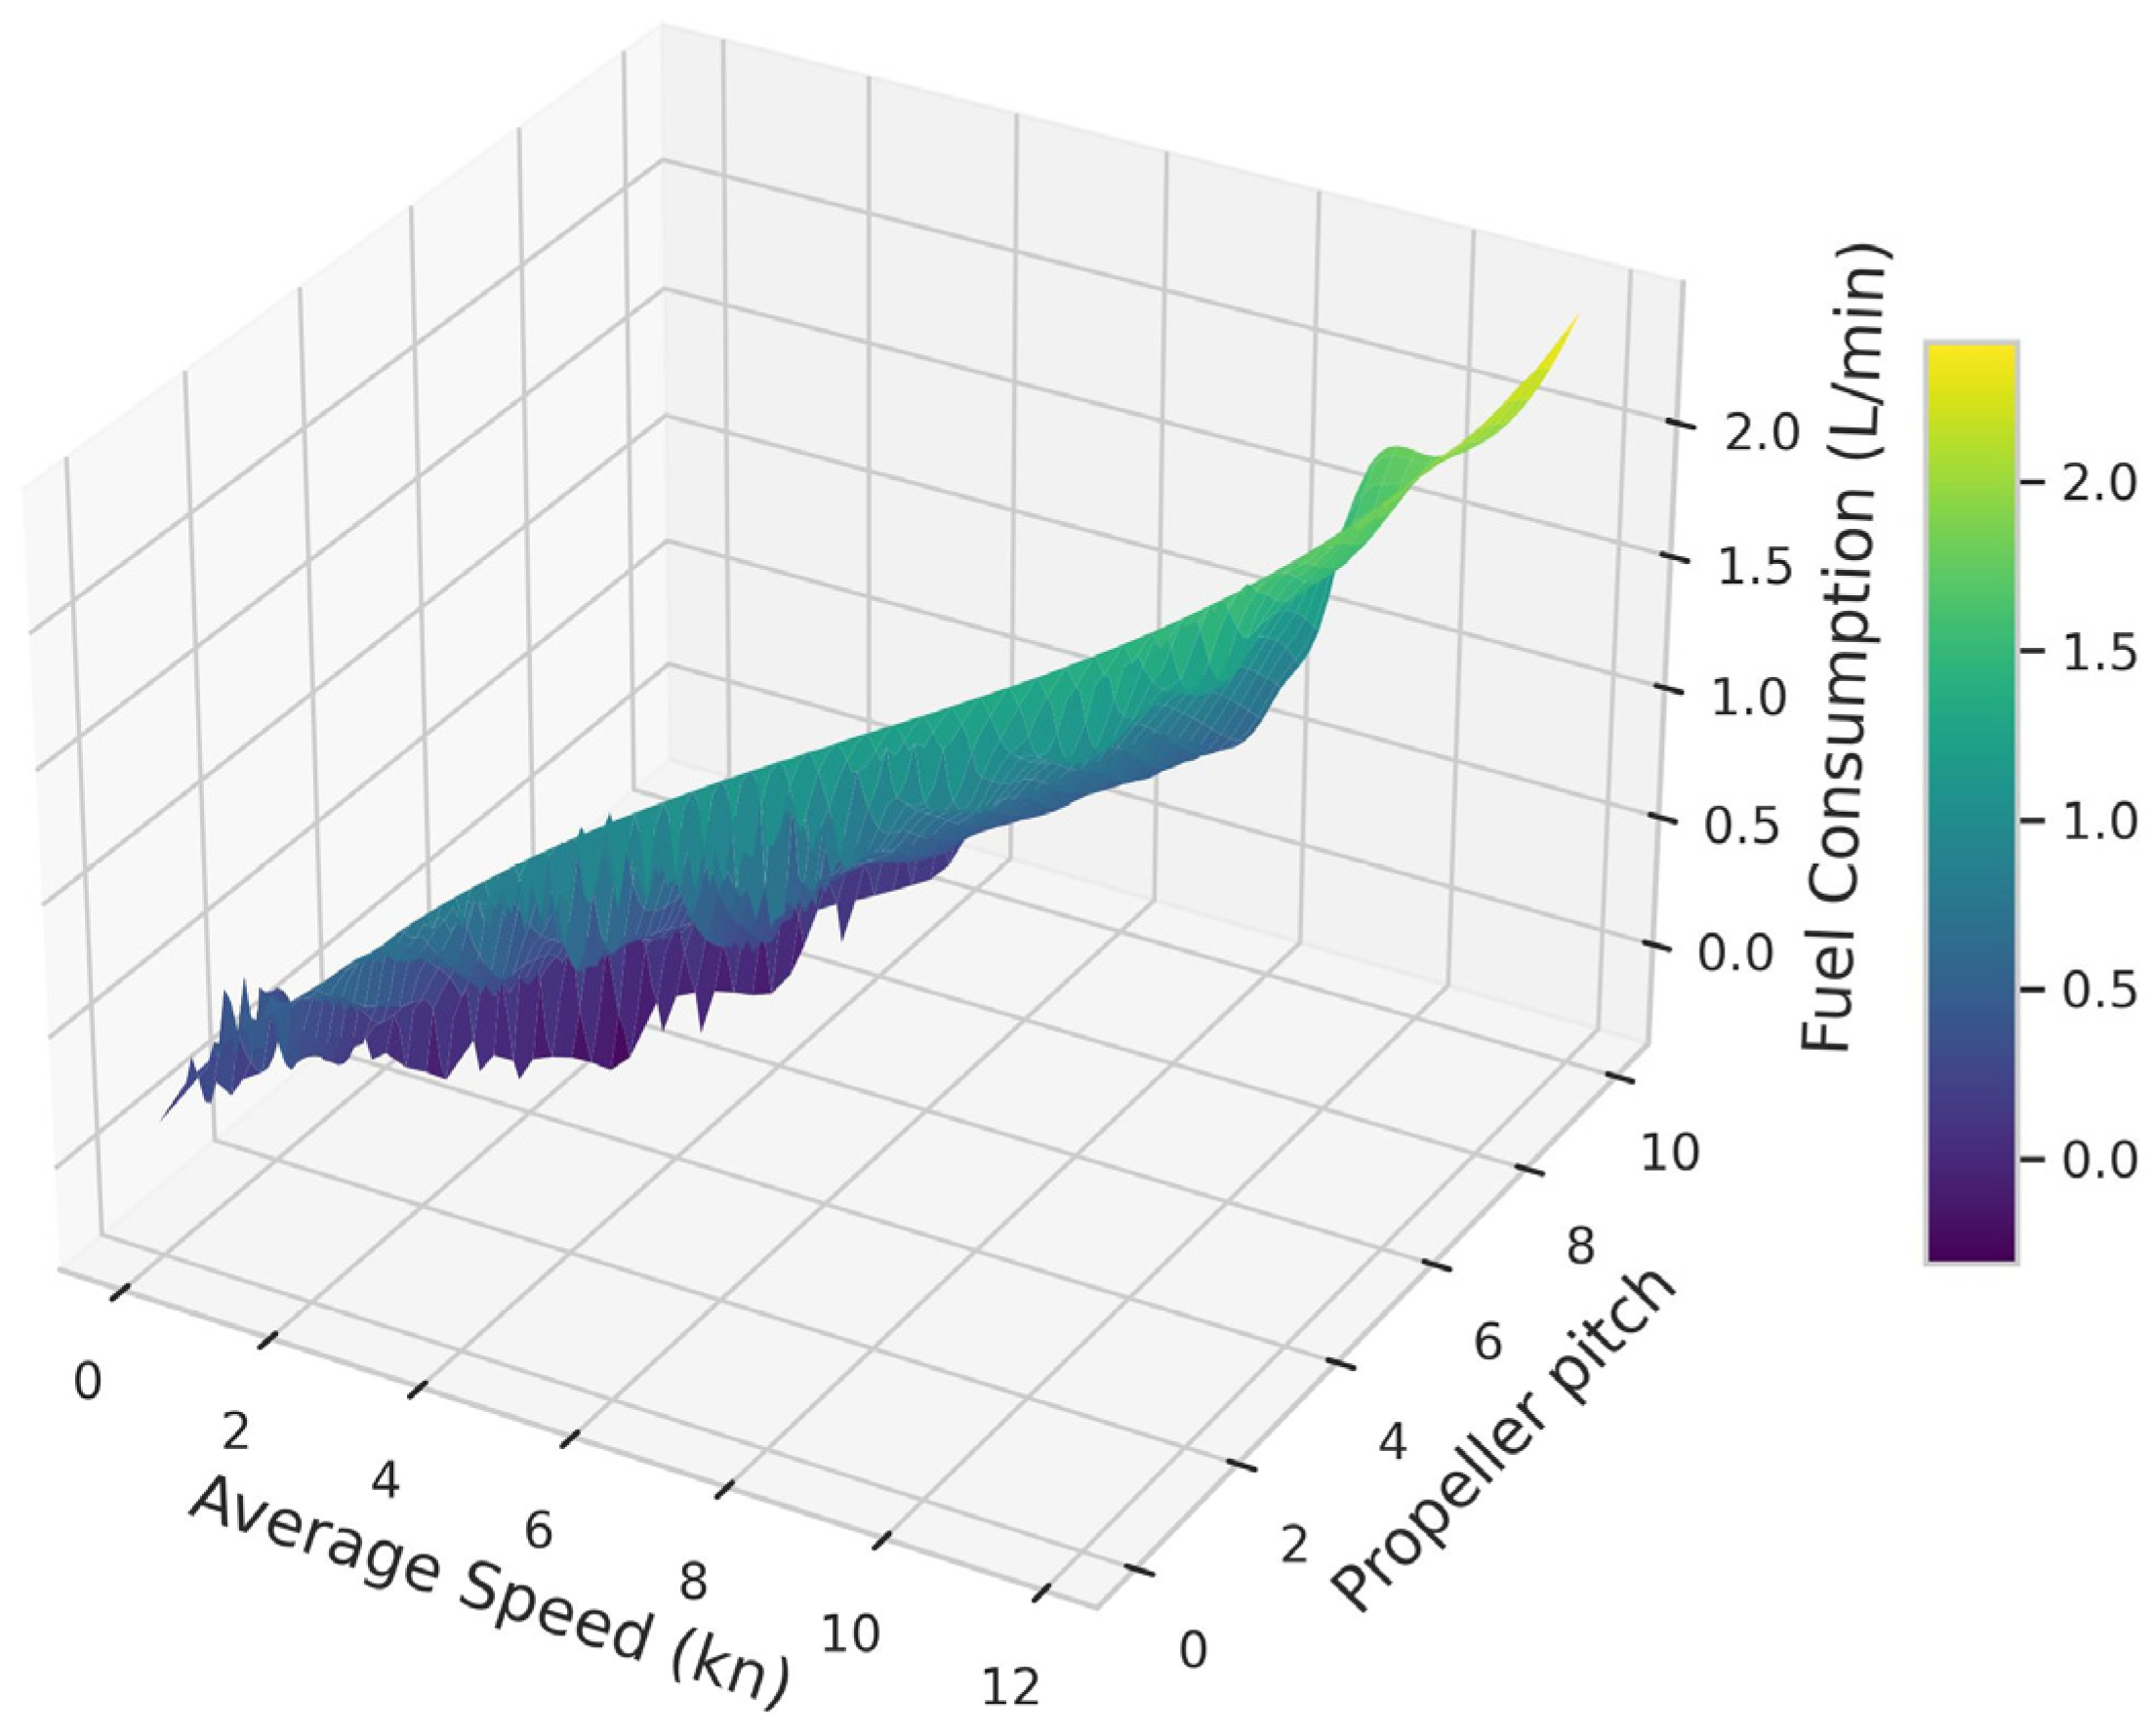
3.4. Three-Dimensional Map of Fuel Consumption
Figure 7 presents a three-dimensional surface plot of fuel consumption as a function of the vessel’s average speed and propeller pitch. This visualization clearly illustrates how both parameters interact to determine the energy demand of the propulsion system. Fuel consumption increases progressively with both speed and propeller pitch, with a more pronounced rise observed at higher values of these variables.
The interpolated surface reveals a region of moderate consumption associated with mid-range propeller pitches and speeds, whereas the highest consumption gradients are concentrated in the upper-right area of the surface—corresponding to propeller pitches above 8 and speeds greater than 6 knots. This trend suggests a less efficient operating regime under maximum propulsive demand, which could be avoided by selecting combinations of speed and propeller pitch that yield lower energy costs for comparable performance.
This graphical analysis provides a valuable tool for identifying suboptimal operating zones and supporting the design of navigation strategies focused on energy efficiency.
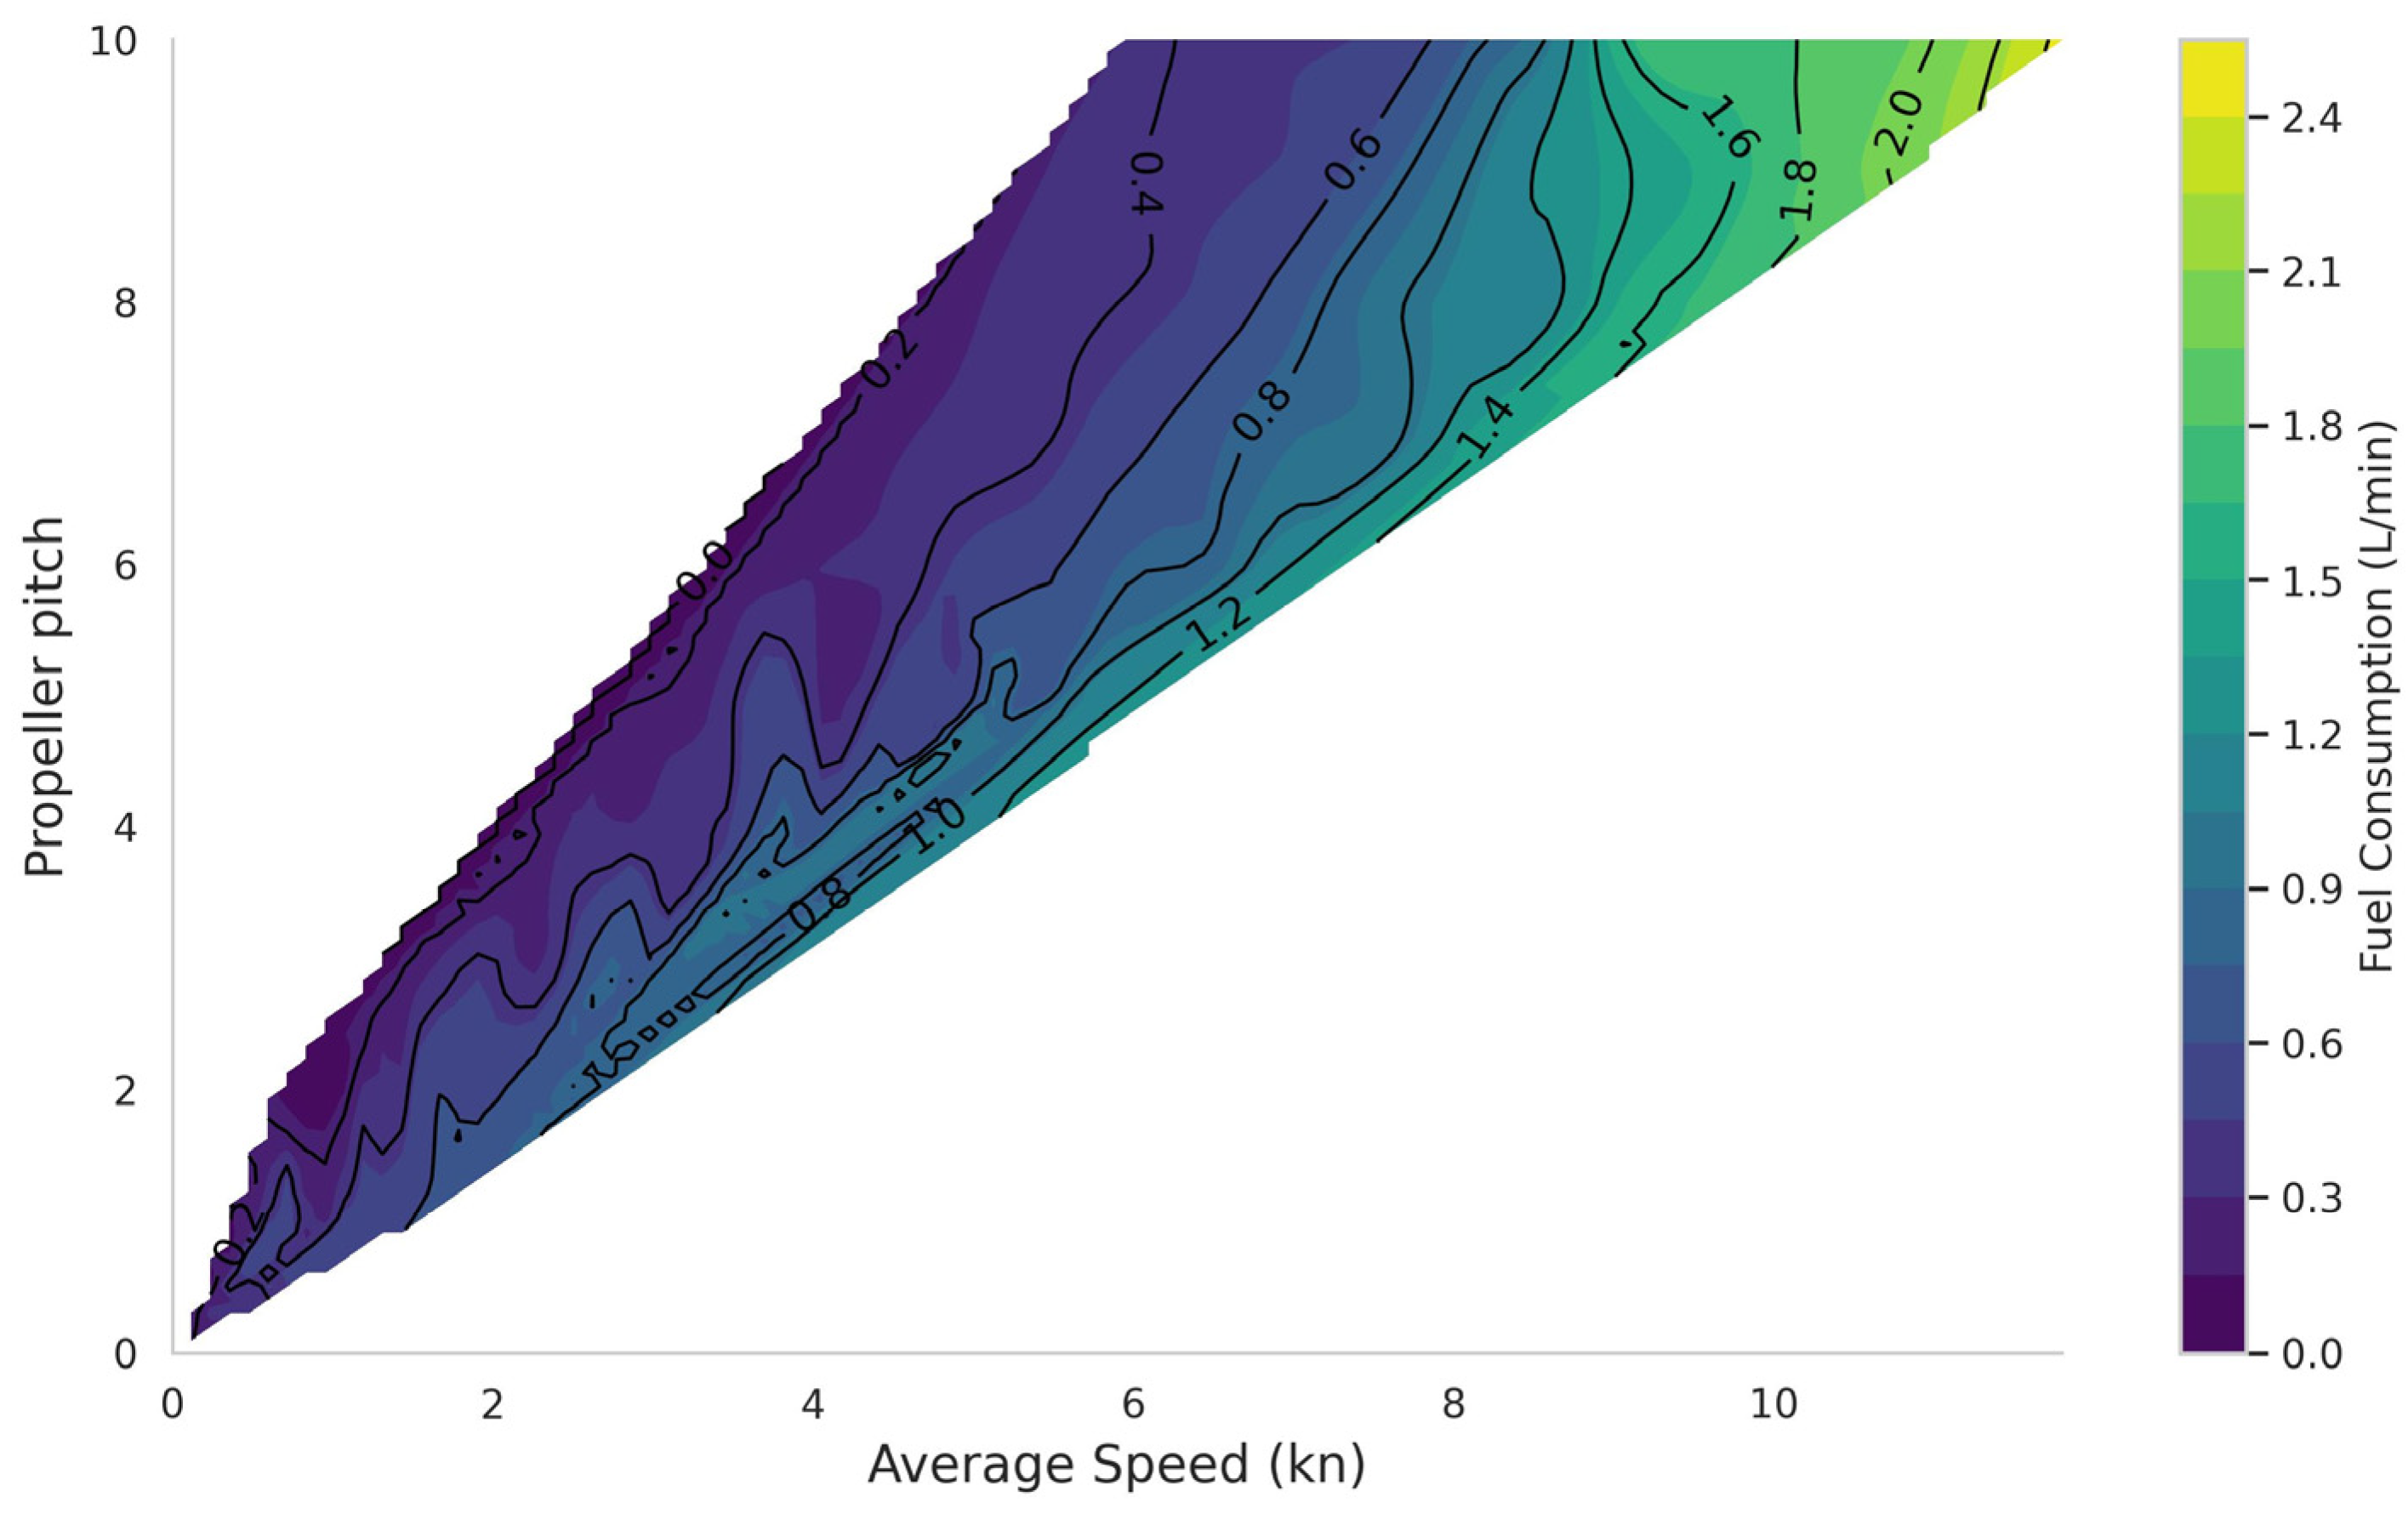
3.5. Iso-Consumption Curves
Figure 8 presents the iso-consumption curves, which represent lines of equal fuel consumption as a function of vessel speed and propeller pitch. This two-dimensional representation allows for a clear identification of operating combinations that result in the same energy demand, making it particularly useful for comparing different propulsion scenarios.
A general upward trend is observed, with fuel consumption increasing progressively as both speed and pitch increase. Iso-consumption lines are more widely spaced in the low-consumption region—corresponding to intermediate propeller pitches and moderate speeds—indicating a zone of higher relative efficiency. In contrast, in the upper-right area of the graph (high pitch and high speed), the curves are more closely packed, reflecting a sharper rise in fuel demand.
This visualization complements the previously analyzed three-dimensional consumption map, providing a more precise perspective for identifying efficiency thresholds and supporting real-time operational decision-making.
3.6. Optimal Combinations by Speed Range
To identify the most energy-efficient propulsion configurations across the vessel’s full operational profile, the top three combinations with the highest efficiency (speed/fuel consumption) were determined within each speed range.
Table 1 summarizes these results, grouped into six intervals: Very Low (0–2 kn), Low (2–4 kn), Moderate (4–6 kn), Medium-High (6–8 kn), High (8–10 kn), and Very High (>10 kn).
The highest efficiency values are concentrated in the Low, Moderate, and Medium-High ranges, indicating that these operational zones yield a relatively greater energy performance. In these intervals, the most efficient combinations involve intermediate propeller pitches and moderate RPM, achieving efficient speeds while maintaining controlled fuel consumption. As target speed increases, progressively higher propeller pitches are required to sustain acceptable efficiency levels. In the upper ranges (High and Very High), the most efficient configurations reflect a trade-off between elevated speed and fuel economy, operating within a regime of a relatively lower efficiency. This detailed classification allows for the adaptation of propulsion strategies to different mission profiles, maximizing the tug’s energy performance under varying navigation conditions.
This analysis transforms the technical information obtained into structured operational recommendations by speed range, representing a further step beyond previous studies focused solely on hydrodynamic characterization of the propulsion system. Such an applied approach is essential for improving energy performance under real operating conditions [
11].
3.7. Optimal Operating Zones
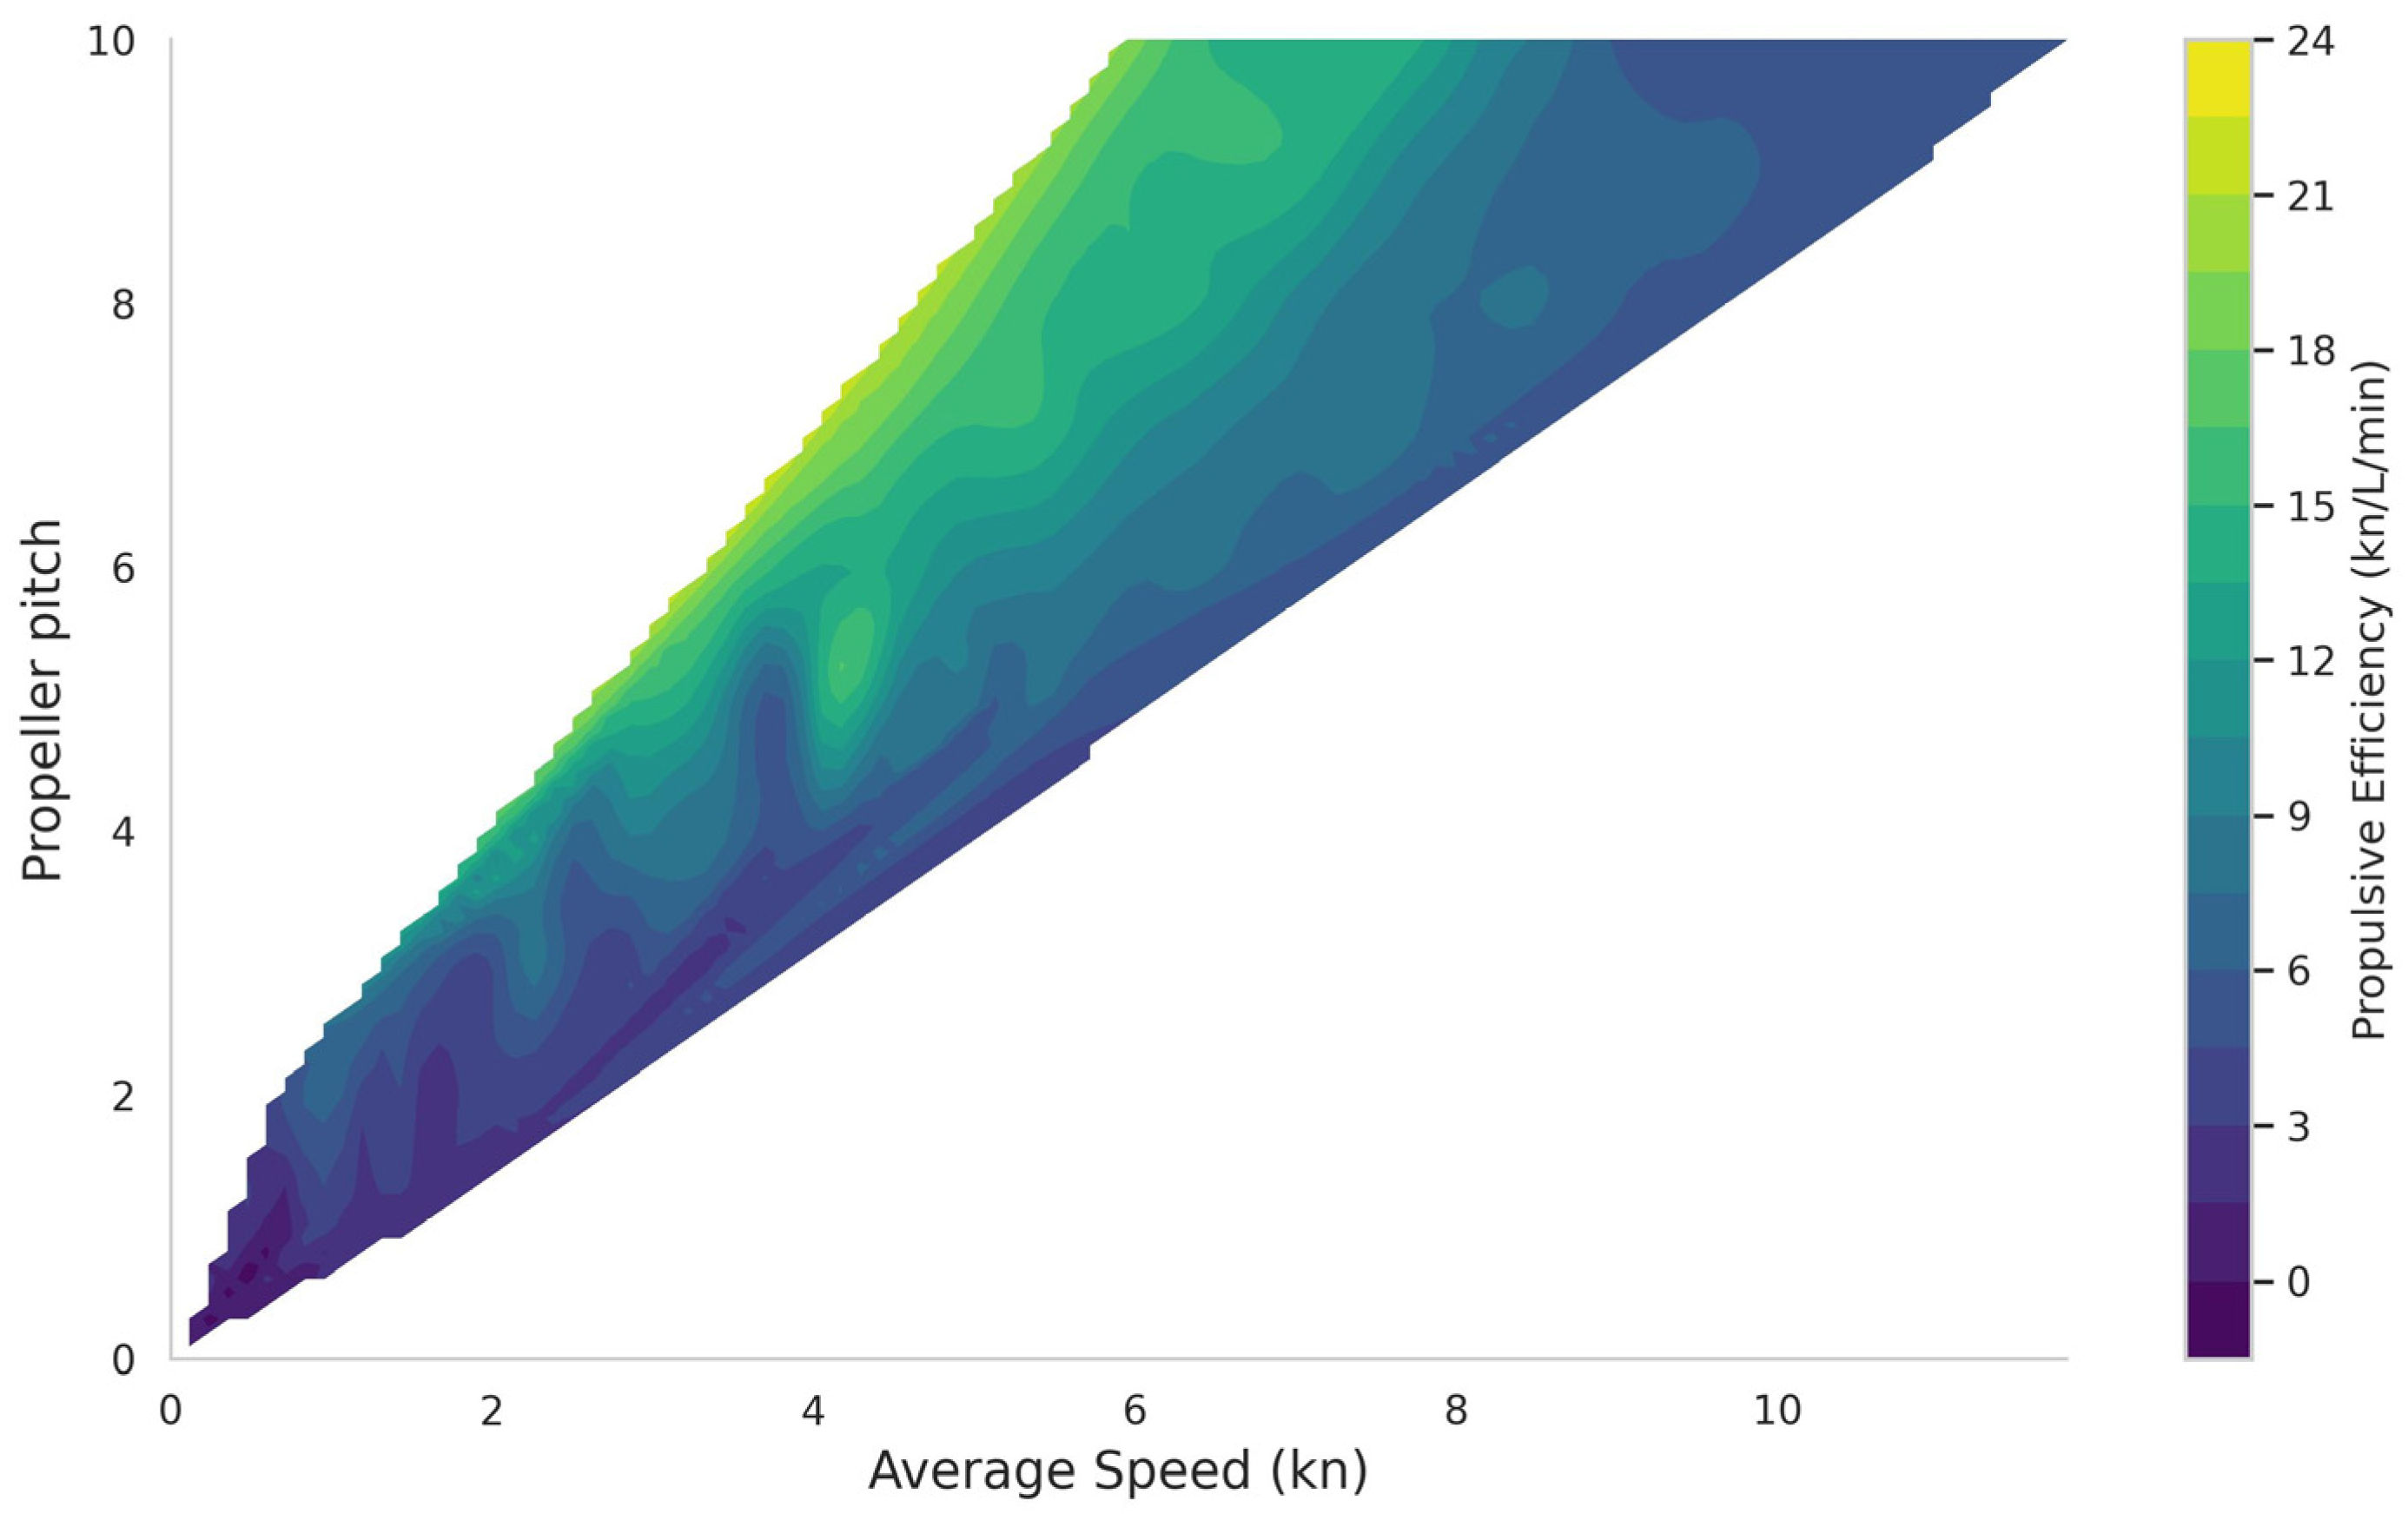
Figure 9 presents an interpolated efficiency map as a function of average vessel speed and propeller pitch, allowing for a visual identification of the most favorable operating zones from an energy standpoint. The color scale represents efficiency values (defined as average speed divided by fuel consumption), enabling the delimitation of parameter combinations that maximize propulsive performance.
The map reveals a well-defined region of maximum efficiency centered around speeds between 3 and 6 knots and propeller pitches between 6 and 9. These operating conditions represent an optimal balance between vessel speed and fuel demand, forming the core of the efficient operating zone. Beyond these values—whether through increased speed or propeller pitch—efficiency progressively decreases, delineating areas of lower energy performance. Similarly, low speed and low pitch combinations also result in suboptimal use of the propulsion system.
This graphical representation synthesizes the preceding analyses and serves as a practical tool for quickly identifying energy-efficient operating configurations.
Unlike the discrete range-based analysis presented in the previous subsection, this representation enables the identification of continuous high-efficiency operating zones, supporting decision-making under varying navigation conditions.
4. Discussion
The sea trials and interpolated performance maps confirmed a nonlinear relationship between propeller pitch and vessel speed, with clear efficiency saturation at high pitch values and increasing fuel penalties at higher RPMs. While these findings are technically consistent with previous hydrodynamic studies on VSP systems [
10], their significance in this study lies in their applicability to real-world tug operations.
From an operational standpoint, the identified patterns reveal efficiency thresholds that can guide low-consumption regimes during transit, standby, or escorting operations. Recognizing these optimal pitch and speed combinations is critical for port operators aiming to reduce fuel costs without compromising the tug’s responsiveness.
More importantly, the empirical maps developed here provide a visual basis that can be integrated into real-time decision support systems. These tools translate complex propulsion system behavior into clear and intuitive operating zones, facilitating decision-making both on board and at the fleet management level. As such, they not only support immediate improvements in energy efficiency but also form a functional building block for future digital twin systems, where real-time feedback and adaptive propulsion modeling can optimize port energy management.
The interpolated representations and iso-consumption curves reinforce these findings, enabling the identification of continuous high-efficiency zones beyond discrete data points. The consistency between graphical methods and efficiency metrics supports the robustness of the results and their practical application.
Unlike previous studies that focused on hydrodynamic characterization under controlled conditions, this work was developed using real data obtained during navigation, adding practical relevance and robustness. Moreover, the applied focus of the methodology allows it to go beyond technical analysis, offering operational criteria for optimizing the energy performance of the overall propulsion system.
The methodological approach—combining full-scale measurements with visual interpolations and speed range segmentation—enables concrete operational recommendations tailored to different mission profiles. This adaptability is particularly valuable in port contexts, where tugboats alternate between high-power maneuvers and prolonged low-demand phases.
Table 1 represents a novel contribution by translating full-scale experimental data into a clear and operational classification of optimal propulsion settings across different speed ranges. Unlike most previous studies focused on hydrodynamic simulations or idealized tests, this table offers a real-world decision-support tool by identifying the most energy-efficient combinations of engine RPM and propeller pitch for each navigation regime.
A particularly relevant example is the moderate speed range (4–6 knots), which corresponds to one of the most common operational phases for tugboats during transit or escorting. Within this interval, the most efficient configuration reached a value of 19.79 kn/(L/min), while the least efficient barely exceeded 4.5. This difference represents a gain of over 330% in efficiency between two possible settings within the same speed range. Access to this information is essential for selecting operational parameters that not only reduce fuel consumption significantly but also lower the vessel’s environmental impact—highlighting the practical and scientific relevance of the findings presented in this study.
These results were obtained under carefully selected environmental conditions (slack tide, light winds, repeated course) to minimize external disturbances and isolate the vessel’s intrinsic propulsion performance. Therefore, the configurations presented in
Table 1 are valid under moderately stable operating conditions, where the influence of external forces is limited.
However, in more dynamic operating environments—such as those involving current, wind, or wave action—the vessel’s speed for a given configuration may deviate from the reference scenario. In such cases, a new optimal configuration would need to be identified for the altered dynamic equilibrium. This underscores the value of the empirical maps as a baseline reference while also highlighting the importance of future research focused on real-time adaptation to varying external conditions.
Moreover, the structured dataset and interpolated efficiency maps developed in this study provide a robust foundation for the development of digital twin systems applied to tugboat operations. A digital twin in this context would require the integration of three essential components: (i) a real-time data acquisition module (including vessel speed, fuel flow rate, RPM, and propeller pitch), (ii) a validated behavioral model (such as the efficiency surfaces obtained in this work), and (iii) a bidirectional communication interface to enable live monitoring and operational decision support. In terms of data acquisition and integration, onboard sensors can be connected through standard marine protocols (e.g., CAN bus, NMEA 2000), with readings stored in a time-series database embedded in an industrial PC or PLC. The interpolated maps can be loaded as look-up tables and periodically updated with operational logs, enabling a semi-online model. More advanced implementations may include machine learning modules for continuous model refinement, as explored in recent real-time digital twin architectures [
15]. These enhancements would enable dynamic simulation, predictive maintenance, and real-time optimization, aligning with the broader vision of intelligent and energy-efficient port tug operations [
13,
25].
Finally, the use of real-world data collected under navigation conditions, combined with interpolation techniques applied to key propulsion system variables, results in a methodological framework that is replicable for other vessels equipped with VSP systems. Although the results were obtained from a specific tugboat, the structural similarity shared by most of these vessels suggests that the identified patterns could be extrapolated—at least as reference guidelines—to other units with comparable characteristics. Given the minimal technical requirements to install flowmeters on existing vessels, the proposed approach is particularly suited for real-world adoption in port towing operations.
5. Limitations and Future Developments
Despite the robustness of the approach and the consistency of the results obtained, this study presents certain limitations worth highlighting. First, the trials were conducted in a specific navigation area selected for its low exposure to currents and wind, but not under fully controlled conditions. Although repeated measurements and averaging were employed to reduce variability, the real operational environment inevitably introduces some dispersion that may affect speed and fuel consumption readings. Additionally, although fuel consumption was monitored on a single engine, the symmetrical configuration and balanced operation of both main engines under steady-state conditions support the representativeness of the data. Nevertheless, monitoring both engines could further reduce uncertainty in future implementations.
Second, the analysis focused on straight-line navigation without rudder input to isolate the behavior of the propulsion system. This means that the conclusions are particularly valid for transit or accompanying operations phases and may not be directly applicable to operations involving frequent heading changes or intensive lateral thrust.
Lastly, while the results were derived from a single vessel, the methodology has proven to be replicable and adaptable. Future application of this approach to a fleet of tugs with similar VSP configurations would help validate the extrapolation of the identified patterns and support the development of more robust predictive models.
As for future work, the incorporation of environmental variables such as current, wind, and towed ship load is proposed to refine operational efficiency in more complex scenarios. Additionally, integrating this methodology into on-board decision support systems or fleet management platforms could enhance its practical applicability and contribute to reducing energy consumption in port operations. As a further step, the availability of extended datasets under a wider range of environmental conditions (e.g., varying wind and current scenarios) could enable the mathematical formulation of the optimization problem, paving the way for the use of formal optimization algorithms based on the empirical performance surfaces developed in this study.
In parallel, the applicability of this methodology to upcoming Voith electric propulsion systems (eVSP) could be investigated. The enhanced responsiveness and torque control of eVSP units may affect the efficiency behavior observed in conventional setups and offer new optimization possibilities.
Finally, although this study did not implement a digital twin system, the structured dataset and visual performance framework developed here represent a solid starting point for future digital twin models aimed at integrating operational data with simulation environments. Future work may explore the real-time synchronization of on-board measurements and predictive models to support advanced decision-making tools in VSP-powered tugboats.
6. Conclusions
Full-scale trials allowed the identification of optimal combinations of vessel speed and propeller pitch in a tugboat with VSP propulsion, aiming to improve energy efficiency under real operating conditions. In typical transit speed ranges (e.g., 4–6 knots), the most efficient configuration outperformed the least efficient by over 300%, highlighting the operational impact of selecting appropriate settings.
The results revealed a nonlinear relationship between propeller pitch, engine RPM, and fuel consumption. The highest efficiency was concentrated at medium-to-high pitch settings and medium cruising speeds, especially during low-demand phases such as standby and accompanying operations.
The proposed methodology, based on empirical data and interpolation techniques, enables the generation of visual tools and performance indicators that are easily interpretable and useful for planning energy-efficient operating regimes.
The approach is replicable and practical, supporting direct fuel savings in port operations without compromising the vessel’s responsiveness during high-power maneuvers.
Moreover, the performance surfaces and structured dataset developed in this study address a core component of future digital twin systems, paving the way for their implementation through real-time data integration and adaptive operational modeling.
Author Contributions
Conceptualization, J.A.O., F.F., J.M.P.-C. and F.M.; methodology, F.F., J.M.P.-C., J.A.O. and F.M.; software, F.M., J.M.P.-C., J.A.O. and F.F.; validation, J.A.O., J.M.P.-C., F.F. and F.M.; investigation, F.F., J.M.P.-C., J.A.O. and F.M.; resources, F.F., J.M.P.-C., F.M. and J.A.O.; data curation, F.F., J.A.O., J.M.P.-C. and F.M.; writing—original draft preparation, F.F., J.A.O., J.M.P.-C. and F.M.; writing—review and editing, F.F. and J.A.O.; supervision, F.F., J.M.P.-C. and J.A.O.; funding acquisition; F.M., F.F., J.M.P.-C. and J.A.O. All authors have read and agreed to the published version of the manuscript.
Funding
This research was funded by University of A Coruña grant number I000815.
Data Availability Statement
The data supporting the findings of this study are available from the corresponding author upon reasonable request. Some restrictions apply due to operational confidentiality agreements.
Acknowledgments
The authors would like to thank Voith Turbo GmbH for their technical support and knowledge sharing throughout the development of this study. This research was also supported by the company Mantenimientos y Servicios Tecman, S.L., through the collaboration agreement with Universidade da Coruña under contract INV02224, and by the Port Authority of Ferrol-San Cibrao.
Conflicts of Interest
The authors declare no conflicts of interest.
References
- International Maritime Organization, Third IMO GHG Study 2014. 2014. Available online: https://www.imo.org/en/ourwork/environment/pages/greenhouse-gas-studies-2014.aspx (accessed on 22 July 2025).
- International Maritime Organization, Resolution MEPC.203(62): Amendments to MARPOL Annex VI—Inclusion of Regulations on Energy Efficiency for Ships. 2011. Available online: https://wwwcdn.imo.org/localresources/en/KnowledgeCentre/IndexofIMOResolutions/MEPCDocuments/MEPC.203(62).pdf (accessed on 22 July 2025).
- Bouman, E.A.; Lindstad, E.; Rialland, A.I.; Strømman, A.H. State-of-the-art technologies, measures, and potential for reducing GHG emissions from shipping—A review. Transp. Res. Part D Transp. Environ. 2017, 52, 408–421. [Google Scholar] [CrossRef]
- Tadros, M.; Ventura, M.; Soares, C.G. Review of the IMO Initiatives for Ship Energy Efficiency and Their Implications. J. Mar. Sci. Appl. 2019, 22, 662–680. [Google Scholar] [CrossRef]
- Saxe, H.; Larsen, T. Air pollution from ships in three Danish ports. Environ. Sci. Policy 2004, 7, 545–551. [Google Scholar] [CrossRef]
- Jiang, L.; Kronbak, J.; Christensen, L. The costs and benefits of sulfur reduction measures: Sulfur scrubbers versus marine gas oil. Transp. Res. Part D Environ. 2014, 28, 19–27. [Google Scholar] [CrossRef]
- Jaramillo, J.; Gutiérrez, J.; Macia, Y.M. Comparative Analysis of Carbon Intensity Indicators Applicable to Harbor Tugboats. Sustainability 2025, 17, 1706. [Google Scholar] [CrossRef]
- Voith Turbo GmbH. Voith Schneider Propeller—Maritime Applications and Performance; Voith Turbo GmbH: Heidenheim, Germany, 2016. [Google Scholar]
- Jürgens, D.; Palm, M.; Singer, S.; Urban, K. Numerical Optimization of the Voith-Schneider Propeller. ZAMM–J. Appl. Math. Mech. 2007, 87, 792–794. [Google Scholar] [CrossRef]
- Bakhtiari, M.; Ghassemi, M. A 2.5D numerical study on open water hydrodynamic performance of a Voith Schneider propeller. Mech. Ind. 2019, 20, 617. [Google Scholar] [CrossRef]
- Baldi, F.; Johnson, H.; Gabrielii, C.; Andersson, K. Energy and exergy analysis of ship energy systems—The case study of a chemical tanker. Int. J. Thermodyn. 2015, 18, 82–93. [Google Scholar] [CrossRef]
- Liu, W.; Chen, Q.; Ma, C. Research on efficiency optimization of the voith-schneider propeller based on motion curve parameter control. Ocean Eng. 2024, 299, 117136. [Google Scholar] [CrossRef]
- Madusanka, N.; Fan, Y.; Yang, S.; Xiang, X. Digital Twin in the Maritime Domain: A Review and Emerging Trends. J. Mar. Sci. Eng. 2023, 11, 1021. [Google Scholar] [CrossRef]
- Assani, N.; Matić, P.; Katalinić, M. Ship’s Digital Twin—A Review of Modelling Challenges and Applications. Appl. Sci. 2022, 12, 6039. [Google Scholar] [CrossRef]
- Lee, J.-H.; Nam, Y.-S.; Kim, Y.; Liu, Y.; Lee, J.; Yang, H. Real-time digital twin for ship operation in waves. Ocean Eng. 2022, 266, 112867. [Google Scholar] [CrossRef]
- Hadi, J.; Zhi Yung, T.; Kudupudi, R.; Taskar, B.; Tan, C.E.; Singh Chopra, P.; Peng, N.; Konovessis, D. Digital Twin Modelling for Full-Electric Harbour Craft: An Integrated Hydrodynamics and Systems Model. In ASME 2024 43rd International Conference on Ocean, Offshore and Arctic Engineering, Proceedings of the Offshore Technology, Singapore, 9–14 June 2024; ASME: New York, NY, USA, 2024; Volume 1, p. V001T01A046. [Google Scholar] [CrossRef]
- Zheng, Y.; Yiew, L.; Jin, Y.; Ravindra, K.; Magee, A.R. Experimental and numerical study on seakeeping performance of a benchmark ASD tug in head seas. Ocean. Eng. 2023, 272, 113800. [Google Scholar] [CrossRef]
- Lv, Z.; Lv, H.; Fridenfalk, M. Digital Twins in the Marine Industry. Electronics 2023, 12, 2025. [Google Scholar] [CrossRef]
- Mauro, F.; Kana, A. Digital twin for ship life-cycle: A critical systematic review. Ocean Eng. 2023, 269, 113479. [Google Scholar] [CrossRef]
- Bertram, V. Practical Ship Hydrodynamics, 2nd ed.; Butterworth-Heinemann: Oxford, UK, 2012. [Google Scholar]
- Carlton, J. Marine Propellers and Propulsion, 4th ed.; Butterworth-Heinemann: Oxford, UK, 2018. [Google Scholar]
- Virtanen, P.; Gommers, R.; Oliphant, T.E.; Haberland, M.; Reddy, T.; Cournapeau, D.; Burovski, E.; Peterson, P.; Weckesser, W.; Bright, J.; et al. SciPy 1.0: Fundamental algorithms for scientific computing in Python. Nat. Methods 2020, 17, 261–272. [Google Scholar] [CrossRef] [PubMed]
- Hunter, J. Matplotlib: A 2D Graphics Environment. Comput. Sci. Eng. 2007, 9, 90–95. [Google Scholar] [CrossRef]
- Lindstad, H.; Eskeland, G.S.; Psaraftis, H.N. Maritime Shipping and Emissions: A Three-Layered, Damage-Based Approach. Ocean Eng. 2015, 10, 94–101. [Google Scholar] [CrossRef]
- Chen, B.-Q.; Soares, C.G.; Videiro, P. Review of digital twin of ships and offshore structures. In Developments in Maritime Technology and Engineering; CRC Press: London, UK, 2021; p. 7. [Google Scholar] [CrossRef]
| Disclaimer/Publisher’s Note: The statements, opinions and data contained in all publications are solely those of the individual author(s) and contributor(s) and not of MDPI and/or the editor(s). MDPI and/or the editor(s) disclaim responsibility for any injury to people or property resulting from any ideas, methods, instructions or products referred to in the content. |
© 2025 by the authors. Licensee MDPI, Basel, Switzerland. This article is an open access article distributed under the terms and conditions of the Creative Commons Attribution (CC BY) license (https://creativecommons.org/licenses/by/4.0/).


