Article

Characterization of TGFβ Signaling Components in Large Yellow Croaker (Larimichthys crocea) and Their Role in Growth and Body Shape Regulation

1
Fishery Machinery and Instrument Research Institute, Chinese Academy of Fishery Sciences, Shanghai 200092, China
2
College of Engineering Science and Technology, Shanghai Ocean University, Lingang New City Campus, Shanghai 201306, China
3
Qingdao Conson Oceantec Valley Development Co., Ltd., Qingdao 266000, China
4
Shandong Key Laboratory of Intelligent Marine Ranch (Under Preparation), Marine Science Research Institute of Shandong Province (National Oceanographic Center, Qingdao), Qingdao 266104, China
*
Authors to whom correspondence should be addressed.
J. Mar. Sci. Eng. 2025, 13(9), 1716; https://doi.org/10.3390/jmse13091716
Submission received: 19 June 2025 / Revised: 21 August 2025 / Accepted: 1 September 2025 / Published: 5 September 2025
(This article belongs to the Special Issue Marine Ecological Ranch, Fishery Remote Sensing, and Smart Fishery)

Abstract

The transforming growth factor β (TGFβ) signaling axis plays a pivotal role in orchestrating a wide array of biological functions, encompassing cellular growth, proliferation, and differentiation. The aim of the present study was to identify the members of TGFβ signaling pathway and their expression patterns in large yellow croaker (Larimichthys crocea) under different culture modes. TGFβ signaling pathway and their expression patterns in fish reared under two different culture modes: Group N (2400 fish in a 120 m3 cage) and Group V (168,000 fish in a 5600 m3 aquaculture vessel). After 120 days, we analyzed 15 fish from each group and found that Group V exhibited faster growth and a slender body shape compared to Group N. Bioinformatics analysis identified 48 TGFβ superfamily members in L. crocea, including 21 ligands, 10 receptors, and 3 Smads. mRNA expression levels indicated that these signaling molecules influence growth rate and body shape through five distinct ligand–receptor–R-Smad pathways, with the INHBB-, Nodal-, and GDF3-ACVR2A-ALK4-Smad2 axis playing a predominant role in regulating these traits.

1. Introduction

The global depletion of fishery resources has driven the transition from traditional extractive fishing to aquaculture. In this context, marine aquaculture has established itself as an essential method for sustainable seafood production [1]. China, the world’s largest producer in this sector, is leading this transformation. Among the various species farmed, the yellow croaker (Larimichthys crocea) stands out, whose production reaches unparalleled scale and throughput [2,3,4,5]. In 2024, production of this species reached 292.615 million tons, representing 13.53% of China’s annual marine fish production [6]. Given this, and with aquaculture expected to become the primary source of aquatic protein by 2050 [7], understanding the biological mechanisms that regulate the growth and morphology of commercially valuable species, such as L. crocea, is becoming increasingly crucial.
Growth-related traits are a priority in breeding programs, as they directly affect productivity. Furthermore, body shape is also a relevant factor in aquaculture, as it influences swimming behavior, feeding, predator avoidance, and, most importantly, consumer acceptance [8]. In this context, the market preference for large, slender yellow croaker specimens has made body shape an important economic characteristic, directly impacting the species’ commercial value [9]. However, factors such as climate change, disease outbreaks, and reduced genetic variability due to inbreeding have been compromising the species’ performance [10].
In this context, understanding the genetic factors involved in growth and body shape characteristics is essential, as these characteristics in L. crocea are complex quantitative traits controlled by multiple genes distributed throughout the genome. Furthermore, recent studies indicate that morphological variability is strongly determined by genetic factors [11,12]. Therefore, identifying the genes responsible for regulating growth and body shape is essential for the genetic improvement of the species. Research in animal models has demonstrated that the transforming growth factor beta (TGFβ) family plays a crucial role in coordinating a wide range of biological processes, including cell growth, proliferation, and differentiation [13,14,15]. Mechanistically, the TGFβ signaling pathway begins with the binding of ligands to membrane receptors, which promotes the activation of type I receptors through phosphorylation by type II receptors. Type I receptors then phosphorylate SMAD proteins, initiating intracellular signal transduction [16,17].
Regarding ligands, the TGFβ superfamily comprises a variety of proteins that bind to specific receptors on the cell surface, thus activating intracellular signaling pathways. These ligands include the TGFβs themselves (TGFB1-5), bone morphogenetic proteins (BMP2-16), growth and differentiation factors (GDF1-15), as well as Nodal, activins (INHBA and INHBB), and inhibins. In turn, receptors are transmembrane proteins classified into two main groups: type I receptors, which include activin-like kinases (ALK1 to ALK7), and type II receptors, which include TGFBR2, ACVR2, ACVR2B, AMHR2, and BMPR2 [18]. At the intracellular level, SMAD proteins, which act in signaling downstream of these receptors, are divided into three categories: R-SMADs (receptor-regulated, such as SMAD2 and SMAD3), Co-SMADs (co-regulatory, such as SMAD4), and I-SMADs (inhibitory, such as SMAD6 and SMAD7). This classification provides a framework for understanding the complex interactions within the TGFβ superfamily [19]. Generally, all cells, both in the embryo and in the adult organism, are capable of responding to these signals [20]. Furthermore, the number and type of TGFβ family members have been extensively evaluated in model organisms ranging from worms and flies to mammals [21,22], demonstrating that most cells respond to at least a subset of their ligands [19].
In addition to its role in growth and development, recent evidence from genome-wide association studies suggests that the TGFβ signaling pathway is also involved in body shape-related traits in L. crocea [9]. However, the specific components of this pathway and their regulatory mechanisms in this species remain largely unexplored. This knowledge gap is due, in part, to the recent completion of the complete genome sequencing and precise mapping of the species, carried out only in 2015 [23,24,25]. Currently, it is known that the TGFβ family in L. crocea comprises 24 ligands, 19 receptors and 3 SMAD proteins. Additionally, some members have even more specific subtypes, such as BMPR1BX1 (XM_010732488.3), BMPR1BX2 (XM_027275036.1) and BMPR1BX3 (XM_027275041.1). Despite this, functional and expression studies that clarify the role of these genes in the body development of the species are still scarce. Therefore, this study aimed to identify and characterize genes belonging to the TGFβ signaling pathway in the yellow croaker genome, as well as analyze their expression profiles. Understanding the role of these genes in regulating growth and body morphology is fundamental for advancing genetic improvement and the sustainability of aquaculture for this commercially valuable species.

2. Materials and Methods

2.1. Experimental Fish

In November 2023, L. crocea with a mean total length of 32.41 ± 1.16 cm and mean body weight of 350.4 ± 34.24 g (Group A) were allocated to two experimental rearing systems. Group N (n = 2400) was stocked in a 120 m3 net-pen cage (density: 20 fish/m3). Group V (n = 168,000) was reared in the “Conson No. 1” Aquaculture Vessel (total water volume: 5600 m3; density: 30 fish/m3) (Figure 1). After a 120-day feeding period, 15 sexually immature fish from each group were randomly selected for further detailed experimental analysis. The study characterized growth and body shape using parameters such as Body Weight (BW), Total Length (TL), Body Length (BL), Body Depth (BD), Caudal Peduncle Length (CPL), Caudal Peduncle Width (CPW), the ratio of Caudal Peduncle Length to Caudal Peduncle Width (CPL/CPW), the ratio of Body Length to Body Height (BL/BD), the ratio of Caudal Peduncle Length to Body Length (CPL/BL), and Fullness.

2.2. Sequence Analysis

The available protein sequences for all TGFβ ligands, receptors, and Smads from L. crocea on the NCBI (National Center for Biotechnology Information) database were downloaded and subjected to comparative analysis with sequences from other species using the BLAST (Basic Local Alignment Search Tool) programs. Multiple sequence alignments were conducted using the ClustalW Multiple Alignment program, accessible at http://www.ebi.ac.uk/clustalw/ (16 January 2025). Based on the amino acid sequences of ligands, receptors, and Smads, individual phylogenetic trees were constructed using the neighbor-joining (NJ) method implemented in MEGA version 7.0 [26]. The robustness of these trees was evaluated through 1000 bootstrap repetitions to ensure reliability.

2.3. mRNA Expression of TGFβ Signaling Pathway Genes

The muscle and liver of L. crocea of different sizes were peeled away carefully, flash-frozen in liquid nitrogen, and stored at −80 °C for subsequent total RNA extraction. Specific primers for TGFβ signaling pathway genes and housekeeping genes were designed based on known L. crocea sequences (Table 1) using Oligo 7.0. The primers required for this experiment were synthesized by Sangon Biotech (Shanghai, China) Co., Ltd. Total RNA was extracted with TRIzol™ Reagent (Invitrogen, Thermo Fisher Scientific, Waltham, MA, USA) and purified of genomic DNA using RNase-free DNase (Takara Bio, Kusatsu, Japan). RNA was reverse-transcribed using the Prime Script RT-PCR Kit (Takara). cDNA was then subjected to quantitative real-time PCR in a PikoReal™ Real-Time PCR System (96-well, Thermo Fisher Scientific, USA) with a 10 μL reaction mix including SYBR Green Master Mix, diluted cDNA, primers, and water. PCR cycling involved 94 °C for 5 min, followed by 30 cycles of 95 °C for 15 s, 60 °C for 30 s, and 72 °C for 1 min, with a final extension at 72 °C for 7 min. PCR products were visualized on an agarose gel, and dissociation curves were analyzed to ensure specificity. mRNA abundance was calculated using the Pfaffl method [27].
Statistical analysis of all data was conducted using GraphPad Prism 5.0 software, with one-way ANOVA employed for assessment. Post hoc multiple comparisons were performed using Tukey’s Honestly Significant Difference (HSD) test to evaluate differences between the means. The results were reported as mean ± SD, and a p-value of less than 0.05 was considered statistically significant.

3. Results

3.1. The Growth and Body Shape of L. crocea Under Two Aquiculture Modes

After a 120-day feeding period, significant differences were observed in body weight, total length, and body length among the three groups of L. crocea with undeveloped gonads, with Group V exhibiting a faster growth rate compared to Group N (Table 2). Additionally, there were significant differences in the ratios of caudal peduncle length to caudal peduncle width (CPL/CPW), body length to body depth (BL/BD), caudal peduncle length to body length (CPL/BL), as well as fullness, between Group V and Group N (Table 2). These indicators collectively demonstrate that large yellow croaker cultured in boats possess a longer body compared to those reared in cages. To provide readers with a more intuitive understanding of the differences in these data, we selected one fish from each of the three groups as representatives (Figure 2).

3.2. Phylogenetic Analysis of Ligand Sequences

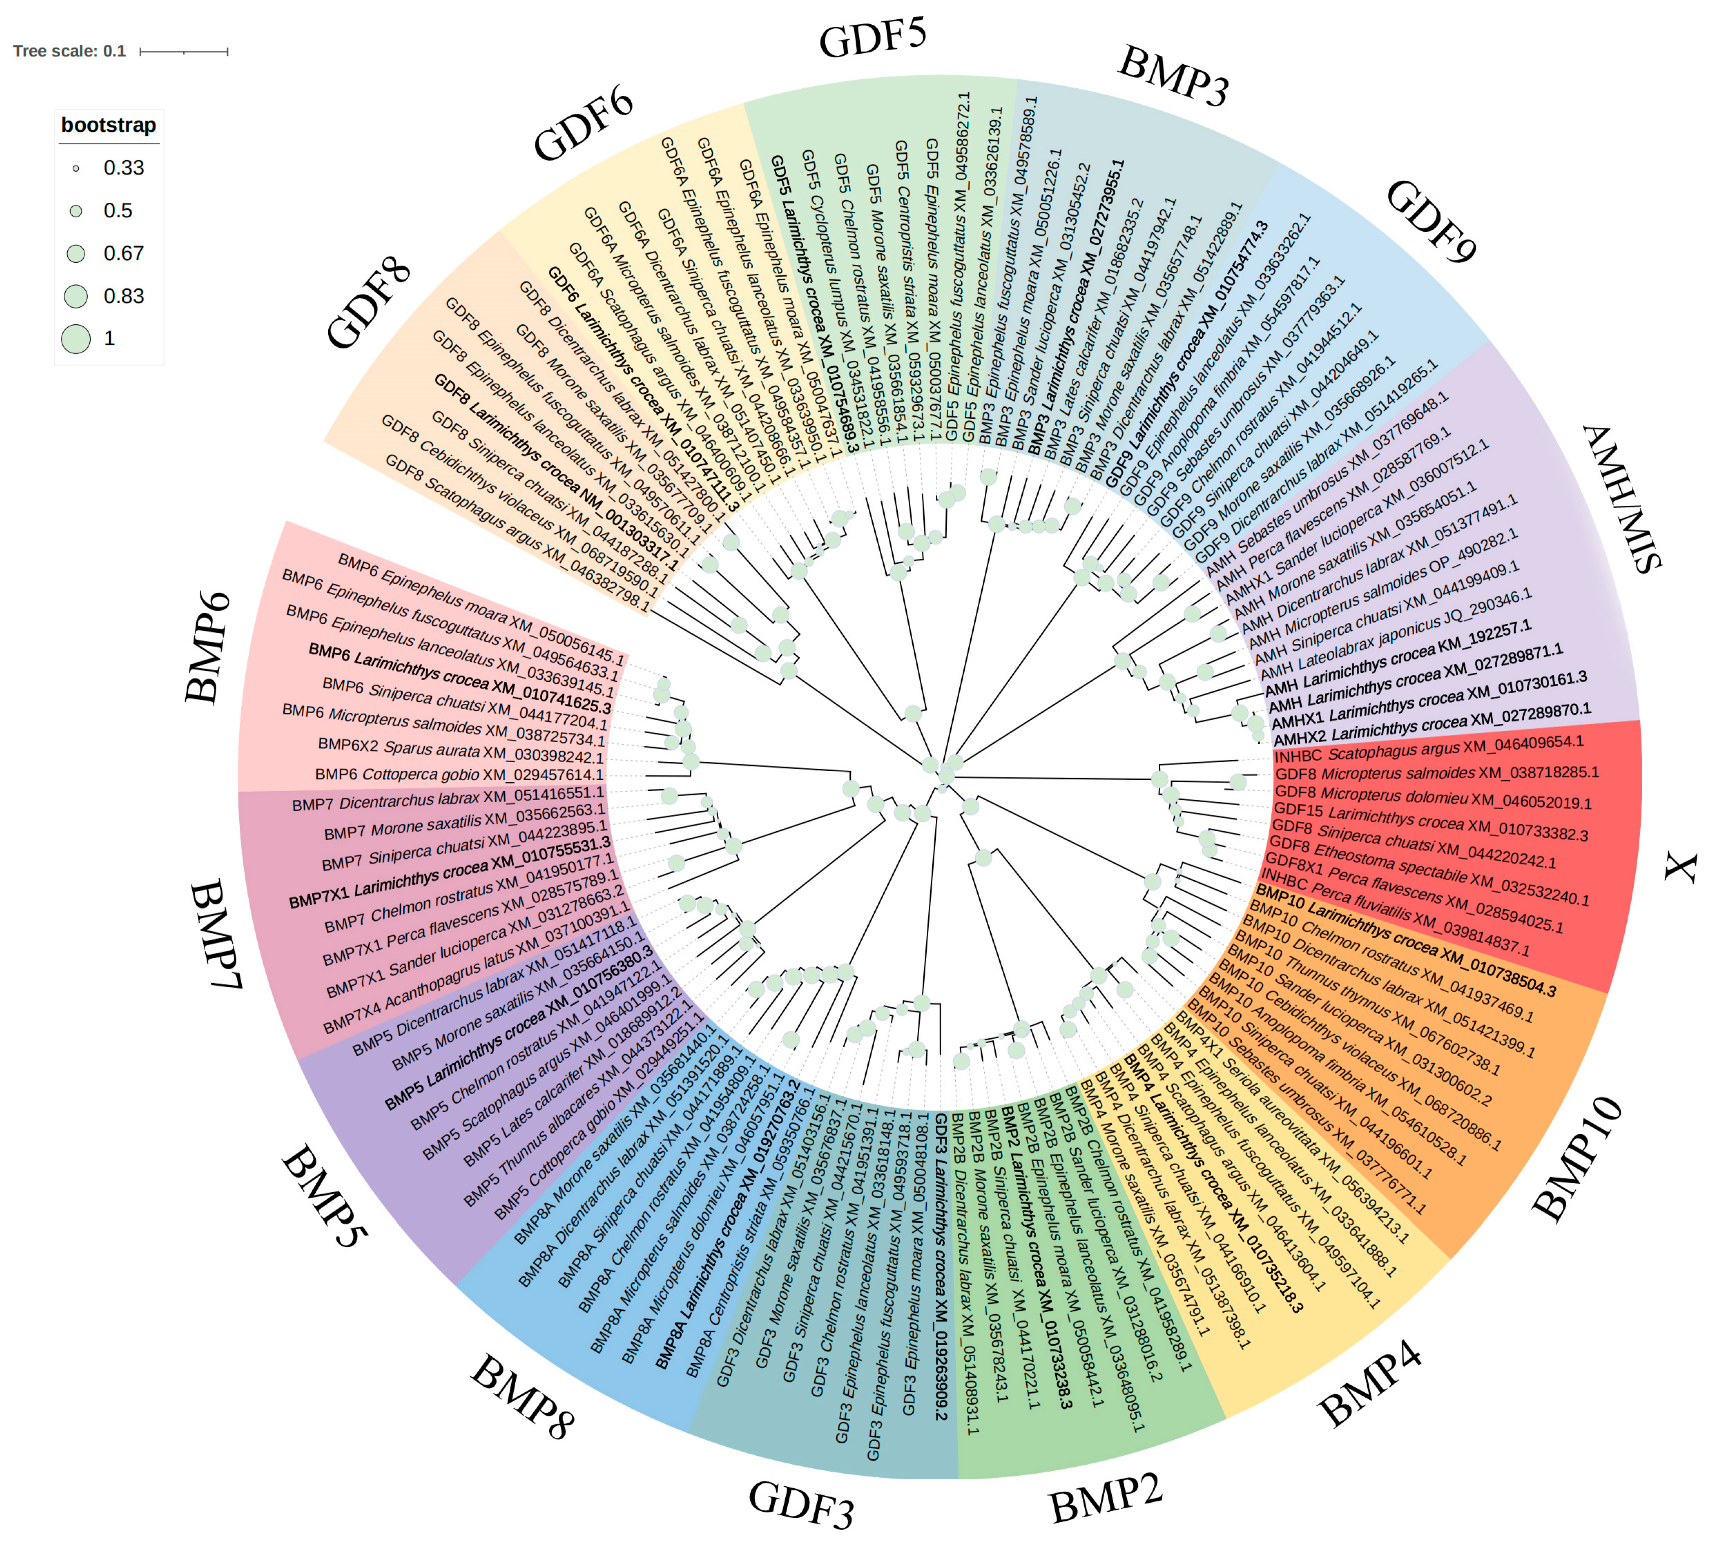
The variety and quantity of ligands are illustrated in Figure 3 and Figure 4. The NCBI contains 24 ligand entries, which are categorized into 21 classes. Notably, GDF15 from Larimichthys crocea (XM_010733382.3) does not cluster with other GDF species in the phylogenetic tree but shows a closer relationship to GDF8 (Figure 4). Except for AMH/MIS (Anti-Mullerian Hormone/Muellerian-inhibiting substance), which has four subtypes, each of the remaining 20 classes of ligands has one subtype. In Larimichthys crocea, the definitive ligand types include GDF8 (Growth Differentiation Factor 8), GDF6/BMP13 (Growth Differentiation Factor 6/Bone Morphogenetic Protein 13), GDF5/BMP14 (Growth Differentiation Factor 5/Bone Morphogenetic Protein 14), BMP3 (Bone Morphogenetic Protein 3), GDF9 (Growth Differentiation Factor 9), AMH, BMP10 (Bone Morphogenetic Protein 10), BMP4/BMP2B (Bone Morphogenetic Protein 4/Bone Morphogenetic Protein 2B), BMP2/BMP2A (Bone Morphogenetic Protein 2/Bone Morphogenetic Protein 2A), GDF3 (Growth Differentiation Factor 3), BMP8/BMP8B (Bone Morphogenetic Protein 8/Bone Morphogenetic Protein 8B), BMP5 (Bone Morphogenetic Protein 5), BMP7 (Bone Morphogenetic Protein 7), BMP6 (Bone Morphogenetic Protein 6), NDR2 (Nodal-related 2), INHBB/Activin B (Inhibin Subunit Beta B/Activin Beta-B Chain), INHBA/Activin A (Inhibin Subunit Beta A/Activin Beta-A Chain), TGFB1 (Transforming Growth Factor Beta 1), TGFB2 (Transforming Growth Factor Beta 2), and TGFB3 (Transforming Growth Factor Beta 3).

3.3. Phylogenetic Analysis of Receptors

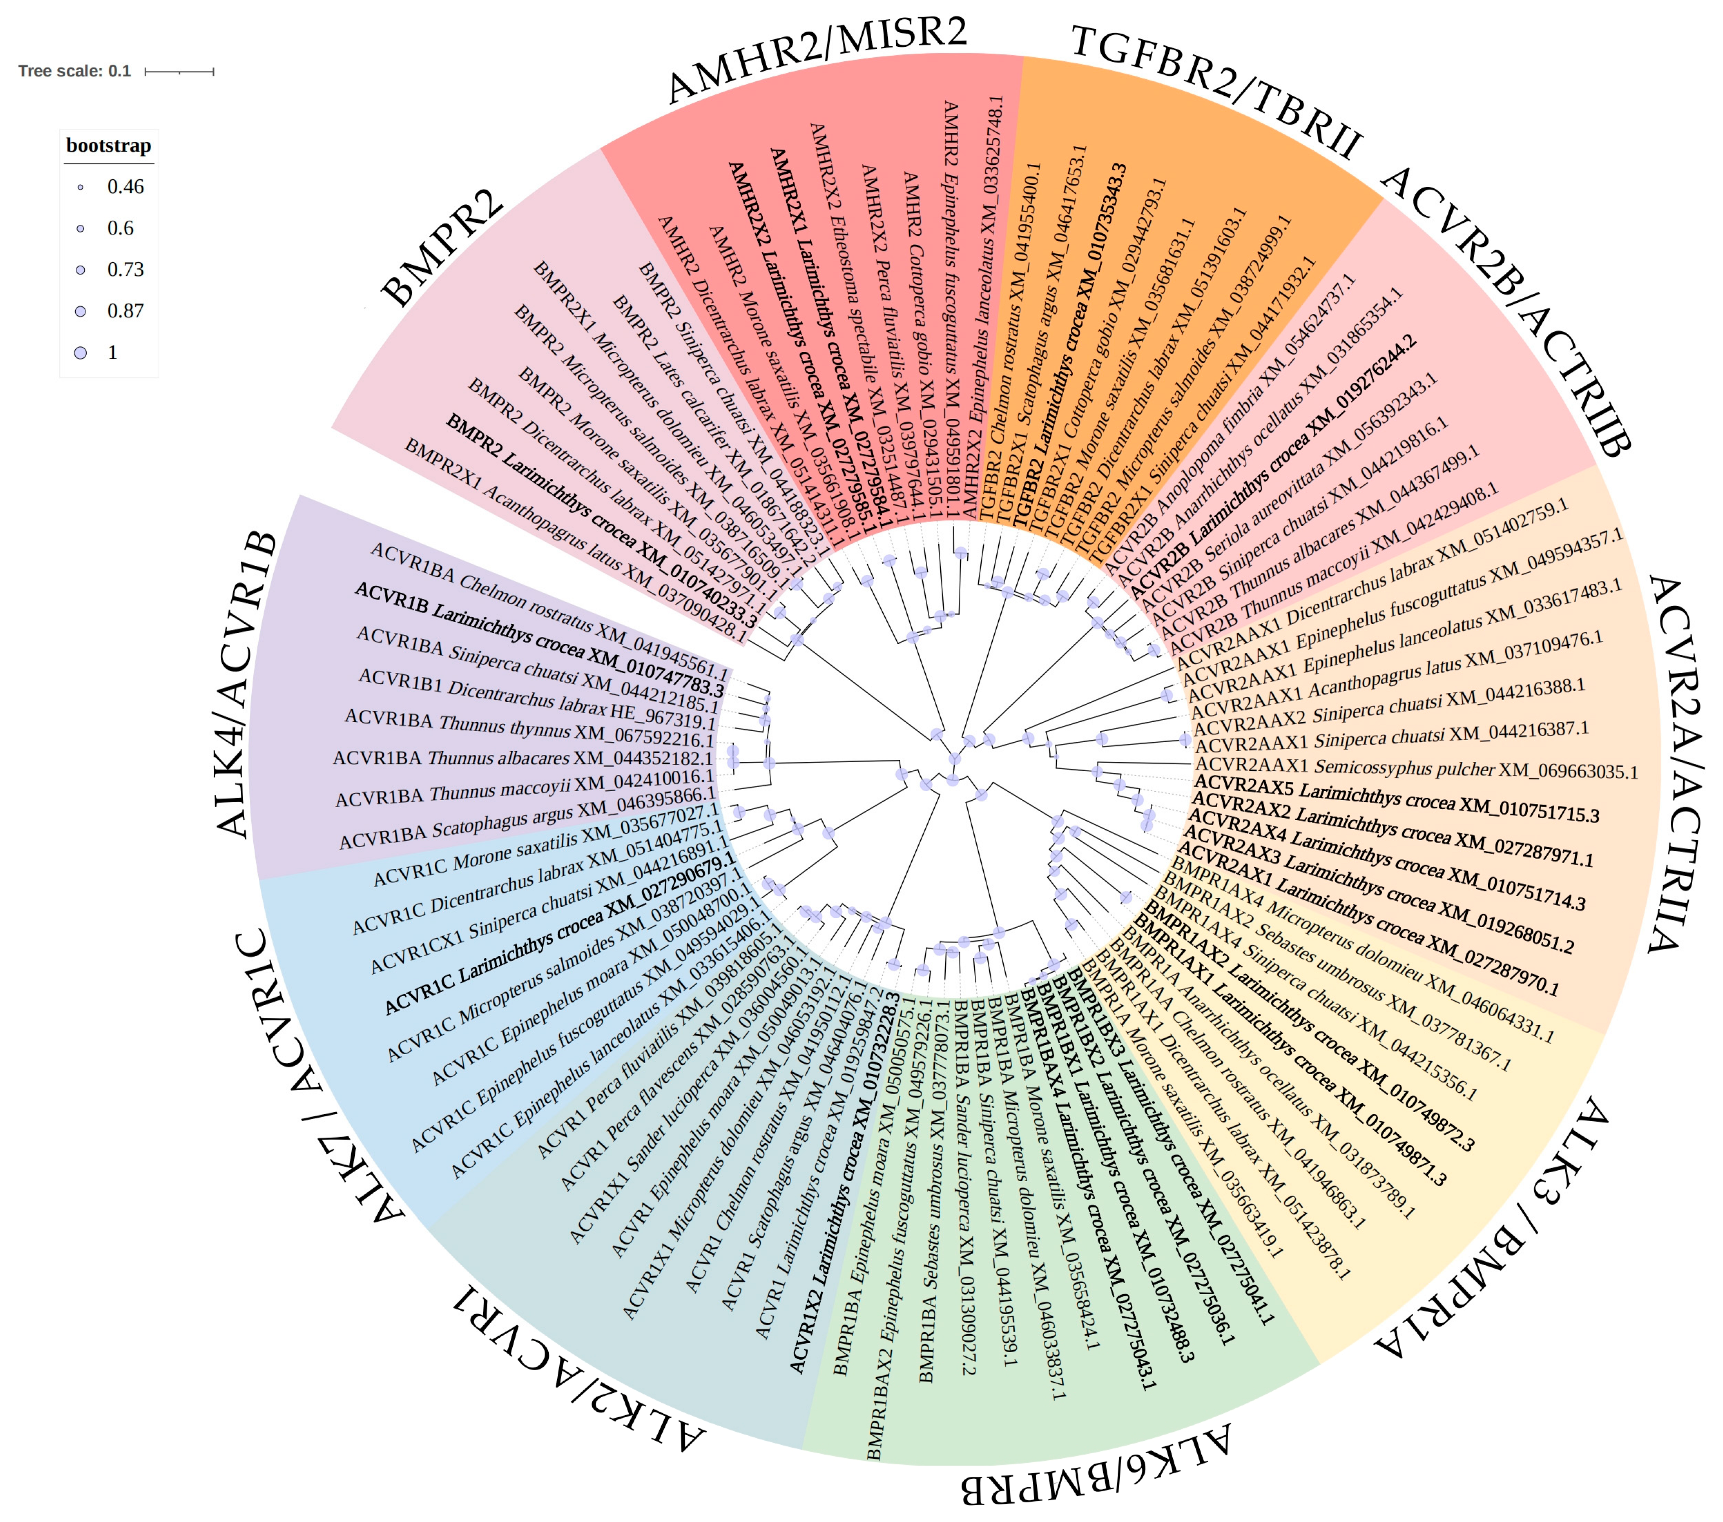
Upon examining the receptor phylogenetic tree in Figure 5, it is evident that the 19 nucleotide sequence entries for receptors in Larimichthys crocea available in Genebank can be categorized into 10 distinct groups. These include five type I receptors: ALk3/BMPR1A (Activin Receptor-Like Kinase 3/Bone Morphogenetic Protein Receptor Type 1A), ALK6/BMPR1B (Activin Receptor-Like Kinase 6/Bone Morphogenetic Protein Receptor Type 1B), ALK2/ACVR1 (Activin Receptor-Like Kinase 2/Activin A Receptor Type 1), ALK4/ACVR1B (Activin Receptor-Like Kinase 4/Activin A Receptor Type 1B), and ALK7/ACVR1C (Activin Receptor-Like Kinase 7/Activin A Receptor Type 1C). Additionally, there are five type II receptors: ACVR2A/ACTRIIA (Activin A Receptor Type 2A/Activin Receptor Type-2A), ACVR2B/ACTRIIB (Activin A Receptor Type 2B/Activin Receptor Type-2B), TGFBR2/TBRII (Transforming Growth Factor Beta Receptor 2), BMPR2 (Bone Morphogenetic Protein Receptor Type 2), and AMHR2/MISR2 (Anti-Mullerian Hormone Receptor Type 2/Muellerian-inhibiting substance Receptor Type 2). Notably, within some of these categories, different subtypes exist in Larimichthys crocea. For instance, AMHR2 has two subtypes (AMHR2 × 1 and AMHR2 × 2), ACVR2A has five subtypes (ACVR2AX1, ACVR2AX2, ACVR2AX3, ACVR2AX4, and ACVR2AX5), BMPR1A has two subtypes (BMPR1AX1 and BMPR1AX2), and BMPR1B has four subtypes (BMPR1BX1, BMPR1BX2, BMPR1BX3, and BMPR1BX4).

3.4. Phylogenetic Analysis of R-Smads

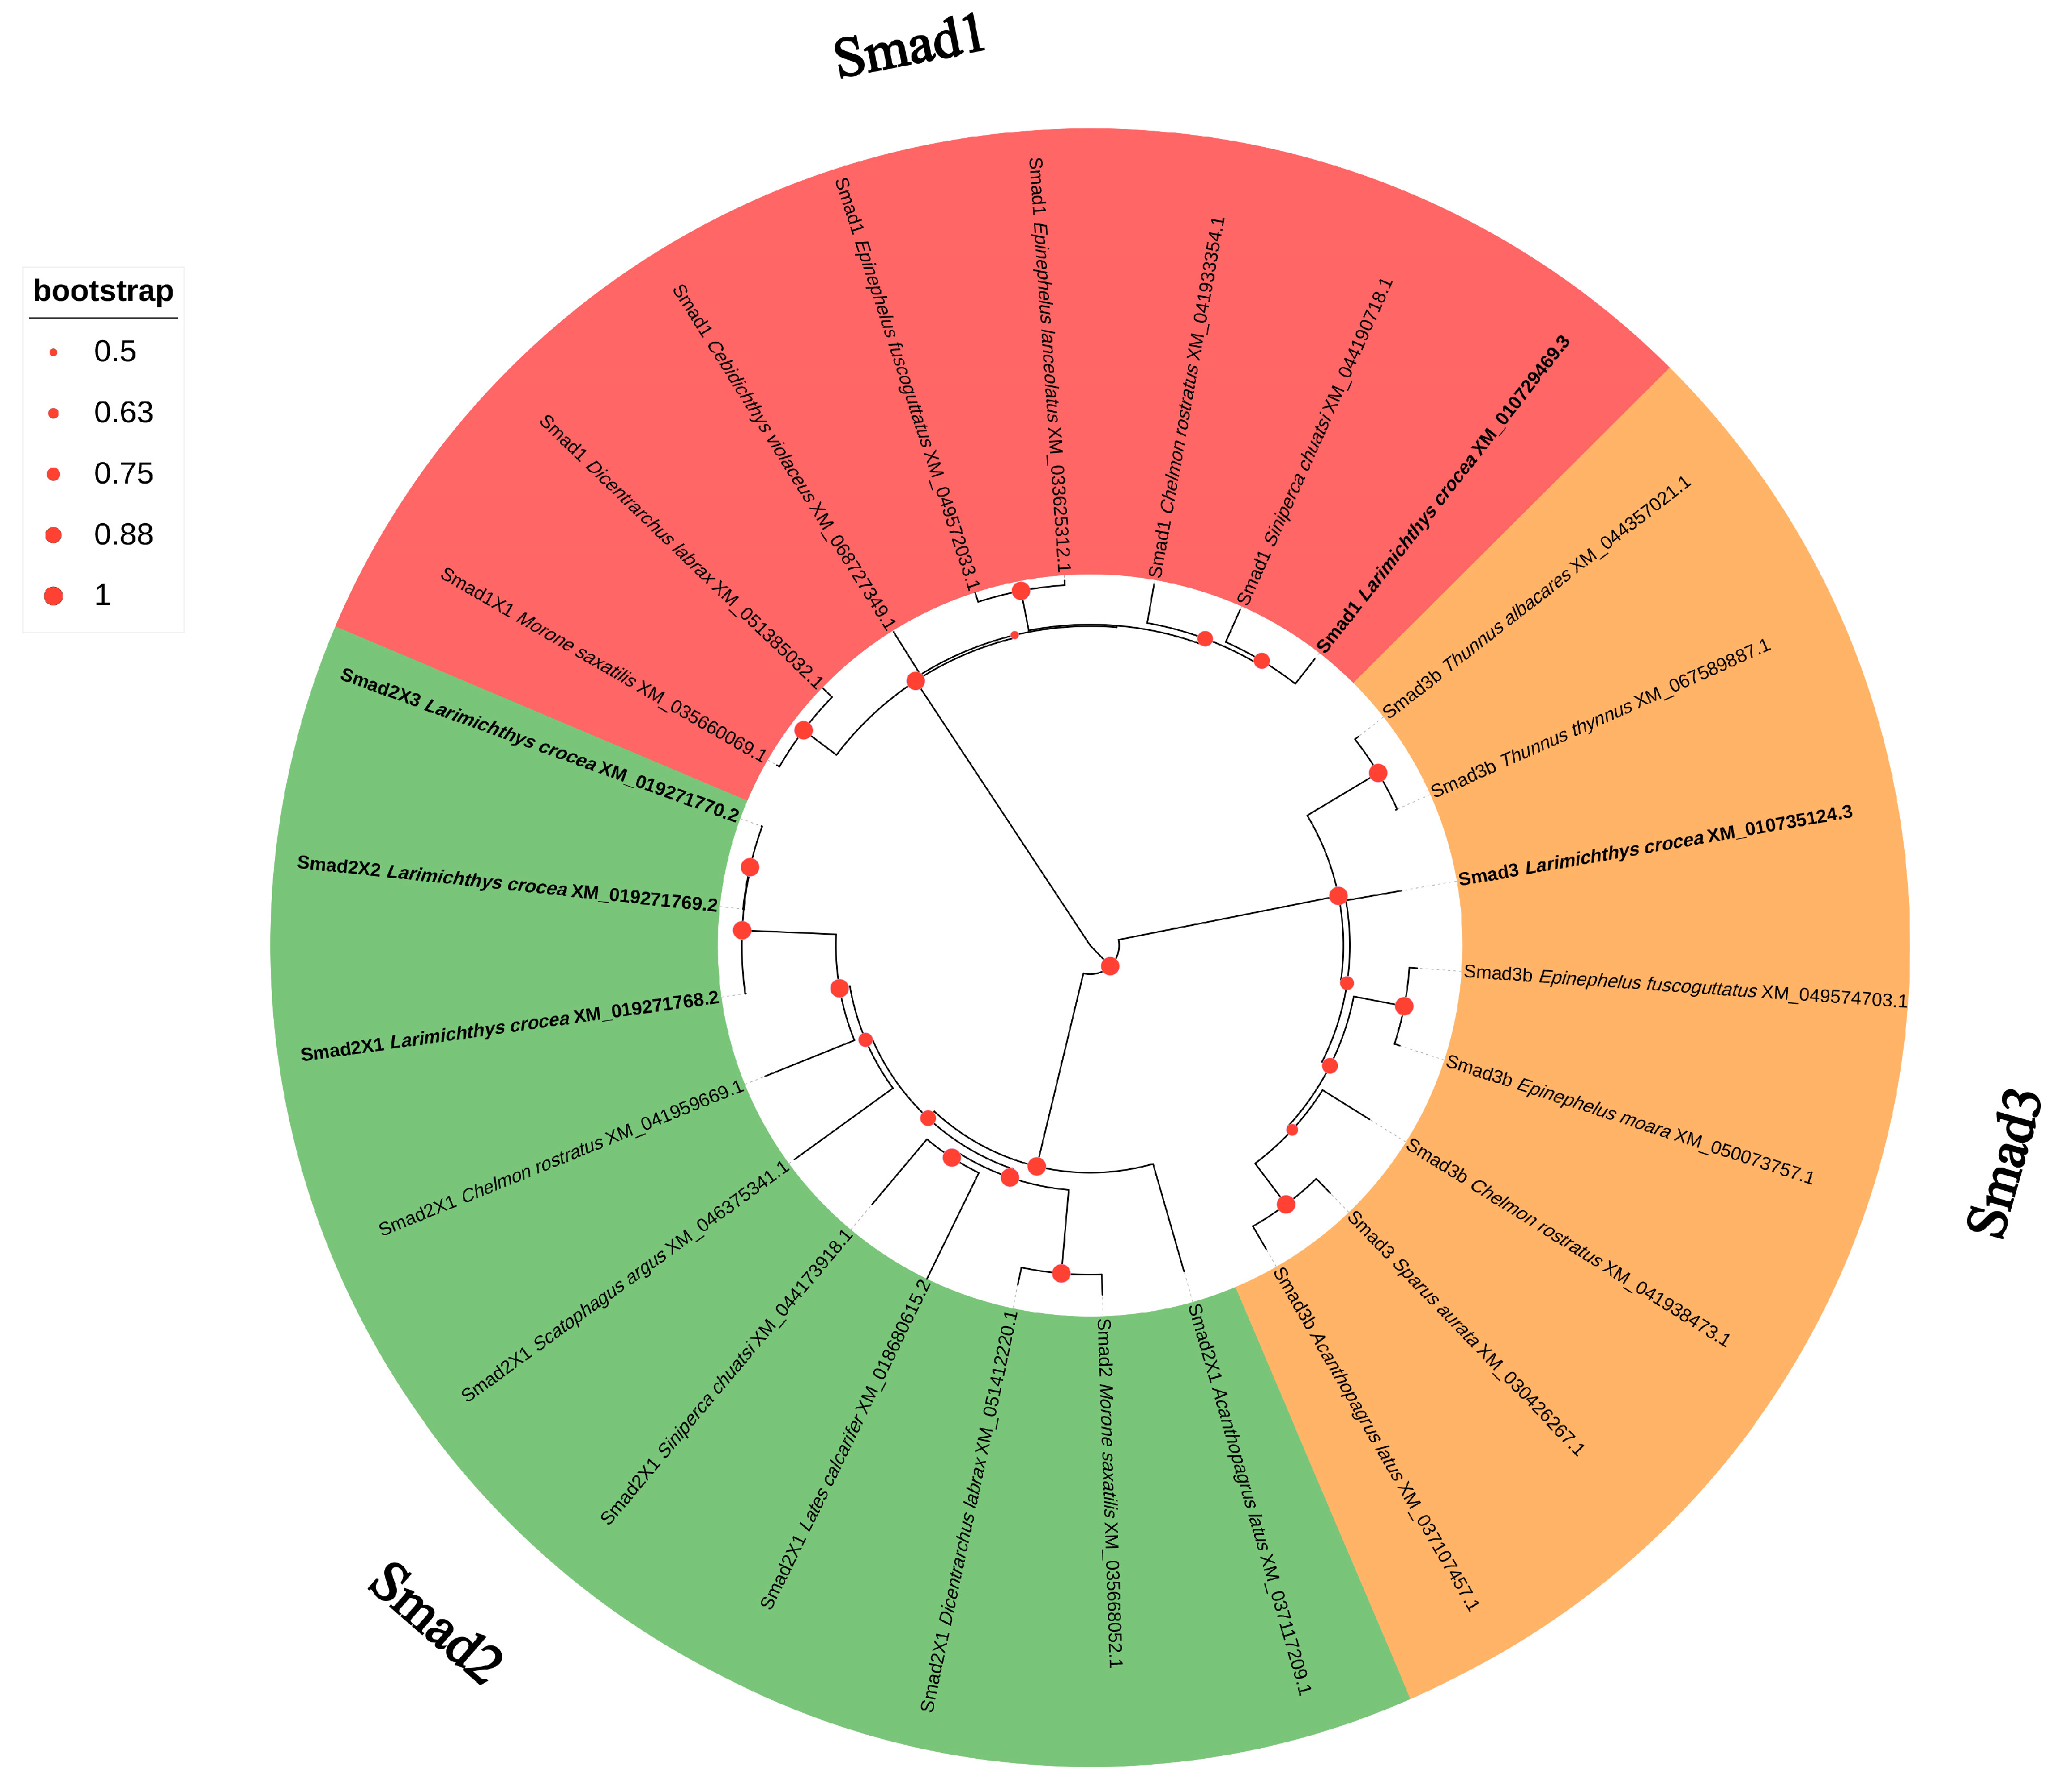
In the phylogenetic tree depicted in Figure 6, the nucleotide acid sequences of each type of R-Smad grouped together. The five Smad genes identified in L. crocea were categorized into three classes: Smad1, Smad2, and Smad3. Among them, Smad2 comprises three distinct subtypes, namely Smad2 × 1, Smad2 × 2, and Smad2 × 3. In large yellow croaker, Smad5 and Smad8 were not identified, despite their belonging to the R-Smads family and primarily responding to BMP signals.

3.5. mRNA Levels of Ligands

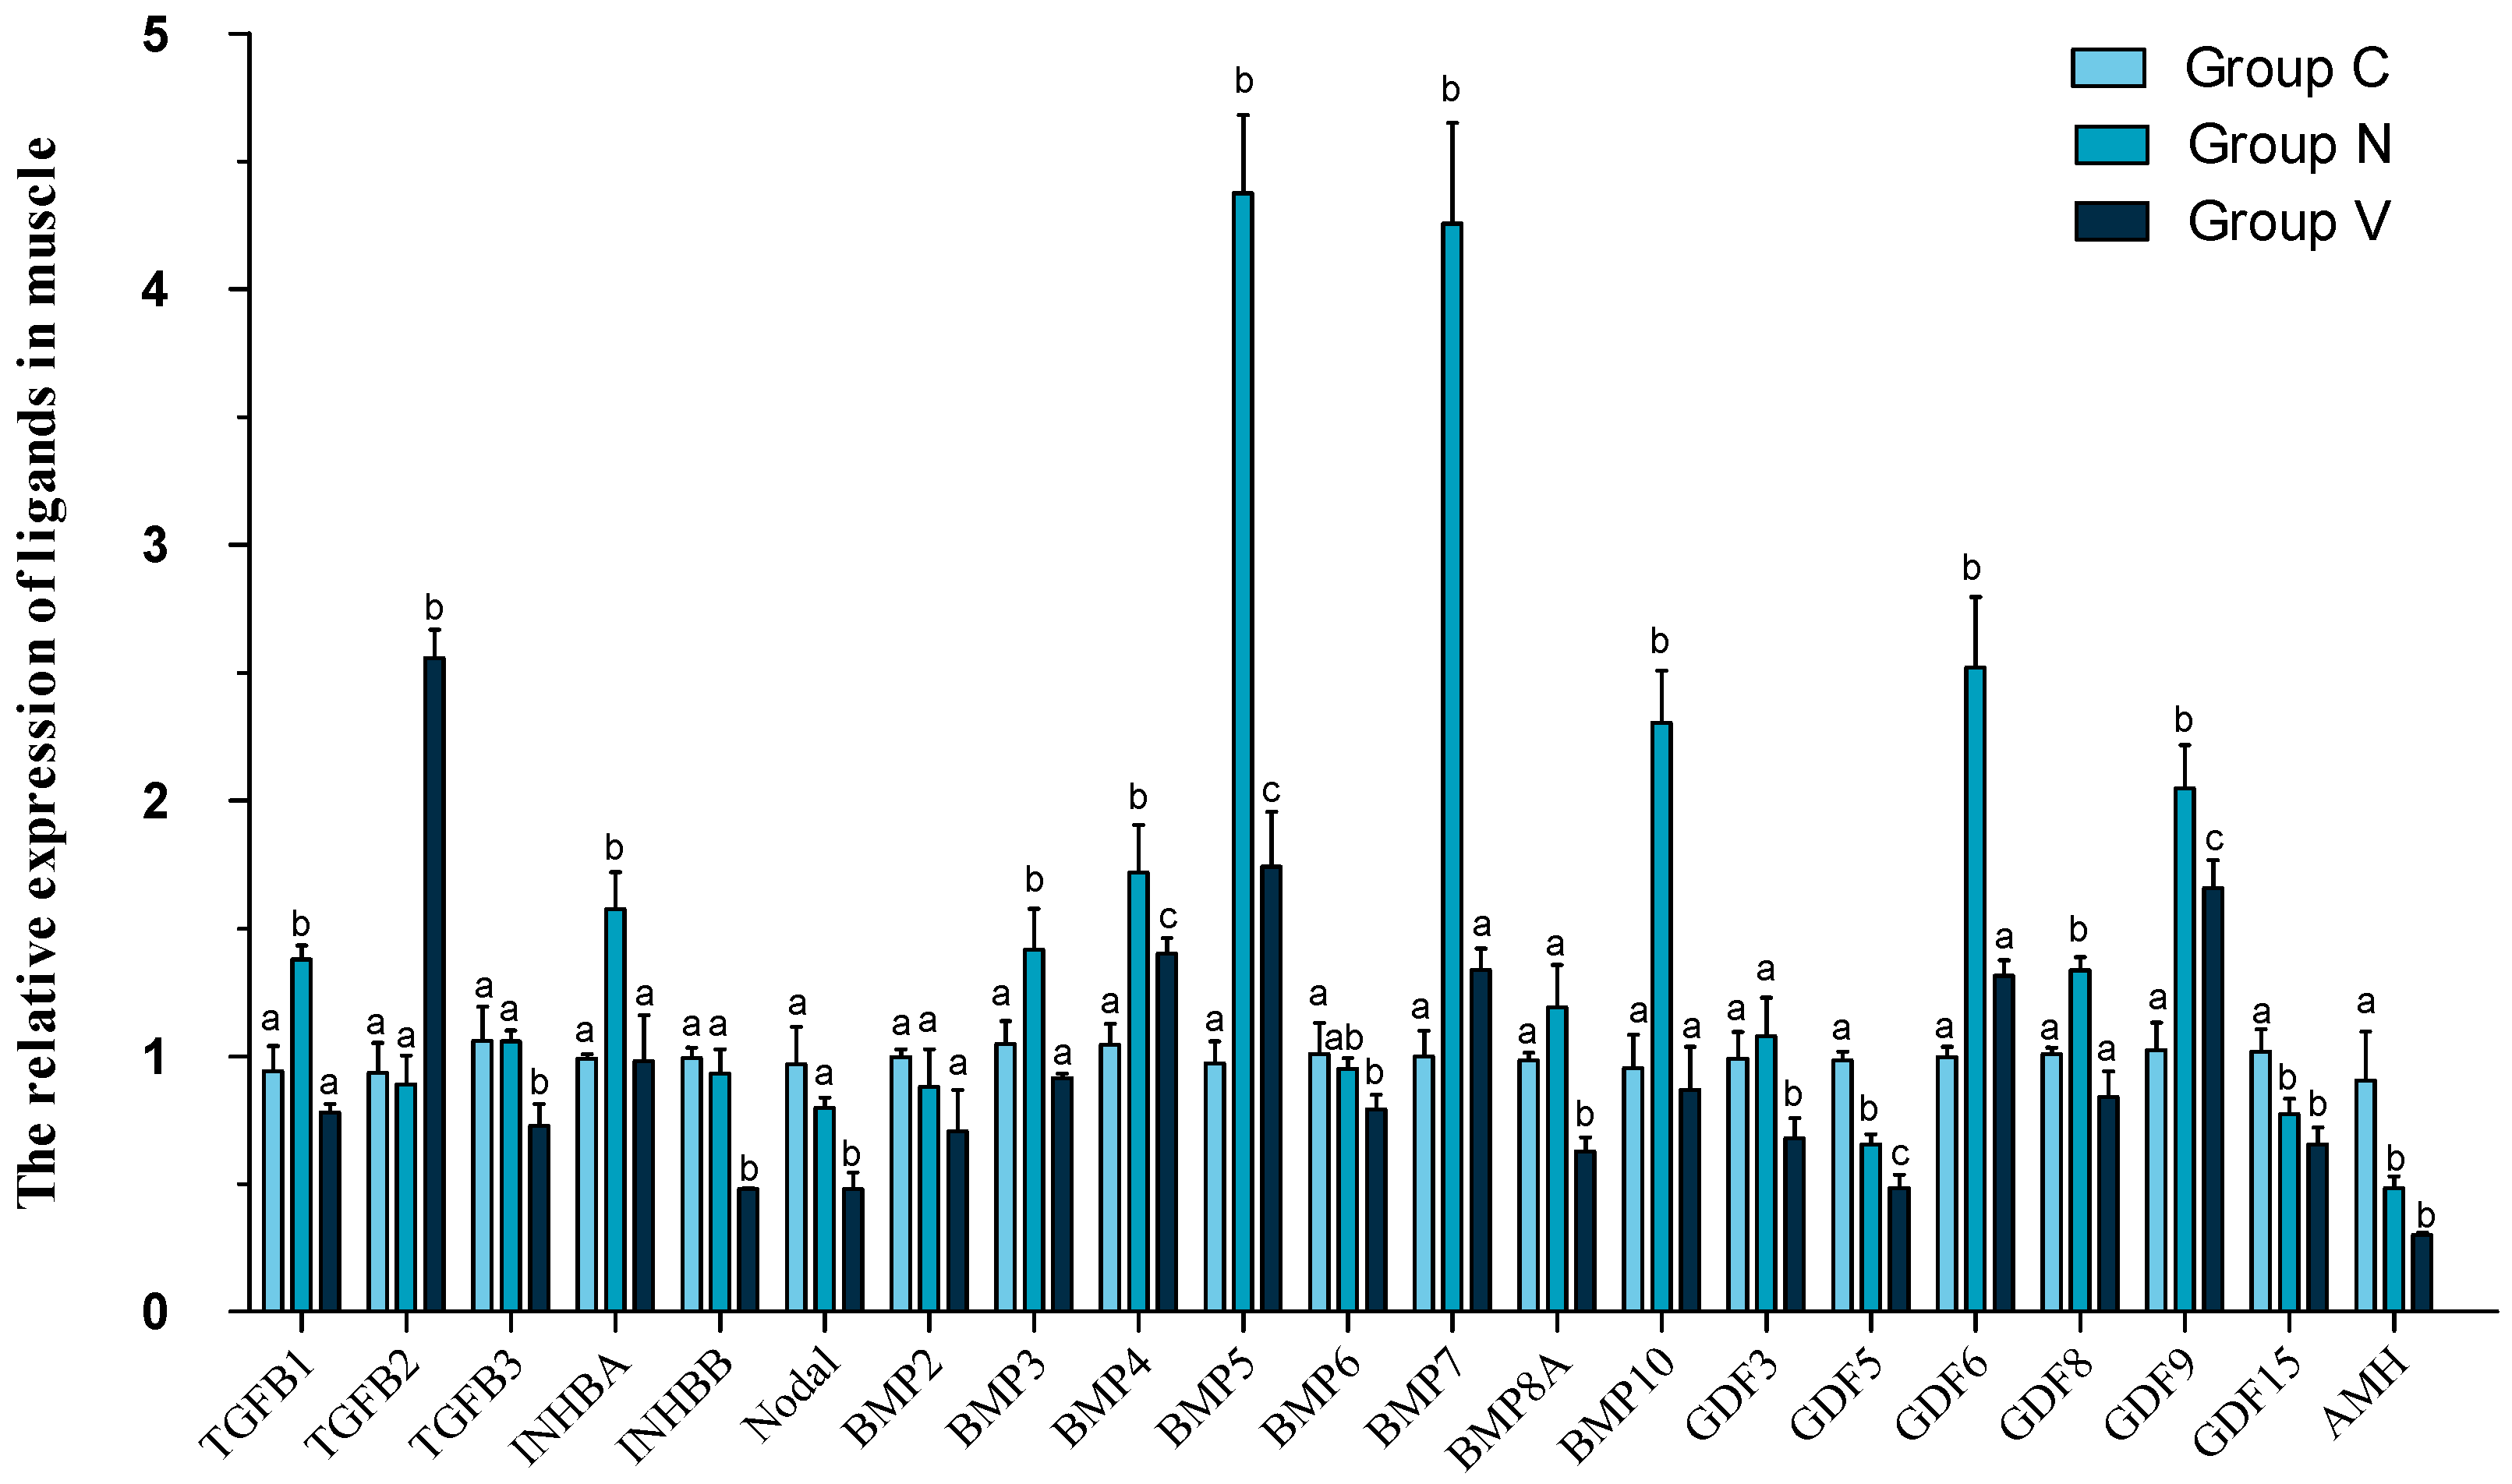
The expression profiles of ligands in the liver of large yellow croaker are illustrated in Figure 7. Specifically, the expression levels of TGFB2, BMP6, and GDF9 were significantly upregulated in both Group N and Group V. In contrast, ligands such as TGFB1, BMP3, BMP4, BMP10, and GDF5 exhibited decreased expression in Group N but increased expression in Group V. Additionally, ligands including TGFB3, INHBA, Nodal, BMP8A, and GDF8 showed no significant change in expression in Group N but were significantly upregulated in Group V. Conversely, GDF3, GDF15, and AMH displayed no significant difference in expression in Group V but were significantly downregulated in Group N. Notably, BMP5, BMP7, and GDF6 exhibited no significant differences in expression levels between Group N and Group V. However, in muscle tissue (Figure 8), we observed a completely different pattern of ligand expression, with one notable exception: GDF9. For instance, the expression level of TGFB2 showed no significant difference in Group N but was significantly upregulated in Group V. Interestingly, BMP4, BMP5, and AMH were the ligands that exhibited significant increases in expression levels in both Group N and Group V. These findings suggest that the expression of ligands in muscle tissue may be regulated by different mechanisms compared to those in liver tissue.

3.6. mRNA Levels of Receptors

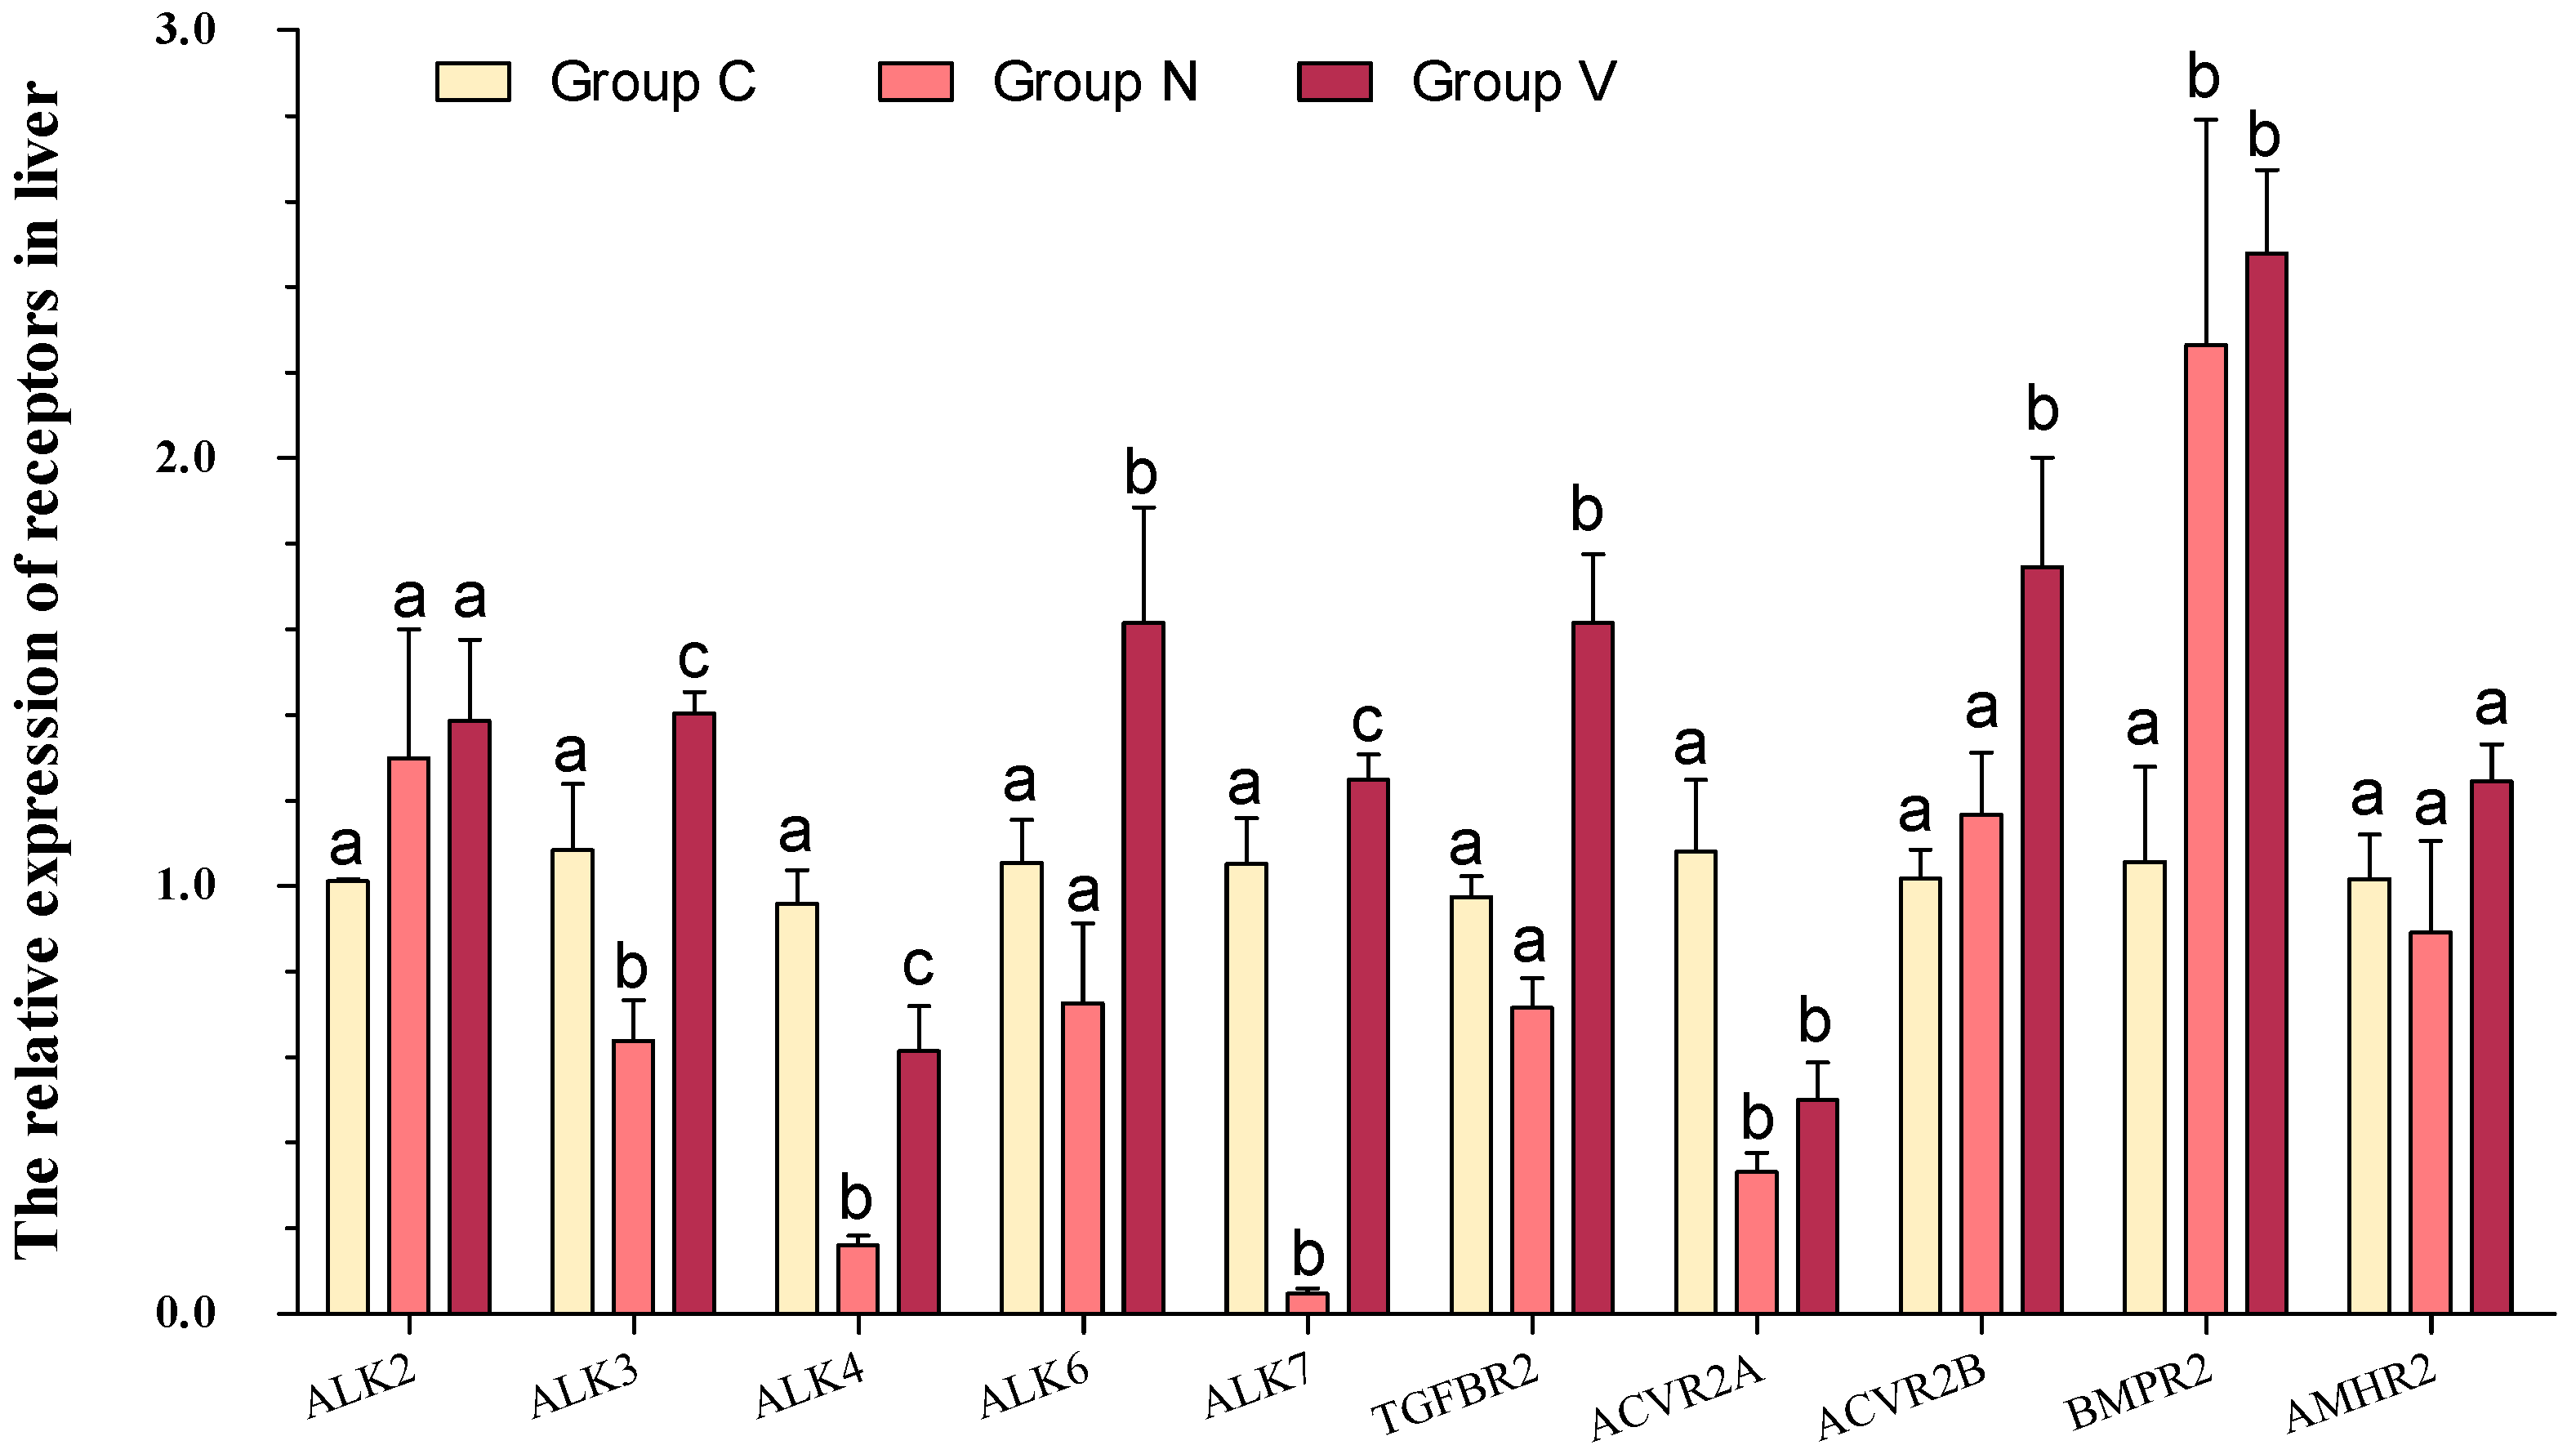
The expression levels of ligands in the liver of large yellow croaker are depicted in Figure 9. Specifically, ALK2 and AMHR2 exhibited no significant differences in expression between Group N and Group V. In contrast, the expression of ALK3 and ALK7 decreased in Group N but increased in Group V. Both ALK4 and ACVR2A showed significant decreases in expression in both groups. Among the remaining three receptors (ALK6, TGFBR2, and ACVR2B), there were no significant differences in expression in Group N, but significant increases were observed in Group V. Notably, except for ALK4, the mRNA expression trends of these receptors in muscle tissue differed from those in liver tissue (Figure 9). In muscle, ALK6 showed no significant difference in expression between Group N and Group V. There were no ligands that exhibited decreased expression in Group N and increased expression in Group V. However, the expression of ALK4 significantly decreased in both groups in muscle. Conversely, the expression of ALK7, TGFBR2, and ACVR2B significantly increased in both Group N and Group V in muscle (Figure 10).

3.7. mRNA Levels of R-Smads

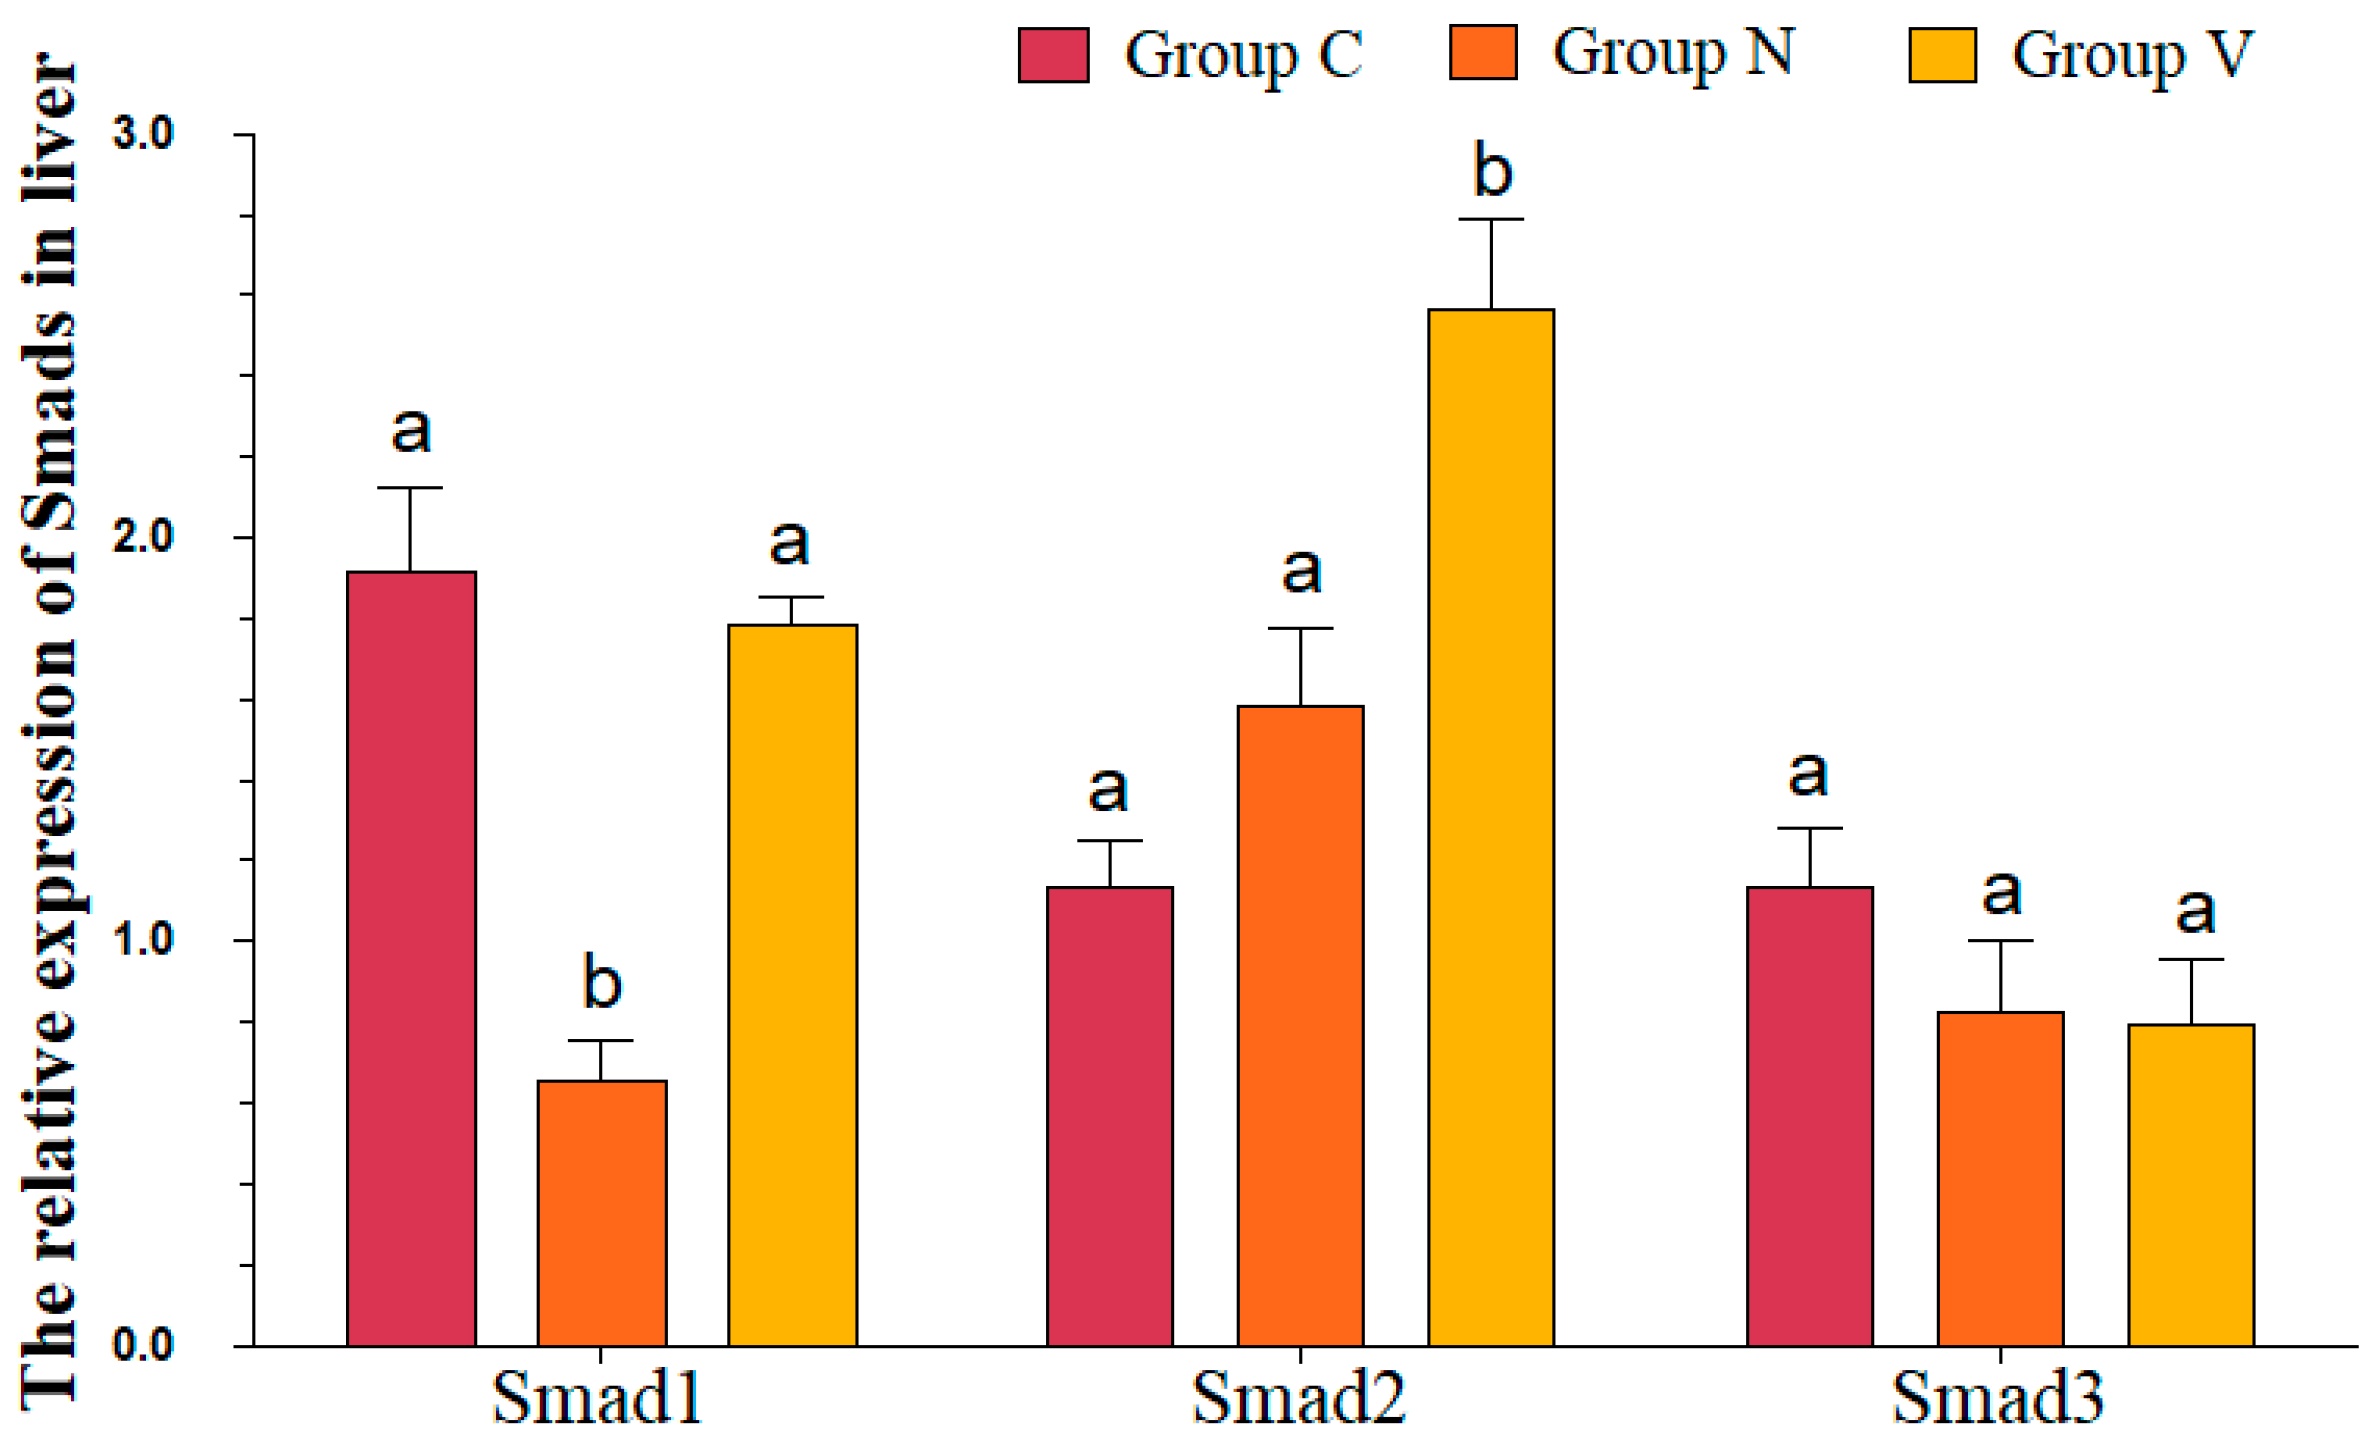
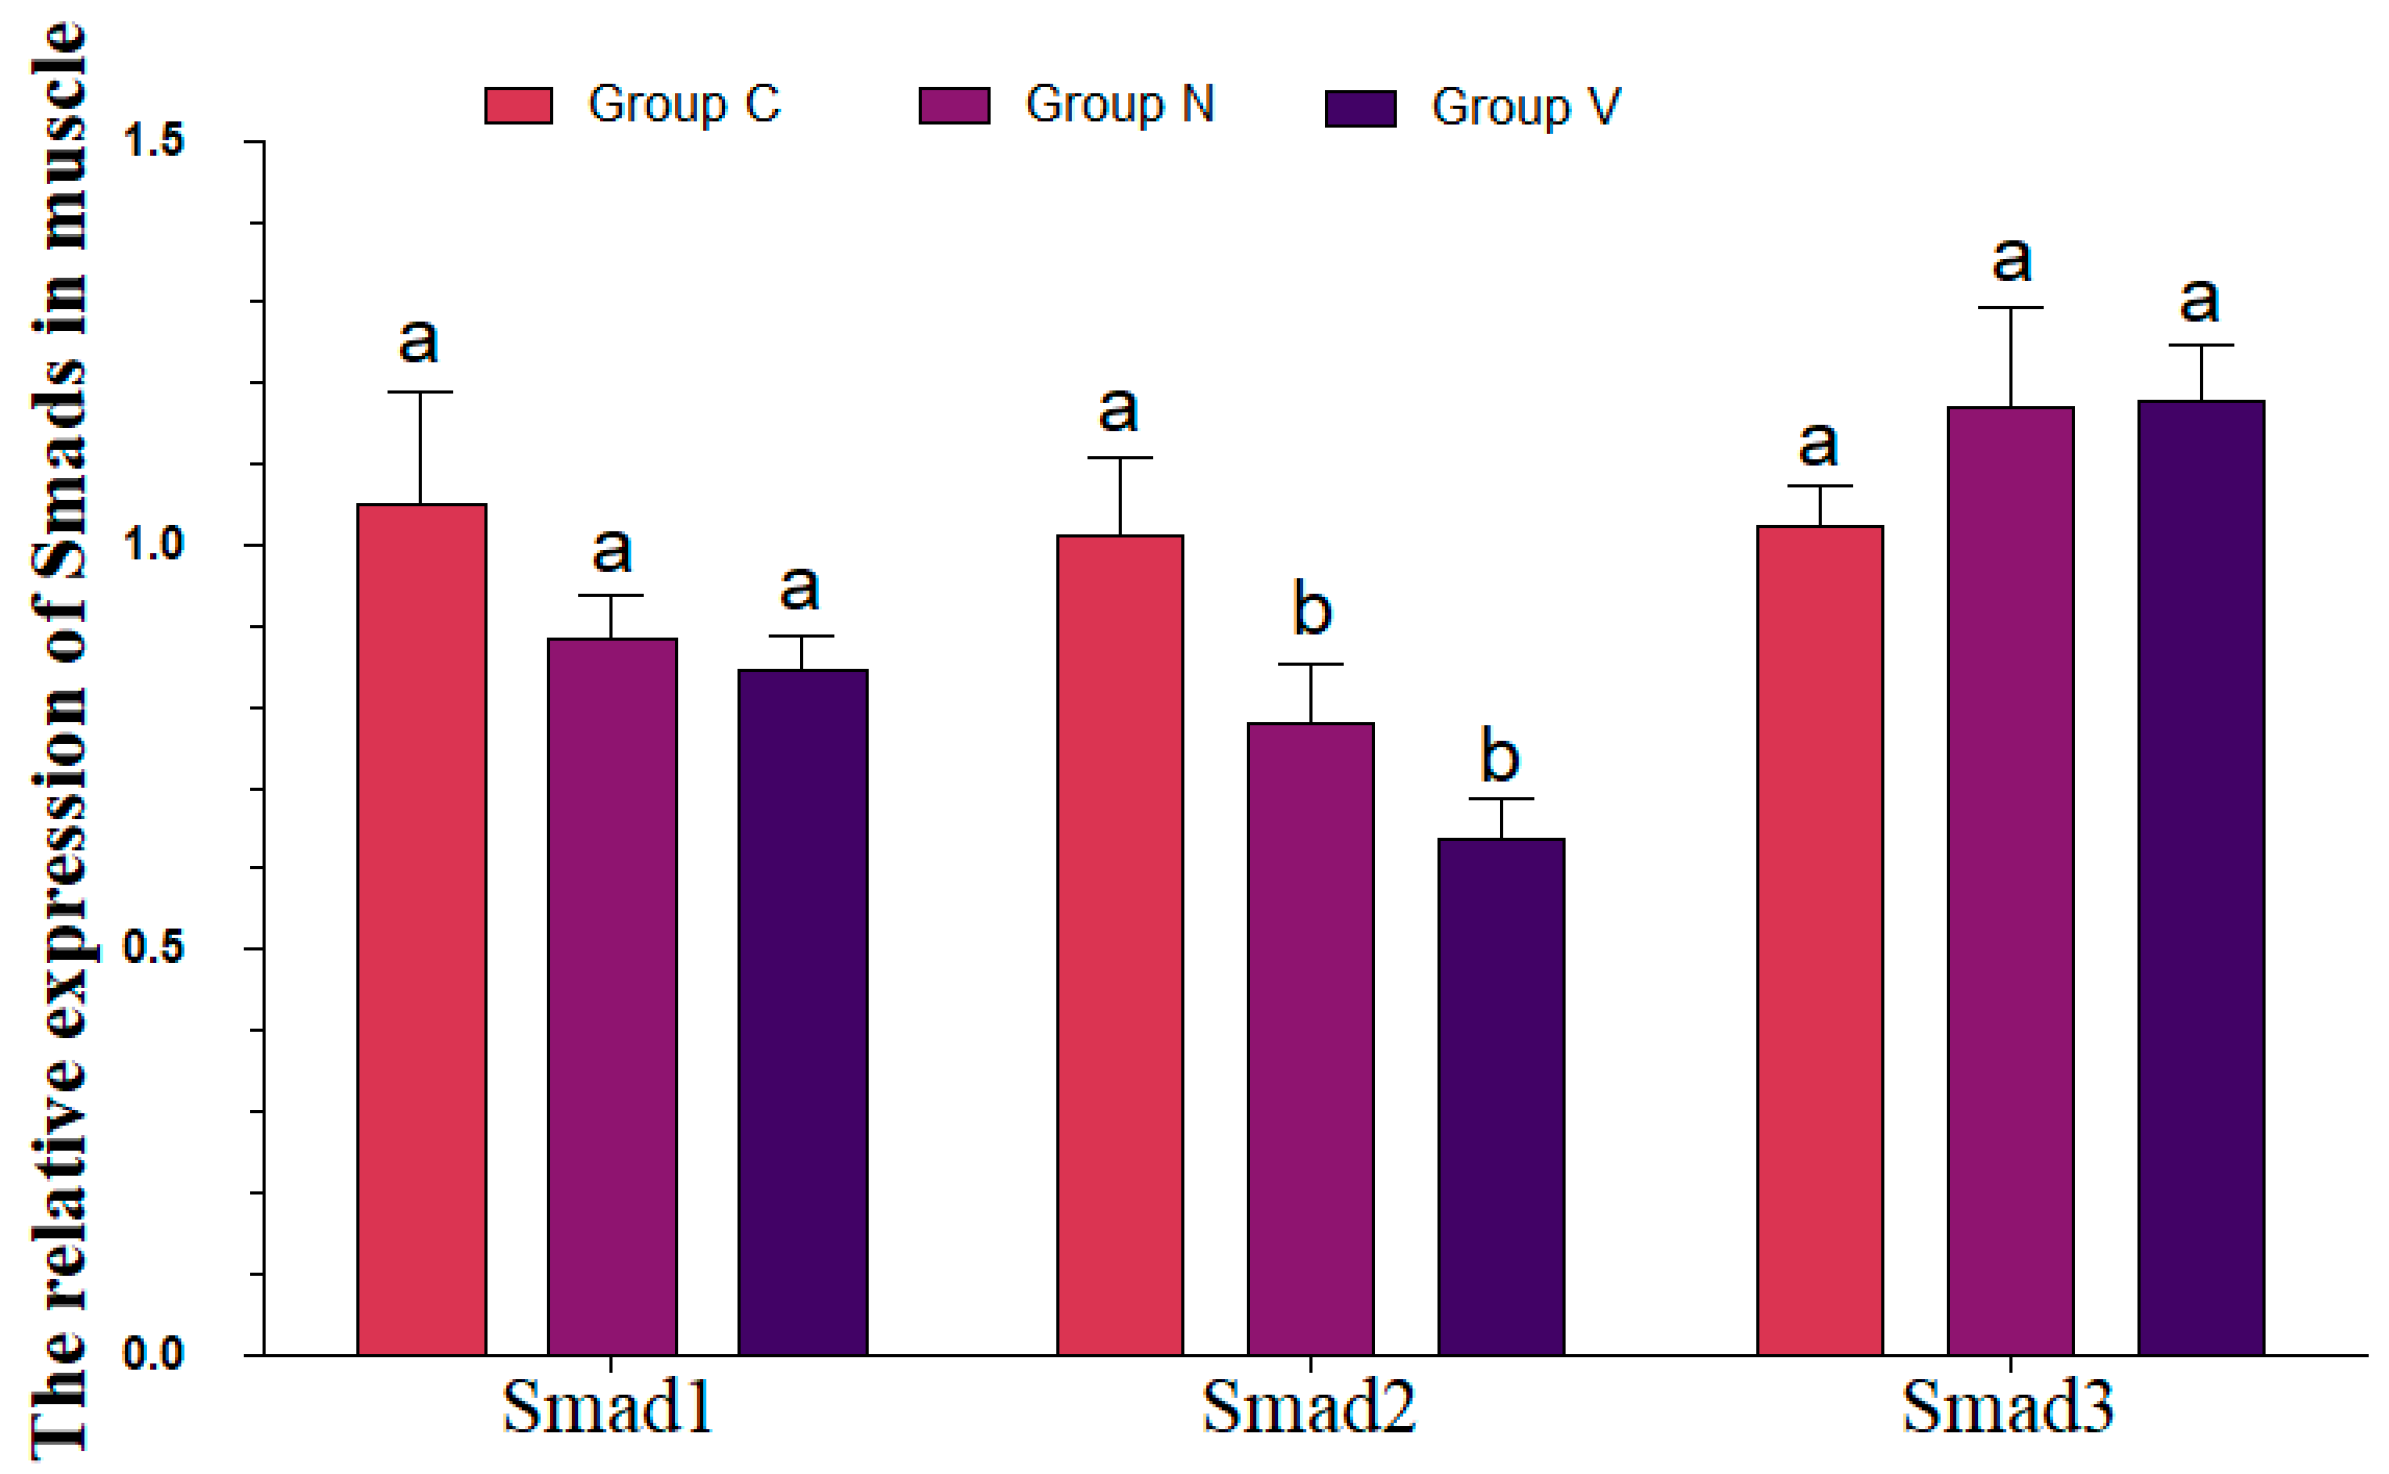
Figure 11 and Figure 12 respectively reveal the expression patterns of R-Smads in the liver and muscle tissues of large yellow croaker. Specifically, in these two tissues, no significant changes in Smad3 expression levels were observed between the experimental groups and the control group, nor were there any notable differences in Smad3 expression between the two experimental groups. As for Smad1 and Smad2, their expression patterns in Group N exhibited distinct trends in liver and muscle tissues. In the liver, the expression of these two genes differed from that of the control group, while no similar differences were found in muscle tissue; conversely, those that showed significant differences compared to the control group in muscle did not display differences in the liver. This result indicates that the expression of Smad1 and Smad2 in Group N is regulated in a tissue-specific manner. In Group V, however, the expression of Smad1 and Smad2 appears to be unaffected by the type of tissue used in the experiment, i.e., their expression patterns remained consistent in both tissues, without showing inter-tissue variability. In summary, the expression of Smad3 among R-Smads in large yellow croaker is relatively stable across different treatments and tissues, while the expression of Smad1 and Smad2 exhibits tissue-specific variation patterns under different treatments.

4. Discussion

In contrast to the slender build of wild large yellow croaker, the cultured variety tends to have a more rounded appearance [28]. This morphological difference is relevant, as fish with a more slender body shape demonstrate superior swimming abilities, greater foraging efficiency, and a greater ability to escape predators [29]. Furthermore, consumer preference for individuals with a more slender appearance significantly influences the market value of the species [10]. In this context, a 120-day culture experiment revealed that yellow croaker raised on an industrial vessel exhibited faster growth and a more slender body shape compared to those raised in conventional cages. This faster growth is attributed, in part, to the vessel’s advanced aquaculture system, which performs forced and continuous exchanges between tank water and external seawater, promoting constant renewal and ensuring better environmental conditions. Furthermore, the vessel is equipped with a deep-water intake device, ensuring the supply of water with ideal temperature and salinity for the species’ cultivation, which helps maintain Larimichthys crocea in optimal growth conditions [30]. The authors suggest that the active swimming behavior and schooling tendency of large yellow croakers cultivated in the onboard system, characteristics similar to those of wild populations, are determining factors in the development of a more slender body shape.
Based on numerous studies addressing the specificity of interactions between ligands, receptors, and R-Smads of the TGFβ superfamily [22,31,32,33,34], as well as the author’s previous experience characterizing TGFβ signaling pathways in marine species such as the sea cucumber (Apostichopus japonicus) [35] and the Pacific oyster (Crassostrea gigas) [36], it was possible to identify and analyze corresponding genes in the genome of the yellow croaker. This analysis was based on both records of related nucleotide sequences (Figure 3, Figure 4, Figure 5 and Figure 6) and the mRNA expression levels of these (Figure 7, Figure 8, Figure 9, Figure 10, Figure 11 and Figure 12) in the genome of L.crocea. The ligand–receptor–R-Smad correspondence for L. crocea is summarised in Table 3. In the TGFβ/activin/Nodal subfamily, the following components were found: ligands (INHBA, INHBB, and Nodal), type I receptors (ALK4 and ALK7), type II receptors (ACVR2A and ACVR2B), and R-Smads (Smad2 and Smad23). On the other hand, analysis of the BMP/GDF/AMH subfamily revealed a greater diversity of components, including ligands (BMP2, BMP4, BMP5, BMP6, BMP7, BMP8A, GDF3, GDF5, GDF6, GDF8, GDF9 and AMH), type I receptors (ALK2, ALK3, ALK4, ALK6 and ALK7), type II receptors (ACVR2A, ACVR2B, BMPR2 and AMHR2) and R-Smads (Smad1, Smad2 and Smad3). In Table 3, we list the family members that present complete signaling pathways, with all essential elements identified. Additionally, the nucleotide and amino acid sequences corresponding to the TGFB1, TGFB2, and TGFB3 genes were detected in the L. crocea genome, and their mRNA expression levels were evaluated by RT-PCR under different culture conditions. However, when comparing the receptor types of TGFB1, TGFB2, and TGFB3 reported in the current literature [32,37,38,39,40,41], it was observed that none of them are present in the yellow croaker genome. Consequently, due to their incomplete signaling pathways, the TGFB1, TGFB2, and TGFB3 members were not included in Table 3.
Based on the promotion and inhibition effects observed in the experimental groups involving ligands, receptors, and R-Smads (Figure 7, Figure 8, Figure 9, Figure 10, Figure 11 and Figure 12), viable signaling pathways responsible for regulating growth and body shape in the tissues of the greater yellow croaker were identified. These pathways are detailed in Table 4 (liver) and Table 5 (muscle), encompassing a total of 11 pathways in liver and 5 pathways in muscle, all belonging to two subfamilies of the TGFβ superfamily. The reason for the lower number of viable signaling pathways in muscle compared to liver can be explained by differences in Smad1 mRNA expression levels. Specifically, the different rearing environments did not cause significant changes in Smad1 expression in muscle, resulting in a reduced number of viable pathways in this tissue. It is noteworthy that Smad1 is the only R-Smad functionally associated with multiple BMPs identified in the yellow croaker, playing a central role in complex formation with Co-Smad (Smad4) for subsequent translocation to the nucleus and regulation of gene expression [42,43]. Interestingly, the five growth and body size regulation pathways detected in the muscle tissue of the yellow croaker are also present in the liver, suggesting a possible functional sharing between these tissues. However, it remains unclear whether these pathways maintain a similar regulatory pattern in other organs, such as the heart, spleen, kidney, intestine, gonads, and brain. This hypothesis requires further experimental investigation. In muscle group V, a suppression in the expression levels of components of the following three signaling pathways was observed: INHBB-ACVR2A-ALK4-Smad2, Nodal-ACVR2A-ALK4-Smad2, and GDF3-ACVR2A-ALK4-Smad2 (Figure 8, Figure 10 and Figure 12). The INHBB, Nodal, and GDF3 ligands bind to specific receptors to initiate signaling. The reduction in the expression of these ligands may compromise the efficiency of signal transduction [44,45]. The ACVR2A and ALK4 receptors are able to interact with these three ligands, thus activating signal transduction downstream of Smad2 [46]. The decrease in the levels of ACVR2A, ALK4, and Smad2 indicates a possible inhibition of the TGF-β signaling pathway in these cases [47]. On the other hand, the receptors ACVR2B and ALK7, which can also bind to the same ligands, showed elevated levels of expression. This suggests two possibilities: they may be transmitting signals from other, yet unidentified ligands in this context, or they may be acting compensatorily to compensate for the reduced function of ALK4 and ACVR2A under specific conditions [32,48].

5. Conclusions

In summary, this study identified the presence of 34 members of the TGFβ superfamily distributed across two subfamilies in the genome of yellow croaker (L. crocea). These findings suggest that these signaling molecules likely influence the regulation of growth rate and body shape in this species, acting through five distinct ligand–receptor–R-Smad signaling pathways. Among these pathways, the INHBB-, Nodal-, and GDF3-ACVR2A-ALK4-Smad2 signaling axis stands out, which was identified as playing a central role in modulating the aforementioned physiological traits and is, therefore, a potential key target for future interventions in genetic improvement programs and aquaculture management for this species.

Author Contributions

In this study, X.J. contributed by conducting a comprehensive literature search, per-forming extensive data collection, and playing a key role in writing the manuscript; L.Z. and X.H. both participated actively in data collection efforts; M.C. supported the research through literature search and offered valuable insights in data interpretation; J.L. was responsible for preparing the figures and contributing to the interpretation of data; H.L. and L.Y. jointly designed the study and performed in-depth data analysis, providing critical guidance throughout the research process. All authors have read and agreed to the published version of the manuscript.

Funding

This study was supported by Qingdao National Laboratory for Ocean Science and Technology project (2022NLM030001-3); Modern Agro-industry Technology Research System in Shandong Province (SDAIT-12-08); Research Grant Funds Project of the Marine Science Research Institute of Shandong Province (20230201).

Data Availability Statement

The raw data supporting the conclusions of this article will be made available by the authors on request.

Conflicts of Interest

Authors Xuyang Jiang, Lu Zhang, Xin Hu and Jie Li were employed by the company Qingdao Conson Oceantec Valley Development Co., Ltd., Qingdao. The remaining authors declare that the research was conducted in the absence of any commercial or financial relationships that could be construed as a potential conflict of interest.

References

  1. Costello, C.; Cao, L.; Gelcich, S.; Cisneros-Mata, M.Á.; Free, C.M.; Froehlich, H.E.; Golden, C.D.; Ishimura, G.; Maier, J.; Macadam-Somer, I.; et al. The future of food from the sea. Nature 2020, 588, 95–100. [Google Scholar] [CrossRef]
  2. Asche, F.; Yang, B.; Gephart, J.A.; Smith, M.D.; Anderson, J.L.; Camp, E.V.; Garlock, T.M.; Love, D.C.; Oglend, A.; Straume, H.M. China’s seafood imports—Not for domestic consumption? Science 2022, 375, 386–388. [Google Scholar] [CrossRef]
  3. Crona, B.; Wassenius, E.; Troell, M.; Barclay, K.; Mallory, T.; Fabinyi, M.; Zhang, W.; Lam, V.W.Y.; Cao, L.; Henriksson, P.J.G.; et al. China at a Crossroads: An Analysis of China’s Changing Seafood Production and Consumption. One Earth 2020, 3, 32–44. [Google Scholar] [CrossRef]
  4. Wei, Y.; Wei, Q.; An, D. Intelligent monitoring and control technologies of open sea cage culture: A review. Comput. Electron. Agric. 2020, 169, 105119. [Google Scholar] [CrossRef]
  5. Xu, H.; Wu, T.; Budhathoki, M.; Fang, D.S.; Zhang, W.; Wang, X. Consumption Patterns and Willingness to Pay for Sustainable Aquatic Food in China. Foods 2024, 13, 2435. [Google Scholar] [CrossRef] [PubMed]
  6. Bureau of Fisheries and Fishery Administration, Ministry of Agriculture and Rural Affairs, National Fisheries Technology Extension Center, China Society of Fisheries. China Fishery Statistical Yearbook; China Agriculture Press: Beijing, China, 2025. [Google Scholar]
  7. Stentiford, G.D.; Bateman, I.J.; Hinchliffe, S.J.; Bass, D.; Hartnell, R.; Santos, E.M.; Devlin, M.J.; Feist, S.W.; Taylor, N.G.H.; Verner-Jeffreys, D.W.; et al. Sustainable aquaculture through the One Health lens. Nat. Food 2020, 1, 468–474. [Google Scholar] [CrossRef]
  8. Reid, D.T.; Peichel, C.L. Perspectives on the Genetic Architecture of Divergence in Body Shape in Sticklebacks. Integr. Comp. Biol. 2010, 50, 1057–1066. [Google Scholar] [CrossRef]
  9. Kong, S.; Zhou, Z.; Zhou, T.; Zhao, J.; Chen, L.; Lin, H.; Pu, F.; Ke, Q.; Bai, H.; Xu, P. Genome-Wide Association Study of Body Shape-Related Traits in Large Yellow Croaker (Larimichthys crocea). Mar. Biotechnol. 2020, 22, 631–643. [Google Scholar] [CrossRef]
  10. Ye, H.; Liu, Y.; Liu, X.; Wang, X.; Wang, Z. Genetic Mapping and QTL Analysis of Growth Traits in the Large Yellow Croaker Larimichthys crocea. Mar. Biotechnol. 2014, 16, 729–738. [Google Scholar] [CrossRef]
  11. DeLorenzo, L.; Mathews, D.; Brandon, A.A.; Joglekar, M.; Baez, A.C.; Moore, E.C.; Ciccotto, P.J.; Roberts, N.B.; Roberts, R.B.; Powder, K.E. Genetic basis of ecologically relevant body shape variation among four genera of cichlid fishes. Mol. Ecol. 2023, 32, 3975–3988. [Google Scholar] [CrossRef]
  12. Zhou, Z.; Han, K.; Wu, Y.; Bai, H.; Ke, Q.; Pu, F.; Wang, Y.; Xu, P. Genome-Wide Association Study of Growth and Body-Shape-Related Traits in Large Yellow Croaker (Larimichthys crocea). Using ddRAD Sequencing. Mar. Biotechnol. 2019, 21, 655–670. [Google Scholar] [CrossRef] [PubMed]
  13. Ali, S.; Rehman, M.U.; Yatoo, A.M.; Arafah, A.; Khan, A.; Rashid, S.; Majid, S.; Ali, A.; Ali, M.N. TGF-β signaling pathway: Therapeutic targeting and potential for anti-cancer immunity. Eur. J. Pharmacol. 2023, 947, 175678. [Google Scholar] [CrossRef] [PubMed]
  14. Arnold, C.P.; Benham-Pyle, B.W.; Lange, J.J.; Wood, C.J.; Alvarado, A.S. Wnt and TGFβ coordinate growth and patterning to regulate size-dependent behaviour. Nature 2019, 572, 655–659. [Google Scholar] [CrossRef] [PubMed]
  15. Liu, S.; Shen, B.; Loor, J.J.; Jiang, Q.; Yuan, Y.; Kong, Y.; Tan, P.; Zeng, F.; Zhao, C.; Zhu, X.; et al. Strontium Regulates the Proliferation and Differentiation of Isolated Primary Bovine Chondrocytes via the TGFβ/SMAD Pathway. Front. Pharmacol. 2022, 13, 925302. [Google Scholar] [CrossRef]
  16. Goebel, E.J.; Corpina, R.A.; Hinck, C.S.; Czepnik, M.; Castonguay, R.; Grenha, R.; Boisvert, A.; Miklossy, G.; Fullerton, P.T.; Matzuk, M.M.; et al. Structural characterization of an activin class ternary receptor complex reveals a third paradigm for receptor specificity. Proc. Natl. Acad. Sci. USA 2019, 116, 15505–15513. [Google Scholar] [CrossRef]
  17. Richardson, L.; Wilcockson, S.G.; Guglielmi, L.; Hill, C.S. Context-dependent TGFβ family signalling in cell fate regulation. Nat. Rev. Mol. Cell Biol. 2023, 24, 876–894. [Google Scholar] [CrossRef]
  18. Yadin, D.; Knaus, P.; Mueller, T.D. Structural insights into BMP receptors: Specificity, activation and inhibition. Cytokine Growth Factor Rev. 2016, 27, 13–34. [Google Scholar] [CrossRef]
  19. David, C.J.; Massagué, J. Contextual determinants of TGFβ action in development, immunity and cancer. Nat. Rev. Mol. Cell Biol. 2018, 19, 419–435. [Google Scholar] [CrossRef]
  20. Massagué, J. How cells read TGF-β signals. Nat. Rev. Mol. Cell Biol. 2000, 1, 169–178. [Google Scholar] [CrossRef]
  21. Chen, W.; Ten Dijke, P. Immunoregulation by members of the TGFβ superfamily. Nat. Rev. Immunol. 2016, 16, 723–740. [Google Scholar] [CrossRef]
  22. Tzavlaki, K.; Moustakas, A. TGF-β Signaling. Biomolecules 2020, 10, 487. [Google Scholar] [CrossRef]
  23. Ao, J.; Li, J.; You, X.; Mu, Y.; Ding, Y.; Mao, K.; Bian, C.; Mu, P.; Shi, Q.; Chen, X. Construction of the High-Density Genetic Linkage Map and Chromosome Map of Large Yellow Croaker (Larimichthys crocea). Int. J. Mol. Sci. 2015, 16, 26237–26248. [Google Scholar] [CrossRef]
  24. Xiao, S.; Li, J.; Ma, F.; Fang, L.; Xu, S.; Chen, W.; Wang, Z.Y. Rapid construction of genome map for large yellow croaker (Larimichthys crocea) by the whole-genome mapping in BioNano Genomics Irys system. BMC Genom. 2015, 16, 670. [Google Scholar] [CrossRef]
  25. Xiao, S.; Wang, P.; Zhang, Y.; Fang, L.; Liu, Y.; Li, J.-T.; Wang, Z.-Y. Gene map of large yellow croaker (Larimichthys crocea) provides insights into teleost genome evolution and conserved regions associated with growth. Sci. Rep. 2015, 5, 18661. [Google Scholar] [CrossRef] [PubMed]
  26. Kumar, S.; Stecher, G.; Tamura, K. MEGA7: Molecular Evolutionary Genetics Analysis Version 7.0 for Bigger Datasets. Mol. Biol. Evol. 2016, 33, 1870–1874. [Google Scholar] [CrossRef]
  27. Pfaffl, M.W. A new mathematical model for relative quantification in real-time RT-PCR. Nucleic Acids Res. 2001, 29, e45. [Google Scholar] [CrossRef] [PubMed]
  28. Wan, L.; Dong, L.; Xiao, S.; Han, Z.; Wang, X.; Wang, Z. Genomewide association study for economic traits in the large yellow croaker with different numbers of extreme phenotypes. J. Genet. 2018, 97, 887–895. [Google Scholar] [CrossRef]
  29. Langerhans, R.B.; Reznick, D.N. Ecology and evolution of swimming performance in fishes: Predicting evolution with biomechanics. In Fish Locomotion: An Eco-Ethological Perspective, 1st ed.; CRC Press: Boca Raton, FL, USA, 2010; Volume 200, p. 248. [Google Scholar]
  30. Zhang, W. Guoxin-1 Vessel: A Mobile Fish Farm on the Sea. World 2022, 50, 38–41. [Google Scholar]
  31. de Caestecker, M. The transforming growth factor-β superfamily of receptors. Cytokine Growth Factor Rev. 2004, 15, 1–11. [Google Scholar] [CrossRef]
  32. Derynck, R.; Budi, E.H. Specificity, versatility, and control of TGF-β family signaling. Sci. Signal. 2019, 12, eaav5183. [Google Scholar] [CrossRef]
  33. Massague, J. TGFβ signalling in context. Nat. Rev. Mol. Cell Biol. 2012, 13, 616–630. [Google Scholar] [CrossRef]
  34. Pennison, M.; Pasche, B. Targeting transforming growth factor-β signaling. Curr. Opin. Oncol. 2007, 19, 579–585. [Google Scholar] [CrossRef]
  35. Yao, L.; Zhao, B.; Wang, Q.; Jiang, X.; Han, S.; Hu, W.; Li, C. Contribution of the TGFβ signaling pathway to pigmentation in sea cucumber (Apostichopus japonicus). Front. Mar. Sci. 2023, 10, 1101725. [Google Scholar] [CrossRef]
  36. Yao, L.; Liu, Y.; Li, L.; Jiang, X. Contribution of the TGF β signaling pathway to growth of Pacific oyster (Crassostrea gigas). Aquaculture 2024, 590, 740983. [Google Scholar] [CrossRef]
  37. Bazioti, V.; Triantafyllidou, V.; Chen, P.Y.; Simons, M.; Santovito, D.; Atzler, D.; Lutgens, E. Myeloid Tgfbr1/2-deficiency leads to a pro-atherogenic environment in ApoE-/- mice. Eur. Heart J. 2024, 45, ehae666-3889. [Google Scholar] [CrossRef]
  38. Ge, R.; Huang, G.M. Targeting transforming growth factor beta signaling in metastatic osteosarcoma. J. Bone Oncol. 2023, 43, 100513. [Google Scholar] [CrossRef]
  39. Hinck, A.P.; Mueller, T.D.; Springer, T.A. Structural Biology and Evolution of the TGF-β Family. Cold Spring Harb. Perspect. Biol. 2016, 8, a022103. [Google Scholar] [CrossRef]
  40. Li, S.; Yan, L.; Li, C.; Lou, L.; Cui, F.; Yang, X.; He, F.; Jiang, Y. NPC1 controls TGFBR1 stability in a cholesterol transport-independent manner and promotes hepatocellular carcinoma progression. Nat. Commun. 2025, 16, 439. [Google Scholar] [CrossRef]
  41. White, S.E.; Schwartze, T.A.; Mukundan, A.; Schoenherr, C.; Singh, S.P.; van Dinther, M.; Cunningham, K.T.; White, M.P.J.; Campion, T.; Pritchard, J.; et al. TGM6 is a helminth secretory product that mimics TGF-β binding to TGFBR2 to antagonize signaling in fibroblasts. Nat. Commun. 2025, 16, 1847. [Google Scholar] [CrossRef]
  42. Lee, J.; Yon, D.K.; Choi, Y.S.; Lee, J.; Yeo, J.H.; Kim, S.S.; Lee, J.M.; Yeo, S.G. Roles of SMAD and SMAD-Associated Signaling Pathways in Nerve Regeneration Following Peripheral Nerve Injury: A Narrative Literature Review. Curr. Issues Mol. Biol. 2024, 46, 7769–7781. [Google Scholar] [CrossRef]
  43. Wu, D.; Kong, X.; Zhang, W.; Di, W. Reconstruction of the TGF-β signaling pathway of Fasciola gigantica. Parasitol. Res. 2023, 123, 51. [Google Scholar] [CrossRef]
  44. Bisgrove, B.W.; Su, Y.C.; Yost, H.J. Maternal Gdf3 is an obligatory cofactor in Nodal signaling for embryonic axis formation in zebrafish. eLife 2017, 6, e28534. [Google Scholar] [CrossRef]
  45. Rodriguez, K.F.; Brown, P.R.; Amato, C.M.; Nicol, B.; Liu, C.F.; Xu, X.; Yao, H.H. Somatic cell fate maintenance in mouse fetal testes via autocrine/paracrine action of AMH and activin B. Nat. Commun. 2022, 13, 4130. [Google Scholar] [CrossRef] [PubMed]
  46. Kumar, R.; Grinberg, A.V.; Li, H.; Kuo, T.H.; Sako, D.; Krishnan, L.; Liharska, K.; Li, J.; Grenha, R.; Maguire, M.C.; et al. Functionally diverse heteromeric traps for ligands of the transforming growth factor-β superfamily. Sci. Rep. 2021, 11, 18341. [Google Scholar] [CrossRef] [PubMed]
  47. Kriseman, M.L.; Tang, S.; Liao, Z.; Jiang, P.; Parks, S.E.; Cope, D.I.; Yuan, F.; Chen, F.; Masand, R.P.; Castro, P.D.; et al. SMAD2/3 signaling in the uterine epithelium controls endometrial cell homeostasis and regeneration. Commun. Biol. 2023, 6, 261. [Google Scholar] [CrossRef]
  48. Heldin, C.-H.; Moustakas, A. Signaling receptors for TGF-β family members. Cold Spring Harb. Perspect. Biol. 2016, 8, a022053. [Google Scholar] [CrossRef]
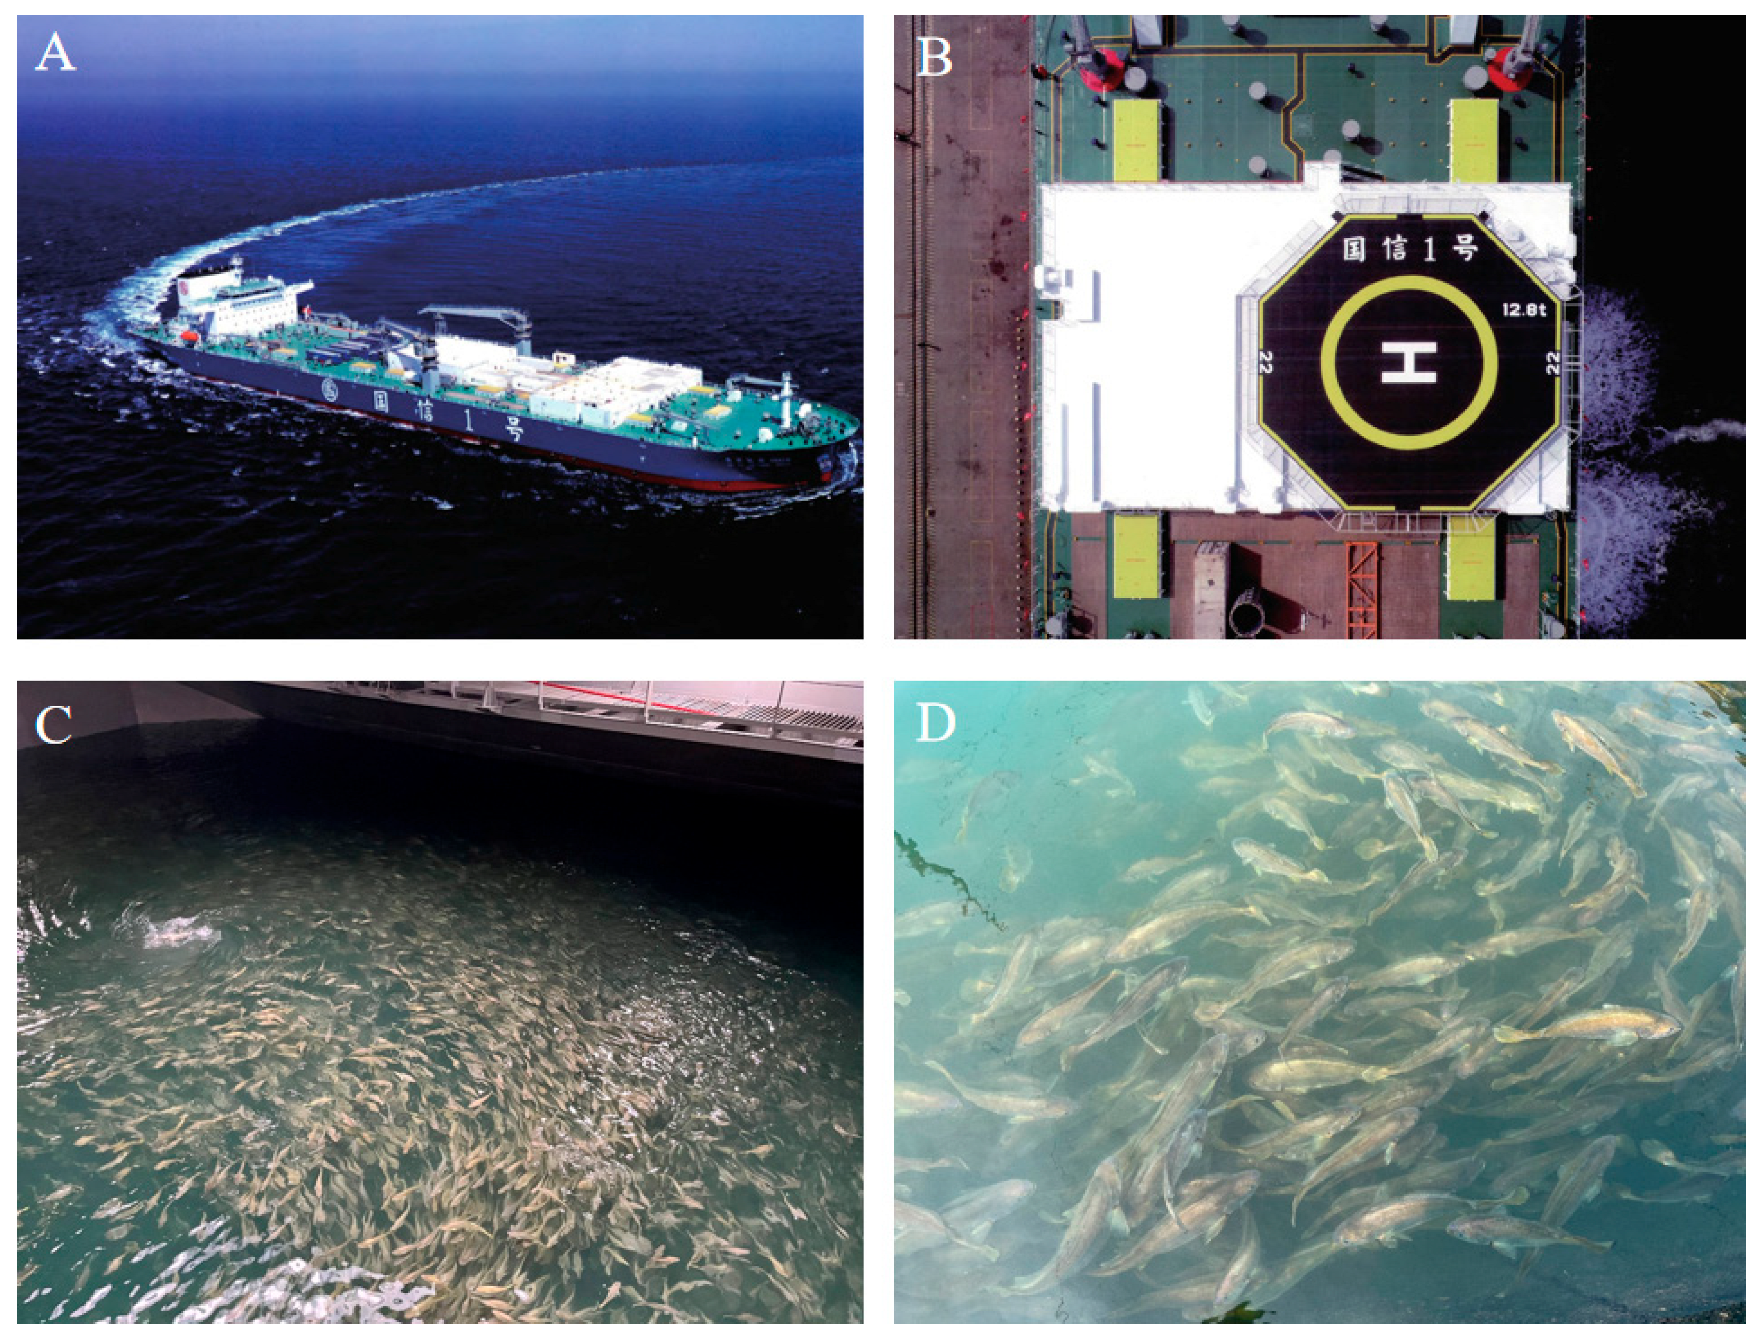
Figure 1. Aquaculture Vessel “Conson No. 1”. Panels (AD) show a sequential zoom-in view, from the entire aquaculture vessel (A) to a partial section of the cabin (B), then to high-density aquaculture of large yellow croakers inside the cabin (C), and finally to a close-up of the large yellow croakers (D).
Jmse 13 01716 g001
Figure 2. Growth and body shape of L. crocea. (A) Fish in the Early Stage of Culture. (B) Fish in Cage Culture for 120 Days. (C) Fish in Aquaculture Vessel for 120 Days.
Jmse 13 01716 g002
Figure 3. Neighbor-joining phylogenetic tree constructed based on the nucleotide sequences of ligands belonging to the TGFβ/activin/Nodal subfamily in L. crocea. (Bold text for L. crocea).
Jmse 13 01716 g003
Figure 4. Neighbor-joining phylogenetic tree constructed based on the nucleotide sequences of ligands belonging to the BMP/GDF/MIS subfamily in L. crocea. (Bold text for L. crocea).
Jmse 13 01716 g004
Figure 5. Neighbor-joining phylogenetic tree constructed based on the nucleotide sequences of receptors in L. crocea. (Bold text for L. crocea).
Jmse 13 01716 g005
Figure 6. Neighbor-joining phylogenetic tree constructed based on the nucleotide sequences of R-Smads in L. crocea. (Bold text for L. crocea).
Jmse 13 01716 g006
Figure 7. The relative expression of ligands in liver. Values with different superscript lowercase letters (a, b, c) denote statistically significant differences between groups (p < 0.05, [Tukey’s HSD]). Groups sharing the same letter are not significantly different (p ≥ 0.05).
Jmse 13 01716 g007
Figure 8. The relative expression of ligands in muscle. Values with different superscript lowercase letters (a, b, c) denote statistically significant differences between groups (p < 0.05, [Tukey’s HSD]). Groups sharing the same letter are not significantly different (p ≥ 0.05).
Jmse 13 01716 g008
Figure 9. The relative expression of receptors in liver. Values with different superscript lowercase letters (a, b, c) denote statistically significant differences between groups (p < 0.05, [Tukey’s HSD]). Groups sharing the same letter are not significantly different (p ≥ 0.05).
Jmse 13 01716 g009
Figure 10. The relative expression of receptors in muscle. Values with different superscript lowercase letters (a, b, c) denote statistically significant differences between groups (p < 0.05, [Tukey’s HSD]). Groups sharing the same letter are not significantly different (p ≥ 0.05).
Jmse 13 01716 g010
Figure 11. The relative expression of Smads in liver. Values with different superscript lowercase letters (a, b) denote statistically significant differences between groups (p < 0.05, [Tukey’s HSD]). Groups sharing the same letter are not significantly different (p ≥ 0.05).
Jmse 13 01716 g011
Figure 12. The relative expression of Smads in muscle. Values with different superscript lowercase letters (a, b) denote statistically significant differences between groups (p < 0.05, [Tukey’s HSD]). Groups sharing the same letter are not significantly different (p ≥ 0.05).
Jmse 13 01716 g012
Table 1. Oligonucleotide primers used to amplify the TGFβ signaling pathway genes of L. crocea.
Gene Name/Another NameAccession No.Primer Sequence
β-actin/ACTBFJ936563.15′-GACCTGACAGACTACCTCATG-3′
5′-AGTTGAAGGTGGTCTCGTGGA-3′
TGFB1/TGFβ1XM_027280465.15′-GGTGGTTTTCACAGCAGCAG-3′
5′-GGGATGCTCGGGGAATAGTG-3′
TGFB2/TGFβ2XM_010752699.35′-GCTGCCTACTGCTCCAGAAA-3′
5′-TTGGCCTCATAGCCCTTTGG-3′
TGFB2/TGFβ3XM_010733855.35′-AAGACGACCCCAAAGCCAAA-3′
5′-ACTGATCTCCAGGCCCAGAT-3′
INHBA/Activin AXM_010747963.35′-TCATCAGGAGGACAGAGCGA-3′
5′-CGGGACTGGCTGTGTTACAT-3′
INHBB/Activin BNodalXM_010746279.35′-GAGGATGGGAGGGTGGAGAT-3′
5′-CAGATTCTGGTTGCCCTCGT-3′
NodalXM_010743837.35′-CTTTTGCGCTGCACACATCT-3′
5′-CATGTAGGTTGGCAGGTGGT-3′
BMP2XM_010733238.35′-CATGGCTTCATGGTGGAGGT-3′
5′-TCACCCTGACGTGCCTACTA-3′
BMP3XM_027273955.15′-TGCTCGTGCTGCTTTATGGA-3′
5′-TGGTCGTCTTTCGTGAGGTG-3′
BMP4XM_010735218.35′-CAGCTCTTGGATACGCGACT-3′
5′-GTGTCTGGTTGAGGTGCAGA-3′
BMP5XM_010756380.35′-CACCTTTGAACCGTGCTGTG-3′
5′-GATCTCCCTGCGTTCGTGAT-3′
BMP6XM_010741625.35′-GAAACTCCAGGCCAGACACA-3′
5′-TCCACCACAATCCGACCAAG-3′
BMP7XM_010755531.35′-CACGGCAGCAGAGTTTAGGA-3′
5′-ACCTGGTAGACGCTGACTCT-3′
BMP8AXM_019270763.25′-TTGAGGACCGCAGGAGAAAC-3′
5′-TTCATCCATTCACGCCTGCT-3′
BMP10XM_010738504.35′-GGGACAGTTGGATTCTCGCA-3′
5′-GTTTGGTGGGTGTGACATGC-3′
GDF3XM_019263909.25′-CTCTCTGGACCCTCATGGGA-3′
5′-CGGGCCAATCAGAACCTCAT-3′
GDF5/BMP14XM_010754689.35′-CACTTCAACGTCAGCTCCCT-3′
5′-GGGATGAACCTCCTCCTCCT-3′
GDF6/BMP13XM_010747111.35′-CCTGGATTACGAGGCGTACC-3′
5′-CTGATGGGGCTGAGTTTGGT-3′
GDF8NM_001303317.15′-AGAGTCCGCTCCCTGAAGAT-3′
5′-CTCTGCTGAAGTGACAGCCA-3′
GDF9XM_010754774.35′-ACAAGCAGATGGCGTTCAGA-3′
5′-AATCGTACAAGGCGCAGTCA-3′
GDF15XM_010733382.35′-GTGGACAGAATGGACAGCCA-3′
5′-TGGGCTCCCTGTCTATACCC-3′
AMH/MISXM_010730161.35′-GGACTCTGCACGGTTTCTGA-3′
5′-GCAGACTGTGGGAGGTCAAA-3′
ALK2/ACVR1XM_019259847.25′-CACTGTGGAGCTGCCTGTTA-3′
5′-CTCGTGACGTAAGCCTCTCC-3′
ALK3/BMPR1AXM_010749871.35′-GAGAGAAGGTGGCCGTCAAA-3′
5′-TGAGGAAGAGCTGCGTGAAG-3′
ALK4/ACVR1BXM_010747783.35′-GGCGTGTTCCTGTTCCAGTA-3′
5′-ACAAACAGGGGCAAACCAGA-3′
ALK6/BMPR1BXM_010732488.35′-GACATCCCTCCCAACACGAG-3′
5′-CCCTCCTGAGACACAACGTC-3′
ALK7/ACVR1CXM_027290679.15′-CCTGCCATTGCTCACAGAGA-3′
5′-TGTCGATGGTGTTGGTCCTG-3′
TBRII/TGFBR2XM_010735343.35′-ATGAAGGTGAGACGGCTGTG-3′
5′-GGCAGATGGAGGTGATCTCG-3′
ACVR2A/ACTR2AXM_027287970.15′-TGAAGGCAAACGTCCTCTCC-3′
5′-GGTCAGGTTCGACTTCAGCA-3′
ACVR2B/ACTR2BXM_019276244.25′-CTGGCTGGACGACTTCAACT-3′
5′-TGGAGGCCGGATTTTCACTC-3′
BMPR2XM_010740233.35′-ACCACCCTGCACAATGAGAG-3′
5′-CGTGTTCTTAGCCACACCCT-3′
AMHR2/MISR2XM_027279584.15′-GTGGCTGATTTTGGCTGTGG-3′
5′-GTTCTGGCGAGTCACTTGGA-3′
Smad1/MADR1XM_010729469.35′-AATCGTGTTGGAGAGGCGTT-3′
5′-CGGGTGTTCTCAATGGTGGA-3′
Smad2/MADR2XM_019271768.25′-TACATCGGAGGGGAGGTGTT-3′
5′-GTGCAGCAAACTCCTGGTTG-3′
Smad3/MADH3XM_010735124.35′-CCACTACCAGAGGGTGGAGA-3′
5′-AGGGATGGATGGGCTGTAGT-3′
Table 2. The impact of net cages and vessel aquaculture on the growth and body shape of L. crocea. (Values with different superscript lowercase letters (a, b, c) denote statistically significant differences between groups (p < 0.05, [Tukey’s HSD]). Groups sharing the same letter are not significantly different (p ≥ 0.05). Data are presented as mean ± standard deviation (SD; n = 15 per group).
IndexesInitial Data (in November 2023) for Group AFinish Data for Group NFinish Data for Group V
Weight (Wt, g)350.4 ± 34.24 c508 ± 29.02 b535.33 ± 22.24 a
Total Length (TL, cm)32.41 ± 1.16 c35.31 ± 1.22 b37.28 ± 0.92 a
Body Length (BL, cm)28.29 ± 1.15 c31.35 ± 0.93 b33.78 ± 1.24 a
Body Depth (BD, cm)7.9 ± 0.49 b9.04 ± 0.35 a9.06 ± 0.44 a
Caudal Peduncle Length (CPL, cm)7.49 ± 0.55 c8.07 ± 0.69 b9.34 ± 0.42 a
Caudal Peduncle Width (CPW, cm)2.03 ± 0.13 c2.19 ± 0.15 b2.3 ± 0.08 a
Caudal Peduncle Length/Caudal Peduncle Width (CPL/CPW)3.7 ± 0.28 b3.7 ± 0.32 b4.07 ± 0.24 a
Body Length/Body Depth (BL/BD)3.59 ± 0.21 b3.47 ± 0.18 b3.73 ± 0.17 a
Caudal Peduncle Length/Body Length (CPL/BL)0.26 ± 0.01 b0.26 ± 0.02 b0.28 ± 0.01 a
Fullness (g/cm3)1.55 ± 0.15 a1.66 ± 0.17 a1.4 ± 0.15 b
Table 3. TGFβ superfamily ligand–receptor–R-Smad specificity.
SubfamilyLigandReceptor IReceptor IIR-Smad
TGFβ/activin/NodalINHBA/Activin AALK4/ACVR1BACVR2A/ACTRIIA and ACVR2B/ACTRIIBSmad/MADR2, 3
INHBB/Activin BALK4/ACVR1B and ALK7/ACVR1CACVR2A/ACTRIIA and ACVR2B/ACTRIIBSmad/MADR2, 3
NodalALK4/ACVR1B and ALK7/ACVR1CACVR2A/ACTRIIA and ACVR2B/ACTRIIBSmad/MADR2, 3
BMP/GDF/AMHBMP2ALK3/BMPR1A/BMPR1A and ALK6/BMPR1BACVR2A/ACTRIIA, ACVR2B/ACTRIIB and BMPR2Smad1/MADR1
BMP4ALK3/BMPR1A and ALK6/BMPR1BACVR2A/ACTRIIA, ACVR2B/ACTRIIB and BMPR2Smad1/MADR1
BMP5ALK2/ACVR1, ALK3/BMPR1A and ALK6/BMPR1BACVR2A/ACTRIIA, ACVR2B/ACTRIIB and BMPR2Smad1/MADR1
BMP6ALK2/ACVR1, ALK3/BMPR1A and ALK6/BMPR1BACVR2A/ACTRIIA, ACVR2B/ACTRIIB and BMPR2Smad1/MADR1
BMP7ALK2/ACVR1, ALK3/BMPR1A and ALK6/BMPR1BACVR2A/ACTRIIA, ACVR2B/ACTRIIB and BMPR2Smad1/MADR1
BMP8AALK2/ACVR1, ALK3/BMPR1A and ALK6/BMPR1BACVR2A/ACTRIIA, ACVR2B/ACTRIIB and BMPR2Smad1/MADR1
GDF3ALK4/ACVR1B and ALK7/ACVR1CACVR2A/ACTRIIA and ACVR2B/ACTRIIBSmad/MADR2, 3
GDF5/BMP14ALK3/BMPR1A and ALK6/BMPR1BACVR2A/ACTRIIA, ACVR2B/ACTRIIB and BMPR2Smad1/MADR1
GDF6/BMP13ALK3/BMPR1A and ALK6/BMPR1BACVR2A/ACTRIIA, ACVR2B/ACTRIIB and BMPR2Smad1/MADR1
GDF8ALK4/ACVR1BACVR2B/ACTRIIBSmad/MADR2, 3
GDF9ALK4/ACVR1BBMPR2Smad1/MADR1
AMH/MISALK2/ACVR1 and ALK3/BMPR1AAMHR2/MISR2Smad1/MADR1
Table 4. TGFβ superfamily ligand–receptor–R-Smad specificity in liver.
SubfamilyLigandReceptor IReceptor IIR-Smad
TGFβ/activin/NodalINHBA/Activin AALK4/ACVR1BACVR2A/ACTRIIA and ACVR2B/ACTRIIBSmad2/MADR2
INHBB/ActivinBALK4/ACVR1B and ALK7/ACVR1CACVR2A/ACTRIIA and ACVR2B/ACTRIIBSmad2/MADR2
NodalALK4/ACVR1B and ALK7/ACVR1CACVR2A/ACTRIIA and ACVR2B/ACTRIIBSmad2/MADR2
BMP/GDF/MISBMP2ALK3/BMPR1A and ALK6/BMPR1BACVR2A/ACTRIIA, ACVR2B/ACTRIIB and BMPR2Smad1/MADR1
BMP4ALK3/BMPR1A and ALK6/BMPR1BACVR2A/ACTRIIA, ACVR2B/ACTRIIB and BMPR2Smad1/MADR1
BMP6ALK3/BMPR1A and ALK6/BMPR1BACVR2A/ACTRIIA, ACVR2B/ACTRIIB and BMPR2Smad1/MADR1
BMP8AALK3/BMPR1A and ALK6/BMPR1BACVR2A/ACTRIIA, ACVR2B/ACTRIIB and BMPR2Smad1/MADR1
GDF3ALK4/ACVR1B and ALK7/ACVR1CACVR2A/ACTRIIA and ACVR2B/ACTRIIBSmad/MADR2, 3
GDF5/BMP14ALK3/BMPR1A and ALK6/BMPR1BACVR2A/ACTRIIA, ACVR2B/ACTRIIB and BMPR2Smad1/MADR1
GDF8ALK4/ACVR1BACTRIIB and BMPR2Smad2/MADR2
GDF9ALK4/ACVR1BBMPR2Smad1/MADR1
Table 5. TGFβ superfamily ligand–receptor–R-Smad specificity in muscle.
SubfamilyLigandReceptor IReceptor IIR-Smad
TGFβ/activin/NodalINHBA/Activin AALK4/ACVR1BACVR2A/ACTRIIA and ACVR2B/ACTRIIBSmad2/MADR2
INHBB/ActivinBALK4/ACVR1B and ALK7/ACVR1CACVR2A/ACTRIIA and ACVR2B/ACTRIIBSmad2/MADR2
NodalALK4/ACVR1B and ALK7/ACVR1CACVR2A/ACTRIIA and ACVR2B/ACTRIIBSmad2/MADR2
BMP/GDF/MISGDF3ALK4/ACVR1B and ALK7/ACVR1CACVR2A/ACTRIIA and ACVR2B/ACTRIIBSmad2/MADR2
GDF8ALK4/ACVR1BACVR2B/ACTRIIBSmad2/MADR2
Disclaimer/Publisher’s Note: The statements, opinions and data contained in all publications are solely those of the individual author(s) and contributor(s) and not of MDPI and/or the editor(s). MDPI and/or the editor(s) disclaim responsibility for any injury to people or property resulting from any ideas, methods, instructions or products referred to in the content.