Article

Spatial and Seasonal Characteristics of the Submesoscale Energetics in the Northwest Pacific Subtropical Ocean

1
College of Oceanic and Atmospheric Sciences, Ocean University of China, Qingdao 266100, China
2
Frontiers Science Center for Deep Ocean Multispheres and Earth System (FDOMES), Key Laboratory of Physical Oceanography, Ministry of Education, Ocean University of China, Qingdao 266100, China
3
Laboratory for Ocean Dynamics and Climate, Qingdao Marine Science and Technology Center, Qingdao 266100, China
4
Qingdao Institute of Marine Meteorology, Chinese Academy of Meteorological Sciences, Qingdao Research Center of Marine Meteorology, Qingdao 266404, China
5
The First Institute of Oceanography, Ministry of Natural Resources, Qingdao 266061, China
6
Frontiers Science Center for Deep Ocean Multispheres and Earth System (FDOMES), Key Laboratory of Marine Environmental Science and Ecology, Ministry of Education, Ocean University of China, Qingdao 266100, China
7
Qingdao Leice Transient Technology Co., Ltd., Qingdao 266100, China
*
Author to whom correspondence should be addressed.
J. Mar. Sci. Eng. 2025, 13(9), 1691; https://doi.org/10.3390/jmse13091691
Submission received: 31 July 2025 / Revised: 28 August 2025 / Accepted: 29 August 2025 / Published: 2 September 2025
(This article belongs to the Section Physical Oceanography)

Abstract

The spatial and seasonal characteristics of submesoscales in the Northwest Pacific Subtropical Ocean are thoroughly investigated here using a submesoscale-permitting model within a localized multiscale energetics framework, in which three scale windows termed background, mesoscale, and submesoscale are decomposed. It is found that submesoscale energetics are highly geographically inhomogeneous. In the Luzon Strait, baroclinic and barotropic instabilities are the primary mechanisms for generating submesoscale available potential energy (APE) and kinetic energy (KE), and they exhibit no significant seasonal variations. Although buoyancy conversion experiences pronounced seasonal cycles and serves as the main sink of submesoscale APE in winter and spring, its contribution to submesoscale KE is negligible. The major sinks of submesoscale KE are advection, horizontal pressure work, and dissipation. In the Western Boundary Current transition and Subtropical Countercurrent (STCC) interior open ocean zone, submesoscales undergo significant seasonality, with large magnitudes in winter and spring. In spring and winter, baroclinic instability dominates the generation of submesoscale APE via forward cascades, while KE is mainly energized by buoyancy conversion and dissipated by the residual term. Meanwhile, in summer and autumn, submesoscales are considerably weak. Additionally, submesoscale energetics in the Western Boundary Current transition zone are slightly greater than those in the STCC interior open ocean zone, which is attributed to the strengthened straining of the Western Boundary Current and mesoscale eddies.

1. Introduction

Submesoscale processes (hereafter, submesoscales) preferentially occur in the upper ocean boundary layer, manifesting fronts, filaments, and vortices with temporal and horizontal spatial scales of O (1–10) days and O (1–50) km, respectively [1,2,3,4]. They can be generated by different dynamical mechanisms, including mixed-layer instabilities [5,6,7,8], frontogenesis by mesoscale straining [9,10], and flow–topography interactions [11,12]. In dynamics, submesoscales are characterized by increased vertical velocity [13,14,15], which enhances the transmission of heat and tracers between the ocean surface and interior [16,17,18]. In energetics, as the medium of quasi-geostrophic mesoscale eddies and three-dimensional turbulence, submesoscales play a vital role in closing ocean energy cascades [3,19]. Additionally, submesoscales feature O (1) Rossby (Ro) and Richardson (Ri) numbers. This indicates that they are only slightly affected by Earth’s rotation and oceanic stratification [20,21], leading to a dual cascade of kinetic energy (KE) with coexisting geostrophic and ageostrophic components [22,23,24]. For example, smaller-scale submesoscales, such as symmetric instability, feature forward KE cascades and facilitate geostrophic flows to turbulence by generating ageostrophic secondary circulation [25]. Conversely, mesoscale eddies can be reinforced by larger-scale submesoscales resulting from mixed-layer baroclinic instabilities [22,23], and Sasaki [26] suggests that submesoscales can enhance mesoscale eddies, increasing inverse KE cascade to make them more coherent, and preventing rapid dissipation.
The Northwest Pacific Subtropical Ocean is characterized by complex multiscale dynamic processes [27]. In the Luzon Strait region, in which the strong Western Boundary Current is present (marked by (a) in Figure 1), the Kuroshio always intrudes into the South China Sea (SCS) and sheds mesoscale eddies under certain conditions [28,29]. Additionally, the intense interactions between barotropic tides and complex topography generate highly energetic internal tides, which further develop into large-amplitude internal solitary waves in the northeastern SCS [30,31]. Moreover, the combined effects of the strong East Asian monsoon, along with the complicated islands and topography, can generate abundant submesoscales and smaller-scale turbulent mixing. The generation mechanisms of submesoscales have been validated by both mixed-layer instability and strain-induced frontogenesis from both site observations [32] and high-resolution models [33], and the energy cascades and thermohaline transports driven by submesoscales have further been thoroughly investigated [34]. Correspondingly, in the open ocean of the Northwest Pacific Subtropical region (marked by (b–c) in Figure 1), the combined forcing of surface wind stress and heat fluxes shapes the shallow eastward current of the Subtropical Countercurrent (STCC), beneath which lies the wind-driven westward North Equatorial Current (NEC) [35,36]. The reversal in sign of the meridional potential vorticity gradient leads to baroclinic instability, which serves as the primary mechanism for generating active mesoscale eddies in the western North Pacific Ocean. These mesoscale eddies propagate westward at approximately O(0.1) m/s, leading to significant multiscale interactions [37,38,39]. At the periphery of the eddies, active submesoscales can also be frequently detected from both satellite and site observations [16,25]. Although the regionality and seasonality of submesoscales and mesoscale eddies in the Northwest Pacific Subtropical Ocean have been thoroughly investigated [19,26,35,36], most studies have mainly focused on the multiscale interactions and dynamical mechanisms based on statistical and spectral approaches [19,23,26], with few case studies on the spatial and seasonal characteristics of submesoscale energetics in this region.
In this study, we attempt to explore this scientific issue using a submesoscale-permitting numerical simulation. As mentioned by Wu [40], in contrast to the interior STCC region, mesoscale eddies significantly modulate the seasonal variations of mesoscale KE and STCC near the Western Boundary Current region. Considering the significance of mesoscale eddies in generating submesoscales, we infer that the submesoscale dynamics exhibit significant differences between the Western Boundary Current and the open ocean interior. Therefore, we separate the study area into three subregions in Figure 1: the Luzon Strait zone (Sub. 1, marked by (a)), the Western Boundary Current transition zone (Sub. 2, marked by (b)), and the STCC open ocean interior zone (Sub. 3, marked by (c)). This paper is organized as follows: After the Introduction in Section 1, Section 2 provides a brief introduction to the downscaled model configuration and multiscale energetics approach. Section 3 characterizes the spatial and seasonal characteristics of the submesoscales in three different subregions of the Northwest Pacific Subtropical Ocean. Finally, summaries and discussions are given in Section 4.

2. Method

2.1. Model Configuration

The Regional Oceanic Modeling System is specifically designed to simulate regional oceanic multiscale dynamical processes and is utilized here [25,33,41]. Based on the Boussinesq and hydrostatic approximations, the ROMS is a free-surface, terrain-following coordinate model employing split-explicit time-stepping. This study utilizes a third-order predictor–corrector time-stepping algorithm and third-order upstream-biased advection for momentum and tracers, effectively reducing numerical dispersion and diffusion. Furthermore, a nonlocal vertical turbulence closure scheme of K-profile boundary layer (KPP) [42] is adopted to parameterize vertical subgrid-scale effects at the surface, bottom, and interior of the ocean. The tidal model is excluded from the simulation.
As illustrated in Figure 1, the large parent grid covers the Northwest Pacific Ocean from 105–158° E to 4–31° N, with the horizontal resolution of mesoscale-resolving 1/20°. The atmospheric forcings are all interpolated from the hourly CFSv2 reanalysis dataset with a relatively coarse spatial resolution of 1/4°, while the initial and lateral fields are all interpolated from the daily 1/12° HYCOM dataset. To reduce numerical errors associated with the pressure gradient in the model, the bathymetry is extracted from the GEBCO 2023 dataset with a horizontal resolution of 15 arcseconds and selectively smoothed to avoid exceeding computational restrictions of topography steepness and roughness when the value of r-factor δ h / h exceeds 0.2, in which h is the water depth and δ h is its horizontal variation between two grid points [43]. Vertically, the model consists of 50 layers, with critical stretching parameters θ s , θ b , and h c set to 8.5, 1.0, and 20 m, respectively. This configuration yields concentrated vertical level thicknesses ranging from 0.2 to 15.0 m within the upper 200 m. The model was initialized on 1 January 2012 and operated for 9 years until 1 January 2021 under realistic oceanic and atmospheric forcing. The initial two years were designated as spin-up, after which the model achieved numerical equilibrium within the upper 200 m. Subsequently, it generated daily outputs and snapshots at 12:00 UTC in subsequent simulations. The numerical results, such as the Kuroshio circulation, temperature–salinity vertical structure, and mixed-layer depth (LMD), were all validated with satellite observation and reanalysis results before the downscaled simulation.
Then, a one-way offline nesting approach was implemented for the fine child grid in the Northwest Pacific Subtropical Ocean (marked by the solid red line in Figure 1), with a refined submesoscale-permitting horizontal resolution of 1/45°. The grid encompasses 991 points along zonal directions and 451 points meridionally, spanning longitude from 118° to 140° E and latitude from 16° to 26° N. The model employs the same surface forcing from CFSv2, with oceanic initial and boundary conditions derived from the parent grid. This high-resolution model was run from 1 January 2017 to 1 January 2021 and generated daily-averaged outputs. The sinusoidal wavelength of mixed-layer instability (MLI) was investigated by Dong [44]; the results showed that it is smallest in summertime [45]. In this study, the MLI sinusoidal wavelength upper bound within the child domain is approximately 15 km, rendering the 1/45° resolution (about 2.4 km) effective for resolving MLI, which directly improves the ability to effectively resolve submesoscales [46]. Meanwhile, seasons are categorized as spring (March, April, and May), summer (June, July, and August), autumn (September, October, and November), and winter (December, January, and February)

2.2. Multiscale Energetic Diagnostic Methods

The multiscale energy and vorticity analysis (MS-EVA) method [47] is widely utilized to evaluate cross-scale dynamical processes [48,49,50,51,52,53,54]. Here, the 1/45° daily-averaged outputs with a temporal length of 1024 days, from 1 September 2017 to 20 June 2020, are categorized into three scale windows: the background flow window (>256 days, =   0 ), the mesoscale window (>16 and <256 days, = 1 ), and the submesoscale window (≤16 days, = 2 ). The choice of 16 days as the separation threshold was based on submesoscale mooring array observations in the Luzon Strait and the Northwest Pacific Ocean, which indicate that 15 days is the optimal temporal scale for distinguishing mesoscales and submesoscales [55]. Therefore, a 16-day (the nearest to 15-day) window that could be evenly divided by 2, as required by the MS-EVA method, was selected. The short-period bound of the daily-averaged outputs for the submesoscale window was chosen to filter out most unbalanced inertia–gravity waves, including internal tides, that are not related to submesoscale turbulence indicated in previous studies [14,18,24]. Additionally, Zhao [56] showed that the typical period of mesoscale eddies in the SCS is about 30 to 240 days [57,58,59]. So, the mesoscale eddy window was selected to range from 16 to 256 days, which is almost consistent with previous studies [51,52,56]. Liang [47] obtained energy equations of KE and APE on window ω ¯ (indicated as K E ω ¯ and A P E ω ¯ ), based on the ocean primitive equations:
K E ω ¯ t =   1 2 V V h ^ ~ ω ¯ : V h ^ ~ ω ¯ · V V h ^ ~ ω ¯ · V h ^ ~ ω ¯ + Γ K ω ¯ 1 2 h · V h V h ^ ~ ω ¯ · V h ^ ~ ω ¯ Δ h Q K ω ¯ + 1 2 z w V h ^ ~ ω ¯ · V h ^ ~ ω ¯ Δ z Q K ω ¯ + h · 1 ρ 0 V h ^ ~ ω ¯ P ^ ~ ω ¯ Δ h Q P ω ¯ + z 1 ρ 0 w ^ ~ ω ¯ P ^ ~ ω ¯ Δ z Q P ω ¯ + g ρ 0 · ρ ^ ~ ω ¯ w ^ ~ ω ¯ + F K ω ¯ b ω ¯ ,
A P E ω ¯ t = c 2 V ρ ^ ~ ω ¯ · ρ ^ ~ ω ¯ ρ ^ ~ ω ¯ · V ρ ^ ~ ω ¯ + Γ A ω ¯ 1 2 h · c ρ ^ ~ ω ¯ V h ρ ^ ~ ω ¯ Δ h Q A ω ¯ + 1 2 z c ρ ^ ~ ω ¯ w ρ ^ ~ ω ¯ Δ z Q A ω ¯ + g ρ 0 ρ ^ ~ ω ¯ w ^ ~ ω ¯ + b ω ¯ 1 2 ρ ^ ~ ω ¯ w ρ ^ ~ ω ¯ c z S A ω ¯ + F A ω ¯ .
where K E ω ¯ and A P E ω ¯ are expressed as 1 2 V ^ h ~ ω ¯ · V ^ h ~ ω ¯ and 1 2 c ( ρ ^ ~ ω ¯ ) 2 , respectively, in which V h is the horizontal velocity vector, c = g 2 ρ 0 2 N 2 , and ρ is the density. Γ K ω ¯ ( Γ A ω ¯ ) is the KE (APE) barotropic (baroclinic) canonical transfer between different scale windows, in which · is the inner product and is the Nabla operator. Δ Q K ω ¯ ( Δ Q A ω ¯ ) and Δ Q P ω ¯ are the KE (APE) advection process and work by pressure, respectively, which can be further divided into horizontal and vertical components denoted by h and z, respectively. However, the vertical advection components of Δ z Q K ω ¯ ( Δ z Q A ω ¯ ) are so weak that only the total component of Δ Q K ω ¯ ( Δ Q A ω ¯ ) is analyzed in this study. A positive (negative) Δ Q K ω ¯ ( Δ Q A ω ¯ ) and Δ Q P ω ¯ stands for the divergence (convergence) of KE (APE) by horizontal advection and pressure work, respectively; b ω ¯ is the buoyancy conversion term; S A ω ¯ is the source/sink of the stratification term and is usually ignored [50,51]. The implicit F term includes the residual contributions of external forcing, friction, and subgrid processes [47]. The canonical transfer of barotropic KE (baroclinic APE) from the background ( ω ¯ = 0 ) and mesoscale ( ω ¯ = 1 ) to the submesoscale scale window ( ω ¯ = 2 ) is denoted as Γ K 0 2 ( Γ A 0 2 ) and Γ K 1 2 ( Γ A 1 2 ) , respectively. A positive value of Γ K ( Γ A ) signifies forward cascades of KE (APE), corresponding to the barotropic (baroclinic) instability in the classical geophysical fluid dynamics [50,54].

3. Spatiotemporal Variations in Submesoscale Energetics

3.1. Spatiotemporal Characteristics of Submesoscales in the Northwest Pacific Subtropical Ocean

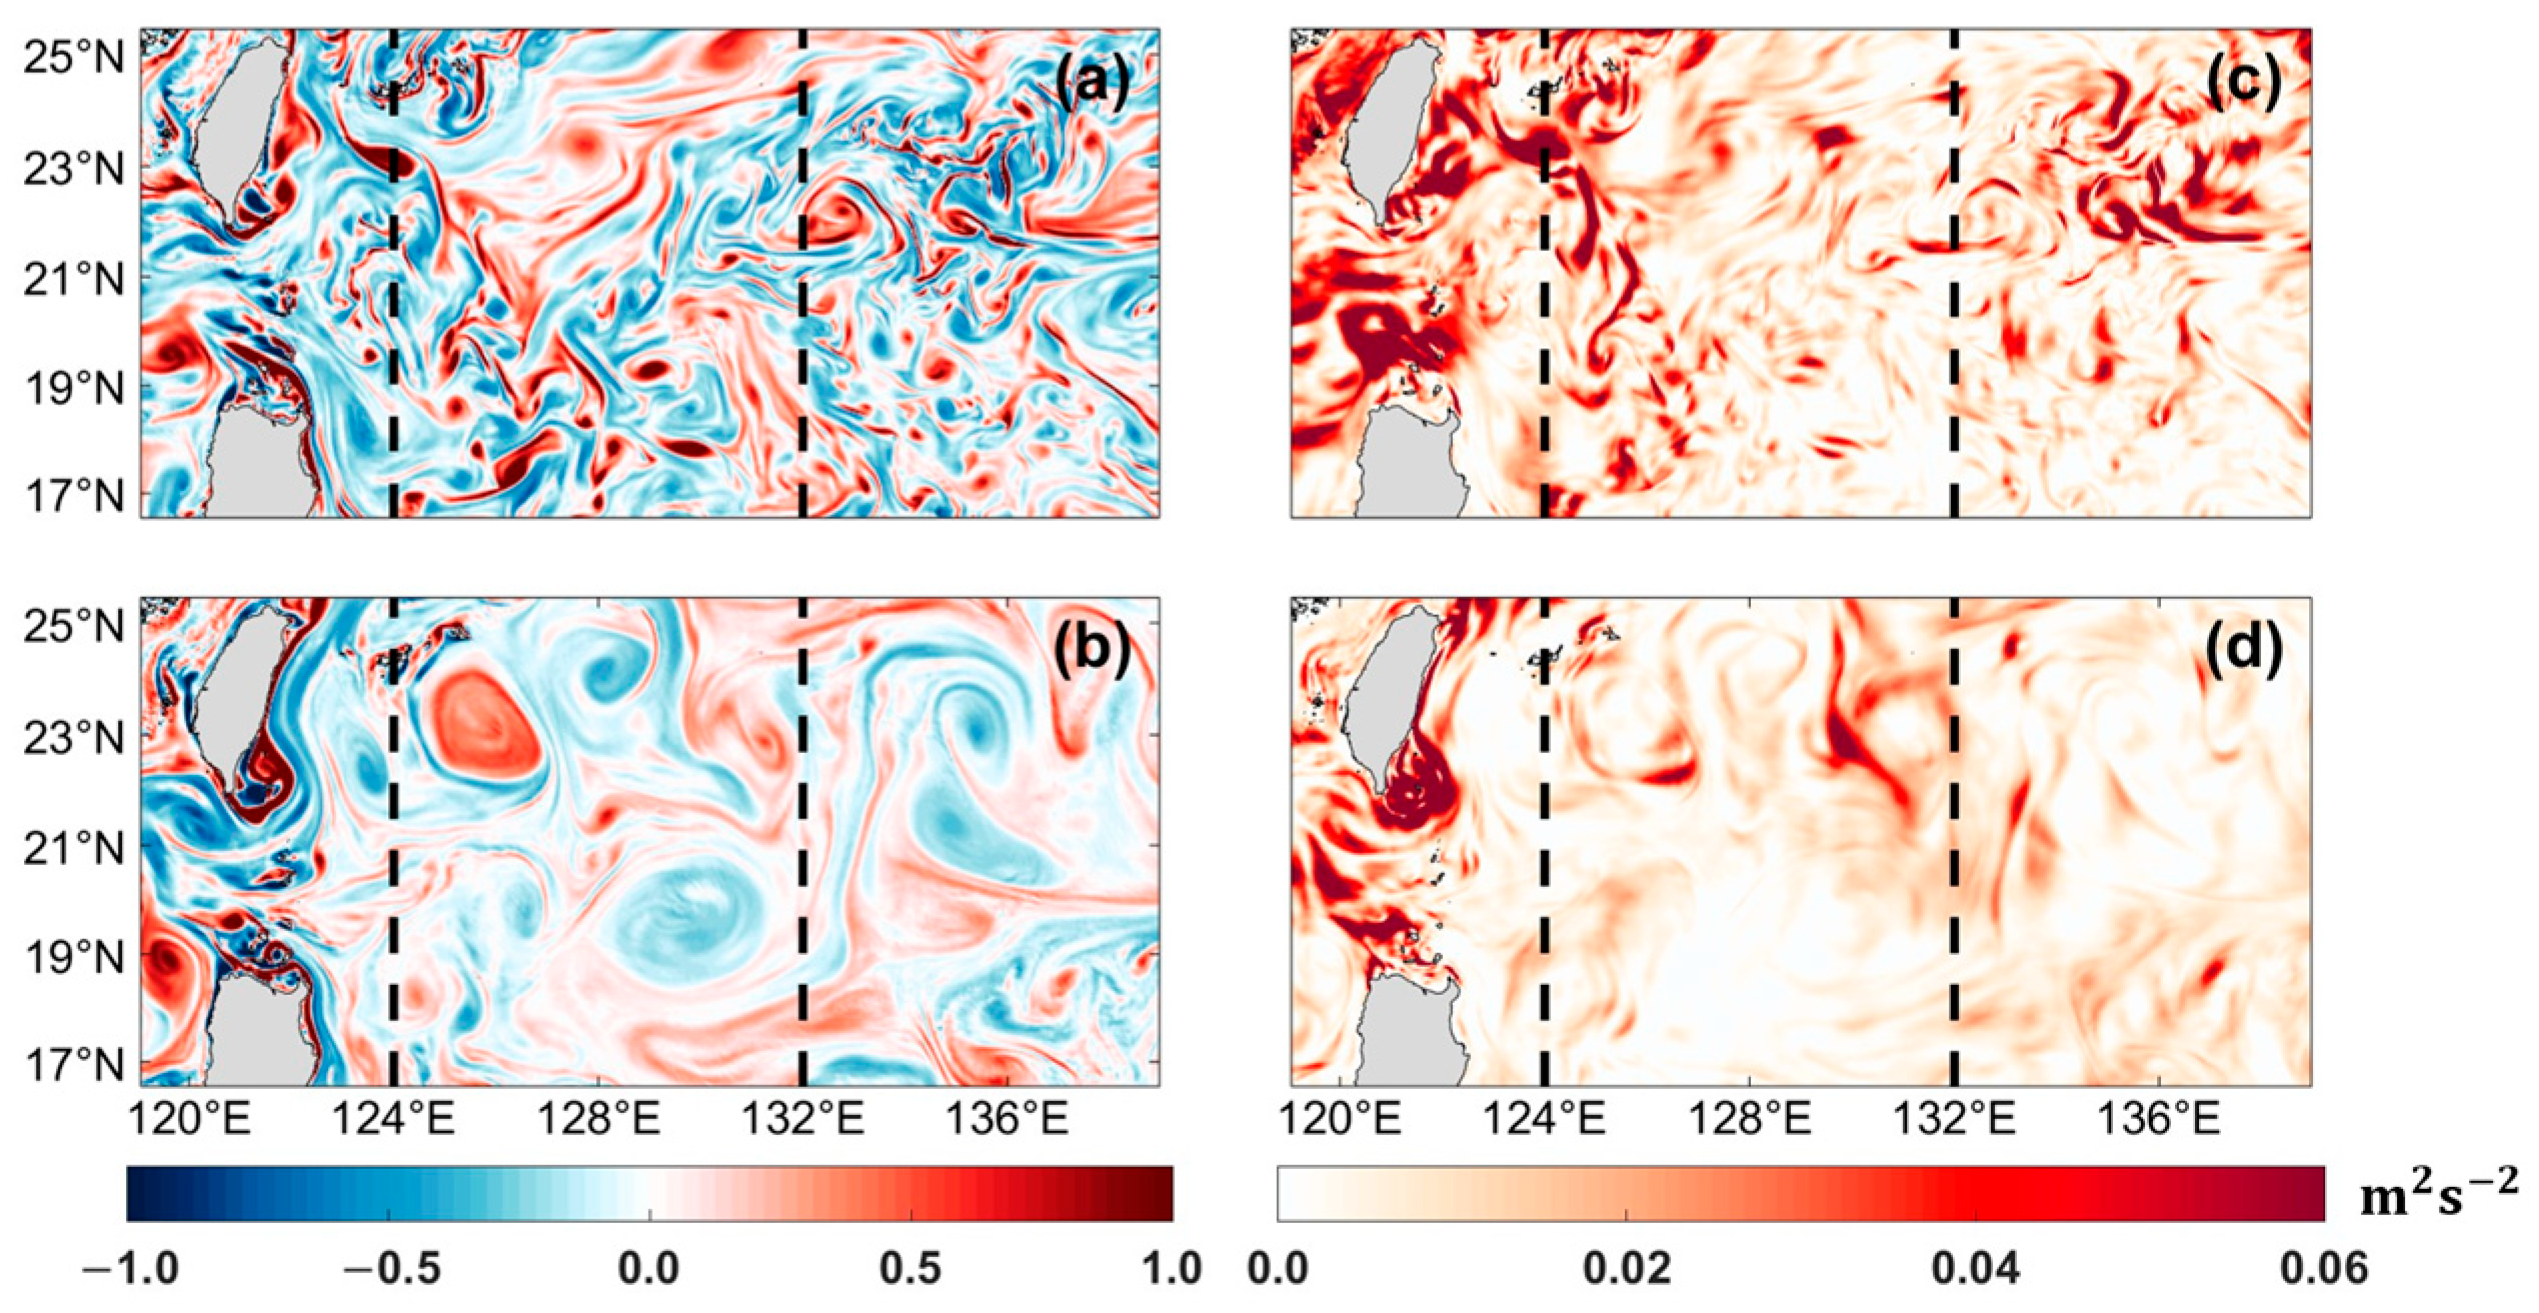
Figure 2 presents the snapshots of the surface Rossby number ( R o = ζ / f , defined as the ratio of vertical relative vorticity ζ to the local Coriolis parameter f ) and submesoscale KE ( K E 2 ) on a typical spring (15 March 2019) and autumn (15 September 2019) day in the Northwest Pacific Subtropical Ocean. As illustrated, the magnitudes of both R o and K E 2 display significant seasonal variations, with large values in spring and small values in autumn. Meanwhile, the pattern of K E 2 closely corresponds with R o , exhibiting increased values in regions where R o is elevated. In spring, the R o is dominated by numerous small-scale vortices and elongated filaments, with the strongest K E 2 concentrated along the main axis of the Kuroshio and around the periphery of these vortices. However, R o experiences a remarkable decrease and exhibits relatively weak values in autumn. Meanwhile, the spatial pattern is primarily characterized by several large mesoscale eddies with radii of approximately hundreds of kilometers, interspersed with elongated fronts. Concurrently, the strength of K E 2 noticeably weakens in the open ocean, with elevated values primarily concentrated along the periphery of the Kuroshio’s main axis. Furthermore, R o and K E 2 display significant geographical differences across the three subregions. In Subregion 1 of the Luzon Strait zone, where the strong Kuroshio passes through, high R o values are mainly concentrated along the Kuroshio’s axis and at the tips of island capes, and K E 2 reaches tremendous levels at the tail of the Babuyan Islands and the southern cape of Taiwan Island. Due to the presence of complex topography and islands in the Luzon Strait, the intrusion of the Kuroshio motivates abundant submesoscales manifesting elongated filaments and fronts at the tails of the islands [34,55]. Notably, no pronounced seasonal variations are observed in this region compared to the other two subregions. For Subregions 2 and 3, the main dynamical difference is that, in the Western Boundary Current transition zone, submesoscales are significantly influenced by the energetic mesoscale eddies and Western Boundary Current. As indicated by Qiu [35], mesoscale eddies generated by baroclinic instability within the interior of the STCC region in Subregion 3 gradually intensify and mature as they propagate into Subregion 2. Thus, as a crucial generation mechanism for submesoscales, the energetics in the submesoscale band can be significantly modulated by the straining of mesoscale eddies and the large-scale current. As shown in Figure 2b, the horizontal scales of mesoscale eddies in Subregion 3 are remarkably smaller than those in Subregion 2. Additionally, high K E 2 values are predominantly concentrated around the mesoscale eddies in both subregions, highlighting the correlation between submesoscales and mesoscale eddies. Previous studies have confirmed the seasonal modulations of submesoscales in this region [19], but the spatial and seasonal variability in submesoscale energetics remains poorly understood.

3.2. Spatial and Seasonal Characteristics of Submesoscale APE

To investigate the spatial and seasonal characteristics of submesoscale energetics across different subregions, we first present the depth profiles of spatially averaged submesoscale APE and KE of the upper 400 m in the three subregions in Figure 3a. Vertically, the strength of A P E 2 and K E 2 in Subregion 1 is significantly greater than that in Subregions 2 and 3, with large values extending beyond the mixed layer and penetrating down to 200 m underwater. Meanwhile, no significant seasonal variability is observed. This indicates that the seasonally dependent mixed-layer baroclinic instability is out of the primary mechanism in generating submesoscales in the Luzon Strait zone, consistent with previous studies [32,34]. However, in Subregions 2 and 3, most of the A P E 2 and K E 2 is confined to the mixed layer and declines rapidly below it. They exhibit pronounced seasonality, which is significantly amplified in late winter and early spring while being weakened during other periods. The intensities of both A P E 2 and K E 2 in Subregion 2 are marginally greater than those in Subregion 3. As mentioned above, the main difference between the two subregions is that Subregion 2 is filled with well-developed mesoscale eddies and significantly influenced by the strong Western Boundary Current, while Subregion 3 is the origin of western-propagating mesoscale eddies and is not directly affected by the strong Kuroshio; we therefore speculate that mixed-layer baroclinic instability and mesoscale-induced frontogenesis simultaneously and collectively exert important effects on submesoscales.
Figure 3b displays the horizontal wavenumber spectra of surface KE in summer (solid lines) and winter (dotted lines) for the three subregions. As demonstrated, the surface KE density in Subregion 1 is significantly greater than that in the other two subregions. Although Subregions 2 and 3 exhibit comparable magnitudes, the surface KE density in Subregion 2 is slightly higher than that in Subregion 3. Furthermore, the surface KE exhibits distinct seasonal characteristics across different subregions. In Subregion 1, the KE density in summer is greater than that in winter across all spatial bands. In the mesoscale band of approximately 50 to 200 km (0.005 to 0.02 cpkm), both the summer and winter spectral slopes approach the interior quasi-geostrophic prediction of K 3 [60,61,62]. However, significant differences arise in the submesoscale band below 50 km (0.02 cpkm). In summer, the spectrum continues to follow the slope of K 3 until 10 km (0.1 cpkm), whereas in winter it follows a shallower slope close to the theory of surface quasi-geostrophic K 2 [63,64]. For Subregions 2 and 3, the KE spectra in the mesoscale bands of both summer and winter display an interior quasi-geostrophic slope of K 3 , similar to that in Subregion 1. However, notable differences emerge in the submesoscale band below 50 km, where the KE spectra follow a steeper slope in summer. Meanwhile, the magnitude of KE density in winter gradually exceeds that in summer, and the spectra in winter drop, following a slope of about K 2 until 14 km (about 0.07 cpkm), below which it decreases sharply owning to the dominant impact of dissipations in the models [23]. Thus, the scale of 14 km can be identified as the effective horizontal resolution of this model, as it needs approximately 4 to 6 grid spacings to adequately resolve an eddy or wave in the simulation [45]. This further validates the model’s capability in resolving mixed-layer baroclinic instability and its suitability for submesoscale energetics research. Additionally, the comparison of the KE spectral slopes with theoretical predictions suggests that mesoscale and summer submesoscale dynamics follow an interior quasi-geostrophic regime, while the winter submesoscale dynamics follow a surface quasi-geostrophic regime. As illustrated below, submesoscale energetics vary significantly in different subregions, indicating that the generation and dissipation mechanisms of the submesoscales are geographically inhomogeneous.
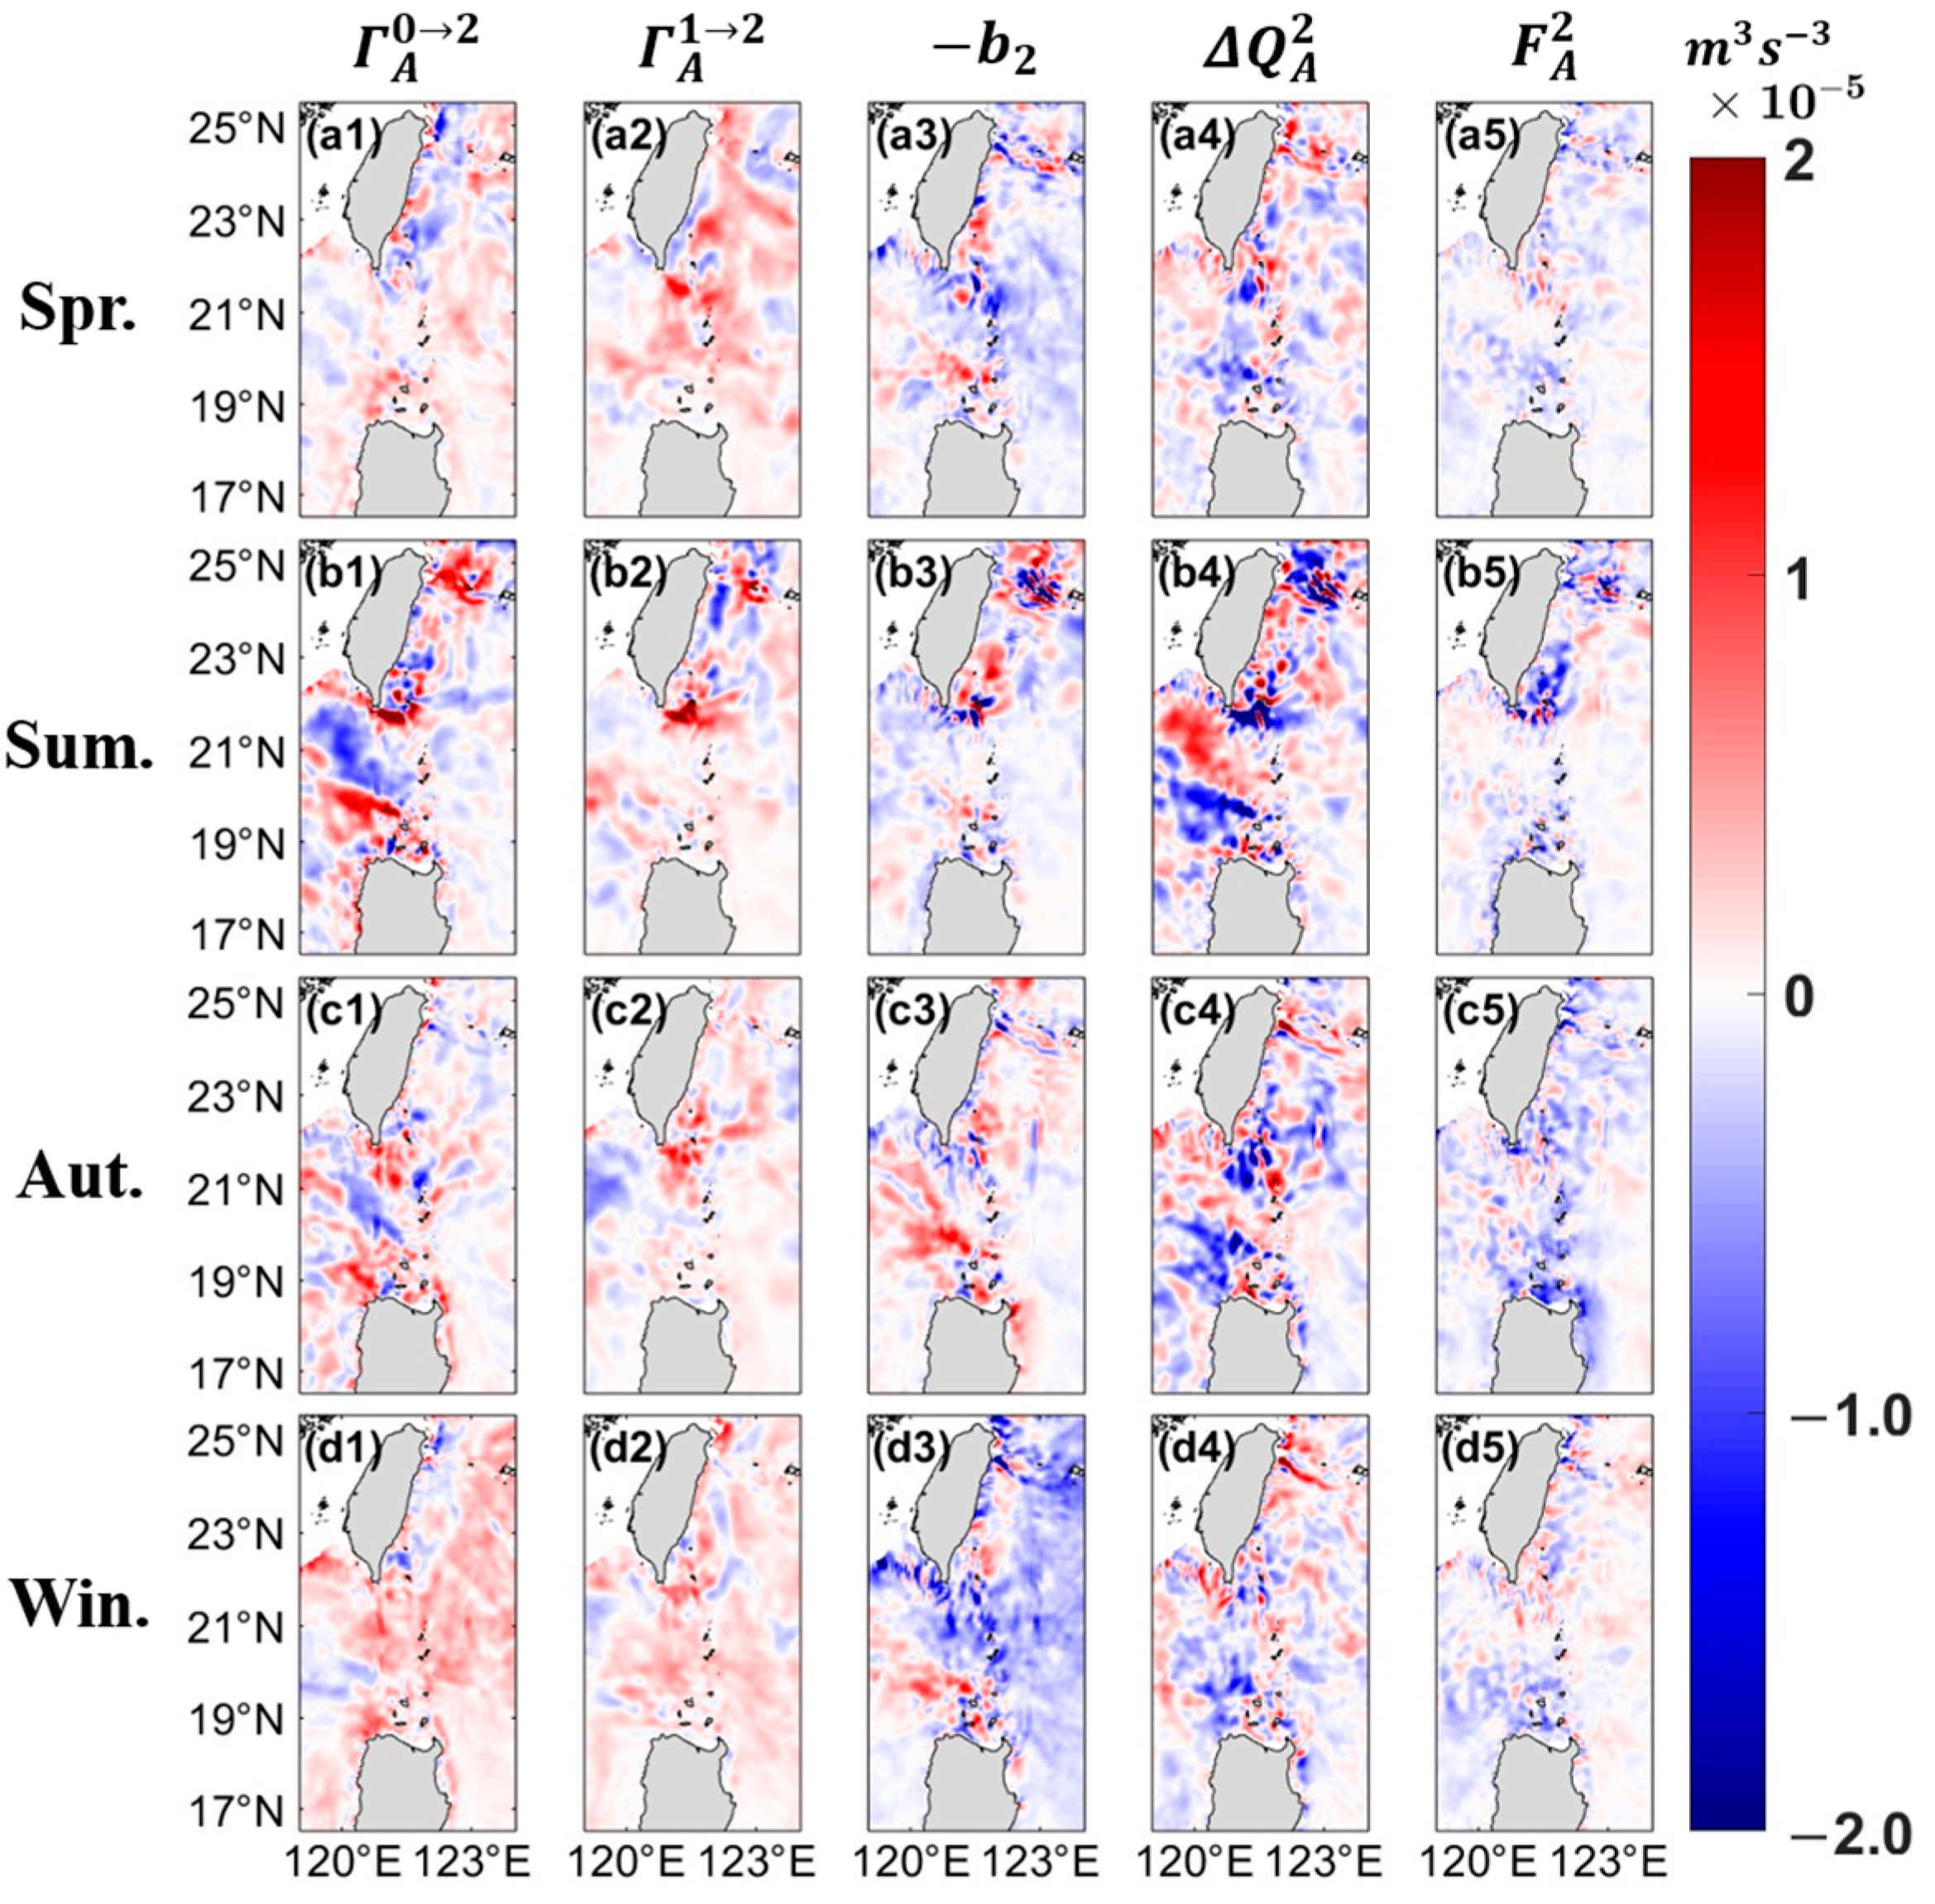
Figure 4 shows the horizontal distributions of vertically integrated submesoscale APE energetics across four seasons in Subregion 1 within the upper 200 m. The baroclinic canonical transfer of Γ A 0 2 and Γ A 1 2 displays overwhelming positive patterns throughout the entire year, without significant seasonal variations. This means that the large-scale current and mesoscale eddies are characterized by energizing submesoscales through forward cascades. Specifically, when the strong Kuroshio flows through the Luzon Strait, it always intrudes into the SCS in the forms of leaking, leaping, and looping, and transports substantial volumes of seawater into the SCS [64,65]. Due to the obstruction of islands and complex bathymetry in the Luzon Strait, combined with the differences in water mass properties between the Northwest Pacific Ocean and the SCS, abundant submesoscales are generated at the tails of islands and complex topography. Zhao [56] examined the genesis of mesoscale eddies in the upper layer of the SCS using the HYCOM reanalysis dataset and came to the same conclusions. Simultaneously, the presence of fragmented negative patterns in Γ A 0 2 ( Γ A 1 2 ) indicates weak inverse cascades from submesoscales to larger scales, which is particularly evident in summer for Γ A 0 2 southwest of Taiwan. This phenomenon may be attributed to the absorption of submesoscales by the Kuroshio Current.
Unlike Γ A 0 2 and Γ A 1 2 , the buoyancy conversion b 2 displays distinct seasonal variations, with negative values prevailing in winter/spring and positive values dominating in summer/autumn. In winter, the mixed layer deepens due to intense surface cooling from atmospheric forcing, leading to a significant accumulation of APE in the upper ocean. Consequently, buoyancy conversion from APE to KE is strengthened. However, the increased positive pattern of positive b 2 in autumn, as shown in Figure 4(c3), appears to be odd, with the expectation that mixed-layer baroclinic instability facilitates the conversion of APE to KE. This may be linked to the remarkable differences in water mass properties, which facilitate the energy conversion from KE to APE.
As another major term, the APE advection Δ Q A 2 exhibits no distinct seasonal characteristics. Instead, it demonstrates spatial patterns that compensate for the sum of the first three main energy terms: Γ A 0 2 , Γ A 1 2 , and b 2 . Particularly, during the summer, submesoscale energetics are dominated by Γ A 0 2 , while Γ A 1 2 and b 2 exhibit relatively small magnitudes, and Δ Q A 2 displays a negative spatial pattern with Γ A 0 2 . However, this circumstance is governed by the sum of Γ A 0 2 and b 2 in autumn. The opposite spatial patterns indicate that the canonical transfer by baroclinic instability, together with buoyancy conversion, is primarily balanced by the advection process in the Luzon Strait. A positive (negative) value of Δ Q A 2 represents the convergence (divergence) of submesoscale APE. The notable feature in Figure 4(a4–d4) is that the majority of negative values are concentrated in the south of the Luzon Strait, while positive-dominated values are located in the northern part. This implies a northward transport of submesoscale APE, aligning with the flow direction of the Kuroshio Current.
The residual term of F A 2 reveals a negative pattern around the island and complex topography, which corresponds to intense turbulence dissipation in the Luzon Strait. At the same time, there are several weak positive areas in the northwest part of the SCS; this is related to external surface wind stress that performs positive work on the ocean [33].
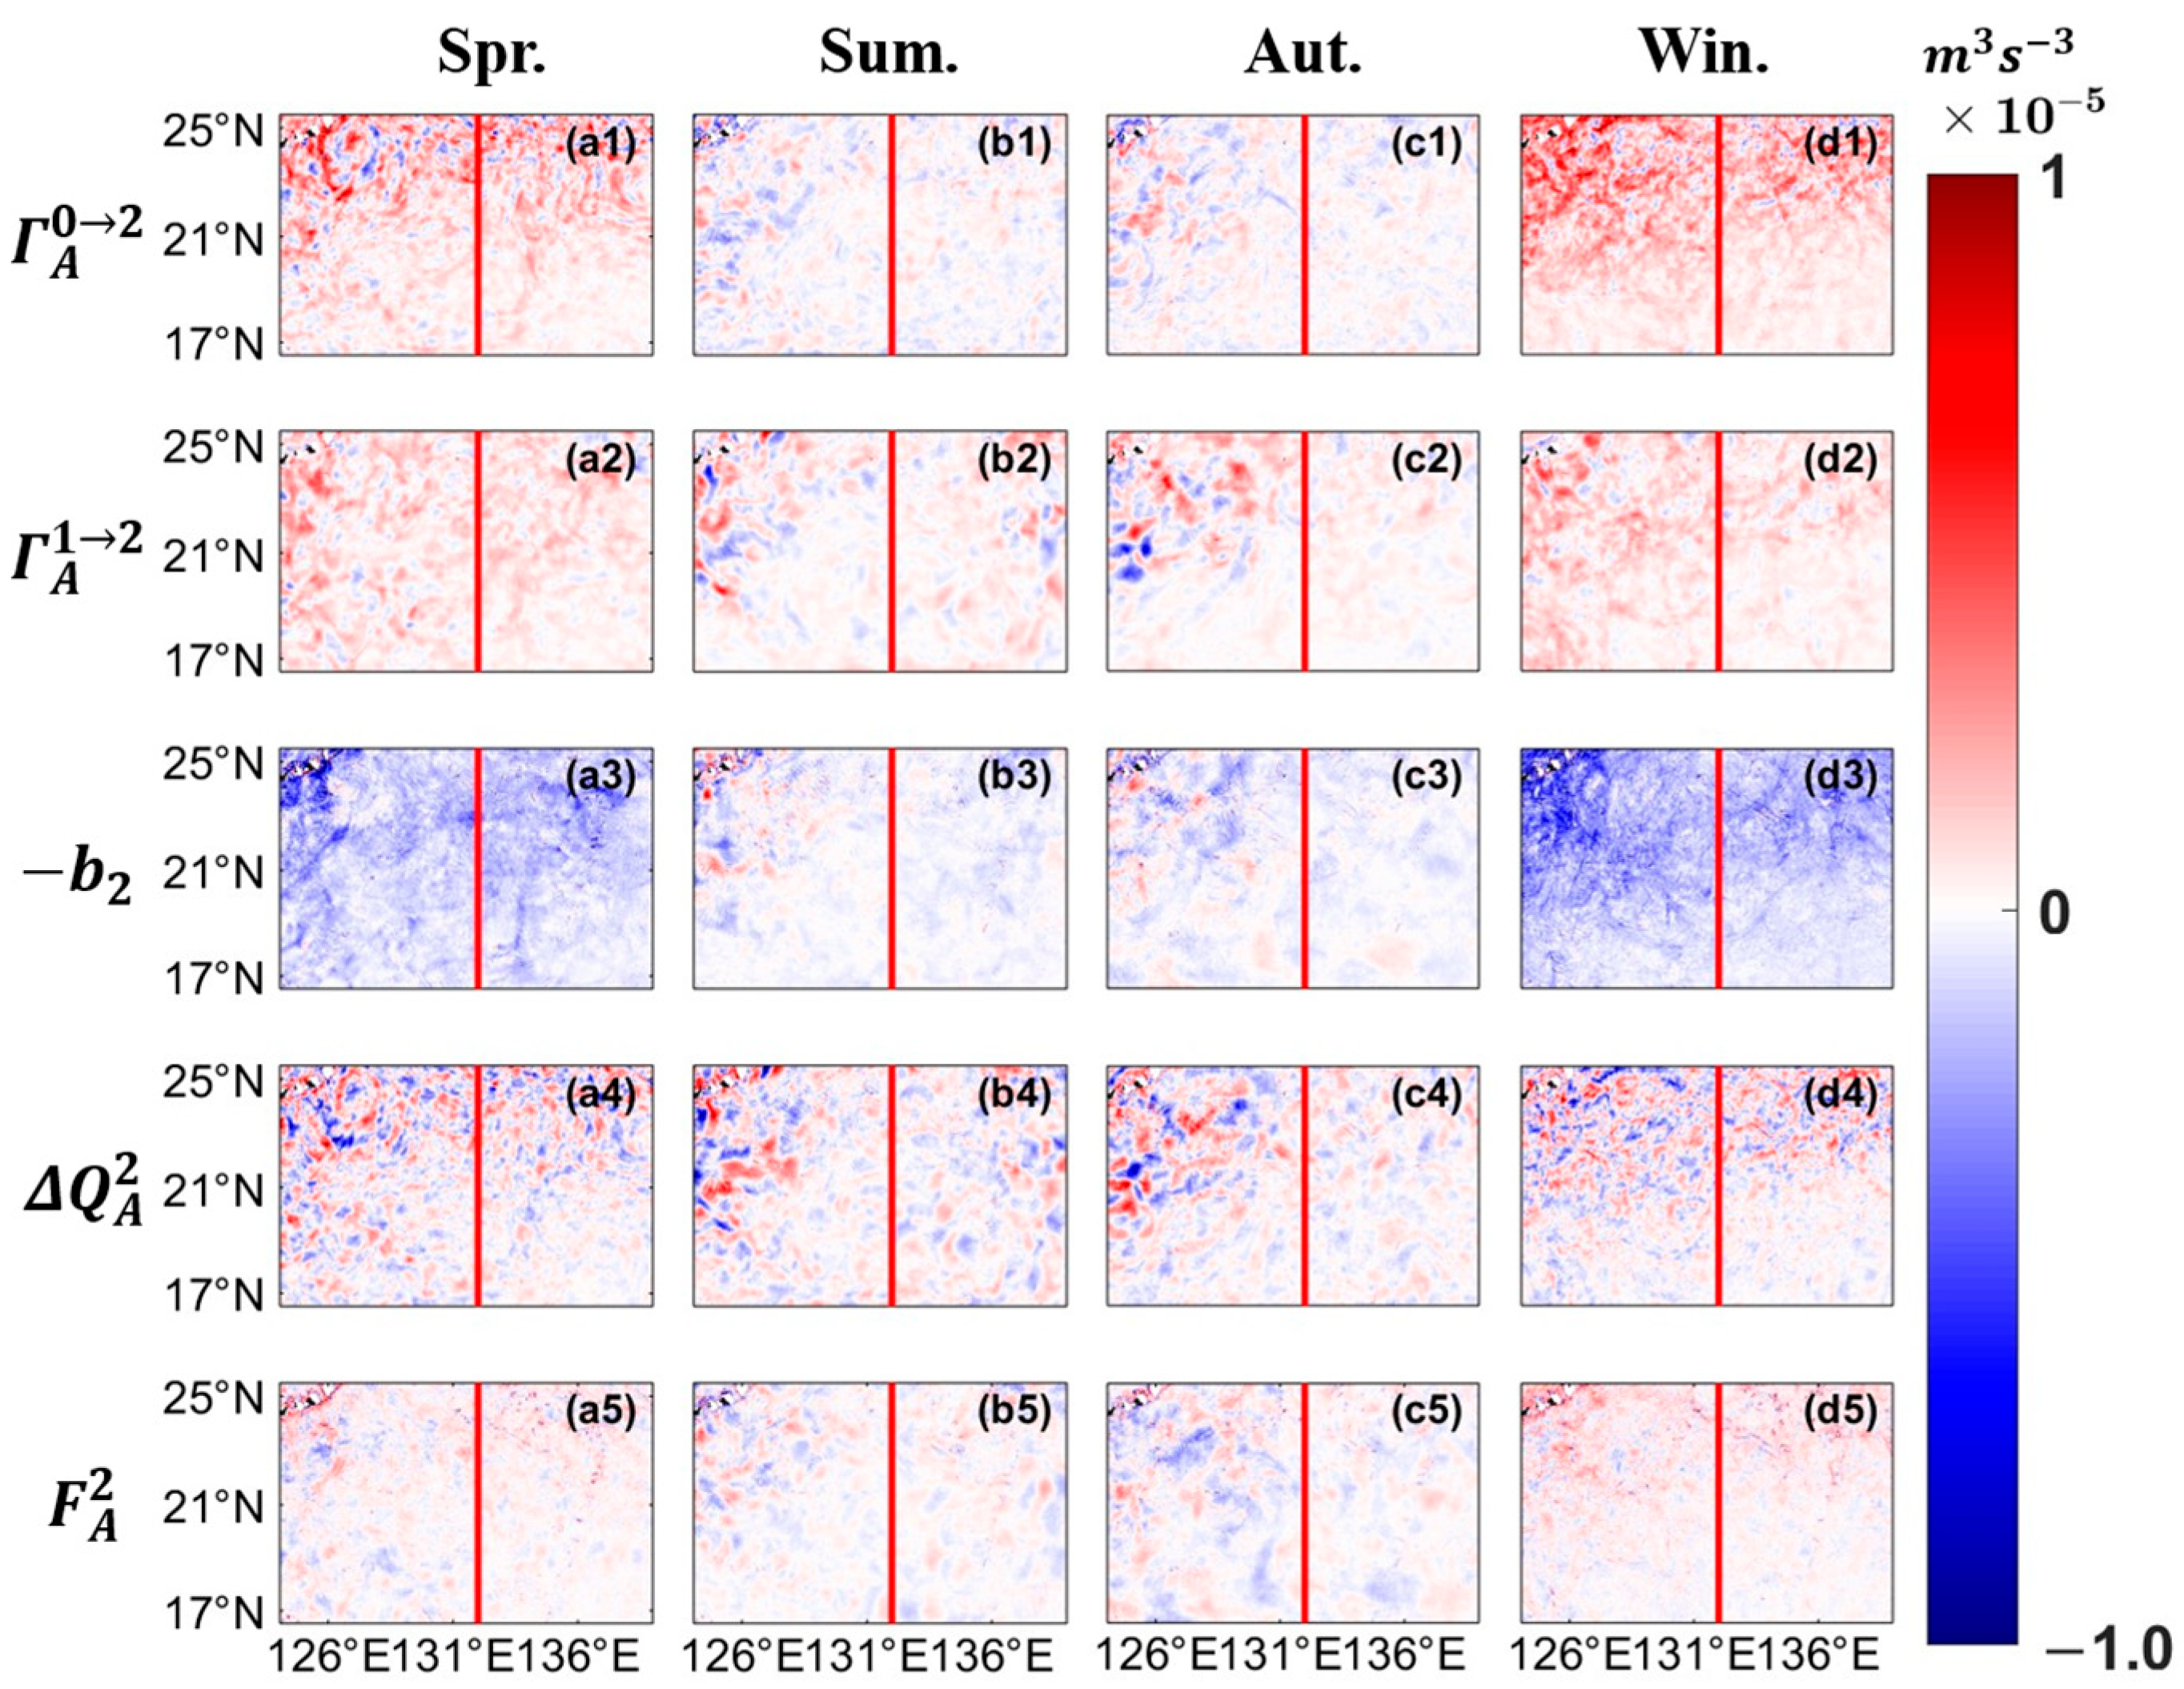
Considering that Subregions 2 and 3 share common dynamical characteristics, we will analyze them together in the subsequent discussions. Figure 5 shows the horizontal distributions of vertically integrated submesoscale APE energetics across four seasons within the upper 200 m. Unlike Subregion 1, the magnitudes of submesoscale APE energetics in Subregion 2 and 3 decrease dramatically and exhibit significant seasonal variations. In winter and spring, baroclinic canonical transfer of both Γ A 0 2 and Γ A 1 2 reveals overwhelming positive patterns indicative of forward energy cascades from larger scales to submesoscales. Previous studies indicate that surface cooling induced by the atmosphere injects an amount of APE at the basin scale in winter, which is subsequently transferred to smaller scales through forward cascades [9,66,67,68]. However, during summer and autumn, Γ A 0 2 and Γ A 1 2 feature scattered zones with alternating positive and negative values of relatively small magnitudes, implying the coexistence of weak forward and inverse cascades of APE in the open ocean.
Correspondingly, as the primary sink of submesoscale APE, buoyancy conversion b 2 exhibits a similar spatial pattern to Γ A 0 2 and Γ A 1 2 but features large negative values in winter and spring. This suggests intense energy conversion from APE to KE during this period. However, in summer and autumn, the strength of buoyancy conversion dramatically weakens, even resulting in a reverse transfer from KE to APE. The transmission pathway of APE observed in winter and spring, in which it is mainly transferred from larger-scale flow to submesoscales and subsequently converted to KE through buoyancy conversion, is consistent with the typical submesoscale energetics routes of baroclinic instability in the open ocean [23]. These findings suggest that baroclinic instability serves as the predominant dynamical mechanism for generating submesoscales in this region. Additionally, there are no significant seasonal and spatial variation characteristics for Δ Q A 2 , which exhibits complex patterns with intersecting opposite values. However, it is worth noting that the spatial scale of Δ Q A 2 in spring and winter is much smaller than that in summer and autumn and reveals similar seasonality to that in Figure 2. The residual F A 2 in Subregions 2 and 3 significantly differs from that in Subregion 1. In Subregion 1, F A 2 is characterized by negative values associated with enhanced dissipation. However, in Subregions 2 and 3, F A 2 is predominantly positive, implying that external wind stress performs positive work on submesoscales.
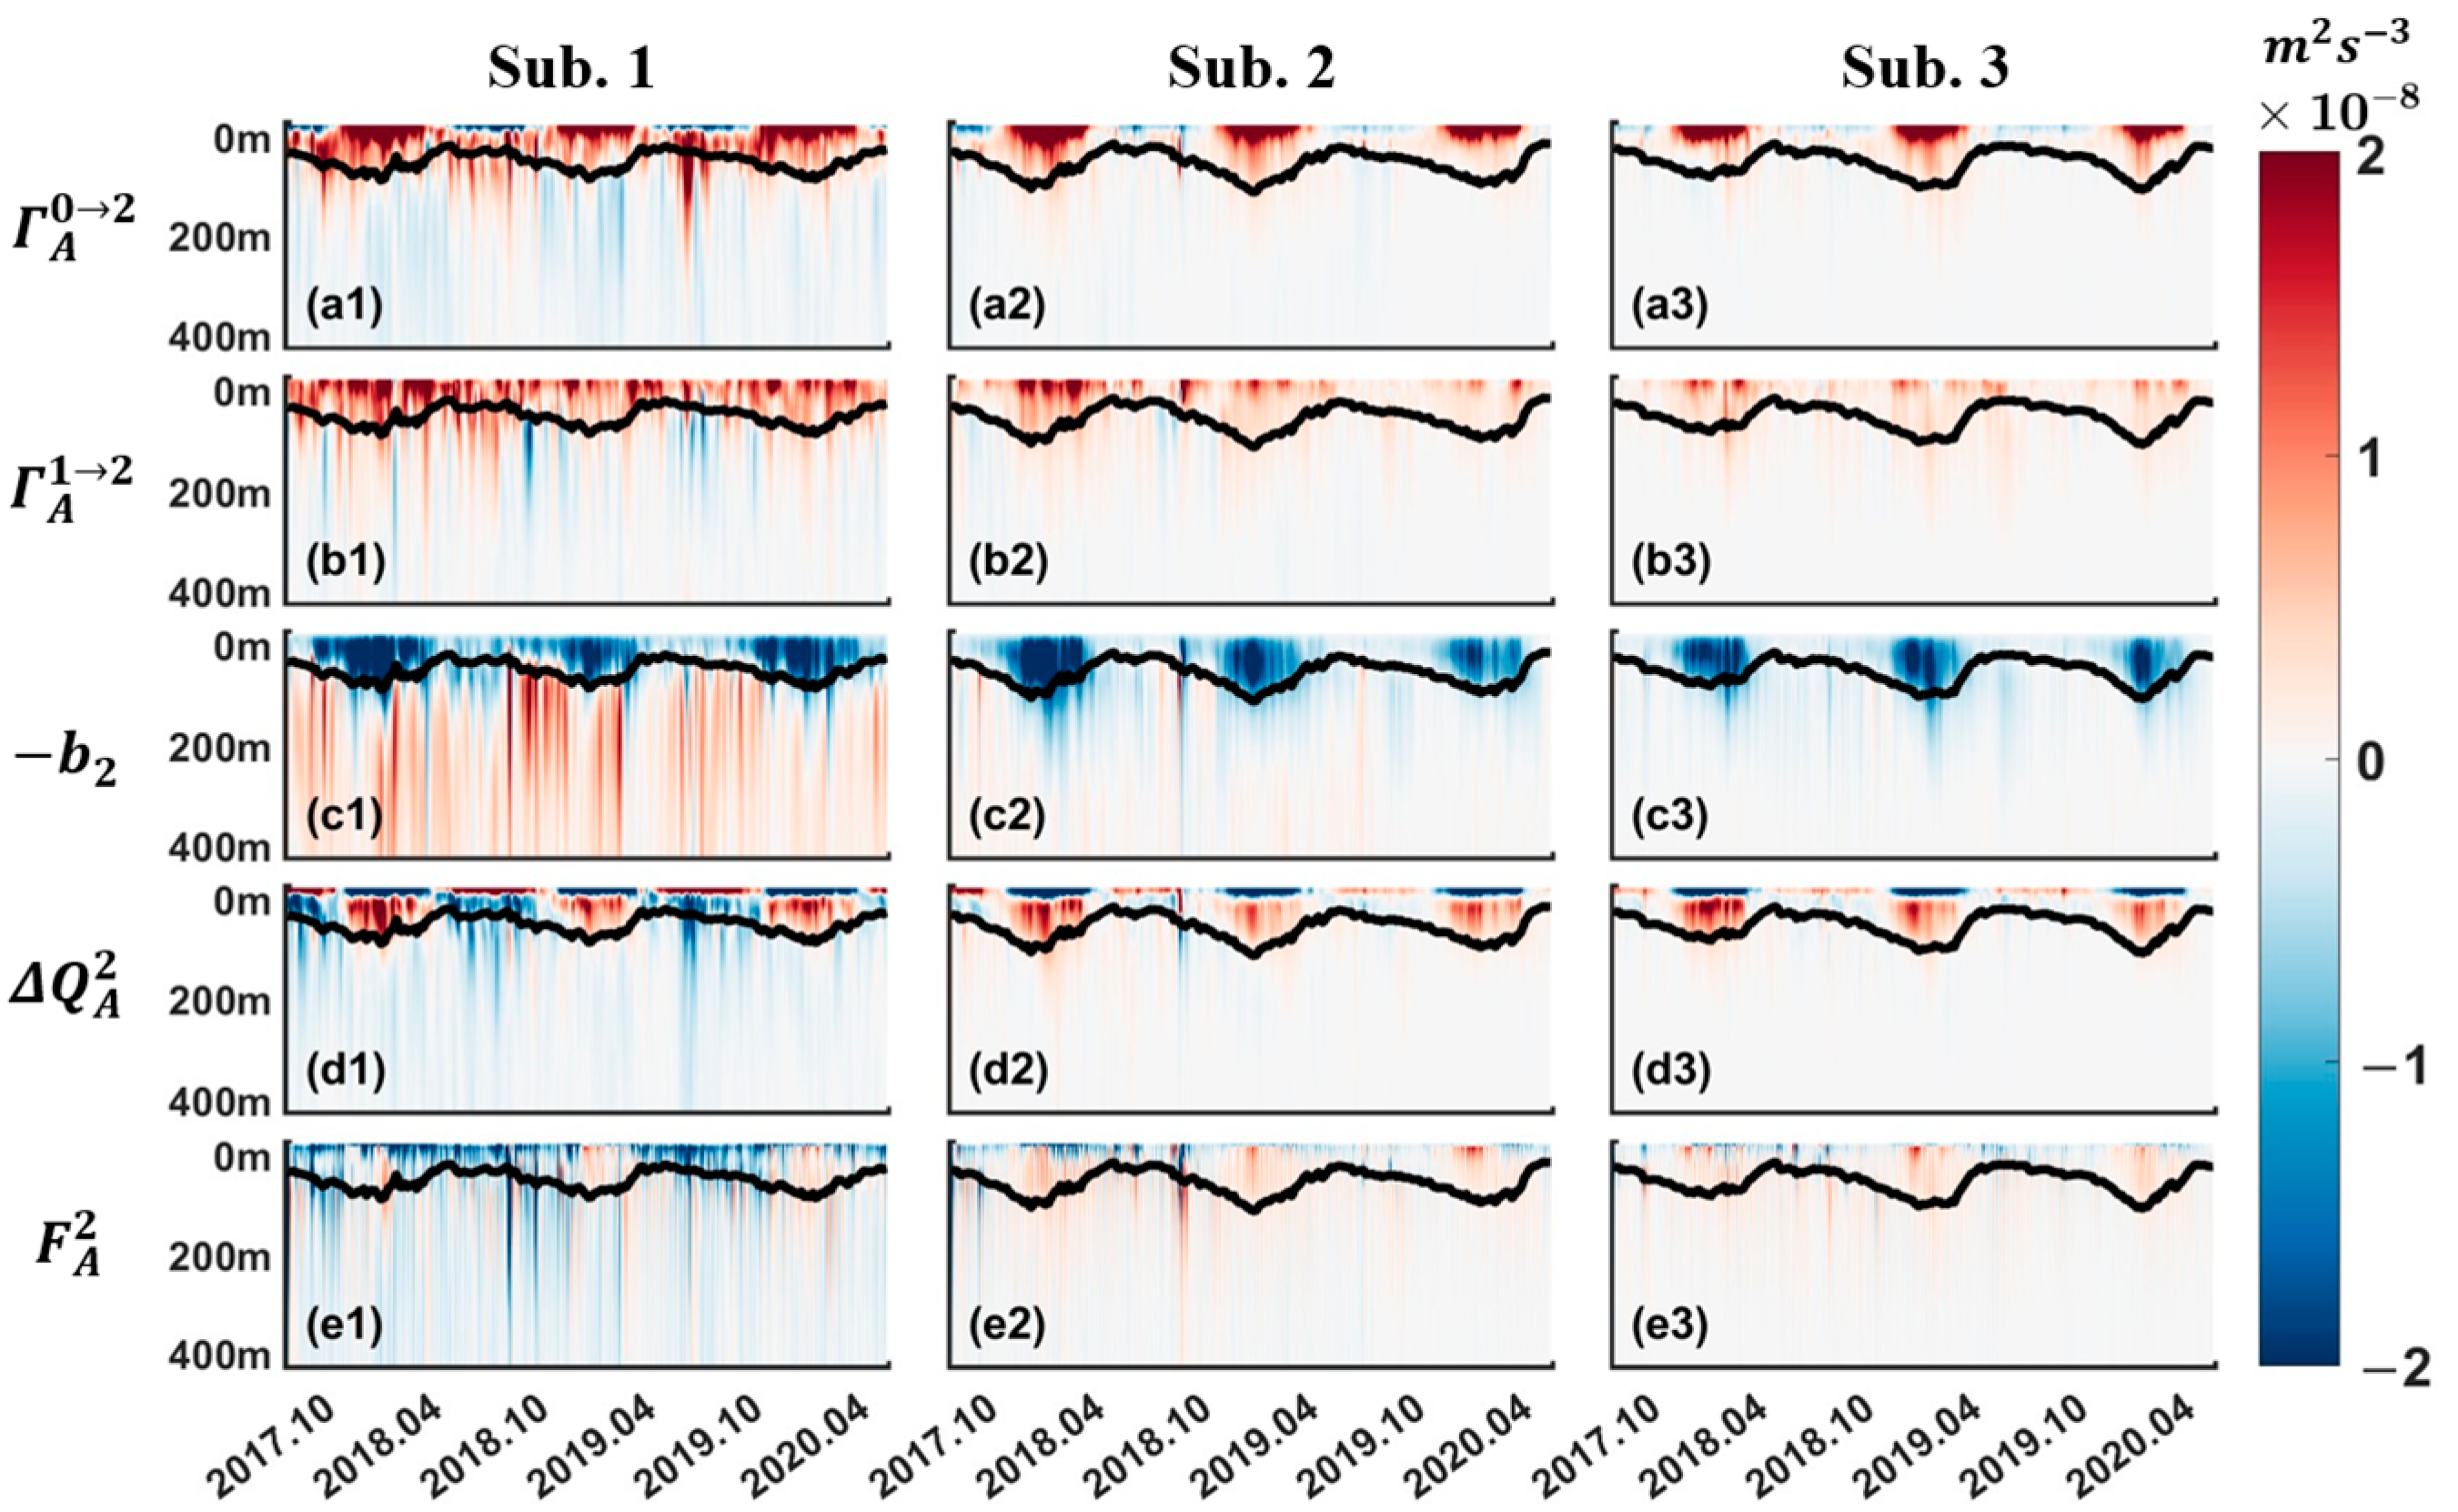
Figure 6 illustrates the vertical profiles of spatially averaged submesoscale A P E 2 energetics of the upper 400 m for the three subregions. As shown, the vertical distributions of energetics in Subregion 1 (a1–e1) show significant differences with those in Subregions 2 (a2–e2) and 3 (a3–e3), and the patterns in Subregions 2 and 3 are nearly identical. In Subregion 1, the baroclinic canonical transfer of Γ A 0 2 and Γ A 1 2 is not confined within the mixed layer and can extend down to 300 m underwater. Moreover, their magnitudes are significantly greater than those in Subregions 2 and 3. This further confirms that the seasonally dependent mixed-layer baroclinic instability can be ruled out as the primary mechanism for generating submesoscales in the Luzon Strait. In contrast, Γ A 0 2 and Γ A 1 2 in Subregions 2 and 3 exhibit a remarkable seasonal cycle, with maxima/minima in winter/summer, similar to those elsewhere in the open ocean [14,19,23]. Additionally, their strength in Subregion 2 is slightly greater than that in Subregion 3; this is likely attributable to the existence of the energetic Western Boundary Current and mesoscale eddies that strengthen cross-scale interactions in Subregion 2.
The buoyancy conversion b 2 in all three subregions reveals pronounced seasonal variations within the mixed layer, characterized by significant negative values indicative of intense energy conversion from APE to KE in winter and spring. This is not contradictory to the above conclusion that mixed-layer instability is no longer the main dynamical mechanism for submesoscales in the Luzon Strait. As demonstrated in previous studies [32,33], it is the combination of strain-induced frontogenesis together with mixed-layer baroclinic instability that collectively determines the generation of submesoscales in this region. Although strain-induced frontogenesis plays the leading role in modulating submesoscales, the importance of seasonally dependent mixed-layer baroclinic instability should not be overestimated. Moreover, b 2 exhibits an overwhelming positive pattern beneath the mixed layer, which indicates an opposite buoyancy conversion from KE to APE. We speculate that this may be linked to the remarkable differences in seawater properties, which convert a portion of submesoscale KE into APE in complex topography zones. However, this requires further analyses, which are beyond the scope of the current study and can be addressed in following studies.
The advection and residual terms of Δ Q A 2 and F A 2 are mainly constrained within the mixed layer in Subregions 2 and 3, whereas they extend to a depth of 100 m underwater in Subregion 1. Additionally, Δ Q A 2 in all three subregions exhibits remarkable seasonal variations with similar patterns, featuring a shallow layer of negative values within the upper 10 m and positive values below in winter and spring, and vice versa at other times. This indicates that submesoscale APE exhibits opposing transport directions across different seasons, specifically transporting downward in winter and spring, and upward in summer and autumn. F A 2 exhibits an overwhelming negative pattern indicative of strong diffusion in Subregion 1. Conversely, Subregions 2 and 3 are characterized by weak positive values associated with buoyancy flux in the open ocean.
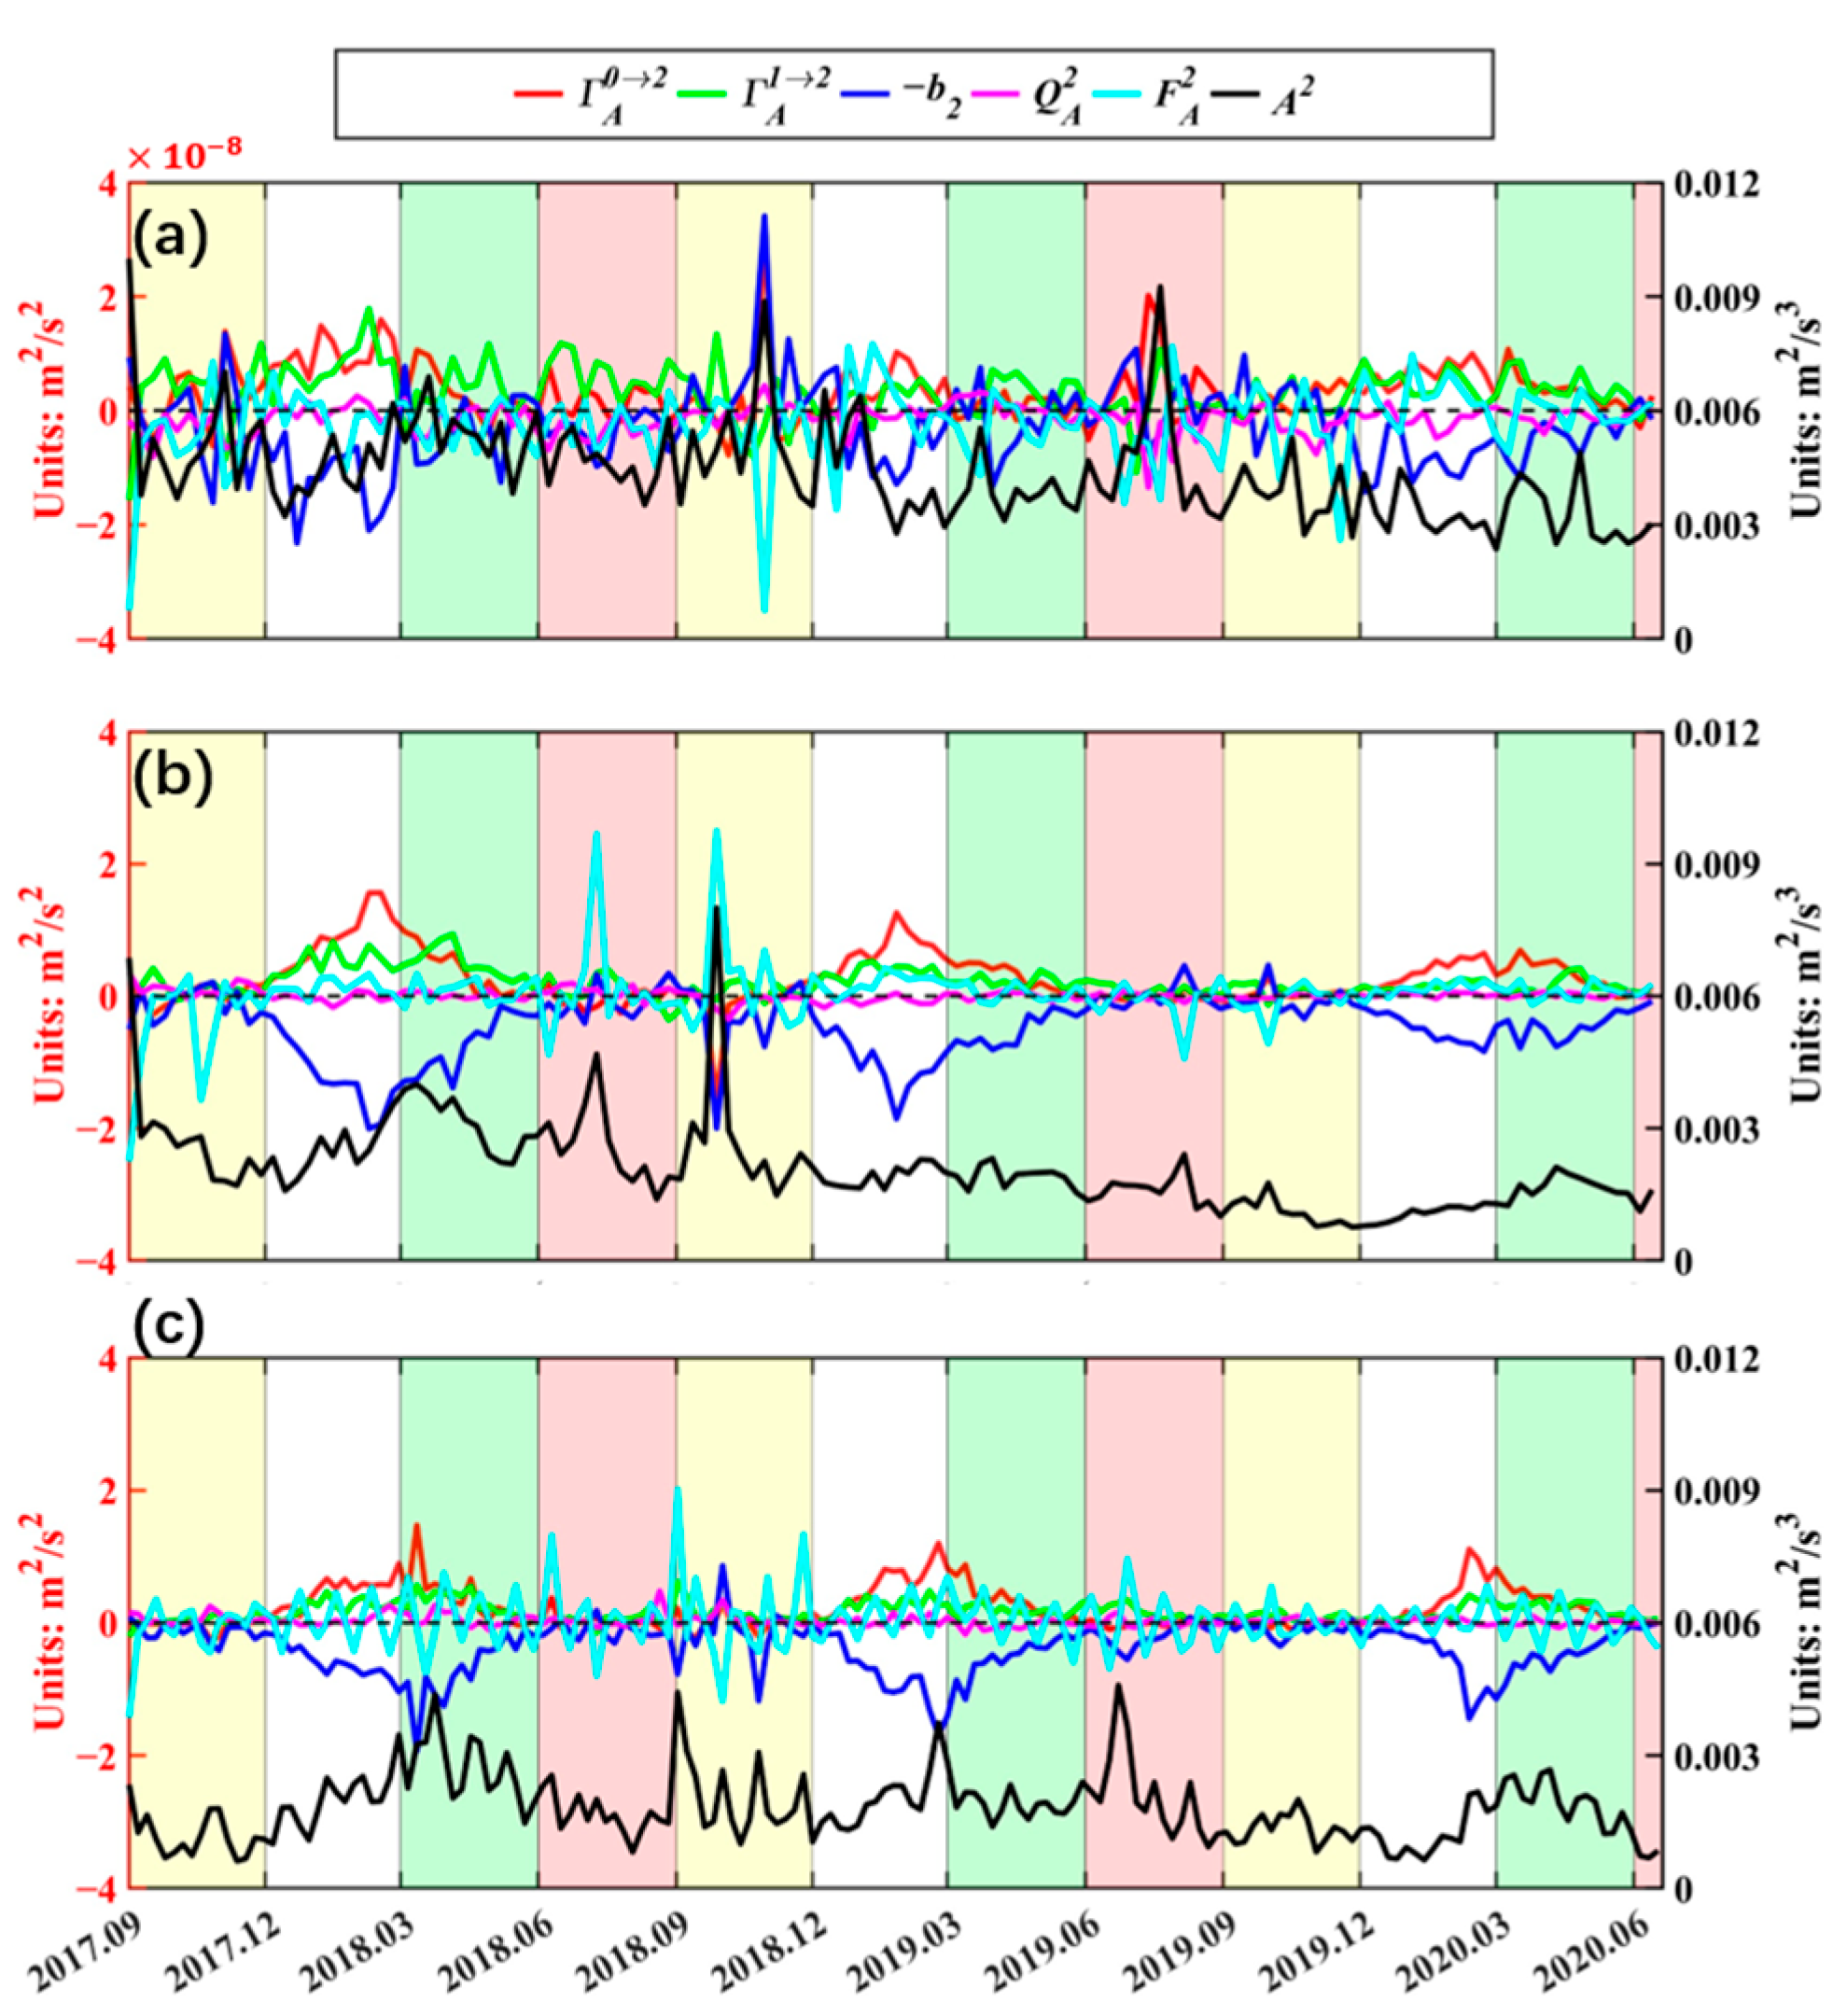
Figure 7 shows the time series of spatially averaged A P E 2 energetics for the three subregions within the upper 200 m. The most notable feature is that the energetics in Subregions 2 and 3 show significant seasonality, but there is no significant seasonal variation in Subregion 1. Meanwhile, the magnitude of A P E 2 in Subregion 1 is significantly greater than that in the other two subregions. In Subregion 1, the baroclinic canonical transfer of Γ A 0 2 and Γ A 1 2 is characterized by positive values, and they serve as the two primary sources of submesoscale APE, which are mainly balanced by the negatively dominated b 2 , Δ Q A 2 , and F A 2 . Correspondingly, in winter and spring in Subregions 2 and 3, the positive Γ A 0 2 predominantly contributes to the source of A P E 2 , while the strength of baroclinic canonical transfer from mesoscales Γ A 1 2 remains relatively weak. According to Qiu [35], the Subtropical Countercurrent and the North Equatorial Current (STCC-NEC) system has a large vertical velocity shear and a weak vertical stratification in spring, subjecting it to strong baroclinic instability and the seasonal modulation of the STCC’s mesoscale eddy field. Therefore, we speculate that the significant increase in Γ A 0 2 in both winter and spring could be attributed to the combined effects of baroclinicity from the STCC-NEC system and atmosphere-forced surface cooling. Similarly, Γ A 1 2 serves as the second leading source of A P E 2 . Qiu [35] suggests that seasonal variations in the mesoscale eddy in the STCC are the result of shifts in STCC-NEC baroclinic instability, and in winter and spring, the magnitude of Γ A 1 2 in Subregion 2 is slightly greater than that in Subregion 3. Based on the work of Wu [40], this can be explained by the intense mesoscale eddy activities in Subregion 2. Meanwhile, the negative buoyancy conversion indicative of energy transfer from APE to KE serves as the primary sink of A P E 2 . Nevertheless, in summer and winter, the strength of all A P E 2 energetics reduces dramatically due to the absorption of submesoscales by mesoscale eddies [23]. The other two energetics of Δ Q A 2 and F A 2 are relatively small and play insignificant roles in the A P E 2 balance.

3.3. Spatial and Seasonal Characteristics of Submesoscale KE

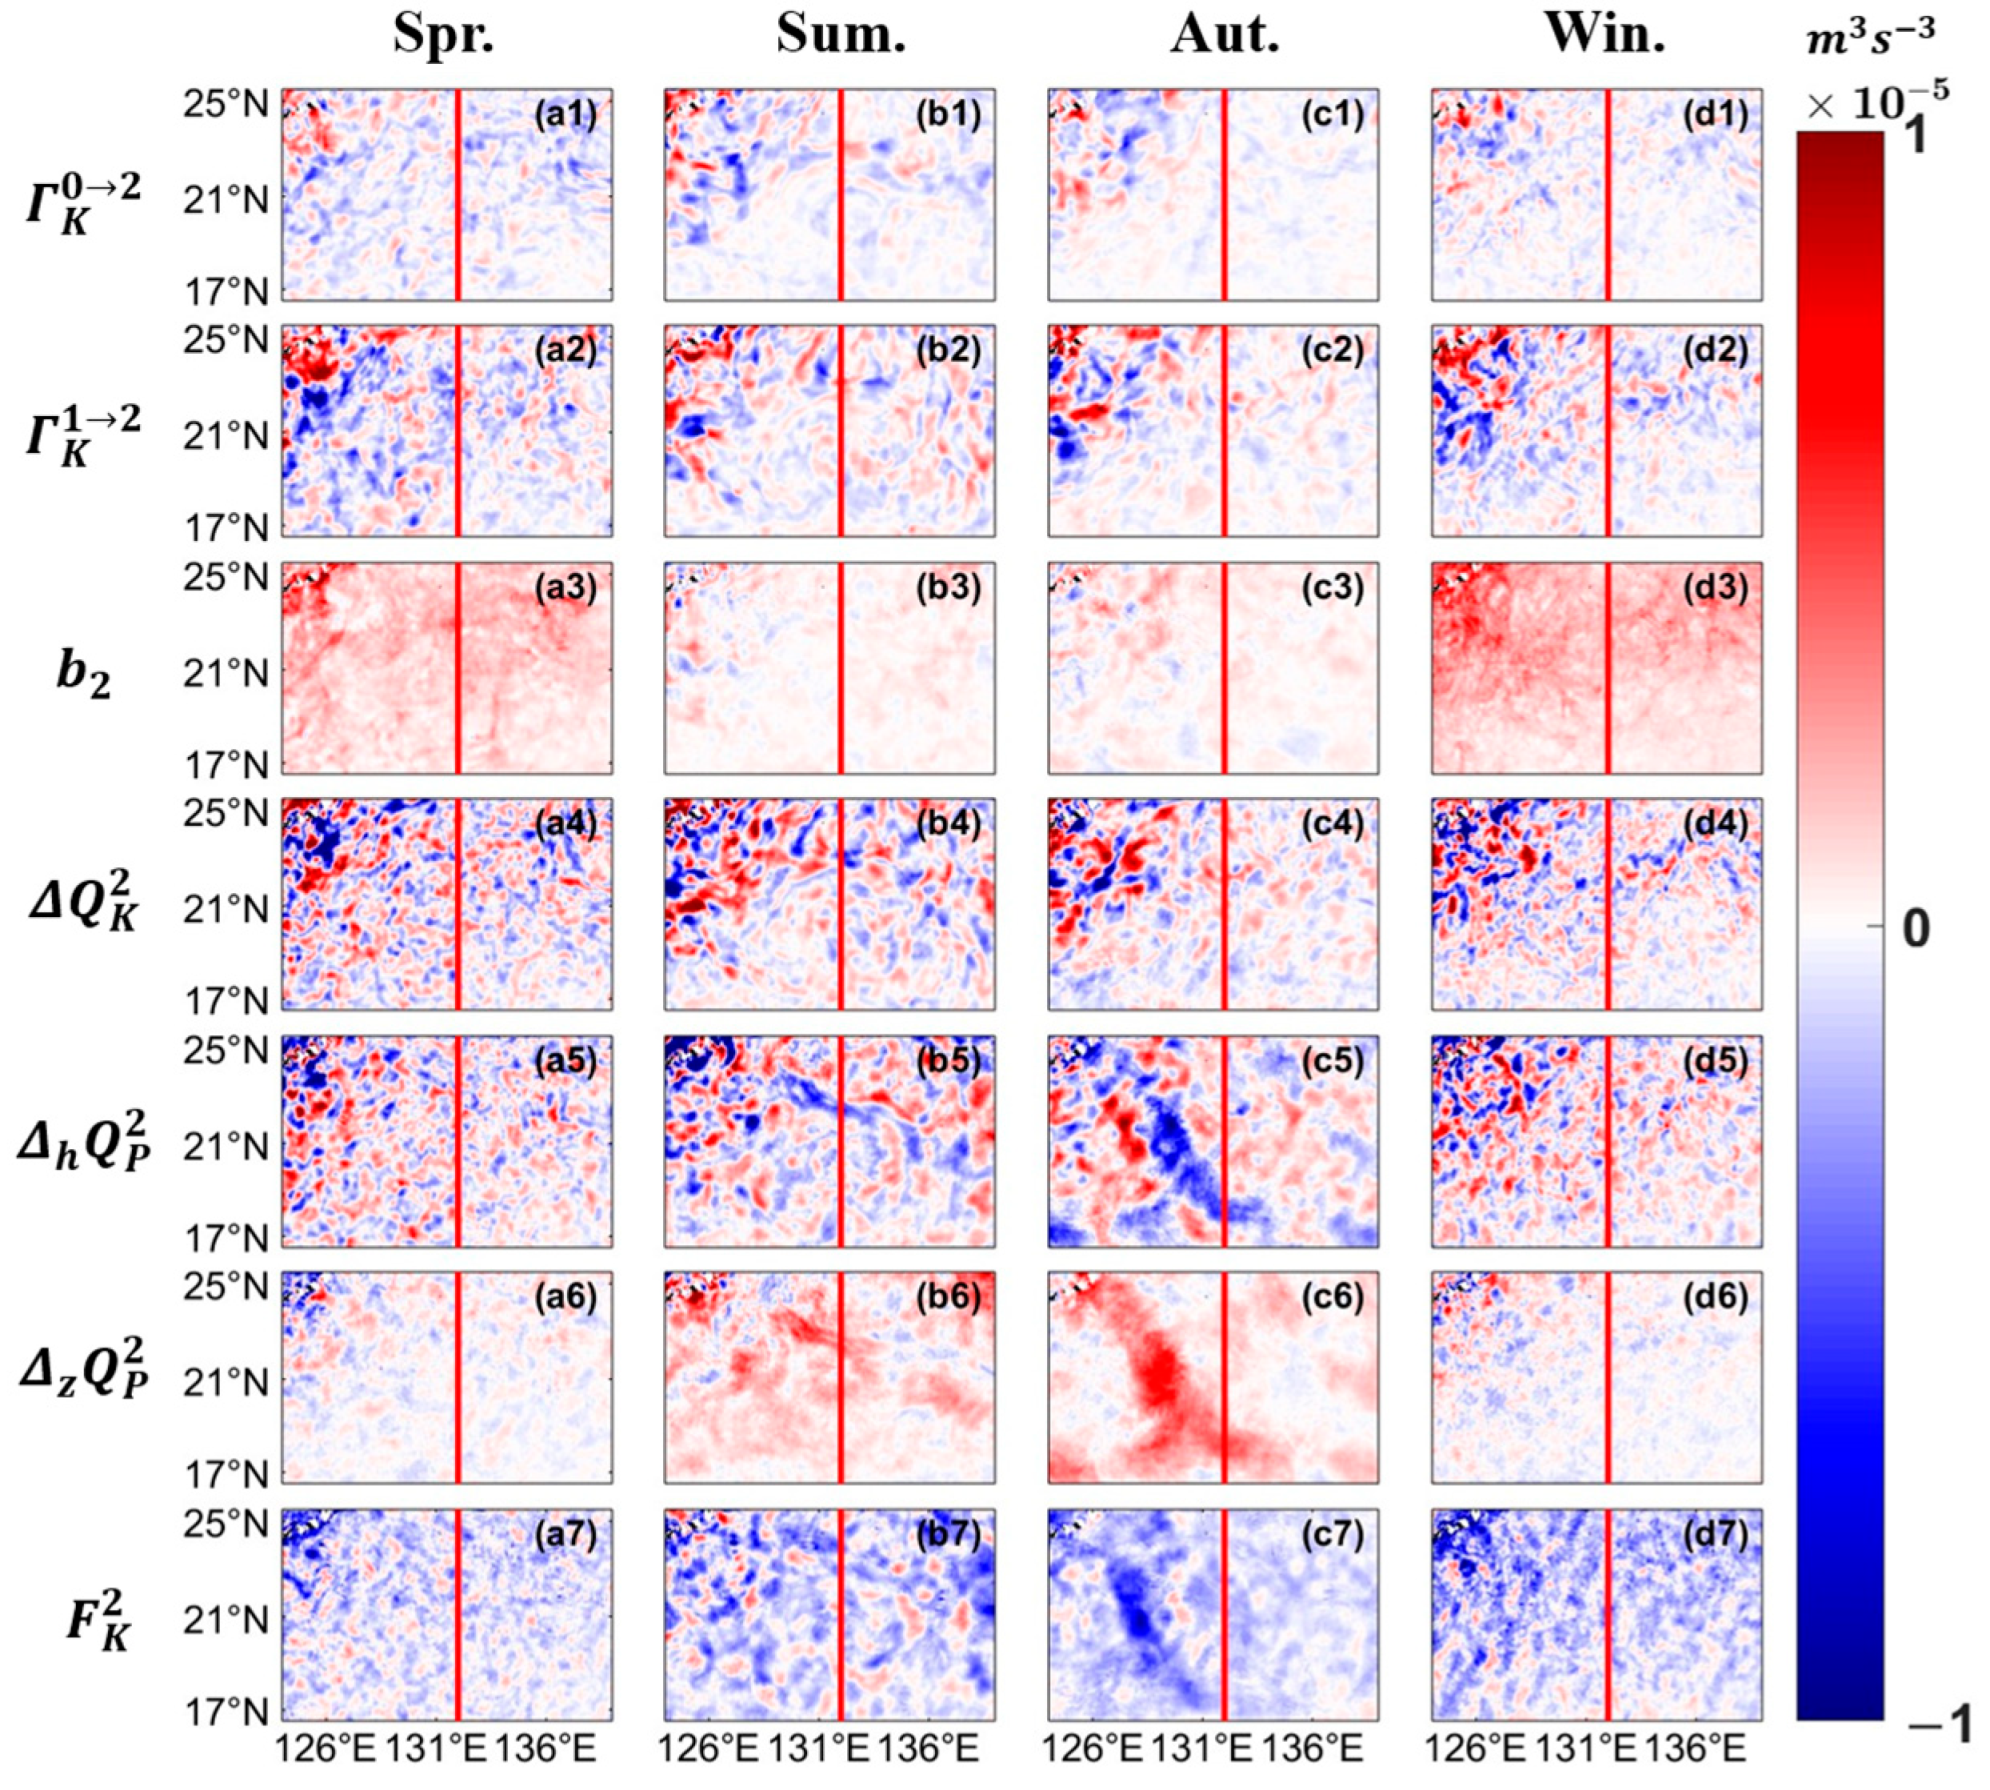
The spatial and seasonal characteristics of submesoscale APE energetics in the Northwest Pacific Subtropical Ocean have been thoroughly investigated above. This section will examine the energetics of submesoscale KE across the three subregions. Figure 8 displays the vertically integrated submesoscale KE energetics within the upper 200 m across the four seasons in Subregion 1. Overall, the energetics of K E 2 are dominated by five terms of barotropic canonical transfer from large Γ K 0 2 and mesoscale Γ K 1 2 , the advection term of Δ Q K 2 , horizontal pressure work Δ h Q P 2 , and the residual term F K 2 . The strength of buoyancy conversion b 2 and vertical pressure work Δ z Q P 2 is relatively weak, and they play insignificant roles in submesoscale KE balance. Moreover, all energetics show no remarkable seasonality, consistent with the patterns observed in submesoscale APE in Figure 4. The barotropic canonical transfer of Γ K 0 2 and Γ K 1 2 is predominantly positive, with significant values observed at the tail of Babuyan Island and the southern cape of Taiwan Island. This suggests that the intrusion of the Kuroshio generates abundant submesoscales due to the obstructive effects of complex topography and meandering islands, strengthening the forward energy cascades. However, in the southwestern and eastern regions of Taiwan Island, there are scattered areas exhibiting relatively weak negative patterns indicative of inverse energy cascades, which have been reported by previous studies and recognized as the absorption of submesoscales by larger-scale currents [69,70]. The buoyancy conversion b 2 is dominated by weak positive values; this indicates that the buoyancy conversion of submesoscales is mainly transferred from APE to KE. Although it serves as one of the crucial components in balancing submesoscale APE in Figure 4, its contribution to energizing submesoscale KE is limited.
The advection term Δ Q K 2 and horizontal pressure work Δ h Q P 2 are two other primary energy components and display a closely opposite spatial pattern with the barotropic canonical transfer Γ K 0 2 and Γ K 1 2 , implying that the generation of submesoscale KE through forward cascades is primarily balanced by local advection process and horizontal pressure work. For example, at the tail of Babuyan Island, Γ K 0 2 and Γ K 1 2 reveal significantly large positive values due to the island’s blocking. Conversely, Δ Q K 2 and Δ h Q P 2 display substantial negative values of the opposite sign. Meanwhile, in the downstream region southwest of Taiwan Island, Γ K 0 2 and Γ K 1 2 are dominated by negative values, implying inverse cascades, while Δ Q K 2 and Δ h Q P 2 are governed by positive patterns, indicating that the advection and horizontal pressure work can redistribute the submesoscale KE throughout the ocean.
Correspondingly, vertical pressure work Δ z Q P 2 is comparatively weak and displays a slight negative pattern in the northwestern SCS; this suggests that the upper ocean transfers submesoscale KE downward through pressure work. Although the strength of Δ z Q P 2 is relatively low, its importance in the vertical KE transport should not be overlooked. Previous studies highlighted the primary dynamics characteristics of the upper ocean layer in regulating intraseasonal fluctuations of the deep SCS [49,50]. Similar to the residual term F A 2 shown in Figure 4, F K 2 also exhibits remarkable increased negative values in the Luzon Strait, particularly in areas where the magnitudes of Γ K 0 2 and Γ K 1 2 are relatively large. This corresponds to the intensified dissipation associated with turbulence [71,72].
In the aforementioned analysis, the spatial and seasonal characteristics of submesoscale APE in Subregions 2 and 3 differ significantly from those in Subregion 1. We therefore anticipate similar differences to be evident in submesoscale KE. Figure 9 reveals the vertically integrated submesoscale K E 2 energetics in Subregions 2 and 3 within the upper 200 m.
As illustrated, the most significant distinction between Figure 8 and Figure 9 is that the submesoscale KE energetics in Subregions 2 and 3 demonstrate pronounced seasonality. The two components of barotropic canonical transfer Γ K 0 2 and Γ K 1 2 , which serve as the main source of submesoscale KE in Subregion 1, become insignificant in Subregions 2 and 3 and even display overall negative patterns indicative of inverse cascades. Moreover, their magnitudes in Subregion 2 are significantly greater than those in Subregion 3, indicating intense multiscale interactions between submesoscales and larger scales in the Western Boundary Current zone.
The buoyancy conversion b 2 exhibits overwhelming positive patterns all year, with increased strength captured in winter and spring. This suggests that buoyancy conversion from APE to KE serves as the primary source in driving submesoscale KE. Meanwhile, b 2 undergoes significant seasonal variations, being dramatically reduced in summer and autumn.
Similar to barotropic canonical transfer of Γ K 0 2 and Γ K 1 2 , the advection term of Δ Q K 2 demonstrates typical seasonal and region-dependent characteristics, being significantly heightened in the Western Boundary Current zone of Subregion 2, while in Subregion 3 its strength is relatively small. Meanwhile, Δ Q K 2 is characterized by smaller scale in winter and spring, while in summer and autumn its spatial scale gradually increases. Additionally, it exhibits complex patterns with intersecting opposite values, indicating that submesoscale KE can be effectively redistributed in the upper ocean via advection processes.
The horizontal and vertical components of pressure work Δ h Q P 2 and Δ z Q P 2 , respectively, display distinct spatial and temporal differences, with Δ h Q P 2 being significantly larger in magnitude than Δ z Q P 2 . This suggests that horizontal pressure work is more important than the vertical component in submesoscale KE balance. However, this phenomenon does not persist in autumn, when the vertical pressure work Δ z Q P 2 displays obviously increased strength in Subregion 2. The residual term F K 2 is dominated by negative patterns, indicating that the external forcing serves as the sink of submesoscale KE associated with dissipation.
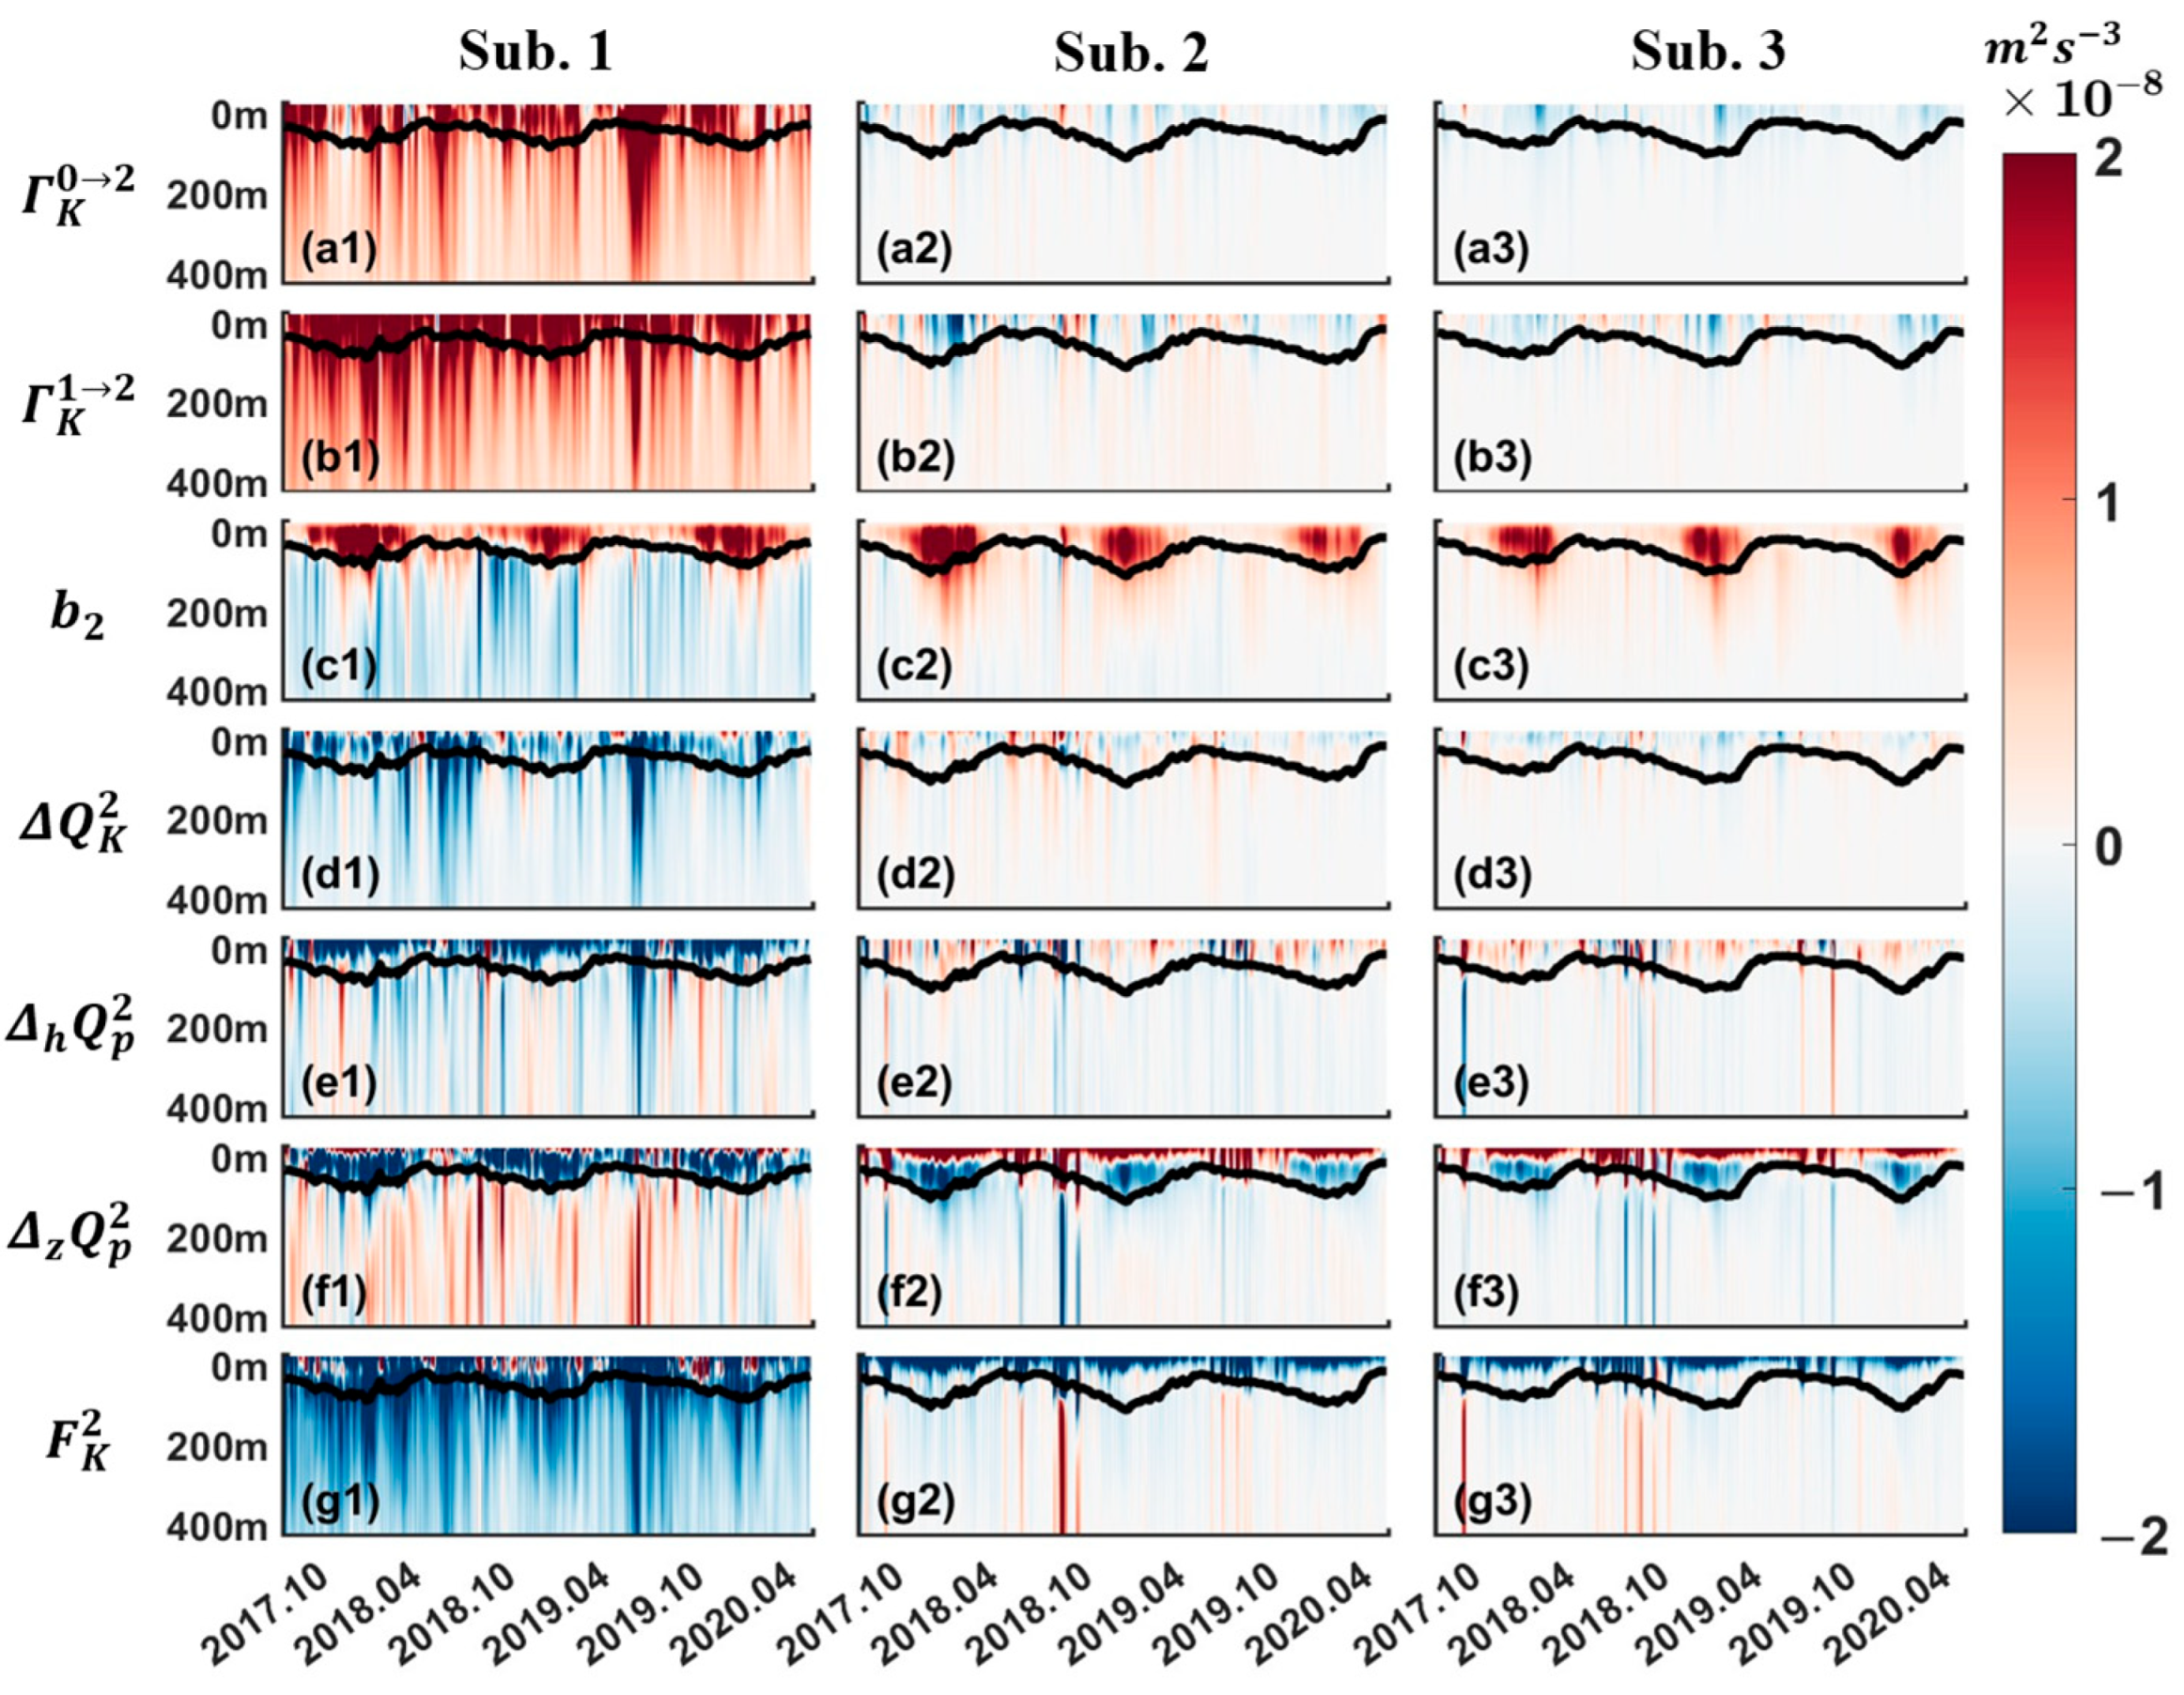
Vertically in Figure 10, the magnitudes of K E 2 energetics in Subregion 1 are significantly greater than those in Subregions 2 and 3 and extend beyond the mixed-layer depth. In Subregion 1, the barotropic canonical transfer of Γ K 0 2 and Γ K 1 2 serves as the primary source of submesoscale KE and shows relatively high positive values within the upper 400 m. In contrast, they display weak negative patterns indicative of inverse cascades in Subregions 2 and 3, and they are limited to the mixed-layer depth, acting as sinks for submesoscale KE.
The buoyancy conversion b 2 is also mainly confined to the mixed layer and demonstrates significant seasonality, which reveals increased positive values during winter and spring across all three subregions. However, below the mixed layer, b 2 is characterized by weak negative values in Subregion 1, while in Subregions 2 and 3 the positive b 2 occasionally penetrates below the mixed layer, with a relatively weak intensity in spring. Meanwhile, b 2 serves as the leading source of submesoscale KE in Subregions 2 and 3, while in Subregion 1, although it also displays large positive values in the upper ocean, its intensity is weaker than that of Γ K 0 2 and Γ K 1 2 . This indicates that buoyancy conversion is not the primary energy source of submesoscale KE in Subregion 1, further evidence that the mixed-layer instability is not the dominant dynamic in generating submesoscales.
The advection term of Δ Q K 2 shows large negative values in Subregion 1, indicating that a significant amount of submesoscale KE generated in the Luzon Strait is transported outward. This phenomenon has been validated by previous studies, which indicate that both submesoscale and mesoscale KE is transported into the northeast SCS via advection processes [27,70]. However, in Subregions 2 and 3, it displays a weak positive layer within the mixed layer. The same time–depth variations are observed in the horizontal pressure work Δ h Q P 2 , which serves to redistribute submesoscale KE across the ocean. The vertical pressure work Δ z Q P 2 in Subregion 1 displays extremely large negative values within the mixed layer and transitions to a relatively weak positive pattern beneath it, implying that vertical pressure is vertically transported from the upper to the subsurface ocean. However, in winter and spring in Subregions 2 and 3, Δ z Q P 2 demonstrates a typical surface-intensified feature, with negative values below it and above the mixed layer. Meanwhile, in summer and autumn, the upper ocean is occupied by negative values, with the negative penetrating to 400 m depth beneath it. The residual term F K 2 in Subregion 1 is dominated by negative values, indicating that the external forcing serves as the sink of submesoscale KE associated with dissipation, while in Subregions 2 and 3 there exists only a shallow negative layer at the surface.
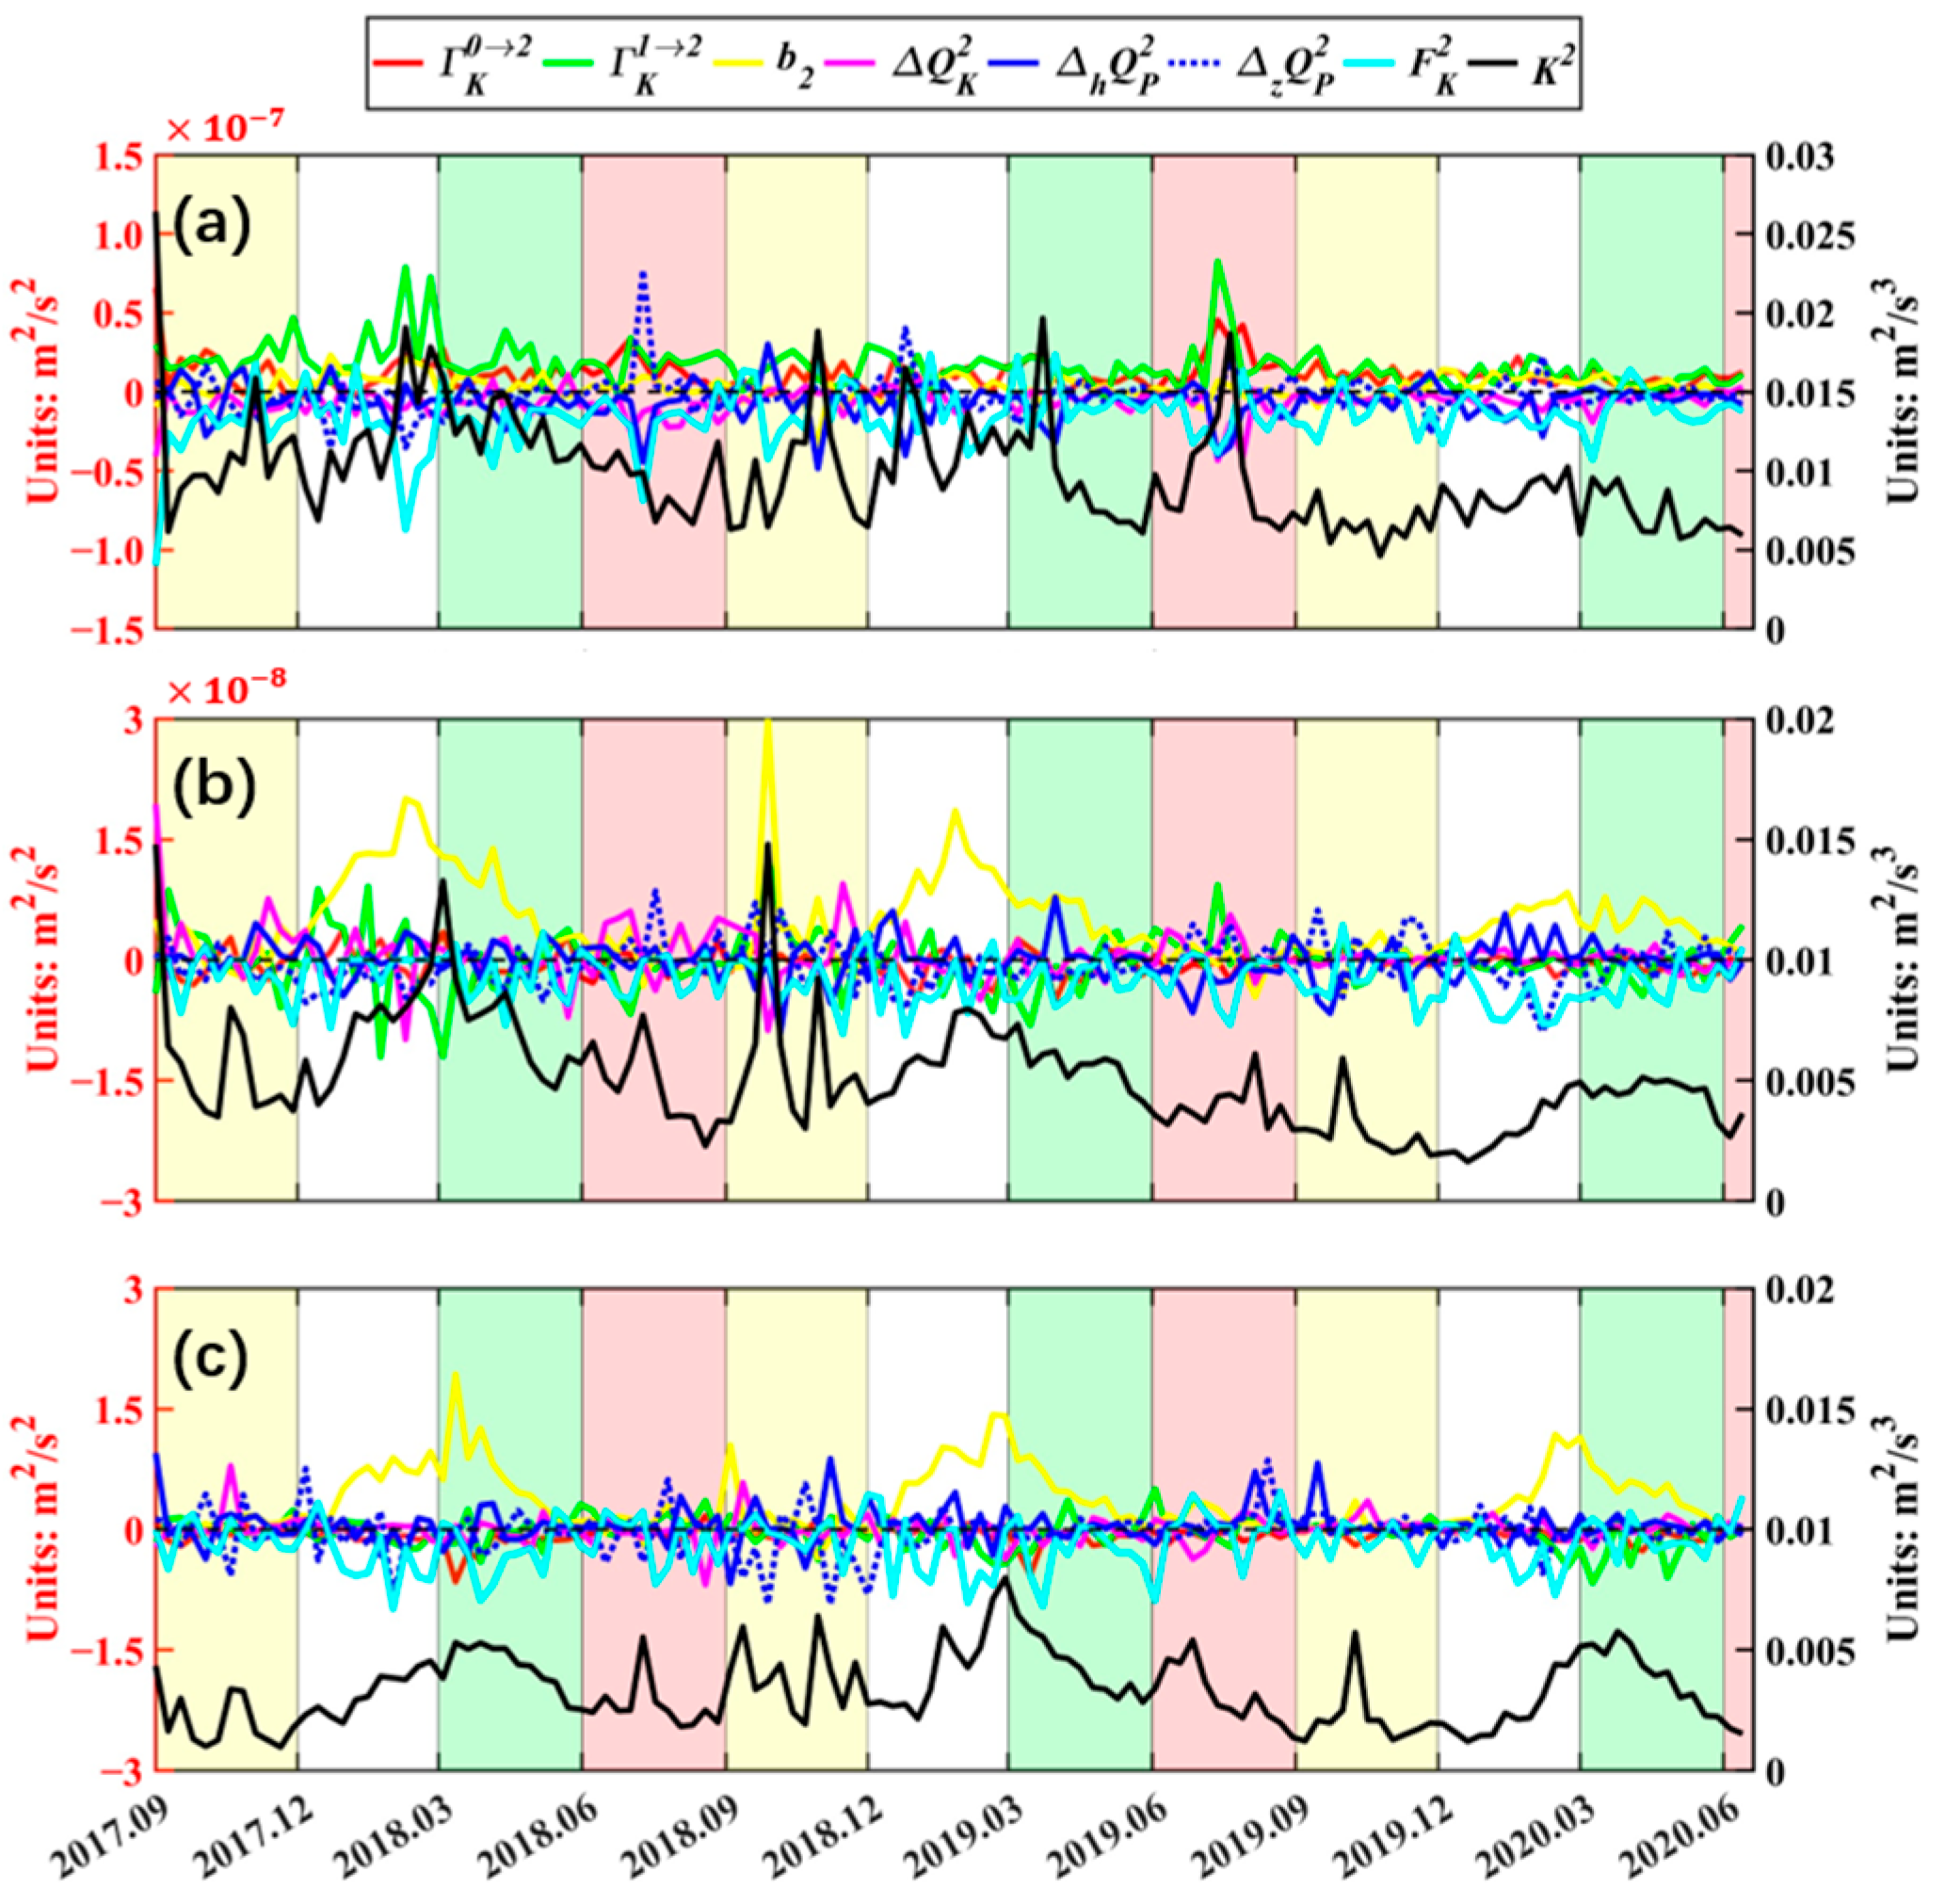
Figure 11 reveals the time series of spatially averaged K E 2 energetics for the three subregions within the upper 200 m. As illustrated, the magnitudes of submesoscale KE energetics in Subregion 1 are about an order of magnitude larger than in Subregions 2 and 3, except for the buoyancy conversion b 2 and the residual term F K 2 . In Subregion 1, submesoscale KE shows no significant seasonal variation; the barotropic canonical transfer of Γ K 1 2 and Γ K 0 2 serves as the two main energy sources, which are balanced firstly by the residual term F K 2 and secondly by the horizontal pressure work Δ h Q P 2 . The other terms are relatively small and play minor roles in the submesoscale KE budget. This appears to be inconsistent with the above analysis in Figure 8(a4–d4), where the advection of Δ Q K 2 also plays a crucial role in the energy balance of submesoscale KE. This is because although the strength of Δ Q K 2 is relatively large and comparable to the magnitude of Γ K 1 2 and Γ K 0 2 , it primarily occurs locally within Subregion 1, causing communication with the external regions to be dramatically reduced. Unlike the temporal variations in Subregion 1, the energetics in Subregions 2 and 3 exhibit significant seasonality, where the buoyancy conversion b 2 serves as the primary contributor to submesoscale KE during winter and spring and is predominantly balanced by the residual term F K 2 , while the Γ K 1 2 , Γ K 0 2 , and other terms remain relatively small. Meanwhile, the strength of both the submesoscale KE and its energetics in Subregion 2 is slightly greater than that in Subregion 3, which further validates our conclusion that the strengthened Western Boundary Current and mesoscale eddies motivate more abundant submesoscales in the open ocean.
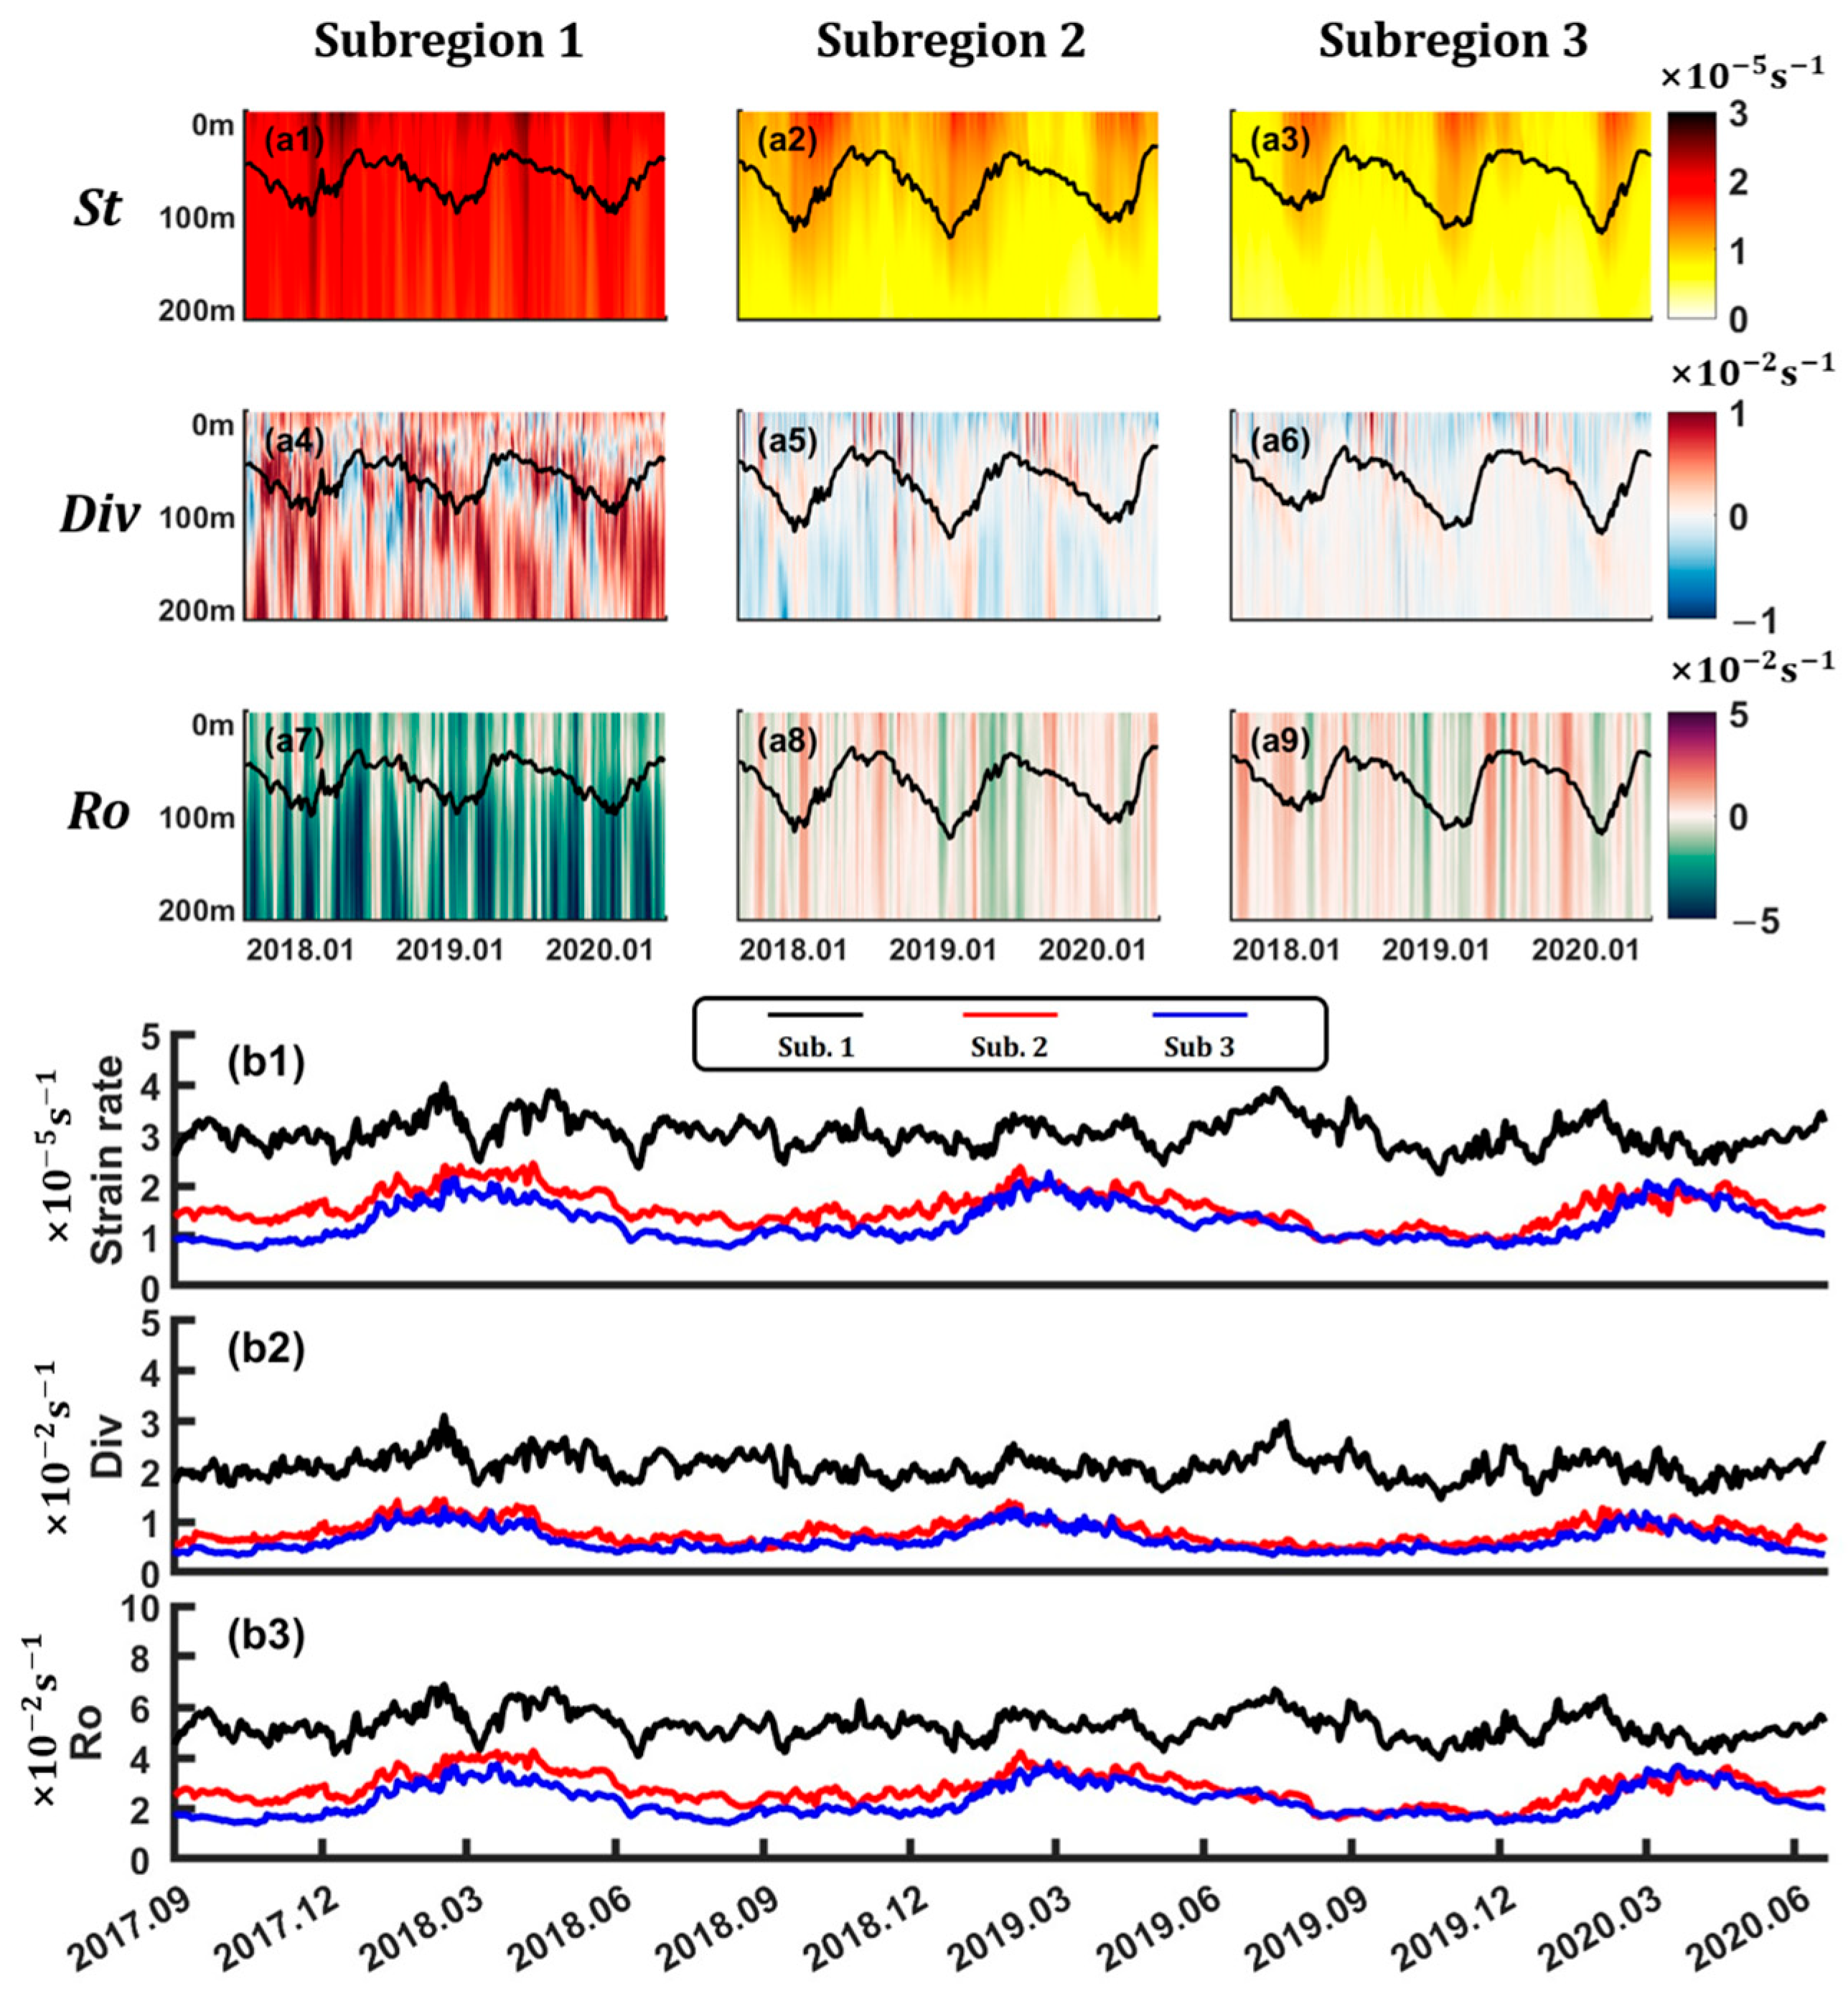
To further confirm this consequence, we plot the depth–time diagrams of spatially averaged strain rate S t (a1–a3), normalized divergence D i v (a4–a6), and Rossby number R o (a7–a9) in the three subregions, along with their surface root-mean-square (RMS) time series, in Figure 12. As shown in Figure 12(a1–a9), the intensities of S t , D i v , and R o in Subregion 1 are significantly greater than those in Subregions 2 and 3 and show no seasonality. Meanwhile, D i v reveals an overwhelming positive pattern indicative of intense convergence in the upper ocean, while R o is predominantly negative. This suggests that Subregion 1 is characterized by active anticyclonic eddies and strong convergence. In Subregions 2 and 3, the three variables are characterized by significant seasonal variations and display semblable vertical and temporal distributions. Meanwhile, their magnitudes in Subregion 2 are slightly greater than those in Subregion 3. This phenomenon is clearly illustrated by the RMS of surface variables presented in Figure 12(b1–b3), where S t , D i v , and R o in Subregion 1 maintain relatively large values with no seasonality. Meanwhile, all three variables in Subregions 2 and 3 undergo significant seasonality, with increased intensity in winter and spring. Moreover, the trends of S t and R o are almost identical, confirming the contributions of straining from larger scales in generating submesoscales.

3.4. Spatial and Seasonal Characteristics of Submesoscale Energy Budget

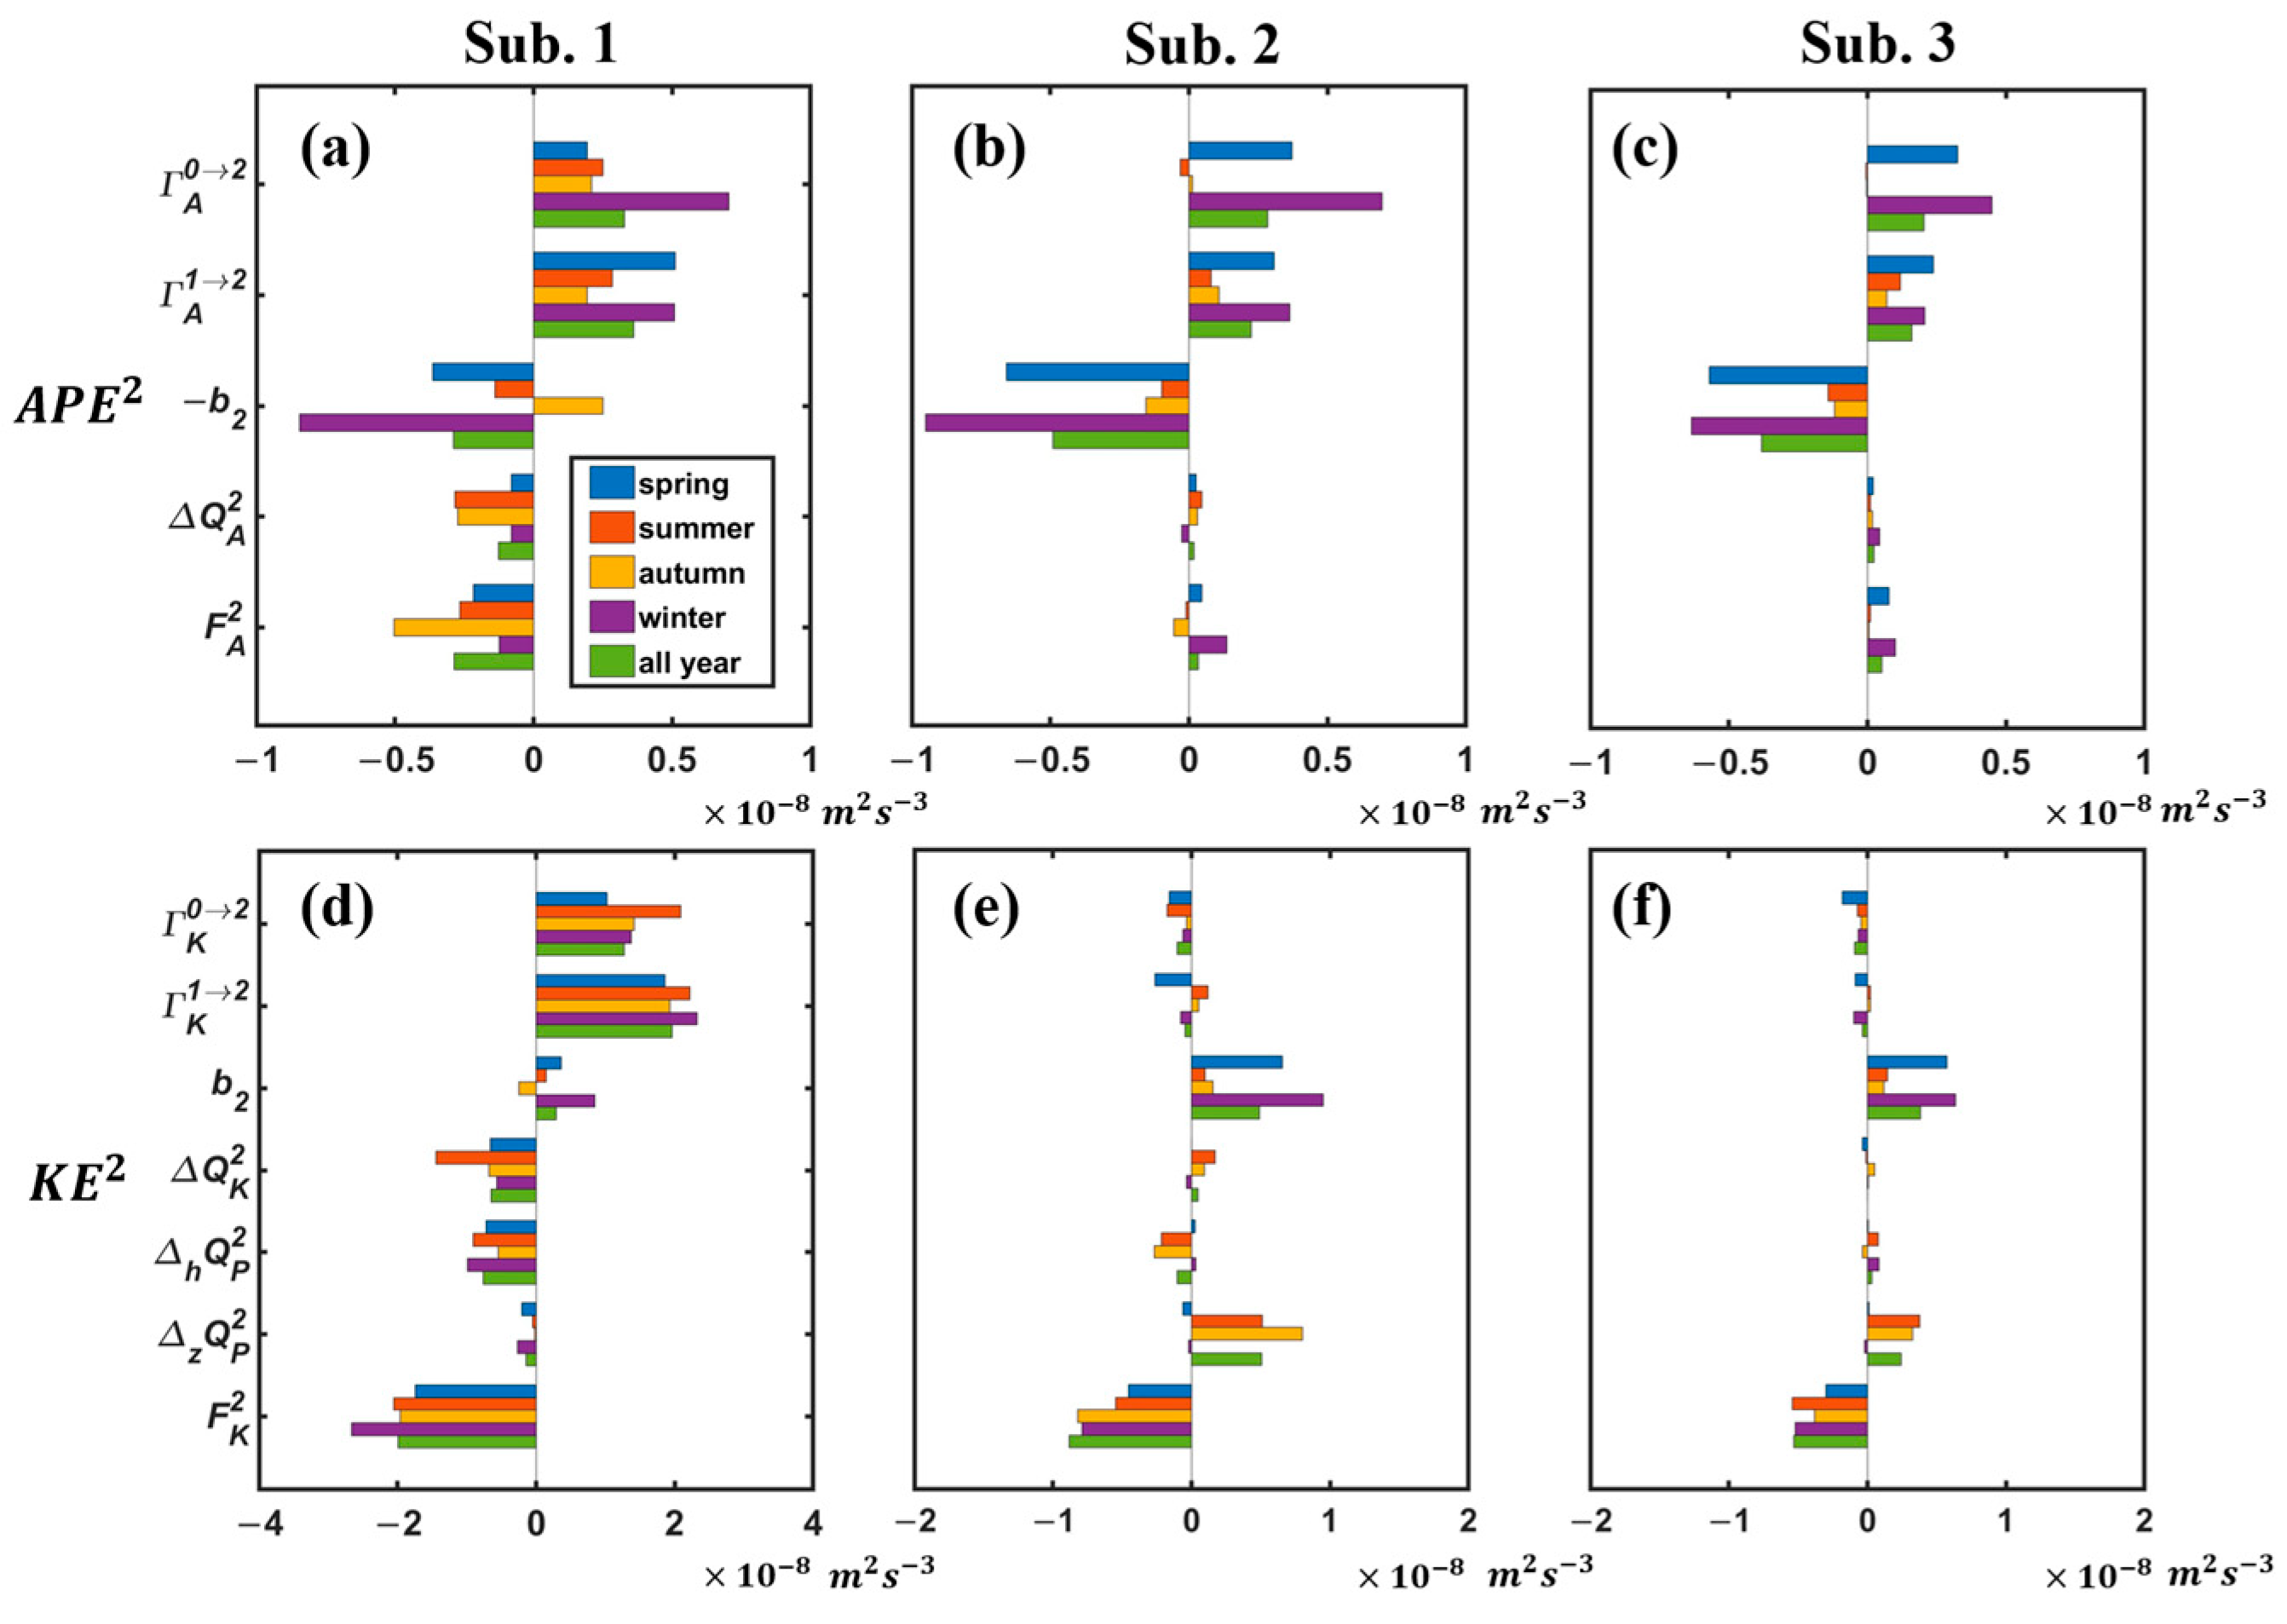
Figure 13 summarizes the seasonality of K E 2 and A P E 2 energetics averaged within the upper 200 m across the three subregions. Overall, the energetics display significant seasonal and spatial characteristics in different subregions of the Northwest Pacific Ocean. For Subregion 1 of the Luzon Strait zone, there is no obvious seasonality in both submesoscale KE and APE energetics, except for buoyancy conversion b 2 . The magnitudes of KE energetics are significantly higher than those in APE, with cross-scale canonical transfers from larger scales serving as the primary sources in both the APE and KE budgets. For APE, Γ A 1 2 and Γ A 0 2 are mainly balanced by buoyancy conversion − b 2 in spring and winter, while in summer and autumn they are primarily balanced by advection Δ Q A 2 and the residual F A 2 associated with turbulence. For KE, buoyancy conversion b 2 is relatively small and plays a minor role in the KE budget. The other energetics reveal no marked seasonality, and the barotropic canonical transfers of Γ K 1 2 and Γ K 0 2 are mainly balanced by the residual F K 2 , Δ Q K 2 , and horizontal pressure work Δ h Q P 2 . In contrast, Subregions 2 and 3 exhibit significant seasonal variations. For APE, although the baroclinic canonical transfers of Γ A 1 2 and Γ A 0 2 remain the two main sources in spring and winter, their intensities in summer and autumn are extremely minimal. Meanwhile, buoyancy conversion b 2 acts as the primary sink and undergoes a similar seasonality to Γ A 1 2 and Γ A 0 2 in both subregions. The other terms are relatively smaller throughout the year and contribute minimally to the submesoscale APE balance. For submesoscale KE, barotropic canonical transfers of Γ K 1 2 and Γ K 0 2 are characterized by relatively small negative values indicative of weak inverse cascades. Buoyancy conversion experiences significant seasonality and serves as the main energy source in spring and winter, while in summer and autumn its strength is significantly diminished. Additionally, vertical pressure work Δ z Q P 2 exhibits relatively large values in summer and autumn, and it serves as the primary source in the submesoscale KE budget. We speculate that this circumstance may be related to the strengthened mesoscales at this time, which are accompanied by abundant submesoscales in their surroundings and reinforce the communications between the upper and deep ocean. Additionally, the main energy sink is the residual term, which is connected to the surface forcing and dissipation. Moreover, the intensities of submesoscale APE and KE in Subregion 2 are slightly larger than those in Subregion 3. This can be attributed to the intensified Western Boundary Current and mesoscales in Subregion 2, in which the cross-scale interactions are more pronounced.

4. Summary and Discussion

In this study, a localized multiscale energetics diagnostic approach was employed to explore the spatial and seasonal characteristics of submesoscales in the Northwest Pacific Subtropical Ocean using a 1/45° submesoscale-permitting numerical simulation downscaled from a 1/20° mesoscale-resolving model. Then, the outputs with a time length of approximately 3 years were decomposed into three scale windows, termed the background flow, the mesoscale, and the submesoscale windows. The resulting submesoscale KE and APE energetics were localized in both time and space, allowing us to investigate the spatial and temporal variability of the submesoscale energetics in detail. We found that submesoscales are highly geographically inhomogeneous and exhibit significant seasonality in the Northwest Pacific Subtropical Ocean.
In the Luzon Strait, baroclinic and barotropic instabilities are the primary mechanisms in generating submesoscale APE and KE, respectively, and both of them reveal no significant seasonal variations. For submesoscale APE, buoyancy conversion serves as the main sink in winter and spring, while during summer and autumn, submesoscale APE is predominantly balanced by the residuals associated with turbulence and advection processes. Although buoyancy conversion experiences a pronounced seasonal cycle, its contribution to submesoscale KE is relatively insignificant. The major sinks of submesoscale KE are advection, horizontal pressure work, and the residual term associated with dissipation.
In the Western Boundary Current transition and STCC interior open ocean zone, submesoscales undergo significant seasonality, with larger magnitudes in spring and winter compared to summer and autumn. In spring and winter, baroclinic instability energizes submesoscale APE by forward cascades, and then energizes submesoscale KE through buoyancy conversion. Subsequently, submesoscale KE is mainly balanced by the residual term related to dissipation. Interestingly, it reveals relatively weak inverse cascades from the submesoscale to larger scales, which serve as the typical submesoscale energy pathway in the open ocean. However, in summer and autumn, the intensities of submesoscale energetics are considerably weaker, during which the leading source of submesoscale KE is vertical pressure work instead of buoyancy conversion. Meanwhile, the strength of submesoscale KE and energetics in the Western Boundary Current transition zone is slightly greater than that in the STCC interior open ocean zone, which can be attributed to the strengthened straining of the Western Boundary Current and mesoscale eddies.
This study provides an attempt to describe the spatial and seasonal characteristics of submesoscales in the Northwest Pacific Subtropical Ocean. An important message from the detailed energetics is that submesoscale flows are ubiquitous and highly regionally and temporally dependent. A limitation of this study is that the present numerical simulation does not resolve submesoscale motions below 15 km, which is the effective resolution of this model. Higher-resolution studies and further research are needed to show the characteristics of submesoscales more clearly.

Author Contributions

Literature Search: S.Z., Y.F., K.W., Y.Y., and T.C.; Conceptualization: S.Z. and Y.F.; Methodology: Y.F., S.Z., and K.W.; Numerical Model Configuration: Y.F., K.W., and Y.Y.; Numerical Model Result Validation: Y.F., K.W., Y.Y., and T.C.; Data Download: K.W., T.C., and Y.Y.; Computational Resources Provision: S.Z. and Y.G.; Data Processing and Analysis: Y.F., K.W., Y.Y., and T.C.; Writing—Original Draft Preparation: Y.F.; Writing—Review and Editing: S.Z., Y.G., K.W., Y.Y., and T.C.; Visualization: Y.F., K.W., Y.Y., and T.C.; Project Administration: S.Z. and Y.G.; Funding Acquisition: S.Z. and Y.G. All authors have read and agreed to the published version of the manuscript.

Funding

This work was supported by the National Key Research and Development Program of China (2022YFE0106400), the National Key R&D Program of China (2022YFE0106400), the Science and Technology Innovation Project of Laoshan Laboratory (Nos. LSKJ202300400, LSKJ202300401-03, LSKJ202202200, LSKJ202202201-04), the National Natural Science Foundation of China (42361164616), and Shandong Province’s “Taishan” Scientist Program (ts201712017).

Data Availability Statement

The data presented in this study are available upon request from the corresponding author.

Acknowledgments

We would like to express our gratitude to all those who contributed to the article.

Conflicts of Interest

Author Tong Cui was employed by the company Qingdao Leice Transient Technology Co., Ltd. The remaining authors declare that the re-search was conducted in the absence of any commercial or financial relationships that could be construed as a potential conflict of interest.

References

  1. Buckingham, C.E.; Naveira Garabato, A.C.; Thompson, A.F.; Brannigan, L.; Lazar, A.; Marshall, D.P.; George Nurser, A.J.; Damerell, G.; Heywood, K.J.; Belcher, S.E. Seasonality of submesoscale flows in the ocean surface boundary layer. Geophys. Res. Lett. 2016, 43, 2118–2126. [Google Scholar] [CrossRef]
  2. Callies, J.; Flierl, G.; Ferrari, R.; Fox-Kemper, B. The role of mixed-layer instabilities in submesoscale turbulence. J. Fluid Mech. 2016, 788, 5–41. [Google Scholar] [CrossRef]
  3. McWilliams, J.C. Submesoscale currents in the ocean. Proc. R. Soc. A 2016, 472, 20160117. [Google Scholar] [CrossRef]
  4. Thomas, L.N.; Taylor, J.R.; Ferrari, R.; Joyce, T.M. Symmetric instability in the Gulf stream. Deep. Sea Res. Part II 2013, 91, 96–110. [Google Scholar] [CrossRef]
  5. Boccaletti, G.; Ferrari, R.; Fox-Kemper, B. Mixed layer instabilities and restratification. J. Phys. Oceanogr. 2007, 37, 2228–2250. [Google Scholar] [CrossRef]
  6. Capet, X.; Roullet, G.; Klein, P.; Maze, G. Intensification of upper-ocean submesoscale turbulence through Charney baroclinic instability. J. Phys. Oceanogr. 2016, 46, 3365–3384. [Google Scholar] [CrossRef]
  7. Fox-Kemper, B.; Ferrari, R.; Hallberg, R. Parameterization of mixed layer eddies. Part I: Theory and diagnosis. J. Phys. Oceanogr. 2008, 38, 1145–1165. [Google Scholar] [CrossRef]
  8. Thompson, A.F.; Lazar, A.; Buckingham, C.; Naveira Garabato, A.C.; Damerell, G.M.; Heywood, K.J. Open-Ocean submesoscale motions: A full seasonal cycle of mixed layer instabilities from gliders. J. Phys. Oceanogr. 2016, 46, 1285–1307. [Google Scholar] [CrossRef]
  9. Capet, X.; McWilliams, J.C.; Molemaker, M.J.; Shchepetkin, A.F. Mesoscale to submesoscale transition in the California current system. Part II: Frontal processes. J. Phys. Oceanogr. 2008, 38, 44–64. [Google Scholar] [CrossRef]
  10. McWilliams, J.C. Submesoscale surface fronts and filaments: Secondary circulation, buoyancy flux, and frontogenesis. J. Fluid Mech. 2017, 823, 391–432. [Google Scholar] [CrossRef]
  11. Gula, J.; Molemaker, M.J.; McWilliams, J.C. Submesoscale dynamics of a Gulf Stream frontal eddy in the South Atlantic Bight. J. Phys. Oceanogr. 2016, 46, 305–325. [Google Scholar] [CrossRef]
  12. Srinivasan, K.; McWilliams, J.C.; Renault, L.; Hristova, H.G.; Molemaker, J.; Kessler, W.S. Topographic and mixed layer submesoscale currents in the near-surface southwestern tropical Pacific. J. Phys. Oceanogr. 2017, 47, 1221–1242. [Google Scholar] [CrossRef]
  13. Qiu, B.; Nakano, T.; Chen, S.; Klein, P. Submesoscale transition from geostrophic flows to internal waves in the northwestern Pacific upper ocean. Nat. Commun. 2017, 8, 14055. [Google Scholar] [CrossRef] [PubMed]
  14. Rocha, C.B.; Gille, S.T.; Chereskin, T.K.; Menemenlis, D. Seasonality of submesoscale dynamics in the Kuroshio Extension. Geophys. Res. Lett. 2016, 43, 11–304. [Google Scholar] [CrossRef]
  15. Torres, H.S.; Klein, P.; Menemenlis, D.; Qiu, B.; Su, Z.; Wang, J.; Chen, S.; Fu, L. Partitioning ocean motions into balanced motions and internal gravity waves: A modeling study in anticipation of future space missions. J. Geophys. Res. Ocean. 2018, 123, 8084–8105. [Google Scholar] [CrossRef]
  16. Klein, P.; Hua, B.L.; Lapeyre, G.; Capet, X.; Gentil, S.L.; Sasaki, H. Upper ocean turbulence from high-resolution 3D simulations. J. Phys. Oceanogr. 2008, 38, 1748–1763. [Google Scholar] [CrossRef]
  17. Mahadevan, A.; Pascual, A.; Rudnick, D.L.; Ruiz, S.; Tintoré, J.; D’Asaro, E. Coherent pathways for vertical transport from the surface ocean to interior. Bull. Amer. Meteor. Soc. 2020, 101, E1996–E2004. [Google Scholar] [CrossRef]
  18. Su, Z.; Wang, J.; Klein, P.; Thompson, A.F.; Menemenlis, D. Ocean submesoscales as a key component of the global heat budget. Nat. Commun. 2018, 9, 775. [Google Scholar] [CrossRef]
  19. Wang, S.; Song, Z.; Ma, W.; Shu, Q.; Qiao, F. Mesoscale and submesoscale turbulence in the Northwest Pacific Ocean revealed by numerical simulations. Deep. Sea Res. Part II 2022, 206, 105221. [Google Scholar] [CrossRef]
  20. Bachman, S.D.; Fox-Kemper, B.; Taylor, J.R.; Thomas, L.N. Parameterization of frontal symmetric instabilities. I: Theory for resolved fronts. Ocean. Model. 2017, 109, 72–95. [Google Scholar] [CrossRef]
  21. D’Asaro, E.; Lee, C.; Rainville, L.; Harcourt, R.; Thomas, L. Enhanced turbulence and energy dissipation at ocean fronts. Science 2011, 332, 318–322. [Google Scholar] [CrossRef]
  22. Srinivasan, K.; Barkan, R.; McWilliams, J.C. A forward energy flux at submesoscales driven by frontogenesis. J. Phys. Oceanogr. 2022, 53, 287–305. [Google Scholar] [CrossRef]
  23. Schubert, R.; Gula, J.; Greatbatch, R.J.; Baschek, B.; Biastoch, A. The submesoscale kinetic energy cascade: Mesoscale absorption of submesoscale mixed layer eddies and frontal downscale fluxes. J. Phys. Oceanogr. 2020, 50, 2573–2589. [Google Scholar] [CrossRef]
  24. Yang, Y.; McWilliams, J.C.; Liang, X.; Zhang, H.; Weisberg, R.H.; Liu, Y.; Menemenlis, D. Spatial and temporal characteristics of the submesoscale energetics in the Gulf of Mexico. J. Phys. Oceanogr. 2021, 47, 1243–1489. [Google Scholar] [CrossRef]
  25. Jing, Z.; Fox-Kemper, B.; Cao, H.; Rui, Z.; Du, Y. Submesoscale fronts and their dynamical processes associated with symmetric instability in the northwest Pacific subtropical ocean. J. Phys. Oceanogr. 2021, 51, 83–100. [Google Scholar] [CrossRef]
  26. Sasaki, H.; Klein, P.; Sasai, Y.; Qiu, B. Regionality and seasonality of submesoscale and mesoscale turbulence in the North Pacific Ocean. Ocean Dyn. 2017, 67, 1195–1216. [Google Scholar] [CrossRef]
  27. Zhao, W.; Zhou, C.; Zhang, Z.; Huang, X.; Guan, S.; Yang, Q.; Sun, Z.; Qin, C.; Guan, Y.; Tian, J. The South China Sea Mooring Array and its applications in exploring oceanic multiscale dynamics. Sci. Bull. 2024, 70, 609–623. [Google Scholar] [CrossRef]
  28. Jia, Y.; Chassignet, E.P. Seasonal variation of eddy shedding from the Kuroshio intrusion in the Luzon Strait. J. Phys. Oceanogr. 2011, 67, 601–611. [Google Scholar] [CrossRef]
  29. Sun, Z.; Zhang, Z.; Qiu, B.; Zhang, X.; Tian, J. Three-dimensional structure and interannual variability of the Kuroshio loop current in the northeastern South China Sea. J. Phys. Oceanogr. 2020, 50, 2437–2455. [Google Scholar] [CrossRef]
  30. Duda, T.F.; Lynch, J.F.; Irish, J.D.; Beardsley, R.C.; Ramp, S.R.; Chiu, C.S.; Tang, T.Y.; Yang, Y.-J. Internal tide and nonlinear internal wave behavior at the continental slope in the northern South China Sea. IEEE J. Oceanic. Eng. 2005, 29, 1105–1130. [Google Scholar] [CrossRef]
  31. Ramp, S.R.; Tang, T.Y.; Duda, T.F.; Lynch, J.F.; Liu, A.K.; Chiu, C.S.; Bahr, F.L.; Kim, H.R.; Yang, Y.J. Internal solitons in the northeastern South China Sea. Part I: Sources and deepwater propagation. IEEE J. Oceanic. Eng. 2004, 29, 1157–1181. [Google Scholar] [CrossRef]
  32. Zhang, Z.; Zhang, Y.; Qiu, B.; Sasaki, H.; Sun, Z.; Zhang, X.; Zhao, W.; Tian, J. Spatiotemporal characteristics and generation mechanisms of submesoscale currents in the northeastern South China Sea revealed by numerical simulations. J. Geophys. Res. Ocean. 2020, 125, e2019JC015404. [Google Scholar] [CrossRef]
  33. Zheng, R.; Jing, Z. Submesoscale-Enhanced Filaments and Frontogenetic Mechanism within Mesoscale Eddies of the South China Sea. Acta Oceanol. Sin. 2022, 41, 42–53. [Google Scholar] [CrossRef]
  34. Tang, T.; Zhang, Z.; Zhang, J.; Zhang, X.; Sun, Z.; Feng, Z. Submesoscale processes in the Kuroshio Loop Current: Roles in energy cascade and salt and heat transports. J. Geophys. Res. Ocean. 2024, 129, e2023JC020226. [Google Scholar] [CrossRef]
  35. Qiu, B. Seasonal eddy field modulation of the North Pacific subtropical countercurrent: TOPEX/Poseidon observations and theory. J. Phys. Oceanogr. 1999, 29, 2471–2486. [Google Scholar] [CrossRef]
  36. Qiu, B.; Chen, S.; Klein, P.; Sasaki, H. Seasonal mesoscale and submesoscale eddy variability along the North Pacific Subtropical Countercurrent. J. Phys. Oceanogr. 2014, 44, 3079–3098. [Google Scholar] [CrossRef]
  37. Jan, S.; Yang, Y.J.; Wang, J.; Mensah, V.; Kuo, T.H.; Chiou, M.D.; Chern, C.S.; Chang, M.H.; Chien, H. Large variability of the Kuroshio at 23.75°N east of Taiwan. J. Geophys. Res. Ocean. 2015, 120, 1825–1840. [Google Scholar] [CrossRef]
  38. Tsai, C.J.; Andres, M.; Jan, S.; Mensah, V.; Sanford, T.B.; Lien, R.C.; Lee, C.M. Eddy-Kuroshio interaction processes revealed by mooring observations off Taiwan and Luzon. Geophys. Res. Lett. 2015, 42, 8098–8105. [Google Scholar] [CrossRef]
  39. Yan, X.M.; Kang, D.J.; Pang, C.G. Energetics Analysis of the Eddy-Kuroshio Interaction East of Taiwan. J. Phys. Oceanogr. 2022, 52, 647–664. [Google Scholar] [CrossRef]
  40. Wu, B.; Gan, J. Seasonal Modulation of the Eddy Kinetic Energy and Subtropical Countercurrent Near the Western North Pacific Boundary. J. Geophys. Res. Ocean. 2022, 128, e2022JC019160. [Google Scholar] [CrossRef]
  41. Shchepetkin, A.F.; McWilliams, J.C. The regional oceanic modeling system (ROMS): A split-explicit, free-surface, topography-following-coordinate oceanic model. Ocean Model. 2005, 9, 347–404. [Google Scholar] [CrossRef]
  42. Large, W.G.; McWilliams, J.C.; Doney, S.C. Oceanic with vertical mixing: A review layer and a model with a nonlocal boundary. Rev. Geophys. 1994, 32, 363–403. [Google Scholar] [CrossRef]
  43. Beckmann, A.; Haidvogel, D.B. Numerical simulation of flow around a tall isolated seamount. Part I: Problem formulation and model accuracy. J. Phys. Oceanogr. 1993, 23, 1736–1753. [Google Scholar] [CrossRef]
  44. Dong, J.; Kemper, F.B.; Zhang, H.; Dong, C. The scale of submesoscale baroclinic instability globally. J. Phys. Oceanogr. 2020, 50, 2649–2667. [Google Scholar] [CrossRef]
  45. Jiang, Y.; Zhang, W.; Wang, H.; Zhang, X. Assessing the spatio-temporal features and mechanisms of symmetric instability activity probability in the central part of the South China Sea based on a regional ocean model. J. Mar. Sci. Eng. 2023, 11, 431–450. [Google Scholar] [CrossRef]
  46. Zhang, Z.; Liu, Y.; Qiu, B.; Luo, Y.; Cai, W.; Yuan, Q.; Zhang, H.; Liu, H.; Miao, M. Submesoscale inverse energy cascade enhances Southern Ocean eddy heat transport. Nat. Commun. 2023, 14, 1335. [Google Scholar] [CrossRef]
  47. Liang, X.S. Canonical transfer and multiscale energetics for primitive and quasigeostrophic atmospheres. J. Atmos Sci. 2016, 73, 4439–4468. [Google Scholar] [CrossRef]
  48. Ma, J.; Liang, X.S. Multiscale dynamical processes underlying the wintertime Atlantic blockings. J. Atmos Sci. 2017, 74, 3815–3831. [Google Scholar] [CrossRef]
  49. Quan, Q.; Liu, Z.; Sun, S.; Cai, Z.; Yang, Y.; Jin, G.; Li, Z.; Liang, X.S. Influence of the Kuroshio intrusion on deep flow intraseasonal variability in the Northern South China Sea. J. Geophys. Res. Ocean. 2021, 126, e2021JC017429. [Google Scholar] [CrossRef]
  50. Quan, Q.; Xue, H.; Yang, Y.; Cai, Z.; Zhang, H.; Liu, X. Characterization of intraseasonal fluctuations in the abyssal South China Sea: An insight into the energy pathway. Prog Oceanogr. 2022, 206, 102829. [Google Scholar] [CrossRef]
  51. Yang, Y.; Liang, X.S. The instabilities and multiscale energetics underlying the mean-interannual-eddy interactions in the Kuroshio Extension region. J. Phys. Oceanogr. 2016, 46, 1477–1494. [Google Scholar] [CrossRef]
  52. Yang, Y.; Liang, X.S. On the seasonal eddy variability in the Kuroshio Extension. J. Phys. Oceanogr. 2018, 48, 1675–1689. [Google Scholar] [CrossRef]
  53. Li, M.; Pang, C.; Yan, X.; Zhang, L.; Liu, Z. Energetics of multiscale interactions in the Agulhas retroflection current system. J. Phys. Oceanogr. 2023, 53, 457–476. [Google Scholar] [CrossRef]
  54. Liang, X.S.; Robinson, A.R. Localized multi-scale energy and vorticity analysis: II. Finite-amplitude instability theory and validation. Dynam. Atmos. Oceans. 2007, 44, 51–76. [Google Scholar] [CrossRef]
  55. Zhang, J.; Zhang, Z.; Qiu, B.; Zhang, X.; Sasaki, H.; Zhao, W.; Tian, J. Seasonal modulation of submesoscale kinetic energy in the upper ocean of the northeastern South China Sea. J. Geophys. Res. Ocean. 2021, 126, e2021JC017695. [Google Scholar] [CrossRef]
  56. Zhao, Y.; Yang, Y.; Mao, L.; Zhang, Y. On the Genesis of the South China Sea Mesoscale Eddies. J. Mar. Sci. Eng. 2022, 10, 188. [Google Scholar] [CrossRef]
  57. Xiu, P.; Chai, F.; Shi, L.; Xue, H.; Chao, Y. A Census of Eddy Activities in the South China Sea during 1993–2007. J. Geophys. Res. 2010, 115, C03012. [Google Scholar] [CrossRef]
  58. Zhang, M.; von Storch, H.; Chen, X.; Wang, D.; Li, D. Temporal and Spatial Statistics of Travelling Eddy Variability in the South China Sea. Ocean Dyn. 2019, 69, 879–898. [Google Scholar] [CrossRef]
  59. Zhao, Y.; Yang, Y.; Liang, X.S.; Zhang, Y. Different Mechanisms for the Seasonal Variations of the Mesoscale Eddy Energy in the South China Sea. Deep. Sea Res. Part II 2021, 179, 103677. [Google Scholar] [CrossRef]
  60. Charney, J.G. Geostrophic turbulence. J. Atmos. Sci. 1971, 28, 1087–1095. [Google Scholar] [CrossRef]
  61. Lapeyre, G.; Klein, P. Dynamics of the upper oceanic layers in terms of surface quasigeostrophy theory. J. Phys. Oceanogr. 2006, 36, 165–176. [Google Scholar] [CrossRef]
  62. Boyd, J.P. The energy spectrum of fronts: Time evolution of shocks in Burger’s equation. J. Atmos. Sci. 1992, 49, 128–139. [Google Scholar] [CrossRef]
  63. Callies, J.; Ferrari, R. Interpreting energy and tracer spectra of upper-ocean turbulence in the submesoscale range (1–200km). J. Phys. Oceanogr. 2013, 43, 2456–2474. [Google Scholar] [CrossRef]
  64. Nan, F.; Xue, H.; Chai, F.; Shi, L.; Shi, M.; Guo, P. Identification of different types of Kuroshio intrusion into the south china sea. Ocean Dyn. 2011, 61, 1291–1304. [Google Scholar] [CrossRef]
  65. Caruso, M.J.; Gawwarkiewicz, G.G.; Beardsley, R.C. Interannual variability of the Kuroshio intrusion in the South China Sea. J. Phys. Oceanogr. 2006, 62, 559–575. [Google Scholar] [CrossRef]
  66. Molemaker, J.; McWilliams, J.C.; Capet, X. Balanced and unbalanced routes to dissipation in an equilibrated Eady flow. J. Fluid Mech. 2010, 654, 35–63. [Google Scholar] [CrossRef]
  67. von Storch, J.S.; Eden, C.; Fast, I.; Haak, H.; Hernández Deckers, D.; Maier-Reimer, E.; Marotzke, J.; Stammer, D. An estimate of the Lorenz energy cycle for the World Ocean based on the STORM/NCEP simulation. J. Phys. Oceanogr. 2012, 42, 2185–2205. [Google Scholar] [CrossRef]
  68. Mensa, J.A.; Garraffo, Z.; Griffa, A.; Özgökmen, T.M.; Haza, A.; Veneziani, M. Seasonality of the submesoscale dynamics in the Gulf Stream region. Ocean Dyn. 2013, 63, 923–941. [Google Scholar] [CrossRef]
  69. Liu, Y.; Zhang, X.; Sun, Z.; Zhang, Z.; Sasaki, H.; Zhao, W.; Tian, J. Region-dependent eddy kinetic energy budget in the northeastern South China Sea revealed by submesoscale-permitting simulations. J. Marine. Syst. 2022, 235, 103797. [Google Scholar] [CrossRef]
  70. Cao, H.; Meng, X.; Jing, Z.; Yang, X. High-Resolution Simulation of Upper-Ocean Submesoscale Variability in the South China Sea: Spatial and Seasonal Dynamical Regimes. Acta Oceanol. Sin. 2022, 41, 26–41. [Google Scholar] [CrossRef]
  71. Zhang, Z.; Tian, J.; Qiu, B.; Zhao, W.; Chang, P.; Wu, D.; Wan, X. Observed 3D structure, generation, and dissipation of oceanic mesoscale eddies in the South China Sea. Sci. Rep. 2016, 6, 24349. [Google Scholar] [CrossRef] [PubMed]
  72. Zhang, Z.; Zhao, W.; Qiu, B.; Tian, J. Anticyclonic eddy sheddings from Kuroshio loop and the accompanying cyclonic eddy in the northeastern South China Sea. J. Phys. Oceanogr. 2017, 47, 1243–1259. [Google Scholar] [CrossRef]
Figure 1. Domain illustrations for the downscaled experiment in the Northwest Pacific Subtropical Ocean (from 1/20° to 1/45°). The dotted red lines within the solid red box are used to separate three subregions: (a) the Luzon Strait zone (referred to as Sub. 1); (b) the Western Boundary Current transition zone (referred to as Sub. 2); (c) the STCC interior open ocean zone (referred to as Sub. 3). The black solid arrows indicate the upper oceanic circulations in the region, with STCC, NEC, and NECC denoting the Subtropical Countercurrent, North Equatorial Current, and North Equatorial Countercurrent, respectively. The dotted solid line in the Luzon Strait zone indicates the Kuroshio looping into the South China Sea. The black circles with arrows represent the mesoscale eddies generated by the baroclinic instability of the STCC and NEC. The red spiral structures at the periphery of the mesoscale eddies show the active submesoscales manifesting elongated filaments, fronts, and submesoscale eddies.
Jmse 13 01691 g001
Figure 2. Snapshots of the surface Rossby number ( R o = ζ / f ) on (a) 15 Mar 2019 and (b) 15 Sep 2019. (c,d) as (a,b) but for the surface submesoscale KE ( K E 2 ;   m 2 s 2 ).
Jmse 13 01691 g002
Figure 3. (a) Depth–time diagrams of the spatially averaged submesoscale APE ( A P E 2 , m 2 s 2 ; a1a3) and KE ( K E 2 , m 2 s 2 ; a4a6) for three subregions (Sub. 1, 2, 3, from top to bottom). The black line in each panel denotes the spatially averaged mixed-layer depth (MLD), which is defined as the depth where potential density is larger than the sea surface density of 0.03 σ θ . (b) Horizontal wavenumber spectra of surface KE density in summer (solid) and winter (dotted) for the three subregions. The black dotted lines indicate k 2 and k 3 spectral slopes, where k is the isotropic wavenumber.
Jmse 13 01691 g003
Figure 4. Horizontal distributions of the upper 200 m vertically integrated A P E 2 energetics ( m 3 s 3 ) across four seasons in Subregion 1 (spring (a), summer (b), autumn (c), and winter (d), from top to bottom), showing (1) baroclinic canonical transfer from large-scale to submesoscale window Γ A 0 2 , (2) baroclinic canonical transfer from mesoscale to submesoscale window Γ A 1 2 , (3) buoyancy conversion b 2 , (4) APE advection of Δ Q A 2 , and (5) APE residual of F A 2 .
Jmse 13 01691 g004
Figure 5. The same as Figure 4, but for Subregions 2 and 3 ( m 3 / s 3 ) of different seasons (spring (a), summer (b), autumn (c), and winter (d), from top to bottom), showing (1) baroclinic canonical transfer from large-scale to submesoscale window Γ A 0 2 , (2) baroclinic canonical transfer from mesoscale to submesoscale window Γ A 1 2 , (3) buoyancy conversion b 2 , (4) APE advection of Δ Q A 2 , and (5) APE residual of F A 2 . The solid red line indicates the longitude line used to separate Subregions 2 and 3.
Jmse 13 01691 g005
Figure 6. Depth–time diagrams of the spatially averaged A P E 2 energetics for the three subregions ((1), (2), (3) for Subregion 1, 2, 3) ( m 2 s 3 ), showing (a) baroclinic canonical transfer from large-scale to submesoscale window Γ A 0 2 , (b) baroclinic canonical transfer from mesoscale to submesoscale window Γ A 1 2 , (c) buoyancy conversion b 2 , (d) APE advection of Δ Q A 2 , and (e) APE residual of F A 2 . The black line denotes the spatially averaged MLD.
Jmse 13 01691 g006
Figure 7. Time series of spatially averaged A P E 2 and its energetics for the three subregions within the upper 200 m for (a) Subregion 1, (b) Subregion 2, and (c) Subregion 3, where the background yellow, write, green, and red colors represent autumn, winter, spring, and summer, respectively.
Jmse 13 01691 g007
Figure 8. The same as Figure 4, but for K E 2 energetics ( m 3 s 3 ) in spring (a), summer (b), autumn (c), and winter (d) from top to bottom, showing (1) barotropic canonical transfer from large-scale to submesoscale window Γ K 0 2 , (2) barotropic canonical transfer from mesoscale to submesoscale window Γ K 1 2 , (3) buoyancy conversion b 2 , (4) KE advection of Δ Q K 2 , (5) horizontal pressure work of Δ h Q P 2 , (6) vertical pressure work of Δ z Q P 2 , and (7) KE residual of F K 2 .
Jmse 13 01691 g008
Figure 9. The same as Figure 5, but for K E 2 energetics ( m 3 s 3 ) in Subregions 2 and 3 of different seasons (spring (a), summer (b), autumn (c), and winter (d), from left to right), showing (1) barotropic canonical transfer from large-scale to submesoscale window Γ K 0 2 , (2) barotropic canonical transfer from mesoscale to submesoscale window Γ K 1 2 , (3) buoyancy conversion b 2 , (4) KE advection of Δ Q K 2 , (5) horizontal pressure work of Δ h Q P 2 , (6) vertical pressure work of Δ z Q P 2 , and (7) KE residual of F K 2 . The solid red line indicates the longitude line used to separate Subregions 2 and 3.
Jmse 13 01691 g009
Figure 10. As in Figure 6, but for K E 2 energetics ( m 2 s 3 ) of the three subregions ((ac) for Subregion 1, 2, 3) ( m 2 s 3 ), showing (a) barotropic canonical transfer from large-scale to submesoscale window Γ K 0 2 , (b) barotropic canonical transfer from mesoscale to submesoscale window Γ K 1 2 , (c) buoyancy conversion b 2 , (d) KE advection of Δ Q K 2 , (e) horizontal pressure work of Δ h Q P 2 , (f) vertical pressure work of Δ z Q P 2 , and (g) KE residual of F K 2 . The black line denotes the spatially averaged MLD.
Jmse 13 01691 g010
Figure 11. As in Figure 7, but for K E 2 energetics ( m 3 s 3 ) in (a) Subregion 1, (b) Subregion 2, and (c) Subregion 3.
Jmse 13 01691 g011
Figure 12. (a) Depth–time diagrams of spatially averaged strain rate S t (a1a3; s 1 ), normalized divergence D i v (a4a6; s 1 ), and Rossby number R o (a7a9; s 1 ) of the three subregions (from left to right for Subregions 1, 2 and 3). (b) Time series of the root-mean-square (RMS) of surface strain rate (b1), normalized divergence (b2), and Rossby number (b3) in the three subregions.
Jmse 13 01691 g012
Figure 13. Seasonal energetics of K E 2 (ac) and A P E 2 (df) averaged within the upper 200 m over the three subregions. The blue, orange, yellow, purple, and green bars indicate budget terms averaged over the spring, summer, autumn, winter, and the whole simulation period, respectively.
Jmse 13 01691 g013
Disclaimer/Publisher’s Note: The statements, opinions and data contained in all publications are solely those of the individual author(s) and contributor(s) and not of MDPI and/or the editor(s). MDPI and/or the editor(s) disclaim responsibility for any injury to people or property resulting from any ideas, methods, instructions or products referred to in the content.