Abstract
Regarding the impact of hull roughness on ship resistance and propulsive performance, most existing studies rely heavily on numerical hulls or simplified models, while systematic analysis focusing on the heterogeneous roughness of actual ships remains insufficient. Taking the 2433 TEU container ship SITC CAGAYAN as the research object, this study adopts a method that combines CFD numerical simulation with actual ship operation data. It employs a resistance prediction model based on the “roughness influence factor” to explore the mechanism by which local roughness affects ship resistance. Meanwhile, this study innovatively proposes the index of “fuel consumption increment per unit wetted surface area” and the concept of “fuel consumption factor,” thereby realizing the quantitative characterization of the impact of local rough areas on fuel consumption. The purpose of this study is to provide theoretical support and technical pathways for the optimization of ship energy efficiency and the development of green shipping.
1. Introduction
Increased hull surface roughness caused by ship corrosion and fouling not only increases navigation resistance, leading to intensified fuel consumption and higher operating costs, but also serves as a key factor affecting ship energy efficiency and carbon emissions. Particularly in actual operation, hull fouling tends to be unevenly distributed, which means the contribution of roughness in different areas to total resistance and fuel consumption may vary significantly. Therefore, accurately identifying key areas sensitive to resistance impact is of great significance for shipowners to formulate cost-effective anti-corrosion and anti-fouling strategies.
Computational Fluid Dynamics (CFD) has become a core tool in the research and design of ship hydrodynamic performance due to its low cost, high resolution, and ability to handle complex physical problems. By analyzing the laws of fluid motion through numerical methods, CFD can effectively simulate complex hull geometries and non-uniform surface conditions. Specifically, the implicit unsteady solver in hull resistance prediction can not only accurately capture unsteady flow characteristics such as wave generation and vortex shedding but also effectively improve simulation efficiency through flexible time step control and parallel computing optimization. The Volume of Fluid (VOF) method enables precise capture of dynamically changing wave profiles and free surfaces; the turbulence model, which combines the high accuracy of in near-wall regions with the stability of in main flow regions, can accurately predict boundary layer development, flow separation, and viscous pressure resistance, while the second-order upwind scheme balances computational accuracy and numerical stability in the discretization of convection terms. In terms of mesh strategy, by constructing high-resolution mesh refinement zones around the hull, sufficient mesh density can be maintained in key regions such as wave surface distortion, boundary layers, and stern vortices, thereby ensuring the reliability and accuracy of flow field resolution while controlling computational resources. With these advantages, CFD has become a standard tool for research institutions, classification societies, and ship design companies in performance analysis and hull form optimization.
For a long time, researchers have generally adopted the uniform roughness assumption to evaluate its impact. Yao et al. [1] used CFD methods to conduct simulation analysis on the rough surface of ships and clarified the influence of roughness on hull resistance through the increase in resistance. Xiong [2] studied the differential effects of hull roughness height and surface groove morphology on surface resistance in numerical simulations, and found that the greater the roughness height, the more significant the increase in hull resistance. Andersson et al. [3] reviewed the roughness functions corresponding to different hull coating types, indicating a moderate correlation between additional resistance and average roughness height. Farkas et al. [4] adopted a roughness function model representing the surface state of biofilm fouling in the wall function of CFD software, and analyzed the flow field around the ship and its propulsion characteristics. The results showed that biofilm would lead to a significant increase in required power, which in turn causes an increase in fuel consumption or a decrease in ship speed. Choi et al. [5] conducted full-scale simulations of naval ships, quantifying the resistance, power loss, and speed reduction under different fouling scenarios. They also revealed that rough surfaces would thicken the boundary layer and expand the wake region, leading to a significant increase in the nominal wake fraction and affecting ship propulsion performance.
However, to more truly reflect the actual ship state, research on non-uniform roughness has gradually attracted attention. Östman et al. [6] conducted CFD simulations on a full-scale oil tanker, using high-quality coatings in high frictional resistance areas and low-quality coatings in other parts. The results showed that compared with the overall application of low-quality coatings, this low-cost method could effectively reduce ship resistance. Vargas et al. [7] established a segmented model of a full-scale combat ship to evaluate the impact of different hull roughness scenarios. The results showed that the increase in local frictional resistance caused by hull roughness was the highest at the bow, followed by the ship side, flat bottom, stern, and transom. Song et al. [8] simulated non-uniform hull roughness conditions by applying grit coatings on the hull surface and conducted tank towing tests. They proposed a new prediction method for ship non-uniform hull roughness based on the boundary layer similarity law, and the predicted results were in good agreement with the towing test results. It was also concluded that the roughness at the bow had a greater impact on resistance. Subsequently, Song et al. [9] further studied the influence of non-uniform hull roughness on ship resistance using CFD. They analyzed the impact of non-uniform hull on the boundary and the changes in roughness Reynolds number, and the resistance changes caused by each area were basically consistent with the experimental data. Ravenna et al. [10] conducted CFD simulations on the KSC hull model, dividing the hull into bulbous bow, bow part, mid-ship part, aft part, stern part, and bottom part. Based on the proposed roughness impact factor, it was finally concluded that the bulbous bow had the greatest roughness impact. The previous research of our team [11] also found that the impact of roughness on the fore part of the hull was much greater than that on the aft part and the flat bottom section.
Although the above studies collectively point out the core law that the impact of roughness is local, most of them are still based on numerical hulls or simplified models, lacking systematic analysis of actual ships; in addition, the division of rough areas in existing studies is usually broad, making it difficult to accurately quantify the impact of specific local fouling. Their conclusions are also mostly limited to hydrodynamic parameters, lacking evaluation indicators directly linked to fuel consumption and economy. Even our previous research [11] could not provide clear guidance for coating maintenance strategies due to the insufficiently detailed division of areas.
To fill the above research gaps, this study subdivides the hull of the SITC CAGAYAN ship into 12 rough areas to more accurately identify the sensitivity of local roughness. At the same time, two new evaluation indicators— and —are proposed. The former can quickly predict the increase in fuel consumption based on the fouling area, while the latter can be used to evaluate the impact of local hull roughness on the fuel consumption increment per nautical mile. The research results are expected to provide direct data support for shipowners to optimize the layout of anti-fouling coatings and formulate docking maintenance plans and have practical significance for reducing ship operating costs and carbon emissions.
2. Methods
2.1. Approach
First, a Wigley hull similar to the target ship type is selected for simulation calculations, and comparative verification is conducted against the experimental data (EFD) in Reference [8]. This is to verify the reliability of the applied numerical simulation method and apply it to the SITC CAGAYAN ship. Then, simulation calculations are performed on the target ship: in the STAR-CCM+ 2302 software, the improved wall function method is applied to simulate the local roughness effect. To analyze the impact of different rough areas on resistance, the Roughness Influence Factor () is introduced to quantify local roughness sensitivity. Next, the main engine output power is derived using the conversion efficiency calculated from the ship propulsion system and the resistance prediction results obtained via CFD. Subsequently, the screened actual ship operation data is used to fit and analyze the data of main engine power, ship speed, and fuel consumption per nautical mile, thereby calculating the fuel consumption variation corresponding to the locally rough hull. Finally, the indicators of and are used to quantify the relationship between local hull roughness, resistance, and energy consumption, so as to analyze the contribution rate of local rough areas to operating costs.
2.2. Wigley Hull Verification Study
2.2.1. Governing Equation and CFD Methods
For incompressible flow, the averaged continuity and momentum equations in tensor notation and Cartesian coordinate system are given by the following two equations:
wherein denotes the density, represents the mean velocity vector, is the Reynolds stress, is the mean pressure, and is the component of the mean viscous stress tensor. The viscous stress of a Newtonian fluid can be expressed as:
wherein is the dynamic viscosity.
This study conducted simulations using the commercial CFD software STAR-CCM+ 2302, employing the Implicit Unsteady Solver with a first-order implicit scheme for temporal discretization, a second-order upwind scheme for spatial discretization, and the turbulence model for turbulence simulation. Regarding computational resources, the study was based on a portable computer hardware platform equipped with an Intel Core i9-13900H CPU (ASUS, Shanghai, China), with GPU acceleration not yet enabled; the mesh size was optimized through grid convergence analysis, effectively reducing computational time while ensuring accuracy and stability remain unaffected. For the unsteadiness of the free surface, the free surface effect was simulated using the VOF method, employing the HRIC scheme combined with the VOF wave model and wave zone distance settings, which effectively reduced interface diffusion. The wall time for a single working condition in this study is approximately 48 h.
2.2.2. Modified Wall-Function Approach
The study of roughness effects mainly focuses on the downward shift in the dimensionless velocity profile within the logarithmic region of the turbulent boundary layer. For Granville P S rough surfaces, the dimensionless velocity distribution in the logarithmic region can be expressed by the equation [12]:
wherein is the dimensionless velocity, defined as the ratio of the mean velocity to the friction velocity (), where ( is the wall shear stress, and is the fluid density); is the dimensionless distance, defined as ( is the normal distance from the wall, and is the kinematic viscosity); is the von Kármán constant (); and is the logarithmic law intercept. The roughness function represents the difference between the actual flow velocity and the mean velocity. It is a function of the roughness Reynolds number , which is defined by the equation [13]:
wherein is the surface roughness height. The roughness height and the Reynolds number can be used to establish a roughness function model to represent the fouling condition of the inspected hull. is the average hull roughness, which is the maximum peak-valley roughness height measured at 50 mm intervals, and is defined as in the current model.
The default roughness function in STAR-CCM+ is based on the form proposed by Cebeci and Bradshaw [14], with its general expression as follows:
This function allows users to modify the constants , , , and (denoted as , , , and in STAR-CCM+, respectively). Song et al. [8] conducted towing tests on a Wigley hull by covering its surface with alumina grits (with a roughness size of ), and derived the roughness function model shown in Equation (7). They also verified the effectiveness of this roughness function. The numerical simulations in this study are based on this roughness function relationship and applied to the roughness function model of the STAR-CCM+ 2302 software.
2.2.3. Geometry and Boundary Conditions of Wigley Hull
Figure 1 and Table 1 present comparative analyses of the three-dimensional models and principal parameters between the Wigley hull and the SITC CAGAYAN. Selecting the Wigley hull as a validation benchmark is justified by its geometric similarity to the target vessel, particularly in terms of their shared characteristic vertical stem profiles. This morphological congruence ensures the appropriateness of the Wigley hull for numerical validation purposes, as it effectively represents the fundamental hydrodynamic features of the target vessel’s bow configuration.

Figure 1.
Three-dimensional model of the ship: Wigley hull (left) and SITC CAGAYAN (right).

Table 1.
Ship parameters.
As shown in Figure 2, the Wigley hull is divided into smooth, fully rough, and locally rough geometric conditions for calculation, and the results are compared with the tank test data (EFD) in Reference [8]. The Wigley hull adopts global domain calculation. As shown in Figure 3, according to the ITTC [15] standard, the distance from the bow to the inlet is 1.5 times , the distance from the stern to the outlet is 3 times , the distance to the bottom is 2.5 times , the distance to the top is 1.25 times , and the distance to the side is 2.5 times . The inlet, top, bottom, and two side surfaces of the computational domain are set as velocity inlets, while the outlet is set as a pressure outlet.
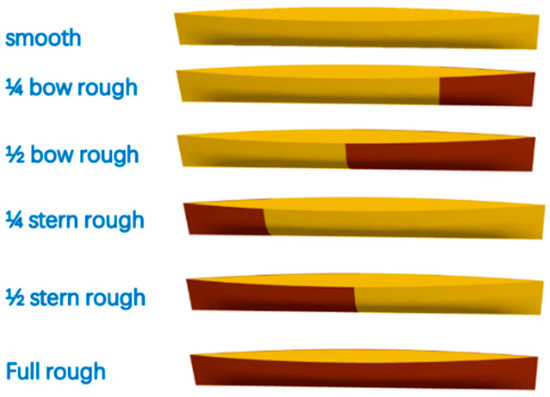
Figure 2.
Wigley hull simulation conditions (where the red areas represent the rough regions).
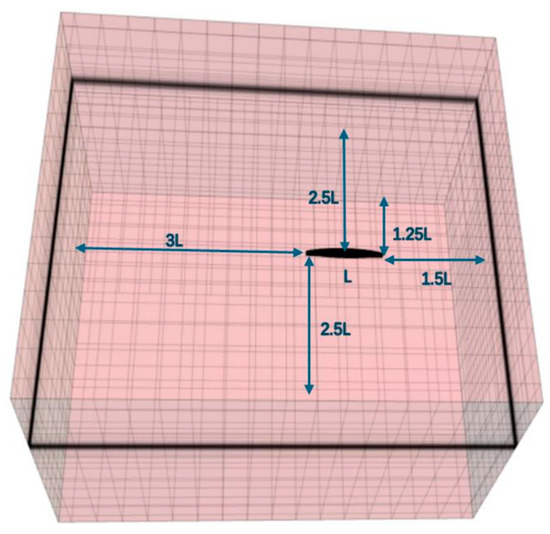
Figure 3.
Calculation domain and boundary conditions of Wigley hull.
2.2.4. Mesh Generation of Wigley Hull
The mesh generation results are shown in Figure 4. The built-in polyhedral meshing tool of STAR-CCM+ software was used to generate the mesh. Key regions such as the hull surface, free surface, bow, and stern were further refined. Six boundary layers were set at the water-hull interface with a mesh growth rate of 1.2. The wall treatment model in STAR-CCM+ was adopted, maintaining the wall values between 30 and 300. Figure 5 shows the distribution of values at .
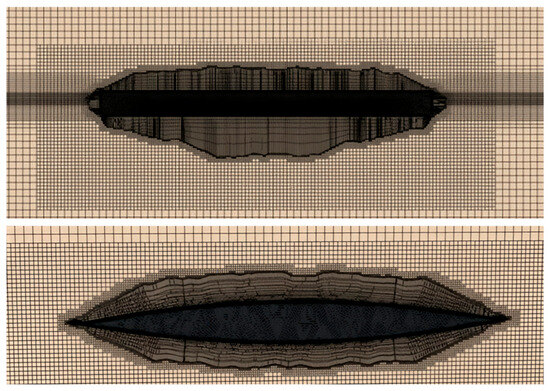
Figure 4.
Side and top meshing of Wigley hull.
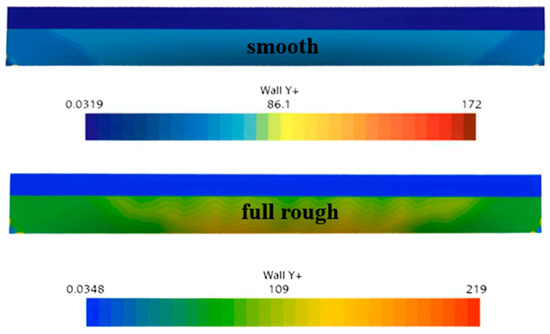
Figure 5.
Hull distribution of Wigley hull.
Based on grid-scale convergence, the same grid topology was established and divided into three grid types. Using Grid 1 as the baseline, the ITTC-standard refinement ratio was applied by multiplying the number of grid nodes in each direction by 23/2 to generate finer grids. In the time-step convergence study, three time steps with a ratio of 2 were set. Under the smooth hull condition at , the calculation results are presented in Table 2. To ensure accuracy and improve computational efficiency, Grid 2 and Time Step 2 were selected to discretize the computational domain in this study.

Table 2.
Hull resistance values of Wigley hull for different meshes and time steps.
2.2.5. Calculation Results
Table 3 shows the comparison between the total resistance coefficient calculated by CFD and the tank towing test results at and .

Table 3.
Comparison between CFD calculation results and towing tank experiments.
Through comparison, it can be found that under different Froude results, the CFD calculation results are quite close to the ship model test values, with the error range between −4.93% and 5.1%. This verifies that the adopted CFD numerical calculation method has high accuracy and can be stably and reliably used for resistance prediction and analysis of real ships.
2.3. SITC CAGAYAN Numerical Modelling
2.3.1. Geometry and Boundary Conditions of SITC CAGAYAN
The validity of the numerical method was verified in the preceding section. Therefore, the same parameter settings were applied to the SITC CAGAYAN, albeit with slight differences in the computational domain and mesh setup. As illustrated in Figure 6, the bow section was divided into eight regional surfaces, while the stern section was partitioned into four. Each region was treated as an independent rough surface in the numerical simulations to identify the area most significantly affected by roughness.
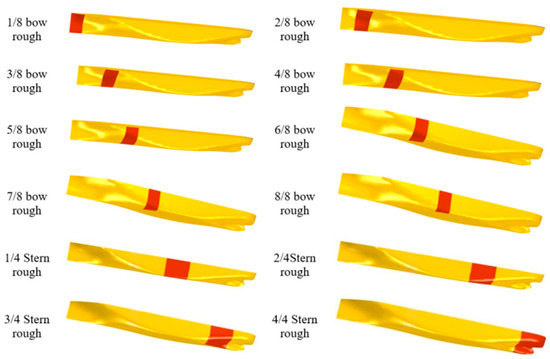
Figure 6.
Division of hull roughness areas (where the red areas represent the rough regions).
The SITC CAGAYAN also employed a full-domain computational approach. As shown in Figure 7, the distance from the ship’s bow to the inlet is 1 times , the distance from the stern to the outlet is 2.5 times , the distance to the bottom is 2 times , the distance to the top is 1 times , and the distance to the side is 2 times [15]. The inlet, top, bottom, and two side surfaces of the computational domain are set as velocity inlets, while the outlet is set as a pressure outlet.
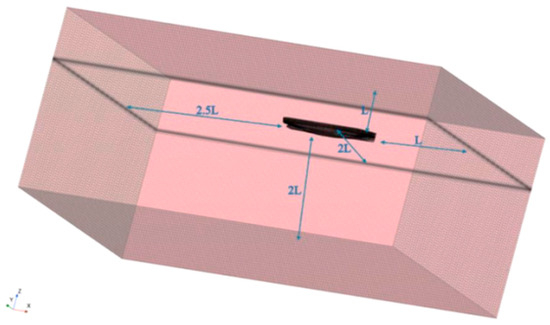
Figure 7.
Calculation domain and boundary conditions of SITC CAGAYAN.
2.3.2. Mesh Generation of SITC CAGAYAN
The unstructured mesh generation was performed using STAR-CCM+. In regions with significant curvature variations, such as the bow and stern, the volume refinement function was employed to enhance local mesh density in the wake separation zone. Additionally, a six-layer prismatic boundary layer mesh was applied on the hull surface, with six boundary layer structures configured. The growth rate of each layer was controlled at 1.2, and the total thickness was set to 1.0 m. The final mesh generation result is shown in Figure 8. The model in STAR-CCM+ was also adopted, ensuring a dimensionless wall distance with . Figure 9 presents the distribution around the hull at and .
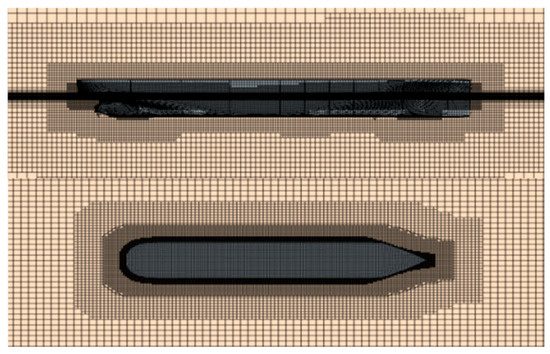
Figure 8.
Side and top meshing of SITC CAGAYAN.
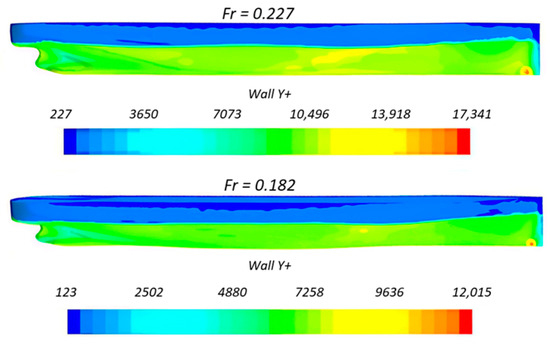
Figure 9.
Hull distribution of SITC CAGAYAN.
Taking the smooth hull at as the benchmark, a convergence study was conducted by investigating different mesh sizes and time step lengths. The computational results are presented in Table 4. Considering limited computational resources, Mesh 1 and Time Step 2 were selected for the discretization of the computational domain in the case of the SITC CAGAYAN, as they provided both fast computation time and accurate results.

Table 4.
Hull resistance values for different meshes and time steps.
3. Results
3.1. Effect of Heterogeneous Roughness on Ship Resistance
Numerical simulations were conducted based on the ship’s actual operational data (service speed: 15 knots, hull draft: 10 m) to calculate the aforementioned 14 working conditions (including both smooth and fully rough conditions). The calculation results are presented in Table 5, where the total resistance coefficient difference , with being the total resistance coefficient of the rough hull and the total resistance coefficient of the smooth hull. Preliminary observations from the table reveal that the resistance does not increase linearly with the rough wetted surface area but rather exhibits a nonlinear trend. Different rough regions have distinct effects on resistance. Notably, the increase in resistance due to roughness is not strictly proportional to the area coverage. For instance, the 2/4 Stern rough case shows the maximum resistance increase, even though it does not correspond to the largest rough wetted surface area proportion.

Table 5.
Calculation results of different hull roughness areas.
To evaluate the impact of local hull roughness increase on additional resistance, the Roughness Impact Factor () [10] was introduced, defined by Equation (8) as follows:
where and represent the total additional resistance and rough wetted surface area for the i-th hull roughness scenario, respectively; denotes the additional resistance under fully rough hull surface conditions, and is the total wetted surface area of the hull. Notably, the value for the fully rough scenario equals 1 by definition. The quantitatively relates the increased resistance coefficient to the rough wetted surface area under any given roughness condition. Specifically: = 1 indicates that the corresponding surface exerts an average impact; > 1 suggests that the affected region has an above-average impact; < 1 implies that the area’s impact is below average.
As shown in the computational results in Figure 10, the in the 1/8 bow rough region is 2.22. The first decreases to 1.92 at the 3/8 bow rough region, then increases progressively, reaching a peak of 3.24 at the 7/8 bow rough region. Although the roughness areas in the evenly divided stern sections were generally larger than those in the bow sections, their maximum impact factor did not exceed the bow’s peak value. In summary, the roughness-sensitive region of the SITC CAGAYAN is located at 7/8 bow rough. While the location of local hull roughness increases significantly affects ship hydrodynamics, this impact may vary depending on hull shape and speed. Therefore, future research could investigate values for different hull forms at various speeds.
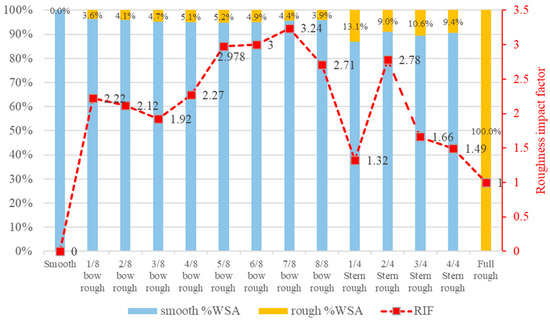
Figure 10.
Calculation results of roughness impact factor.
3.2. The Rationale Behind the Effect of Heterogeneous Roughness
As illustrated in Figure 11, the wall shear stress distribution on the hull of the SITC CAGAYAN demonstrates consistent patterns between localized rough regions and their fully rough counterparts, suggesting a strong correlation with hull geometry. Notably, the most significant local increase in shear stress occurs in the upstream mid-body region. According to Equation (5), the introduction of local roughness enhances wall shear stress magnitude, consequently affecting both the skin friction coefficient and roughness Reynolds number. This phenomenon explains the observed variations in hydrodynamic performance under different roughness conditions.
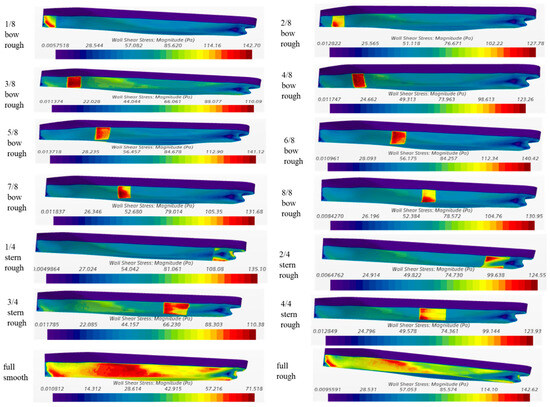
Figure 11.
Hull wall shear stress.
The local skin friction coefficient and the roughness Reynolds number are closely related to the wall shear stress value. Figure 12 shows the distribution of the roughness Reynolds number, where the flow is considered rough when . It can be observed that the maximum value of in the fully rough regime is 46.187, with higher values concentrated in the 1/8, 5/8, and 6/8 bow regions compared to other areas. Due to the smaller fluid deceleration in the bow region, the boundary layer develops more slowly, resulting in a thinner boundary layer. Consequently, the relative proportion of roughness height within the boundary layer becomes larger, leading to a higher local skin friction coefficient. As the wall shear stress increases, the bow region exhibits more pronounced local skin friction coefficients and roughness Reynolds numbers. Under both smooth and rough hull conditions, the boundary layer in the fully rough scenario is thicker than that in the fully smooth scenario.
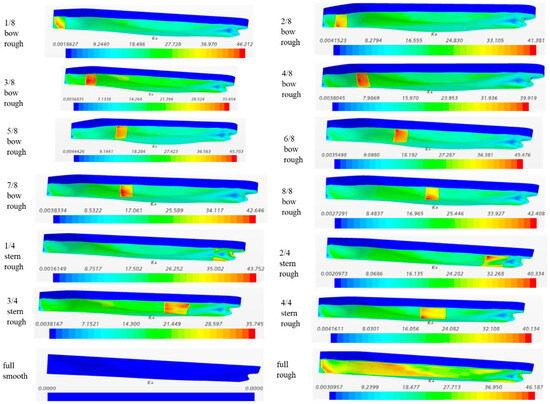
Figure 12.
Distribution diagram of hull roughness Reynolds Number.
3.3. Effect of Heterogeneous Roughness on Ship Energy Consumption
The operational data of the SITC CAGAYAN in its new-build condition is used as the smooth case, as the hull had not yet undergone fouling accumulation at this stage. Based on the CFD numerical simulations described earlier, the total hull resistance at both the design speed of 19 knots and the economic speed of 15 knots can be obtained. The effective power is then calculated using the following equation:
The effective power obtained from CFD simulations is input into the propulsion system transmission model, accounting for shafting efficiency and the wake fraction, to ultimately determine the engine’s output power. When calculating the open-water efficiency of the propeller, the propeller chart method is employed based on the ship’s speed, pitch ratio, number of blades, and collected torque data. By identifying the intersection point between the constant diameter coefficient contour and the optimal efficiency curve, the open-water efficiency and other relevant parameters are determined [16].
The comparison between the simulated data and full-scale monitoring data (as shown in Table 6) indicates that the predicted values are generally higher than the measured values. This discrepancy may be attributed to several factors: slight trim or draft variations in actual operations that improved flow field characteristics, or operational adjustments in speed and routing due to sea conditions that resulted in lower average power demand compared to design conditions. Notably, the prediction error at 19 knots shows a greater magnitude than that at 15 knots. This phenomenon primarily stems from the more pronounced impact of simplification-induced errors in the power prediction methodology under higher speed conditions. Nevertheless, all prediction errors remain within an acceptable 10% threshold, demonstrating the fundamental validity of the proposed prediction approach. Subsequent fuel consumption analyses were consequently conducted using data from the economic speed (15 knots), where prediction accuracy was better maintained.

Table 6.
Comparison between CFD predicted values and actual ship power.
For the hull resistance values under 14 typical operating conditions, the corresponding main engine output power was calculated. Using the filtered ship operational data, the relationship between main engine power, speed, and fuel consumption was established through curve fitting. The correlation between main engine power and speed is closely related to the slip ratio. As shown in Figure 13, the power–speed trend lines exhibit significant separation under different slip ratios. Through curve fitting, the power–speed fitting formula for a slip ratio of 5% ± 1% was derived as: .
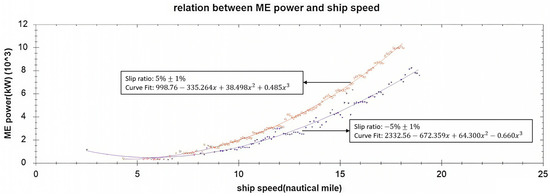
Figure 13.
Power–speed diagrams at different slip ratios.
The main engine fuel consumption per nautical mile () primarily depends on the engine load, which is related to propeller propulsion efficiency, vessel speed, and the navigation condition of the hull, mainly manifested as differences in the slip ratio. Within the same slip ratio range of 5% ± 1%, the filtered at different vessel speeds is shown in Figure 14. Under the same vessel speed, the is higher in full-load conditions compared to light-load conditions. Through curve fitting, the formula for versus speed under full-load conditions was derived as: .
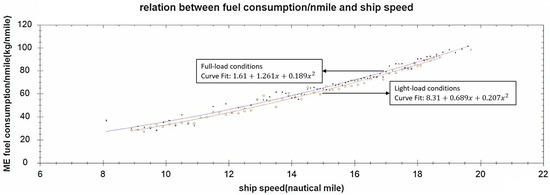
Figure 14.
Fuel consumption per n mile-speed diagrams under different load conditions.
Through the fitting formula, the relationship between resistance and fuel consumption can ultimately be calculated, and the impact of hull roughness on fuel consumption can be further analyzed. The calculated fuel consumption variations under different hull roughness conditions for the SITC CAGAYAN in full-load conditions are presented in Table 7.

Table 7.
Fuel consumption changes in different hull roughness areas.
Based on the calculated fuel consumption variations, this study proposes two new metrics: “Fuel Consumption Increase per Unit Wetted Surface Area” () and the “Fuel Consumption Factor” (). The is derived by dividing the fuel consumption increment under a specific operating condition by the corresponding rough wetted surface area. This metric enables rapid prediction of fuel consumption increases based on fouling coverage, providing a quantitative basis for hull maintenance decisions. The , analogous to a roughness impact factor, quantifies the impact of localized hull roughness on the incremental fuel consumption per nautical mile. Its mathematical definition is given in Equation (10):
denotes the incremental fuel consumption per nautical mile for the i-th hull section under a specific roughness condition, while represents the incremental fuel consumption per nautical mile under fully rough hull surface conditions. The equals 1 for a fully rough scenario. The correlates the additional fuel consumption per nautical mile with the rough wetted surface area under a given roughness condition. When = 1, the corresponding surface has an average impact on fuel consumption; > 1 indicates that the impact of that surface region on fuel consumption is above average, whereas < 1 suggests a below-average impact. As derived from Equation (10), the fuel consumption factor remains consistent with the incremental fuel consumption per unit wetted surface area. The computational results for both are presented in Table 7.
Figure 15 shows the comparison between and for different hull roughness zones. As can be seen from Table 7 and Figure 15, there exists a highly nonlinear relationship between the wetted surface area of the hull and the . Despite having relatively small surface areas, some localized rough zones exhibit significantly larger . Excluding the fully rough and fully smooth cases, the minimum is 1.38 for the 1/4 stern rough zone, while the maximum value reaches 3.33 for the 7/8 bow rough zone—an increase of 141%. The also increased by 141%. This variation trend of maintains high consistency with the theoretical model of . The fundamental reason lies in the fact that small-scale roughness elements alter the turbulent structure of the boundary layer, thereby intensifying the energy dissipation caused by surface friction resistance.
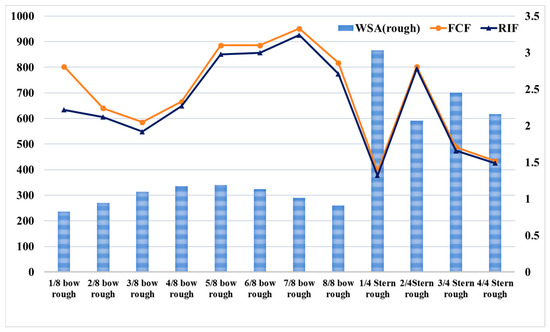
Figure 15.
FCF and RIF in different hull roughness areas.
This system enables dynamic assessment of hull conditions across different maintenance cycles, with the serving as a quantitative basis for dry-dock decision-making. For instance, when the fouling coverage in the 7/8 Bow region reaches 5%, the system can promptly predict a 3.2% increase in fuel consumption based on fuel consumption rates and wetted surface area, thereby determining whether and what type of antifouling measures should be implemented. For highly sensitive areas, high-performance foul-release coatings may be employed. Despite their higher cost, the fuel-saving benefits per unit area prove to be substantial. Conversely, for less sensitive zones, cost-effective self-polishing coatings can be adopted to strike an optimal balance between overall vessel expenditure and energy efficiency.
4. Conclusions
Through CFD numerical analysis, the resistance data of the SITC CAGAYAN under various speeds and different rough hull conditions were obtained. Building upon this foundation, combined with detailed analysis and calculations of the ship’s propulsion system, the prediction and comparative assessment of main engine output power were ultimately achieved. The predicted results were then cross-verified against actual energy efficiency operational data from the vessel. The conclusions are as follows:
- (1)
- The calculation of 14 partial rough hull conditions at economic speed revealed that a fully rough hull caused a sharp 19.9% increase in fuel consumption. The impact of partial hull roughness is closely associated with multiple key factors, including the area of rough wetted surface, the distribution of local wall shear stress, variations in the roughness Reynolds number, and boundary layer characteristics.
- (2)
- By employing CFD calculations combined with the , the sensitive regions of this ship type can be identified. The study found that the 7/8 Bow region of the SITC CAGAYAN exhibits strong roughness sensitivity, with an value of 3.24—significantly higher than the 1.32 recorded in the stern region. Different ship types exhibit distinct sensitivity distributions, and this model overcomes the limitations of the traditional uniform roughness assumption, providing a precise theoretical tool for optimizing localized antifouling coatings.
- (3)
- The relationship between localized hull roughness and energy consumption exhibits a nonlinear trend. By introducing the concepts of and , this study quantifies the contribution rate of partial rough regions to operational costs. Although the 7/8 bow region accounts for only 4.38% of the total wetted surface area, its reaches 0.007 kg—141% higher than the 0.0029 kg recorded in the stern region. These findings provide a dynamic quantitative basis for optimizing ship maintenance cycles and economic performance evaluations.
Author Contributions
X.Z.: Writing—review and editing, Methodology, Funding acquisition. X.G.: Writing—review and editing, Software, Data curation. A.Y.: Writing—original draft, Investigation. All authors have read and agreed to the published version of the manuscript.
Funding
This work was supported by the Science & Technology Commission of Shanghai Municipality and Shanghai Engineering Research Center of Ship Intelligent Maintenance and Energy Efficiency under Grant 20DZ2252300.
Institutional Review Board Statement
Not applicable.
Data Availability Statement
The original contributions presented in this study are included in the article. Further inquiries can be directed to the corresponding author.
Conflicts of Interest
All simulation data and methodologies are fully documented in the manuscript, and the research complies with ethical standards in scientific publishing. The authors declare no conflicts of interest, and the work has not been published or submitted elsewhere.
Abbreviations
The following abbreviations are used in this manuscript:
| CFD | Computational Fluid Dynamics |
| URANS | Unsteady Reynolds-Averaged Navier–Stokes |
| VOF | Volume of Fluid |
| WSA | Wetted Surface Area |
| RIF | Roughness Impact Factor |
| FCF | Fuel Consumption Factor |
References
- Yao, X.L.; Yuan, C.Q.; Zhao, X.K.; Bai, X. Effect of Surface Roughness and Fouling on Ship Resistance Based on CFD Analysis. Surf. Technol. 2017, 46, 27–34. [Google Scholar] [CrossRef]
- Xiong, Y.C. Analysis of Hull Resistance and Propulsion System Energy Efficiency Based on Surface Roughness and Ship Floating. Master’s Thesis, Wuhan University Of Technology, Wuhan, China, 2018. [Google Scholar]
- Andersson, J.; Oliveira, D.R.; Yeginbayeva, I.; Leer-Andersen, M.; Bensow, R.E. Review and Comparison of Methods to Model Ship Hull Roughness. Appl. Ocean Res. 2020, 99, 102119. [Google Scholar] [CrossRef]
- Farkas, A.; Song, S.; Degiuli, N.; Martić, I.; Demirel, Y.K. Impact of Biofilm on the Ship Propulsion Characteristics and the Speed Reduction. Ocean Eng. 2020, 199, 107033. [Google Scholar] [CrossRef]
- Choi, W.; Min, G.; Han, S.; Yun, H.; Terziev, M.; Dai, S.; Kim, D.; Song, S. Resistance and Speed Penalty of a Naval Ship with Hull Roughness. Ocean Eng. 2024, 312, 119058. [Google Scholar] [CrossRef]
- Östman, A.; Koushan, K.; Savio, L. Study on Additional Ship Resistance Due to Roughness Using CFD. GMO J. Ship Mar. Technol. 2019, 25, 55–65. [Google Scholar]
- Vargas, A.; Shan, H.; Holm, E. Using CFD to Predict Ship Resistance Due to Biofouling, and Plan Hull Maintenance. In Proceedings of the 4th Hull Performance & Insight Conference (HullPIC’19), Gubbio, Italy, 6–8 May 2019; pp. 6–8. [Google Scholar]
- Song, S.; Ravenna, R.; Dai, S.; DeMarco Muscat-Fenech, C.; Tani, G.; Demirel, Y.K.; Atlar, M.; Day, S.; Incecik, A. Experimental Investigation on the Effect of Heterogeneous Hull Roughness on Ship Resistance. Ocean Eng. 2021, 223, 108590. [Google Scholar] [CrossRef]
- Song, S.; Demirel, Y.K.; De Marco Muscat-Fenech, C.; Sant, T.; Villa, D.; Tezdogan, T.; Incecik, A. Investigating the Effect of Heterogeneous Hull Roughness on Ship Resistance Using CFD. J. Mar. Sci. Eng. 2021, 9, 202. [Google Scholar] [CrossRef]
- Ravenna, R.; Song, S.; Shi, W.; Sant, T.; De Marco Muscat-Fenech, C.; Tezdogan, T.; Demirel, Y.K. CFD Analysis of the Effect of Heterogeneous Hull Roughness on Ship Resistance. Ocean Eng. 2022, 258, 111733. [Google Scholar] [CrossRef]
- Yin, A.; Zeng, X. The Impact of Roughness on the Resistance of Full-Scale Ships. J. Phys. Conf. Ser. 2024, 2882, 012096. [Google Scholar] [CrossRef]
- Granville, P.S. The Frictional Resistance and Turbulent Boundary Layer of Rough Surfaces. J. Ship Res. 1958, 2, 52–74. [Google Scholar] [CrossRef]
- Nikuradse, J. Laws of Flow in Rough Pipes (NACA Technical Memorandum No. 1292); National Advisory Committee for Aeronautics (NACA): Washington, DC, USA, 1950. [Google Scholar]
- Cebeci, T.; Bradshaw, P. Momentum Transfer in Boundary Layers; Washington: Washington, DC, USA, 1977. [Google Scholar]
- Committee, I.S. Recommended Procedures and Guidelines—Practical Guidelines for Ship CFD Applications. In Proceedings of the 26th International Towing Tank Conference, Rio de Janeiro, Brazil, 3–9 September 2011; Volume 28. [Google Scholar]
- Wang, C. Research on Ship-Engine-Propeller Matching Underoff-Design Conditions. Master’s Thesis, Harbin Engineering University, Harbin, China, 2019. [Google Scholar]
Disclaimer/Publisher’s Note: The statements, opinions and data contained in all publications are solely those of the individual author(s) and contributor(s) and not of MDPI and/or the editor(s). MDPI and/or the editor(s) disclaim responsibility for any injury to people or property resulting from any ideas, methods, instructions or products referred to in the content. |
© 2025 by the authors. Licensee MDPI, Basel, Switzerland. This article is an open access article distributed under the terms and conditions of the Creative Commons Attribution (CC BY) license (https://creativecommons.org/licenses/by/4.0/).