Abstract
As wind energy development continues to expand toward nearshore and deep-sea regions, enhancing the aerodynamic efficiency of vertical axis wind turbines (VAWTs) in complex marine environments has become a critical challenge. To address this, a composite flow control strategy combining leading-edge suction and trailing-edge gurney flap is proposed. A two-dimensional unsteady numerical simulation framework is established based on CFD and the four-equation Transition SST (TSST) transition model. The key control parameters, including the suction slot position and width as well as the gurney flap height and width, are systematically optimized through orthogonal experimental design. The aerodynamic performance under single (suction or gurney flap) and composite control schemes is comprehensively evaluated. Results show that leading-edge suction effectively delays flow separation, while the gurney flap improves aerodynamic characteristics in the downwind region. Their synergistic effect significantly suppresses blade load fluctuations and enhances the wake structure, thereby improving wind energy capture. Compared to all other configurations, including suction-only and gurney flap-only blades, the composite control blade achieves the most significant increase in power coefficient across the entire tip speed ratio range, with an average improvement of 67.24%, demonstrating superior aerodynamic stability and strong potential for offshore applications.
1. Introduction
The global energy mix has been heavily reliant on fossil fuels since the 20th century. However, excessive reliance on fossil fuels has continuously increased atmospheric CO2 levels, threatening the stability of the Earth’s ecosystems through global warming [1]. Developing low-carbon and clean energy sources is essential for reducing greenhouse gas emissions, lowering dependence on fossil fuels, and promoting sustainable energy transitions [2]. As a key form of clean and renewable energy, wind energy plays a crucial role in global transition to green energy. Wind turbines serve as the primary technology for converting wind energy into electricity, and are essential for enhancing energy conversion efficiency, reducing electricity generation costs, and accelerating the adoption of renewables [3,4].
According to the Global Wind Energy Council’s 2025 report, global wind power installations reached a record 117 GW in 2024, including 109 GW onshore and 8 GW offshore [5]. Compared with onshore wind resources, offshore wind offers higher wind speeds, lower variability, reduced wind shear, and greater energy density, resulting in power generation efficiency up to 1.7 times higher than onshore wind power [6,7]. With the continuous advancement of distributed wind power technology and the gradual deployment of off-grid systems, wind energy development is shifting from traditional land-based centralized locations to nearshore and even deep-sea areas, making the “land-to-sea” transition an irreversible trend [8]. This trend imposes greater demands on wind turbines in terms of environmental adaptability, spatial efficiency, and operational stability [9,10].
Based on the relative orientation between the rotor axis and the incoming flow, wind turbines are generally classified into horizontal axis wind turbines (HAWTs) and vertical axis wind turbines (VAWTs) [11,12]. Compared with HAWTs, VAWTs feature a simpler structure without the need for pitch or yaw systems. Their key components are installed closer to the ground for easier maintenance, and they also offer advantages such as low noise emissions and relatively lower visual impact compared with HAWTs. While the visual impact is not minimal, it is generally considered more acceptable, particularly for onshore applications where landscape integration is a concern. These features have made VAWTs an emerging focus in offshore wind power research [13,14]. Moreover, VAWTs experience less wake interference between turbines, making them more suitable for dense array configurations, thereby improving the utilization efficiency of marine spatial resources. Therefore, VAWTs are considered to hold great potential for application in future deep-sea floating wind power systems.
However, due to their unsteady operational characteristics, VAWTs are prone to flow separation on the blade surfaces during operation. Additionally, irregular vortex shedding from the upstream blades can interfere with downstream blades, leading to reduced energy conversion efficiency and compromised operational stability and safety [15]. To address these challenges, the application of effective flow control technologies can mitigate dynamic stall caused by periodic changes in angle of attack, optimize the surrounding flow field, and ultimately enhance both energy utilization efficiency and operational reliability [16]. In the offshore environment, where wind–wave interactions intensify turbulence and loading fluctuations, such flow control strategies are particularly valuable for mitigating unsteady aerodynamic effects and enhancing rotor stability.
Flow control techniques for wind turbines are typically categorized into active flow control (AFC) and passive flow control (PFC) based on whether external energy is introduced [17]. AFC methods aim to suppress or eliminate flow separation by injecting energy locally into the flow field to enhance aerodynamic performance. Common AFC techniques include leading-edge blowing [18] and surface suction [19]. In contrast, PFC methods rely on optimizing blade geometry or surface features to manipulate near-wall flow behavior and delay separation. Representative PFC strategies include vortex generators [20], slotted blade [21], and gurney flap [22]. In complex aerodynamic environments, single control approaches often struggle to simultaneously achieve multiple objectives. Therefore, hybrid strategies that couple AFC and PFC have become a key research direction in recent years [23].
Boundary layer suction (BLS), a highly effective active control method, modifies near-wall velocity profiles by applying suction through porous surfaces or slots, thereby delaying separation and transition and enhancing aerodynamic performance [24]. Wahidi et al. [25] investigated the influence of suction on separation vortex structures for an LA2573a airfoil and found that BLS significantly reduced the size of separation bubbles and delayed both separation and transition, decreasing drag by 14% to 24%, particularly under low Reynolds number conditions. Rezaeiha et al. [26] introduced suction slots near the leading edge of VAWT blades, effectively removing low-energy flow in the boundary layer and improving energy capture, especially under low and fluctuating wind speeds. This strategy was also beneficial in extending turbine service life. Vos [27] using unsteady RANS simulations, analyzed how suction position, width, and intensity influence VAWT aerodynamic performance, showing that suction is most effective when applied at the onset of laminar separation bubbles. With a tip speed ratio (TSR) of 2.5, the power coefficient increased by up to 104%. Sun et al. [28] further explored how optimal suction locations vary with airfoil thickness and camber, finding a downstream shift in optimal position governed by the separation and maximum curvature points. For the NACA0021 airfoil, suction applied 0.3 c from the leading edge showed higher power coefficients under symmetrical suction conditions.
On the passive control side, the Gurney flap (GF) is widely used due to its structural simplicity and adaptability. By altering the trailing-edge flow structure, GF enters momentum into the boundary layer, counteracting adverse pressure gradients and thereby enhancing lift-drag ratios and flow stability [29]. Zhu et al. [30] performed numerical simulations and showed that external and grooved GF improved aerodynamic performance, increasing power capture by 10.92% and 17.92%, respectively. The external GF also reduced torque fluctuation. Bianchini et al. [31] using unsteady CFD, found that internal GFs were more effective at low TSRs. For single-blade VAWTs, internal GFs at 2% c height improved power coefficients by 23.1% and 14.6% at TSRs of 3.3 and 3.9. For three-blade configurations, a 3% c internal GF improved performance by 21.3% at TSR = 2.4. Zhu et al. [32] further examined the influence of GF height and thickness, showing that energy capture increased by up to 21.32% at low TSRs. Though increased GF height enhanced tangential force on the upwind side, it also caused more losses on the downwind side. In contrast, GF thickness had little effect. Syawitri et al. [33] used orthogonal design and CFD to optimize internal GF configuration, determining that a 3% c flap with a 90° angle located at the trailing edge offered substantial performance gains across multiple TSR conditions.
Existing studies demonstrate that both AFC and PFC offer promising avenues for improving VAWT aerodynamic performance. However, research on the combined use of boundary layer suction and GF remains limited. To address this gap, this study proposes a novel hybrid flow control strategy by incorporating active suction at the leading edge and passive GF at the trailing edge. A comprehensive numerical analysis is conducted to evaluate the impact of this combined method on the aerodynamic characteristics and energy capture efficiency of VAWTs, aiming to provide theoretical guidance and technical solutions for offshore VAWT design and optimization. Such improvements are practically significant, as higher aerodynamic efficiency contributes to reducing the levelized cost of offshore wind power, while load stabilization helps extend turbine service life under harsh marine conditions. The main work of this study is as follows:
- A CFD simulation framework based on the TSST transition model is established to evaluate the aerodynamic performance of VAWTs with flow control designs.
- Three blade configurations are proposed, including the Gurney flap (GF), the leading-edge suction control (Suc), and the combination of both (Suc + GF), and their effects under various TSR conditions are analyzed.
- An orthogonal experimental design is applied to optimize key geometric parameters of the control devices.
- The aerodynamic performance, load characteristics, and unsteady flow behavior of each configuration are comprehensively assessed through multiple diagnostics.
Summing up, this paper is structured as follows: Section 2 introduces the computational models and numerical methods. Section 3 validates the reliability of the simulation through mesh independence check, time step sensitivity analysis, revolution number requirements, and turbulence model comparison. Section 4 presents the orthogonal experimental design and optimization of flow control parameters. Section 5 analyzes the aerodynamic performance of optimized configurations in terms of power output, load characteristics, and flow field structures. Section 6 summarizes the main conclusions.
2. Computational Models and Methods
2.1. Geometric Model of VAWT
To ensure consistency with experimental results, the three-bladed H-type VAWT model employed in this study adopts identical geometric configuration and operating parameters as those described in Ref. [34]. The NACA0021 profile was selected for its robustness and frequent use in VAWT studies, with a maximum thickness of 0.21 c, where c is defined as the chord length of the airfoil. Detailed geometric dimensions and operational parameters are listed in Table 1.

Table 1.
Geometric and operating parameters of VAWT.
The geometric configuration of the composite flow control model integrating leading-edge suction and a trailing-edge gurney flap is illustrated in Figure 1. In this configuration, Ls specifies the distance from the leading edge of the blade to the center of the suction slot, while Ws defines the slot width. hG is designed as the height of the gurney flap, and WG as its width. The azimuthal position θ is used to indicate the rotor’s angular position in degrees, O marks the rotation center, and ω defines the angular velocity. The range of 0~180° characterizes the upwind region, whereas 180~360° corresponds to the downwind region.
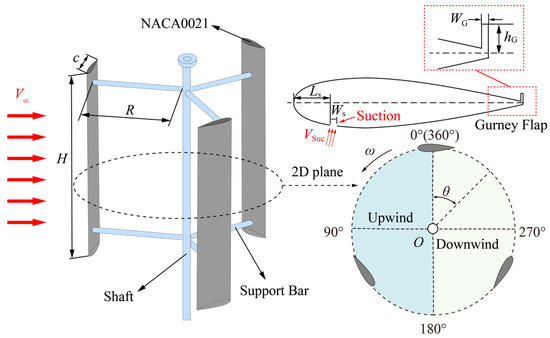
Figure 1.
Geometric configuration of the reference VAWT and blade with combined flow control.
2.2. Aerodynamic Parameters
The operational condition of a VAWT is typically characterized by the tip speed ratio (TSR), which is defined as the ratio of the blade tip speed to the free-stream wind velocity [15]. It is defined as:
where ω is the rotation angular velocity, rad/s. n is the rotation speed, rpm. R is the rotor radius, m. V∞ is the inflow wind speed, m/s.
The pressure coefficient Cpre serves as a key indicator for characterizing the pressure variation along the airfoil surface, quantifying the deviation between local surface pressure and the undisturbed free-stream pressure [35]. It is defined as:
where P and P∞ are the pressures on the airfoil surface and the inflow pressure, Pa. ρ is the air density, kg/m3.
The aerodynamic forces exerted on the blade can be decomposed into tangential and normal components, representing the directional interaction between the blade and the airflow. These components are crucial for evaluating the turbine’s aerodynamic performance and operational stability [36]. By normalizing these forces, the tangential force coefficient Ct and normal force coefficient Cn are defined as:
where Ft is the tangential force, N. Fn is the normal force, N. H is the rotor height, m.
The torque coefficient CT and the power coefficient Cp are two key parameters commonly used to evaluate the aerodynamic performance of VAWTs [37]. They are defined as follows:
where M is the average torque on the blade, N·m. P is the output power, W. A is the swept area of the rotor, m2.
2.3. Computational Domain and Mesh Generation
The computational domain and boundary conditions are illustrated in Figure 2. The overall domain is divided into four subregions. Z1 represents the external flow region, extending 15 D upstream and 25 D downstream of the rotor to minimize boundary effects. Z2 denotes the rotating region, which encloses the rotor and is coupled to Z1 through a non-conformal interface to allow data exchange during rotation. Z3 is embedded downstream of the rotor as a wake refinement zone, ensuring accurate capture of the unsteady flow structures in the wake, which is particularly important for assessing load fluctuations that can be amplified by wind–wave interactions in offshore conditions. The entire domain height is 30 D to avoid blockage effects. Boundary AD is defined as a velocity inlet with uniform inflow V∞, boundary BC is set as a pressure outlet with 0 Pa gauge pressure, and boundaries AB and CD are defined as symmetry planes. A no-slip condition is imposed on the blade surface. In addition, a suction velocity VSuc is specified at the blade suction slots. The working fluid is air, with a density ρ of 1.18415 kg/m3 and a dynamic viscosity μ of 1.855 × 10⁻⁵ kg/(m·s).

Figure 2.
Computational domain and boundary conditions (not to scale).
In this study, polygonal meshes are utilized for two-dimensional numerical simulations, as illustrated in Figure 3. Compared with conventional quadrilateral meshes, polygonal grids provide more neighboring cells per element, which facilitates improved convergence behavior and allows for a reduced total mesh count without compromising computational accuracy. Near the blade surface, the mesh is refined using a near-wall structure with a first-layer height of 1 × 10⁻⁵ m. A total of 28 boundary-layer mesh layers are employed, reaching an overall thickness of 2 mm, which ensures that the dimensionless wall distance is maintained at approximately Y+ ≈ 1.

Figure 3.
Mesh generation and detail view.
2.4. Turbulence Models and Computational Methods
Compared with the commonly used SST k-ω turbulence model, the Transition SST (TSST) four-equation model incorporates two additional transport equations for momentum thickness Reynolds number and intermittency, based on the original two-equation framework. This enables more accurate capture of vortex structures within the boundary layer and provides a reliable prediction of the transition process from laminar to turbulent flow. Consequently, the TSST model offers superior computational accuracy and predictive reliability when simulating complex aerodynamic characteristics [38].
Since the operating Mach number of the wind turbine is below 0.3, the flow can be considered incompressible with constant density. In this study, the unsteady Navier–Stokes equations are solved using the finite volume method. The pressure-velocity coupling is handled by the SIMPLE algorithm, and a second-order accurate scheme is employed for time discretization to ensure temporal accuracy.
3. Reliability Verification
The accuracy of numerical simulation results is affected by many factors. To ensure the reliability and accuracy of the simulation results, this section verifies the independence of results from the number of mesh, time step, number of rotation cycles and turbulence model.
3.1. Mesh Independence
Four different mesh configurations were developed by adjusting the mesh density and growth rate around the blade surface and surrounding regions. A mesh independence study was conducted under the operating condition of TSR = 2.64. Table 2 presents the average Cp of the wind turbine for each mesh configuration, along with the corresponding relative variation.

Table 2.
Mesh independence.
As shown in Table 2, the variation in Cp decreases with increasing mesh resolution. In particular, the difference between configurations N3 and N4 is only 0.32%, indicating that further mesh refinement yields limited accuracy improvement while significantly increasing computational cost.
Additionally, Figure 4 illustrates the variation of the single blade CT with respect to the azimuth angle under different mesh schemes. It is evident that the results for N1 deviate significantly from the other three, while the CT curves for N2 through N4 exhibit strong agreement. This suggests that the mesh resolution is sufficient. Considering both accuracy and computational efficiency, mesh configuration N3 (approximately 740,000 elements) is selected for subsequent simulations.

Figure 4.
Mesh verification.
3.2. Time Step Independence
The Unsteady Reynolds-Averaged Navier–Stokes (URANS) method is employed for numerical simulation in this study. The selection of time step size is generally governed by the characteristic time scale of the unsteady flow. Considering the periodic rotational nature of VAWTs, the angular displacement of the blade per unit time is used as the time step, with values set at 0.25°, 0.5°, and 1°. To balance computational accuracy and efficiency, a time-step independence study is conducted.
Figure 5 illustrates the variation in the single blade CT with azimuth angle under different time step sizes at TSR = 2.64. The results show that when the time step is ωdt = 1°, the CT curve is noticeably overpredicted in the upwind region and underpredicted in the downwind region. As the time step is reduced, the discrepancies progressively diminish. The curves for ωdt = 0.25° and 0.5° exhibit only minor differences within narrow azimuth intervals, indicating that further reduction of the time step yields limited improvement in temporal accuracy. Therefore, an angle step of ωdt = 0.5° is adopted in subsequent simulations.
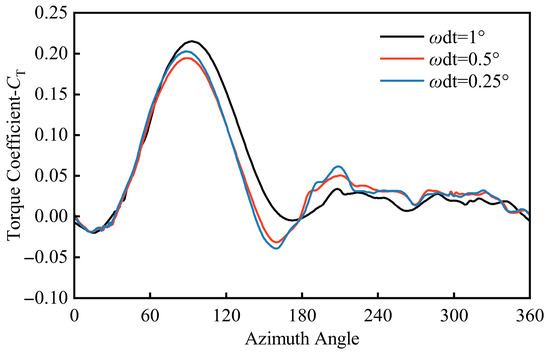
Figure 5.
Time step verification.
3.3. Revolution Independence
The number of rotor revolutions significantly affects the stability of the flow field and the reliability of the simulation results. If the simulation time is insufficient, the flow around the rotor and its wake region may not be fully developed, leading to considerable fluctuations in the monitored data.
Figure 6 presents the variation of Cp and its relative error at TSR = 2.64. At the beginning, Cp shows clear fluctuations as the flow field develops. From the 7th revolution onward, the relative error falls below 0.5% and the variation of Cp becomes negligible, indicating that both the rotor and the wake have reached a quasi-steady state. To further confirm convergence, the simulation was extended to 15 revolutions, which showed no significant changes compared with the 10th revolution. Therefore, the 10th revolution is selected as the reference for analysis, ensuring that the flow field is fully developed while avoiding unnecessary computational cost.
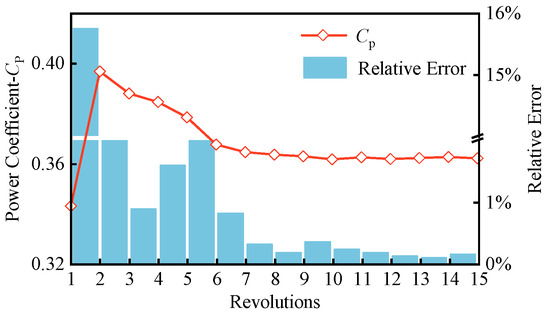
Figure 6.
Revolution verification.
3.4. Comparison with Experimental Values
To assess the accuracy of the turbulence models used, the simulation results obtained from the SST k-ω model and the four-equation TSST transition model were compared with experimental data reported by [34], as shown in Figure 7. Both models reproduce the overall aerodynamic characteristics of the rotor. As expected, the predicted values are higher than the experimental results because the present simulations are two-dimensional and neglect three-dimensional effects such as the tower, support structures, and tip losses. It has also been widely reported that 2D CFD simulations generally overpredict the performance of VAWTs due to the absence of three-dimensional wake dynamics and tip-loss effects [39,40].
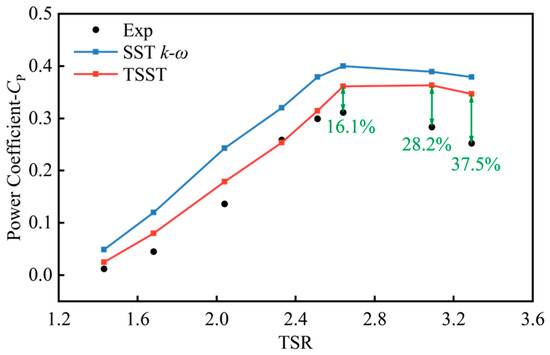
Figure 7.
Comparison of experimental values.
For clarity, several relative errors between numerical predictions and experimental results are also annotated in Figure 7. These values provide a quantitative indication of the deviation while confirming that the TSST model yields results in closer agreement with the experimental data than the SST k-ω model across the entire TSR range. Therefore, the TSST model was adopted for the subsequent numerical simulations in this study.
4. Orthogonal Experimental Design
Orthogonal experimental design (OED) provides an efficient approach for analyzing multi-factor and multi-level problems by reducing the number of simulation cases while still revealing the relative influence of each factor [41]. This makes it suitable for the present study, where a full-factorial analysis would be computationally prohibitive.
Although both leading-edge suction and trailing-edge gurney flap are effective in enhancing the aerodynamic performance of VAWTs, their control efficacy is highly sensitive to parameter configurations. For example, improper suction slot placement or width may fail to significantly delay flow separation under high angles of attack, while suboptimal GF height or width may disturb attached flow at low angles of attack, leading to degraded aerodynamic performance. To address these sensitivities, four geometric factors were selected for the OED: suction slot position (Ls), suction slot width (Ws), gurney flap height (hG), and gurney flap width (WG). Their variation ranges were defined with reference to existing studies on suction control and Gurney flap applications in VAWTs, combined with aerodynamic effectiveness and engineering feasibility [27,28,31,32,33]. This ensures that the selected levels are both physically meaningful and applicable to real turbine configurations.
4.1. Design of Suction and Gurney Flap Geometric Configurations
The four geometric parameters were defined as orthogonal test factors A (Ls), B (Ws), C (hG), and D (WG), with four levels assigned to each factor, as listed in Table 3.

Table 3.
OED factors and levels.
4.2. Range Analysis of OED
A total of 16 orthogonal simulation cases were conducted under the condition of TSR = 2.64. The results are presented in Table 4. The relative changes in torque coefficient (ΔCT) and power coefficient (ΔCp), defined as the average improvement of a single blade per cycle compared to the baseline VAWT, were selected as evaluation indicators of aerodynamic performance.

Table 4.
OED results.
As shown in Table 4, all parameter combinations yielded performance improvements, though the degree of enhancement varied significantly among the cases. To quantify the sensitivity of each factor, range analysis was employed. Table 5 presents the average values (Ave) and range values (R) of ΔCT and ΔCp for each factor at different levels. Here, Ave1, Ave2, etc. represent the mean values of ΔCT or ΔCp obtained from all orthogonal combinations where the corresponding factor is set at level 1, level 2, and so on.

Table 5.
The mean value and range of each index.
The results indicate that the influence of the parameters on aerodynamic performance, in descending order, is: suction slot position (Ls), suction slot width (Ws), gurney flap height (hG), and gurney flap width (WG). Notably, factor A exhibited the largest range of values for both indicators (R1A = 0.0085, R2A = 0.0647), suggesting it has the greatest impact.
Figure 8 illustrates the trends of ΔCT and ΔCp across different factor levels, revealing consistent response patterns. The optimal parameter combination was determined as A1B4C4D2, corresponding to Ls = 0.05 c, Ws = 0.03 c, hG = 1.5% c, WG = 0.1 hG.
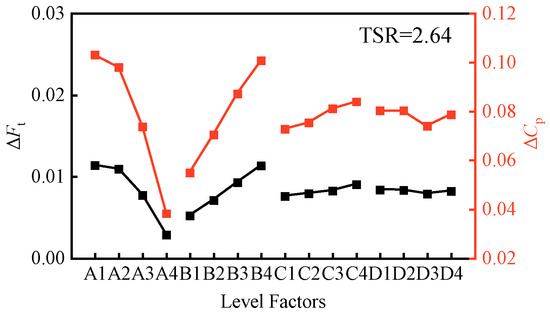
Figure 8.
The relationship between each factor level and index.
4.3. Optimal Combined Blade Geometry Model
To further evaluate the performance advantages of the hybrid flow control strategy over individual control methods, three blade models were constructed based on the previously optimized parameter combination: (a) a suction control model (OPT_Suc), incorporating only the optimal suction parameters; (b) a gurney flap control model (OPT_GF), featuring only the optimal gurney flap configuration; and (c) a hybrid control model (OPT_Suc + GF), combining both suction and gurney flap parameters. The geometric configurations of the three blade models are illustrated in Figure 9.
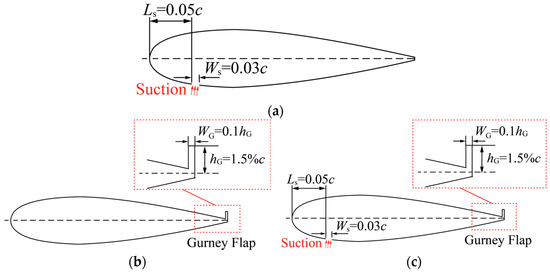
Figure 9.
Geometric configurations of different blade models. (a) OPT_Suc model; (b) OPT_GF model; (c) OPT_Suc + GF model.
5. Performance Analysis of Optimal Blade
5.1. Power Characteristic
Power coefficient variations for different rotor configurations over a range of TSR = 1.43~3.29 are presented in Figure 10. For clarity, the control schemes OPT_GF, OPT_Suc, and OPT_Suc + GF are hereafter referred to as GF, Suc, and Suc + GF, respectively.
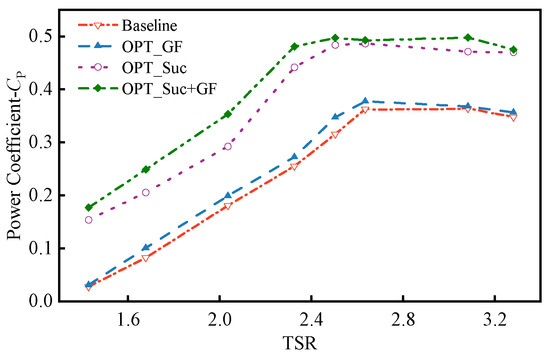
Figure 10.
Comparison of power coefficient under different control strategies at various TSRs.
As shown in Figure 10, all rotor configurations exhibit a general trend where the Cp initially increases with TSR, reaches a peak, and then gradually stabilizes or slightly decreases. This trend indicates that in the low TSR regime (TSR < 2.04), the aerodynamic performance of the rotor is not fully exploited, and the power extraction improves with increasing TSR. In contrast, at higher TSR values (TSR > 2.51), the reduced angle of attack leads to weakened lift generation, causing a decline in Cp.
Compared with the Baseline, all three control schemes improve performance to varying degrees. Among them, the hybrid control (Suc + GF) achieves the most significant enhancement, followed by the Suc scheme. Although GF shows a relatively modest improvement, it still provides a positive aerodynamic contribution. Specifically, at TSR = 1.68, the Cp of GF, Suc, and Suc + GF are 0.0985, 0.2036, and 0.247, respectively, representing increases of 23.28%, 154.82%, and 209.14% over the Baseline (0.0799). At TSR = 2.33, the performance gap between Suc and Suc + GF further widens, suggesting stronger synergy in the hybrid control; however, this advantage diminishes at higher TSR, indicating reduced marginal gains from the Gurney flap and a more dominant role of suction control in governing the flow field.
Across the entire TSR range (1.43~3.29), the average power coefficients of GF, Suc, and Suc + GF are 0.2548, 0.3746, and 0.4019, respectively, which represent improvements of 6.04%, 55.87%, and 67.24% over the Baseline value of 0.2403. These results confirm that Suc + GF not only enhances power extraction at lower TSRs but also maintains robust performance under high TSR conditions. Overall, the proposed hybrid flow control strategy offers significant aerodynamic benefits for improving VAWT efficiency.
5.2. Load Characteristics
5.2.1. Torque Coefficient of Single Blade
Figure 11 illustrates the variation of instantaneous CT for a single blade under different control strategies at three representative TSRs (1.68, 2.33, and 3.09), along with the corresponding bar charts showing the average CT in the upwind and downwind regions. In the bar plots, red bars indicate the average CT in the upwind region (0~180°), blue bars correspond to the downwind region (180~360°), and the black horizontal markers represent the cycle-averaged CT across the entire rotation. It is evident that all control strategies improve the aerodynamic performance of single blades to varying degrees, thereby enhancing torque output. Among them, the upwind region consistently provides the dominant contribution to positive torque, as its average CT is significantly higher than that of the downwind region. Specifically:
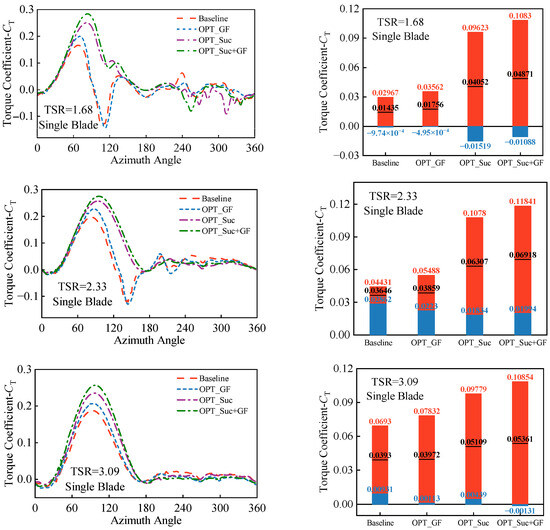
Figure 11.
Comparison of single blade torque coefficient distributions and regional averages under different control strategies at various TSRs.
At a low TSR of 1.68, both Suc and Suc + GF significantly amplify the torque peaks in the 60~120° region and alleviate the torque troughs observed in the Baseline, demonstrating notable aerodynamic benefits. However, due to the flow disturbances induced by suction, a negative aerodynamic effect emerges in the downwind region, causing the average CT to fall below that of the Baseline and GF cases. In contrast, GF exhibits modest enhancement in the upwind region, but its overall effect remains conservative. When TSR increases to 2.33, the average CT in the downwind region becomes positive across all schemes, indicating a more stabilized flow field. The performance gains of Suc and Suc + GF in the upwind region are further extended. The average CT of Suc + GF reaches 0.11841, representing a 167.23% increase compared to the Baseline, while Suc improves by 143.29%, underscoring the pronounced effectiveness of leading-edge suction. The hybrid control strategy further enhances the aerodynamic output. Under high TSR conditions (TSR = 3.09), Suc + GF continues to deliver the highest performance in the upwind region. Although its downwind region exhibits slightly reduced average torque due to the combined influence of suction and the gurney flap, the overall cycle-averaged CT remains the highest among all configurations. This confirms the significant advantage of the hybrid flow control strategy in enhancing the overall aerodynamic performance of VAWTs.
5.2.2. Torque Coefficient of Rotor
Figure 12 presents the variation of the rotor’s instantaneous CT with azimuthal angle under different control strategies, along with a bar chart comparing the corresponding cycle-averaged CT. Since the rotor is composed of three blades, the overall average CT is significantly higher than that of the single blade results shown in Figure 11. As observed in the left panel, the hybrid flow control strategy (Suc + GF) consistently enhances the rotor’s torque output across all examined TSR conditions. The improvements are particularly evident in the increase of torque peaks and the recovery of torque troughs, indicating that the hybrid approach is effective in delivering stable aerodynamic enhancement.
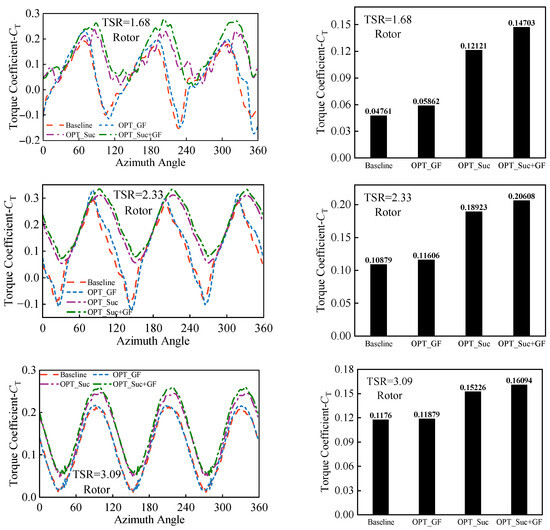
Figure 12.
Rotor torque coefficient distributions and averages under different control strategies at various TSRs.
The bar chart on the right further validates this trend. At TSR = 1.68, the average CT of Suc and Suc + GF reach 0.12121 and 0.14703, representing improvements of 154.59% and 208.82% compared to the Baseline value of 0.04761. As TSR increases to 2.33, Suc + GF continues to exhibit the highest performance, achieving a peak average CT of 0.20608. When TSR reaches 3.09, the torque curves of all configurations begin to converge, and although the advantage of Suc + GF is slightly reduced, it still maintains the highest average value of 0.16094. These results confirm that the hybrid flow control strategy remains effective and stable even under high TSR conditions.
5.2.3. Force Coefficient of Single Blade
Figure 13 illustrates the variation of the normal force coefficient of a single blade under different control strategies as a function of the azimuthal angle. As shown in the figure, the peak values of the normal force coefficient for Suc and Baseline configurations nearly coincide in the upwind region, indicating that the single suction strategy has limited impact on improving the blade’s load-bearing capacity. In contrast, both GF and Suc + GF configurations significantly increase the peak values, suggesting enhanced lift generation in this region, which contributes to improved wind energy capture.
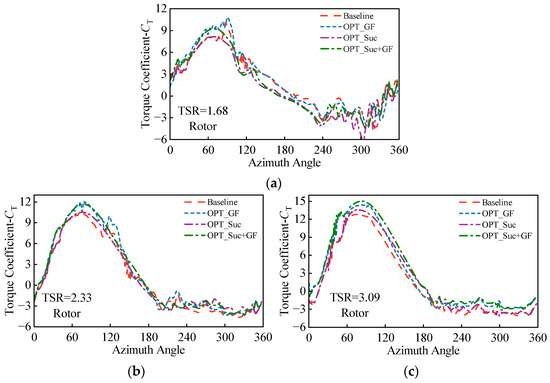
Figure 13.
Variation of single blade normal force coefficient under different control strategies. (a) TSR = 1.68; (b) TSR = 2.33; (c) TSR = 3.09.
Specifically, at TSR = 1.68 and 2.33, the GF-controlled blades exhibit multiple peaks and troughs in the upwind region, reflecting considerable load fluctuations that may negatively affect structural fatigue. In comparison, Suc + GF not only raises the peak normal force coefficient but also maintains smaller amplitude fluctuations, indicating a more stable force response. At high TSR (3.09), Suc + GF retains the highest normal force coefficient with a relatively smooth curve, demonstrating that the hybrid control strategy not only improves overall loading capacity but also offers advantages in structural stability.
5.3. Flow Characteristics
5.3.1. Q Criterion Analysis
Figure 14 presents the vortex structure evolution of different rotors at three representative TSRs, visualized using Q-criterion isosurface to capture the characteristics of flow separation and vortex shedding. Overall, as the TSR increases, vortex shedding first intensifies and then weakens, consistent with the variation in aerodynamic loading.
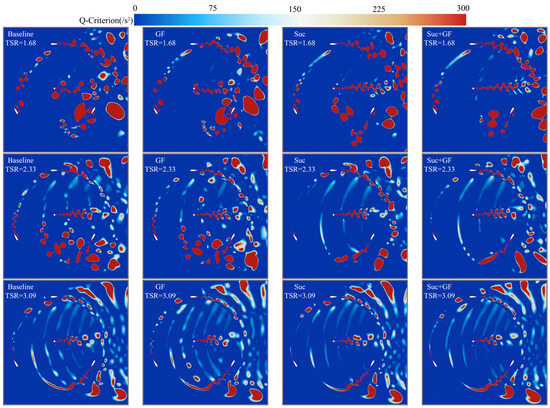
Figure 14.
Vortex structures based on Q-criterion under different control strategies at various TSRs.
Compared with the Baseline, which exhibits strong flow separation and large-scale vortex shedding in the upwind region, the GF configuration provides only moderate suppression. In contrast, suction control (Suc) effectively delays separation and reduces vortex intensity, while the hybrid strategy (Suc + GF) consistently produces the smallest vortices and the most organized wake distribution across all TSRs. This superior performance arises because suction removes low-energy boundary layer fluid and delays stall, while the Gurney flap enhances trailing-edge pressure recovery and stabilizes the wake. Their combined effect explains the improved aerodynamic efficiency and stability achieved by the hybrid control scheme.
5.3.2. Relative Velocity Vector Field Analysis of a Single Blade
To further investigate the mechanisms by which different flow control strategies affect the aerodynamic performance of VAWTs, Figure 15 presents the relative velocity vector fields of single blades under various configurations at TSR = 2.33 across different azimuthal angles.
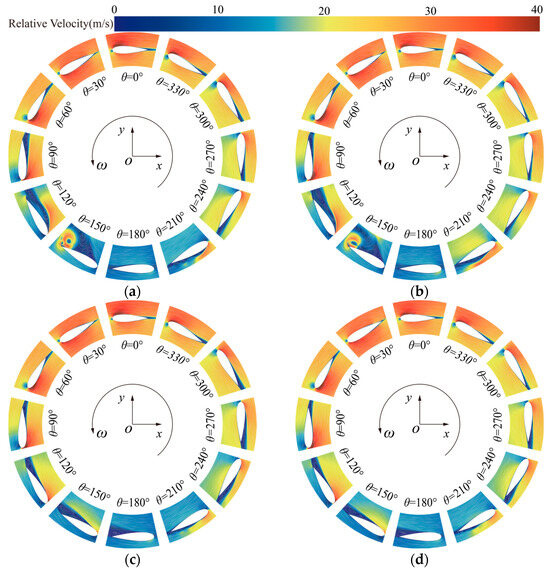
Figure 15.
Relative velocity field distribution around a single blade under different control strategies at TSR = 2.33. (a) Baseline; (b) OPT_GF; (c) OPT_Suc; (d) OPT_Suc + GF.
As observed, within the azimuth range of 0~60°, all schemes exhibit similar flow behavior. However, the Baseline configuration begins to show an intensified adverse pressure gradient on the suction surface, inducing local backflow and signaling the onset of flow separation. This corresponds to the decreasing trend in CT observed under the same condition in Figure 11. Between 90~180°, the Baseline blade undergoes large-scale separation on the suction surface, with severe stall evident at 150°. While the GF configuration slightly reduces the separated region, it fails to delay stall significantly. In contrast, both Suc and Suc + GF effectively suppress large-scale flow separation and delay stall onset. Notably, Suc + GF further enhances suction surface attachment due to the presence of the gurney flap, demonstrating superior flow control effectiveness. In the downwind region (180~360°), the suction and pressure surfaces reverse. Under these conditions, suction control alone tends to induce additional separation, particularly around 240~270°. However, Suc + GF alleviates this issue through the stabilizing effect of the gurney flap, improving aerodynamic stability in the downwind region.
In summary, Suc + GF consistently outperforms single-control strategies (Suc or GF) throughout the entire rotation cycle. It not only mitigates separation on the suction surface but also enhances the aerodynamic stability of the blade.
6. Conclusions
To enhance the aerodynamic performance of VAWTs and support their deployment in complex offshore environments such as nearshore and deep-sea regions, this study proposes a composite flow control strategy combining leading-edge suction and trailing-edge gurney flap. The aim is to provide a theoretical basis and technical support for the efficient design of next-generation offshore VAWTs. The main conclusions are as follows:
- (i)
- Based on CFD simulations and orthogonal experimental design, the optimal set of composite control parameters was determined: suction slot located at 0.05 c with a width of 0.03 c, and gurney flap height and width set to 1.5% c and 0.1 hG, respectively.
- (ii)
- The Suc + GF configuration significantly enhances wind energy capture at low TSRs and maintains strong adaptability and aerodynamic stability at higher TSRs. Compared to the Baseline model and other single-control strategies (suction or gurney flap), it achieves the highest increase in power coefficient across the entire TSR range, with an average improvement of 67.24%.
- (iii)
- Load analysis indicates that Suc + GF improves torque output across all TSR conditions, particularly in enhancing torque peaks and valley recovery. It also increases the mean aerodynamic load in the upwind region and suppresses load fluctuations, contributing to improving operational stability of the rotor.
- (iv)
- Flow field analysis reveals that leading-edge suction effectively delays flow separation, while the gurney flap improves the aerodynamic characteristics of the downwind region. Their synergistic interaction optimizes wake structures and enhances energy capture efficiency. These improvements offer theoretical and technical guidance for the stable operation of VAWTs in deep-sea environments and are especially relevant for offshore applications, where strong turbulence induced by coupled wind–wave conditions poses severe challenges to rotor stability and efficiency.
- (v)
- It should be noted that the present study is limited to two-dimensional simulations under idealized inflow conditions. Future studies with high-fidelity 3D modeling and experimental validation are required to further confirm the scalability and offshore applicability of the Suc + GF strategy.
7. Future Work
This paper focuses on the influence of Suc + GF composite control on the aerodynamic performance of VAWT. There may be further research in the future:
- (i)
- In this paper, suction was applied continuously throughout the rotor rotation. In future studies, azimuth-selective suction strategies, where suction is activated only within specific azimuthal angle ranges, can be investigated to further optimize performance.
- (ii)
- Explore alternative Gurney flap placements, including arrangements on the inner side of the rotor.
- (iii)
- In the future, wind tunnel experiments will be carried out to confirm the effect of the Suc + GF model studied in this paper.
- (iv)
- Extend the aerodynamic analysis to offshore-specific challenges such as wind–wave coupling, salt-induced erosion, cyclic load fatigue, and vibration mitigation through unsteady flow diagnostics.
- (v)
- Integrate parametric optimization with offshore operational conditions by linking airfoil selection to turbulence resistance, coupling operational parameters (θ, ω) with IEC wind–wave spectra, and connecting flap geometry to cyclic load reduction. Future work will also include inlet boundary conditions based on IEC turbulence profiles, representative marine air temperatures, surface roughness models for salt spray erosion, and validation with experiments under saline environments.
Author Contributions
H.O.: Conceptualization, Methodology, Investigation, Software, Validation, Data curation, Writing—original draft. Q.Z.: Investigation, Software, Validation, Data curation. C.L.: Supervision, Resources, Funding acquisition, Project administration. D.L.: Investigation, Data curation. W.M.: Investigation, Resources, Software, Supervision. H.L.: Investigation, Resources, Formal analysis, Writing—review & editing. Z.X.: Conceptualization, Formal analysis, Writing—review & editing. All authors have read and agreed to the published version of the manuscript.
Funding
The authors would like to acknowledge the support of National Key R&D Program of China (2024YFA1012501) and National Natural Science Foundation of China (52476212, 52506259). This research is also support by the ULTIMATE project funded by the UKRI Marie Skłodowska-Curie Postdoctoral Fellowship [UKRI/EPSRC: EP/Y014235/2], Shanghai University Science and the State Key Laboratory of Mechanical System and Vibration at Shanghai Jiao Tong University, Shanghai, China (No. MSV202411), and the General Program of the 2024 Shanghai ‘Science and Technology Innovation Action Plan’ Natural Science Foundation (No. 24ZR1454800).
Data Availability Statement
The original contributions presented in this study are included in the article. Further inquiries can be directed to the corresponding authors.
Conflicts of Interest
The authors declare that they have no known competing financial interests or personal relationships that could have appeared to influence the work reported in this paper.
Correction Statement
This article has been republished with a minor correction to the correspondence contact information. This change does not affect the scientific content of the article.
Abbreviations
The following abbreviations are used in this manuscript:
| VAWT | Vertical Axis Wind Turbine |
| HAWT | Horizontal Axis Wind Turbine |
| CFD | Computational Fluid Dynamics |
| AFC | Active Flow Control |
| PFC | Passive Flow Control |
| TSR | Tip Speed Ratio |
| URANS | Unsteady Reynolds-Averaged Navier–Stokes |
| TSST | Four-equation Transition SST model |
| Suc | Suction |
| GF | Gurney Flap |
| Suc + GF | Suction and Gurney Flap |
References
- Dinh, Q.V.; Doan, Q.V.; Ngo-Duc, T.; Dinh, V.N.; Duc, N.D. Offshore wind resource in the context of global climate change over a tropical area. Appl. Appl. Energy 2022, 308, 118369. [Google Scholar] [CrossRef]
- Chen, M.; Huang, W.; Ali, S. Asymmetric linkages between wind energy and ecological sustainability: Evidence from quantile estimation. Environ. Dev. 2023, 45, 100798. [Google Scholar] [CrossRef]
- Du, Z.; Dai, Z.; Yang, Z.; Zhan, C.; Chen, W.; Cao, M.; Thanh, H.V.; Soltanian, M.R. Exploring hydrogen geologic storage in China for future energy: Opportunities and challenges. Renew. Sustain. Energy Rev. 2024, 196, 114366. [Google Scholar] [CrossRef]
- Msigwa, G.; Ighalo, J.O.; Yap, P.S. Considerations on environmental, economic, and energy impacts of wind energy generation: Projections towards sustainability initiatives. Sci. Total Environ. 2022, 849, 157755. [Google Scholar] [CrossRef]
- Global Wind Energy Council. Global Wind Report; GWEC: Lisbon, Portugal, 2025. [Google Scholar]
- Sahu, B.K. Wind energy developments and policies in China: A short review. Renew. Sustain. Energy Rev. 2018, 81, 1393–1405. [Google Scholar] [CrossRef]
- Du, R.; Chen, H.; Yu, M.; Li, W.; Niu, D.; Wang, K.; Zhang, Z. 3DTCN-CBAM-LSTM short-term power multi-step prediction model for offshore wind power based on data space and multi-field cluster spatio-temporal correlation. Appl. Energy 2024, 376 Pt A, 124169. [Google Scholar] [CrossRef]
- International Energy Association. Technology Roadmap: China Wind Energy Development Roadmap 2050; IEA: Paris, France, 2021. [Google Scholar]
- Huang, S.; Wu, Q.; Guo, Y.; Rong, F. Optimal active power control based on MPC for DFIG-based wind farm equipped with distributed energy storage systems. Int. J. Electr. Power Energy Syst. 2019, 113, 154–163. [Google Scholar] [CrossRef]
- Hand, B.; Cashman, A. A review on the historical development of the lift-type vertical axis wind turbine: From onshore to offshore floating application. Sustain. Energy Technol. Assess. 2020, 38, 100646. [Google Scholar] [CrossRef]
- Rehman, S.; Rafique, M.M.; Alam, M.M.; Alhems, L.M. Vertical axis wind turbine types, efficiencies, and structural stability-A Review. Wind. Struct. 2019, 29, 15–32. [Google Scholar]
- Santamaría, L.; Oro, J.M.F.; Díaz, K.M.A.; Meana-Fernández, A.; Pereiras, B.; Velarde-Suárez, S. Novel methodology for performance characterization of vertical axis wind turbines (VAWT) prototypes through active driving mode. Energy Convers. Manag. 2022, 258, 115530. [Google Scholar] [CrossRef]
- Wang, X.; Ali, A.; Ke, H.; Huang, B.; Yang, J. Numerical simulation of aerodynamic performance degradation of NACA0012 airfoils under icing conditions for vertical-axis wind turbines. Case Stud. Therm. Eng. 2025, 72, 106433. [Google Scholar] [CrossRef]
- Hand, B.; Kelly, G.; Cashman, A. Aerodynamic design and performance parameters of a lift-type vertical axis wind turbine: A comprehensive review. Renew. Sustain. Energy Rev. 2021, 139, 110699. [Google Scholar] [CrossRef]
- Li, Y.; Tong, G.; Ma, Y.; Feng, F.; Tagawa, K. Numerical study on aerodynamic performance improvement of the straight-bladed vertical axis wind turbine by using wind concentrators. Renew. Energy 2023, 219 Pt 2, 119545. [Google Scholar] [CrossRef]
- Singh, M.A.; Biswas, A.; Misra, R.D. Investigation of self-starting and high rotor solidity on the performance of a three S1210 blade H-type Darrieus rotor. Renew. Energy 2015, 76, 381–387. [Google Scholar] [CrossRef]
- Saemian, M.; Bergadà, M.J. Active flow control actuators on wind turbines; comprehensive review. Ocean. Eng. 2025, 339 Pt 1, 121991. [Google Scholar] [CrossRef]
- Wang, L.; Alam, M.M.; Rehman, S.; Zhou, Y. Effects of blowing and suction jets on the aerodynamic performance of wind turbine airfoil. Renew. Energy 2022, 196, 52–64. [Google Scholar] [CrossRef]
- Liu, Q.; Miao, W.; Bashir, M.; Xu, Z.; Yu, N.; Luo, S.; Li, C. Aerodynamic and aeroacoustic performance assessment of a vertical axis wind turbine by synergistic effect of blowing and suction. Energy Convers. Manag. 2022, 271, 116289. [Google Scholar] [CrossRef]
- Yang, K.; Zhang, L.; Xu, J. Simulation of aerodynamic performance affected by vortex generators on blunt trailing-edge airfoils. Sci. China Ser. E Technol. Sci. 2010, 53, 1–7. [Google Scholar] [CrossRef]
- Attie, C.; ElCheikh, A.; Nader, J.; Elkhoury, M. Performance Enhancement of a Vertical Axis Wind Turbine using a Slotted Deflective Flap at the Trailing Edge. Energy Convers. Manag. 2022, 273, 116388. [Google Scholar] [CrossRef]
- Karthikeyan, K.; Harish, R. Enhanced aerodynamic performance of NACA4412 airfoil through integrated plasma actuator and Gurney flap flow control. Results Eng. 2025, 25, 103977. [Google Scholar] [CrossRef]
- Chawla, J.S.; Suryanarayanan, S.; Puranik, B.; Sheridan, J.; Falzon, B.G. Efficiency improvement study for small wind turbines through flow control. Sustain. Energy Technol. Assess. 2014, 7, 195–208. [Google Scholar] [CrossRef]
- Wolf, A.; Lutz, T.; Würz, W.; Krämer, E.; Stalnov, O.; Seifert, A. Trailing edge noise reduction of wind turbine blades by active flow control. Wind. Energy 2015, 18, 909–923. [Google Scholar] [CrossRef]
- Wahidi, R.; Bridges, H.D. Effects of Distributed Suction on an Airfoil at Low Reynolds Number. AIAA J. 2012, 50, 523–539. [Google Scholar] [CrossRef]
- Rezaeiha, A.; Montazeri, H.; Blocken, B. Active flow control for power enhancement of vertical axis wind turbines: Leading-edge slot suction. Energy 2019, 189, 116131. [Google Scholar] [CrossRef]
- Vos, E.M. Improvement of Aerodynamic Performance of Vertical Axis Wind Turbines Using Boundary Layer Suction. Master’s Thesis, Eindhoven University of Technology, Eindhoven, The Netherlands, 2019. [Google Scholar]
- Sun, J.; Huang, D. Numerical investigation of boundary layer suction control positions on airfoils for vertical-axis wind turbine. J. Mech. Sci. Technol. 2021, 35, 2903–2914. [Google Scholar] [CrossRef]
- Zhu, H.; Hao, W.; Li, C.; Ding, Q.; Wu, B. A critical study on passive flow control techniques for straight-bladed vertical axis wind turbine. Energy 2018, 165, 12–25. [Google Scholar] [CrossRef]
- Zhu, H.; Hao, W.; Li, C.; Ding, Q. Numerical study of effect of solidity on vertical axis wind turbine with Gurney flap. J. Wind. Eng. Ind. Aerodyn. 2019, 186, 17–31. [Google Scholar] [CrossRef]
- Bianchini, A.; Balduzzi, F.; Di Rosa, D.; Ferrara, G. On the use of gurney flaps for the aerodynamic performance augmentation of Darrieus wind turbines. Energy Convers. Manag. 2019, 184, 402–415. [Google Scholar] [CrossRef]
- Zhu, H.; Hao, W.; Li, C.; Luo, S.; Liu, Q.; Gao, C. Effect of geometric parameters of gurney flap on performance enhancement of straight-bladed vertical axis wind turbine. Renew. Energy 2021, 165, 464–480. [Google Scholar] [CrossRef]
- Syawitri, T.P.; Yao, Y.; Yao, J.; Chandra, B. Geometry optimisation of vertical axis wind turbine with Gurney flap for performance enhancement at low, medium and high ranges of tip speed ratios. Sustain. Energy Technol. Assess. 2022, 49, 101779. [Google Scholar] [CrossRef]
- Castelli, M.R.; Ardizzon, G.; Battisti, L.; Benini, E.; Pavesi, G. Modeling strategy and numerical. validation for a Darrieus vertical axis micro-wind turbine. In Proceedings of the ASME 2010 International Mechanical Engineering Congress and Exposition, Vancouver, BC, Canada, 12–18 November 2010. [Google Scholar]
- Mansoubi, S.; Sadeghi, H.; Ma, Y.; Mohebbi, R. An experimental and numerical investigation into the influence of wind effects on wind turbines with tubular towers. Ocean. Eng. 2024, 313 Pt 3, 119555. [Google Scholar] [CrossRef]
- He, J.; Jin, X.; Xie, S.; Cao, L.; Wang, Y.; Lin, Y.; Wang, N. CFD modeling of varying complexity for aerodynamic analysis of H-vertical axis wind turbines. Renew. Energy 2020, 145, 2658–2670. [Google Scholar] [CrossRef]
- Ou, H.; Miao, W.; Li, C.; Weng, Y.; Yue, M.; Zhang, W.; Xu, Z. Research on multi-physical field coupling characteristics of three-dimensional variable cross-section blade H-type vertical axis wind turbine. Energy Convers. Manag. 2025, 342, 120105. [Google Scholar] [CrossRef]
- Rezaeiha, A.; Montazeri, H.; Blocken, B. On the accuracy of turbulence models for CFD simulations of vertical axis wind turbines. Energy 2019, 180, 838–857. [Google Scholar] [CrossRef]
- Li, C.; Zhu, S.; Xu, Y.L.; Xiao, Y. 2.5D large eddy simulation of vertical axis wind turbine in consideration of high angle of attack flow. Renew. Energy 2013, 51, 317–330. [Google Scholar] [CrossRef]
- Bachant, P.; Wosnik, M. Modeling the near-wake of a vertical-axis cross-flow turbine with 2-D and 3-D RANS. J. Renew. Sustain. Energy 2016, 8, 053311. [Google Scholar] [CrossRef]
- Xu, Z.; Feng, Y.; Zhao, C.; Huo, Y.; Li, S.; Hu, X.; Zhong, Y. Experimental and numerical investigation on aerodynamic performance of a novel disc-shaped wind rotor for the small-scale wind turbine. Energy Convers. Manag. 2018, 175, 173–191. [Google Scholar] [CrossRef]
Disclaimer/Publisher’s Note: The statements, opinions and data contained in all publications are solely those of the individual author(s) and contributor(s) and not of MDPI and/or the editor(s). MDPI and/or the editor(s) disclaim responsibility for any injury to people or property resulting from any ideas, methods, instructions or products referred to in the content. |
© 2025 by the authors. Licensee MDPI, Basel, Switzerland. This article is an open access article distributed under the terms and conditions of the Creative Commons Attribution (CC BY) license (https://creativecommons.org/licenses/by/4.0/).