Article

Operational Inundation and Water Quality Forecasting in Transitional Waters: Lessons from the Tagus Estuary, Portugal

by
Marta Rodrigues
*,
André B. Fortunato
,
Gonçalo Jesus
,
Ricardo J. Martins
and
Anabela Oliveira
National Laboratory for Civil Engineering, Avenida do Brasil, 101, 1700-066 Lisbon, Portugal
*
Author to whom correspondence should be addressed.
J. Mar. Sci. Eng. 2025, 13(9), 1668; https://doi.org/10.3390/jmse13091668 (registering DOI)
Submission received: 26 June 2025 / Revised: 21 August 2025 / Accepted: 27 August 2025 / Published: 30 August 2025
(This article belongs to the Special Issue Coastal Water Quality Observation and Numerical Modeling)

Abstract

This study presents the implementation and evaluation of a high-resolution operational forecasting system for the Tagus estuary (Portugal), focusing on inundation and water quality predictions to support estuarine management. Developed using the relocatable Water Information Forecast Framework (WIFF), the system integrates two implementations of SCHISM: a 2D barotropic model including wave–current interactions for flood-prone areas, and a 3D baroclinic model simulating salinity, temperature, and biogeochemical variables. Forecasts were assessed over six months using in situ and satellite near real-time observations. Results show that the operational models represent well water levels, waves, salinity, temperature, and water quality dynamics. Compared to a regional model, the local forecast system generally offers improved accuracy within the estuary due to higher spatial resolution and better representation of local dynamics. Several challenges remain, including uncertainties in oceanic and riverine boundary conditions and limited high-resolution near real-time observations to continuously assess and improve operational models. Furthermore, the absence of operational two-way coupling between regional and local models limits cross-scale integration of physical and biogeochemical processes. The forecasting system for the Tagus estuary demonstrates the potential of local high-resolution operational models as reliable, user-oriented tools for managing transitional water systems, and as core elements for coastal management.

1. Introduction

Estuaries are among Earth’s most dynamic and productive ecosystems, acting as vital interfaces between land and sea. They provide crucial services, including supporting biodiversity, filtering water, and facilitating human endeavors like fisheries and transportation [1,2,3]. Despite their importance, these environments are increasingly pressured by human activities and climate change, resulting in degraded water quality and heightened flood exposure [4,5,6,7,8]. Such challenges demand innovative strategies for effective management.
Managing estuarine environments is particularly challenging due to the complex interplay of natural and human-made factors [9], posing severe risks such as contamination of water bodies and inundation of urbanized margins. The degradation of the water quality by contaminants from urban and industrial wastewater discharges, agricultural activities, dredging operations, or changes in freshwater water balances due to dams or extreme weather events [10,11,12,13,14] threatens the ecosystem’s health and sustainability. Inundation risks endanger human and natural assets and add another layer of complexity to management actions. Although estuaries are naturally prone to flooding due to tidal dynamics, factors such as sea-level rise, increased storm frequency, and changes in river discharge patterns due to climate change increase these risks [15,16,17]. Additionally, urbanization often increases the vulnerability of estuarine margins to inundation [18] by reducing natural flood buffers, such as wetlands and marshes. Integrated management of estuaries to address these challenges requires detailed, real-time knowledge into biogeochemical dynamics and inundation processes, which can be provided by sophisticated, high-resolution forecasting tools.
Coastal forecasts play a fundamental role in providing timely information for daily activities and planning to support estuarine management. Several ocean and coastal forecasting services are currently available, although their geographical and thematical distribution varies significantly [19,20]. Reference [21] presents an operational forecasting system applied in Portugal to predict extreme sea levels at both regional and local scales, integrating hydrodynamic modeling with real-time data. The SAMOA—System of Meteorological and Oceanographic Support for Port Authorities forecasting system [22,23] provides high-resolution forecasting applications for the Spanish coast. The WMOP—Western Mediterranean Operational forecasting system [24,25] provides 2-km forecasts of ocean temperature, salinity, sea level, and currents for the Western Mediterranean basin. The Bluelink forecasting system [26] provides circulation and biogeochemical forecasts for the Australian coast at different spatial scales, including a user-driven relocatable local area model (ROAM) that allows the users to configure physical forecasts with sub-km resolutions. High-resolution coastal forecasting systems are still scarce, particularly those dealing with inundation and water quality in transitional waters. Numerical models are central to operational forecasting services. Process-based models are commonly used [21,22], but approaches based on Artificial Intelligence (AI) are also emerging [27,28]. These models are often coupled with near real-time (NRT) monitoring systems [29,30], including in situ sensors and remote sensing platforms, to validate predictions [31] or provide inputs for data assimilation [32,33]. Several tools have been developed in recent years, by merging forecast frameworks and web-based interfaces, to build relocatable forecast services, facilitating the deployment of forecast systems and providing the corresponding computational resources [34,35,36]. Despite these advancements, several challenges remain in operational forecasting, particularly in estuarine regions, due to their transitional nature.
This paper evaluates and discusses the current state and potential advancements in operational forecasting for biogeochemistry and inundation within estuarine environments. We detail the implementation and validation of a high-resolution operational forecasting system developed for the Tagus estuary, which serves as a focal point for this study. To assess its performance, we compare six months of operational results from the Tagus estuary model with in situ and satellite NRT data, as well as outputs from Copernicus Marine Service regional models for the Iberia–Biscay–Ireland region (CMEMS-IBI) for physics [37,38,39,40,41], waves [42], and biogeochemistry [43]. Finally, drawing from our experience in generating and operating this multi-purpose forecast system, we discuss the lessons learned from this exercise, aiming to generalize these insights to improve coastal forecast systems as effective tools for estuarine management.
The Tagus estuary (Portugal), which is vital ecologically, economically, and socially, has been extensively monitored and modeled since the 1980s [44]. Early barotropic models, driven by tides and river flow, had coarse resolutions, limited domains, and lacked wetting and drying simulation [45,46]. Nevertheless, these were instrumental in studying hydrodynamics, salinity [47], sediment dynamics [48,49,50], residence times [51], and water quality [47]. By the late 1990s, finer grids improved geometric and tidal propagation representation [52]. The 2000s saw the introduction of 3D baroclinic models with wind forcing [53] and advanced biogeochemical water quality simulations [54,55,56], alongside the first operational model [57].
Further advances in the 2010s included wave dynamics, wave–current interactions, and storm surge modeling [58,59], enabling inundation and sea level rise impact studies [60,61]. Domains expanded both upstream and downstream to the continental shelf [21,62,63]. Operational modeling progressed to simulate coupled waves, currents, inundation [21], fecal contamination [64,65], and biogeochemical dynamics [66]. Since 2020, operational baroclinic models have been enhanced through automated online comparison with observational data and coupled circulation–biogeochemical processes [31]. User-friendly, open-access platforms to generate on-demand forecasts further accelerated operational model development for the Tagus estuary [34,35]. Collectively, these advancements have matured the existing tools, providing all the necessary components for robust operational forecasts in the Tagus estuary. These forecasts can significantly enhance water quality and inundation management by supporting early warning mechanisms and guiding long-term planning. While state-of-the-art models now incorporate key processes, challenges in their operational implementation remain, as discussed herein.
The paper is organized as follows. Section 2 describes the methodology used in the study, including the study area, the forecasting system, and the implementation of the operational models in the Tagus estuary. Section 3 presents and discusses the results. Conclusions are summarized in Section 4.

2. Materials and Methods

2.1. Study Area

A vital hub for Portugal, the Tagus estuary offers significant economic, social, and environmental value, hosting a major harbor and a protected area. Its shores, densely populated with over 1.6 million inhabitants [67] across industrial, agricultural, and urban areas (including the nation’s capital and other key cities), stress its water and ecological quality [68,69,70,71,72,73]. Moreover, its margins face inundation [21], a climate change-exacerbated issue responsible for notable economic and environmental damage from past floods [67,74].
The Tagus estuary spans over approximately 320 km2, with intertidal areas accounting for nearly 43% of its total surface [75]. The estuary connects to the Atlantic Ocean through a deep, long, and narrow inlet and the mid-estuary has a shallow inner basin with extensive tidal flats and marshes, narrowing around 40 km upstream of the inlet (Figure 1). The circulation in the estuary is mainly driven by tides, although other factors, such as river flow, wind, atmospheric pressure, and surface waves, may also influence the circulation within the estuary during storms [59]. The semi-diurnal tidal ranges at the coast vary between 0.55 m and 3.86 m [61] and are significantly amplified within the estuary due to resonance effects [46,52]. With a mean discharge of 336 m3/s, the Tagus River is the primary source of freshwater [76]. Additional freshwater contributions come from the Sorraia and Trancão rivers. The water levels are mainly controlled by tides and storm surges downstream, while in the upper estuary river discharge may significantly influence water levels. Though often considered well-mixed, the Tagus estuary can become stratified when river flows are high and tidal ranges are low [62,77].

2.2. Operational Models of the Tagus Estuary

2.2.1. The Tagus Forecast System

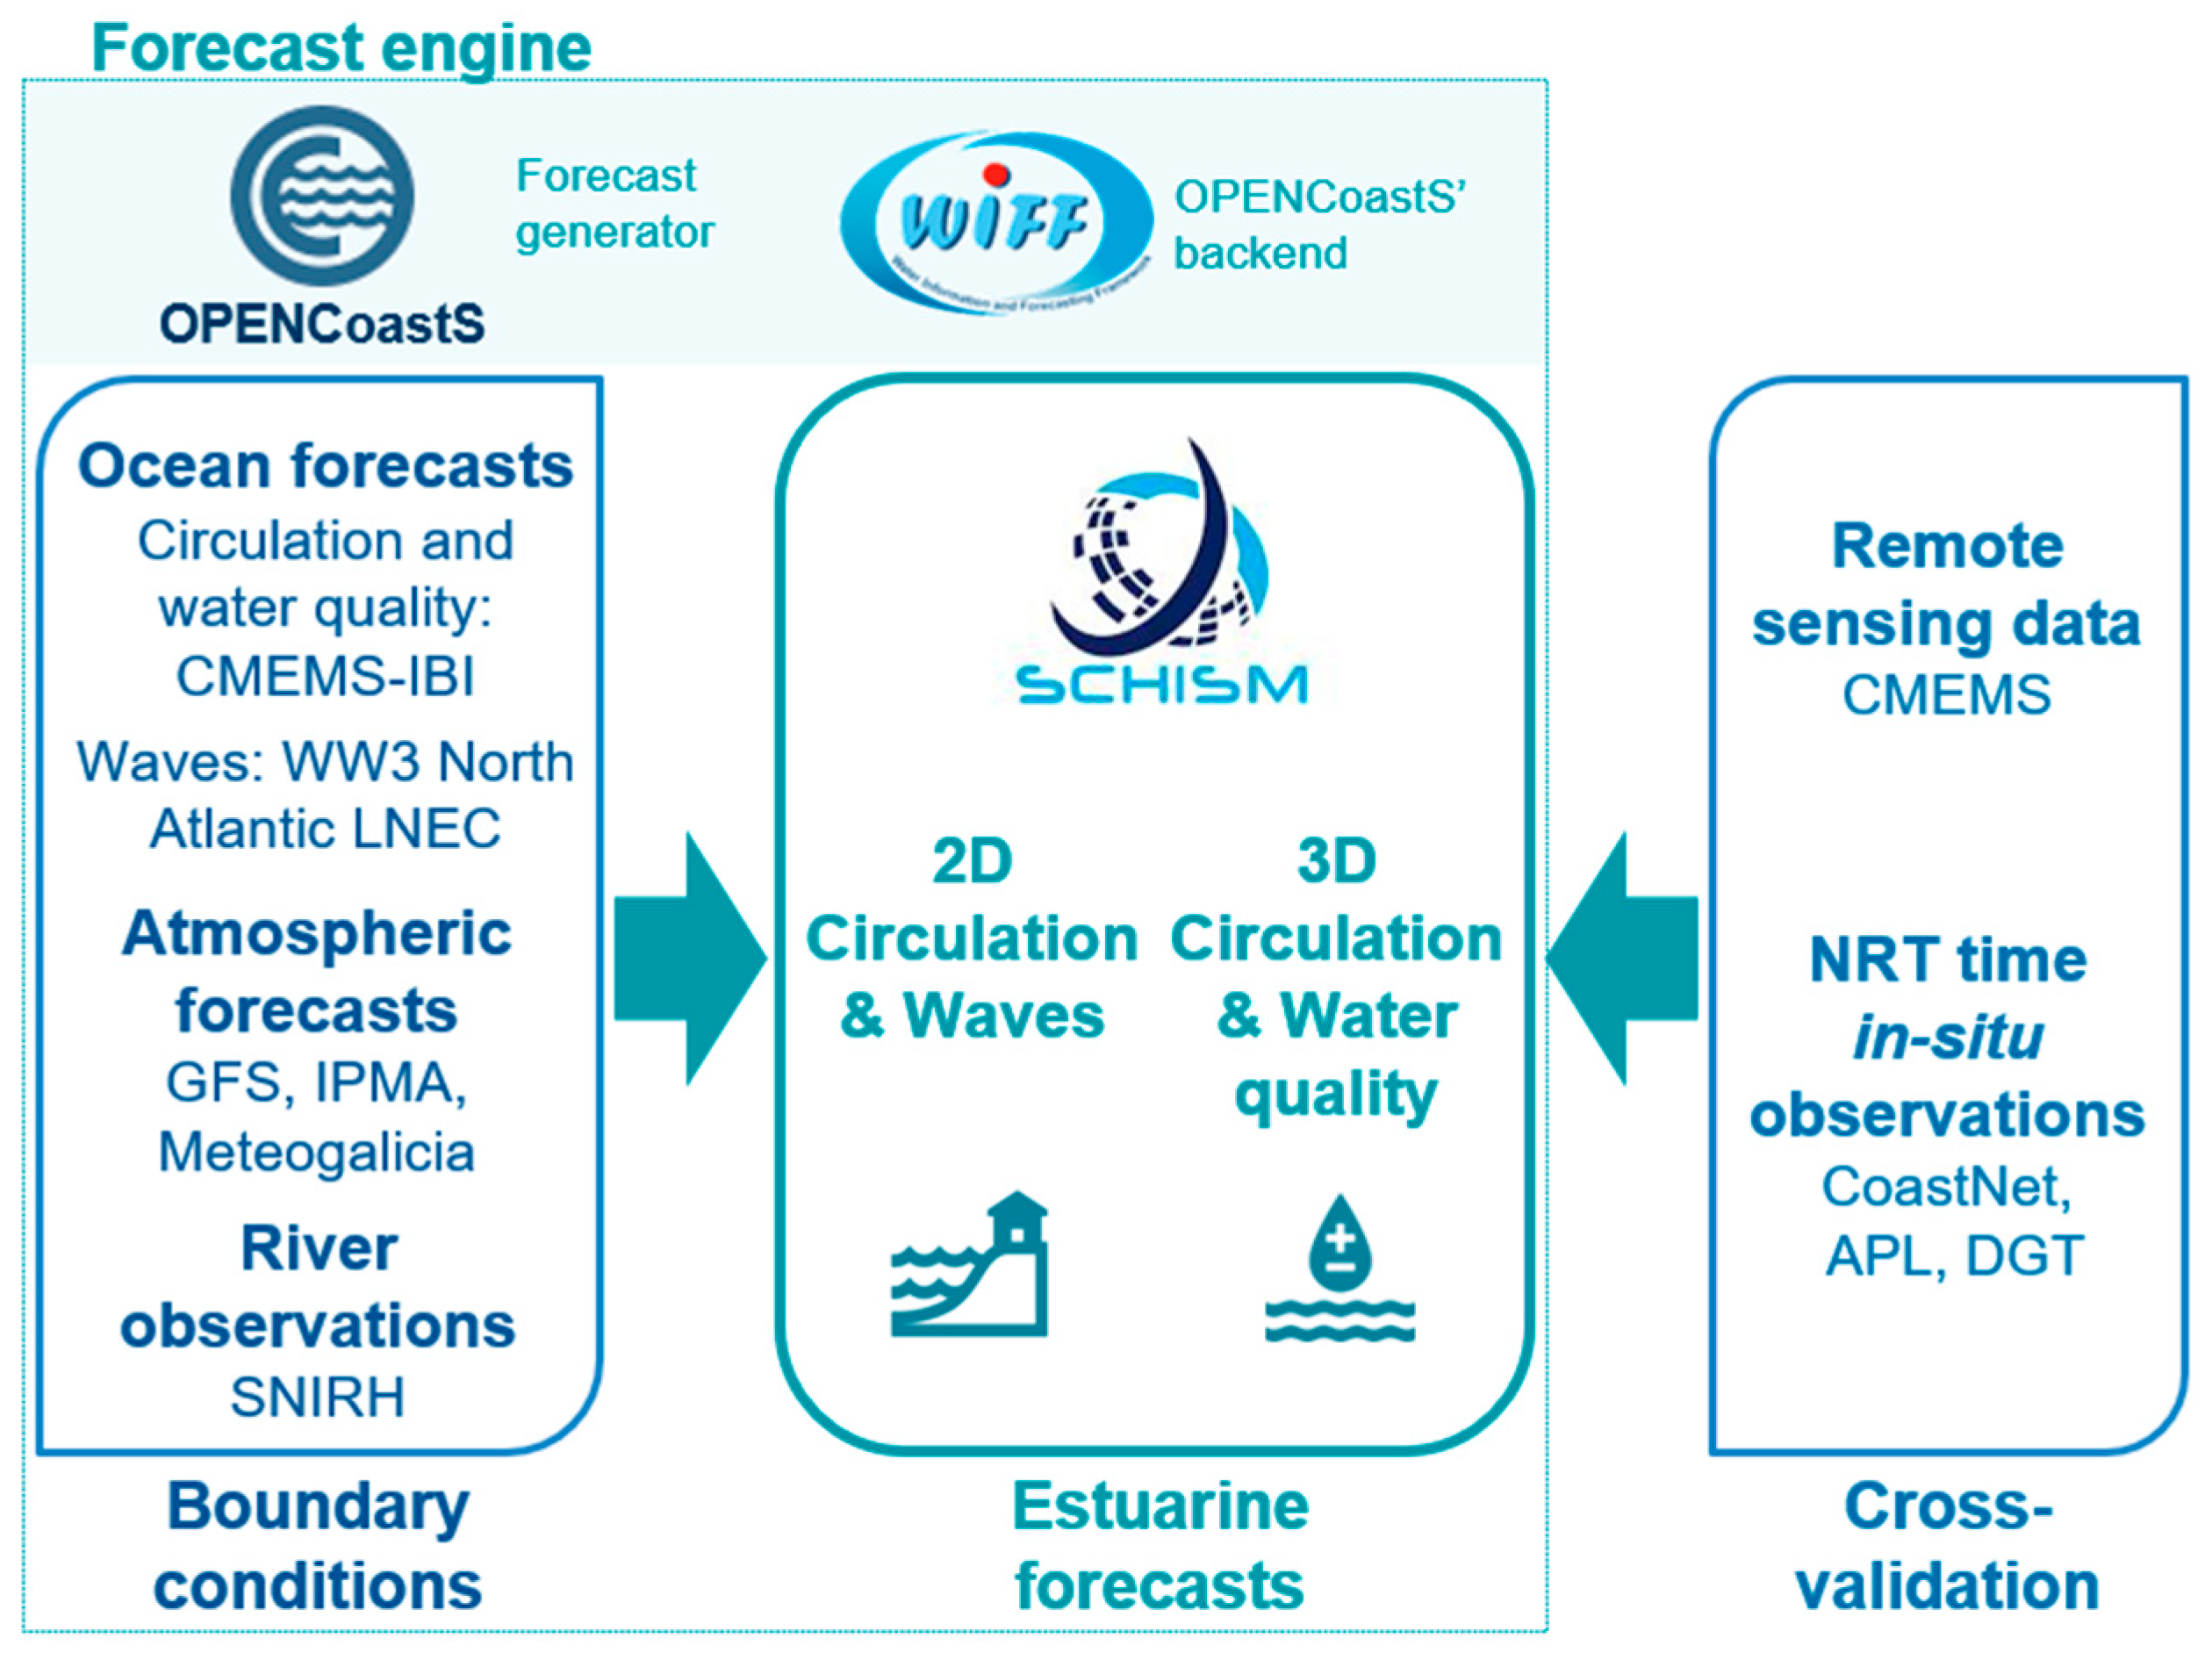
The forecast system (Figure 2) is detailed in the following sections. It was developed and is operated by WIFF—Water Information Forecast Framework [21,31], a software package designed to automatically assemble and launch the necessary procedures for producing predictions. WIFF handles the generic aspects of operating forecast systems, including coupling different solvers, retrieving forcings, and running simulations. For forecasts without a biogeochemical module, such as the 2D Tagus forecast described below, WIFF can be launched by OPENCoastS [34,35], a platform for generating on-demand forecast systems. OPENCoastS’s front-end guides the user in developing a forecast system, which is then managed by its backend, WIFF. The forecasts are driven by predictions from regional-scale models at the surface and ocean boundaries, and by NRT observations and climatology at the river boundaries. Forecasts are produced daily for the next two days and with hourly outputs. Both remote and in situ data are used for continuous model validation. The forecast system of the Tagus estuary is one of the components of the CONNECT coastal service (https://connect-portal.lnec.pt/connect/, accessed on 21 August 2025), which provides circulation and water quality information on Portuguese coastal areas to support decision-making.
Forecasts are automatically produced from WIFF with the SCHISM (Semi-implicit Cross-scale Hydroscience Integrated System Model) modeling suite [78]. SCHISM is an open-source, fully parallelized, unstructured grid model designed for seamless simulation of 3D processes across river–estuary–ocean scales. Optional modules for surface waves [79] and biogeochemistry [80,81] are used to simulate inundation and water quality in the 2D and 3D forecasts, respectively. The biogeochemical module is fully coupled to the hydrodynamic model and was extended from EcoSim 2.0 [82] to simulate zooplankton and the oxygen cycle (both adapted from [83]). The model includes the carbon, nitrogen, phosphorus, silica, and oxygen cycles in the present application to the Tagus estuary.
Two complementary forecasts were implemented for the Tagus estuary: (i) a 2D depth-averaged barotropic simulation, including waves and their interactions with the flow, in a domain that includes extensive areas that can potentially be flooded during extreme events; and (ii) a 3D baroclinic simulation, including salt and temperature dynamics, as well as nutrient dynamics. For an efficient and fast availability of predictions and an optimized use of computational resources, the 3D simulation does not include waves, and its domain excludes areas that are above the Highest Astronomical Tide line or protected by dykes. Further details about the forecasting engine and the numerical model implementation in the Tagus estuary are described below.

2.2.2. Numerical Models Setup

2D Barotropic Model with Wave–Current Interactions for Inundation Prediction
The model domain extends from the river to the sea (Figure 3A). Upstream, it reaches the area of Santarém along the Tagus River, far beyond the salinity intrusion limit. Two smaller rivers, the Sorraia and the Trancão, are also partially represented, as well as a channel that connects the Tagus and the Sorraia rivers, known as the Risco River. In the upper estuary, the domain includes extensive areas that are above the Highest Astronomical Tide line but can potentially be inundated during extreme weather events. Most of these areas are in the Vila Franca de Xira municipality and consist primarily of agricultural lands. On the ocean side, the domain extends about 28 km into the sea, reaching the head of the Lisbon canyon.
The domain is discretized with a finite element grid, composed of about 175,000 nodes and 339,000 triangular elements. The grid resolution varies from about 2 m to 1800 m. In the very extensive areas that are protected by dykes, a row of nodes was placed along the crest of the dykes to optimize the representation of the bathymetry.
Ocean boundary conditions for water levels and velocities are downscaled from the CMEMS-IBI regional model (Figure 2), namely the Atlantic-Iberian Biscay Irish-Ocean Physics Analysis and Forecast. Water levels are imposed at 15-min intervals, while depth-averaged velocities are imposed at hourly intervals. Waves at the ocean boundary are taken from an in-house implementation of WaveWatch III to the North Atlantic Ocean [35] (Figure 2). The local wind and the atmospheric pressure were taken originally from the forecasts of MeteoGalicia (until early May 2024, https://www.meteogalicia.gal/, accessed on 21 August 2025) and then from the forecasts of the Instituto Português do Mar e da Atmosfera (https://www.ipma.pt/, accessed on 21 August 2025) (Figure 2). Global wind forecasts from the American National Ocean and Atmospheric Administration (https://www.noaa.gov/, accessed on 21 August 2025) are also used to force wave forecasts in the North Atlantic Ocean, which are used to provide boundary conditions for the local wave module.
Daily river discharges from the Tagus are extrapolated from NRT observations taken from the Serviço Nacional de Informação de Recursos Hídricos (SNIRH, www.snirh.pt, accessed on 21 August 2025) at the hydrometric station of Almourol. Due to the lack of NRT observations in the Sorraia and the Trancão rivers, the same data were used to estimate the freshwater inflow in these rivers as percentages of the Tagus inflow (5% and 1%, respectively); these percentages were estimated based on an analysis of historical river flow data.
The Manning coefficient was gently ramped up from 0.015 s.m−1/3 in the estuary to 0.05 s.m−1/3 in the river. The time step was set to 60 s. The physical and numerical parameters of the wave model were specified from previous applications [59,84,85], where further details on the model setup, calibration, and validation during energetic events can be found.
3D Baroclinic Model
The 3D model domain extends from the river to the sea (Figure 3B), similarly to the 2D model. The key distinction between the 2D and 3D model domains is that the 3D version excludes the floodable areas of the upper estuary to speed up calculations.
The horizontal domain is discretized with a finite element grid, containing about 84,000 nodes and 159,000 triangular elements (Figure 3B). The grid resolution varies from 5 to 100 m in the estuary to 250 m to 1800 m in the adjacent coastal area. To represent the water column, the vertical grid has 39 SZ levels in the vertical, with 30 S-coordinates levels in the upper 100 m, and 9 Z-coordinates levels between 100 m and 1350 m.
Ocean boundary conditions are downscaled from the CMEMS-IBI regional models, namely the Atlantic-Iberian Biscay Irish-Ocean Physics Analysis and Forecast and the Atlantic-Iberian Biscay Irish-Ocean Biogeochemical Analysis and Forecast. Water levels at the boundary are imposed at 15-min intervals, while velocities, salinities, and temperatures are imposed at hourly intervals. Biogeochemical variables provided by the CMEMS-IBI forecasts (ammonium, nitrate, phosphate, silicate, dissolved oxygen, chlorophyll-a, and phytoplankton) are imposed as daily means. For the remaining biogeochemical variables, the ocean boundary conditions are set using climatological values derived from a literature review for the Tagus estuary and adjacent coastal area, following [31,80,81].
The atmospheric forcing (wind, air temperature, atmospheric pressure, relative humidity, downwelling shortwave radiation, and longwave radiation) are taken from MeteoGalicia forecasts.
The river flow is imposed in a manner similar to the 2D depth-average model. Salinity is set to zero at riverine boundaries. Temperature is imposed as monthly mean values based on historical data from SNIRH measured at the Almourol and Ómnias stations, since water temperature forecasts or NRT measurements are currently unavailable for the Tagus, Sorraia, and Trancão rivers. Similarly, due to the lack of biogeochemical forecasts or NRT data, the concentrations of the biogeochemical variables at the river boundaries were also imposed as monthly mean values based on the data available in SNIRH and a literature review for the Tagus River.
The bottom stress was parameterized using a drag coefficient, based on previous applications of SCHISM in the Tagus estuary and determined from the Manning coefficient adopted for a 2D depth-averaged model application [59]. The time step was set to 30 s. Further details on the model setup can be found in [62].
The 3D baroclinic model of the Tagus estuary, including a coupled hydrodynamic–biogeochemical model, was previously calibrated and extensively validated against data measured under different seasonal conditions [31,35,62,63].

2.3. Operational Models Assessment

The Tagus estuary 2D and 3D models’ operational forecasts are assessed for the period between 1 January and 30 June 2024 by comparison with in situ and satellite observations (Figure 2). In situ data includes the following (see location of the stations on Figure 1): (i) water levels and temperature from the Cascais tidal gauge; (ii) wave data from the Port of Lisbon Authority (APL) buoy; and (iii) salinity, water temperature, dissolved oxygen, and chlorophyll-a data measured in NRT at the CoastNet monitoring network [86,87,88]. Satellite-derived sea surface temperature from CMEMS Global Ocean OSTIA Sea Surface Temperature and Sea Ice Analysis product [89,90,91], with 0.05° × 0.05° horizontal resolution and daily temporal resolution, was also used to assess the model performance, particularly regarding the spatial and monthly variations. An intercomparison between the SCHISM-Tagus 2D and 3D model forecasts’ accuracy and the CMEMS-IBI model forecasts was also performed in the region where the two models overlap.

3. Results and Discussion

3.1. The 2D Barotropic Operational Model

3.1.1. Water Levels Forecasts

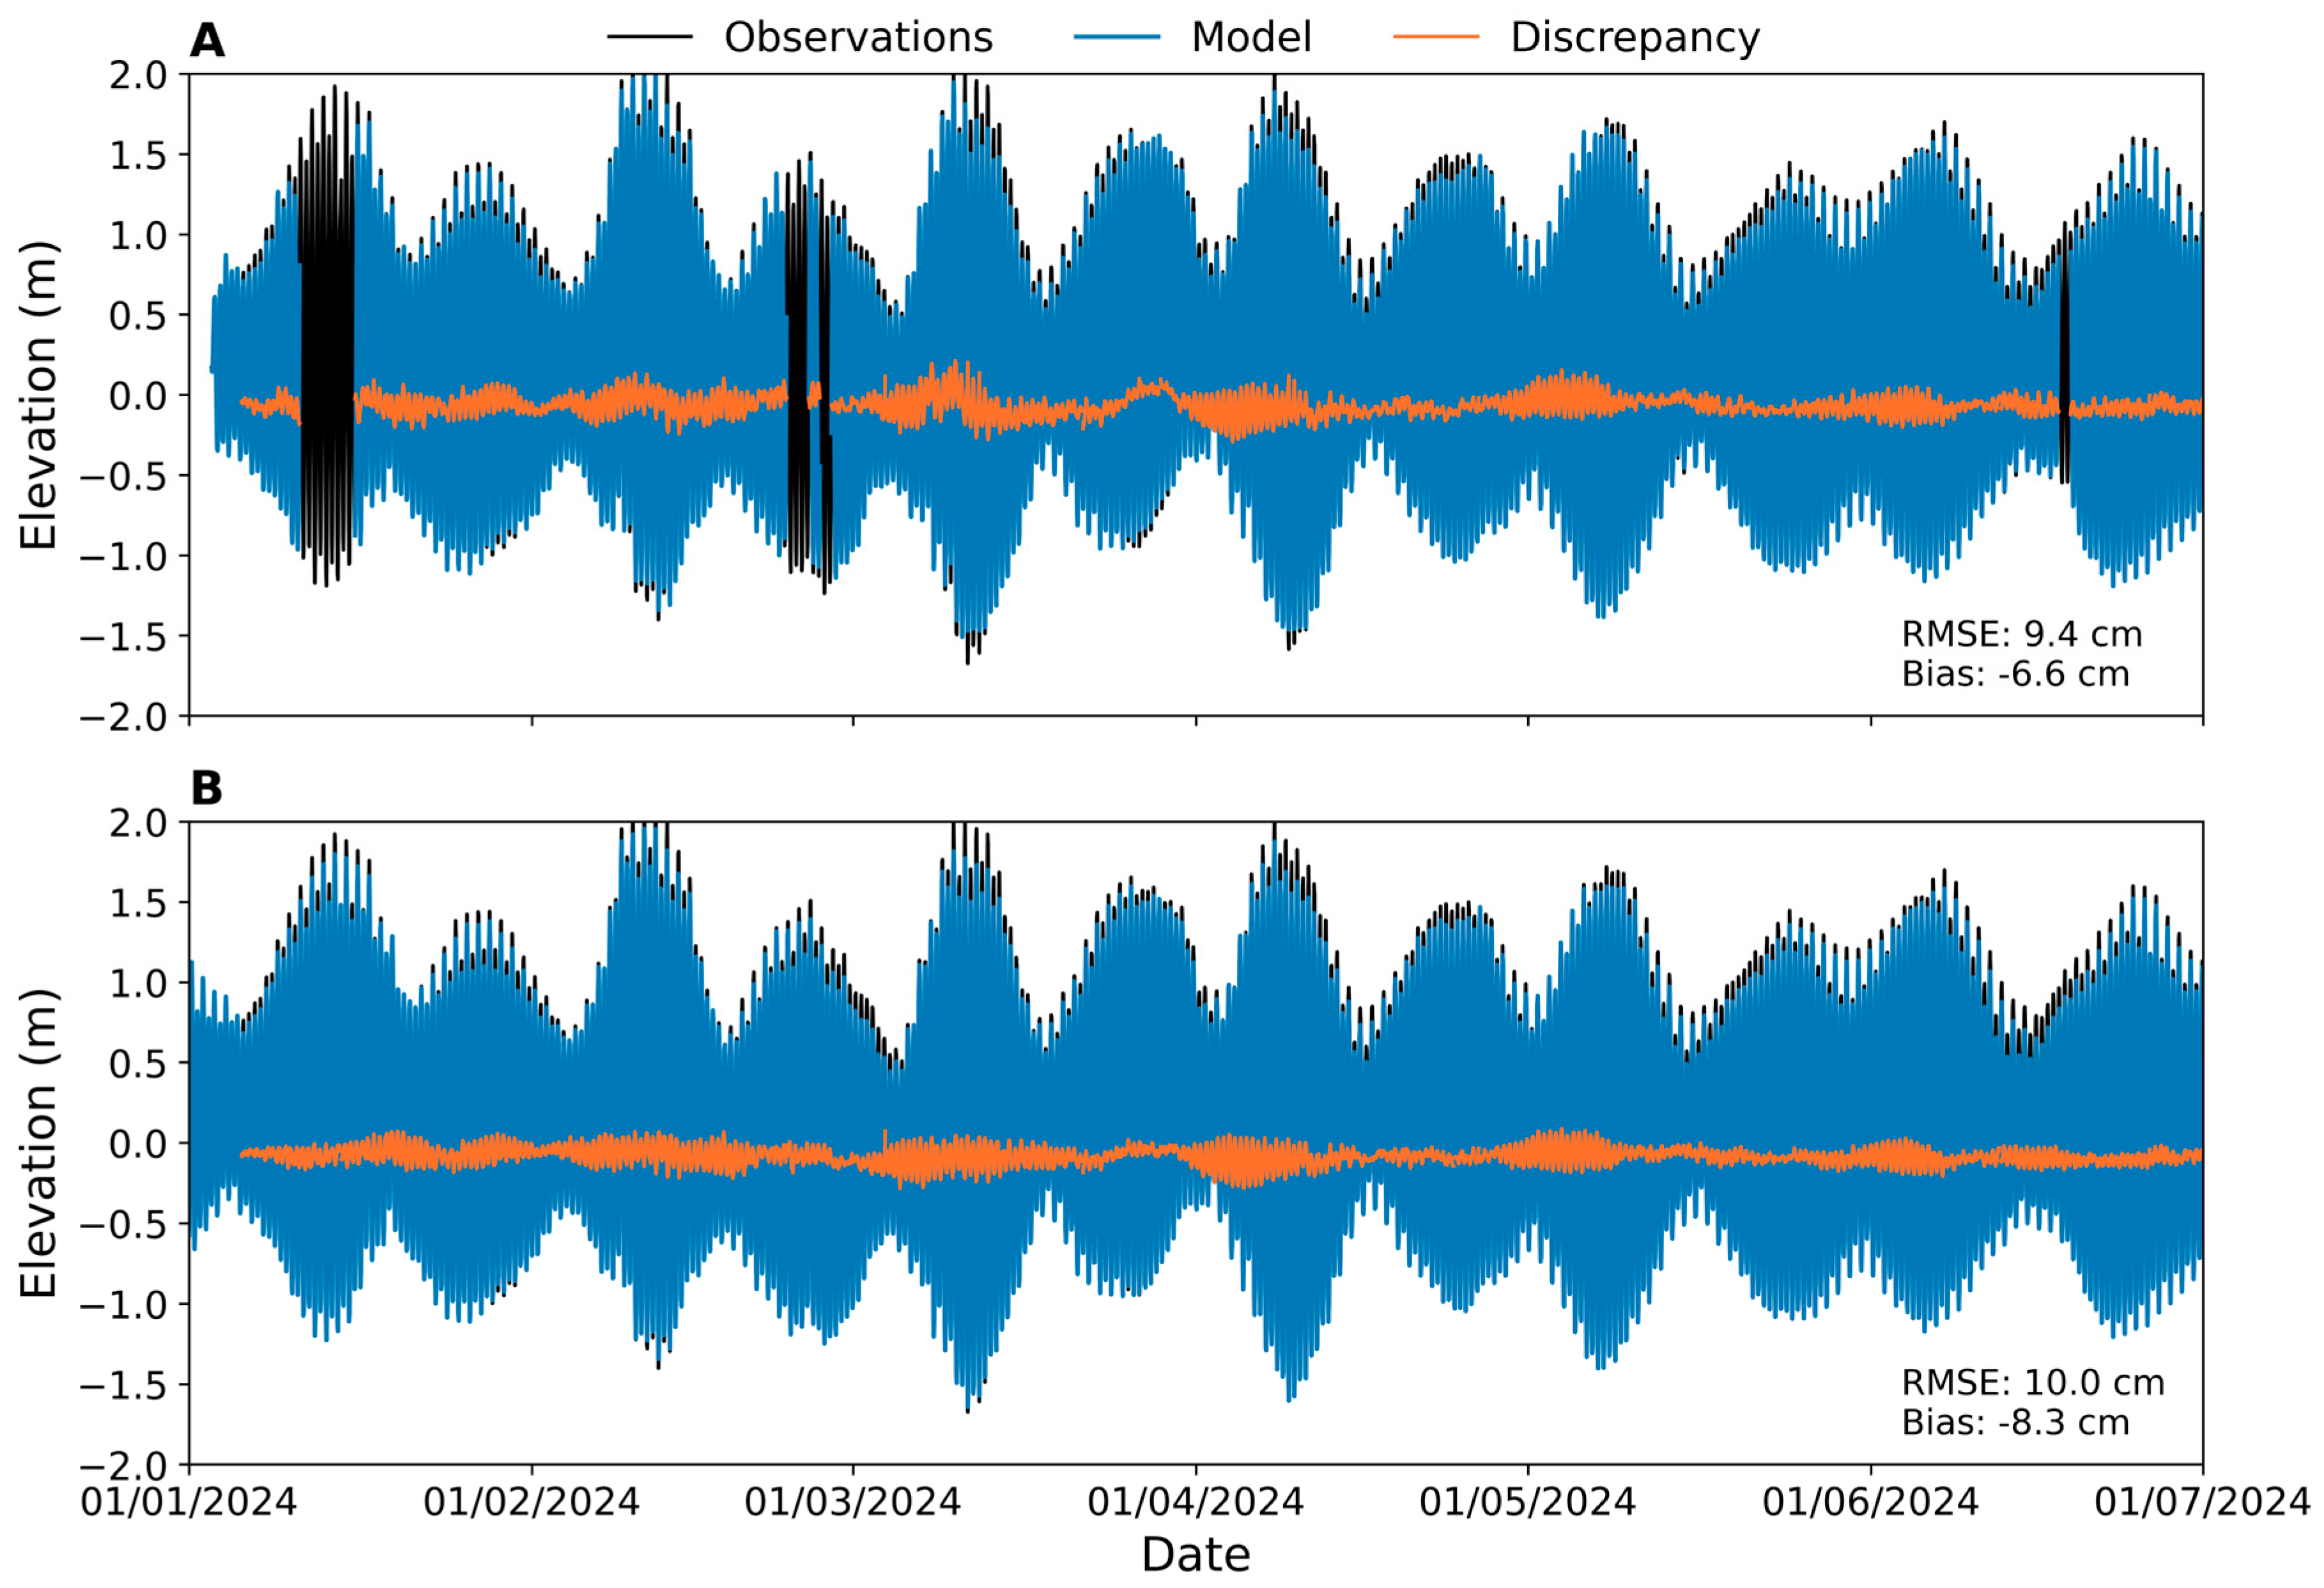
Water levels were assessed at Cascais (Figure 4). Before computing the errors, the time series of observations were filtered with a Butterworth filter to remove the high-frequency signals associated with infragravity waves. Note that the time series of model results from SCHISM is not homogeneous, since the model was updated several times during the period under analysis by improving the grid or the model parameters. Hence, the overall error for the whole period is expected to underestimate the accuracy of the most recent forecast version. Because Cascais is located at the coast, outside the estuary, the local model’s accuracy is also compared with the regional CMEMS-IBI model (Figure 4).
The root mean square (RMS) error for the SCHISM forecasts is 9.4 cm (Figure 4), which is significantly higher than the error obtained for the validation of the model by comparison with data from 1972 at the same station (3.5 cm. This discrepancy is attributed to the fact that the 1972 simulation did not include atmospheric nor wave forcings, and the observed time series had those effects removed by harmonic analysis and synthesis. Indeed, both tidal and non-tidal signals are relevant in the time series of discrepancies (Figure 4).
Errors are expected to originate primarily from the boundary conditions. Indeed, differences between sea surface elevations at the model’s ocean boundary and Cascais are so minor that older models, with a similar ocean boundary, were directly forced using Cascais elevation data (e.g., [46,52]). A comparison between the discrepancies of the 2D SCHISM and CMEMS-IBI models at Cascais confirms this expectation: the correlation coefficient between the discrepancies in the CMEMS-IBI and the 2D SCHISM model (0.86) is very high.
Still, the local model reduces the error relative to the regional model: the RMSE and the bias decrease by 6% (from 10.0 to 9.4 cm) and 20% (from 8.3 to 6.6 cm), respectively (Figure 4). This assessment also suggests that the local model could be improved by correcting the bias of the CMEMS-IBI model. This bias correction could potentially reduce the RMS error of the local model to 6.7 cm, which corresponds to the unbiased root mean square error.
While both the local and the regional models underestimate the sea surface elevation, the absolute value of the bias is smaller for the SCHISM simulations. This observation suggests that the lack of wave-induced setup explains part of the bias in the regional model.

3.1.2. Wave Forecasts

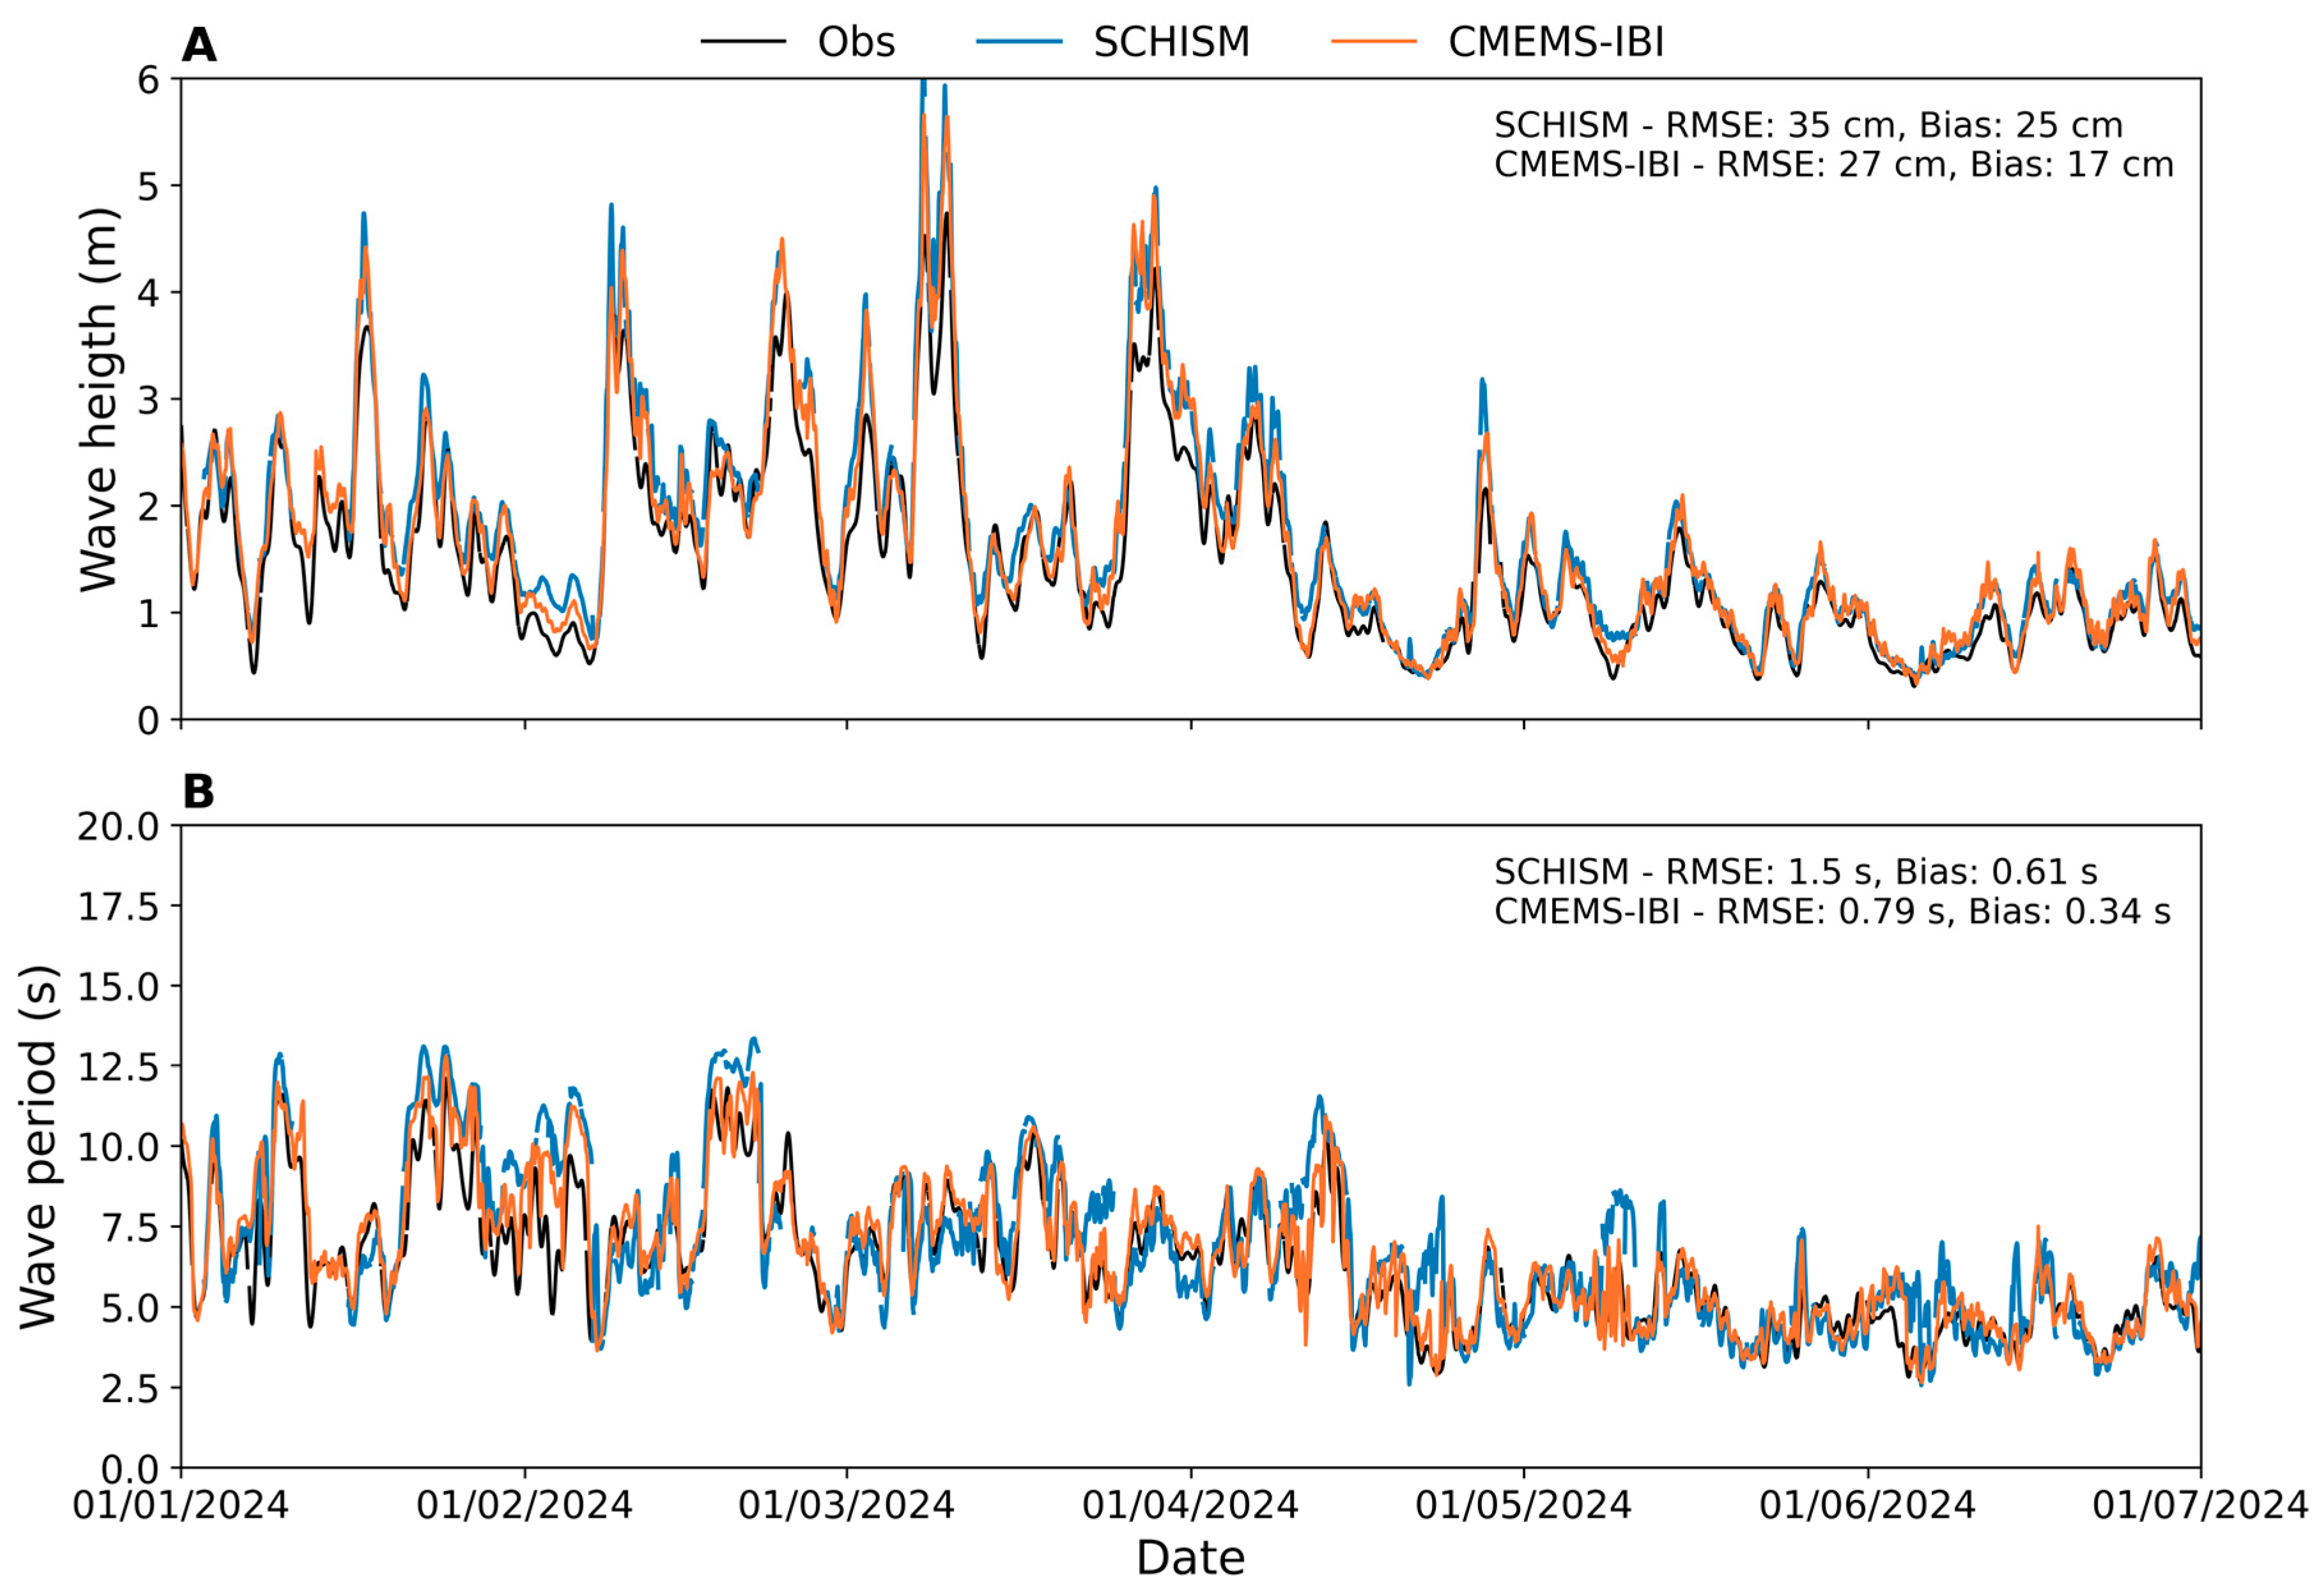
The wave forecasts were validated against observations from the APL buoy. The observations were filtered with a Butterworth filter before computing the errors. Both the significant wave height (Hs) and the mean period (TM02) were reproduced with acceptable errors (Figure 5). The Hs and TM02 RMS errors represent 23% and 10% of the mean observed corresponding variables. A similar comparison for the CMEMS-IBI wave model shows that the local forecast is less accurate than the regional model (Figure 5).
The CMEMS-IBI wave model has a spatial resolution of 0.05° and is enhanced through data assimilation [42]. In contrast, the Tagus estuary 2D model has a higher horizontal resolution and explicitly represents the interactions between waves and tides, but the wave boundary conditions are provided by an application of WaveWatchIII to the North Atlantic on an unstructured grid with resolutions between about 0.1° in the continental shelf and 0.5° in the deep ocean. This WaveWatchIII application does not have data assimilation. Also, the spectra in the IBI model are resolved with 32 frequencies and 32 directions, while the 2D barotropic Tagus estuary operational model and its driving WaveWatchIII model use only 24 frequencies and 24 directions to discretize the spectra. Several reasons can therefore explain the higher accuracy of the CMEMS-IBI wave forecasts. Improving the spectral resolution of 2D barotropic Tagus estuary operational model would probably enhance its accuracy, but at the expense of the computational cost. In addition, improving the boundary conditions would also be important. This could be achieved by either refining the WaveWatchIII spatial and spectral resolution and including data assimilation or downscaling the outputs from the CMEMS-IBI wave model. Accurately downscaling the regional wave model would require using the full wave spectra, which are not publicly available for the CMEMS-IBI wave model forecasts.

3.2. The 3D Baroclinic Model

3.2.1. Water Levels Forecasts

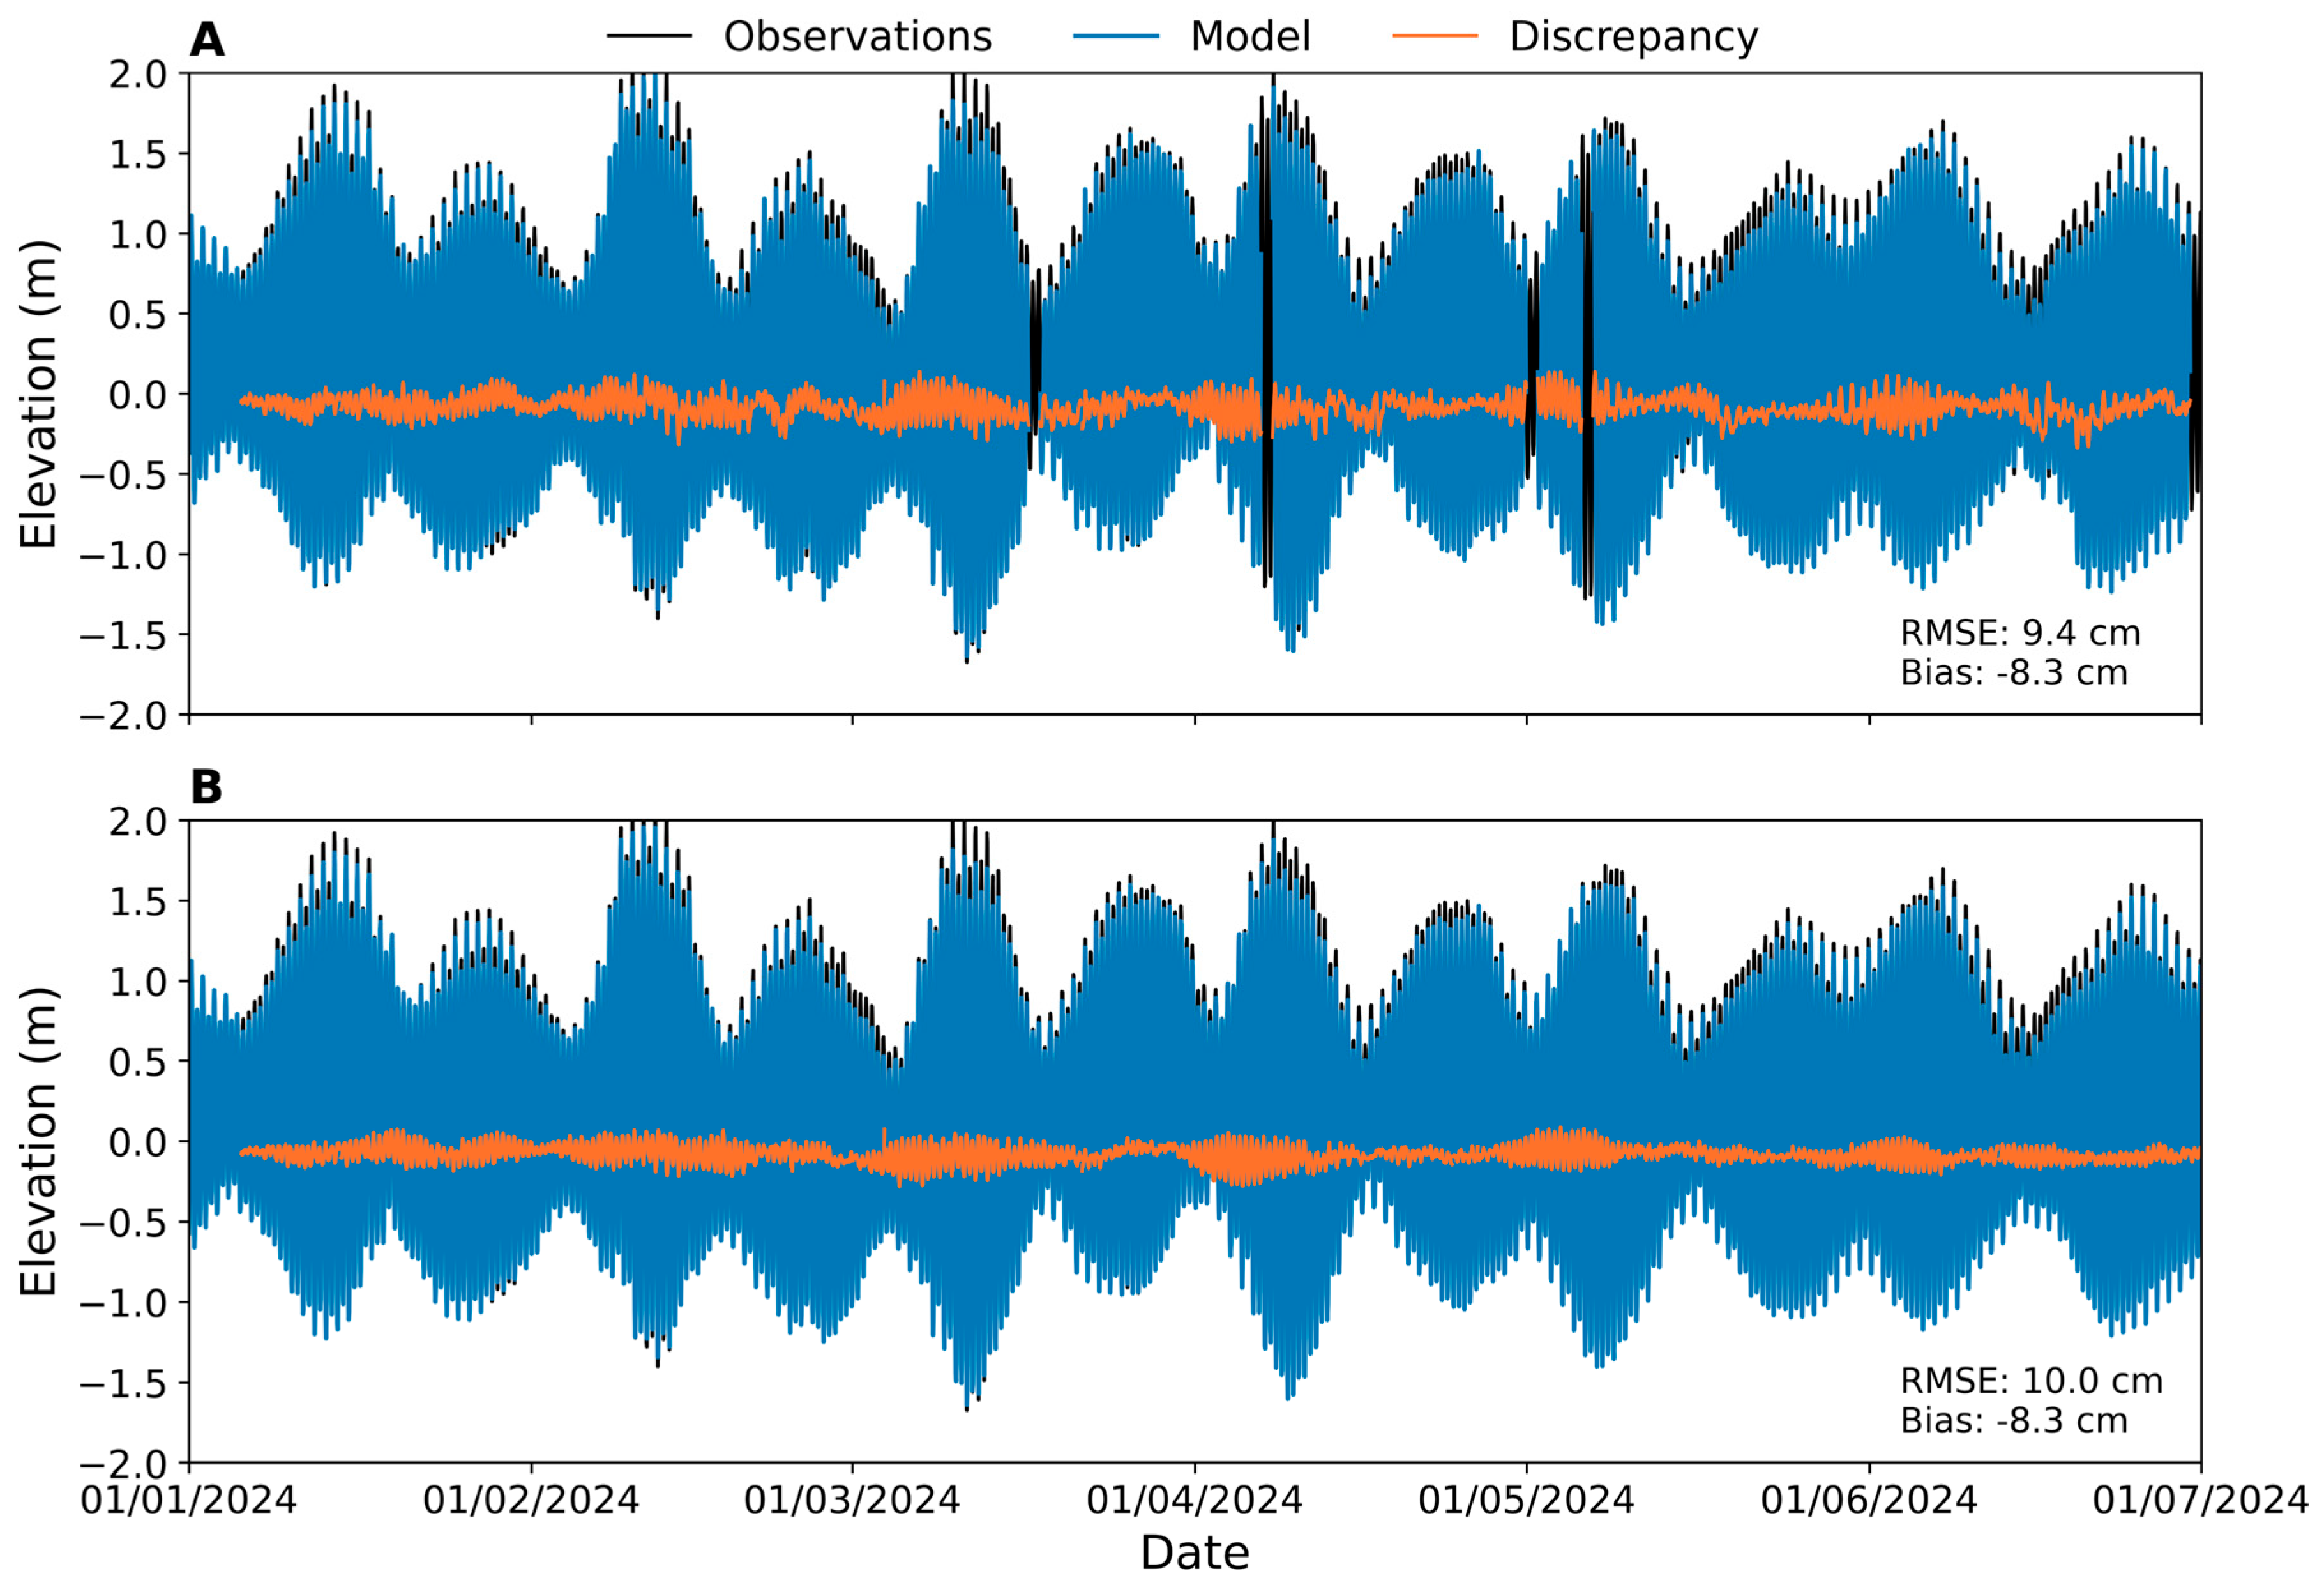
Water levels were assessed at Cascais, similarly to the 2D model and using the same time series of observations. The RMS error for the SCHISM forecasts is 9.4 cm (Figure 6), which is significantly higher than the error obtained for the validation of the model by comparison with data from 1972 at the same station (3.5 cm), but of the same order of magnitude of the error obtained for 2020 data (8.3 cm). As mentioned for the 2D application, this discrepancy is attributed to the fact that the 1972 simulation did not include atmospheric forcing and the observed time series had those effects removed by harmonic analysis and synthesis.
As mentioned for the 2D SCHISM application, errors are expected to originate primarily from the boundary conditions, since the differences between the sea surface elevation at the boundary and Cascais are small. Still, the RMS error at Cascais is slightly smaller in the 3D local model (RMSE = 9.4 cm; Figure 6A) than in the CMEMS-IBI regional model (RMSE = 10.0 cm; Figure 6B).

3.2.2. Salinity and Water Temperature Forecasts

Salinity and water temperature in situ data measured in NRT at the three buoys from the CoastNet monitoring network and satellite-derived sea surface temperature data were used to assess the operational SCHISM 3D baroclinic model.
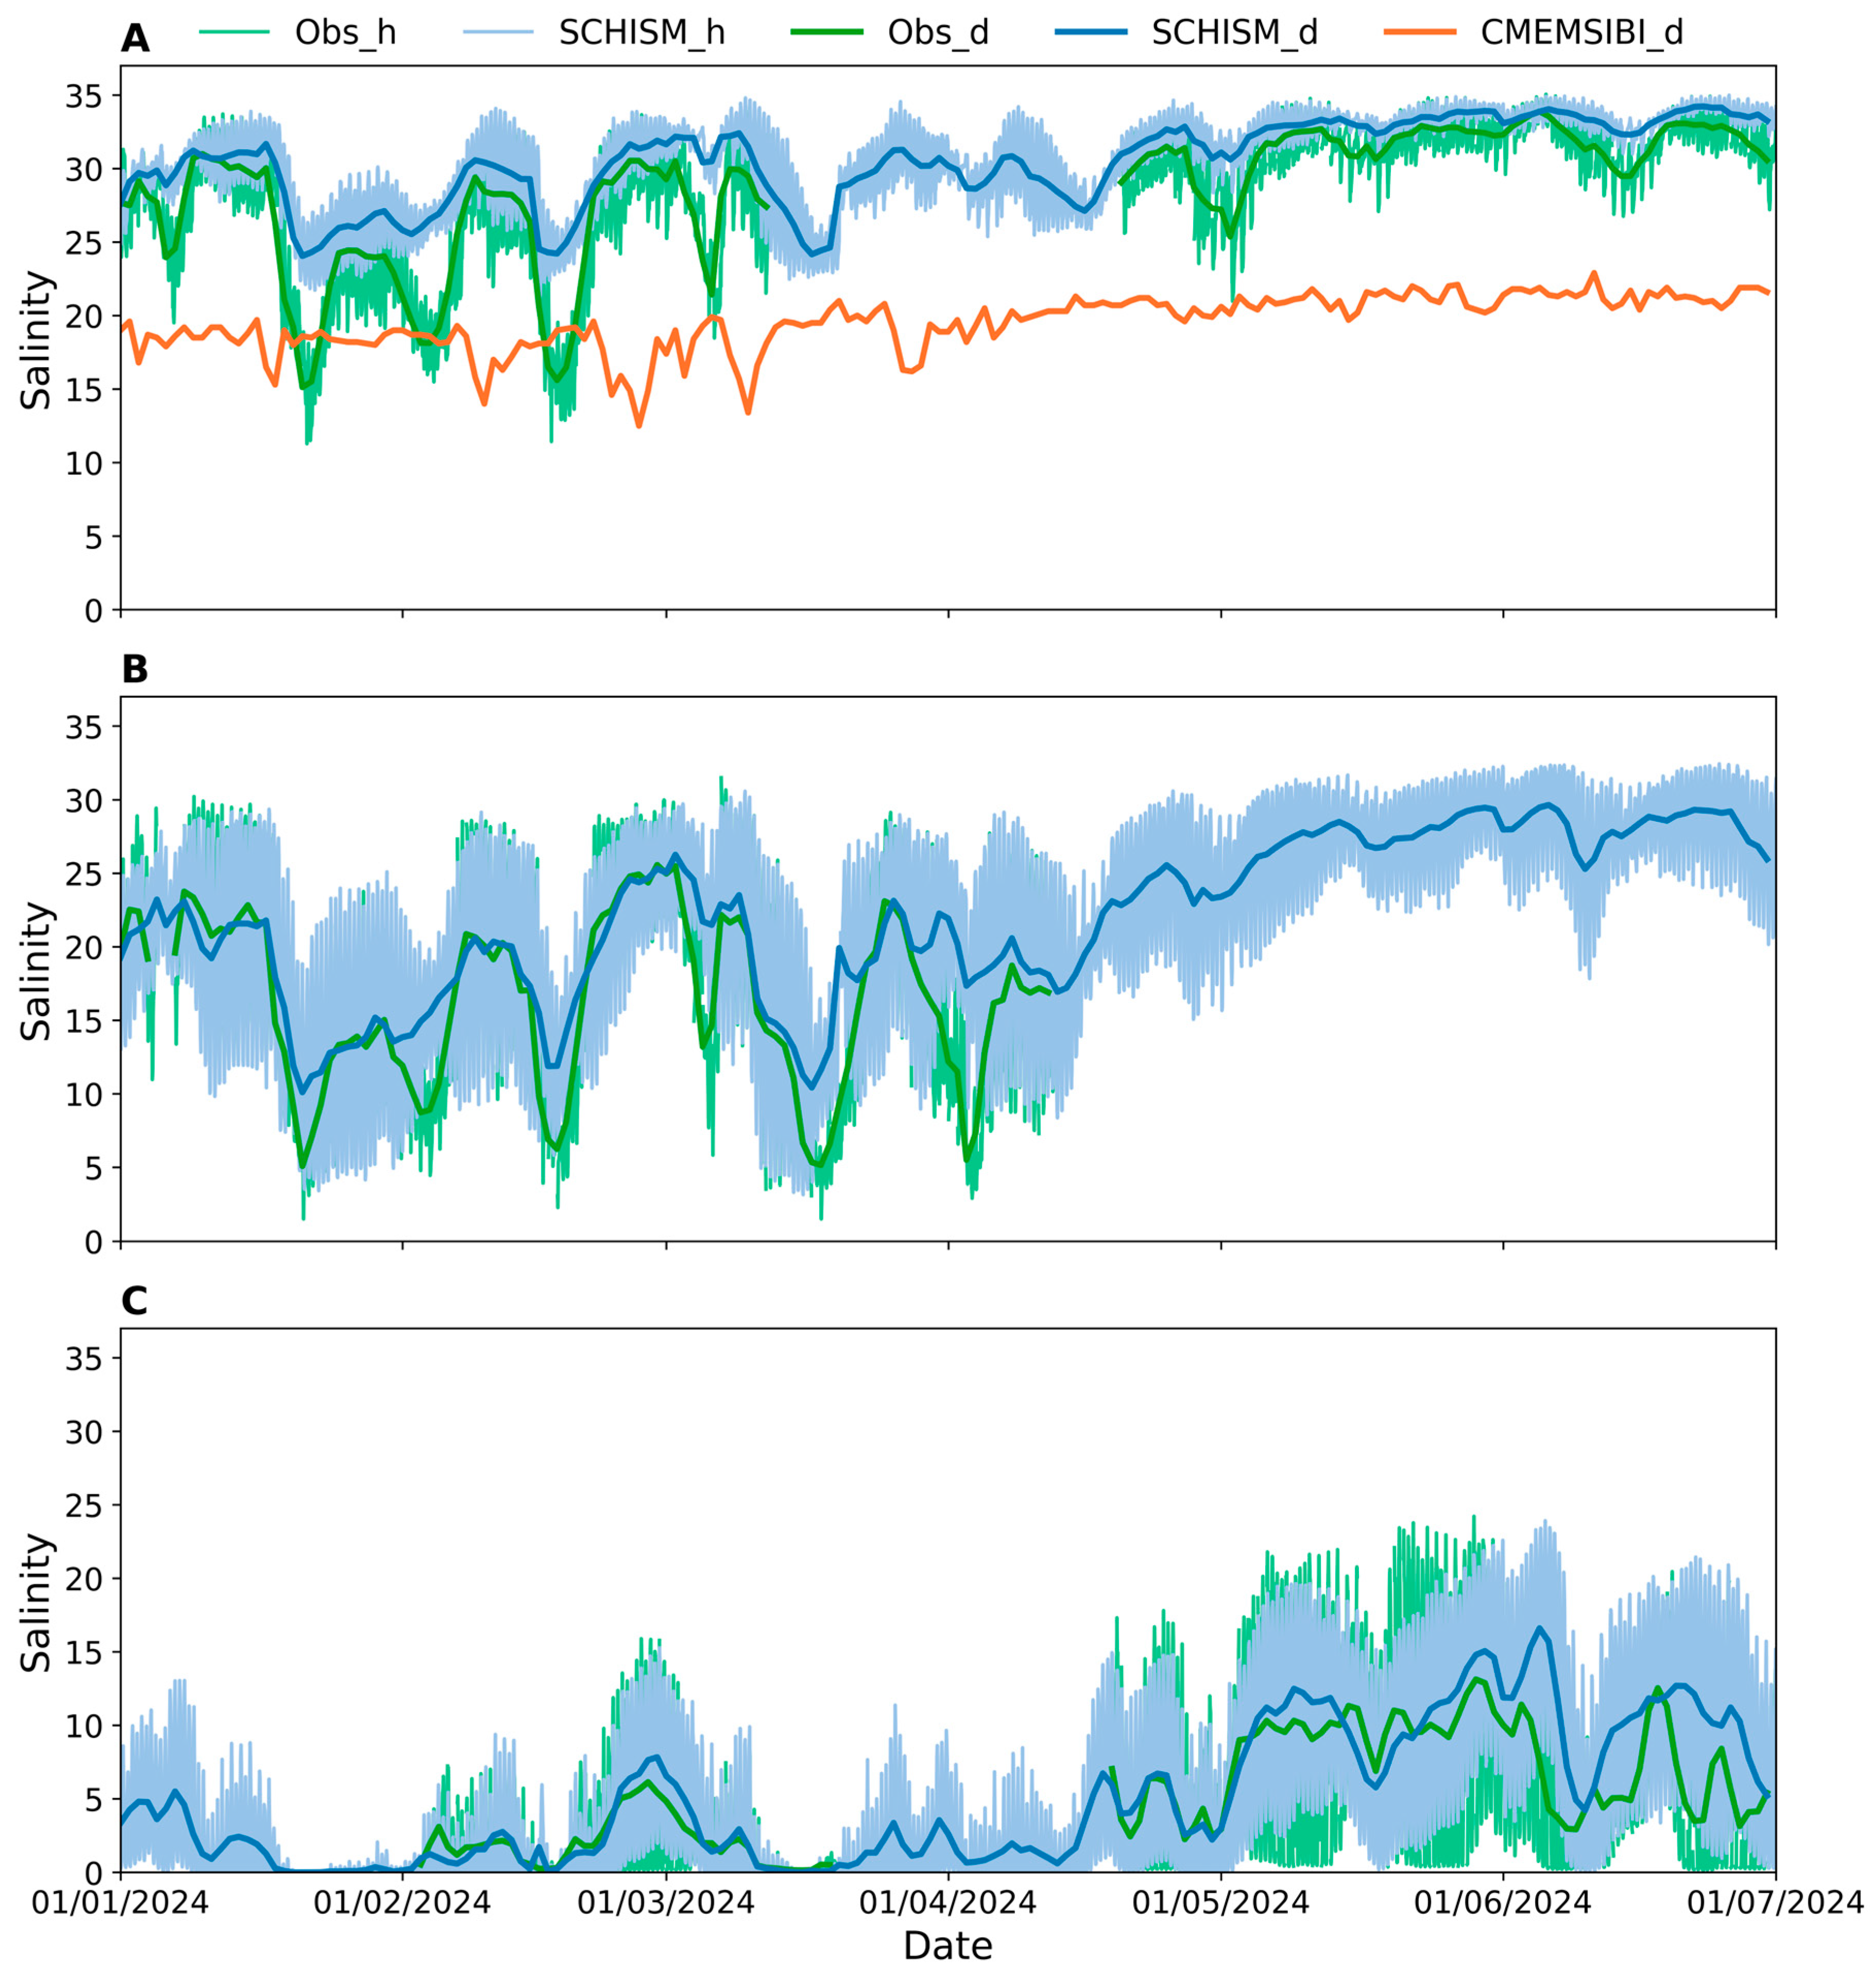
Model–data comparisons show that the model represents well the main spatial salinity gradients along the estuary (Figure 7), as observed in previous validations with historical data (e.g., [62]). The model also represents the lower salinity trends observed during wet periods, although it tends to overestimate minimum salinities during some periods, particularly at the downstream and mid-estuary stations. Tidal fluctuations of salinity are accurately represented. The RMS and mean absolute errors of daily mean salinity range between 2.8 and 3.7, and 1.8 and 2.4, respectively (Table 1). There is a good correlation between observations and model results, with R values of 0.93, 0.83, and 0.84 at Buoys 1, 2, and 3, respectively (Table 1).
Several factors may explain the differences observed in minimum salinity values. First, the model omits additional freshwater sources along the estuarine margins, such as pluvial discharges during wet periods and discharges from wastewater treatment plants, which might have local effects [92]. Second, although the ratios between the discharges from the Tagus River and its tributaries were considered constant, these ratios vary seasonally and inter-annually. A climatological analysis of the observations of the Trancão and the Tagus rivers suggests that the ratio between their discharges can sometimes reach 3%, i.e., three times the ratio used in the model, particularly during high-flow periods (winter). Thus, differences between forecasts and observations are expected to be larger during high-flow events. Finally, running the model in forecast mode implies a 24-h delay in the freshwater discharge imposed at the boundaries, which causes a lag in salinity propagation within the estuary when the river discharge fluctuates significantly. For example, this delay is visible at the CoastNet Buoy 3 in early June (Figure 7) when the imposed river flows were increasing sharply (Figure S1).
The comparison of salinity forecast accuracy between the local model and the CMEMS-IBI regional model at the CoastNet Buoy 1 indicates that the local model outperforms the regional model by representing local circulation patterns in more detail (Figure 7). The RMS and the mean absolute salinity errors at Buoy 1 are 3.2 and 2.4, respectively, for the local model, compared to 10.0 and 9.3 for the CMEMS-IBI model (Table 1).
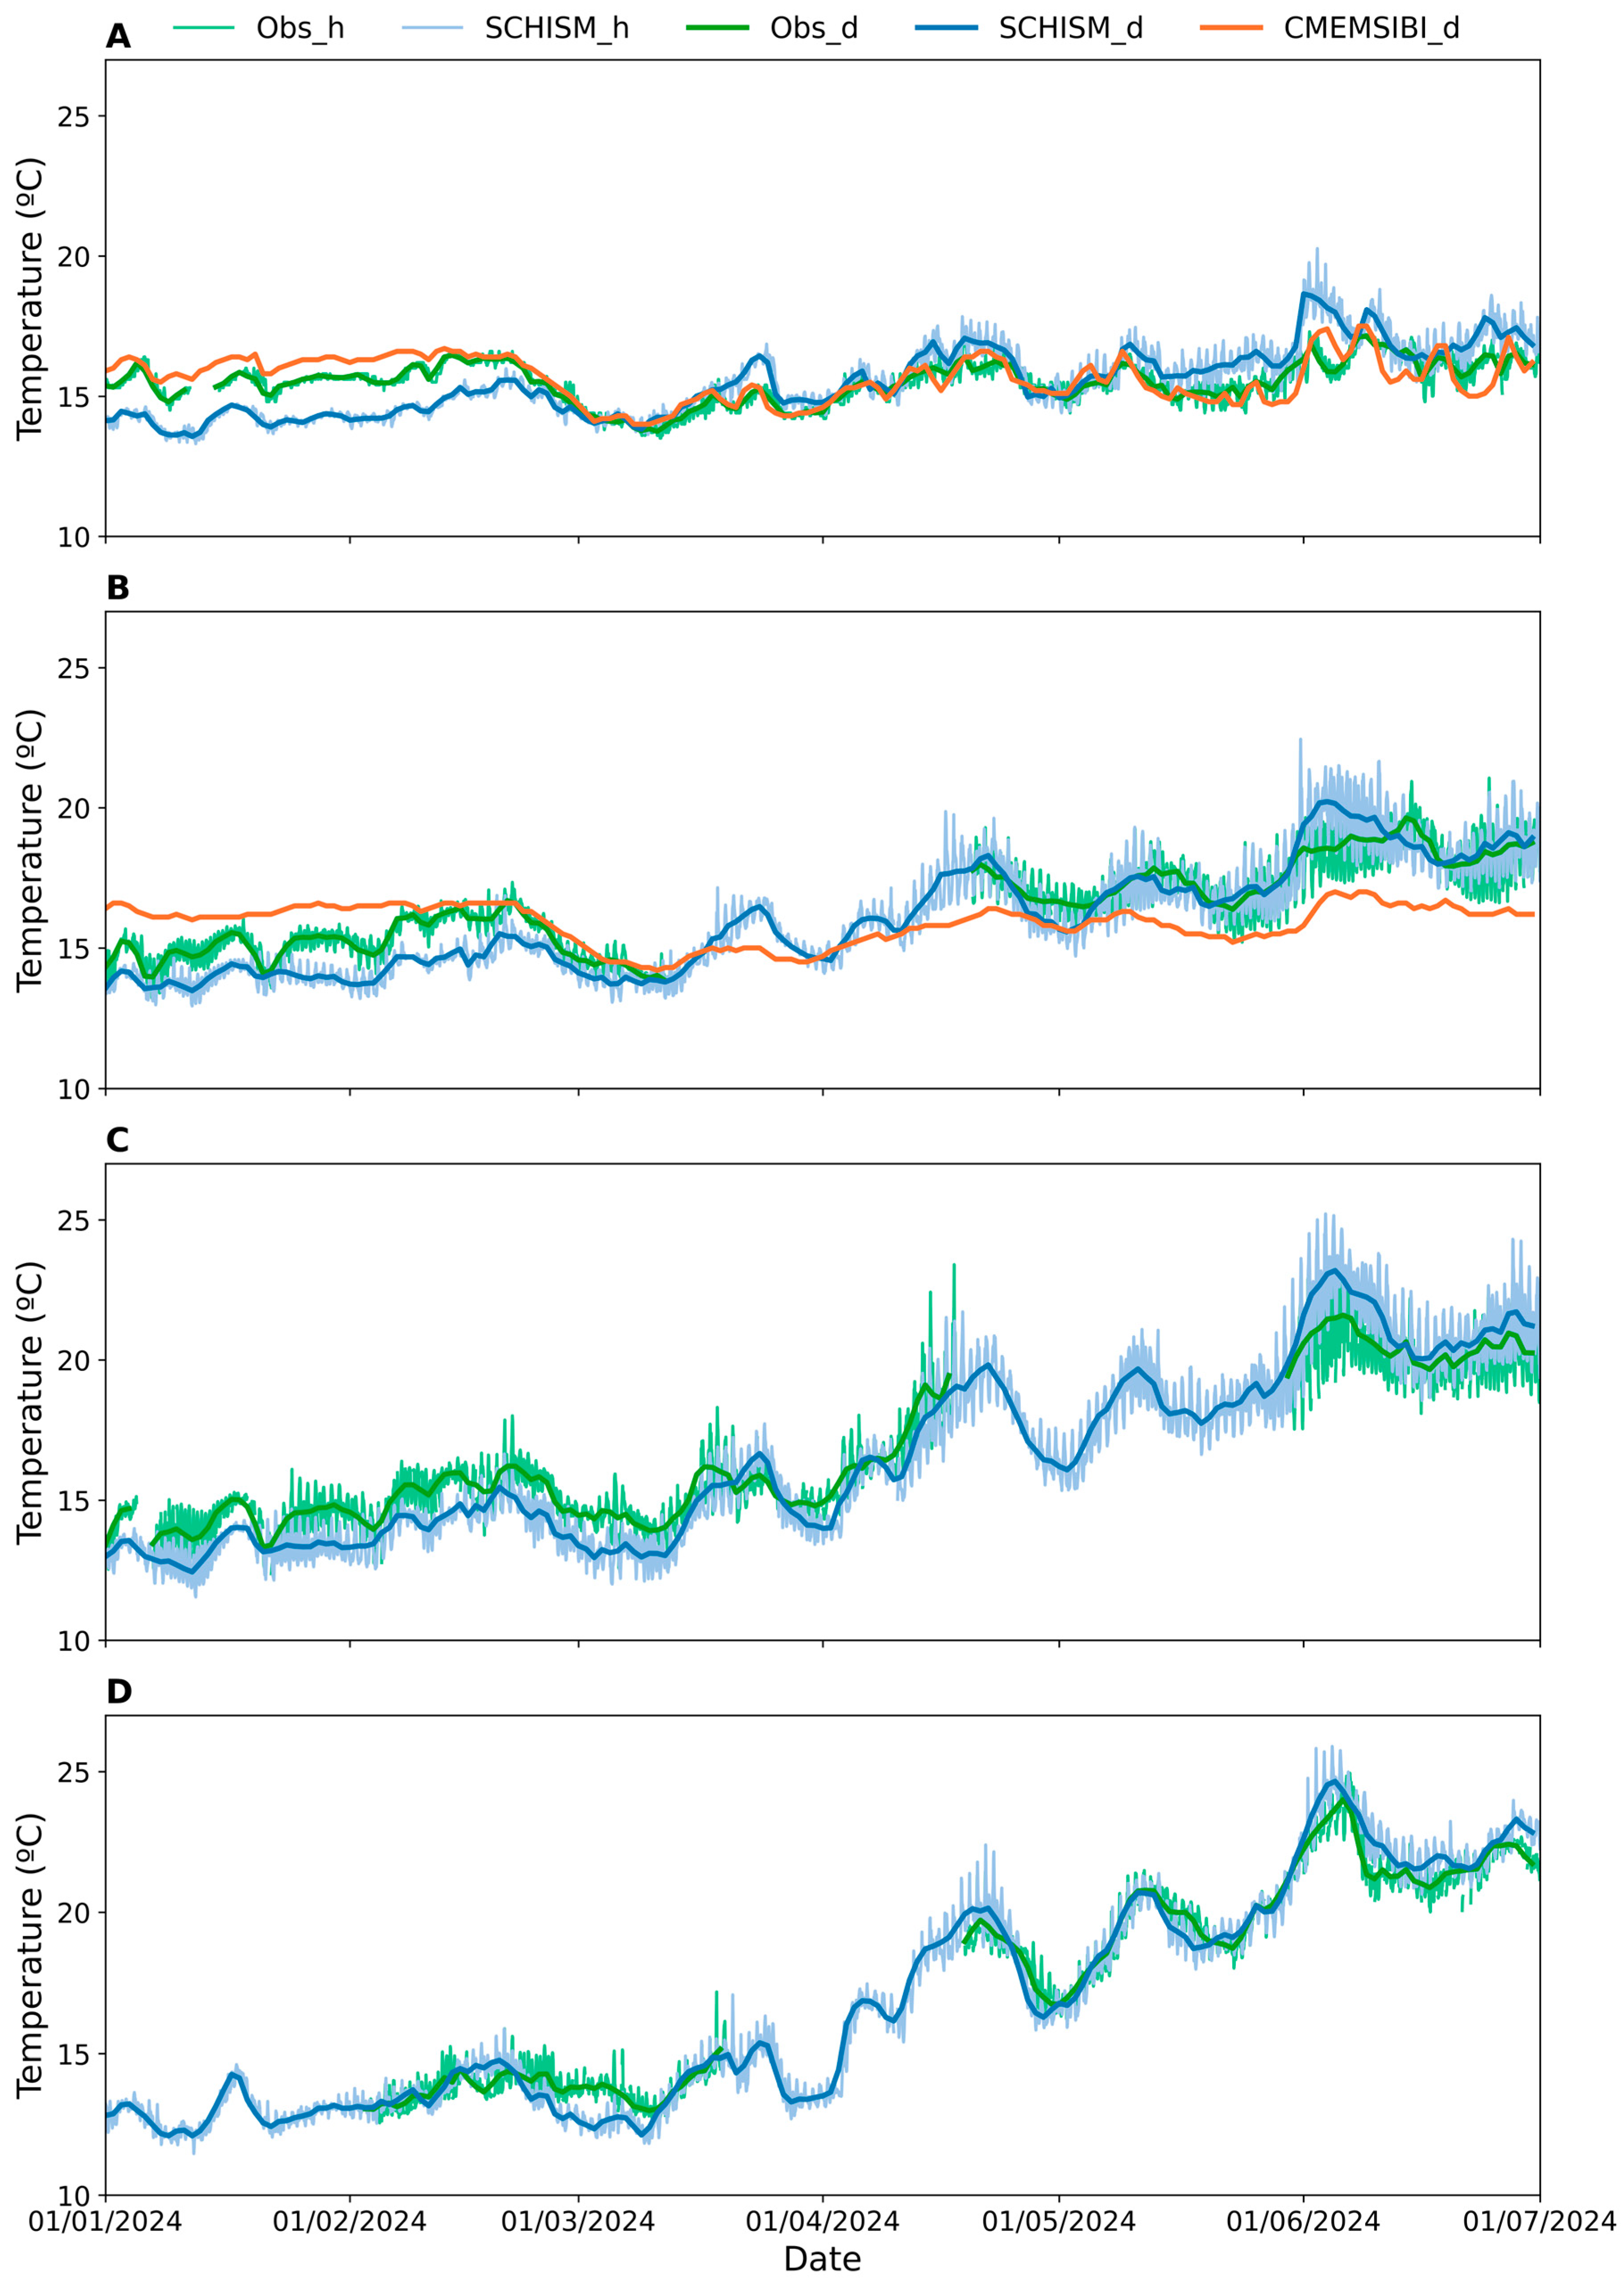
Regarding water temperature, results show that the 3D baroclinic operational model also represents the main spatial and seasonal variability (Figure 8) with errors similar to those observed for the validation with historical data (e.g., [62]), indicating a good agreement between observed and simulated data: the RMS and the mean absolute errors of daily mean temperature range between 0.6 and 1.0 °C, and 0.5 and 0.9 °C (Table 1), respectively. The correlation between observations and model results is also very strong, with R values of 0.96, 0.98, and 0.99 at Buoys 1, 2, and 3, respectively (Table 1).
Forcing the model at the river boundaries with climatology-based temperatures is a notable limitation. However, despite this limitation, the overall estuarine temperature is well represented. The model’s good accuracy is likely due to the relatively small influence of river boundary conditions on temperature within the estuary. First, a sensitivity analysis demonstrated that heat exchange at the surface is the primary control on water temperature in the Tagus estuary [92], which is expected given the estuary’s shallow depth and long residence times [51]. Secondly, tidal velocities in the Tagus estuary exceed river-induced velocities by one to three orders of magnitude [62]. Consequently, the temperature of the estuarine waters is more determined by the ocean than the river. Given that atmospheric forcing is a key driver of water temperature in the Tagus estuary [62], using higher-resolution atmospheric forecasts could improve the temperature predictions.
The comparison of temperature forecast accuracy between the SCHISM 3D local model and CMEMS-IBI regional model suggests that at Cascais the local model has slightly higher errors than the regional model: the RMS and the mean absolute errors are 0.9 °C and 0.8 °C, respectively, for the local model, compared to 0.5 °C and 0.4 °C for the CMEMS-IBI model (Table 1). The differences are higher in winter, when the local model overestimates temperature, and in late spring when the opposite occurs, suggesting a larger influence of the estuarine waters. The better performance of the regional model at this location may be due to the use of NRT in situ and satellite data assimilation by the regional model. Enhancements to the local model, particularly the use of nudging near the ocean boundary, could improve its accuracy in this region. In the estuary the local model performs better than the CMEMS-IBI regional model: the RMS and the mean absolute temperature errors at Buoy CN1 are 0.9 °C and 0.7 °C, respectively, for the local model, compared to 1.5 °C and 1.3 C for the CMEMS-IBI model (Table 1). Comparisons with satellite SST images further confirm that the model adequately represents the seasonal and spatial gradients, especially within the estuary, and performs better than the CMEMS-IBI model in the overlapping estuarine area (Figures S2–S7, Supplementary Material). The comparison between remote and in situ observations also suggests that satellite data is less accurate in the inner estuary than in the ocean. Therefore, using multiple sources of observations to assess operational models is essential to ensure reliability. Additionally, both salinity and temperature assessment results in the estuary suggest advantages in using the local model forecasts as boundary conditions for regional models in a two-way flow of data.

3.2.3. Water Quality Forecasts

Dissolved oxygen and chlorophyll-a data provided in NRT at the three CoastNet buoys were used to assess the operational SCHISM 3D baroclinic model.
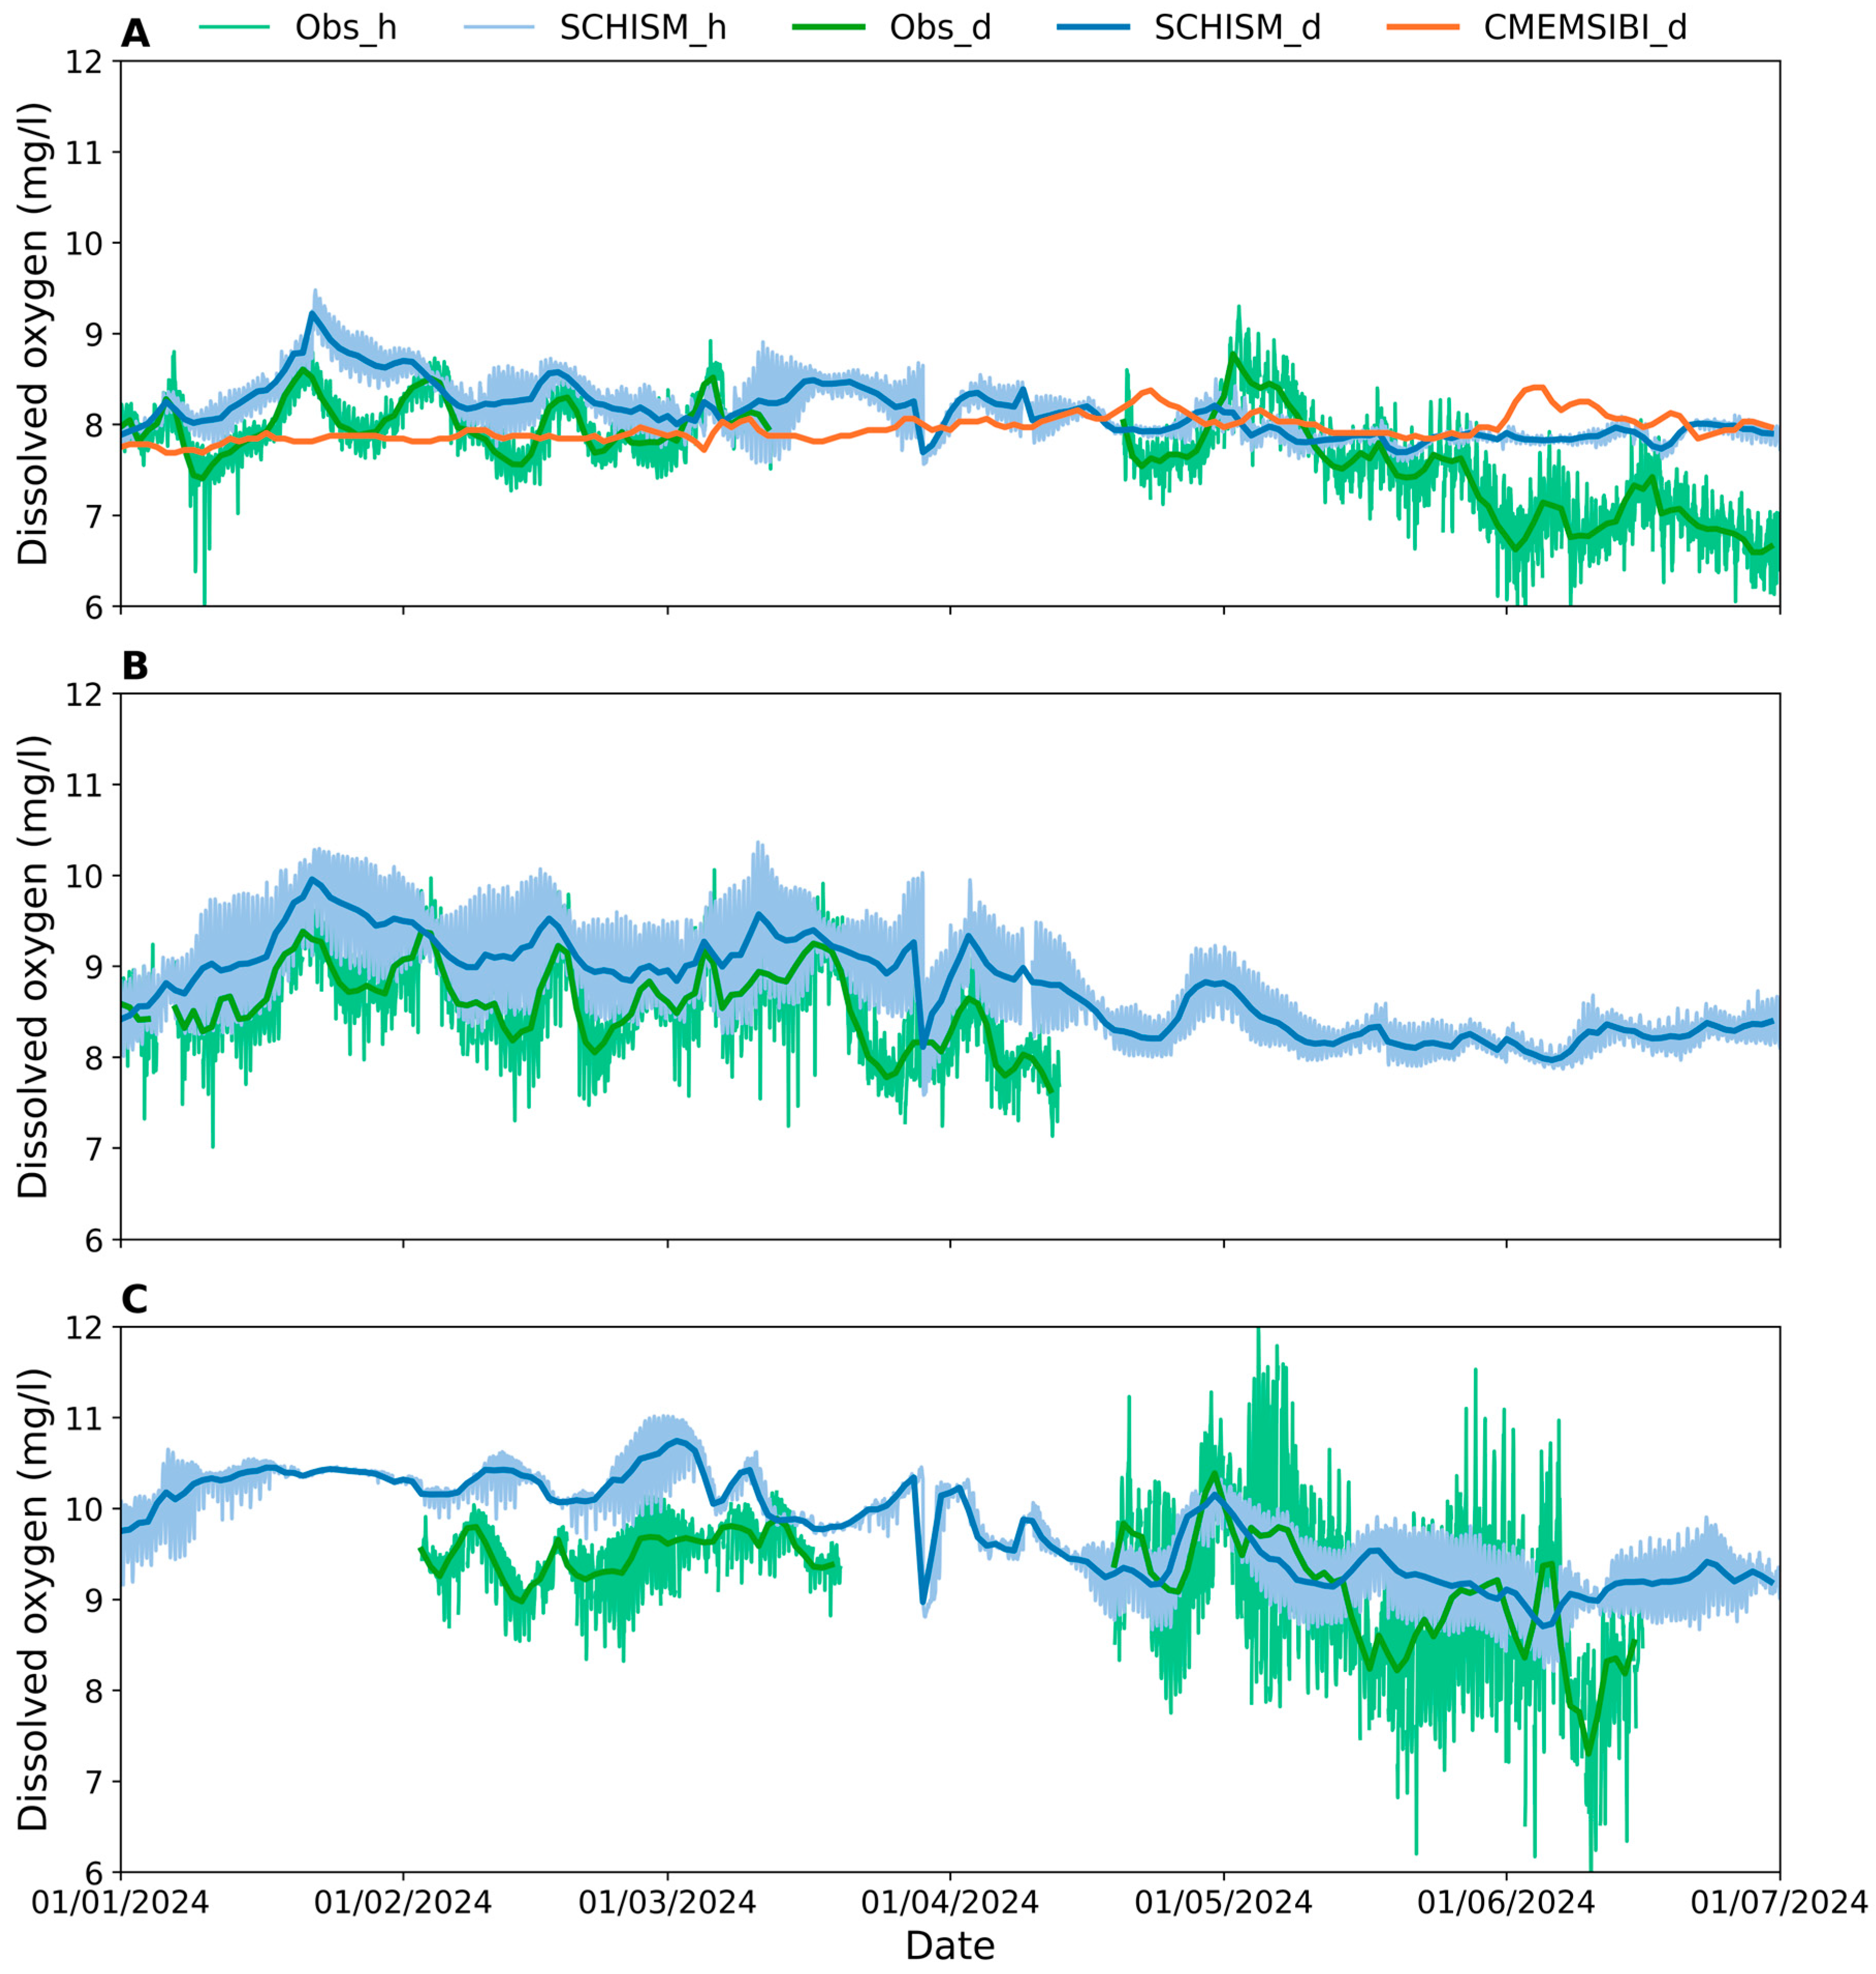
Results show that the 3D operational model represents the main spatial patterns of dissolved oxygen in the Tagus estuary (Figure 9), with higher concentrations upstream. The seasonal variation, with a decrease in dissolved oxygen in spring/summer, is also represented by the model (Figure 9). The mean absolute errors of daily mean dissolved oxygen range from 0.5 to 0.6 mg/L (Table 2). The comparison of dissolved oxygen forecast accuracy between the local model and the CMEMS-IBI regional model at Buoy CN1 suggests that, although the errors of both models are similar (Table 2), the local model tends to represent better the trends and variations. For instance, the observations suggest an increase in dissolved oxygen concentrations in mid-January followed by a decrease in late January that is adequately represented by the local model, while dissolved oxygen is almost constant in CMEMS-IBI (Figure 9).
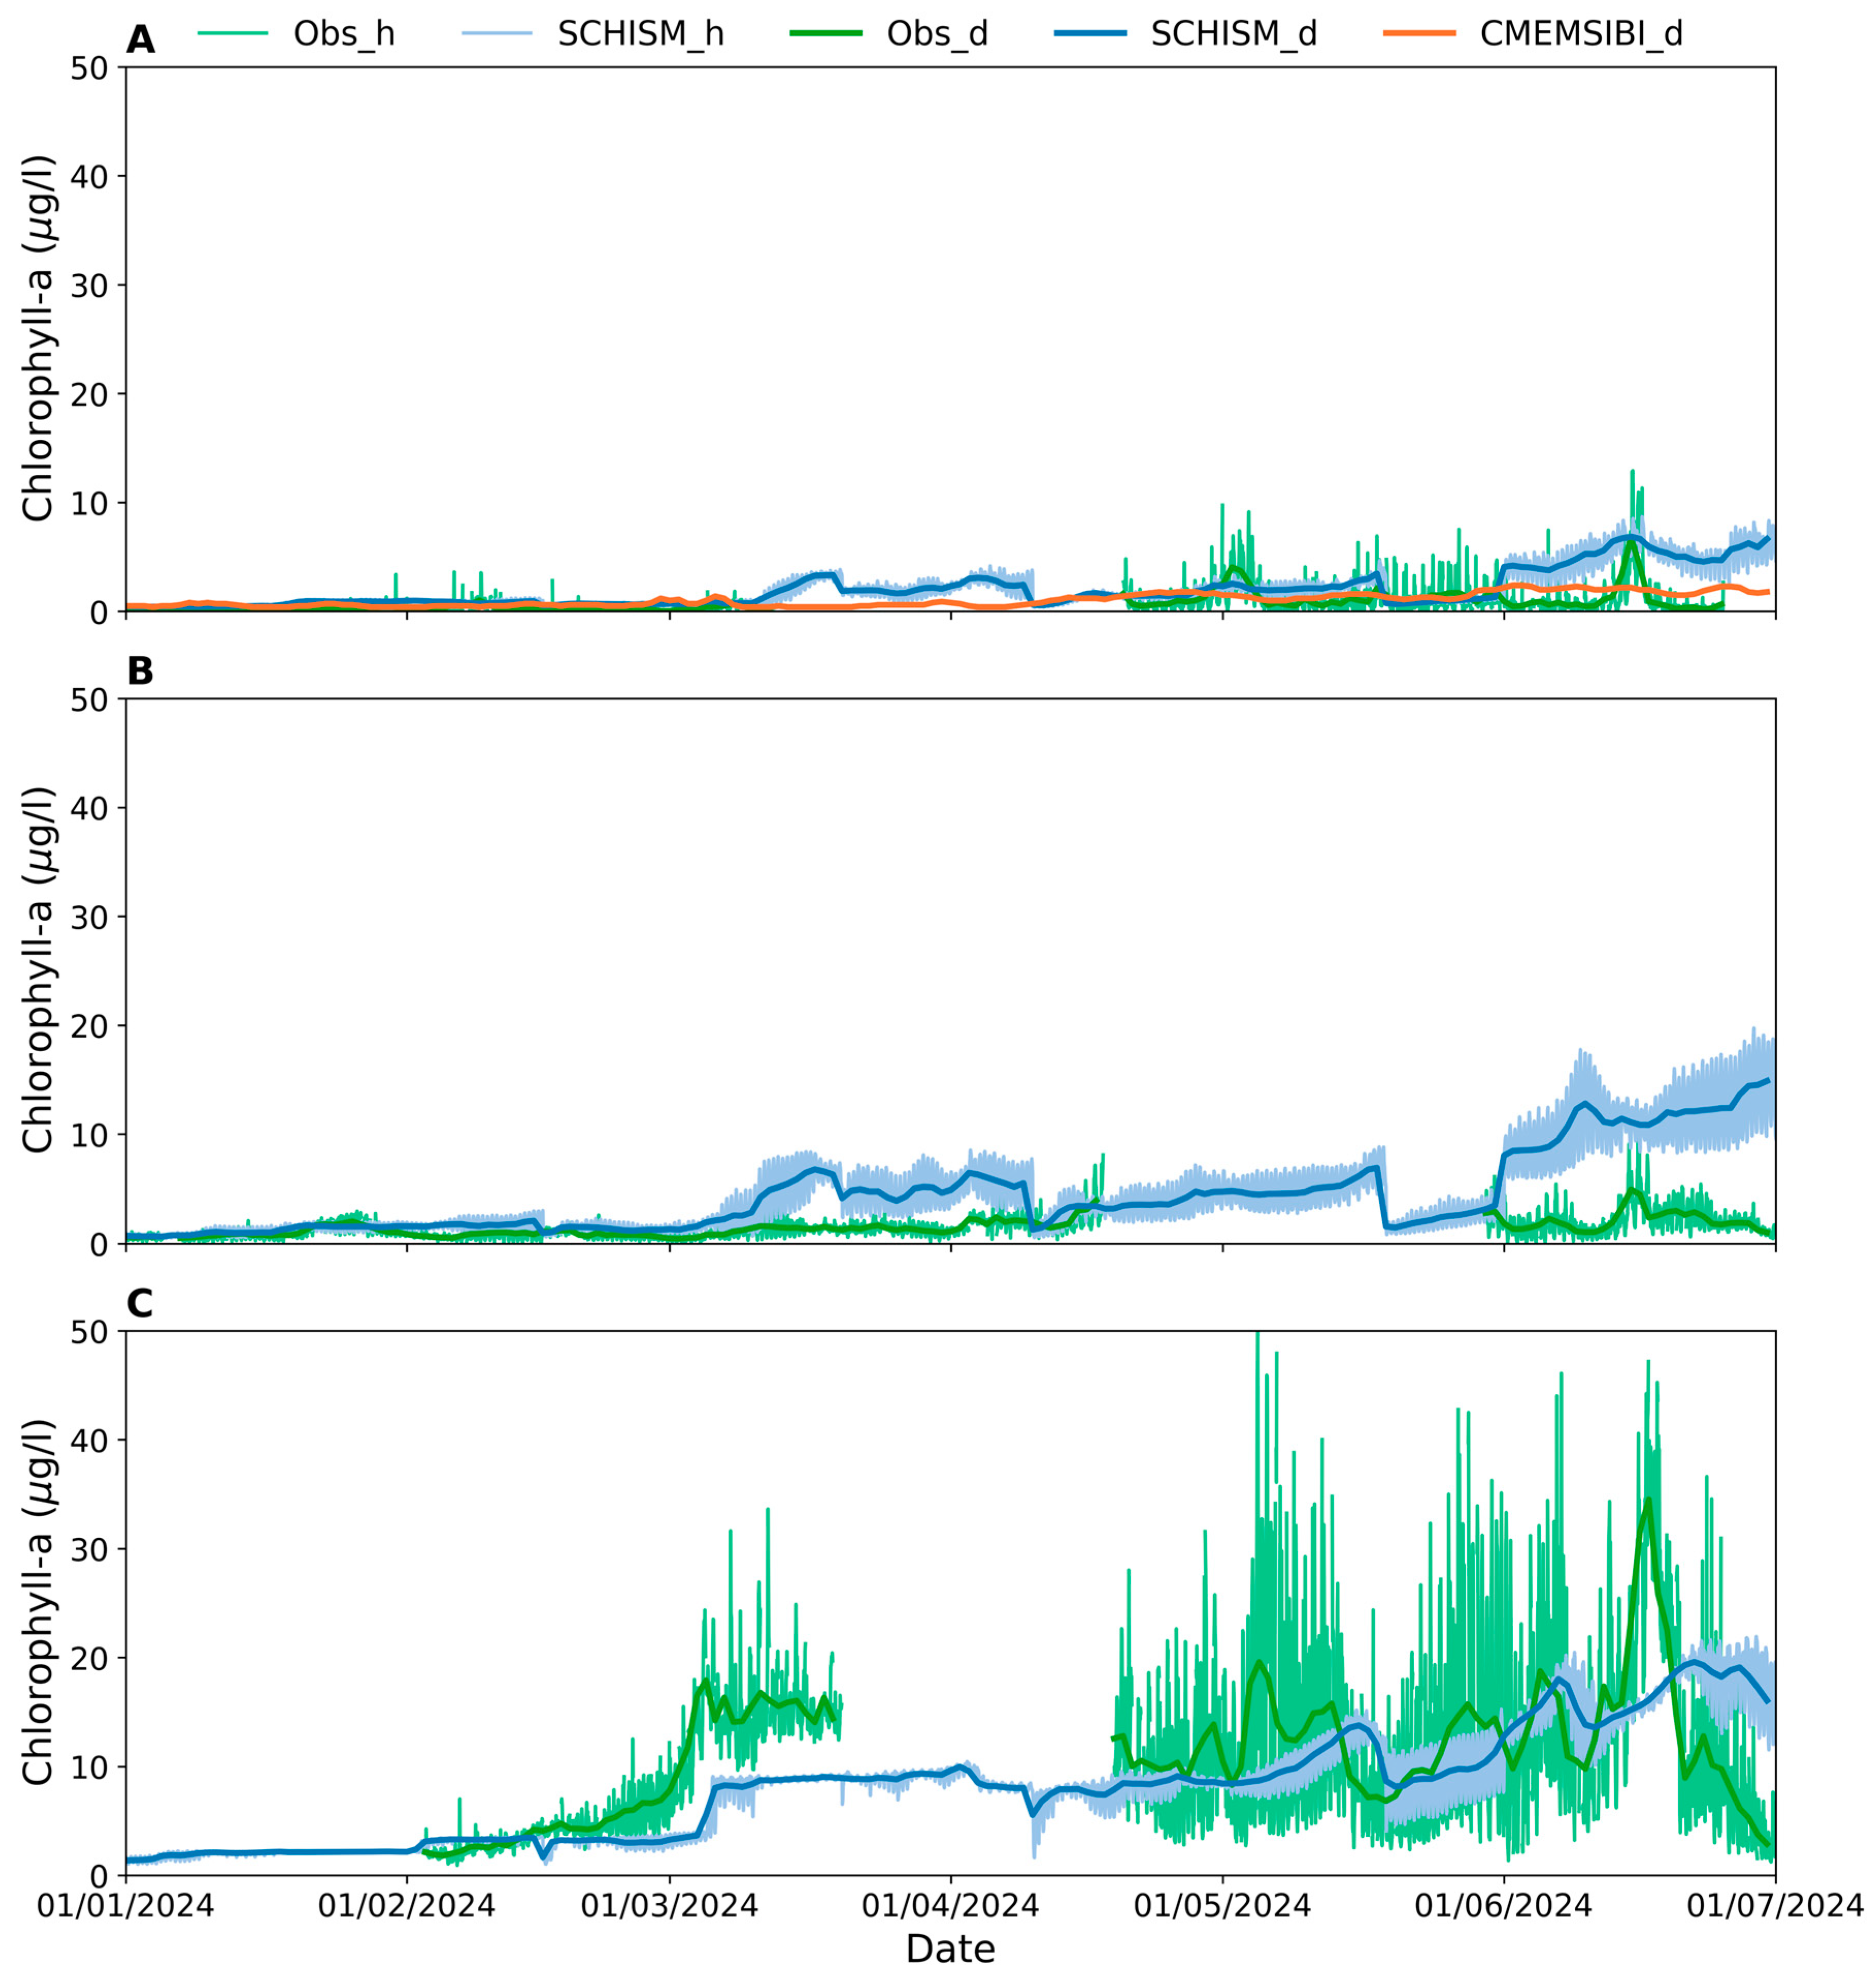
The operational SCHISM 3D baroclinic model also represents the main spatial and seasonal variability of chlorophyll-a (Figure 10): concentrations decrease seaward and increase in spring/early summer, particularly upstream. Relative differences between observed and predicted chlorophyll-a concentrations tend to be higher than for the other variables. NRT chlorophyll-a measurements themselves display wider variability and observational errors. The mean absolute errors of daily mean chlorophyll-a range from 1.2 to 4.4 μg/L. At Buoy CN1, the local model errors tend to be slightly higher than the CMEMS-IBI regional model. However, as discussed for dissolved oxygen, some local trends and variations are better represented by the local model than by the regional model. In June 2024 the growth of chlorophyll-a concentrations in Buoy CN1 is represented by SCHISM 3D, while in CMEMS-IBI, forecast chlorophyll-a concentrations remain almost constant.
The differences between observations and model results for dissolved oxygen and chlorophyll-a may be due to several factors.
The use of climatology values at the riverine boundaries, where forecasts and NRT observations are unavailable to force the operational model, is a source of uncertainty. Errors in river flows, due to both the phase lag in the imposed river flow and the estimation of inflow from other tributaries, may also contribute to the observed differences in the water quality variables.
Light is often considered the main limiting factor for phytoplankton growth in the Tagus estuary [93]. However, suspended sediments may intermittently limit phytoplankton growth [71] since their concentration is primarily driven by tidal amplitudes and phases [94,95], with additional influence from wind–wave interactions [95]. Suspended sediment dynamics are not included in the present application, which limits the model’s ability to more accurately represent light-limited phytoplankton growth.
Another probable source of errors is the absence of benthic processes in the model, including the diffusive fluxes at the sediment–water interface. These processes are particularly relevant in the upper estuary, where extensive intertidal mudflats and saltmarsh areas exist. In these areas, microphytobenthos resuspension may also be an important source of chlorophyll-a in the water column [96,97,98], which is not represented in the model. In the Ems estuary, [96] found that over 30% of the total chlorophyll-a in the water column consisted of suspended microphytobenthos.
Finally, a single phytoplankton group—diatoms, the dominant group in the Tagus estuary [99,100]—is considered in the present application. However, some seasonal and local variations in phytoplankton groups may occur [100].
Thus, improving these aspects in future applications could improve the accuracy of the water quality simulations.

3.3. Operational Inundation and Water Quality Forecasts as Effective Services to Support Coastal Management

The operational forecasting system developed herein advanced the current forecasting services for inundation and water quality in the Tagus estuary. Downscaling from regional models to high-resolution local models improves the representation of coastal processes, enhancing forecasting capabilities to effectively support coastal management [101]. The updated model’s high-resolution grids accurately capture the estuary’s complex geometry and bathymetry, a critical factor in coastal circulation modeling [102]. Both the 2D barotropic and the 3D baroclinic operational applications demonstrated very good performance in reproducing the main patterns of circulation and water quality in the Tagus estuary, with errors comparable to those reported in operational systems for physical (e.g., [22,25]) and biogeochemical variables (e.g., [43]). This indicates that the Tagus estuary operational forecasting system is a reliable tool to support coastal and environmental management in the region. The forecast system for the Tagus estuary also proved valuable from a user-engagement perspective. Workshops conducted with stakeholders indicated a strong interest in applying the model outputs to support decision-making, especially concerning monitoring and planning.
The implementation of an operational forecasting system to the Tagus estuary also provided several lessons and identified areas for improvement in the application of these services in transitional waters.
Boundary conditions remain a significant source of uncertainty. In oceanic regions, regional model forecasts often provide only mean wave parameters (e.g., [42]), whereas models such as SCHISM require boundary conditions in the form of wave spectra. In the present application, this limitation is addressed by running an operational model of wave generation and propagation in the North Atlantic. Expanding the availability of spectral wave forecasts from regional models would benefit similar local high-resolution applications globally. Biogeochemical boundary conditions from regional oceanic models are also typically limited to a few variables. The remaining variables required by biogeochemical models, such as the one used herein, are typically imposed from climatology analysis, which contributes to inaccuracy.
Additionally, imposing accurate river boundary conditions remains a major challenge due to the lack of reliable forecasts of river flows, temperature, and biogeochemical variables at most rivers. Observational data are often scarce or unavailable in NRT, and when available, they suffer from phase errors that degrade the estuarine model performance. Furthermore, watershed models, which could provide the necessary inputs, are frequently unavailable or inadequate in heavily regulated or dammed basins where flow dynamics are not determined by natural processes alone. In the absence of NRT data or forecasts, temperature and biogeochemical boundary conditions are typically imposed using climatological values, introducing substantial uncertainties. Emerging approaches based on deep learning can overcome this limitation. Reference [103] developed Multilayer Perceptron (MLP) models to predict and forecast the river flow in the Tagus and Mondego estuaries (Portugal), with acceptable accuracy in short-term forecasts (of a few days). Extending the approach from [103] to temperature and biogeochemical variables could further contribute to improving the reliability and accuracy of operational forecasts in estuarine and coastal areas. In addition to the main rivers, diffuse sources of nutrients and other loads remain difficult to quantify, further contributing to uncertainty in land boundary condition specification along the estuary.
Outdated bathymetric data remains a primary obstacle to further improving simulation accuracy. For example, the existing bathymetry data for the upper Tagus estuary and the lower river, sampled every 2.5 km, fails to adequately represent the alternating sandbars visible in aerial imagery. Similarly, topographic data lacks the necessary precision to accurately represent protective dykes.
While the model’s vertical resolution effectively simulates strong stratification during high river flow events [62], more detailed vertical profiles of environmental variables would strengthen these findings.
The limited availability of reliable NRT in situ observations in many estuaries poses a significant constraint, limiting the ability to continuously and automatically evaluate the performance of operational models and improve their accuracy. Satellite observations offer broader spatial coverage and continuous data availability, complementing in situ measurements in estuarine and coastal systems. For the present application in the Tagus, comparisons between modeled water temperatures, in situ measurements, and satellite-derived data indicate that satellite observations are generally reliable in open coastal areas but show some discrepancies with in situ data inside estuaries (e.g., Figures S5 and S7). This contrast highlights the importance of using multiple observation sources to assess the performance of operational models, as well as the need to develop criteria for identifying areas where satellite images are sufficiently accurate to support continuous and automatic model–data comparisons.
Moreover, data assimilation techniques, commonly employed in ocean operational forecasting systems to correct model deviations and improve reliability [32], require the availability of dependable NRT data in estuaries. Various data assimilation methods have been applied successfully (e.g., [32,104,105]). While these approaches can significantly enhance numerical forecast accuracy by integrating observational data into model simulations, their use must be carefully managed to ensure the reliability of the results, avoiding biases and misrepresentations of the processes [19]. In this context, the availability of independent, reliable, observational datasets is essential to ensure robust and trustworthy model outputs in forecasting systems. This is particularly important in transitional areas such as estuaries, where strong variability at short temporal and spatial scales arises from their dynamic nature as interfaces between land and sea.
Two-way coupling between regional and estuarine local models should be effectively implemented in operational forecasting systems to improve accuracy. Wherever possible, comparisons were made with forecasts from the CMEMS-IBI regional operational model. Results show that the local models tend to provide better results in terms of elevations, particularly when waves are considered (SCHISM 2D barotropic model). The SCHISM 3D model also performs better than the regional model, particularly in forecasting salinity and temperature in the downstream area of the estuary and in representing local patterns of water quality dynamics that are not captured by the regional model. Local models can thus provide useful inputs (e.g., freshwater, salinity, temperature, nutrient fluxes) for regional models in a two-way flow of information. Recent applications also showed advantages in coupling ocean–estuary–river dynamics to improve the models’ accuracy. Reference [106] coupled the National Water Model (NWM) with SCHISM to simulate water levels during extreme weather events on the northeastern coast of South Carolina (USA), [107] applied a two-way coupled Energy Exascale Earth System Model (E3SM) ensemble to simulate compound flooding in the Delaware Bay estuary (USA), and [108] provides a proof-of-concept of an offline two-way methodology where local schematic rivers and estuaries are coupled to a regional model application in the Portuguese coast. Further efforts are necessary on two-way coupling between regional and local operational models and on extending this approach to additional variables, particularly the biogeochemical ones.
Process-based numerical models and operational forecasts are fundamental elements for coastal management and decision-support tools, such as emerging coastal Digital Twins. These tools can help solve challenges in coastal management by delivering seamless, information-rich, customizable, and user-friendly platforms. These platforms enhance user access to observations and model results, support their integration, and provide tailored products and indicators. Tackling the areas of improvement identified through the present application is essential not only to enhance the accuracy of operational forecasts in transitional waters, but also to advance the development and implementation of operational decision-support tools in coastal systems, including Digital Twins.

4. Conclusions

The development and implementation of a high-resolution operational forecast system for the Tagus estuary represents a significant advancement in supporting coastal and environmental management. Two operational models covering the lower Tagus River, its estuary, and the adjacent coastal area were implemented: (i) a 2D barotropic model, including wave–current interactions and a representation of extensive areas in the upper estuary that can potentially be flooded during extreme events; and (ii) a 3D baroclinic model, including several biogeochemical variables.
Comparisons between forecast simulations and observational data showed excellent accuracy in simulating water levels, wave dynamics, salinity, temperature, and water quality. Comparisons with observations and the regional model results indicate that the local model generally offers improved accuracy, particularly within the estuary, due to its refined spatial resolution and ability to resolve local patterns.
However, several challenges remain, including uncertainties in both oceanic and land boundary conditions, data gaps to model implementation, and the limited availability of high-resolution NRT data necessary to continuously assess and improve model performance. Additionally, the operational two-way coupling between local estuarine models and regional systems could improve the integration of processes across scales. Addressing these limitations is essential to further enhance the reliability and effectiveness of coastal forecasting systems in supporting decision-making.
The forecast system described herein is a core element of the preliminary coastal Digital Twin of the Tagus estuary (CONNECT coastal service), offering a valuable, user-centric platform for informed decision-making in estuarine and coastal management.

Supplementary Materials

The following supporting information can be downloaded at: https://www.mdpi.com/article/10.3390/jmse13091668/s1, Figure S1: Comparison of mean daily river discharge observations at the Tagus River with discharges used as boundary conditions in the 3D SCHISM simulations for the period from 1 January to 30 June 2024. Source of river flow: SNIRH (snirh.pt, data downloaded on 20 November 2024); Figure S2: Temperature forecasts: January 2024—mean monthly sea surface temperature from CMEMS-IBI (top), OSTIA satellite data (center), SCHISM 3D (bottom) and in-situ observations (circles); Figure S3: Temperature forecasts: February 2024—mean monthly sea surface temperature from CMEMS-IBI (top), OSTIA satellite data (center), SCHISM 3D (bottom) and in-situ observations (circles); Figure S4: Temperature forecasts: March 2024—mean monthly sea surface temperature from CMEMS-IBI (top), OSTIA satellite data (center), SCHISM 3D (bottom) and in-situ observations (circles); Figure S5: Temperature forecasts: April 2024—mean monthly sea surface temperature from CMEMS-IBI (top), OSTIA satellite data (center), SCHISM 3D (bottom) and in-situ observations (circles); Figure S6: Temperature forecasts: May 2024—mean monthly sea surface temperature from CMEMS-IBI (top), OSTIA satellite data (center), SCHISM 3D (bottom) and in-situ observations (circles); Figure S7: Temperature forecasts: June 2024—mean monthly sea surface temperature from CMEMS-IBI (top), OSTIA satellite data (center), SCHISM 3D (bottom) and in-situ observations (circles).

Author Contributions

Conceptualization, M.R., A.B.F. and A.O.; Methodology, M.R. and A.B.F.; Software, G.J. and R.J.M.; Validation, M.R. and A.B.F.; Formal Analysis, M.R. and A.B.F.; Data Curation, R.J.M. and A.O.; Writing—Original Draft Preparation, M.R. and A.B.F.; Writing—Review and Editing, M.R., A.B.F. and A.O.; Project administration, M.R.; Funding Acquisition, M.R., A.B.F. and A.O. All authors have read and agreed to the published version of the manuscript.

Funding

This research was supported by funding from the CONNECT project, funded by the Mercator Ocean—Copernicus Marine National Collaboration Programme 2022–2028; and from the ATTRACT-DIH project (Digital Innovation Hub for Artificial Intelligence and High-Performance Computing), funded by the Digital European Programme under Grant Agreement 101083770 and the Recovery and Resilience Plan (PRR) within the scope of the Recovery and Resilience Mechanism (MRR) of the European Union (EU), framed in the Next Generation EU, for the period 2021–2026, within project ATTRACT, reference 774. This work used results produced with the support of the Portuguese National Grid Initiative.

Data Availability Statement

The model-based data are publicly accessible through the CONNECT portal (https://connect-portal.lnec.pt, accessed on 21 August 2025). The model-based datasets used in this study are available on request from the corresponding author. The NRT observations and regional model forecasts used are publicly accessible through the following portals: Copernicus Marine Service—https://marine.copernicus.eu/, accessed on 21 August 2025; EMODnet—https://emodnet.ec.europa.eu/, accessed on 21 August 2025; CoastNet—http://geoportal.coastnet.pt/, accessed on 21 August 2025; and Port of Lisbon Authority—https://www.portodelisboa.pt/ondulacao, accessed on 21 August 2025.

Acknowledgments

The authors acknowledge the near real-time (NRT) data providers: José Lino Costa and Ana Brito from the Faculty of Sciences of the University of Lisbon (FCUL) and the Marine and Environmental Sciences Centre (MARE) for making the data from the CoastNet monitoring network available; the NRT river flow data was obtained through the Portuguese National Water Resources Information System (SNIRH) from the Portuguese Environment Agency (APA); the NRT wave data was provided by the Port of Lisbon Authority; and the water level data was obtained from the Directorate-General for Territorial Development (DGT) through the European Marine Observation and Data Network (EMODnet) portal. The authors also acknowledge the atmospheric and oceanographic forecast providers: the Portuguese Institute for the Sea and Atmosphere (IPMA); MeteoGalicia (Galician Meteorological Agency); the U.S. National Oceanic and Atmospheric Administration (NOAA); and the Copernicus Marine Service (CMEMS).

Conflicts of Interest

The authors declare no conflicts of interest.

References

  1. Barbier, E.B.; Hacker, S.D.; Kennedy, C.; Koch, E.W.; Stier, A.C.; Silliman, B.R. The value of estuarine and coastal ecosystem services. Ecol. Monogr. 2011, 81, 169–193. [Google Scholar] [CrossRef]
  2. Boerema, A.; Meire, P. Management for estuarine ecosystem services: A review. Ecol. Eng. 2017, 98, 172–182. [Google Scholar] [CrossRef]
  3. Booi, S.; Mishi, S.; Andersen, O. Ecosystem services: A systematic review of provisioning and cultural ecosystem services in estuaries. Sustainability 2022, 14, 7252. [Google Scholar] [CrossRef]
  4. Donázar-Aramendía, I.; Sánchez-Moyano, J.E.; García-Asencio, I.; Florido, M.; Pascual-Fernández, N.; García-Gasco, L. Human pressures on two estuaries of the Iberian Peninsula are reflected in food web structure. Sci. Rep. 2019, 9, 11495. [Google Scholar] [CrossRef] [PubMed]
  5. Andersen, J.H.; Al-Hamdani, Z.; Harvey, E.T.; Kallenbach, E.; Murray, C.; Stock, A. Relative impacts of multiple human stressors in estuaries and coastal waters in the North Sea–Baltic Sea transition zone. Sci. Total Environ. 2020, 704, 135316. [Google Scholar] [CrossRef]
  6. De Dominicis, M.; Wolf, J.; Jevrejeva, S.; Zheng, P. Future interactions between sea level rise, tides, and storm surges in the world’s largest urban area. Geophys. Res. Lett. 2020, 47, e2020GL087002. [Google Scholar] [CrossRef]
  7. Kennish, M.J. Drivers of change in estuarine and coastal marine environments: An overview. Open J. Ecol. 2021, 11, 266–289. [Google Scholar] [CrossRef]
  8. Priya, A.K.; Muruganandam, M.; Rajamanickam, S.; Sivarethinamohan, S.; Gaddam, M.K.R.; Velusamy, P.; Gomathi, R.; Ravindiran, G.; Gurugubelli, T.R.; Muniasamy, S.K. Impact of climate change and anthropogenic activities on aquatic ecosystem—A review. Environ. Res. 2023, 238 Pt 2, 117233. [Google Scholar] [CrossRef]
  9. Elliott, M.; Whitfield, A.K. Challenging paradigms in estuarine ecology and management. Estuar. Coast. Shelf Sci. 2011, 94, 306–314. [Google Scholar] [CrossRef]
  10. Rocha, C.; Galvão, H.; Barbosa, A. Role of transient silicon limitation in the development of cyanobacteria blooms in the Guadiana estuary, south-western Iberia. Mar. Ecol. Prog. Ser. 2002, 228, 35–45. [Google Scholar] [CrossRef]
  11. Kerner, M. Effects of deepening the Elbe Estuary on sediment regime and water quality. Estuar. Coast. Shelf Sci. 2007, 75, 492–500. [Google Scholar] [CrossRef]
  12. Rothenberger, M.B.; Burkholder, J.M.; Brownie, C. Long-term effects of changing land use practices on surface water quality in a coastal river and lagoonal estuary. Environ. Manag. 2009, 44, 505–523. [Google Scholar] [CrossRef] [PubMed]
  13. Wetz, M.S.; Yoskowitz, D.W. An ‘extreme’ future for estuaries? Effects of extreme climatic events on estuarine water quality and ecology. Mar. Pollut. Bull. 2013, 69, 7–18. [Google Scholar] [CrossRef] [PubMed]
  14. Freeman, L.A.; Corbett, D.R.; Fitzgerald, A.M.; Lemley, D.A.; Quigg, A.; Steppe, C.N. Impacts of urbanization and development on estuarine ecosystems and water quality. Estuaries Coasts 2019, 42, 1821–1838. [Google Scholar] [CrossRef]
  15. Mayo, T.L.; Lin, N. Climate change impacts to the coastal flood hazard in the northeastern United States. Weather. Clim. Extrem. 2022, 36, 100453. [Google Scholar] [CrossRef]
  16. Green, J.; Haigh, I.D.; Quinn, N.; Neal, J.; Wahl, T.; Wood, M.; Eilander, D.; de Ruiter, M.; Ward, P.; Camus, P. Review article: A comprehensive review of compound flooding literature with a focus on coastal and estuarine regions. Nat. Hazards Earth Syst. Sci. 2025, 25, 747–816. [Google Scholar] [CrossRef]
  17. Jang, J.-H.; Chang, T.-H.; Wu, Y.-M.; Liao, T.-E.; Hsu, C.-H. Analyzing the impact of climate change on compound flooding under interdecadal variations in rainfall and tide. Hydrology 2025, 12, 182. [Google Scholar] [CrossRef]
  18. Pareja-Roman, L.F.; Orton, P.M.; Talke, S.A. Effect of estuary urbanization on tidal dynamics and high tide flooding in a coastal lagoon. J. Geophys. Res. Ocean. 2023, 128, e2022JC018777. [Google Scholar] [CrossRef]
  19. Fennel, K.; Gehlen, M.; Brasseur, P.; Brown, C.W.; Ciavatta, S.; Cossarini, G.; Crise, A.; Edwards, C.A.; Ford, D.; Friedrichs, M.A.M.; et al. Advancing marine biogeochemical and ecosystem reanalyses and forecasts as tools for monitoring and managing ecosystem health. Front. Mar. Sci. 2019, 6, 89. [Google Scholar] [CrossRef]
  20. Cirano, M.; Alvarez-Fanjul, E.; Capet, A.; Ciliberti, S.; Clementi, E.; Dewitte, B.; Dinápoli, M.; El Serafy, G.; Hogan, P.; Joseph, S.; et al. A description of existing operational ocean forecasting services around the globe. In Ocean Prediction: Present Status and State of the Art (OPSR) (State of the Planet); Álvarez Fanjul, E., Ciliberti, S.A., Pearlman, J., Wilmer-Becker, K., Behera, S., Eds.; Copernicus Publications: Göttingen, Germany, 2025; Volume 5-opsr, p. 5. [Google Scholar] [CrossRef]
  21. Fortunato, A.B.; Oliveira, A.; Rogeiro, J.; Tavares da Costa, R.; Gomes, J.L.; Li, K.; Jesus, G.; Freire, P.; Rilo, A.; Mendes, A.; et al. Operational forecast framework applied to extreme sea levels at regional and local scales. J. Oper. Oceanogr. 2017, 10, 1–15. [Google Scholar] [CrossRef]
  22. Sotillo, M.G.; Cerralbo, P.; Lorente, P.; Grifoll, M.; Espino, M.; Sanchez-Arcilla, A.; Alvarez-Fanjul, E. Coastal ocean forecasting in Spanish ports: The Samoa operational service. J. Oper. Oceanogr. 2019, 13, 37–54. [Google Scholar] [CrossRef]
  23. García-León, M.; Sotillo, M.G.; Mestres, M.; Espino, M.; Álvarez-Fanjul, E. Improving operational ocean models for the Spanish Port Authorities: Assessment of the SAMOA coastal forecasting service upgrades. J. Mar. Sci. Eng. 2022, 10, 149. [Google Scholar] [CrossRef]
  24. Juza, M.; Mourre, B.; Renault, L.; Gómara, S.; Sebastián, K.; Lora, S.; Beltran, J.P.; Frontera, B.; Garau, B.; Troupin, C.; et al. SOCIB operational ocean forecasting system and multi-platform validation in the Western Mediterranean Sea. J. Oper. Oceanogr. 2016, 9, 155–166. [Google Scholar] [CrossRef]
  25. Mourre, B.; Aguiar, E.; Juza, M.; Hernandez-Lasheras, J.; Reyes, E.; Heslop, E.; Escudier, R.; Cutolo, E.; Ruiz, S.; Mason, E.; et al. Assessment of high-resolution regional ocean prediction systems using multi-platform observations: Illustrations in the Western Mediterranean Sea. In New Frontiers in Operational Oceanography; Chassignet, E., Pascual, A., Tintoré, J., Verron, J., Eds.; GODAE OceanView, 2018; pp. 663–694. [Google Scholar] [CrossRef]
  26. Schiller, A.; Brassington, G.B.; Oke, P.; Cahill, M.; Divakaran, P.; Entel, M.; Freeman, J.; Griffin, D.; Herzfeld, M.; Hoeke, R.; et al. Bluelink ocean forecasting Australia: 15 years of operational ocean service delivery with societal, economic and environmental benefits. J. Oper. Oceanogr. 2020, 13, 1–18. [Google Scholar] [CrossRef]
  27. Chondros, M.; Metallinos, A.; Papadimitriou, A.; Memos, C.; Tsoukala, V. A coastal flood early-warning system based on offshore sea state forecasts and artificial neural networks. J. Mar. Sci. Eng. 2021, 9, 1272. [Google Scholar] [CrossRef]
  28. Gan, M.; Chen, Y.; Pan, S.; Lai, X.; Pan, H.; Wen, Y.; Xia, M. An improved machine learning-based model to predict estuarine water levels. Ocean Model. 2024, 190, 102376. [Google Scholar] [CrossRef]
  29. Davidson, F.; Alvera-Azcárate, A.; Barth, A.; Brassington, G.B.; Chassignet, E.P.; Clementi, E.; De Mey-Frémaux, P.; Divakaran, P.; Harris, C.; Hernandez, F.; et al. Synergies in operational oceanography: The intrinsic need for sustained ocean observations. Front. Mar. Sci. 2019, 6, 450. [Google Scholar] [CrossRef]
  30. Alvarez Fanjul, E.; Ciliberti, S.; Pearlman, J.; Wilmer-Becker, K.; Bahurel, P.; Ardhuin, F.; Arnaud, A.; Azizzadenesheli, K.; Aznar, R.; Bell, M.; et al. Promoting best practices in ocean forecasting through an Operational Readiness Level. Front. Mar. Sci. 2024, 11, 1443284. [Google Scholar] [CrossRef]
  31. Rodrigues, M.; Martins, R.; Rogeiro, J.; Fortunato, A.B.; Oliveira, A.; Cravo, A.; Jacob, J.; Rosa, A.; Azevedo, A.; Freire, P. A web-based observatory for biogeochemical assessment in coastal regions. J. Environ. Inform. 2021, 38, 1–15. [Google Scholar] [CrossRef]
  32. Martin, M.J.; Balmaseda, M.; Bertino, L.; Brasseur, P.; Brassington, G.; Cummings, J.; Weaver, A.T. Status and future of data assimilation in operational oceanography. J. Oper. Oceanogr. 2015, 8 (Suppl. S1), s28–s48. [Google Scholar] [CrossRef]
  33. Martin, M.J.; Hoteit, I.; Bertino, L.; Moore, A.M. Data assimilation schemes for ocean forecasting: State of the art. In Ocean Prediction: Present Status and State of the Art (OPSR) (State of the Planet); Álvarez Fanjul, E., Ciliberti, S.A., Pearlman, J., Wilmer-Becker, K., Behera, S., Eds.; Copernicus Publications: Göttingen, Germany, 2025; Volume 5-opsr, p. 9. [Google Scholar] [CrossRef]
  34. Oliveira, A.; Fortunato, A.B.; Rogeiro, J.; Teixeira, J.; Azevedo, A.; Lavaud, L.; Bertin, A.; Gomes, J.; David, M.; Pina, J.; et al. OPENCoastS: An open-access service for the automatic generation of coastal forecast systems. Environ. Model. Softw. 2020, 124, 104585. [Google Scholar] [CrossRef]
  35. Oliveira, A.; Fortunato, A.B.; Rodrigues, M.; Azevedo, A.; Rogeiro, J.; Bernardo, S.; Lavaud, B.; Bertin, X.; Nahon, A.; Jesus, G.; et al. Forecasting contrasting coastal and estuarine hydrodynamics with OPENCoastS. Environ. Model. Softw. 2021, 143, 105132. [Google Scholar] [CrossRef]
  36. Trotta, F.; Federico, I.; Pinardi, N.; Coppini, G.; Causio, S.; Jansen, E.; Iovino, D.; Masina, S. A relocatable ocean modeling platform for downscaling to shelf-coastal areas to support disaster risk reduction. Front. Mar. Sci. 2021, 8, 642815. [Google Scholar] [CrossRef]
  37. Sotillo, M.G.; Cailleau, S.; Lorente, P.; Levier, B.; Reffray, G.; Amo-Baladrón, A.; Benkiran, M.; Alvarez Fanjul, E. The MyOcean IBI ocean forecast and reanalysis systems: Operational products and roadmap to the future Copernicus service. J. Oper. Oceanogr. 2015, 8, 63–79. [Google Scholar] [CrossRef]
  38. Sotillo, M.G.; Campuzano, F.; Guihou, K.; Lorente, P.; Olmedo, E.; Matulka, A.; Santos, F.; Amo-Baladrón, M.A.; Novellino, A. River freshwater contribution in operational ocean models along the European Atlantic façade: Impact of a new river discharge forcing data on the CMEMS IBI regional model solution. J. Mar. Sci. Eng. 2021, 9, 401. [Google Scholar] [CrossRef]
  39. Aznar, R.; Sotillo, M.G.; Cailleau, S.; Lorente, P.; Levier, B.; Amo-Baladrón, A.; Reffray, G.; Alvarez Fanjul, E. Strengths and weaknesses of the CMEMS forecasted and reanalyzed solutions for the Iberia-Biscay-Ireland (IBI) waters. J. Mar. Syst. 2016, 159, 1–14. [Google Scholar] [CrossRef]
  40. Lorente, P.; García-Sotillo, M.; Amo-Baladrón, A.; Aznar, R.; Levier, B.; Sánchez-Garrido, J.C.; Sammartino, S.; de Pascual-Collar, Á.; Reffray, G.; Toledano, C.; et al. Skill assessment of global, regional, and coastal circulation forecast models: Evaluating the benefits of dynamical downscaling in IBI (Iberia-Biscay-Ireland) surface waters. Ocean Sci. 2019, 15, 967–996. [Google Scholar] [CrossRef]
  41. Mason, E.; Ruiz, S.; Bourdalle-Badie, R.; Reffray, G.; García-Sotillo, M.; Pascual, A. New insight into 3-D mesoscale eddy properties from CMEMS operational models in the western Mediterranean. Ocean Sci. 2019, 15, 1111–1131. [Google Scholar] [CrossRef]
  42. Toledano, C.; Ghantous, M.; Lorente, P.; Dalphinet, A.; Aouf, L.; Sotillo, M.G. Impacts of an altimetric wave data assimilation scheme and currents-wave coupling in an operational wave system: The new Copernicus Marine IBI wave forecast service. J. Mar. Sci. Eng. 2022, 10, 457. [Google Scholar] [CrossRef]
  43. Gutknecht, E.; Reffray, G.; Mignot, A.; Dabrowski, T.; Sotillo, M.G. Modelling the marine ecosystem of Iberia-Biscay-Ireland (IBI) European waters for CMEMS operational applications. Ocean Sci. 2019, 15, 1489–1516. [Google Scholar] [CrossRef]
  44. Vaz, N.; Mateus, M.; Pinto, L.; Neves, R.; Dias, J.M. The Tagus Estuary as a numerical modeling test bed: A review. Geosciences 2020, 10, 4. [Google Scholar] [CrossRef]
  45. Vieira, J.R. Contribuição para o Estudo de Processos de Circulação em Regiões Costeiras: Desenvolvimento e Aplicação dum Modelo Matemático por Elementos Finitos. Ph.D. Thesis, Instituto Superior Técnico, Lisbon, Portugal, 1991. [Google Scholar]
  46. Fortunato, A.B.; Baptista, A.M.; Luettich, R.A., Jr. A three-dimensional model of tidal currents in the mouth of the Tagus Estuary. Cont. Shelf Res. 1997, 17, 1689–1714. [Google Scholar] [CrossRef]
  47. Portela, L.I. Modelação Matemática de Processos Hidrodinâmicos e de Qualidade da Água no Estuário do Tejo. Ph.D. Thesis, Instituto Superior Técnico, Universidade Técnica de Lisboa, Lisbon, Portugal, 1996. [Google Scholar]
  48. Barros, A.P.; Baptista, A.M. An Eulerian-Lagrangian model for sediment transport in estuaries. In Estuarine and Coastal Modeling; Spalding, M., Ed.; American Society of Civil Engineers: Reston, VA, USA, 1990; pp. 102–112. [Google Scholar]
  49. Portela, L.I.; Neves, R. Numerical modelling of suspended sediment transport in tidal estuaries: A comparison between the Tagus (Portugal) and the Scheldt (Belgium–The Netherlands). Neth. J. Aquat. Ecol. 1994, 28, 329–335. [Google Scholar] [CrossRef]
  50. Barros, A.P. An evaluation of model parameterizations of sediment pathways: A case study for the Tagus Estuary. Cont. Shelf Res. 1996, 16, 1725–1749. [Google Scholar] [CrossRef]
  51. Oliveira, A.; Baptista, A.M. Diagnostic modeling of residence times in estuaries. Water Resour. Res. 1997, 33, 1935–1946. [Google Scholar] [CrossRef]
  52. Fortunato, A.B.; Oliveira, A.; Baptista, A.M. On the effect of tidal flats on the hydrodynamics of the Tagus estuary. Oceanol. Acta 1999, 22, 31–44. [Google Scholar] [CrossRef]
  53. Vaz, N.; Fernandes, L.; Leitão, P.C.; Dias, J.M.; Neves, R.; Manuel, A. The Tagus estuarine plume induced by wind and river runoff: Winter 2007 case study. J. Coast. Res. 2009, 56, 1090–1094. [Google Scholar]
  54. Saraiva, S. Produção Primária de Biomassa no Estuário do Tejo. Master’s Thesis, Instituto Superior Técnico, Universidade Técnica de Lisboa, Lisbon, Portugal, 2001. [Google Scholar]
  55. Saraiva, S.; Pina, P.; Martins, F.; Santos, M.; Braunschweig, F.; Neves, R. Modelling the influence of nutrient loads on Portuguese estuaries. Hydrobiologia 2007, 587, 5–18. [Google Scholar] [CrossRef]
  56. Mateus, M.; Neves, R. Evaluating light and nutrient limitation in the Tagus estuary using a process-oriented ecological model. J. Mar. Eng. Technol. 2008, 7, 43–54. [Google Scholar] [CrossRef]
  57. Braunschweig, F.; Leitão, P.C.; Fernandes, L.; Pina, P.; Neves, R.J.J. The object-oriented design of the integrated water modelling system MOHID. Dev. Water Sci. 2004, 55, 1079–1090. [Google Scholar] [CrossRef]
  58. Rusu, L.; Bernardino, M.; Guedes Soares, C. Modelling the influence of currents on wave propagation at the entrance of the Tagus estuary. Ocean Eng. 2011, 38, 1174–1183. [Google Scholar] [CrossRef]
  59. Fortunato, A.B.; Freire, P.; Bertin, X.; Rodrigues, M.; Ferreira, J.; Liberato, M.L.R. A numerical study of the February 15, 1941 storm in the Tagus estuary. Cont. Shelf Res. 2017, 144, 50–64. [Google Scholar] [CrossRef]
  60. Valentim, J.M.; Vaz, N.; Silva, H.; Duarte, B.; Caçador, I.; Dias, J.M. Tagus estuary and Ria de Aveiro saltmarsh dynamics and the impact of sea level rise. Estuar. Coast. Shelf Sci. 2013, 130, 138–151. [Google Scholar] [CrossRef]
  61. Guerreiro, M.; Fortunato, A.B.; Freire, P.; Rilo, A.; Taborda, R.; Freitas, M.C.; Andrade, C.; Silva, T.; Rodrigues, M.; Bertin, X.; et al. Evolution of the hydrodynamics of the Tagus estuary (Portugal) in the 21st century. Rev. Gestão Costeira Integr./J. Integr. Coast. Zone Manag. 2015, 15, 65–80. [Google Scholar] [CrossRef]
  62. Rodrigues, M.; Fortunato, A.B. Assessment of a three-dimensional baroclinic circulation model of the Tagus estuary. AIMS Environ. Sci. 2017, 4, 763–787. [Google Scholar] [CrossRef]
  63. Rodrigues, M.; Fortunato, A.B.; Freire, P. Saltwater intrusion in the upper Tagus estuary during droughts. Geosciences 2019, 9, 400. [Google Scholar] [CrossRef]
  64. Oliveira, A.; Rogeiro, J.; Jesus, G.; Fortunato, A.B.; David, L.M.; Rodrigues, M.; Costa, J.; Mota, T.; Gomes, J.L.; Matos, R. Real-time monitoring and forecast platform to support early warning of faecal contamination in recreational waters. In Climate Change, Water Supply and Sanitation: Risk Assessment, Management, Mitigation and Reduction; Hulsmann, A., Grützmacher, G., van den Berg, G., Rauch, W., Jensen, A.L., Popovych, V., Mazzola, M.R., Vamvakeridou-Lyroudia, L.S., Savić, D.A., Eds.; IWA Publishing: London, UK, 2015; Chapter 3.13; pp. 102–112. ISBN 9781780404998. [Google Scholar]
  65. Póvoa, P.; Nobre, A.; Leitão, P.; Galvão, P.; Santos, H.; Frazão, A.; Neves, R.; Matos, J.S. Operational decision support system for large combined sewage systems: Lisbon/Tagus estuary case study. Water Sci. Technol. 2015, 72, 1421–1427. [Google Scholar] [CrossRef]
  66. Franz, G.; Fernandes, R.; De Pablo, H.; Viegas, C.; Pinto, L.; Campuzano, F.; Ascione, I.; Leitão, P.; Neves, R. Tagus estuary hydro-biogeochemical model: Inter-annual validation and operational model update. In 3as Jornadas de Engenharia Hidrográfica; Instituto Hidrográfico: Lisbon, Portugal, 2014; pp. 103–106. [Google Scholar]
  67. Rilo, A.; Tavares, A.; Freire, P.; Pinto Santos, P.; Zêzere, J.L. The contribution of historical information to flood risk management in the Tagus estuary. Int. J. Disaster Risk Reduct. 2017, 25, 22–35. [Google Scholar] [CrossRef]
  68. Ferreira, J.G.; Simas, T.; Nobre, A.; Silva, M.C.; Schifferegger, K.; Lencart-Silva, J. Identification of Sensitive Areas and Vulnerable Zones in Transitional and Coastal Portuguese Systems: Application of the United States National Estuarine Eutrophication Assessment to the Minho, Lima, Douro, Ria de Aveiro, Mondego, Tagus, Sado, Mira, Ria Formosa and Guadiana Systems; INAG/IMAR: Lisbon, Portugal, 2003. [Google Scholar]
  69. Brogueira, M.J.; Cabeçadas, G. Identification of similar environmental areas in Tagus estuary by using multivariate analysis. Ecol. Indic. 2006, 6, 508–515. [Google Scholar] [CrossRef]
  70. Brito, A.C.; Moita, T.; Gameiro, C.; Silva, T.; Anselmo, T.; Brotas, V. Changes in the phytoplankton composition in a temperate estuarine system (1960 to 2010). Estuaries Coasts 2015, 38, 1678–1691. [Google Scholar] [CrossRef]
  71. Caetano, M.; Raimundo, J.; Nogueira, M.; Santos, M.; Mil-Homens, M.; Prego, R.; Vale, C. Defining benchmark values for nutrients under the Water Framework Directive: Application in twelve Portuguese estuaries. Mar. Chem. 2016, 185, 27–37. [Google Scholar] [CrossRef]
  72. Rodrigues, M.; Cravo, A.; Freire, P.; Rosa, A.; Santos, D. Temporal assessment of the water quality along an urban estuary (Tagus estuary, Portugal). Mar. Chem. 2020, 223, 103824. [Google Scholar] [CrossRef]
  73. Borges, C.; Bettencourt da Silva, R.J.N.; Palma, C. Determination of river water composition trends with uncertainty: Seasonal variation of nutrients concentration in Tagus river estuary in the dry 2017 year. Mar. Pollut. Bull. 2020, 158, 111371. [Google Scholar] [CrossRef]
  74. de Freitas, J.G.; Dias, J.A. 1941 windstorm effects on the Portuguese Coast: What lessons for the future? J. Coast. Res. 2013, 65 (Suppl. S1), 714–719. [Google Scholar] [CrossRef]
  75. Castanheiro, J.M. Distribution, transport and sedimentation of suspended matter in the Tejo Estuary. In Estuarine Processes: An Application to the Tagus Estuary; Secretaria de Estado do Ambiente e Recursos Naturais: Lisboa, Portugal, 1986; pp. 75–90. [Google Scholar]
  76. Agência Portuguesa do Ambiente, APA. Plano de Gestão da Região Hidrográfica do Tejo, Relatório Técnico—Síntese; Ministério da Agricultura, do Mar, do Ambiente e do Ordenamento do Território: Lisbon, Portugal, 2012; p. 294. [Google Scholar]
  77. Neves, F.S. Dynamics and Hydrology of the Tagus Estuary: Results from In Situ Observations. Ph.D. Thesis, Universidade de Lisboa, Lisbon, Portugal, 2010. [Google Scholar]
  78. Zhang, Y.J.; Ye, F.; Stanev, E.V.; Grashorn, S. Seamless cross-scale modeling with SCHISM. Ocean Model. 2016, 102, 64–81. [Google Scholar] [CrossRef]
  79. Roland, A.; Zhang, Y.J.; Wang, H.V.; Meng, Y.; Teng, Y.-C.; Maderich, V.; Brovchenko, I.; Dutour-Sikiric, M.; Zanke, U. A fully coupled 3D wave-current interaction model on unstructured grids. J. Geophys. Res. Ocean. 2012, 117, C00J33. [Google Scholar] [CrossRef]
  80. Rodrigues, M.; Oliveira, A.; Queiroga, H.; Fortunato, A.B.; Zhang, Y.J. Three-dimensional modeling of the lower trophic levels in the Ria de Aveiro (Portugal). Ecol. Model. 2009, 220, 1274–1290. [Google Scholar] [CrossRef]
  81. Rodrigues, M.; Oliveira, A.; Queiroga, H.; Brotas, V. Seasonal and diurnal water quality modelling along a salinity gradient (Mira channel, Aveiro lagoon, Portugal). Procedia Environ. Sci. 2012, 13, 899–918. [Google Scholar] [CrossRef]
  82. Bisset, W.P.; Debra, S.; Dye, D. Ecological Simulation (EcoSim) 2.0: Technical Description; Florida Environmental Research Institute: Tampa, FL, USA, 2004. [Google Scholar]
  83. Vichi, M.; Pinardi, N.; Masina, S. A generalized model of pelagic biogeochemistry for the global ocean ecosystem. Part I: Theory. J. Mar. Syst. 2007, 64, 89–109. [Google Scholar] [CrossRef]
  84. Fortunato, A.B.; Freire, P.; Mengual, B.; Bertin, X.; Pinto, C.; Martins, K.; Guérin, T.; Azevedo, A. Sediment dynamics and morphological evolution in the Tagus Estuary inlet. Mar. Geol. 2021, 440, 106590. [Google Scholar] [CrossRef]
  85. Fortunato, A.B.; Freire, P.; Ana, R.; Viseu, T.; Rodrigues, M. Mapping inundation of estuarine margins driven by ocean and fluvial forcings. In Proceedings of the 8th IAHR Congress, Lisbon, Portugal, 4–7 June 2024; pp. 229–235. [Google Scholar] [CrossRef]
  86. Castellanos, P.; Brito, A.C.; Chainho, P.; Quintella, B.; da Costa, L.; França, S.; Cabral, H.; Costa, J.L. CoastNet dataset from Mondego, Tejo and Mira estuaries: Multiparametric measurements during 2020. Front. Mar. Sci. 2021, 8, 707089. [Google Scholar] [CrossRef]
  87. França, S.; Fonseca, V.F.; Tanner, S.E.; Vasconcelos, R.; Reis-Santos, P.; Maia, A.; Ruano, M.; Cardoso, I.; Henriques, S.; Pais, M.P.; et al. Historical data in the CoastNet Geoportal: Snapshot of estuarine fish communities in Portuguese estuaries. Front. Mar. Sci. 2021, 8, 685294. [Google Scholar] [CrossRef]
  88. Brandão, P.; da Costa, L.M.; Costa, J.L.; Cabral, H.N.; Marques, T.A.; França, S. Trends in fish diversity in Portuguese estuaries in the past decades and predictions in face of global changes. Estuar. Coast. Shelf Sci. 2025, 312, 109048. [Google Scholar] [CrossRef]
  89. Stark, J.D.; Donlon, C.J.; Martin, M.J.; McCulloch, M.E. OSTIA: An operational, high resolution, real time, global sea surface temperature analysis system. In Proceedings of the OCEANS 07 IEEE, Aberdeen, UK, 18–21 June 2007. [Google Scholar] [CrossRef]
  90. Donlon, C.J.; Martin, M.; Stark, J.; Roberts-Jones, J.; Fiedler, E.; Wimmer, W. The Operational Sea Surface Temperature and Sea Ice Analysis (OSTIA) system. Remote Sens. Environ. 2012, 116, 140–158. [Google Scholar] [CrossRef]
  91. Good, S.; Fiedler, E.; Mao, C.; Martin, M.J.; Maycock, A.; Reid, R.; Roberts-Jones, J.; Searle, T.; Waters, J.; While, J.; et al. The current configuration of the OSTIA system for operational production of foundation sea surface temperature and ice concentration analyses. Remote Sens. 2020, 12, 720. [Google Scholar] [CrossRef]
  92. Rodrigues, M.; Rogeiro, J.; David, L.; Fortunato, A.B.; Oliveira, A. Análise de sensibilidade à incerteza dos forçamentos na previsão da qualidade da água em tempo real. In Proceedings of the Atas do 13° Congresso da Água, Lisbon, Portugal, 7–9 March 2016; 15p. [Google Scholar]
  93. Gameiro, C.; Zwolinski, J.; Brotas, V. Light control on phytoplankton production in a shallow and turbid estuarine system. Hydrobiologia 2011, 669, 249–263. [Google Scholar] [CrossRef]
  94. Vale, C.; Sundby, B. Suspended sediment fluctuations in the Tagus Estuary on semi-diurnal and fortnightly time scales. Estuar. Coast. Shelf Sci. 1987, 25, 495–508. [Google Scholar] [CrossRef]
  95. Franz, G.; Pinto, L.; Ascione Kenov, I.; Mateus, M.; Fernandes, R.; Leitão, P.; Neves, R. Modelling of cohesive sediment dynamics in tidal estuarine systems: Case study of Tagus estuary, Portugal. Estuar. Coast. Shelf Sci. 2014, 151, 34–44. [Google Scholar] [CrossRef]
  96. De Jonge, V.N.; Van Beuselom, J.E.E. Contribution of resuspended microphytobenthos to total phytoplankton in the EMS estuary and its possible role for grazers. Neth. J. Sea Res. 1992, 30, 91–105. [Google Scholar] [CrossRef]
  97. Brito, A.C.; Fernandes, T.F.; Newton, A.; Facca, C.; Tett, P. Does microphytobenthos resuspension influence phytoplankton in shallow systems? A comparison through a Fourier series analysis. Estuar. Coast. Shelf Sci. 2012, 110, 77–84. [Google Scholar] [CrossRef]
  98. Brito, A.C.; Benyoucef, I.; Jesus, B.; Brotas, V.; Gernez, P.; Mendes, C.R.; Launeau, P.; Peixe Dias, M.; Barillé, L. Seasonality of microphytobenthos revealed by remote-sensing in a South European estuary. Cont. Shelf Res. 2013, 66, 83–91. [Google Scholar] [CrossRef]
  99. Gameiro, C.; Brotas, V. Patterns of phytoplankton variability in the Tagus Estuary. Estuaries Coasts 2010, 33, 311–323. [Google Scholar] [CrossRef]
  100. Cereja, R.; Chainho, P.; Brotas, V.; Cruz, J.P.C.; Sent, G.; Rodrigues, M.; Carvalho, F.; Cabral, S.; Brito, A.C. Spatial variability of physicochemical parameters and phytoplankton at the Tagus Estuary (Portugal). Sustainability 2022, 14, 13342. [Google Scholar] [CrossRef]
  101. Staneva, J.; Melet, A.; Veitch, J.; Matte, P. Solving coastal dynamics: Introduction to high-resolution ocean forecasting services. In Ocean Prediction: Present Status and State of the Art (OPSR); Álvarez Fanjul, E., Ciliberti, S.A., Pearlman, J., Wilmer-Becker, K., Behera, S., Eds.; Copernicus Publications: Göttingen, Germany, 2025; Volume 5-opsr, p. 4. [Google Scholar] [CrossRef]
  102. Zhang, Y.J.; Anderson, J.; Park, K.; Wu, C.H.; Wipperfurth, S.; Anderson, E.; Pe’eri, S.; Beletsky, D.; Titze, D.; Di Lorenzo, E.; et al. Debunking common myths in coastal circulation modeling. Ocean Model. 2024, 190, 102401. [Google Scholar] [CrossRef]
  103. Jesus, G.; Mardani, Z.; Alves, E.; Oliveira, A. Deep learning-based river flow forecasting with MLPs: Comparative exploratory analysis applied to the Tejo and the Mondego rivers. Sensors 2025, 25, 2154. [Google Scholar] [CrossRef]
  104. Song, H.; Edwards, C.A.; Moore, A.M.; Fiechter, J. Data assimilation in a coupled physical-biogeochemical model of the California current system using an incremental lognormal 4-dimensional variational approach: Part 3—Assimilation in a realistic context using satellite and in situ observations. Ocean Model. 2016, 106, 159–172. [Google Scholar] [CrossRef]
  105. Moore, A.M.; Martin, M.J.; Akella, S.; Arango, H.G.; Balmaseda, M.; Bertino, L.; Ciavatta, S.; Cornuelle, B.; Cummings, J.; Frolov, S.; et al. Synthesis of ocean observations using data assimilation for operational, real-time and reanalysis systems: A more complete picture of the state of the ocean. Front. Mar. Sci. 2019, 6, 90. [Google Scholar] [CrossRef]
  106. Zhang, H.; Shen, D.; Bao, S.; Len, P. Two-way coupling of the National Water Model (NWM) and semi-implicit cross-scale Hydroscience Integrated System Model (SCHISM) for enhanced coastal discharge predictions. Hydrology 2024, 11, 145. [Google Scholar] [CrossRef]
  107. Feng, D.; Tan, Z.; Engwirda, D.; Wolfe, J.D.; Xu, D.; Liao, C.; Bisht, G.; Benedict, J.J.; Zhou, T.; Li, H.-Y.; et al. Simulation of compound flooding using river-ocean two-way coupled E3SM ensemble on variable-resolution meshes. J. Adv. Model. Earth Syst. 2024, 16, e2023MS004054. [Google Scholar] [CrossRef]
  108. Sobrinho, J.; de Pablo, H.; Campuzano, F.; Neves, R. Coupling Rivers and Estuaries with an Ocean Model: An Improved Methodology. Water 2021, 13, 2284. [Google Scholar] [CrossRef]
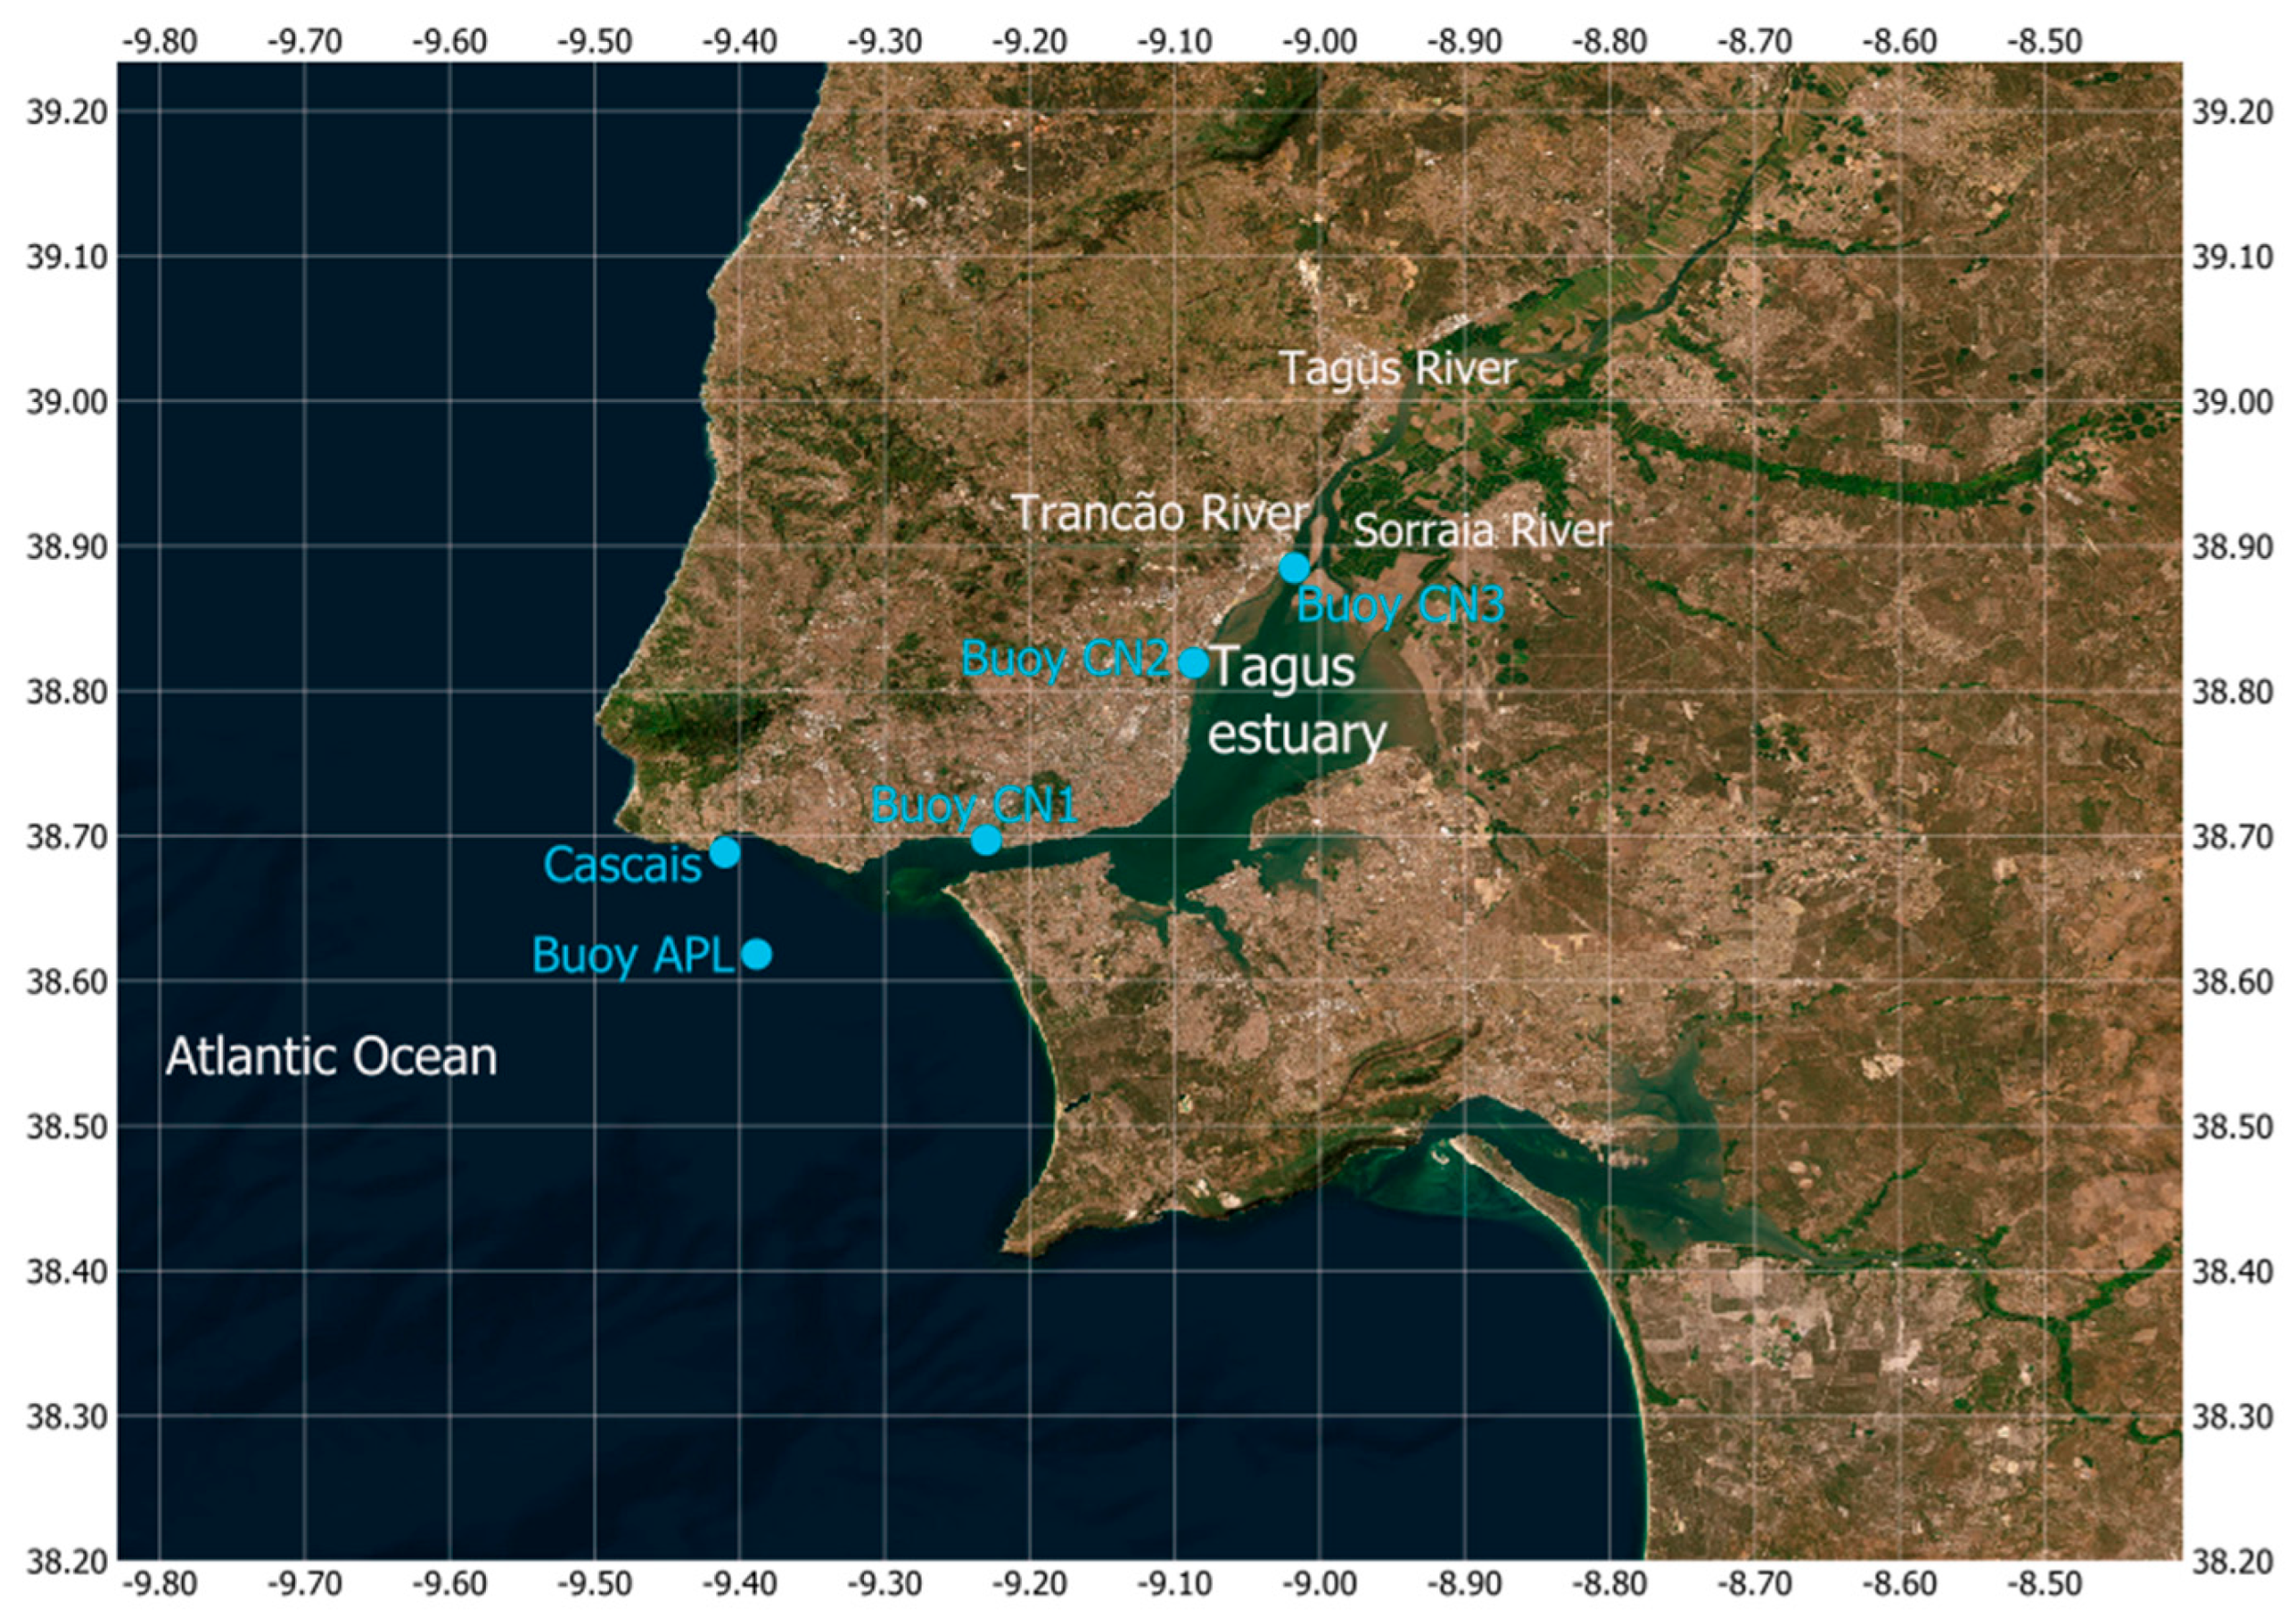
Figure 1. Tagus estuary: study area and location of the in situ monitoring stations.
Jmse 13 01668 g001
Figure 2. Forecast system of the Tagus estuary and its main components.
Jmse 13 01668 g002
Figure 3. The 2D (A) and 3D (B) horizontal grids, domains, and bathymetry.
Jmse 13 01668 g003
Figure 4. Water levels at Cascais: observed and modeled time series and their difference (Discrepancy), root mean square (RMS) error, and the bias for the SCHISM 2D depth-averaged model (A) and the regional CMEMS-IBI model (B). The interruptions in the SCHISM 2D time series correspond to failures in the forecasts.
Jmse 13 01668 g004
Figure 5. Significant wave height (A) and wave mean period (B) at the APL buoy: observed and modeled time series, root mean square (RMS) error, and bias for the SCHISM 2D model and for the CMEMS-IBI regional model.
Jmse 13 01668 g005
Figure 6. Water levels at Cascais: observed and modeled time series and their difference (Discrepancy), root mean square (RMS) error, and bias for the SCHISM 3D baroclinic model (A) and the regional CMEMS-IBI model (B). The interruptions in the SCHISM 3D time series correspond to failures in the forecasts.
Jmse 13 01668 g006
Figure 7. Salinity at CoastNet Buoy CN1 (A), Buoy CN2 (B), and Buoy CN3 (C): observed (Obs_h—1-h observations; Obs_d—daily mean observations) and modeled time series for the SCHISM 3D baroclinic model (SCHISM_h—1-h results; SCHISM_d—daily mean results) and the regional CMEMS-IBI model (CMEMSIBI_d—daily mean results).
Jmse 13 01668 g007
Figure 8. Temperature at Cascais (A) and CoastNet Buoy CN1 (B), Buoy CN2 (C), and Buoy CN3 (D): observed (Obs_h—1-h observations; Obs_d—daily mean observations) and modeled time series for the SCHISM 3D baroclinic model (SCHISM_h—1-h results; SCHISM_d—daily mean results) and the regional CMEMS-IBI model (CMEMS-IBI_d—daily mean results).
Jmse 13 01668 g008
Figure 9. Dissolved oxygen at CoastNet Buoy CN1 (A), Buoy CN2 (B), and Buoy CN3 (C): observed (Obs_h—1-h observations; Obs_d—daily mean observations) and modeled time series for the SCHISM 3D baroclinic model (SCHISM_h—1-h results; SCHISM_d—daily mean results) and the regional CMEMS-IBI model (CMEMSIBI_d—daily mean results).
Jmse 13 01668 g009
Figure 10. Chlorophyll-a at CoastNet Buoy CN1 (A), Buoy CN2 (B), and Buoy CN3 (C): observed (Obs_h—1-h observations; Obs_d—daily mean observations) and modeled time series for the SCHISM 3D baroclinic model (SCHISM_h—1-h results; SCHISM_d—daily mean results) and the regional CMEMS-IBI model (CMEMSIBI_d—daily mean results).
Jmse 13 01668 g010
Table 1. Temperature and salinity root mean square error (RMSE), mean absolute error (MAE), and correlation coefficient (R) between (i) observations and SCHISM 3D model results and (ii) observations and CMEMS-IBI model results for the period from 1 January to 30 June 2024 at Cascais and CoastNet buoys.
CascaisBuoy CN1Buoy CN2Buoy CN3
RMSEMAERRMSEMAERRMSEMAERRMSEMAER
SCHISM 3D
Temperature (°C)Daily
mean
0.90.80.600.90.70.961.00.90.980.60.50.99
Hourly values1.00.80.580.90.80.911.10.90.970.70.50.98
SalinityDaily
mean
---3.22.40.933.82.60.832.81.80.84
Hourly values---3.42.50.944.63.30.823.52.30.85
CMEMS-IBI
Temperature (°C)Daily
mean
0.50.40.801.51.30.39------
SalinityDaily
mean
---10.09.30.40------
Table 2. Dissolved oxygen and chlorophyll-a root mean square error (RMSE), mean absolute error (MAE), and correlation coefficient (R) between (i) observations and SCHISM 3D model results and (ii) observations and CMEMS-IBI model results for the period from 1 January to 30 June 2024 at the CoastNet buoys.
Buoy CN1Buoy CN2Buoy CN3
RMSEMAERRMSEMAERRMSEMAER
SCHISM 3D
Dissolved oxygen (mg/L)Daily mean0.60.50.570.60.50.660.70.60.57
Chlorophyll-a (µg/L)Daily mean1.81.20.464.83.20.545.84.40.48
CMEMS-IBI
Dissolved oxygen (mg/L)Daily mean0.60.50.41------
Chlorophyll-a (µg/L)Daily mean0.90.70.47------
Disclaimer/Publisher’s Note: The statements, opinions and data contained in all publications are solely those of the individual author(s) and contributor(s) and not of MDPI and/or the editor(s). MDPI and/or the editor(s) disclaim responsibility for any injury to people or property resulting from any ideas, methods, instructions or products referred to in the content.