Article

A Global Perspective on Local Sea Level Changes

1
Hessel Voortman Engineering Consultancy, 3817 CH Amersfoort, The Netherlands
2
Independent Researcher, 5751 HM Deurne, The Netherlands
*
Author to whom correspondence should be addressed.
J. Mar. Sci. Eng. 2025, 13(9), 1641; https://doi.org/10.3390/jmse13091641
Submission received: 20 June 2025 / Revised: 15 August 2025 / Accepted: 20 August 2025 / Published: 27 August 2025
(This article belongs to the Special Issue Sea Level Rise and Related Hazards Assessment)

Abstract

In 2021, the IPCC published new sea level projections. For the first time, the projections gave insight into expected relative sea level rise locally. A prudent designer of coastal infrastructure will want to know how the local projections compare to local observations. That comparison, to date, has not been made. We compared local projections and observations regarding the rate of rise in 2020. We used two datasets with local sea level information all over the globe. In both datasets, we found approximately 15% of the available sets suitable to establish the rate of rise in 2020. Geographic coverage of the suitable locations is poor, with the majority of suitable locations in the Northern Hemisphere. Latin America and Africa are severely under-represented. Statistical tests were run on all selected datasets, taking acceleration of sea level rise as a hypothesis. In both datasets, approximately 95% of the suitable locations show no statistically significant acceleration of the rate of sea level rise. The investigation suggests that local, non-climatic phenomena are a plausible cause of the accelerated sea level rise observed at the remaining 5% of the suitable locations. On average, the rate of rise projected by the IPCC is biased upward with approximately 2 mm per year in comparison with the observed rate.

1. Introduction

Flood protection and infrastructure in the coastal zone are intended to function for several decades up to a century into the future (Figure 1). Structures in the coastal zone, therefore, need to be robust against potential future changes, such as climate change and sea level rise [1,2,3]. An important potential change is a rise of local sea level with respect to the location of interest (relative sea level rise). Projections of future sea level are used to ensure that the design is sufficiently robust [4,5,6].
The construction of coastal infrastructure is costly and it is therefore crucial that sea level information used in design is credible or that possible uncertainties and/or bias are known so that practitioners can appropriately account for them [5,6,7]. The credibility of the present generation of local sea level projections [8,9,10] can be judged by comparison to local observations [11,12]. Such a comparison is undertaken in this paper, aiming for a geographical coverage as wide as the available data allow for.
In 2021, the Intergovernmental Panel on Climate Change (IPCC) published projections of local relative sea level rise for a vast number of locations around the globe [9,10,13]. This is an important improvement from previous projections, which were given as global sea level budgets [14,15] and required translation to local circumstances [2,3,14,15,16]. The fact that IPCC has made the effort to provide local information is commendable.
A comparison to locally observed sea level appears to date to have been undertaken on a very limited scale. Voortman [17] made a comparison for six locations in the North Sea and showed that the projected rate of rise is consistently high compared to observations in that region, and that accelerations of the rate of rise, if present, are statistically not significant. The question is whether this is an isolated phenomenon with local causes, or whether the over-projection of the rate of rise is present in other areas as well [18,19,20].
To answer that question, this paper compares observed and projected sea levels on a large number of locations all over the globe. The methods outlined by Voortman [17] were automated and applied to two datasets with global coverage [11,12,17]. This enables the calculation of trends and acceleration of sea level rise, as well as the comparison of that to contemporary projections. For a subset of stations, the causes of the pattern of sea level rise (or fall) found in the statistical analysis were investigated in more detail.

2. Earlier Work on Mean Sea Level

2.1. General

In the existing literature on mean sea level, a distinction can be made between observations and projections and between global sea level budgets and locally observed levels. Observations are based on actual measurements. Measurements need to be processed to enable analysis of (for example) trends and cycles of historic sea level. Projections are estimates of future conditions and hence cannot be measured, but they can be informed by observations.

2.2. Global Sea Level Budget

In 2002, Munk [21] formulated his enigma, which states that estimates of globally averaged sea level rise are inconsistent with insights into, among others, ice shelves, glaciers, and the thermal expansion of ocean water. Munk [21] recognized that the solution could be found on both sides of the enigma; either individual contributors to sea level rise are estimated too low, or the estimate of globally averaged sea level rise is too high.
Following Munk’s publication [21], several authors attempted to solve the enigma. Without exception, we found papers attempting to close the budget by increasing the contributors to sea level rise [22,23,24,25,26,27,28,29,30]. The alternative option, namely that the estimate of global sea level rise is too high, appears to gain little attention.
The current state of affairs is best illustrated by the paper by Frederikse et al. [31] that claims to have “closed the sea level budget”. Unfortunately, a detailed inspection revealed a number of weaknesses and even errors in Frederikse’s work [17]. It therefore appears that the sea level budget is still not closed and that Munk’s enigma [21] over 2 decades after publication still stands.
Estimates of the global sea level budget have practical use for comparison to global insights into climate change and as a “background signal” that may appear in locally observed sea levels. The practical value of the assessment of coastal flood risk for coastal planning is very limited [4].

2.3. Observations of Mean Sea Level

Sea levels are observed in numerous places, and sometimes for a very long time. Datasets with global coverage are available and are extremely useful for research purposes [11,12]. Trends and possible acceleration of local or regional mean sea level have received wide attention [18,19,25,32,33,34,35,36,37,38,39,40,41,42,43,44,45,46,47,48,49,50,51,52,53,54,55,56,57,58,59,60,61,62,63,64,65]. A lot of effort is taken to establish a global sea level budget [23,31,65,66,67,68,69,70,71,72,73,74].
The study by Douglas [39] is very similar to the present study as it attempts to detect acceleration of sea level rise in tide gauge records. Douglas [39] concludes that acceleration appeared to be small in comparison to expectations stemming from climate science, but also that the available data series are too short for definitive conclusions, and that corrections for inter-annual and inter-decadal variations need to be made. The present study benefits from 30 years of additional data and improved ways to (digitally) process data.
Most studies rely on the Permanent Service for Mean Sea Level (PSMSL) as a data source and appear to use the data without giving much attention to data quality [11,20]. The datasets of PSMSL are an invaluable resource, but it is important to recognize that the temporal mean sea level is a property that is not observed but derived from observations of constantly varying water levels. Measurement frequency and the method for deriving the mean sea level potentially influence the result. Voortman [17] compared local data with data stored in PSMSL and evaluated a few methods to establish mean sea level, finding that in older data, unexplained differences occur between local datasets and the data stored in PSMSL. Further, Voortman [17] showed that the tidal shape influences mean sea level if measurement frequencies are low, as is the case in most older data. Based on that finding, Voortman [17] suggested tidal analysis as an appropriate method to derive mean sea level from high-frequency data [75,76,77,78]. An additional finding of Voortman [17] was that local effects may have influenced the PSMSL data, which, if undetected, lead to unwarranted conclusions about sea level rise.
Lack of spatial coverage is a known problem with tide gauge data [25,72]. Nowadays, sea level is observed by satellite altimetry [79,80]. This potentially solves the lack of spatial coverage, but the records, commencing in 1993, are still too short to reliably detect acceleration, and marked differences in observed rate of rise are as yet not satisfactorily explained [29,73,81,82,83,84].

2.4. Projected Mean Sea Level

Future changes of sea level are important to correctly assess coastal flood risk and to design adaptation schemes. For these purposes, local projections of future sea level are required. Such projections come in a few forms. The first form is an analysis of historically observed sea levels and an analysis of trends therein. The result is insight into the local patterns of sea levels in the past. With caution, such trends can be extrapolated to the near future; at most, a few decades. Such an analysis provides insight into the changes in sea level only in the region considered. Virtually all studies referenced in the previous section reveal the cycles and trends present in observation-based estimates of mean sea level [18,19,25,32,33,34,35,36,37,38,39,40,41,42,43,44,45,46,47,48,49,50,51,52,53,54,55,56,57,58,59,60,61,62,63,64,65].
The second form uses insights into climate change on the global temperature and on the cryosphere, translated into projected future sea level changes [9,15]. The number of ways to do so is vast. A review paper by Slangen et al. [85] recognizes 82 different projections and organizes them into eight families.
Coastal planning requires projections that cover a wide range of possible futures. At the same time, the number of projections needs to be limited as the specialists involved need to be able to communicate clearly about risks and uncertainties involved in the scheme [4,7]. A set of scenarios satisfying these criteria is available in the latest assessment report by the Intergovernmental Panel on Climate Change and published online [8,9,10].

3. Data and Methods

3.1. Data

Two datasets are used in this study. The Permanent Service for Mean Sea Level provides historic records of monthly and yearly sea levels [11]. Hourly data are provided by the Global Sea Level Observing System (GLOSS) [12]. All data were downloaded in 2023, and only full years were used in the study. PSMSL data are available up to and including 2022. GLOSS data are available up to and including 2019.
The yearly sea levels provided by the PSMSL are used directly in this study. Tidal analysis is used to derive yearly mean sea levels from the hourly GLOSS data [17,76,77,78]. Most investigators appear to rely on the temporal arithmetic mean as an estimate of sea level. Voortman [17] demonstrated that the arithmetic mean is sensitive to the shape of the tide, and a tidal estimate of mean sea level is less so. A tidal estimate was used in this study for that reason. The tidal analysis was performed using the Utide functions developed by Codiga [76] and implemented in a Python package by Bowman [75].
The present study aims to estimate the long-term rates of sea level rise in 2020. To do so reliably, data were selected according to the following criteria:
  • Latest year in the dataset not earlier than 2015, this being a compromise between the desire to have data up to 2020 and the desire to have as many locations included as possible
  • Data available over a period of at least 60 years
  • At least 80% of the years in the range with data available
Satellite data do not fulfill our second criterion and were, therefore, not used.

3.2. Regression Models

Local sea levels are influenced by long-term trends and by tides. The latter are driven by the motion of celestial bodies relative to Earth. Voortman [17] found that multi-year tides need to be included in an analysis of long-term tides to avoid unwarranted detection of an acceleration of sea level rise. The regression models used in this study, therefore, include long-term tides. The following regression model was fitted to the data for every location separately:
z 0 t = p 0 + p 1 t + n = 0 1 A n cos ω n t + φ n   i f   t t 0 p 0 + p 1 t + 1 2 p 2 t t 0 2 + 1 6 p 3 t t 0 3 + n = 0 1 A n cos ω n t + φ n   i f   t > t 0
where pi are the parameters of the trend and acceleration of the sea level, while Ai and φi are the amplitude and phase of the perigean and nodal cycles.
Relative sea level in general shows a trend. Contemporary research suggests that a climate-driven acceleration in sea level rise commences somewhere after 1960 [8,9,18,19]. The regression model allows for an arbitrary starting point for increasing acceleration (t0) and describes the increasing acceleration in second- and third-order terms in time, as is mathematically appropriate. Contemporary climate science suggests that the acceleration of sea level rise is positive and increasing, described by both the second- and third-order terms of the model as being non-negative. In the regression procedure, bounds are imposed in accordance with these insights. For the same reason, the onset of acceleration is bounded between 1960 and 1995, in accordance with contemporary insights into the starting year of acceleration [8,9,18,19].
Sea level is known to oscillate with multi-year periods [77,78]. The oscillations are driven by multi-year tidal forces [77,78]. The perigean cycle (8.85 years) and the nodal cycle (18.61 years) are both multi-year tidal signals coupled to periodic shifts of the orbit of the moon with respect to the Earth [78].
One of the goals of this paper is to find whether a statistically significant and increasing acceleration is present in local observations of sea level. A statistical method is used based on the comparison of the full model (above) with a reduced model in which higher-order terms are removed:
z 0 ; r e d u c e d t = p 0 + p 1 t + n = 0 1 A n cos ω n t + φ n
We use regression analysis to establish the parameters of both the full and the reduced model. Subsequently, we compare the two fits with an F-test, a well-established statistical method suitable for our purpose and used previously for Dutch sea level data [17,86].

3.3. Statistical Testing

Statistical methods were applied to judge the validity of regression results and to judge the significance of differences between the full and reduced models introduced previously. The adjusted coefficient of determination is used to judge the validity of model fits [86]. The adjusted coefficient of determination is defined as:
R a d j ; k 2 = 1 N 1 N k 1 S S r e s i d u a l S S t o t a l
where N is the size of the sample (number of independent datapoints in the set), k is the number of parameters in the regression model, SSresidual is the sum of the squared residuals, and SStotal is the sum of squared differences of every observation to the mean.
The adjusted coefficient of determination is best explained as a measure of explained variance, corrected for the number of parameters in the regression model. Adding additional parameters generally increases the explained variance, but not necessarily the adjusted coefficient. There are alternative measures for the goodness-of-fit of regression models, such as the Akaike Information Criterion, or AIC, and the Bayesian Information Criterion, or BIC [87,88]. All these criteria increase if a model better explains the variance of the data and penalize for complexity of the model. Criteria of this kind are sometimes used to justify model choice, arguing that the model with the highest score should be chosen, irrespective of the actual value of the difference compared to the variability of the residuals. Frederikse & Gerkema [89] and the Dutch Sea Level Monitor applied this type of criterion to sea level observations [38].
A test that explicitly judges the difference in variance of the residuals and penalizes for model complexity is the F-test for reduced models [86]. The F-test compares the full model to the reduced model by calculating and judging the F-statistic, given by:
F = S S r e d u c e d S S f u l l k m ÷ S S f u l l N k
where SSreduced and SSfull are the sum of squared residuals of the reduced and the full model, respectively, k is the number of parameters in the full regression model, and m is the number of parameters in the reduced regression model [86].
The null hypothesis in the F-test is the assumption that the reduced model is an adequate description of the data. The F-test is executed by comparing the calculated F-statistic to a value obtained from an F-distribution at a specified confidence level.
For the full set of tests (depending on the dataset consisting of 50 to 200 data series), we adopt a confidence level of 95% (p = 5%). Recognizing that we run a large number of similar tests, we correct the rejection level for an individual test with Bonferroni’s method [86,90,91]. The rejection level for an individual test depends on the total number of tide stations in the dataset analyzed.
Statistical tests generally assume that the residuals calculated from the regression are statistically independent. If that is the case, N in the equations above equals the number of observations in the considered dataset. When working with real-life data, it is hard to ensure statistical independence of residuals. Dependence reveals itself in correlation between residuals. In this study, correction for dependent residuals is done using the method described by Bence [92], which uses the correlation between residuals as input. The result is called the effective sample size, which is never larger than the actual sample size, and, in case of correlated residuals, smaller than the sample size.

3.4. Definition of the Rate of Sea Level Rise

The F-test determines whether the full or the reduced model adequately describes the data at hand. Rate and acceleration of sea level rise in 2020 are calculated from the parameters of the appropriate model. The long-term rate of sea level rise is defined as the first derivative of the selected regression model neglecting the cyclic terms. The short-term rate of sea level rise is the rate including all terms in the model. Figure 2 illustrates the definitions.
The graph shows a sea level that is varying in accordance with a linear trend, the 8.85-year cycle, and the 18.61-year cycle. The linear trend (dotted line) is denoted as the long-term trend, and its rate is the long-term rate. The short-term rate is the actual rate of rise at any given point in time. The long-term trend and acceleration may be driven by anthropogenic or natural climate change. The multi-year cycles are a tidal effect, driven by the motion of the Moon with respect to Earth [77,78]. Therefore, the long-term trend can be compared to the projections published by the IPCC [8,9,10].
In some applications, the short-term rates and the resulting sea level peaks might be important. An example is Trace-Kleeberg et al. [93], who show that short periods (a few years) of high sea levels may be a disadvantage for the maintenance of storm surge barriers.

3.5. Comparison to Projections by the IPCC

The International Panel on Climate Change (IPCC), in its 2021 report, for the first time provided local estimates of sea level rise starting in 2020 [8,9,10]. In view of the value of local projections for coastal adaptation [4,7], this initiative of the IPCC is commendable. For actual decision-making, it is important to know whether there are differences between the local data and the projections and what they are.
From the field data, this study establishes the long-term rate of sea level rise in 2020 and compares it to the rate of rise in the same year given by the IPCC. The PSMSL data are used for this purpose. The GLOSS dataset was found to be too sparse for a meaningful comparison to the projections, thus the GLOSS data were not used for that part of the study. The IPCC provides projections for two-thirds of the PSMSL network.
The IPCC provides five scenarios, characterized by the assumed climate forcing in 2100. The forcings are coupled to the Shared Socio-economic Pathways (SSP) [94,95] and range from 1.9 W/m2 to 8.5 W/m2. Several authors investigated the assumptions underlying the SSPs and compared them to empirical data [96,97,98,99]. These studies consistently find a low likelihood of SSP3-7.0 and higher. This conclusion has since been adopted by the IPCC and the UNFCCC [100,101]. The studies differ with regard to the best-guess (or business-as-usual) scenario with SSP2-4.5 described as either the best-guess scenario or an upper bound [97]. Based on these findings, this study considers the lowest three scenarios (1.9 W/m2, 2.6 W/m2, and 4.5 W/m2) as relevant for policy-making on coastal adaptation, with the forcing of 4.5 W/m2 as a provisional best guess scenario.
In a practical sense, the median rates of rise of all projections are equal up to 2040 [10,102]. This study establishes the rate of rise in 2020 and, therefore, compares the rate of rise to the SSP2-4.5 projection only. The comparison is based on the medians of the projected and the empirical rate.

4. Results

4.1. PSMSL Data

The PSMSL network [11] consists of 1548 locations. Data are available for 1533 (99%) of them. Of these, 204 (14% of the stations with data) meet the selection criteria and are analyzed. Figure 3 summarizes the results.
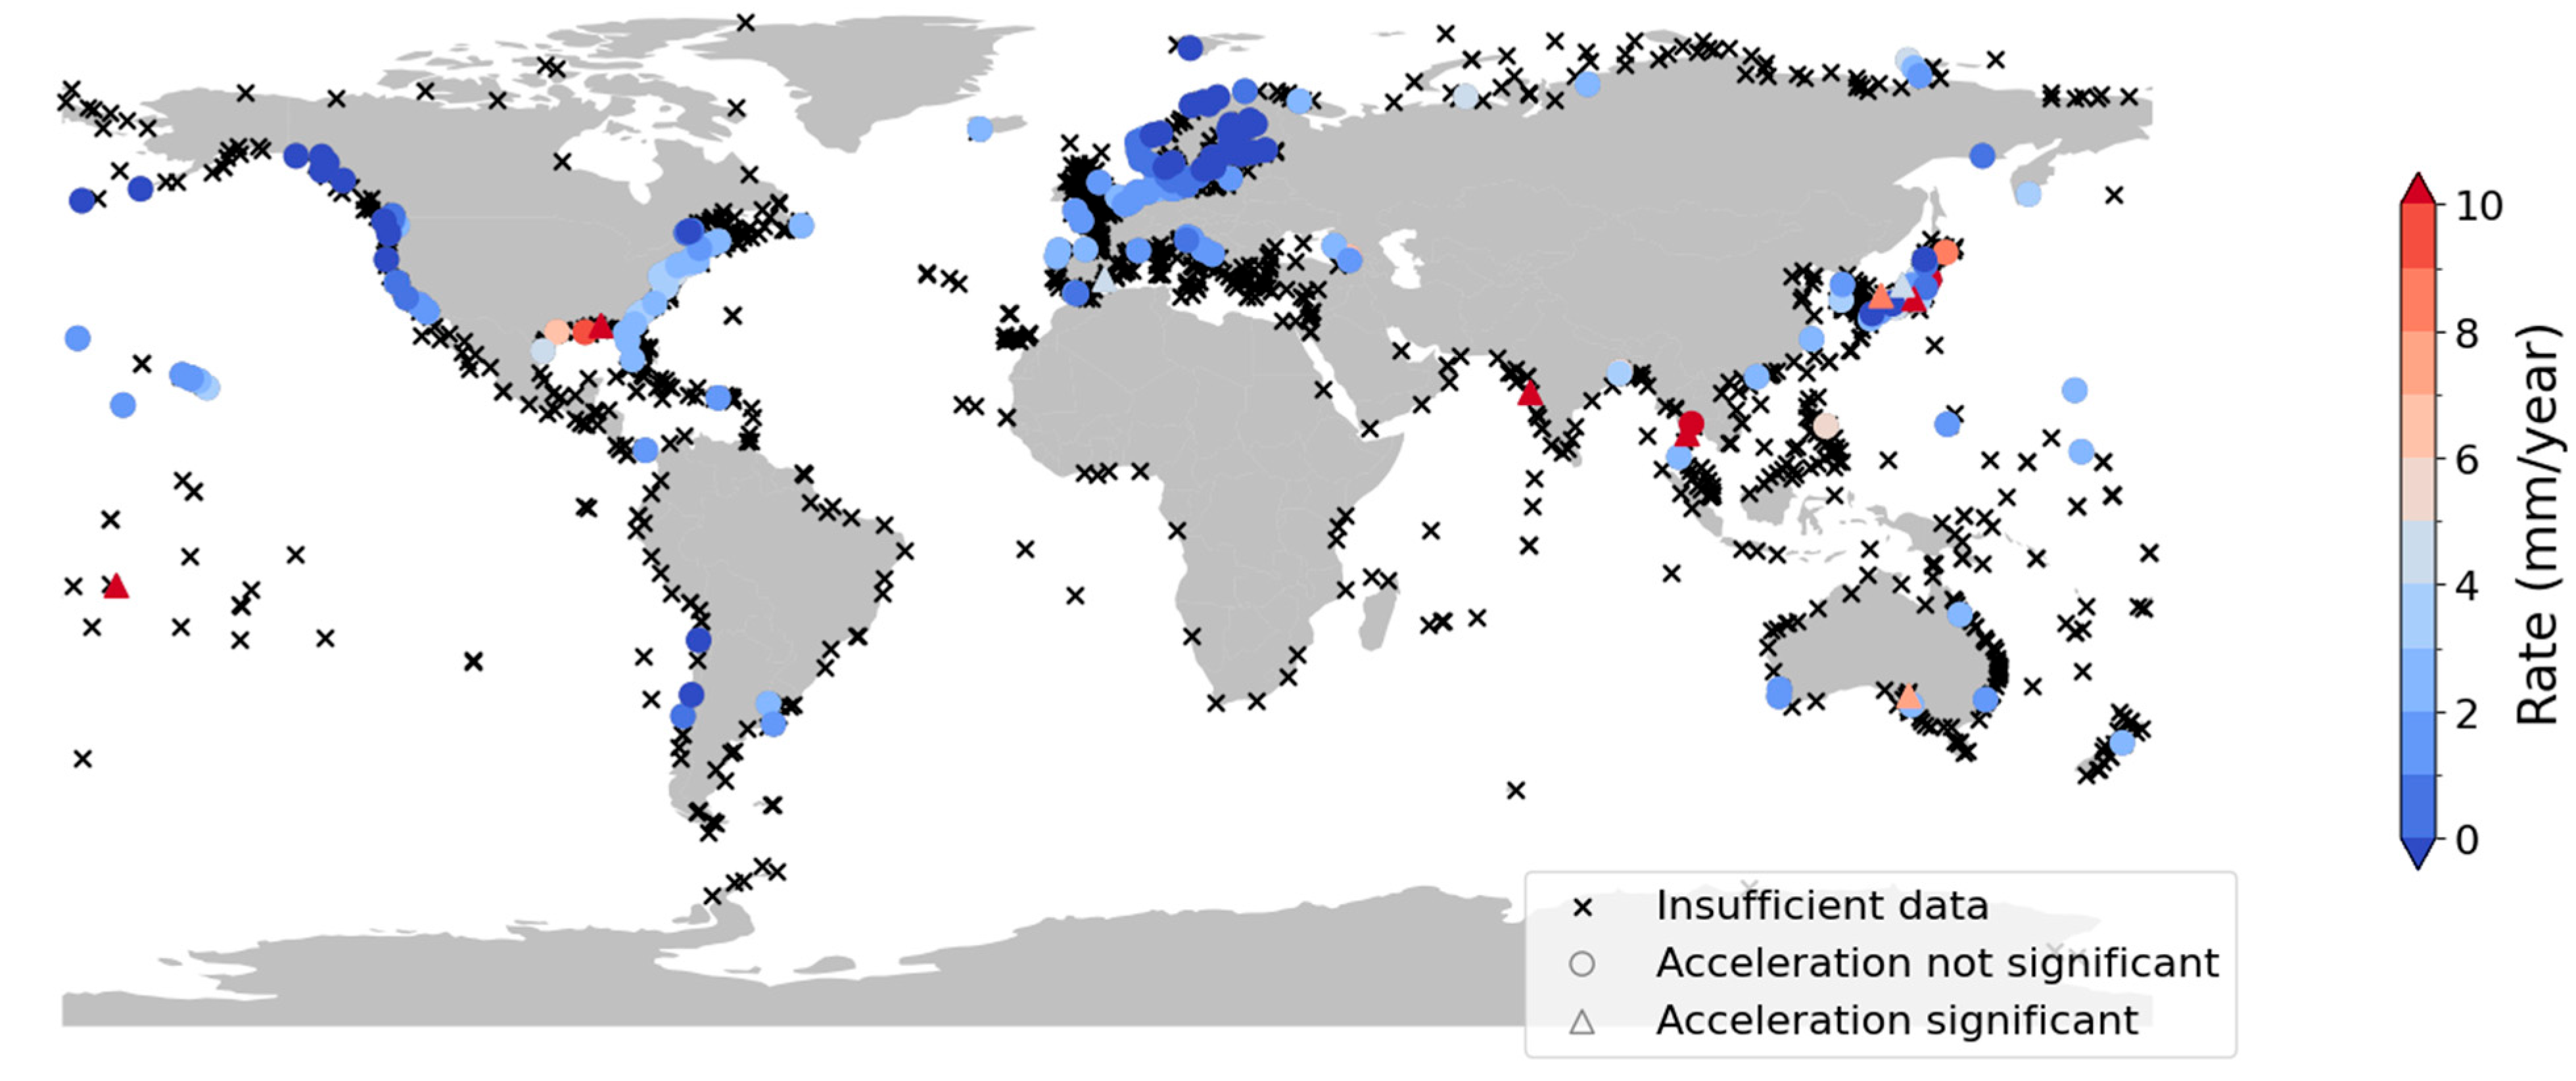
Locations with insufficient data are shown as black crosses, and stations with sufficient data (selected stations) are shown with colored symbols indicating the empirical long-term rate of sea level rise. Selected stations are mostly found in the Northern Hemisphere. Clusters are found in North America (both coasts), Europe (Atlantic coast, North Sea, and Baltic), and around Japan. This uneven distribution of observations was found previously by Woodworth et al. [64] and Jevrejeva et al. [103].
In nine locations (or 4% of the selected locations), the acceleration is statistically significant. These locations are shown as an upward-pointing triangle. Locations where acceleration is not statistically significant are shown as filled circles. Statistically significant acceleration is found in a cluster in Japan and in solitary locations in Spain, Thailand, India, Australia, and the Pacific. Stations with acceleration are often found in close proximity to stations without acceleration.
The distribution of the rates of rise is shown in Figure 4. Where acceleration is significant, the rate is derived from the full model. Otherwise, it is derived from the reduced model. The long-term rate of sea level rise is mild for the majority of locations, with rates of rise less than 5 mm per year. Clusters of negative rates are found in the Baltic and along the West Coast of Canada. High rates of rise (up to 10 mm per year) are found in one location in the Pacific, in the United States along the coast of the Gulf Coast, on the West Coast of India, in Japan, in Thailand, and in Australia. High rates are often found in close proximity of stations with much lower rates, suggesting a local phenomenon affecting the observed rise. The mean rate of sea level rise is 1.4 mm/year, and the median is 1.5 mm/year. Ninety percent of the rates lie between −5.9 mm/year and 6.8 mm/year.

4.2. GLOSS Data

The GLOSS core network consists of 294 locations, of which 245 (83%) have data available. Yearly sea levels were established from the hourly data using the methods outlined in Section 3.1. Of the 245 locations, 39 (16%) suffice the selection criteria and are analyzed. Figure 5 shows the results.
Again, locations with insufficient data are shown as crosses, and stations with sufficient data (selected stations) are shown with colored symbols. The geographical distribution of the selected stations is highly unbalanced. Several parts of the world, such as Australia, the northeast of Latin America, East Asia, and virtually the whole of Africa, are not covered. In three locations of the GLOSS network (8%), the acceleration is statistically significant. Two in the Pacific Ocean and one in Latin America, shown with upward-pointing triangles.
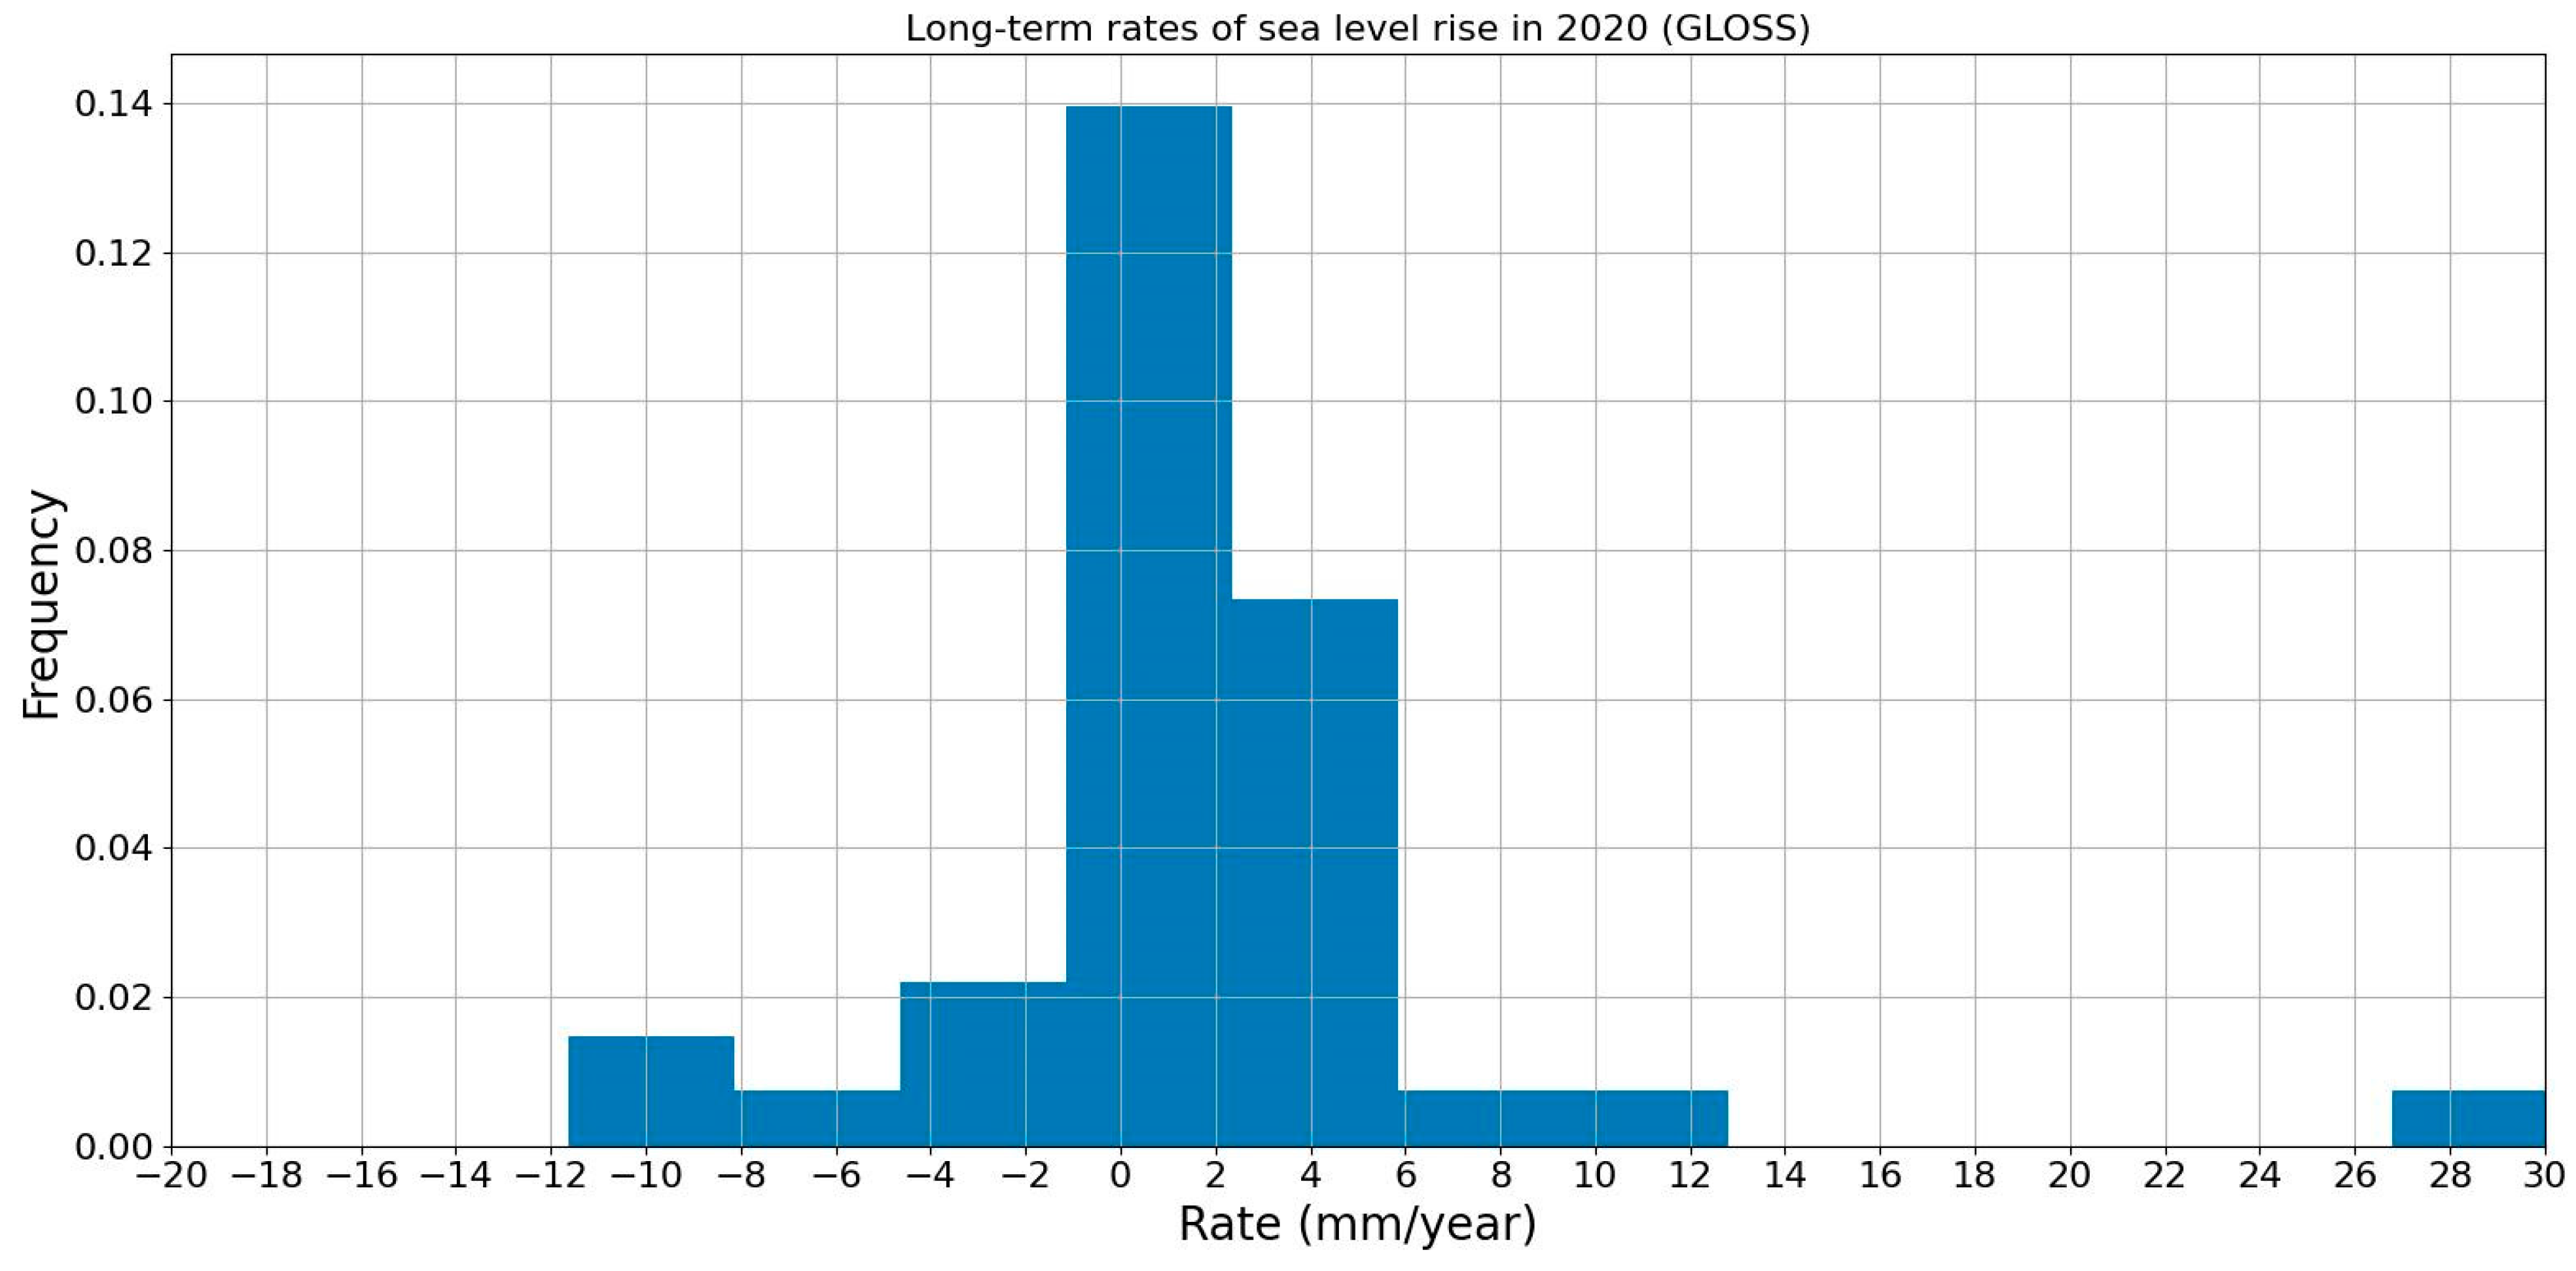
Figure 6 shows that the majority of locations have a rate of sea level rise of less than 5 mm per year. A minority of stations with much higher rates of rise are found in the Pacific and Latin America, coinciding with the locations showing an acceleration. The mean rate of sea level rise is 1.7 mm/year, and the median is 1.9 mm/year. Ninety percent of the rates lie between −7.4 mm/year and 8.5 mm/year.

4.3. Comparison of GLOSS and PSMSL

We find 28 stations available in both GLOSS and PSMSL. We compare the median rate of sea level rise in 2020, resulting from the two data sources in Figure 7.
The long-term rates are generally in good agreement. Stations are labeled with their name if the absolute difference between the two sets is larger than 1 mm/year. Absolute differences exceeding 1 mm/year occur on three locations in the Pacific and one in the Gulf of Mexico. The differences are due to differences in the underlying data. For Midway Island, PSMSL misses a portion of data in the late 1970s and early 1980s. In Honolulu, the GLOSS set appears to suffer from data quality issues in the late 1800s and between 1975 and 1985 with systematically lower readings compared to adjacent years. Pensacola and Pago Pago are analyzed further in Section 5.
The present study treats the available datasets separately. No attempt was made to resolve the differences found between PSMSL and GLOSS.

4.4. Comparison of Rate of Sea Level Rise in PSMSL and IPCC

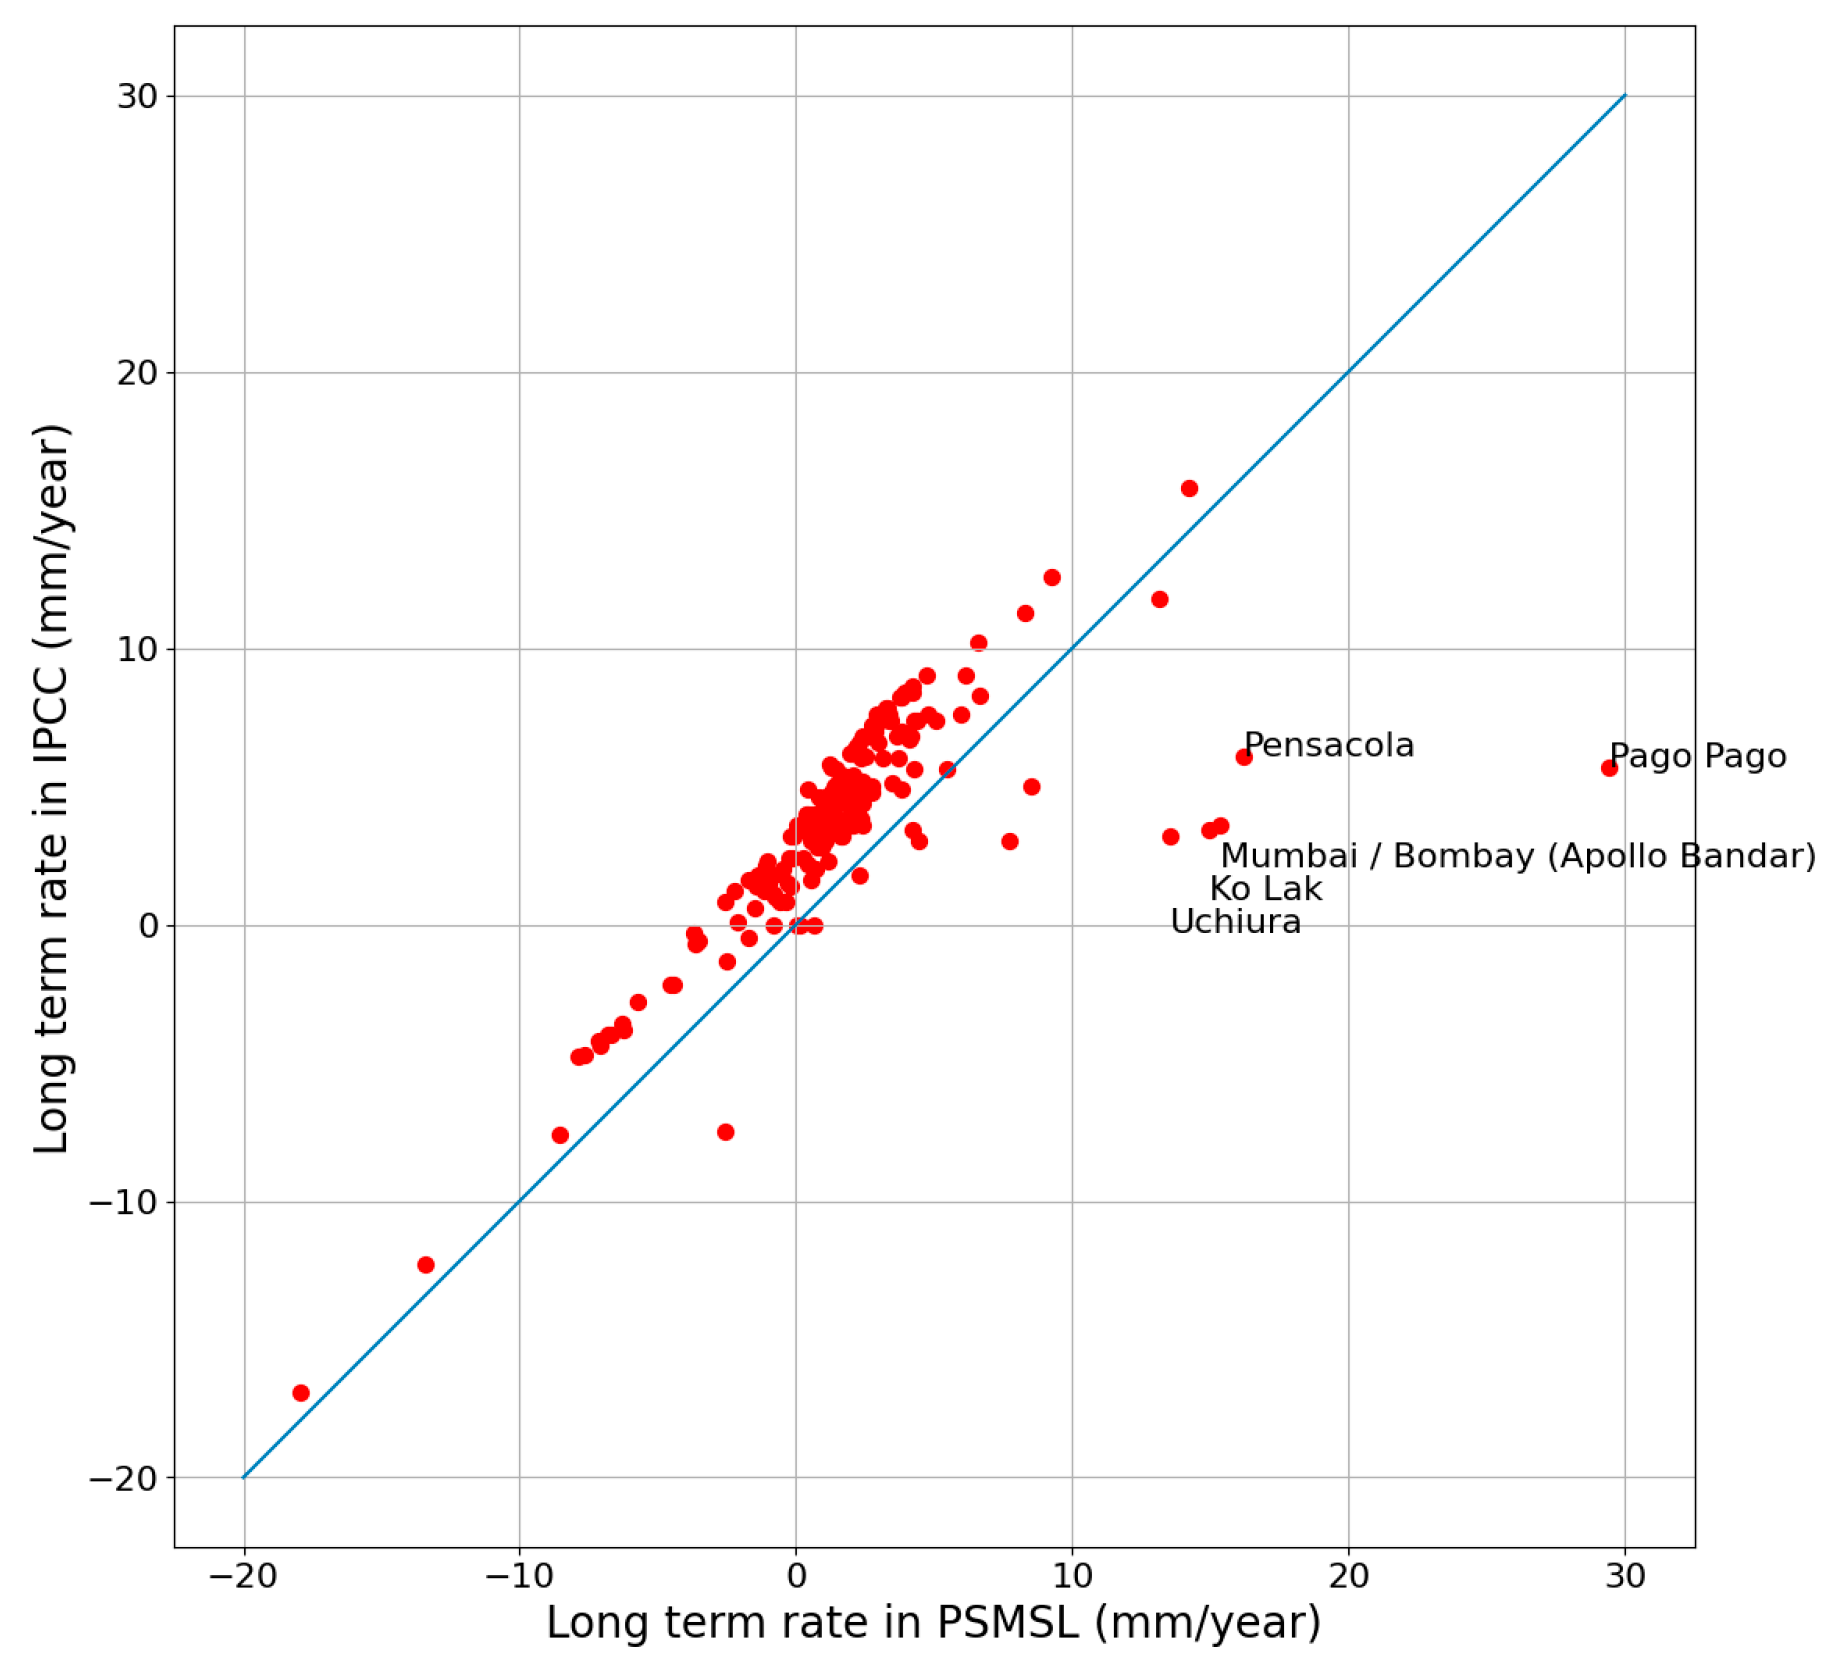
Figure 8 shows the comparison of the median rate of sea level rise in 2020 given by the IPCC compared to the median–long-term rate derived from the PSMSL data. The graph shows the empirical rate of sea level rise in 2020 derived from PSMSL data as described in Section 4, on the horizontal axis. The vertical axis shows the rate of rise in 2020 as given in the Sea Level Projection Tool [10].
Every point in Figure 8 is a location, plotted at the position corresponding to the median empirical rate and the projected rate in 2020. In case of a perfect match, all points would lie on the blue straight line. Where the rate in the projections is higher than the empirical rate, the point is above the line; otherwise, it is below. The graph shows the majority of locations to be above the blue line, indicating that the rate of sea level rise in the projections is too high compared to the empirical rate. A small set of locations shows an empirical rate higher than the projected rate.
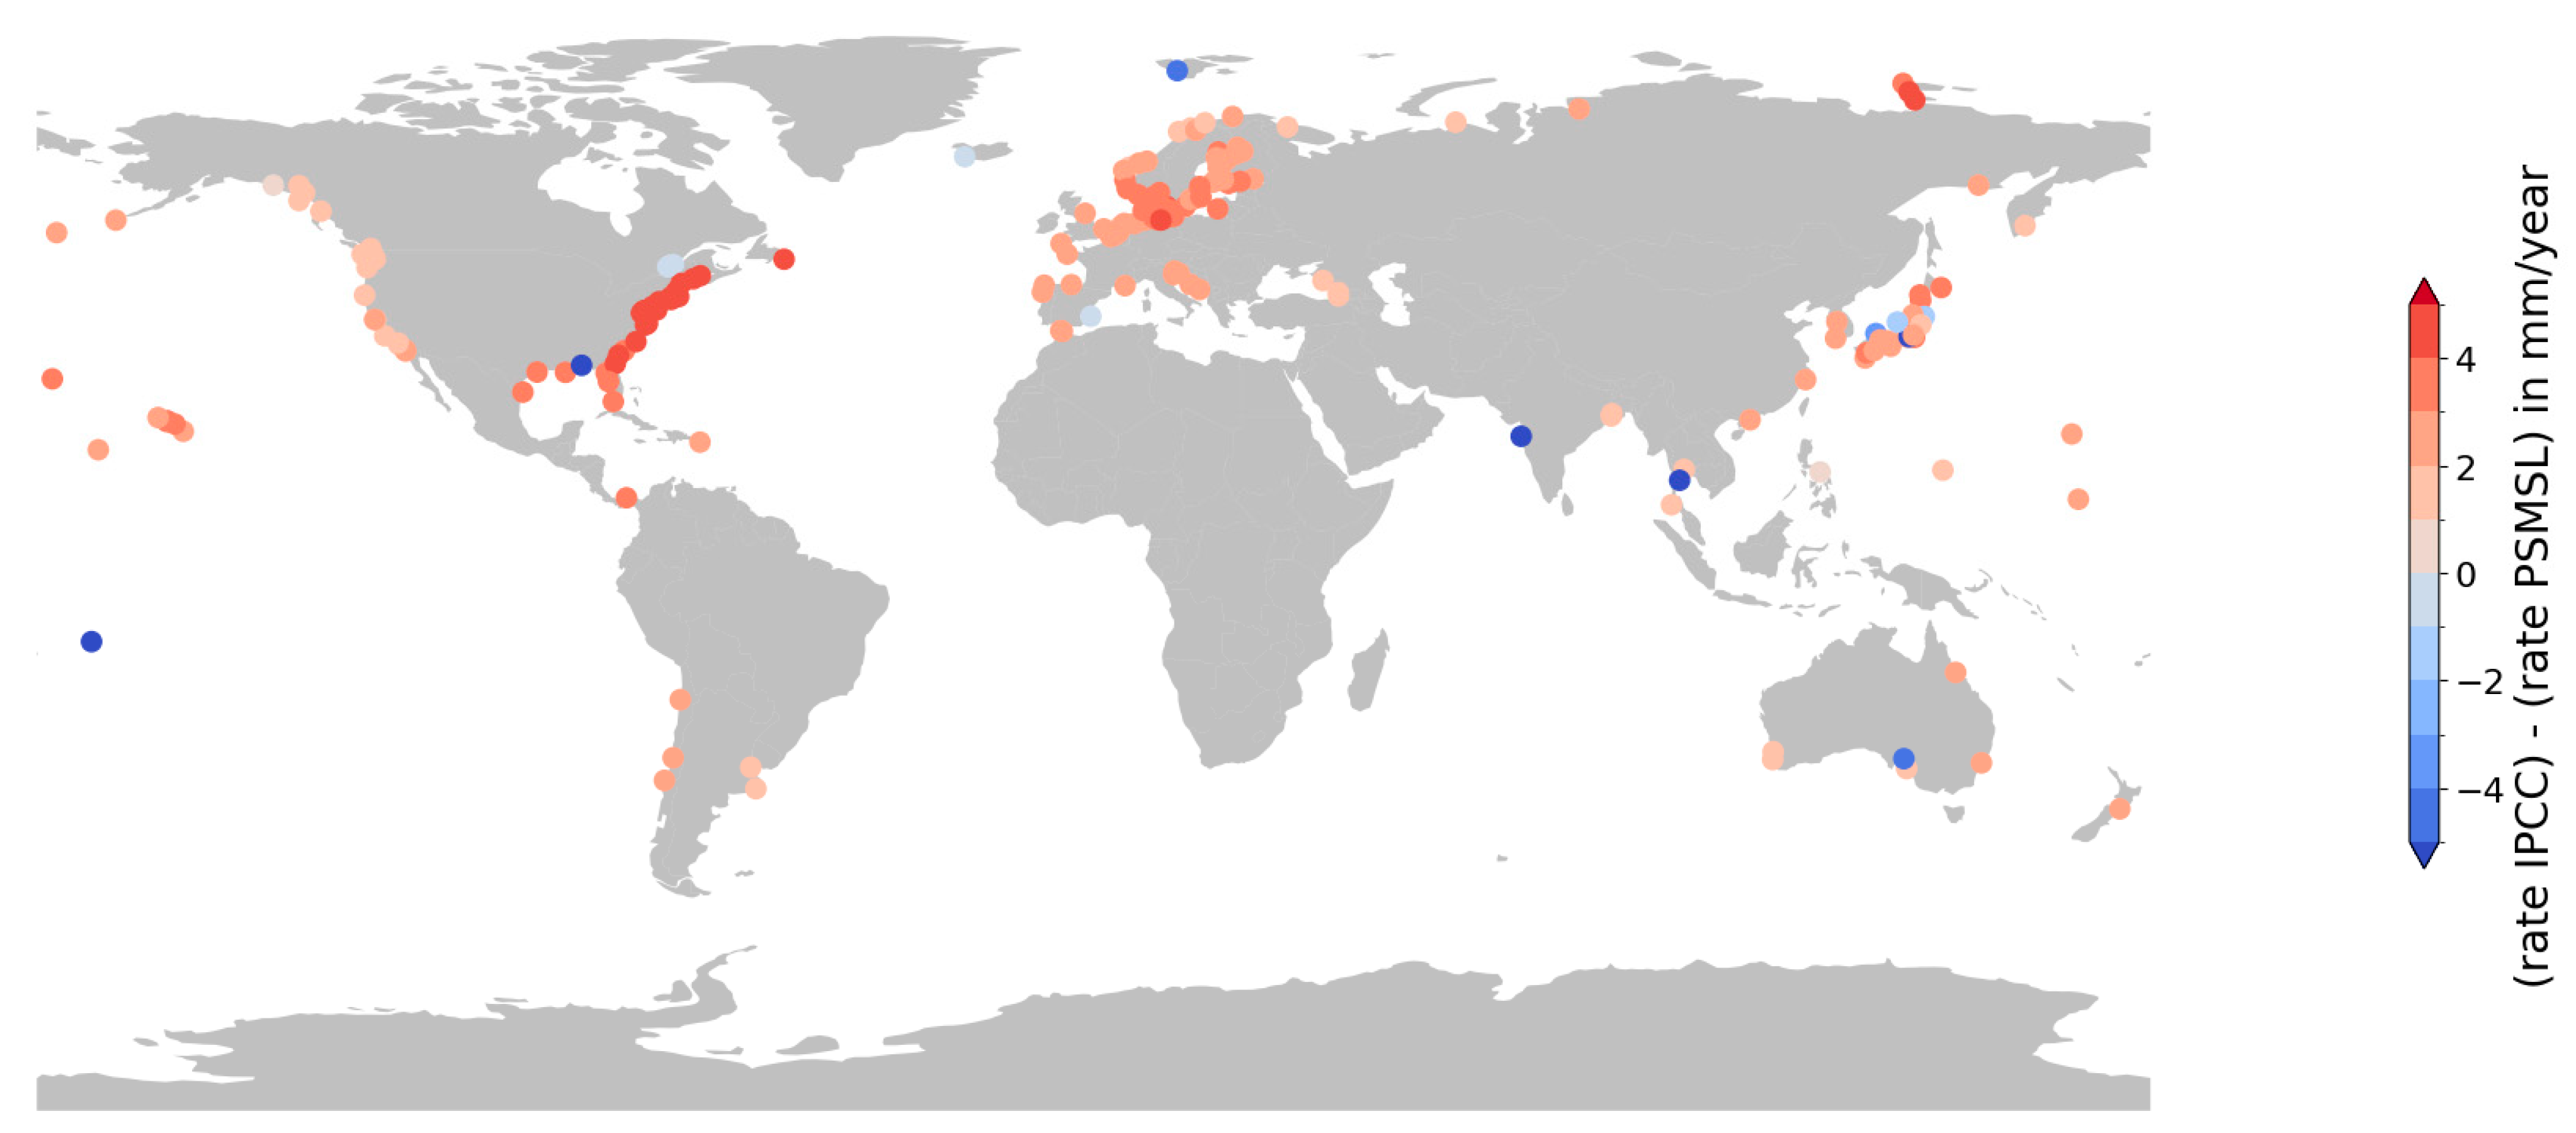
The difference between empirical and projected rate shows up in geographical clusters (Figure 9). The clusters around the North Sea/Baltic and around the Sea of Japan show a difference of the rate of rise between 1 mm/year and 3 mm/year; 2 mm/year on average. Along the Pacific coast of North America and the coast of Australia, the agreement between empirical and projected rate is better with overestimation limited to a maximum of 1 mm/year. On the other hand, the overestimation along the Atlantic coast of North America is 4 mm/year to 5 mm/year; the highest overestimation found anywhere. Data scarcity makes it impossible to draw any conclusions regarding the African coast and a large portion of the Asian coast. Also, along the Latin American coast, data are sparse. Isolated locations in the Pacific show the projections to overestimate the rate of rise with 2 mm/year to 3 mm/year. Underestimation does occur but is limited to a few isolated locations.

5. Discussion

The present study reveals a number of locations with a statistically significant acceleration, a very high rate of sea level rise, or both. A high rate or a statistically significant acceleration are considered the hallmark of sea level change driven by anthropogenic climate change, but other factors such as vertical land motions may be at play [104,105,106]. The differences in rate and acceleration are sometimes found over very short distances and this is puzzling. A selection of PSMSL locations was analysed in more detail in an attempt to obtain a better handle on the drivers of change revealed in the statistical procedure.
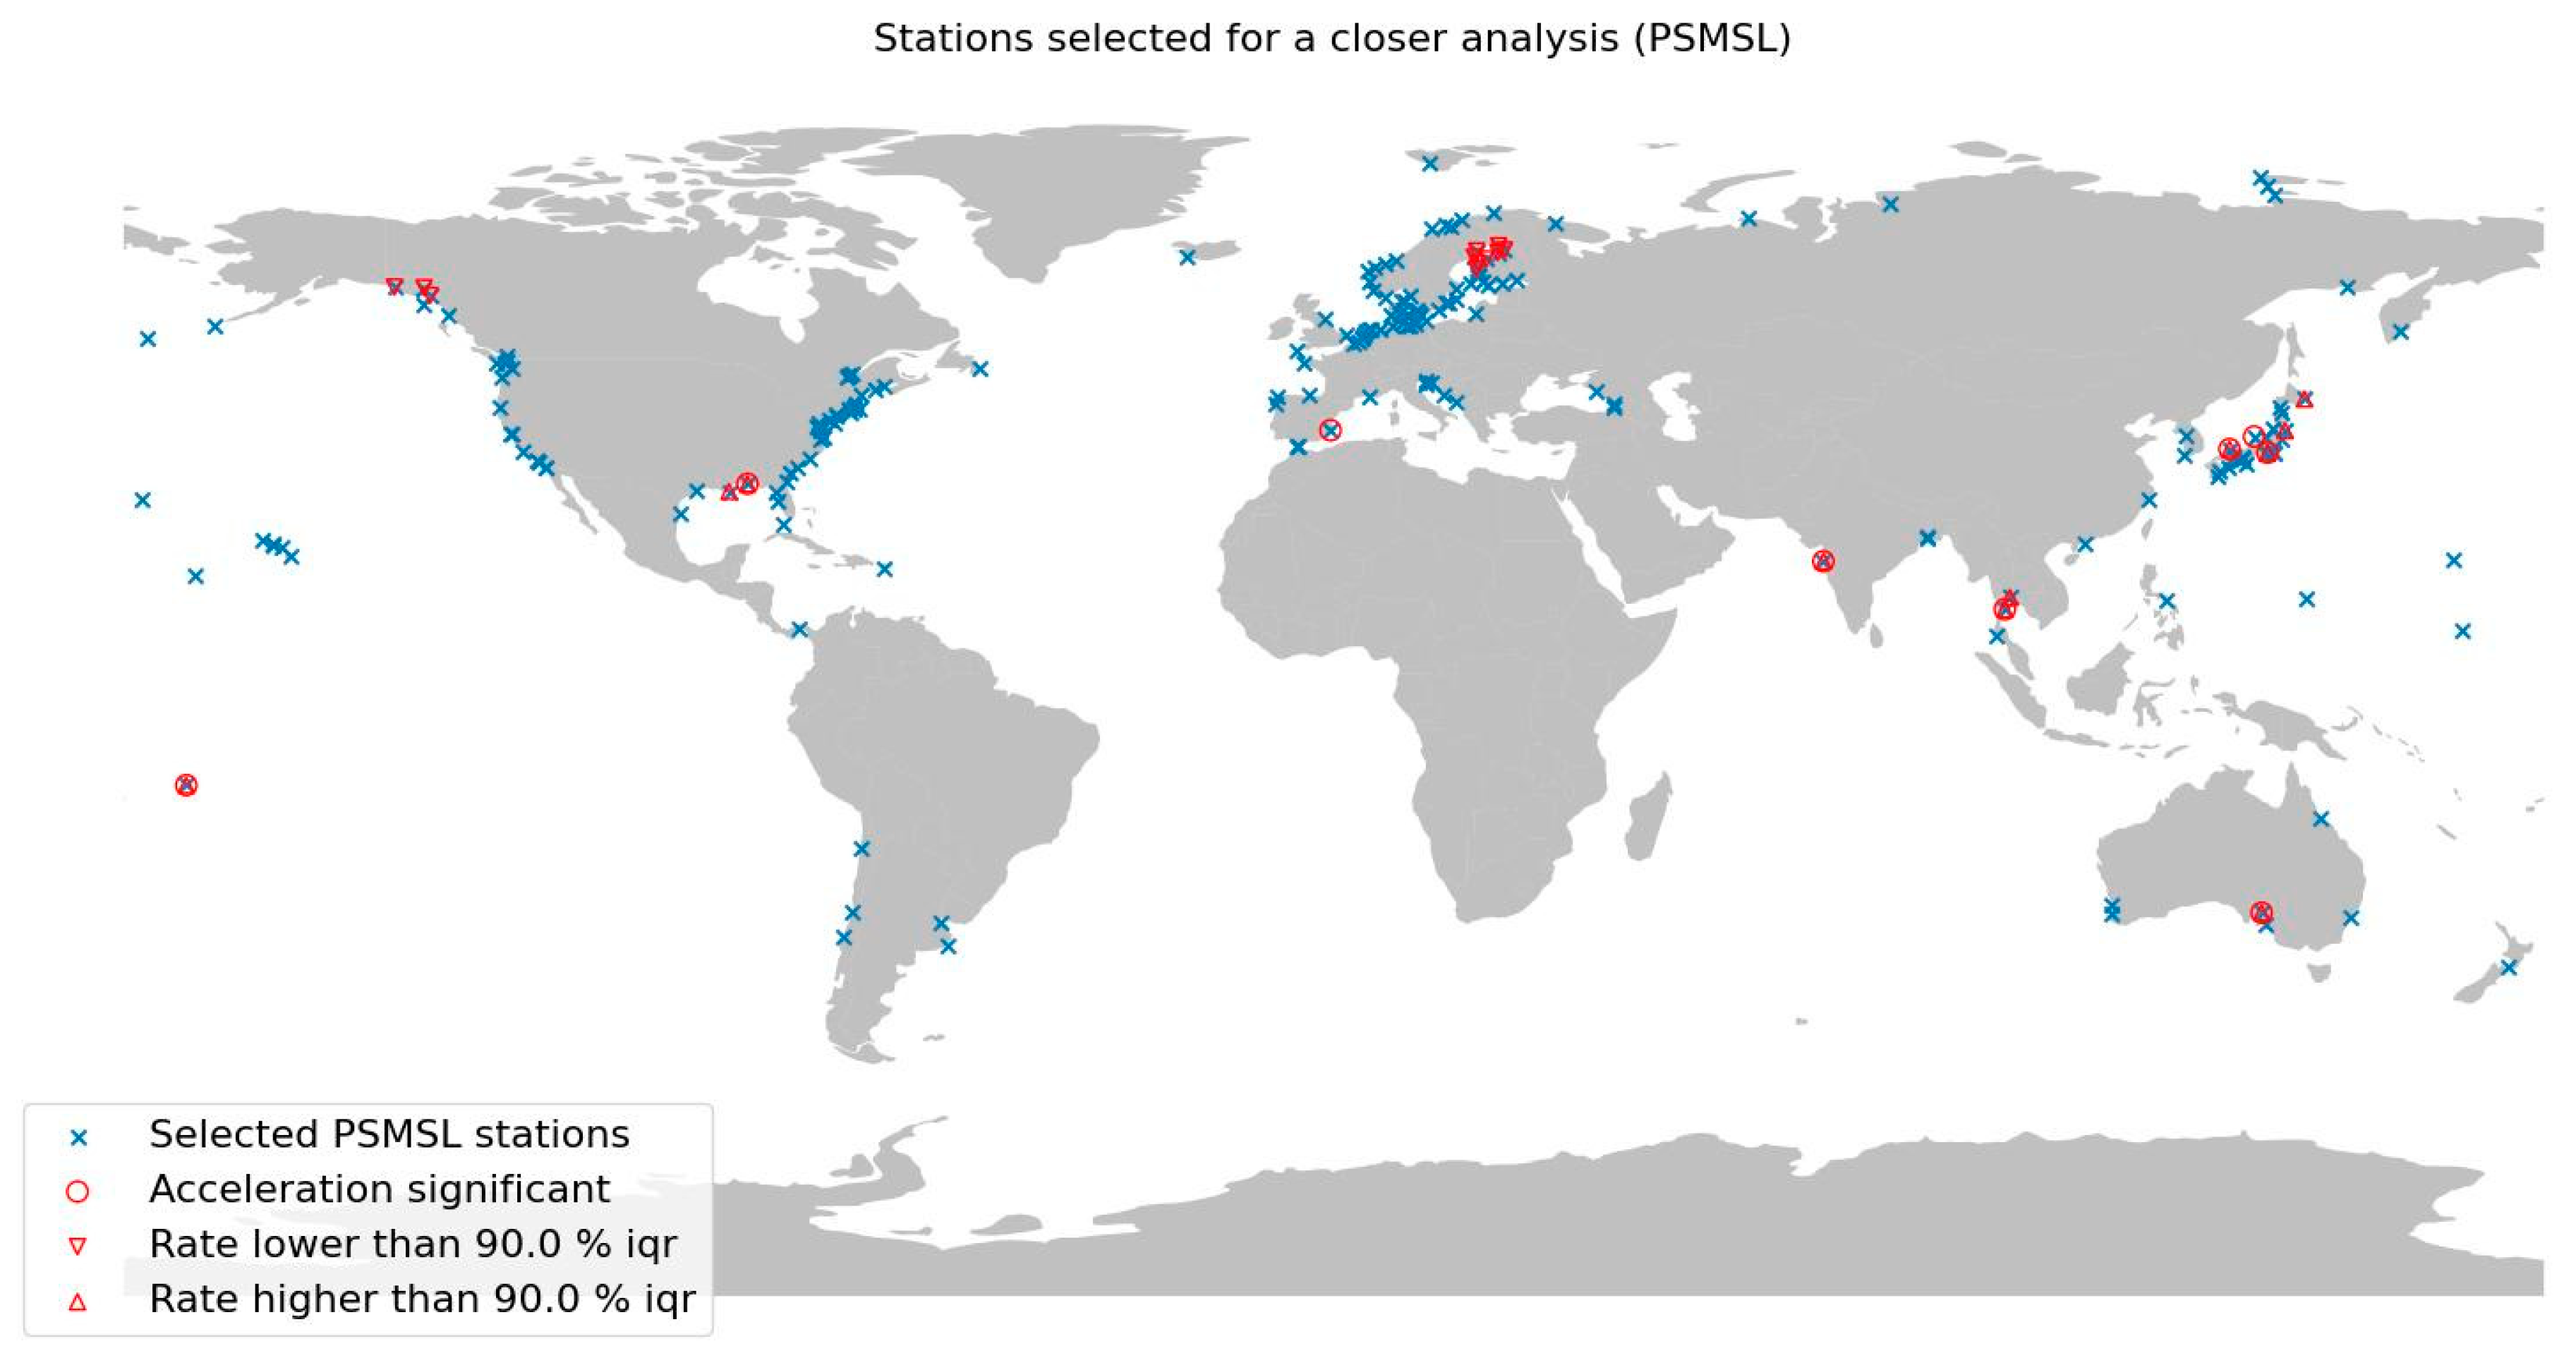
A rate of rise outside the 90% empirical inter-quantile range and/or a statistically significant acceleration was chosen as the threshold for a closer look at local drivers of sea level rise. The threshold was arbitrarily chosen, attempting to strike a balance between detail and workload. Under this threshold, 24 locations were selected for further analysis. This selection is denoted the “validation set” henceforward in view of brevity. The stations in the validation set turn up in geographical clusters (Figure 10 and Table 1).
The suggested cause of the local sea level signal is given in the last column of Table 1. Geological drivers are most frequently the probable cause of high rates of sea level change or of acceleration. Glacial Isostatic Adjustment or GIA is the process where the earth mantle is recovering from the presence of an iceshelf that has since disappeared [124]. The effect is rising land at the former ice sheet location and dropping land in the surroundings. The rapidly dropping sea level around the Baltic Sea is consistent with a known rise of the area as a consequence of GIA [117]. Similar processes lead to dropping sea levels in Alaska. Geological investigations show that, here, GIA is combined with a rise on a shorter timescale, which is assumed to be a response to the little ice age of approximately 1600 to approximately 1800 [107,108]. GIA is a gradual process and accelerations detectable on a human timescale are not caused by it. No acceleration is detected on all locations impacted by GIA only.
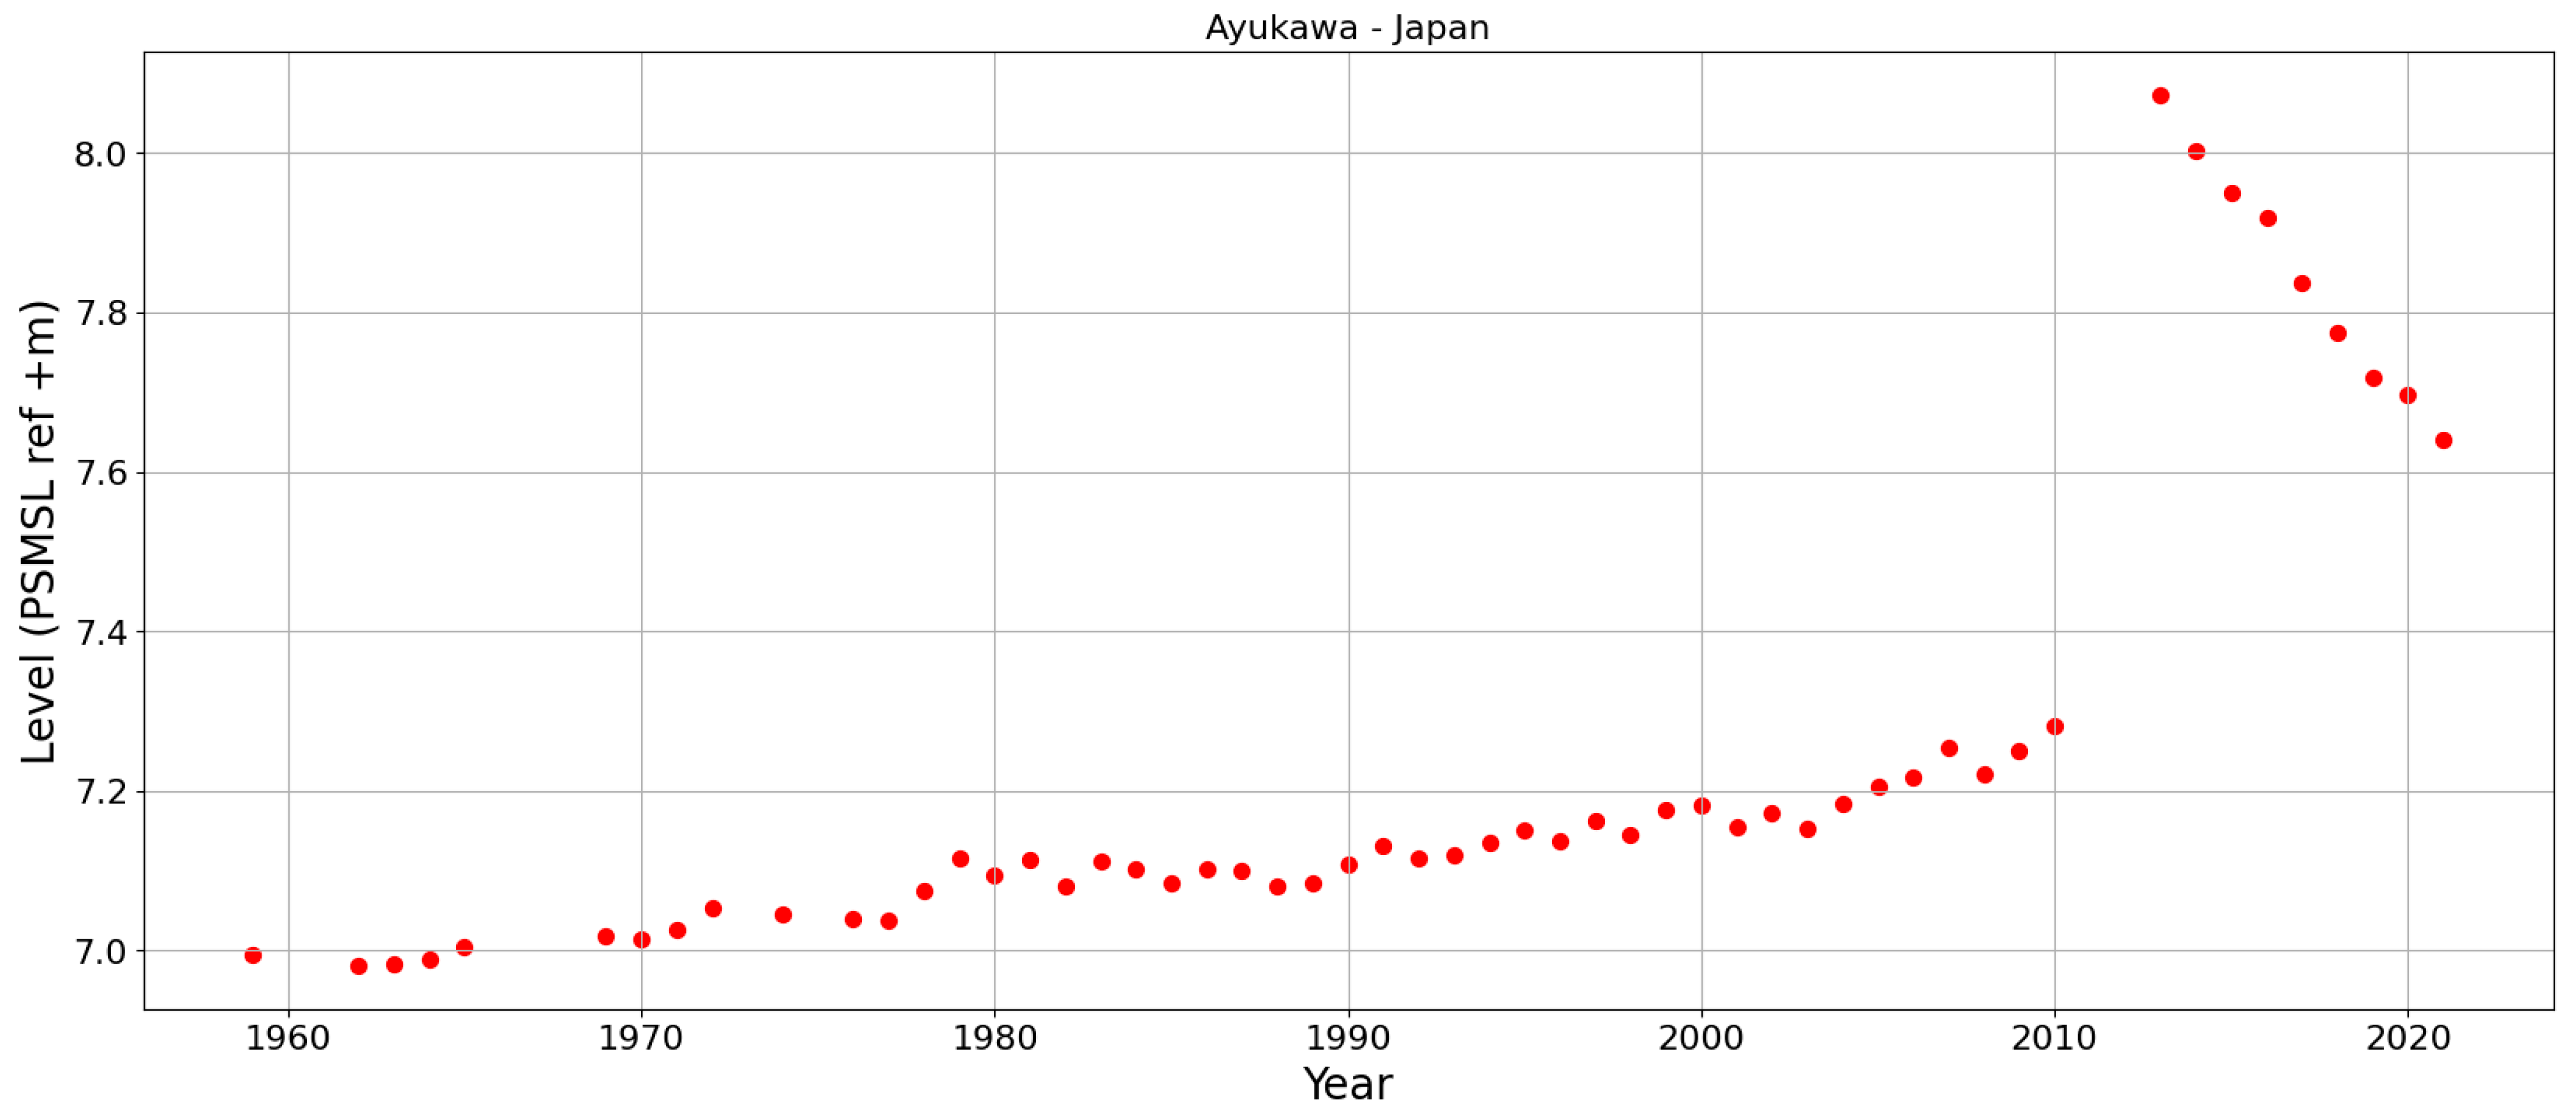
Plate tectonics causes earthquakes and volcanism, which causes uplift and subsidence, both gradual and sudden [111,112,123,125] and the accelerations from these processes can be detectable on a human timescale. Clear effects of tectonics are found in the cluster Japan [111,112] and at the single station of Pago Pago on Samoa [116]. An example is Ayukawa, a tide station only 100 km away from the Tohoku earthquake of 2011 (Figure 11). This station dropped suddenly over 80 cm, shown as a sudden increase of sea level. In the aftermath of the earthquake, the trend of the local sea level is reversed and its absolute value increased, indicating that locally the Earth’s crust is recovering from the event of 2011 [112].
Two locations at the Gulf Coast are in the validation set. The Gulf is a geologically highly complex area, characterized by a strong negative vertical land motion. Yuill et al. [113] concluded that the land motion in this area has multiple causes. Glacial Isostatic Adjustment (GIA) leads to sinking land levels. Large areas here consist of soft soils, naturally vulnerable to subsidence [115]. Compaction due to loading of the terrain (by buildings), ground water retrieval, and mineral extraction all contribute to subsidence of this type of areas.
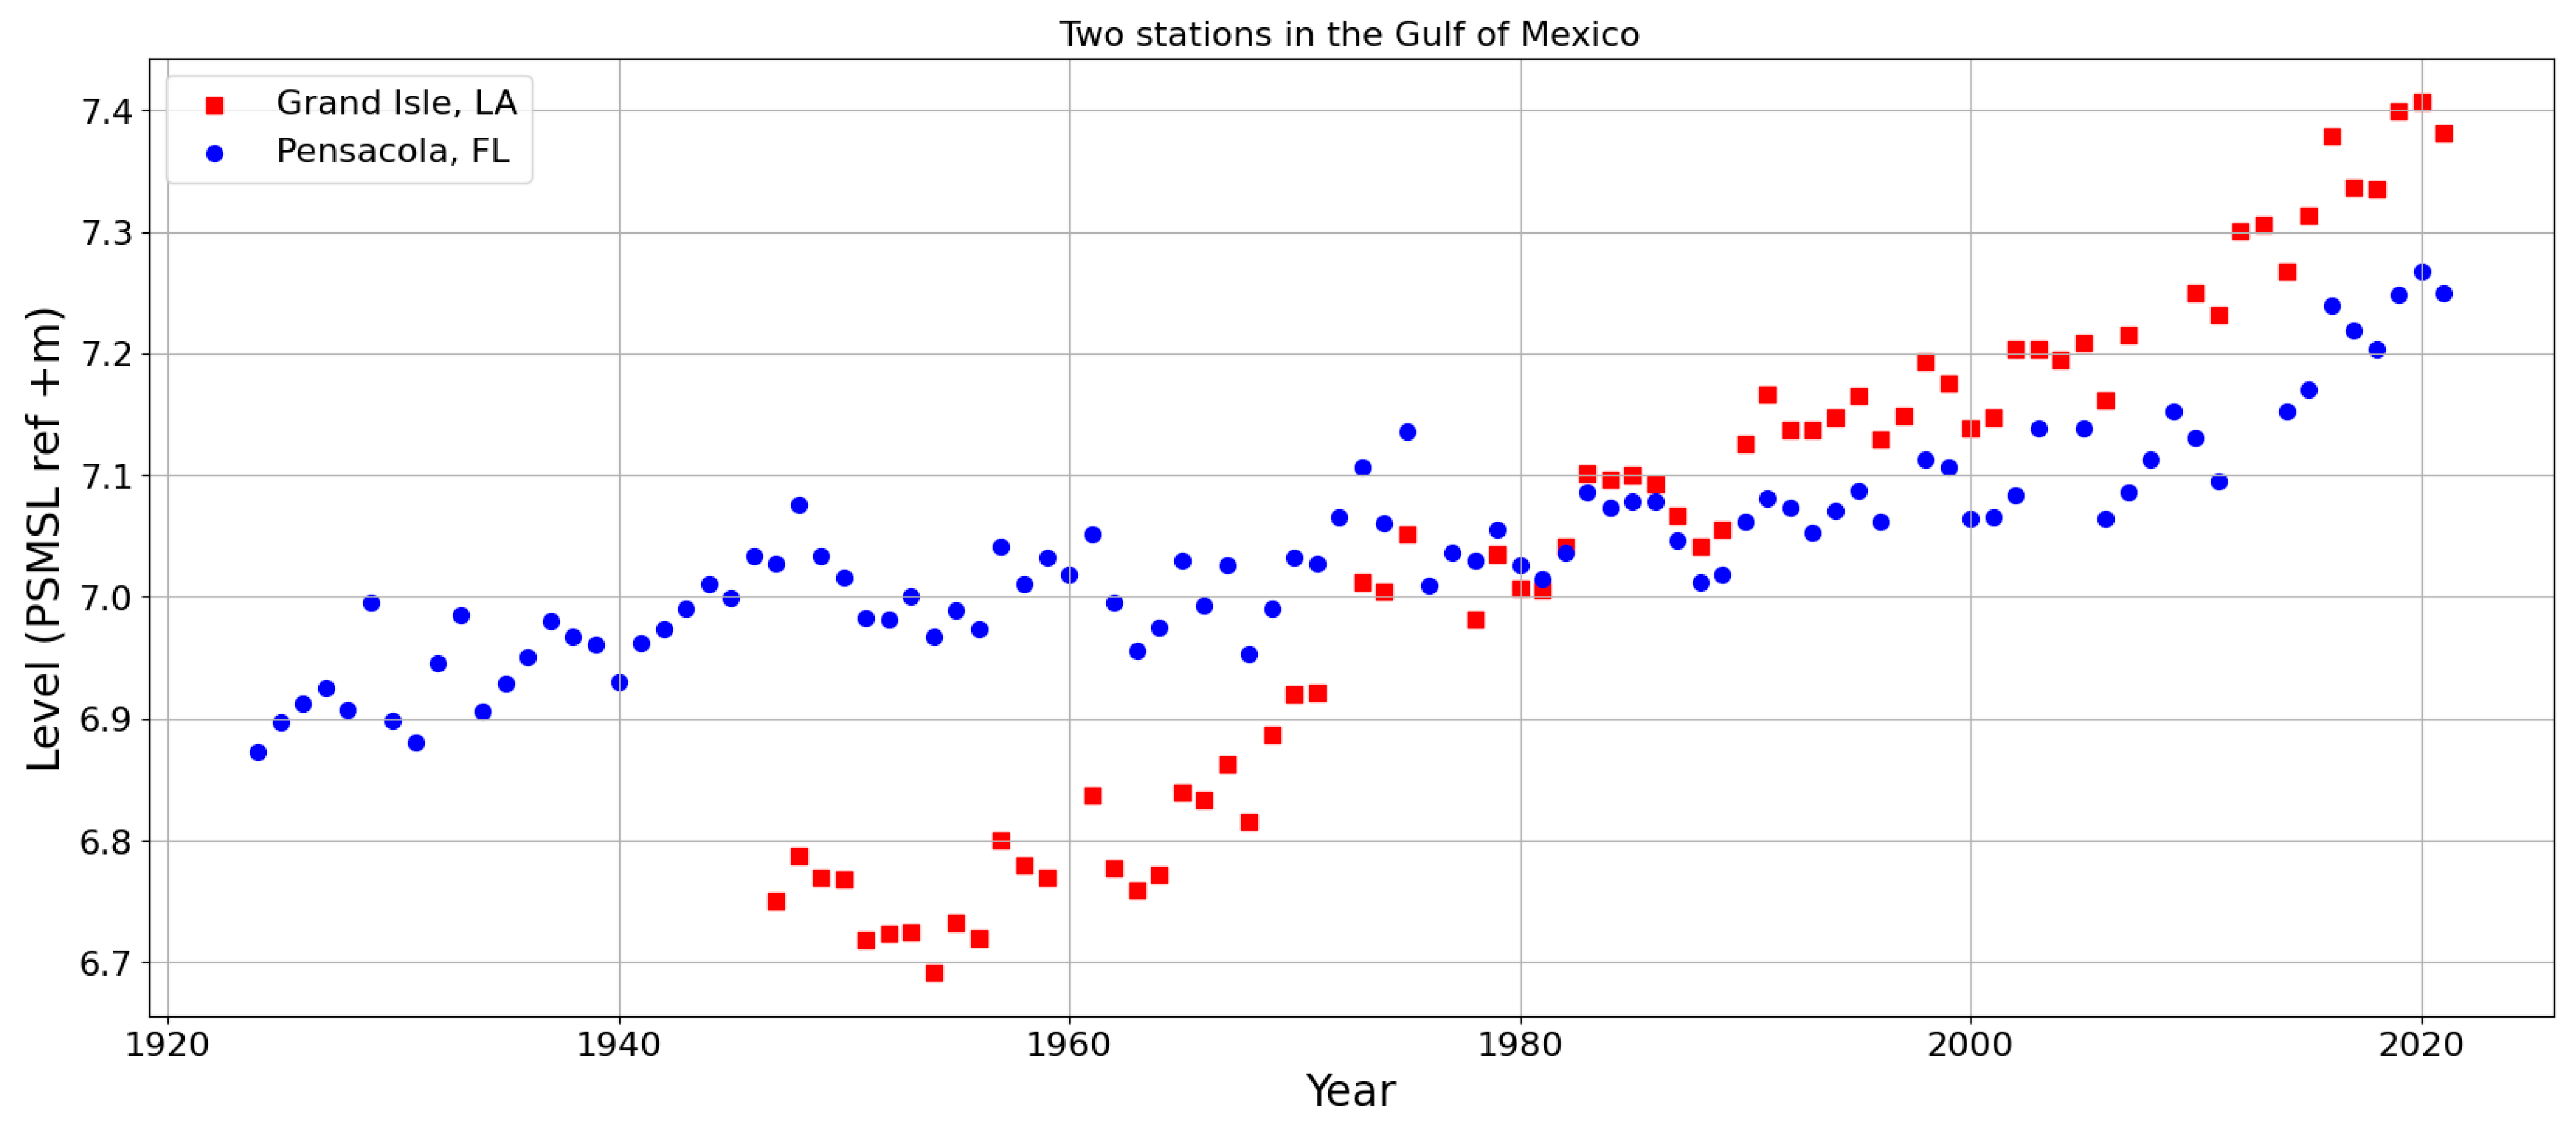
The two sites in this cluster, Pensacola and Grand Isle, are close together (300 km) and are both at the Gulf Coast. When driven by global causes, the pattern of sea level rise is expected to be similar. But instead, the observed sea levels are very different at the two sites (Figure 12).
Grand Isle shows rapid rise in the periods 1960–1980 and from 2010. Pensacola only shows a rapid rise from 2010 onwards. Grand Isle accelerates twice, around 1960 and around 2010. The regression model (Section 3.2) is a mathematical description of the contemporary consensus on the effect of climate on the rate of sea level rise. The model, therefore, assumes the acceleration to occur once and between 1960 and 1995. The double acceleration at Grand Isle is not expected and, therefore, not identified in the analysis.
The increased rate of rise from 2010 is present at both Grand Isle and Pensacola. Dangendorf et al. [126] suggest that Rossby waves, originating from the Caribbean Sea, are responsible for periods of rapid sea level rise in Pensacola. The Rossby waves explain the rapid rise from 2010, but also earlier periods of rapid rise in the 1940s and the 1970s [126]. Since Grand Isle is close to Pensacola and Rossby waves are a large-scale phenomenon [78], we expect to find similar peaks in Grand Isle. And indeed, inspection of Figure 12 suggests that the two locations show synchronous peaks of sea level. But the large difference between 1960 and 1980 suggests that some local phenomena are also at play. Grand Isle is part of the Mississippi River system of which the sediment load is enormous [113]. Large sediment load is known to be a cause of land motion [114]. Rivers with a much smaller catchment area enter the Pensacola bay, and it is, therefore, reasonable to assume that the sediment load in Pensacola is much smaller than in Grand Isle, which could explain the difference in sea level trend.
Subsidence of soft soils are also probable causes for the sea level rates in Mumbai (India). But in Mumbai the cause of the subsidence appears to be rapid urban development and increased extraction of ground water [109,110].
In Port Pirie, there is a jump in sea level around the year 2000 that detailed investigation revealed that the tide station in Port Pirie was renewed around 2000. The old analogue meter was replaced by a digital instrument, and the new station building was founded on a deeper soil layer than the old one (personal communication of Rob de Vos with mr. M. Davis, Australian Bureau of Meteorology and prof. em. N. Harvey, University of Adelaide).
The response of the sea level in the Mediterranean to variations in atmospheric pressure was investigated by Tsimplis et al. [118]. Tsimplis suggests that the North Atlantic Oscillation (NAO) is responsible for observed variations of sea level in this area. This phenomenon is missing in the regression models (Section 3.2) and, therefore, the statistical test identifies the sea level in Alicante 2 as accelerating.
The data of the two Thai stations suggest a jump that the statistical test picks up as a high rate and, in case of Ko Lak, an acceleration. The area is considered geologically stable on time scales relevant for the present study. Jirapinyakul et al. and Taninpong et al. [122,123] investigated a number of tide stations in the Gulf of Thailand, none of which showed the pattern found at the two stations present in the PSMSL database.
Station Fort Phrachula Chomklao is located in the delta south of Bangkok. The sharp increase in sea level rise from the 1960s appears mainly due to large-scale groundwater withdrawals because of Bangkok’s greatly increased demand for water [119,120,121]. The excessive groundwater extraction rates were caused by a growing demand for water for the growing population and the industrial sector.
Despite several attempts, the present study was unable to explain the patterns of sea level rise at the second station in Thailand, Ko Lak. The PSMSL website itself suggests data quality issues on the site. Lacking further information, the causes of the present findings remain unclear at this site.

6. Conclusions

The present study uses a statistical procedure to analyze the local rate and acceleration of sea level rise in 2020. A regression model, including acceleration and multi-year tides, was fitted to locally observed sea level data. The statistical significance of the accelerated rate of rise was tested with an F-test. The procedure was applied to local sea level data obtained from two separate sources.
Data series of sufficient length (the study used 60 years as a minimum) and running up to (or close to) 2020 are required to estimate the rate and acceleration in 2020. Less than 20% of the data in both PSMSL and GLOSS was found to meet these criteria. Available data show a very uneven distribution across the globe leaving some continents even completely void of sea level information.
The statistical procedure detects accelerating sea level rise in a few isolated locations. This pattern is inconsistent with sea level acceleration driven by global phenomena. Further investigation of a subset of locations revealed that local phenomena are often a plausible explanation for the locally observed pattern of sea level rise. The majority of the local causes of rapid sea level rise (or drop) appear to be geologic. Tectonic motion explains sudden changes of sea level rise found in a few places. More gradual but rapid rise (or fall) of sea level is mostly caused by glacial isostatic adjustment and in a few isolated cases by an excessive sediment load. In a few cases, water extraction and loading of soft sediments by buildings explains the (changes of) the observed rate of sea level rise.
Empirically derived long-term rates of sea level rise in 2020 were in majority found to be in excess of the contemporary projected rates of rise. The current generation of projections can therefore be considered conservative. Lower rates were found only in locations where geological processes were suspected to heavily influence the sea level signal.
Practitioners using the projections should be aware of this fact and take their design decisions recognizing the conservatism in the projections. Ideally, practitioners conduct an analysis of locally observed sea levels to compare to the available projections. This paper shows that an empirical analysis of the present rate of sea level rise readily leads to early detection of conservatism in the projections. Such an analysis should be based on datasets of sufficient length (at least 60 years) and incorporate long-term tide signals in the regression model to prevent unwarranted detection of acceleration. A clear understanding of local conditions (geology, hydrology, and land use) is helpful to properly judge observed sea level changes.

Author Contributions

H.G.V.: Conceptualization, Methodology, Data acquisition, Data curation, Formal Analysis, Software, Writing—original draft, Writing—review and editing. R.D.V.: Investigation of local factors described in Section 5, review of drafts and final editing. All authors have read and agreed to the published version of the manuscript.

Funding

This research received no external funding.

Data Availability Statement

Methods and books of graphs for every dataset are available at https://github.com/HVEC-lab/Global_perspective_SLR. Raw sea level data are available on www.psmsl.org and https://uhslc.soest.hawaii.edu/erddap/ or from the first author upon request.

Acknowledgments

Hessel Voortman would like to thank N.H. Lewis for his support in the very early stages of this research endeavor and several valued colleagues and friends for the lively discussions and support. Both authors would like to thank the editors of JMSE for conducting a swift and honest review. Further, both authors would like to thank three anonymous reviewers who, with their fair and valid reviews, improved the quality of this manuscript.

Conflicts of Interest

Author Voortman is owner and managing director of Hessel Voortman Engineering Consultancy. The remaining authors declare that the research was conducted in the absence of any commercial or financial relationships that could be construed as a potential conflict of interest.

References

  1. Dutch Expertise Network on Flood Protection (ENW). Fundamentals of Flood Protection. Available online: https://www.enwinfo.nl/publish/pages/183541/grondslagenen-lowresspread3-v_3.pdf (accessed on 4 May 2023).
  2. UK Government Environment Agency. Flood Risk Assessments: Climate Change Allowances. Available online: https://www.gov.uk/guidance/flood-risk-assessments-climate-change-allowances (accessed on 4 May 2023).
  3. US Army Corps of Engineers. USACE Climate Action Plan. Available online: https://usace.contentdm.oclc.org/digital/collection/p16021coll11/id/5381 (accessed on 4 May 2023).
  4. Parker, A.; Ollier, C.D. Coastal Planning Should Be Based on Proven Sea Level Data. Ocean Coast. Manag. 2016, 124, 1–9. [Google Scholar] [CrossRef]
  5. Voortman, H.G.; Veendorp, M. Robust Flood Defences in a Changing Environment; Nishijima, K., Ed.; CRC Press: Boca Raton, FL, USA, 2011. [Google Scholar]
  6. Voortman, H.G.; Vrijling, J.K. Optimal Design of Flood Defence Systems in a Changing Climate. Heron 2004, 49, 75–94. [Google Scholar]
  7. Voortman, H.G.; Van der Kolk, H. Adaptive Design as an Answer to Climate Uncertainty. In Proceedings of the 22nd European Safety and Reliability Conference ESREL, Amsterdam, The Netherlands, 29 September–2 October 2013; pp. 3303–3309. [Google Scholar]
  8. Kopp, R.E.; Garner, G.G.; Hermans, T.H.J.; Jha, S.; Kumar, P.; Reedy, A.; Slangen, A.B.A.; Turilli, M.; Edwards, T.L.; Gregory, J.M.; et al. The Framework for Assessing Changes To Sea-level (FACTS) v1.0: A platform for characterizing parametric and structural uncertainty in future global, relative, and extreme sea-level change. Geosci. Model Dev. 2023, 16, 7461–7489. [Google Scholar] [CrossRef]
  9. Fox-Kemper, B.; Hewitt, H.T.; Xiao, C.; Aðalgeirsdóttir, G.; Drijfhout, S.S.; Edwards, T.L.; Golledge, N.R.; Hemer, M.; Kopp, R.E.; Krinner, G.; et al. Ocean, Cryosphere, and Sea Level Change. In Climate Change 2021: The Physical Science Basis. Contribution of Working Group I to the Sixth Assessment Report of the Intergovernmental Panel on Climate Change; Masson-Delmotte, V., Zhai, P., Pirani, A., Connors, S.L., Péan, C., Berger, S., Caud, N., Chen, Y., Goldfarb, L., Gomis, M., et al., Eds.; Cambridge University Press: Cambridge, UK; New York, NY, USA, 2021; pp. 1211–1362. [Google Scholar]
  10. NASA. NASA Sea Level Projection Tool; NASA: Washington, DC, USA, 2023. [Google Scholar]
  11. Holgate, S.J.; Matthews, A.; Woodworth, P.L.; Rickards, L.J.; Tamisiea, M.E.; Bradshaw, E.; Foden, P.R.; Gordon, K.M.; Jevrejeva, S.; Pugh, J. New Data Systems and Products at the Permanent Service for Mean Sea Level. J. Coast. Res. 2013, 29, 493–504. [Google Scholar]
  12. Merrifield, M.; Aarup, T.; Allen, A.; Aman, A.; Caldwell, P.; Bradshaw, E.; Fernandes, R.M.S.; Hayashibara, H.; Hernandez, F.; Kilonsky, B. The Global Sea Level Observing System (GLOSS). In Proceedings of the OceanObs’09: Sustained Ocean Observations and Information for Society, Venice, Italy, 21–25 September 2009; Volume 2. [Google Scholar]
  13. Kopp, R.E.; Horton, R.M.; Little, C.M.; Mitrovica, J.X.; Oppenheimer, M.; Rasmussen, D.J.; Strauss, B.H.; Tebaldi, C. Probabilistic 21st and 22nd Century Sea-level Projections at a Global Network of Tide-gauge Sites. Earth’s Future 2014, 2, 383–406. [Google Scholar] [CrossRef]
  14. IPCC. AR5 Climate Change 2013: The Physical Science Basis; IPCC: Geneva, Switzerland, 2013. [Google Scholar]
  15. Oppenheimer, M.; Glavovic, B.C.; Hinkel, J.; Van de Wal, R.S.W.; Magnan, A.K.; Abd-Elgawad, A.; Cai, R.; Cifuentes-Jara, M.; DeConto, R.M.; Ghosh, T.; et al. Sea Level Rise and Implications for Low-Lying Islands, Coasts and Communities. In The Ocean and Cryosphere in a Changing Climate: Special Report of the Intergovernmental Panel on Climate Change; Cambridge University Press: Cambridge, UK, 2022; pp. 321–446. [Google Scholar]
  16. KNMI. KNMI Climate Scenarios 2014; KNMI: De Bilt, The Netherlands, 2014. [Google Scholar]
  17. Voortman, H.G. Robust Validation of Trends and Cycles in Sea Level and Tidal Amplitude in the Dutch North Sea. J. Coast. Hydraul. Struct. 2023, 3. [Google Scholar] [CrossRef]
  18. Keizer, I.; Le Bars, D.; De Valk, C.; Jüling, A.; Van de Wal, R.S.W.; Drijfhout, S.S. The Acceleration of Sea-Level Rise along the Coast of the Netherlands Started in the 1960s. Ocean Sci. 2023, 19, 991–1007. [Google Scholar] [CrossRef]
  19. Steffelbauer, D.B.; Riva, R.E.M.; Timmermans, J.S.; Kwakkel, J.H.; Bakker, M. Evidence of Regional Sea-Level Rise Acceleration for the North Sea. Environ. Res. Lett. 2022, 17, 074002. [Google Scholar] [CrossRef]
  20. Le Bars, D.; De Valk, C.; Keizer, I.; Jüling, A.; Van De Wal, R.S.W.; Drijfhout, S.; Lambert, E. Discussion on: Robust Validation of Trends and Cycles in Sea Level and Tidal Amplitude in the Dutch North Sea. J. Coast. Hydraul. Struct. 2025, 5. [Google Scholar] [CrossRef]
  21. Munk, W. Twentieth Century Sea Level: An Enigma. Proc. Natl. Acad. Sci. USA 2002, 99, 6550–6555. [Google Scholar] [CrossRef] [PubMed]
  22. Wahl, T. Sea-Level Rise and Storm Surges, Relationship Status: Complicated! Environ. Res. Lett. 2017, 12, 111001. [Google Scholar] [CrossRef]
  23. Church, J.A.; White, N.J.; Konikow, L.F.; Domingues, C.M.; Cogley, J.G.; Rignot, E.; Gregory, J.M.; Van den Broeke, M.R.; Monaghan, A.; Velicogna, I. Revisiting the Earth’s Sea-Level and Energy Budgets from 1961 to 2008. Geophys. Res. Lett. 2011, 38, L18601. [Google Scholar] [CrossRef]
  24. Dangendorf, S.; Hay, C.; Calafat, F.M.; Marcos, M.; Piecuch, C.G.; Berk, K.; Jensen, J. Persistent Acceleration in Global Sea-Level Rise since the 1960s. Nat. Clim. Chang. 2019, 9, 705–710. [Google Scholar] [CrossRef]
  25. Holgate, S.J.; Woodworth, P.L. Evidence for Enhanced Coastal Sea Level Rise during the 1990s. Geophys. Res. Lett. 2004, 31. [Google Scholar] [CrossRef]
  26. Mawdsley, R.J.; Haigh, I.D.; Wells, N.C. Global Secular Changes in Different Tidal High Water, Low Water and Ra Nge Levels. Earth’s Future 2015, 3, 66–81. [Google Scholar] [CrossRef]
  27. Mawdsley, R.J.; Haigh, I.D. Global Changes and Variability in Extreme Sea Levels from 1846–2014. Ph.D. Thesis, University of Southampton, Southampton, UK, 2016. [Google Scholar]
  28. Pan, H.; Lv, X. Is There a Quasi 60-Year Oscillation in Global Tides? Cont. Shelf Res. 2021, 222, 104433. [Google Scholar] [CrossRef]
  29. Rovere, A.; Stocchi, P.; Vacchi, M. Eustatic and Relative Sea Level Changes. Curr. Clim. Change Rep. 2016, 2, 221–231. [Google Scholar] [CrossRef]
  30. Woodworth, P.L. A World-wide Search for the 11-yr Solar Cycle in Mean Sea-level Records. Geophys. J. R. Astron. Soc. 1985, 80, 743–755. [Google Scholar] [CrossRef]
  31. Frederikse, T.; Landerer, F.; Caron, L.; Adhikari, S.; Parkes, D.; Humphrey, V.W.; Dangendorf, S.; Hogarth, P.; Zanna, L.; Cheng, L.; et al. The Causes of Sea-Level Rise since 1900. Nature 2020, 584, 393–397. [Google Scholar] [CrossRef]
  32. Amin, M. Changing Mean Sea Level and Tidal Constants on the West Coast of Australia. Mar. Freshw. Res. 1993, 44, 911–925. [Google Scholar] [CrossRef]
  33. Blaha, J.P. Fluctuations of Monthly Sea Level as Related to the Intensity of the Gulf Stream from Key West to Norfolk. J. Geophys. Res. Ocean. 1984, 89, 8033–8042. [Google Scholar] [CrossRef]
  34. Cazenave, A.; Moreira, L. Contemporary Sea-Level Changes from Global to Local Scales: A Review. Proc. R. Soc. A 2022, 478, 20220049. [Google Scholar] [CrossRef]
  35. Cherniawsky, J.Y.; Foreman, M.G.G.; Kang, S.K.; Scharroo, R.; Eert, A.J. 18.6-Year Lunar Nodal Tides from Altimeter Data. Cont. Shelf Res. 2010, 30, 575–587. [Google Scholar] [CrossRef]
  36. Dangendorf, S.; Calafat, F.M.; Arns, A.; Wahl, T.; Haigh, I.D.; Jensen, J. Mean Sea Level Variability in the North Sea: Processes and Implications. J. Geophys. Res. Ocean. 2014, 119, 6820–6841. [Google Scholar] [CrossRef]
  37. Dangendorf, S.; Frederikse, T.; Chafik, L.; Klinck, J.M.; Ezer, T.; Hamlington, B.D. Data-Driven Reconstruction Reveals Large-Scale Ocean Circulation Control on Coastal Sea Level. Nat. Clim. Change 2021, 11, 514–520. [Google Scholar] [CrossRef]
  38. Stolte, W.; Baart, F.; Muis, S.; Hijma, M.P.; Taal, M.; Le Bars, D.; Drijfhout, S. Zeespiegelmonitor 2022; Deltares: Delft, The Netherlands, 2023. [Google Scholar]
  39. Douglas, B.C. Global Sea Level Acceleration. J. Geophys. Res. Ocean. 1992, 97, 12699–12706. [Google Scholar] [CrossRef]
  40. Führböter, A. Changes of the Tidal Water Levels at the German North Sea Coast. Helgoländer Meeresunters. 1989, 43, 325–332. [Google Scholar] [CrossRef]
  41. Hagen, R.; Plüß, A.; Jänicke, L.; Freund, J.; Jensen, J.; Kösters, F. A Combined Modeling and Measurement Approach to Assess the Nodal Tide Modulation in the North Sea. J. Geophys. Res. Ocean. 2021, 126, e2020JC016364. [Google Scholar] [CrossRef]
  42. Hagen, R.; Winter, C.; Kösters, F. Changes in Tidal Asymmetry in the German Wadden Sea. Ocean Dyn. 2022, 72, 325–340. [Google Scholar] [CrossRef]
  43. Haigh, I.D.; Nicholls, R.J.; Wells, N. Assessing Changes in Extreme Sea Levels: Application to the English Channel, 1900–2006. Cont. Shelf Res. 2010, 30, 1042–1055. [Google Scholar] [CrossRef]
  44. Jänicke, L. Assessing Changes of Tidal Dynamics in the North Sea: An Investigation of the Temporal and Spatial Developments Between 1958 and 2014. 2022. Available online: https://agupubs.onlinelibrary.wiley.com/doi/full/10.1029/2020JC016456 (accessed on 9 May 2023).
  45. Jänicke, L.; Ebener, A.; Dangendorf, S.; Arns, A.; Schindelegger, M.; Niehüser, S.; Haigh, I.D.; Woodworth, P.L.; Jensen, J. Assessment of Tidal Range Changes in the North Sea From 1958 to 2014. J. Geophys. Res. Ocean. 2021, 126, e2020JC016456. [Google Scholar] [CrossRef]
  46. Le Bars, D.; De Vries, H.; Drijfhout, S. Sea Level Rise and Its Spatial Variations, KNMI-Report TR-372. 2019. Available online: https://www.knmi.nl/kennis-en-datacentrum/publicatie/sea-level-rise-and-its-spatial-variations (accessed on 15 August 2025).
  47. Parker, A. Oscillations of Sea Level Rise along the Atlantic Coast of North America North of Cape Hatteras. Nat. Hazards 2013, 65, 991–997. [Google Scholar] [CrossRef]
  48. Proudman, J.; Doodson, A.T. The Principal Constituent of the Tides of the North Sea. Philos. Trans. R. Soc. London. Ser. A Contain. Pap. A Math. Or Phys. 1924, 224, 185–219. [Google Scholar]
  49. Rasheed, A.S.; Chua, V.P. Secular Trends in Tidal Parameters along the Coast of Japan. Atmos.-Ocean 2014, 52, 155–168. [Google Scholar] [CrossRef]
  50. Ray, R.D. Secular Changes of the M2 Tide in the Gulf of Maine. Cont. Shelf Res. 2006, 26, 422–427. [Google Scholar] [CrossRef]
  51. Ray, R.D. On Seasonal Variability of the M 2 Tide. Ocean Sci. 2022, 18, 1073–1079. [Google Scholar] [CrossRef]
  52. Ray, R.D.; Merrifield, M.A. The Semiannual and 4.4-Year Modulations of Extreme High Tides. J. Geophys. Res. Ocean. 2019, 124, 5907–5922. [Google Scholar] [CrossRef]
  53. Ross, A.C.; Najjar, R.G.; Li, M.; Lee, S.B.; Zhang, F.; Liu, W. Fingerprints of Sea Level Rise on Changing Tides in the Chesapeake and Delaware Bays. J. Geophys. Res. Ocean. 2017, 122, 8102–8125. [Google Scholar] [CrossRef]
  54. Rossiter, J.R. An Analysis of Annual Sea Level Variations in European Waters. Geophys. J. Int. 1967, 12, 259–299. [Google Scholar] [CrossRef]
  55. Sallenger, A.H.; Doran, K.S.; Howd, P.A. Hotspot of Accelerated Sea-Level Rise on the Atlantic Coast of North America. Nat. Clim Change 2012, 2, 884–888. [Google Scholar] [CrossRef]
  56. Shaw, A.G.P.; Tsimplis, M.N. The 18.6 Yr Nodal Modulation in the Tides of Southern European Coasts. Cont. Shelf Res. 2010, 30, 138–151. [Google Scholar] [CrossRef]
  57. Sloss, C.R.; Murray-Wallace, C.V.; Jones, B.G. Holocene Sea-Level Change on the Southeast Coast of Australia: A Review. Holocene 2007, 17, 999–1014. [Google Scholar] [CrossRef]
  58. Stammer, D.; Cazenave, A.; Ponte, R.M.; Tamisiea, M.E. Causes for Contemporary Regional Sea Level Changes. Annu. Rev. Mar. Sci. 2012, 5, 21–46. [Google Scholar] [CrossRef]
  59. Torres, R.R.; Tsimplis, M.N. Tides and Long-Term Modulations in the Caribbean Sea. J. Geophys. Res. Ocean. 2011, 116, C10022. [Google Scholar] [CrossRef]
  60. Watson, P.J. Acceleration in US Mean Sea Level? A New Insight Using Improved Tools. J. Coast. Res. 2016, 32, 1247–1261. [Google Scholar] [CrossRef]
  61. Watson, P.J. Acceleration in European Mean Sea Level? A New Insight Using Improved Tools. J. Coast. Res. 2017, 33, 23–38. [Google Scholar] [CrossRef]
  62. Woodworth, P.L.; Shaw, S.M.; Blackman, D.L. Secular Trends in Mean Tidal Range around the British Isles and along the Adjacent European Coastline. Geophys. J. Int. 1991, 104, 593–609. [Google Scholar] [CrossRef]
  63. Woodworth, P.L.; Teferle, F.N.; Bingley, R.M.; Shennan, I.; Williams, S.D.P. Trends in UK Mean Sea Level Revisited. Geophys. J. Int. 2009, 176, 19–30. [Google Scholar] [CrossRef]
  64. Woodworth, P.L.; White, N.J.; Jevrejeva, S.; Holgate, S.J.; Church, J.A.; Gehrels, W.R. Evidence for the Accelerations of Sea Level on Multi-Decade and Century Timescales. Int. J. Climatol. A J. R. Meteorol. Soc. 2009, 29, 777–789. [Google Scholar] [CrossRef]
  65. Wöppelmann, G.; Pouvreau, N.; Simon, B. Brest Sea Level Record: A Time Series Construction Back to the Early Eighteenth Century. Ocean Dyn. 2006, 56, 487–497. [Google Scholar] [CrossRef]
  66. Church, J.A.; White, N.J.; Aarup, T.; Wilson, W.S.; Woodworth, P.L.; Domingues, C.M.; Hunter, J.R.; Lambeck, K. Understanding Global Sea Levels: Past, Present and Future. Sustain. Sci. 2008, 3, 9–22. [Google Scholar] [CrossRef]
  67. Church, J.A.; White, N.J. A 20th Century Acceleration in Global Sea-Level Rise. Geophys. Res. Lett. 2006, 33, 313–324. [Google Scholar] [CrossRef]
  68. Church, J.A.; White, N.J. Sea-Level Rise from the Late 19th to the Early 21st Century. Surv. Geophys. 2011, 32, 585–602. [Google Scholar] [CrossRef]
  69. Frederikse, T.; Riva, R.E.M.; Kleinherenbrink, M.; Wada, Y.; Van den Broeke, M.R.; Marzeion, B. Closing the Sea Level Budget on a Regional Scale: Trends and Variability on the Northwestern European Continental Shelf. Geophys. Res. Lett. 2016, 43, 10864–10872. [Google Scholar] [CrossRef]
  70. Frederikse, T.; Jevrejeva, S.; Riva, R.E.M.; Dangendorf, S. A Consistent Sea-Level Reconstruction and Its Budget on Basin and Global Scales over 1958–2014. J. Clim. 2018, 31, 1267–1280. [Google Scholar] [CrossRef]
  71. Wouters, B.; van de Wal, R.S.W. Global Sea-Level Budget 1993–Present. Earth Syst. Sci. Data 2018, 10, 1551–1590. [Google Scholar] [CrossRef]
  72. Jevrejeva, S.; Matthews, A.; Slangen, A. The Twentieth-Century Sea Level Budget: Recent Progress and Challenges. In Integrative Study of the Mean Sea Level and Its Components; Springer: Berlin/Heidelberg, Germany, 2017; pp. 301–313. [Google Scholar] [CrossRef]
  73. Wang, J.; Church, J.A.; Zhang, X.; Chen, X. Reconciling Global Mean and Regional Sea Level Change in Projections and Observations. Nat. Commun. 2021, 12, 990. [Google Scholar] [CrossRef] [PubMed]
  74. White, N.J.; Church, J.A.; Gregory, J.M. Coastal and Global Averaged Sea Level Rise for 1950 to 2000. Geophys. Res. Lett. 2005, 32, L01601. [Google Scholar] [CrossRef]
  75. Bowman, W. UTide for Python. Version 0.3.0. Available online: https://github.com/wesleybowman/UTide (accessed on 19 June 2025).
  76. Codiga, D. Unified Tidal Analysis and Prediction Using the UTide Matlab Functions. 2011. Available online: https://www.researchgate.net/publication/280722790_Unified_tidal_analysis_and_prediction_using_the_UTide_Matlab_functions (accessed on 15 August 2025).
  77. Doodson, A.T. The Harmonic Development of the Tide-Generating Potential. Proc. R. Soc. London. Ser. A Contain. Pap. A Math. Phys. Character 1921, 100, 305–329. [Google Scholar] [CrossRef]
  78. Pugh, D.; Woodworth, P.L. Sea-Level Science: Understanding Tides, Surges, Tsunamis and Mean Sea-Level Changes; Cambridge University Press: Cambridge, UK, 2014; ISBN 978-1-107-02819-7. [Google Scholar]
  79. Leuliette, E.W.; Nerem, R.S.; Mitchum, G.T. Calibration of TOPEX/Poseidon and Jason Altimeter Data to Construct a Continuous Record of Mean Sea Level Change. Mar. Geod. 2004, 27, 79–94. [Google Scholar] [CrossRef]
  80. Nerem, R.S. Measuring Global Mean Sea Level Variations Using TOPEX/POSEIDON Altimeter Data. J. Geophys. Res. Ocean. 1995, 100, 25135–25151. [Google Scholar] [CrossRef]
  81. Christensen, E.J.; Haines, B.J.; Keihm, S.J.; Morris, C.S.; Norman, R.A.; Purcell, G.H.; Williams, B.G.; Wilson, B.D.; Born, G.H.; Parke, M.E.; et al. Calibration of TOPEX/POSEIDON at Platform Harvest. J. Geophys. Res. Ocean. 1994, 99, 24465–24485. [Google Scholar] [CrossRef]
  82. Fu, L.-L.; Haines, B.J. The Challenges in Long-Term Altimetry Calibration for Addressing the Problem of Global Sea Level Change. Adv. Space Res. 2013, 51, 1284–1300. [Google Scholar] [CrossRef]
  83. Ruf, C.S.; Keihm, S.J.; Subramanya, B.; Janssen, M.A. TOPEX/POSEIDON Microwave Radiometer Performance and in-Flight Calibration. J. Geophys. Res. Ocean. 1994, 99, 24915–24926. [Google Scholar] [CrossRef]
  84. Visser, H.; Dangendorf, S.; Petersen, A.C. A Review of Trend Models Applied to Sea Level Data with Reference to the “Acceleration-Deceleration Debate”. J. Geophys. Res. Ocean. 2015, 120, 3873–3895. [Google Scholar] [CrossRef]
  85. Slangen, A.B.A.; Haasnoot, M.; Winter, G. Rethinking sea-Level Projections Using Families and Timing Differences. Earth’s Future 2022, 10, e2021EF002576. [Google Scholar] [CrossRef]
  86. Ott, L.; Longnecker, M. An Introduction to Statistical Methods & Data Analysis, 7th ed.; Cengage Learning: Melbourne, Australia, 2016; ISBN 978-1-305-26947-7. [Google Scholar]
  87. Akaike, H. A New Look at the Statistical Model Identification. IEEE Trans. Autom. Control 1974, 19, 716–723. [Google Scholar] [CrossRef]
  88. Schwarz, G. Estimating the Dimension of a Model. Ann. Stat. 1978, 6, 461–464. [Google Scholar] [CrossRef]
  89. Frederikse, T.; Gerkema, T. Multi-Decadal Variability in Seasonal Mean Sea Level along the North Sea Coast. Ocean Sci. 2018, 14, 1491–1501. [Google Scholar] [CrossRef]
  90. Bland, J.M.; Altman, D.G. Statistics Notes: Multiple Significance Tests: The Bonferroni Method. BMJ 1995, 310, 170. [Google Scholar] [CrossRef]
  91. Bonferroni, C. Teoria Statistica Delle Classi e Calcolo Delle Probabilita; R Istituto Superiore di Scienze Economiche e Commericiali di Firenze: Florence, Italy, 1936; Volume 8, pp. 3–62. [Google Scholar]
  92. Bence, J.R. Analysis of Short Time Series: Correcting for Autocorrelation. Ecology 1995, 76, 628–639. [Google Scholar] [CrossRef]
  93. Trace-Kleeberg, S.; Haigh, I.D.; Walraven, M.; Gourvenec, S. How Should Storm Surge Barrier Maintenance Strategies Be Changed in Light of Sea-Level Rise? A Case Study. Coast. Eng. 2023, 184, 104336. [Google Scholar] [CrossRef]
  94. Meinshausen, M.; Nicholls, Z.R.J.; Lewis, J.; Gidden, M.J.; Vogel, E.; Freund, M.; Beyerle, U.; Gessner, C.; Nauels, A.; Bauer, N.; et al. The Shared Socio-Economic Pathway (SSP) Greenhouse Gas Concentrations and Their Extensions to 2500. Geosci. Model Dev. 2020, 13, 3571–3605. [Google Scholar] [CrossRef]
  95. O’Neill, B.C.; Kriegler, E.; Riahi, K.; Ebi, K.L.; Hallegatte, S.; Carter, T.R.; Mathur, R.; Van Vuuren, D.P. A New Scenario Framework for Climate Change Research: The Concept of Shared Socioeconomic Pathways. Clim. Change 2014, 122, 387–400. [Google Scholar] [CrossRef]
  96. Burgess, M.G.; Langendorf, R.E.; Ippolito, T.; Pielke, R., Jr. Optimistically Biased Economic Growth Forecasts and Negatively Skewed Annual Variation; Center for Open Science: Charlottesville, VA, USA, 2020. [Google Scholar] [CrossRef]
  97. Burgess, M.G.; Ritchie, J.; Shapland, J.; Pielke, R., Jr. IPCC Baseline Scenarios Have Over-Projected CO2 Emissions and Economic Growth. Environ. Res. Lett. 2020, 16, 014016. [Google Scholar] [CrossRef]
  98. Hausfather, Z.; Peters, G.P. Emissions–the ‘Business as Usual’Story Is Misleading. Nature 2020, 577, 618–620. [Google Scholar] [CrossRef] [PubMed]
  99. Pielke, R., Jr.; Burgess, M.G.; Ritchie, J. Plausible 2005–2050 Emissions Scenarios Project between 2 °C and 3 °C of Warming by 2100. Environ. Res. Lett. 2022, 17, 024027. [Google Scholar] [CrossRef]
  100. UNFCCC. NDC Synthesis Report; UNFCCC: Bonn, Germany, 2022. [Google Scholar]
  101. Chen, D.; Rojas, M.; Samset, B.H.; Cobb, K.; Diongue-Niang, A.; Edwards, P.; Emori, S.; Faria, S.H.; Hawkins, E.; Hope, P.; et al. Framing, Context, and Methods. In Climate Change 2021: The Physical Science Basis. Contribution of Working Group I to the Sixth Assessment Report of the Intergovernmental Panel on Climate Change; Masson-Delmotte, V., Zhai, P., Pirani, A., Connors, S.L., Péan, C., Berger, S., Caud, N., Chen, Y., Goldfarb, L., Gomis, M.I., et al., Eds.; Cambridge University Press: Cambridge, UK; New York, NY, USA, 2021; pp. 147–286. [Google Scholar]
  102. Hinkel, J.; Church, J.A.; Gregory, J.M.; Lambert, E.; Le Cozannet, G.; Lowe, J.; McInnes, K.L.; Nicholls, R.J.; van der Pol, T.D.; van de Wal, R. Meeting User Needs for Sea Level Rise Information: A Decision Analysis Perspective. Earth’s Future 2019, 7, 320–337. [Google Scholar] [CrossRef]
  103. Jevrejeva, S.; Moore, J.C.; Grinsted, A.; Matthews, A.P.; Spada, G. Trends and Acceleration in Global and Regional Sea Levels since 1807. Glob. Planet. Change 2014, 113, 11–22. [Google Scholar] [CrossRef]
  104. Hamlington, B.D.; Gardner, A.S.; Ivins, E.; Lenaerts, J.T.M.; Reager, J.T.; Trossman, D.S.; Zaron, E.D.; Adhikari, S.; Arendt, A.; Aschwanden, A.; et al. Understanding of Contemporary Regional Sea-Level Change and the Implications for the Future. Rev. Geophys. 2020, 58, e2019RG000672. [Google Scholar] [CrossRef]
  105. Wöppelmann, G.; Marcos, M. Vertical Land Motion as a Key to Understanding Sea Level Change and Variability. Rev. Geophys. 2016, 54, 64–92. [Google Scholar] [CrossRef]
  106. Vecchio, A.; Anzidei, M.; Serpelloni, E. Sea Level Rise Projections up to 2150 in the Northern Mediterranean Coasts. Environ. Res. Lett. 2024, 19, 014050. [Google Scholar] [CrossRef]
  107. Jin, S.; Zhang, T.Y.; Zou, F. Glacial Density and GIA in Alaska Estimated from ICESat, GPS and GRACE Measurements. JGR Earth Surf. 2017, 122, 76–90. [Google Scholar] [CrossRef]
  108. Sato, T.; Miura, S.; Sun, W.; Sugano, T.; Freymueller, J.T.; Larsen, C.F.; Ohta, Y.; Fujimoto, H.; Inazu, D.; Motyka, R.J. Gravity and Uplift Rates Observed in Southeast Alaska and Their Comparison with GIA Model Predictions. J. Geophys. Res. 2012, 117, 2011JB008485. [Google Scholar] [CrossRef]
  109. Nalakurthi, N.S.R.N.; Behera, M.R. Detection of Land Subsidence Using Sentinel-1 Interferometer and Its relationship with Sea-Level-Rise, Groundwater, and Inundation: A Case s Tudy along Mumbai Coastal City. 2022. Available online: https://www.researchsquare.com/article/rs-1392714/v1 (accessed on 7 December 2023).
  110. Wu, P.-C.; Wei, M.; D’Hondt, S. Subsidence in Coastal Cities Throughout the World Observed by InSAR. Geophys. Res. Lett. 2022, 49, e2022GL098477. [Google Scholar] [CrossRef]
  111. Hashima, A.; Sato, T. A Megathrust Earthquake Cycle Model for Northeast Japan: Bridging the Mismatch between Geological Uplift and Geodetic Subsidence. Earth Planets Space 2017, 69, 23. [Google Scholar] [CrossRef]
  112. Nishimura, T. Pre-, Co-, and Post-Seismic Deformation of the 2011 Tohoku-Oki Earthquake and Its Implication to a Paradox in Short-Term and Long-Term Deformation. J. Disaster Res. 2014, 9, 294–302. [Google Scholar] [CrossRef]
  113. Yuill, B.; Lavoie, D.; Reed, D.J. Understanding Subsidence Processes in Coastal Louisiana. J. Coast. Res. 2009, 10054, 23–36. [Google Scholar] [CrossRef]
  114. Blum, M.; Rahn, D.; Frederick, B.; Polanco, S. Land Loss in the Mississippi River Delta: Role of Subsidence, Global s Ea-Level Rise, and Coupled Atmospheric and Oceanographic Processes. Glob. Planet. Change 2023, 222, 104048. [Google Scholar] [CrossRef]
  115. Terzaghi, K.; Peck, R.B.; Mesri, G. Soil Mechanics in Engineering Practice; John Wiley & Sons: Hoboken, NJ, USA, 1996. [Google Scholar]
  116. Han, S.; Sauber, J.; Pollitz, F.; Ray, R. Sea Level Rise in the Samoan Islands Escalated by Viscoelastic Relaxation After the 2009 Samoa-Tonga Earthquake. JGR Solid Earth 2019, 124, 4142–4156. [Google Scholar] [CrossRef]
  117. Steffen, H.; Kaufmann, G. Glacial Isostatic Adjustment of Scandinavia and Northwestern Europe and the Radial Viscosity Structure of the Earth’s Mantle. Geophys. J. Int. 2005, 163, 801–812. [Google Scholar] [CrossRef]
  118. Tsimplis, M.N.; Calafat, F.M.; Marcos, M.; Jordà, G.; Gomis, D.; Fenoglio-Marc, L.; Struglia, M.V.; Josey, S.A.; Chambers, D.P. The Effect of the NAO on Sea Level and on Mass Changes in the Mediterranean Sea. JGR Ocean. 2013, 118, 944–952. [Google Scholar] [CrossRef]
  119. Babel, M.S.; Gupta, A.D.; Domingo, N.D.S. Land Subsidence: A Consequence of Groundwater Over-Exploitation in Ban Gkok, Thailand—Google Zoeken. Int. Rev. Environ. Strateg. 2006, 6, 307–328. [Google Scholar]
  120. Olson, K.R.; Kreznor, W. Managing the Chao Phraya River and Delta in Bangkok, Thailand: Flood C Ontrol, Navigation and Land Subsidence Mitigation. Open J. Soil Sci. 2021, 11, 197–215. [Google Scholar] [CrossRef]
  121. Phien-wej, N.; Giao, P.H.; Nutalaya, P. Land Subsidence in Bangkok, Thailand. Eng. Geol. 2006, 82, 187–201. [Google Scholar] [CrossRef]
  122. Jirapinyakul, A.; Nudnara, W.; Punwong, P.; Nohall, R.; Englong, A.; Phujareanchaiwon, C.; Yamoah, K.A.; Choowong, M. ENSO May Have Contributed to Sea Level Changes in the Gulf of Thailand during the Late-Holocene. Holocene 2023, 33, 1453–1464. [Google Scholar] [CrossRef]
  123. Taninpong, P.; Minsan, W.; Thumrongnavasawat, S.; Luangdang, K. Trend Analysis of Sea Level Change in the Gulf of Thailand. Sci. Essence J. 2021, 37, 64–77. [Google Scholar]
  124. Lambeck, K.; Purcell, A.; Johnston, P.; Nakada, M.; Yokoyama, Y. Water-Load Definition in the Glacio-Hydro-Isostatic Sea-Level Equation. Quat. Sci. Rev. 2003, 22, 309–318. [Google Scholar] [CrossRef]
  125. Aedo, D.; Cisternas, M.; Melnick, D.; Esparza, C.; Wincklr, P.; Saldaña, B. Decadal Coastal Evolution Spanning the 2010 Maule Earthquake at Isla Santa Maria, Chile: Framing Darwin’s Accounts of Uplift over a Seismic Cycle. Earth Surf. Process. Landf. 2023, 48, 2319–2333. [Google Scholar] [CrossRef]
  126. Dangendorf, S.; Hendricks, N.; Sun, Q.; Klinck, J.; Ezer, T.; Frederikse, T.; Calafat, F.M.; Wahl, T.; Törnqvist, T.E. Acceleration of U.S. Southeast and Gulf Coast Sea-Level Rise Amplified by Internal Climate Variability. Nat. Commun. 2023, 14, 1935. [Google Scholar] [CrossRef]
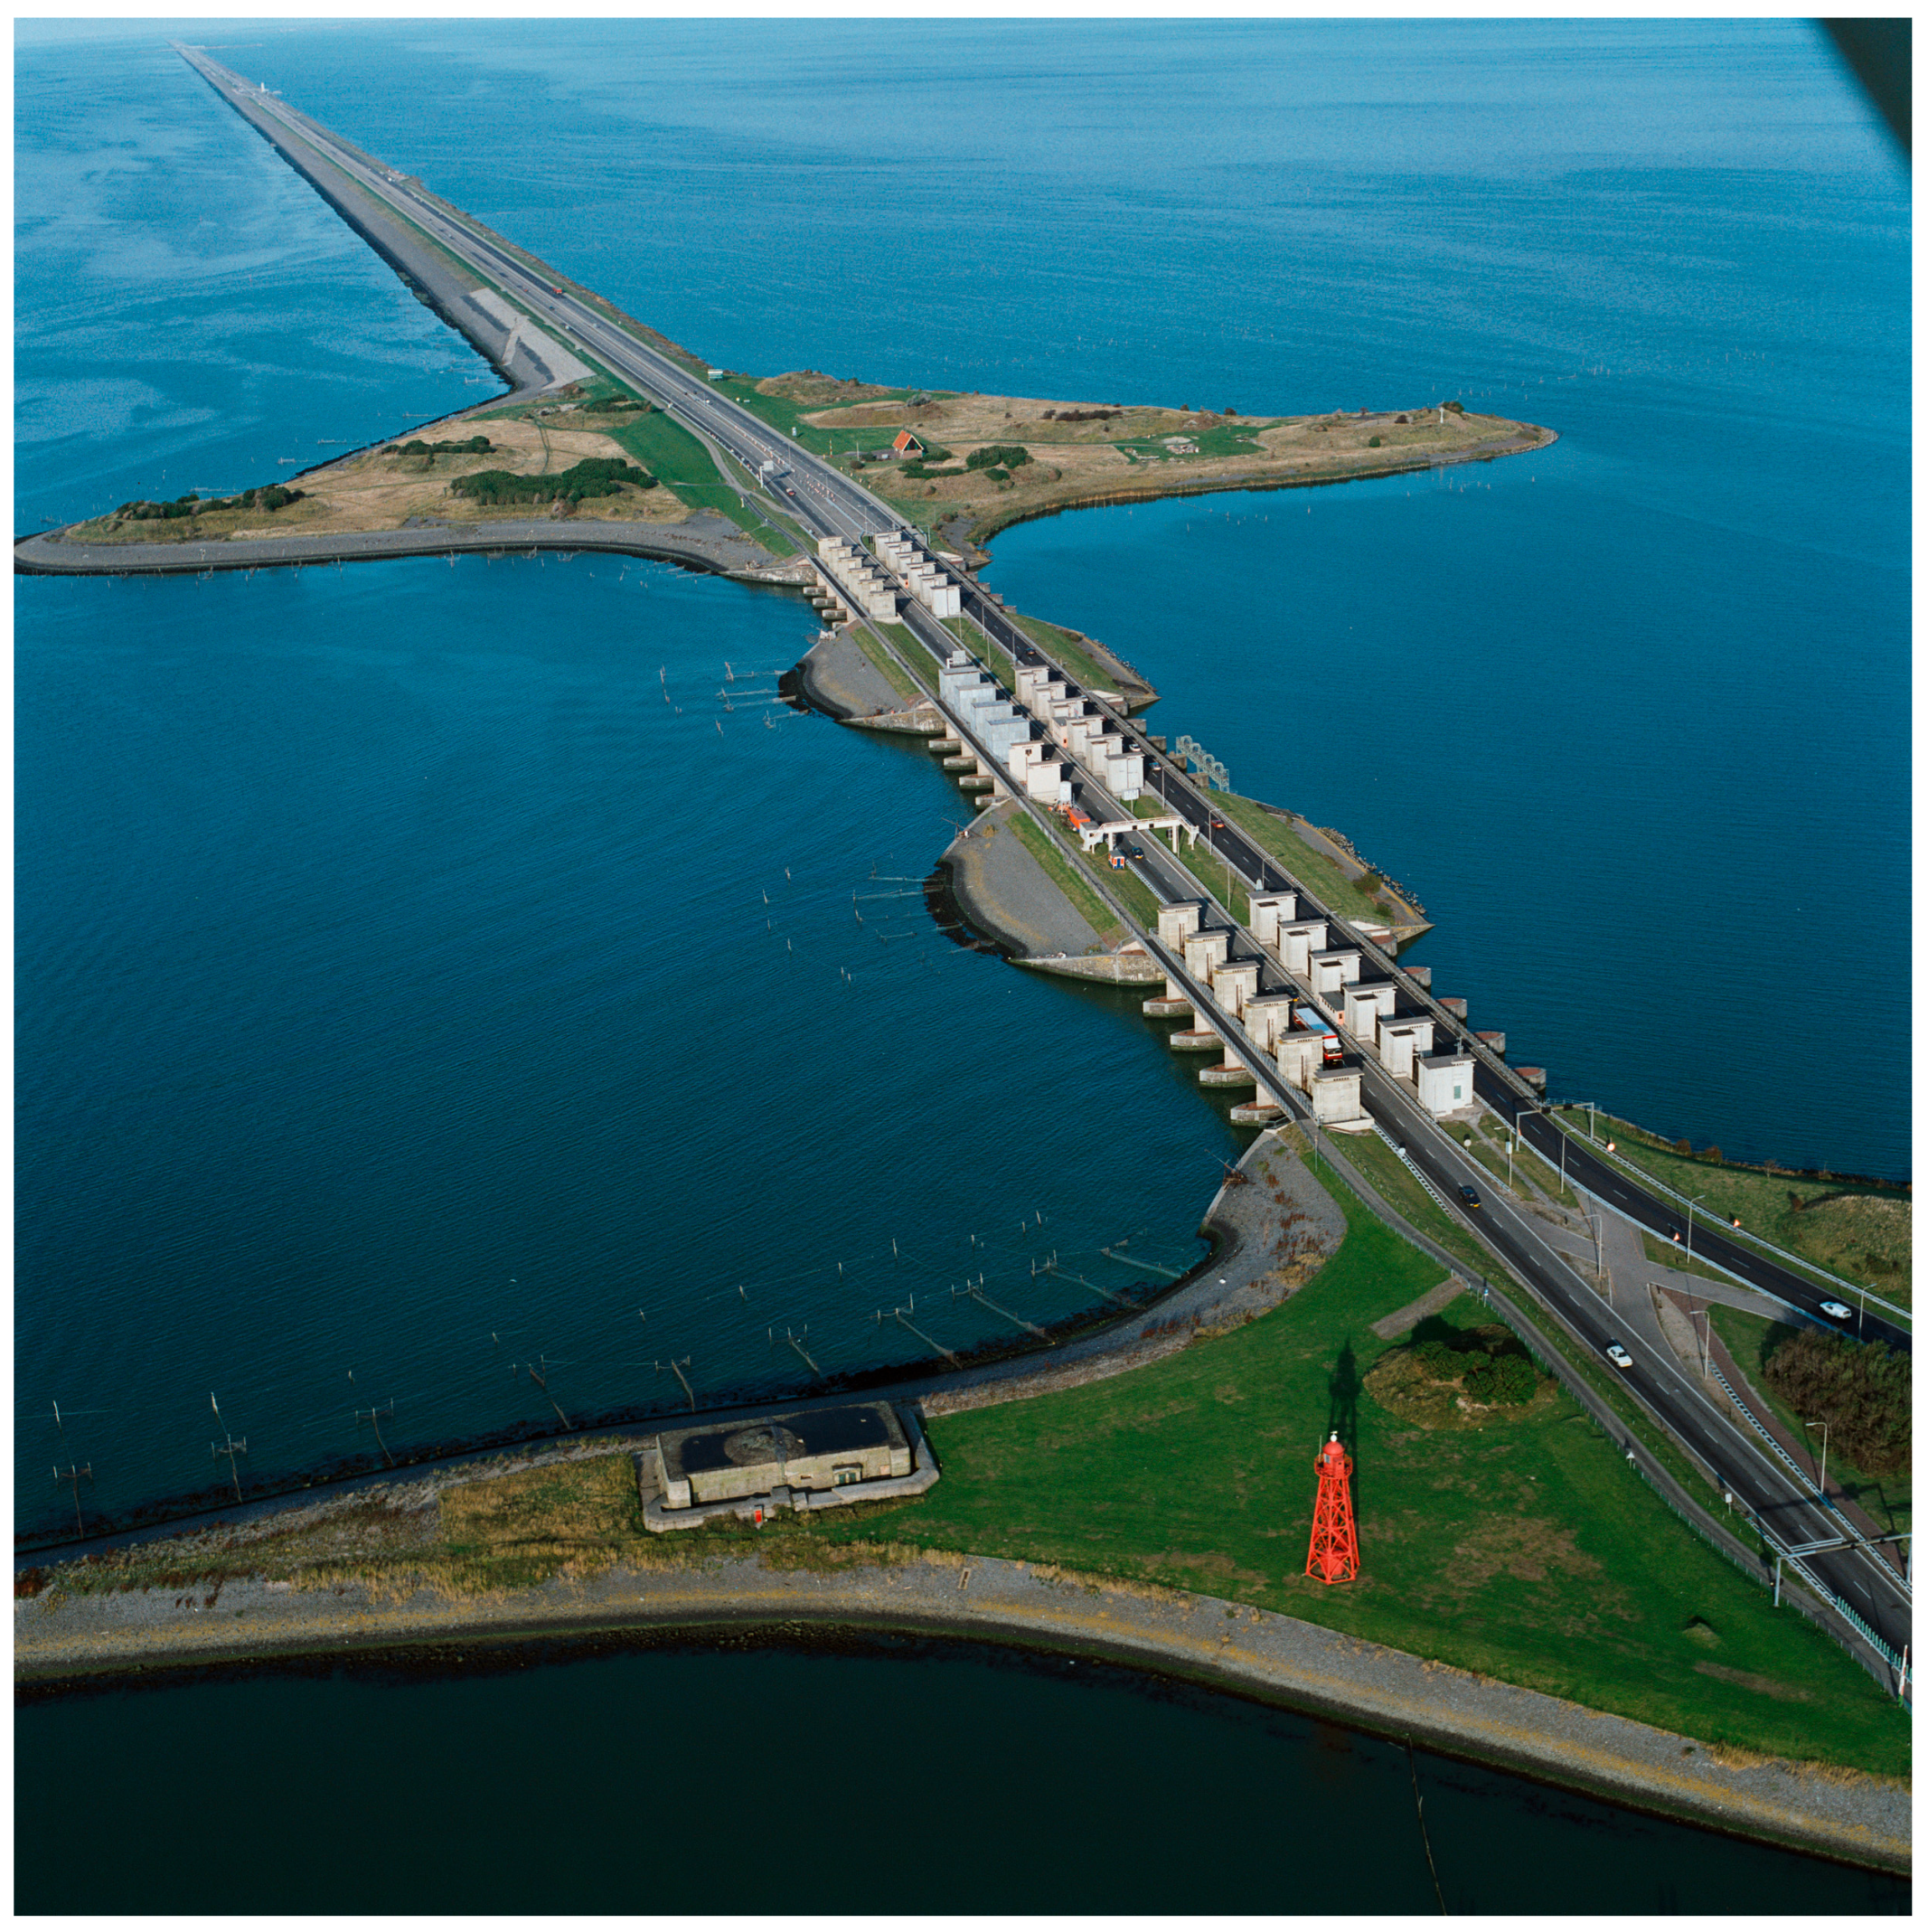
Figure 1. Coastal infrastructure is intended to function for multiple decades. Level control facility in the Netherlands, constructed in 1932 (Image: Rijkswaterstaat image library).
Jmse 13 01641 g001
Figure 2. Observed sea level is a combination of trends (dotted line) and multi-year tides. The long-term trend is the trend without the multi-year tides. The long-term trend may accelerate as a consequence of natural and/or anthropogenic climate change.
Jmse 13 01641 g002
Figure 3. PSMSL network with results of this study. Colored symbols indicate locations where the rate of sea level rise in 2020 could be found from the available data, with the color indicating the calculated rate. Upward-pointing triangles indicate statistically significant acceleration of sea level rise. Circles indicate non-significant acceleration. Crosses indicate locations with insufficient data under the criteria of the present study.
Jmse 13 01641 g003
Figure 4. Histogram of median long-term rate of sea level rise in 2020 as derived from PSMSL data.
Jmse 13 01641 g004
Figure 5. GLOSS network with results of this study. Colored symbols indicate locations where the median rate of sea level rise in 2020 could be found from the available data, with the color indicating the calculated rate. Upward-pointing triangles indicate statistically significant acceleration of sea level rise. Circles indicate non-significant acceleration. Crosses indicate locations with insufficient data under the criteria of the present study.
Jmse 13 01641 g005
Figure 6. Histogram of median rate of sea level rise in 2020 as derived from GLOSS data.
Jmse 13 01641 g006
Figure 7. Median–long-term rates of sea level rise; comparison of GLOSS and PSMSL.
Jmse 13 01641 g007
Figure 8. Median–long-term rates of sea level rise in 2020. Median rates derived from PSMSL data compared to median projection SSP2-4.5 by IPCC.
Jmse 13 01641 g008
Figure 9. Difference of the median rate of sea level rise in IPCC (emission path SSP2-4.5) compared to the median rate found from PSMSL observations.
Jmse 13 01641 g009
Figure 10. Selected PSMSL stations and stations selected for a closer analysis.
Jmse 13 01641 g010
Figure 11. Yearly mean sea level in Ayukawa, Japan as stored in the PSMSL database. The Tohoku earthquake of 2011 is clearly visible.
Jmse 13 01641 g011
Figure 12. Yearly mean sea level in Grand Isle (red squares) and Pensacola (blue discs).
Jmse 13 01641 g012
Table 1. The selection with geographical clusters, reasons for inclusion, and the probable cause of the local sea level signal.
ClusterPSMSL IdNameAcceleration?Extreme Rate?Probable Cause of Observed Sea Level Signal
Alaska495SkagwayNoLowGIA+short-term local rise [107,108]
Alaska445YakutatNoLowGIA+short-term local rise [107,108]
Alaska405JuneauNoLowGIA+short-term local rise [107,108]
Australia216Port PirieYesHighInstrumentation + platform
India43Mumbai/Bombay (Apollo Bandar)YesHighDrainage [109,110]
Japan518KushiroNoHighTectonic, subsidence [111,112]
Japan131AyukawaNoHighTectonic, subsidence [111,112]
Japan132WajimaYesNoTectonic, subsidence [111,112]
Japan407UchiuraYesHighTectonic, subsidence [111,112]
Japan811SakaiYesHighTectonic, subsidence [111,112]
Gulf of Mexico526Grand IsleNoHighGIA+tectonic. subsidence+sediment load [113,114,115]
Gulf of Mexico246PensacolaYesHighGIA+tectonic, subsidence+sediment load [113,114,115]
Samoa539Pago PagoYesHighTectonic, subsidence [116]
Scandinavia240Raahe/BrahestadNoLowGIA [117]
Scandinavia229KemiNoLowGIA [117]
Scandinavia203FuruogrundNoLowGIA [117]
Scandinavia194Pietarsaari/JakobstadNoLowGIA [117]
Scandinavia88RatanNoLowGIA [117]
Scandinavia79Oulu/UleaborgNoLowGIA [117]
Scandinavia57Vaasa/VasaNoLowGIA [117]
Scandinavia285Kaskinen/KaskoNoLowGIA [117]
Spain960Alicante 2YesNoAtmospheric [118]
Thailand444Fort Phrachula Chomklao (Pom Phrachun)NoHighDrainage + sediment load [119,120,121]
Thailand174Ko LakYesHighUnclear [122,123]
GIA stands for Glacial Isostatic Adjustment, the motion of the Earth’s crust caused by rebound effects of glaciation.
Disclaimer/Publisher’s Note: The statements, opinions and data contained in all publications are solely those of the individual author(s) and contributor(s) and not of MDPI and/or the editor(s). MDPI and/or the editor(s) disclaim responsibility for any injury to people or property resulting from any ideas, methods, instructions or products referred to in the content.