Article

Performance Enhancement of Autonomous Sailboats via CFD-Optimized Wing–Tail Sail Configurations

1
School of Physics Science and Information Engineering, Liaocheng University, Liaocheng 252000, China
2
First Institute of Oceanography, Ministry of Natural Resources, Qingdao 266061, China
*
Author to whom correspondence should be addressed.
J. Mar. Sci. Eng. 2025, 13(9), 1640; https://doi.org/10.3390/jmse13091640
Submission received: 5 August 2025 / Revised: 25 August 2025 / Accepted: 26 August 2025 / Published: 27 August 2025
(This article belongs to the Section Ocean Engineering)

Abstract

The development of energy-efficient propulsion systems for autonomous sailboats requires innovative sail designs that balance aerodynamic performance and maritime operational reliability. This study presents a novel rigid wing sail system comprising a NACA 0020 main sail with an embedded NACA 0018 tail sail, specifically designed for uncrewed ocean navigation. Through systematic CFD analysis using ANSYS Fluent 2022R1, three configurations were compared: (1) the proposed hybrid wing–tail system, (2) a single main wing sail, and (3) traditional flap sails. The investigation focused on two key design parameters—tail sail area (25–40% of main sail area) and deflection angle (0–15°)—that were evaluated across angles of attack from 0° to 30° under typical marine wind conditions. The results reveal three critical findings: First, the hybrid system achieves a 29.5% higher peak lift coefficient than a single wing sail and an 11.6% improvement over slotted-flap sails. Second, increasing the tail sail area to 35% of the main sail optimizes both the lift coefficient (CL max = 1.16) and the lift-to-drag ratio (L/D = 7.5 at 9° angles of attack). Third, as the tail deflection angle increases, the maximum lift–drag ratio shifts forward, and at small angles of attack, the maximum lift–drag ratio increases by 40%. The hybrid wing–tail sail design proposed in this study significantly enhances the aerodynamic performance of uncrewed sailing boats, providing new insights for the sustainable development of marine renewable energy technologies and autonomous vessels.

1. Introduction

Recent advancements in marine exploration technology have yielded a suite of devices critical for marine resource exploitation, environmental monitoring, and scientific inquiry. These include autonomous underwater vehicles, uncrewed surface vessels, uncrewed sailboats, and moored oceanographic buoys [1]. Among these, uncrewed sailboats leverage wind power as their primary propulsion, supplemented by solar panels and other auxiliary power to sustain the operations of control systems and sensors [2]. This configuration enables cost-effective oceanographic observations characterized by large spatial coverage, as well as high temporal and spatial resolution [3]. The propulsion system of uncrewed sailboats utilizes a main wing sail as the main driving component, which is supported by a tail wing sail as an auxiliary system to enhance aerodynamic propulsion efficiency. Thus, structural optimization of the sail assembly can greatly improve the aerodynamic performance of uncrewed sailboats, thereby increasing the sailing efficiency of uncrewed sailboats, reducing operational cost, and extending the platform’s operational lifespan [4].
With the evolution of technology, the design and optimization of sail configurations for sailboats have emerged as a critical area of research. The University of Las Palmas de Gran Canaria introduced the A-Tirma G2, an uncrewed sailboat distinguished by its bi-wing sail configuration [5]. This configuration confers superior track-keeping capabilities compared to other uncrewed vessels. The Austrian Society for Innovative Computer Science launched ASV Roboat, an uncrewed sailboat featuring soft sails and a sloop rig [6]. The U.S. Naval Academy, in collaboration with the University of Aberystwyth, developed the small uncrewed sailing vessel Arrtoo, characterized by a Twin-masted, double-jib symmetric configuration [7]. Notably, this vessel incorporates a vertical-axis wind turbine, a departure from other uncrewed sailboat configurations. Kuang et al. optimized dual-element wing sail chord ratios [8]. Li Dongqin et al. proposed a retractable double-flap sail design, wherein the flaps are deployed downwind to enhance the sail’s wind-capturing area and optimize wind energy utilization efficiency [9]. Li Senmao et al. developed a sail system integrating a tail fin and a flap, which augments sail lift. However, this design increases the rotational torque of the sail, making it difficult to accurately control the direction and speed during navigation [10]. The research results of Abdolahipour et al. [11] contribute to a better understanding of the optimal conditions for efficient flow separation control on lifting surfaces using unsteady excitation, which can have significant implications for improving the performance and efficiency of various aerodynamic applications. Arash Shams Taleghani et al. [12] describe the latest advances in aerodynamic tools, methods, techniques, and applications. Soheila A. et al. [13] showed that using a low-drive-frequency range maximizes lift and using a high-frequency range minimizes drag. Based on the concept of “new conic curve”, Baigang Mi et al. [14] proposed a parameterized method for mesh plate fusion configuration and implemented the optimization method by using the NSGA-II algorithm. Xiangyun Zhang et al. [15] studied the mechanism of the Gurney valve through in-depth CFD numerical simulation and found that the Gurney valve affects the flow characteristics of the trailing edge of the hydrofoil, thus affecting its performance. Vandan et al. [16] investigated the effects of Gurney flap length and installation position on the aerodynamic performance of the NACA 23112 airfoil. The study demonstrated that Gurney flaps significantly improve airfoil performance, with the optimal configuration being the installation of flaps at 1% of chord length along the trailing edge of the airfoil. Xie et al. [17] investigated the effects of Gurney flap height on energy capture performance when installed on both sides of the NACA0012 airfoil. The results showed that within a chord length range of 0 to 0.3 times, both lift and maximum power coefficient increased with increasing height. Hui Li et al. [18] analyzed the effect of mesh refinement on ship resistance to evaluate the influence of mesh uncertainty on numerical calculation. Zhehui Zheng et al. [19] conducted a study to evaluate the effect of serrated wheel bed flaps on the aerodynamic characteristics of the NACA 0018 airfoil using an improved delayed separated eddy current simulation technique.
Slotted-flap sails exhibit several drawbacks when exposed to harsh marine environments, including the following:
(1) Traditional flaps require complex mechanical systems (e.g., rails, hinges, and actuators) to achieve multi-stage deployment, significantly increasing weight—especially in large sailboats. This reduces fuel efficiency and raises maintenance costs.
(2) Traditional flaps rely on gap flow to control the boundary layer. While they can provide higher lift under ideal conditions, they suffer from significant turbulent dissipation and mechanical leakage issues.
(3) With numerous moving parts, they are prone to failure due to wear, ice buildup, or foreign object jamming.
To overcome these limitations and address current marine exploration and monitoring requirements, this study proposes a sail configuration for uncrewed sailboats, comprising a main wing sail and an embedded tail sail. The embedded tail sail here, however, involves embedding a small auxiliary sail surface at the tail of the main sail, forming a relatively fixed integrated structure. It primarily enhances the sailboat’s propulsion efficiency by guiding the airflow of the main sail through the tail sail, with its function leaning more toward supplementing and optimizing the main sail’s performance. A critical advantage of the proposed embedded tail design over conventional slotted flaps is its potential for reduced structural mass and lower overall complexity. Traditional flap systems require heavy, reinforced hinges, tracks, and multiple actuators to manage the high loads on a cantilevered appendage. These components significantly increase the total mass of the sail system and contribute to higher manufacturing costs due to the precision machining and assembly of multiple high-stress mechanical parts. In contrast, our integrated design eliminates the need for these external mechanisms. The main sail and the embedded tail sail are connected via a flexible structure at their linkage points, which reduces the number of parts and avoids heavy reinforcement at the hinges. This approach also ensures that the tail sail can achieve a slight angular deflection. While the unit cost of manufacturing the integrated composite structure may be higher due to specialized layup techniques, this is offset by the simplification of the assembly process and the reduction in purchased components. The compliant structure reduces the part count and the need for heavy reinforcements at hinge points. The resultant system is not only lighter but also likely to exhibit lower long-term maintenance costs and improved reliability due to the absence of wear-prone hinges and bearings. Thus, the trade-off leans favorably towards the embedded design, where a potential increase in unit production cost is balanced by significant savings in mass, assembly complexity, and operational durability. The main wing sail functions as the principal propulsive element, while the embedded tail sail acts as an auxiliary component to augment wind capture efficiency. In comparison to conventional sail designs, this proposed sail configuration exhibits superior aerodynamic characteristics, including an elevated lift coefficient and an enhanced lift-to-drag ratio, along with good controllability of the angle of attack [20]. Computational fluid dynamics (CFD) simulations, conducted using Fluent 2022R1 software, provide a comprehensive numerical investigation of a novel embedded tail sail concept for autonomous sailboats, functioning as a mechanically simplified plain flap, with the systematic quantification of its aerodynamic performance parameters (optimal deflection angle and area ratio) in comparison to standard mono-wing and slotted-flap designs. The CFD model itself is a standard, well-validated tool; its novelty is in being used to explore this specific and previously unreported configuration.

2. Modeling of Main Wing Sail

2.1. Simulation Model Establishment

During the operation of an uncrewed sailboat on the water surface, the wind conditions are inherently complex and highly variable, with the wind direction potentially shifting to either the port or starboard side at any given time. Consequently, the main wing sail usually adopts a symmetrical airfoil configuration to accommodate these dynamic changes. Herein, the NACA0020 airfoil was selected for the main wing sail due to its good aerodynamic properties, including a relatively thick cross-section, high lift coefficient, low drag coefficient, and large stall angle of attack [21]. Compared to asymmetric airfoils (e.g., NACA 2412), the NACA 0020 maintains consistent performance in both forward and reverse flows, eliminating aerodynamic asymmetry issues. Relative to thinner airfoils (e.g., NACA 0006), its greater thickness provides superior structural strength and internal space, making it more suitable for higher load applications. When compared to high-camber airfoils (e.g., NACA 4412), while it exhibits a lower maximum lift coefficient, the NACA 0020 offers more gradual stall characteristics and better low-speed stability.
The chord length (C1) of the main sail was set at 500 mm, the wingspan (B1) at 2000 mm, and the maximum thickness at 100 mm. The sail area (S0) was approximated as a rectangle, calculated as S0 = C1 × B1. The NACA0018 airfoil, with good aerodynamic performance, was used for the tail sail. The chord length (C2) was set at 175 mm, equal to 35% of the main sail’s chord length (C2 = 35% C1), while the wingspan (B2) matched the main sail’s wingspan (B2 = B1), resulting in the tail sail area (S1) of 35% of the main sail’s area (S1 = 35%S0). The corresponding three-dimensional models were developed using SolidWorks 2022 software, as illustrated in Figure 1. This sail configuration is typically suitable for small vessels, specifically dinghies or small multihulls with a hull length ranging from 2 to 6 m. Figure 1a shows a main wing sail system without an embedded tail sail. The main wing sail integrated with an embedded tail sail is presented in Figure 1b,c. The tail sail was embedded in the main sail at the position of 20%C1 from the trailing edge, which not only increases the area of the sail but also deflects the tail sail to increase the sail’s camber, thereby enhancing the sail’s wind energy capture efficiency. To avoid the effect of airflow, the leading-edge surface of the embedded tail sail is almost closely connected to the surface of the main sail. This specific geometry limits the practical range of motion to ±15° without mechanical interference. Figure 1d shows the slotted-flap sail structure. In this configuration, the leading-edge geometry of the main sail is retained, while a single-sided coupling mechanism structurally integrates the flap with the sail body. To enhance computational efficiency, non-essential structural details are omitted during the modeling process.

2.2. Force Analysis of the Main Wing Sail

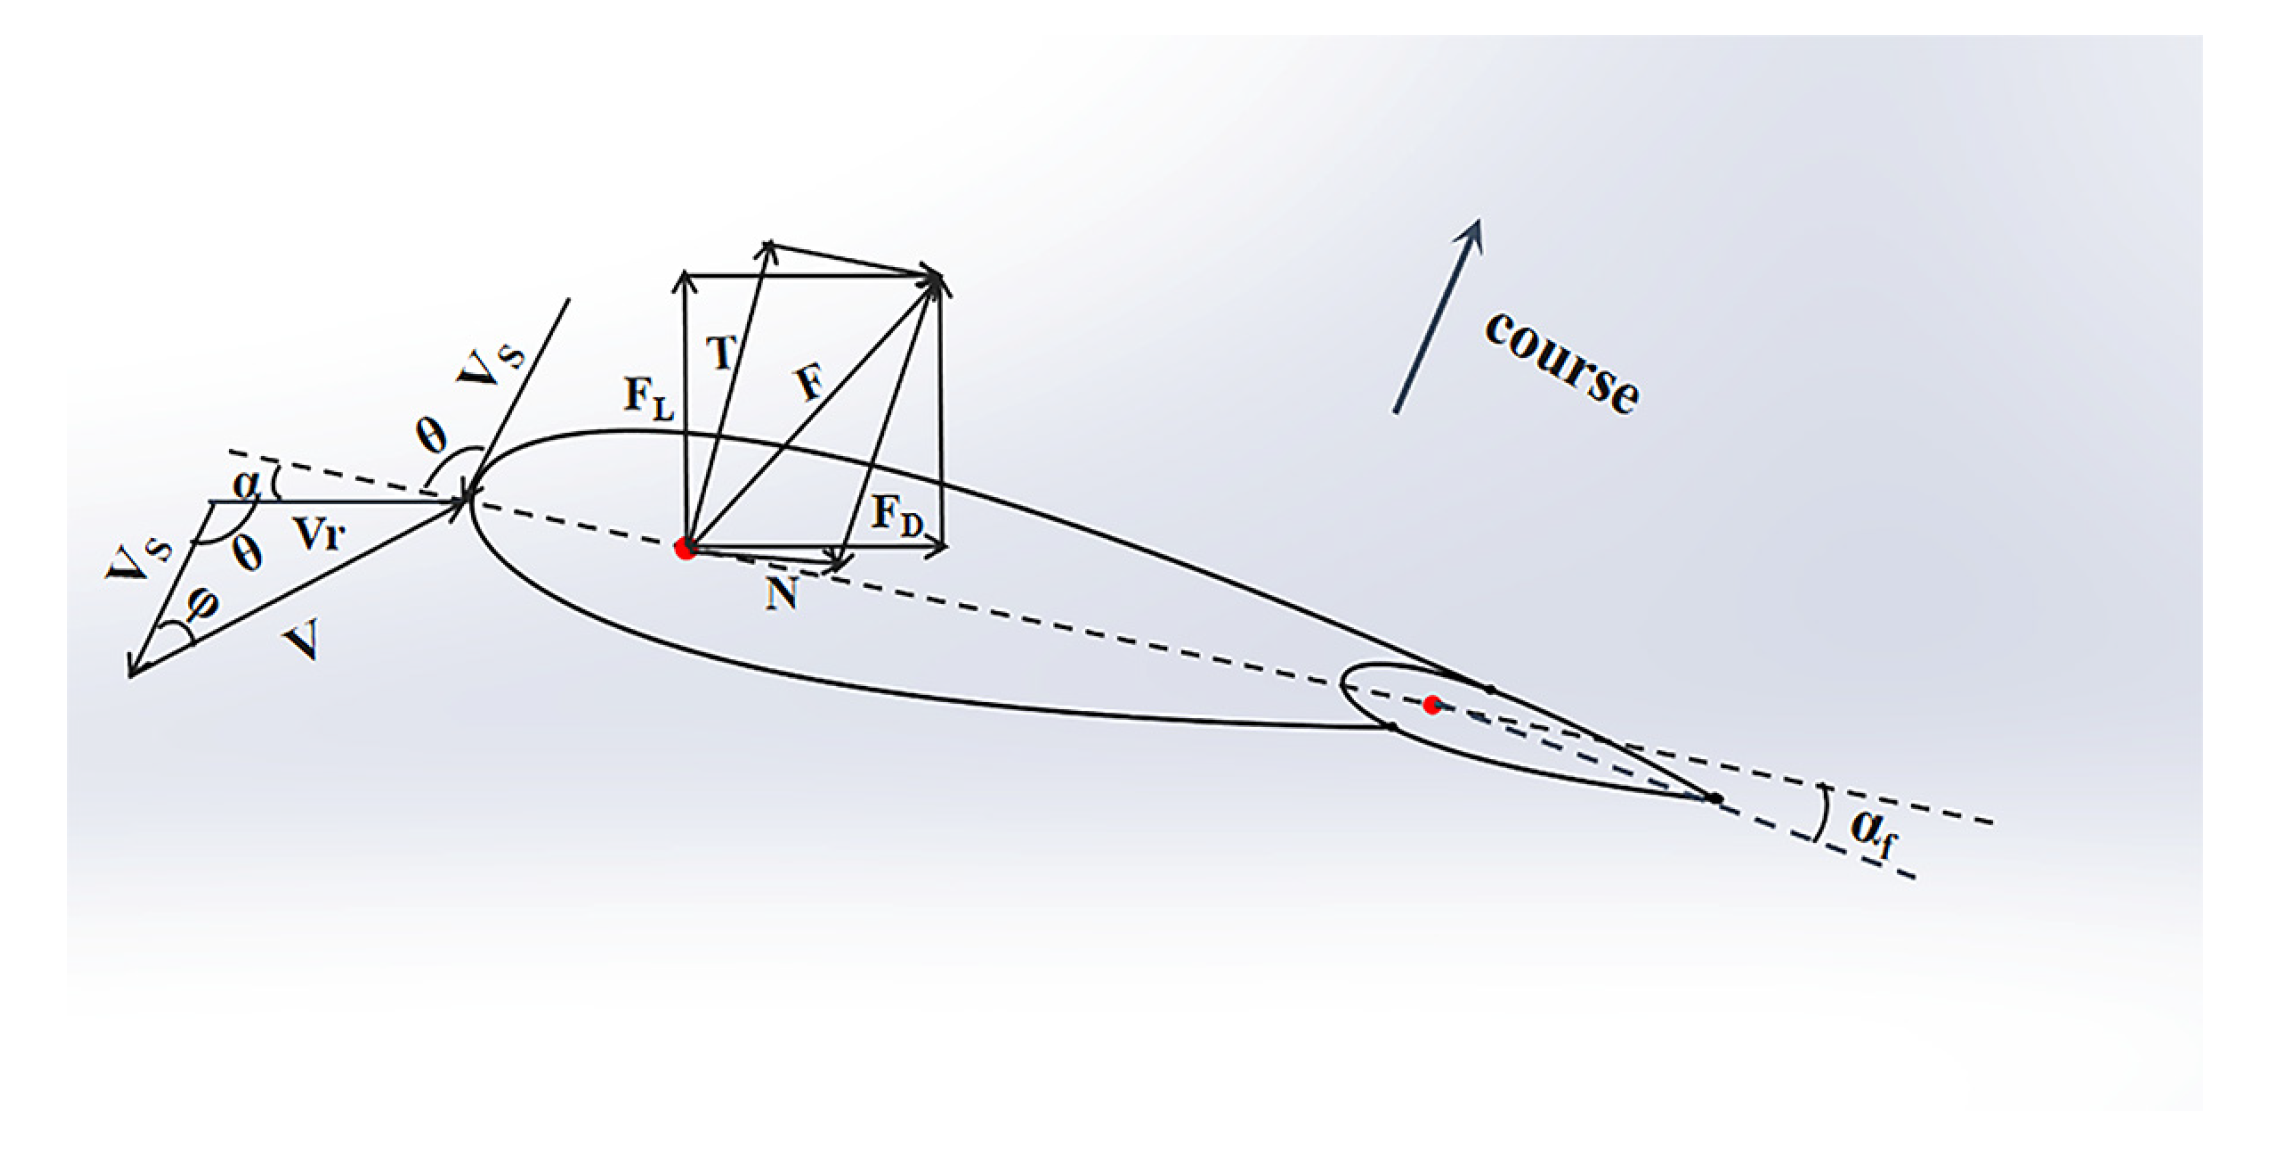
The main sail is the critical component that affects the uncrewed sailboat’s capacity to harness wind energy. The force principle of the main sail during navigation is shown in Figure 2, where the environmental wind speed is denoted as V, the wind velocity induced by the boat’s motion is Vs, and thus the relative wind velocity experienced onboard is Vr. Mathematically, Vr is the vector sum of V and Vs, expressed as Vr = V + Vs. The angle of attack (α) is defined as the angle between Vr and the chord of sail. The wind angle (φ) is the angle between V and Vs, while the relative wind angle (θ) is the angle between Vs and Vr. Additionally, the deflection angle (αf) of the tail sail is specified as the angle between the main sail chord direction and the tail sail chord direction.
The forces acting on the main wing sail arise from the interaction with the wind, resulting in two primary components: the drag force (FD), which acts in the direction of the relative wind velocity, and the lift force (FL), which acts perpendicular to the relative wind direction. In the study of the power generated by the sail to the sailboat, the combined force (F), derived from the vector sum of (FD) and (FL), is decomposed into two orthogonal components: the thrust force (T), aligned with the boat’s heading direction, and the side thrust force (N), oriented perpendicular to the heading direction. The aerodynamic performance of the main sail is commonly evaluated using some coefficients: the lift coefficient (CL), drag coefficient (CD), thrust coefficient (CT), and side thrust coefficient (CN). These coefficients are defined as follows [22]:
C L   = F L 1 2 ρ V r 2 S A  
C D = F D 1 2 ρ V r 2 S A  
C T =   C L s i n θ   C D c o s θ
  C N =   C L c o s θ +   C D s i n θ
where ρ is the air density and S A denotes the projected area of the main wing sail.

3. The Aerodynamic Study of the Main Wing Sail

3.1. Mesh Generation

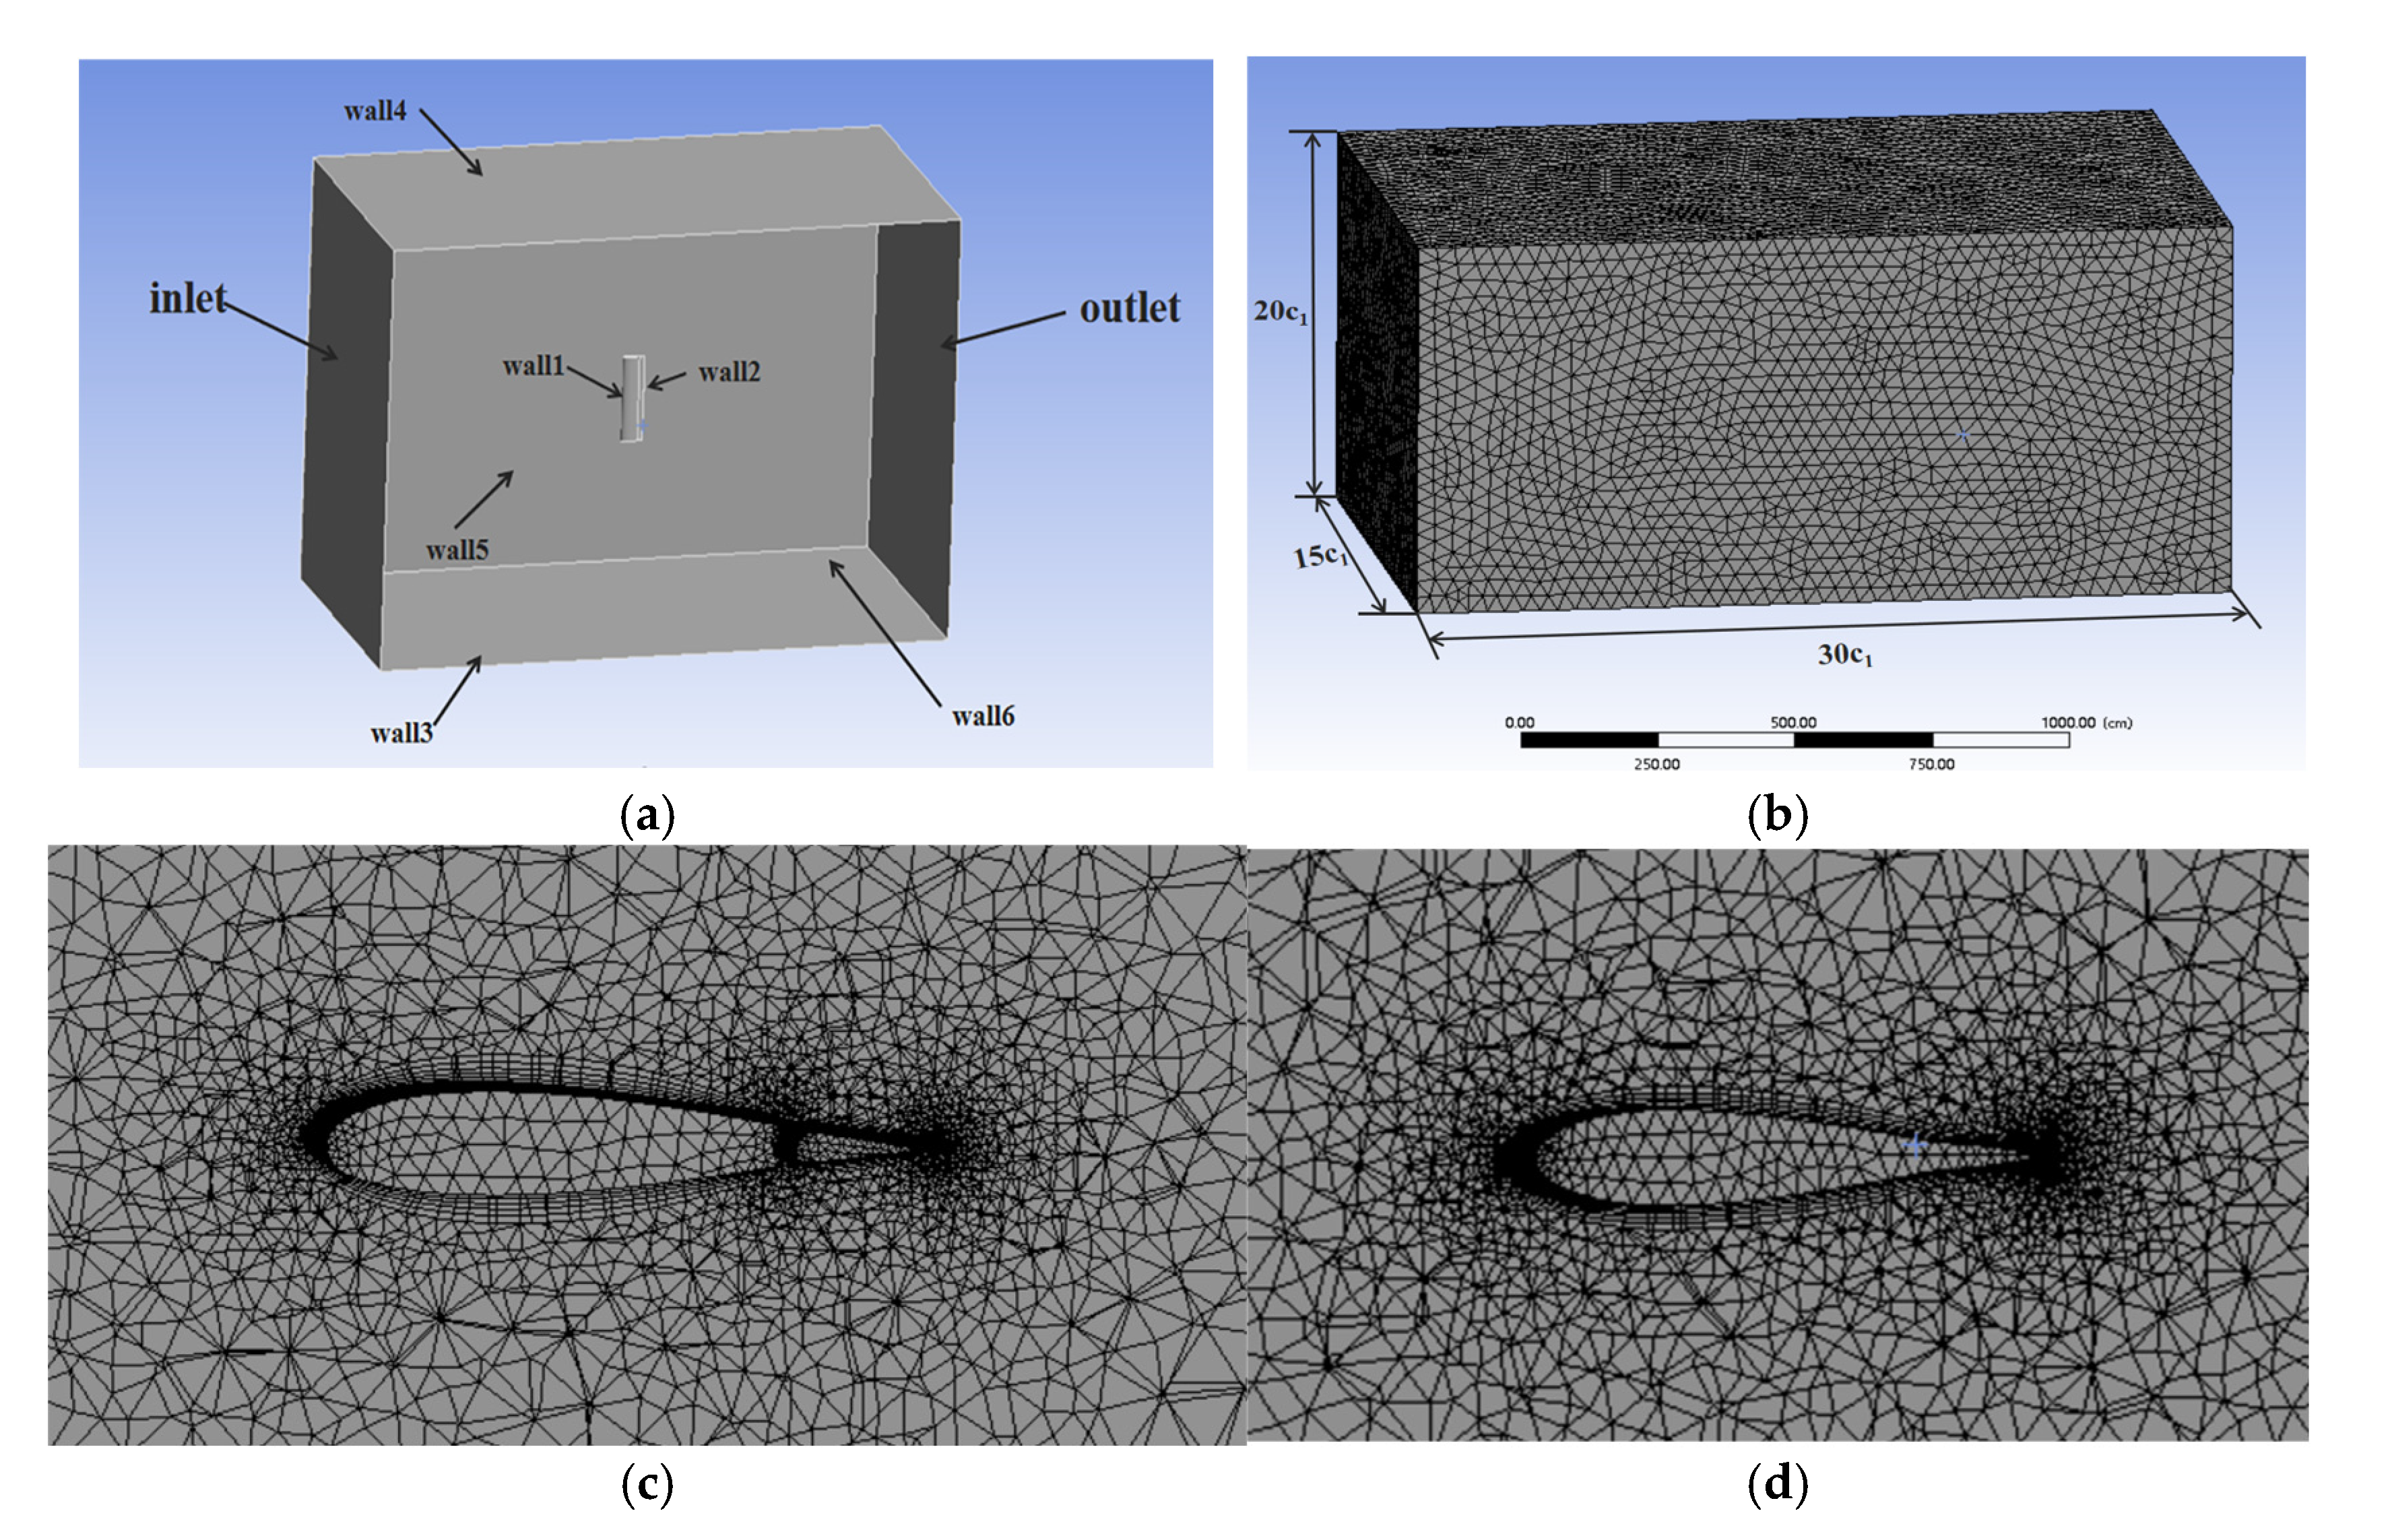
The computational domain was established within the Fluent software. The fluid domain must be large enough relative to the wing sails to minimize boundary effects and ensure realistic flow conditions, but not excessively large to avoid reducing computational efficiency. The domain dimensions were defined as follows: the vertical range (top and bottom) was set at 20 C1, the longitudinal range (front and rear) at 15 C1, and the lateral range (left and right) at 30 C1, as illustrated in Figure 3a. The left boundary was prescribed a velocity inlet condition with an inflow velocity of 8 m/s [23], while the right boundary was designated as a pressure outlet, maintained at one standard atmospheric pressure. The value of the turbulence intensity specified at the velocity inlet for all calculations was 5%. The main sail surface is wall1, the embedded tail sail surface is wall2, and the remaining fluid domain walls are wall3, wall4, wall5, and wall6. The sail surface and other solid walls were assigned no-slip wall boundary conditions [24]. The pressure–velocity coupling was resolved using the SIMPLEC algorithm, which was chosen for its robustness in handling incompressible external aerodynamics. Spatial discretization was performed with second-order accuracy for pressure, momentum, and turbulence equations to ensure solution precision. The under-relaxation factors were set as follows: pressure 0.3, momentum 0.7, and turbulence parameters 0.8, ensuring numerical stability throughout the iterative process. This setup is standard for external aerodynamics and is justified for replicating the flow around a sailboat operating in open water. Tetrahedral mesh division is adopted in the calculation domain, with localized refinement applied to both the airfoil surface and trailing-edge tail sail gap regions. This approach is instrumental in minimizing the mesh count while enhancing computational accuracy and efficiency. During mesh generation, a grid independence study was conducted to determine the mesh resolution for numerical simulations [25]. This study employs boundary layer meshing with y + ≈1 (first-layer height: 1.2 × 10⁻⁶ m) combined with enhanced wall treatment, demonstrating the model’s reliability in separated flow prediction. The Reynolds number was maintained at Re = 2.71 × 10⁶ throughout the simulations. The main sail’s angle of attack is set to 12°, the deflection angle of the embedded tail sail is set to 0°, and the flow field wind speed is set to 8 m/s. The lift and drag coefficients of the main sail are calculated for different mesh counts, as shown in Table 1. The analysis indicates that increasing the number of grid elements has minimal impact on the lift and drag coefficients. However, the grid with 2.2 × 10⁶ elements demonstrates faster convergence compared to other grid densities. Therefore, to ensure simulation accuracy while maintaining computational efficiency, the grid configuration with 2.2 × 10⁶ elements was selected for subsequent fluid dynamics analysis. The mesh orthogonal quality and skewness serve as critical metrics for evaluating mesh quality, and their values were scrutinized post-meshing to ensure compliance with established standards. [26]. The local mesh diagrams of the two types of sail models are illustrated in Figure 3b,c.

3.2. Calculation Method

The airflow velocity surrounding the sails of the uncrewed sailboat during navigation is not high. Additionally, the annual mean sea-level air temperature across China’s maritime regions is approximately 15 °C. In this case, such a flow velocity around the sail is not large (Mach number Ma < 0.3) [27], and the temperature is not high, so the air around the uncrewed sailing ship can be considered as an incompressible fluid. The sail system was analyzed using the Reynolds-averaged Navier–Stokes (RANS) equations [28]. The continuity equation and Navier–Stokes (N-S) equation are calculated as follows [29]:
U i X i   =   0  
U i t + ρ U i U j X i   = P X i + ρ X j μ U i X j + U j X i + ρ g i  
Here, U i denotes the velocity component along the X i direction within the three-dimensional Cartesian coordinate system, ρ represents the fluid density, P is the pressure,   μ is the hydrodynamic viscous coefficient, and g i is the mass force.
The selection of an appropriate turbulence model is critical for enhancing numerical accuracy. Under the actual working conditions of the sails in this paper, the flow on the model wall is not only a turbulent flow but also a viscous movement between molecules. The SST k-ω model has a mixing function, which makes it more efficient when dealing with deformation near the wall. The Shear-Stress Transport (SST) k-ω model was adopted in this study, where the transport equations of k-ω were [30]
ρ k t + ( ρ u j k ) x j = x j [ ( μ +   σ * μ t ) k x j ] +   P k   β * ρ ω k
ρ ω t + ( ρ u j ω ) x j = x j [ ( μ + σ μ t ) ω x j ] + α ω k P k     β   ρ ω 2
where k denotes the turbulent kinetic energy, ω represents the specific dissipation rate, Pk signifies the generating term of turbulent kinetic energy k, and μt is the eddy viscosity.

3.3. Relevant Parameter Settings

To conduct computational fluid dynamics (CFD) simulations, the initial step involves defining the operational parameters, which are detailed in Table 2. The aerodynamic performance of two distinct sail configurations was first evaluated across varying angles of attack. Meanwhile, a comparison is made between the traditional flap sail and this sail structure, with an analysis of their aerodynamic characteristics. Secondly, the impact of embedded tail sails with different areas on the aerodynamic performance of the main sail and the thrust coefficient of the uncrewed sailing vessel was assessed. Lastly, the influence of varying deflection angles of the embedded tail sails on the aerodynamic performance of the main sail was examined.

3.4. Reliability Validation of the Computational Method

To verify the reliability and rationality of the computational method of the selected model, the aerodynamic performance of the NACA0018 airfoil at angles of attack ranging from 0° to 20° was calculated and analyzed. The results were compared with experimental data [31], as shown in Figure 4. As can be seen from Figure 4, the simulation results and experimental values exhibit consistent trends. Therefore, in terms of both lift and drag characteristics, the computational method of the selected model is reliable and reasonable, meeting the computational requirements for the wing sail model.

4. The Analysis of Simulation Results

4.1. Impact of Embedded Tail Sail on the Aerodynamic Performance of the Main Sail

To investigate the influence of the embedded tail sail on the aerodynamic performance of the main sail, fluid dynamic simulations were conducted for the main sail across angles of attack ranging from 0° to 30°. The deflection angle of the embedded tail sail remains at 0°.
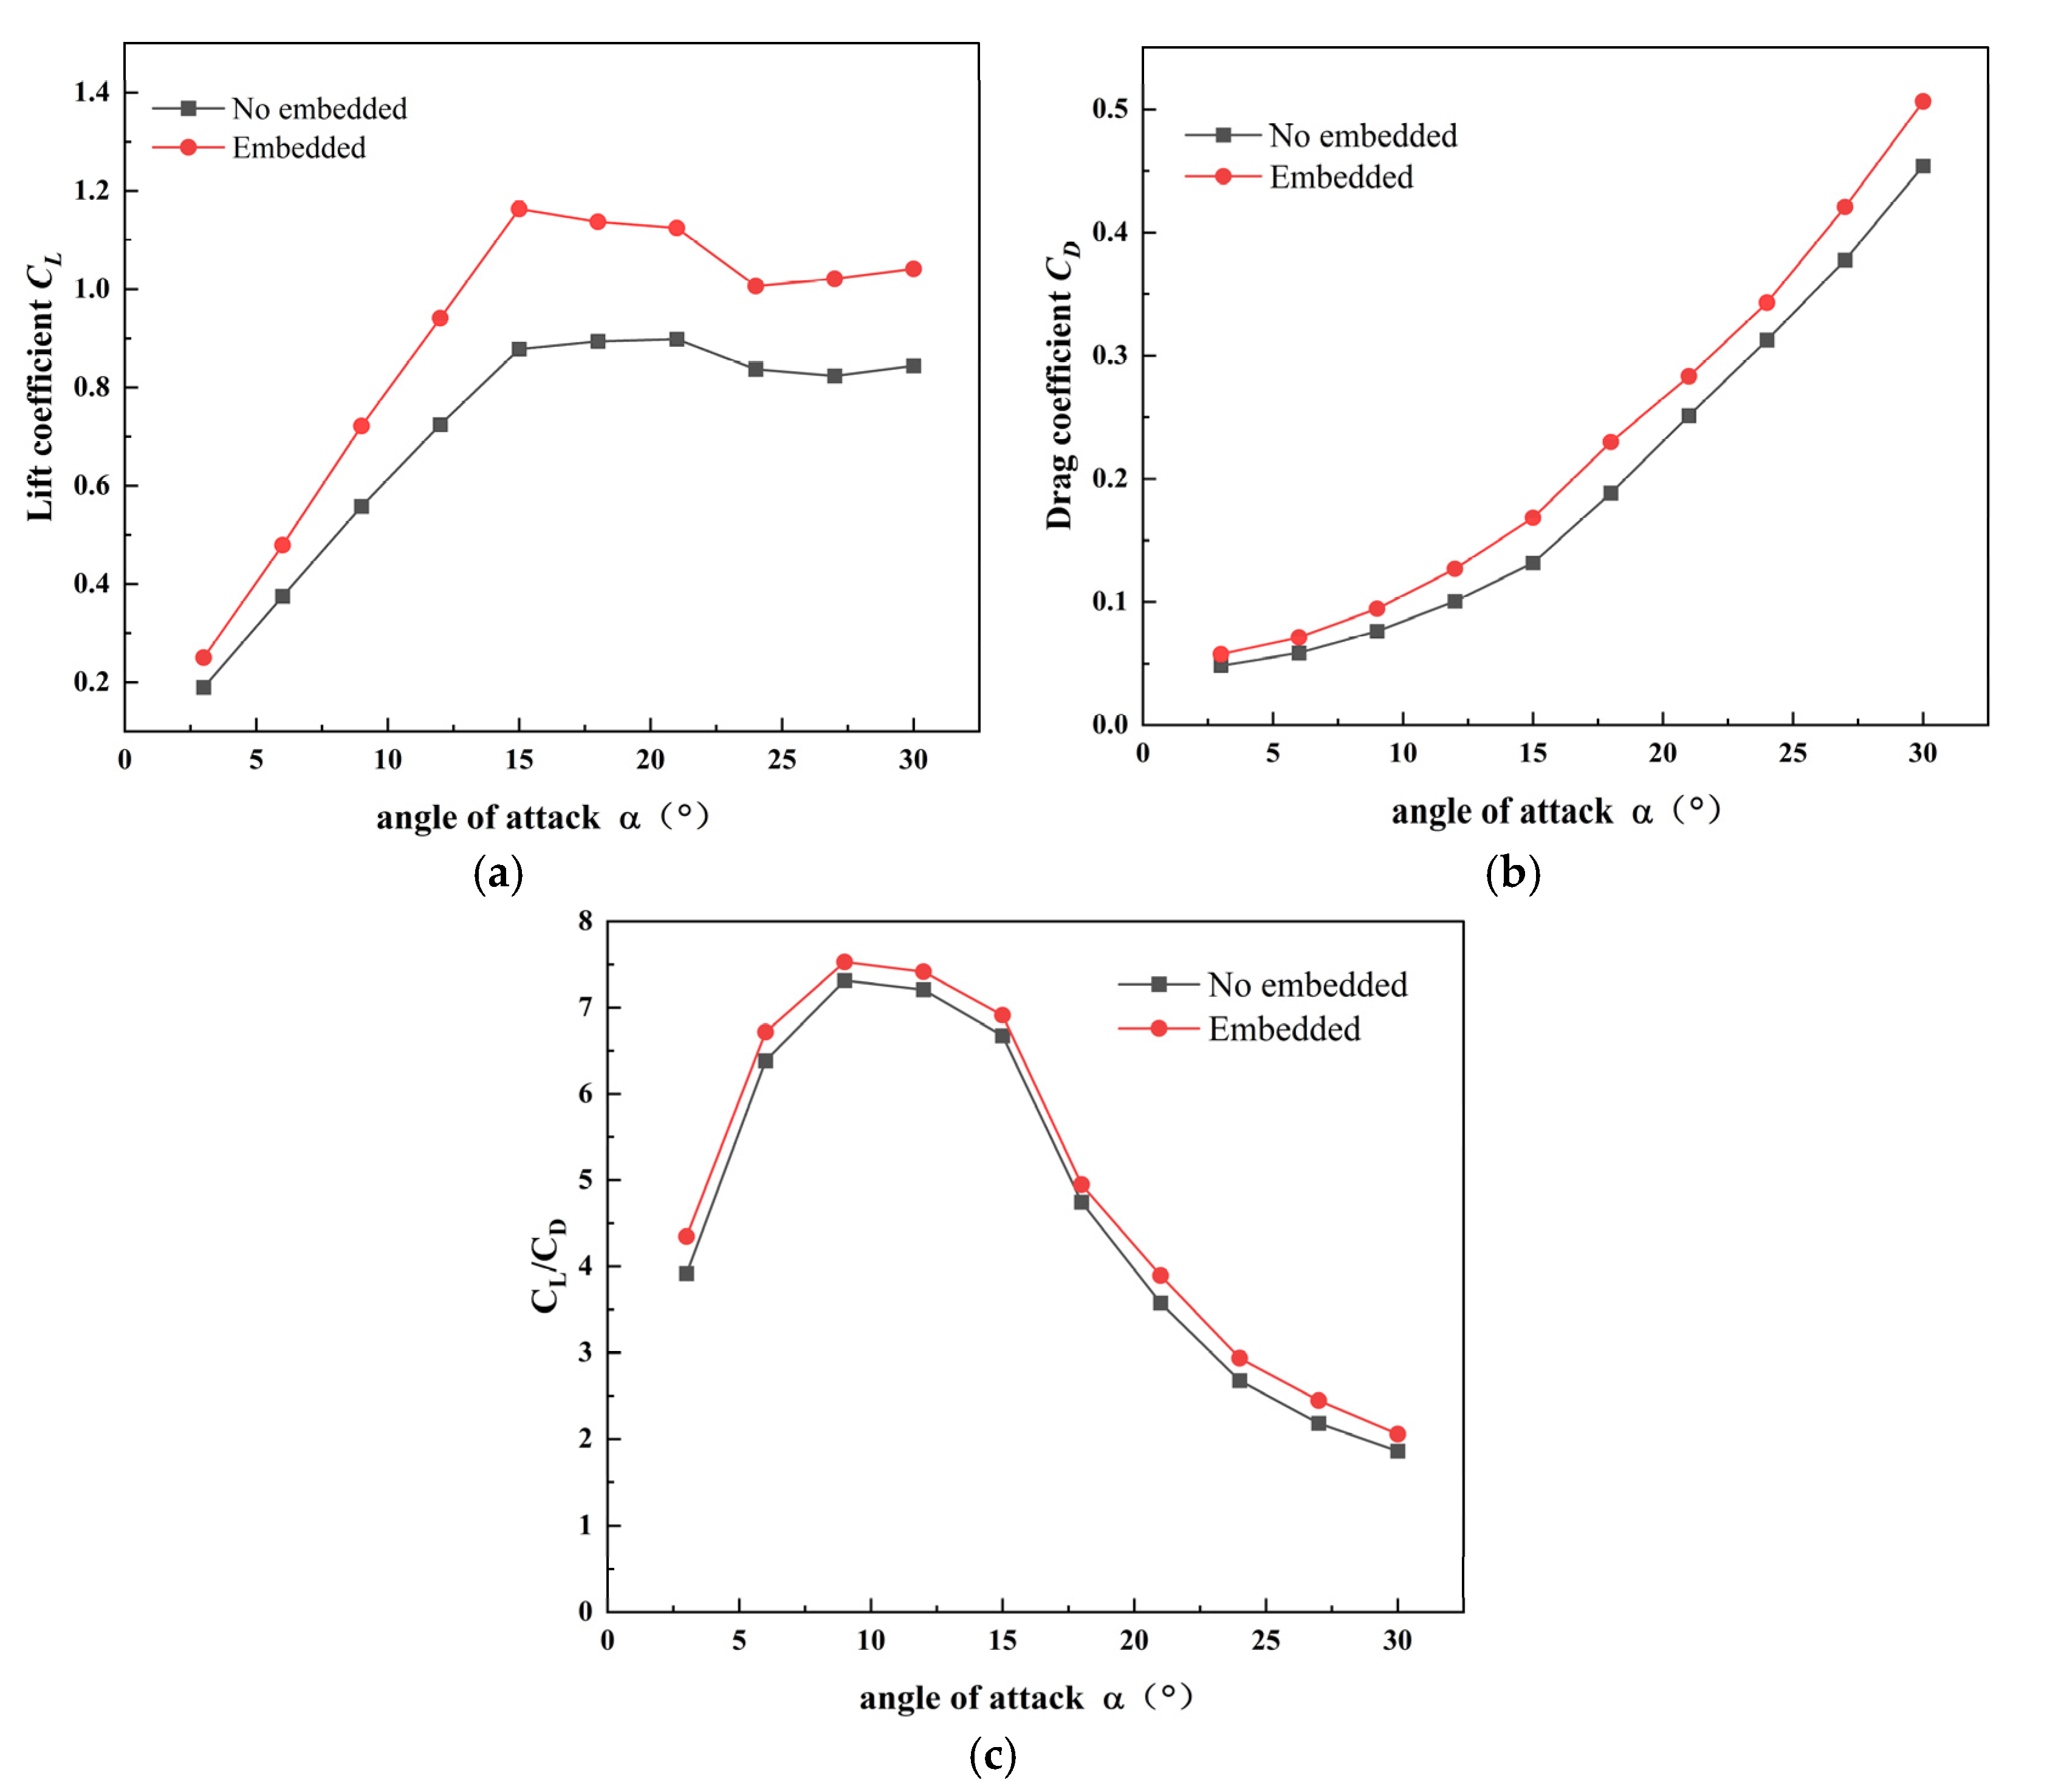
As depicted in Figure 5a, the lift coefficient of the main sail with an embedded tail sail exhibits a substantial increase relative to the main sail without a tail sail. The embedded tail sail delays flow separation on the leeward side of the main sail, enabling the airflow to adhere more closely to the sail surface, thereby expanding the effective windward area. The vortices or high-pressure zones generated by the tail fin fill the low-pressure region behind the main sail, increasing the overall pressure differential and directly enhancing lift. For both sail configurations, the lift coefficient demonstrated a consistent trend: it gradually rises with increasing angle of attack, peaks at a critical value, and subsequently declines, indicating stall inception near an angle of attack of 15°. In addition, the drag coefficient also increases to a certain extent (Figure 5b). Specifically, the drag coefficient continues to rise monotonically with increasing angles of attack. When evaluating the aerodynamic performance, the lift-to-drag ratio of the main wing sail with an embedded tail sail is higher than that of the single main sail (Figure 5c). The tail sail’s improvement in lift significantly outweighs its negative impact on drag, stabilizing the flow field behind the main sail, reducing turbulent energy loss, and minimizing ineffective drag, thus improving aerodynamic efficiency. The proposed sail structure demonstrates a 29.5% improvement in the peak lift coefficient compared to a single main wing sail. The increase in lift coefficient reduces stall risk, enabling the sailboat to maintain propulsion even in light wind conditions, thereby enhancing endurance. The improved lift generation also translates to greater lateral force at equivalent wind speeds, minimizing speed loss during maneuvers. These findings suggest that the aerodynamic performance of main sails equipped with embedded tail sails is superior to that of unembedded main sails. Figure 6 presents a comparison of the Q-criteria contour between the embedded tail sail and the single wing sail. Moreover, a comparison with the research data on slotted-flap sails from Li et al. reveals a consistent trend in performance. Both studies indicate that the lift coefficient peaks at an attack angle of 15°. However, while the maximum lift coefficient reported by Li Senmao et al. [10] is approximately 0.9, the embedded stern sail proposed in this study achieves a significantly higher value of around 1.16, underscoring the advantage of our design. The comparison is shown in Table 3.

4.2. Comparative Aerodynamic Analysis of Traditional Flap Sails and Embedded Tail Sails

For consistency and comparability, the deflection angle is fixed at 15° for both the embedded tail sail and the traditional flap sail, and all other geometric parameters are maintained identical to those used in the preceding simulations. The flap chord is set to the same percentage of the main sail chord (30%), and the hinge point is located at the leading edge of the flap/tail sail. The gap for the slotted flap is set to a standard value of 1% of the chord length. This controlled setup ensures that any observed variations in aerodynamic performance can be directly attributed to structural optimization. Figure 7 presents a comparison of velocity cloud diagrams between the embedded tail sail and the slotted-flap sail.
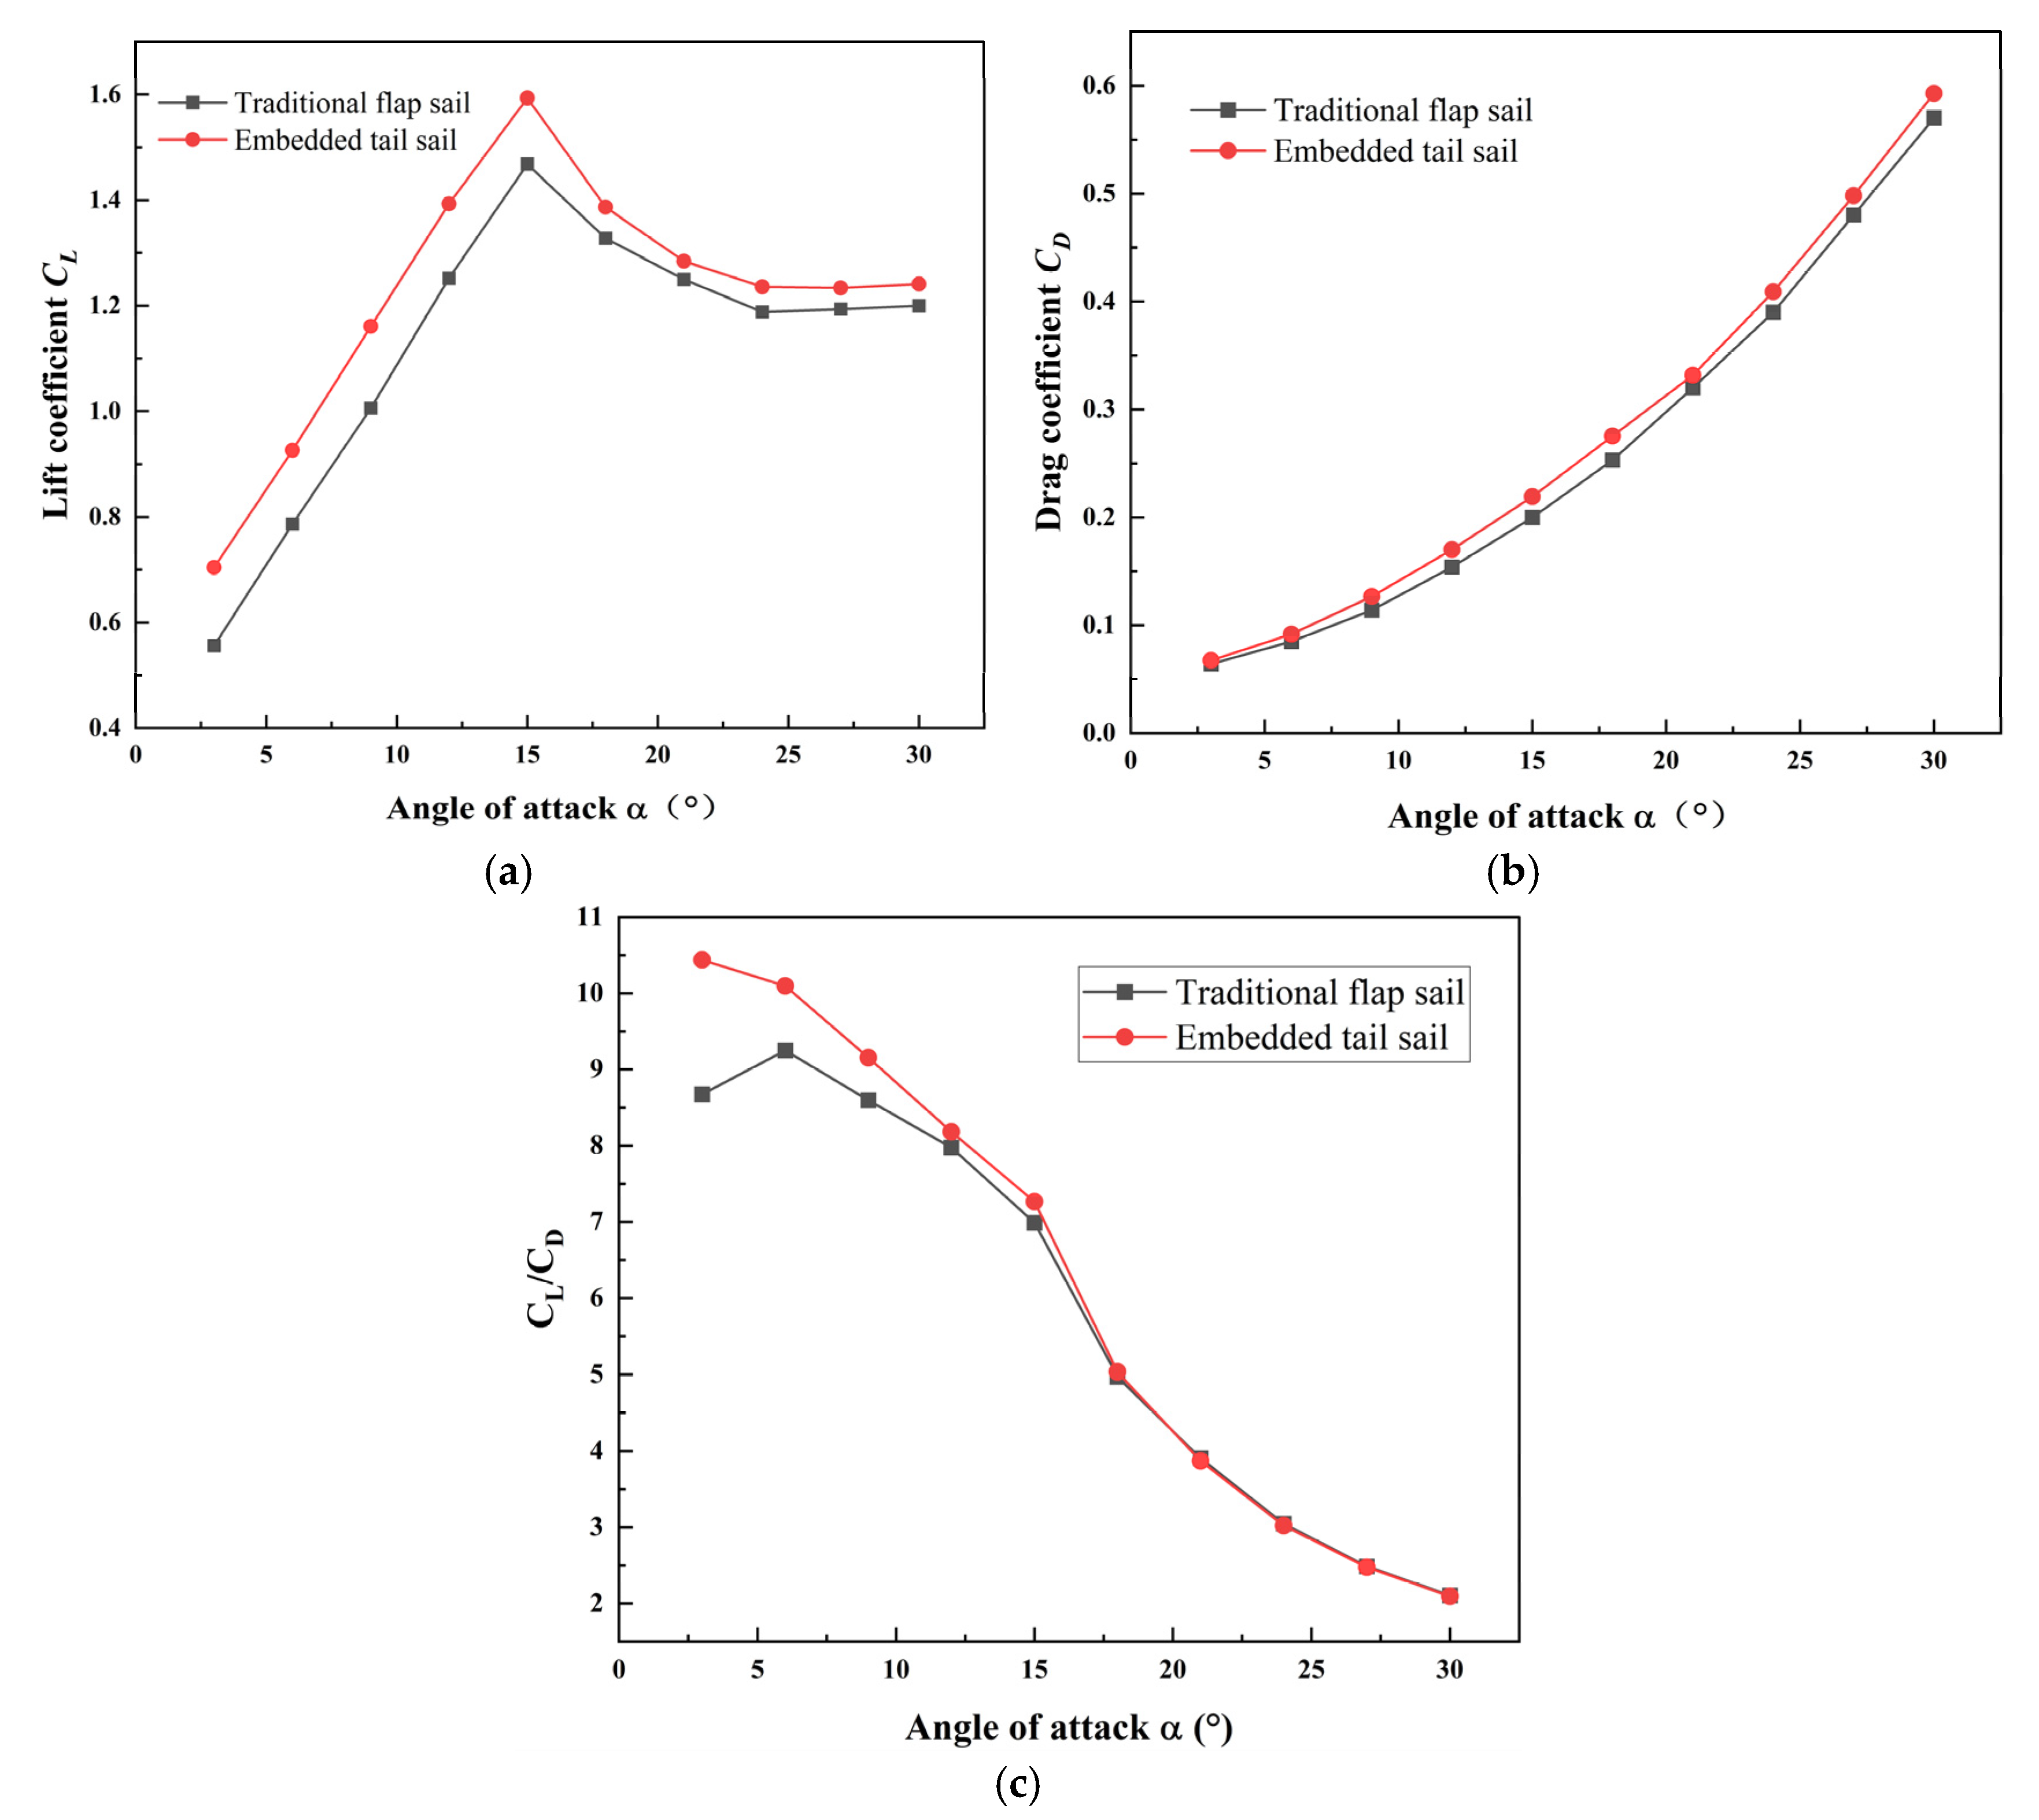
As illustrated in Figure 8, the embedded tail sail demonstrates a notable improvement in aerodynamic performance over the traditional flap sail, as evidenced by the consistently increasing trend in the lift coefficient (Figure 8a). The tail wing generates counter-rotating vortex pairs that effectively suppress flow separation on the main sail leeward side, increasing airflow attachment length. Secondly, the “high-pressure wedge zone” formed between the tail wing and main sail optimizes pressure distribution, enhancing leeward-side low-pressure stability. Finally, the integrated design reduces tip vortex energy loss, achieving 11.6% higher lift coefficient than slotted flaps. This vortex-dominant lift enhancement approach avoids the inherent turbulent kinetic energy dissipation and mechanical leakage issues of slotted structures, making it particularly suitable for uncrewed sailboats operating in variable conditions. As illustrated in Figure 8b, there is a negligible variation in the drag coefficient between the two configurations. As illustrated in Figure 8c, the embedded tail sail significantly improves the lift–drag ratio at small angles of attack (α < 15°), which is attributed to its reverse vortex pair effectively suppressing flow separation. However, the traditional flap performs relatively poorly due to insufficient development of the slot jet and high frictional resistance. At large angles of attack (α > 18°), the performance of both tends to be consistent because flow separation has dominated at this point, and the control effects of the tail fin and flap are both close to the limit. Compared with the traditional flap, the peak lift–drag ratio of the embedded tail sail is increased by 12.8%.

4.3. Influence of Embedded Tail Sail Area Size on the Aerodynamic Performance of the Main Sail

To investigate the influence of the embedded tail sail area (i.e., S1 = 25%S0, S1 = 30%S0, S1 = 35%S0, and S1 = 40%S0) on the aerodynamic performance of the main sail, fluid dynamic simulations were conducted for the main sail across angles of attack ranging from 0° to 30°. The deflection angle of the embedded tail sail remains at 0°.
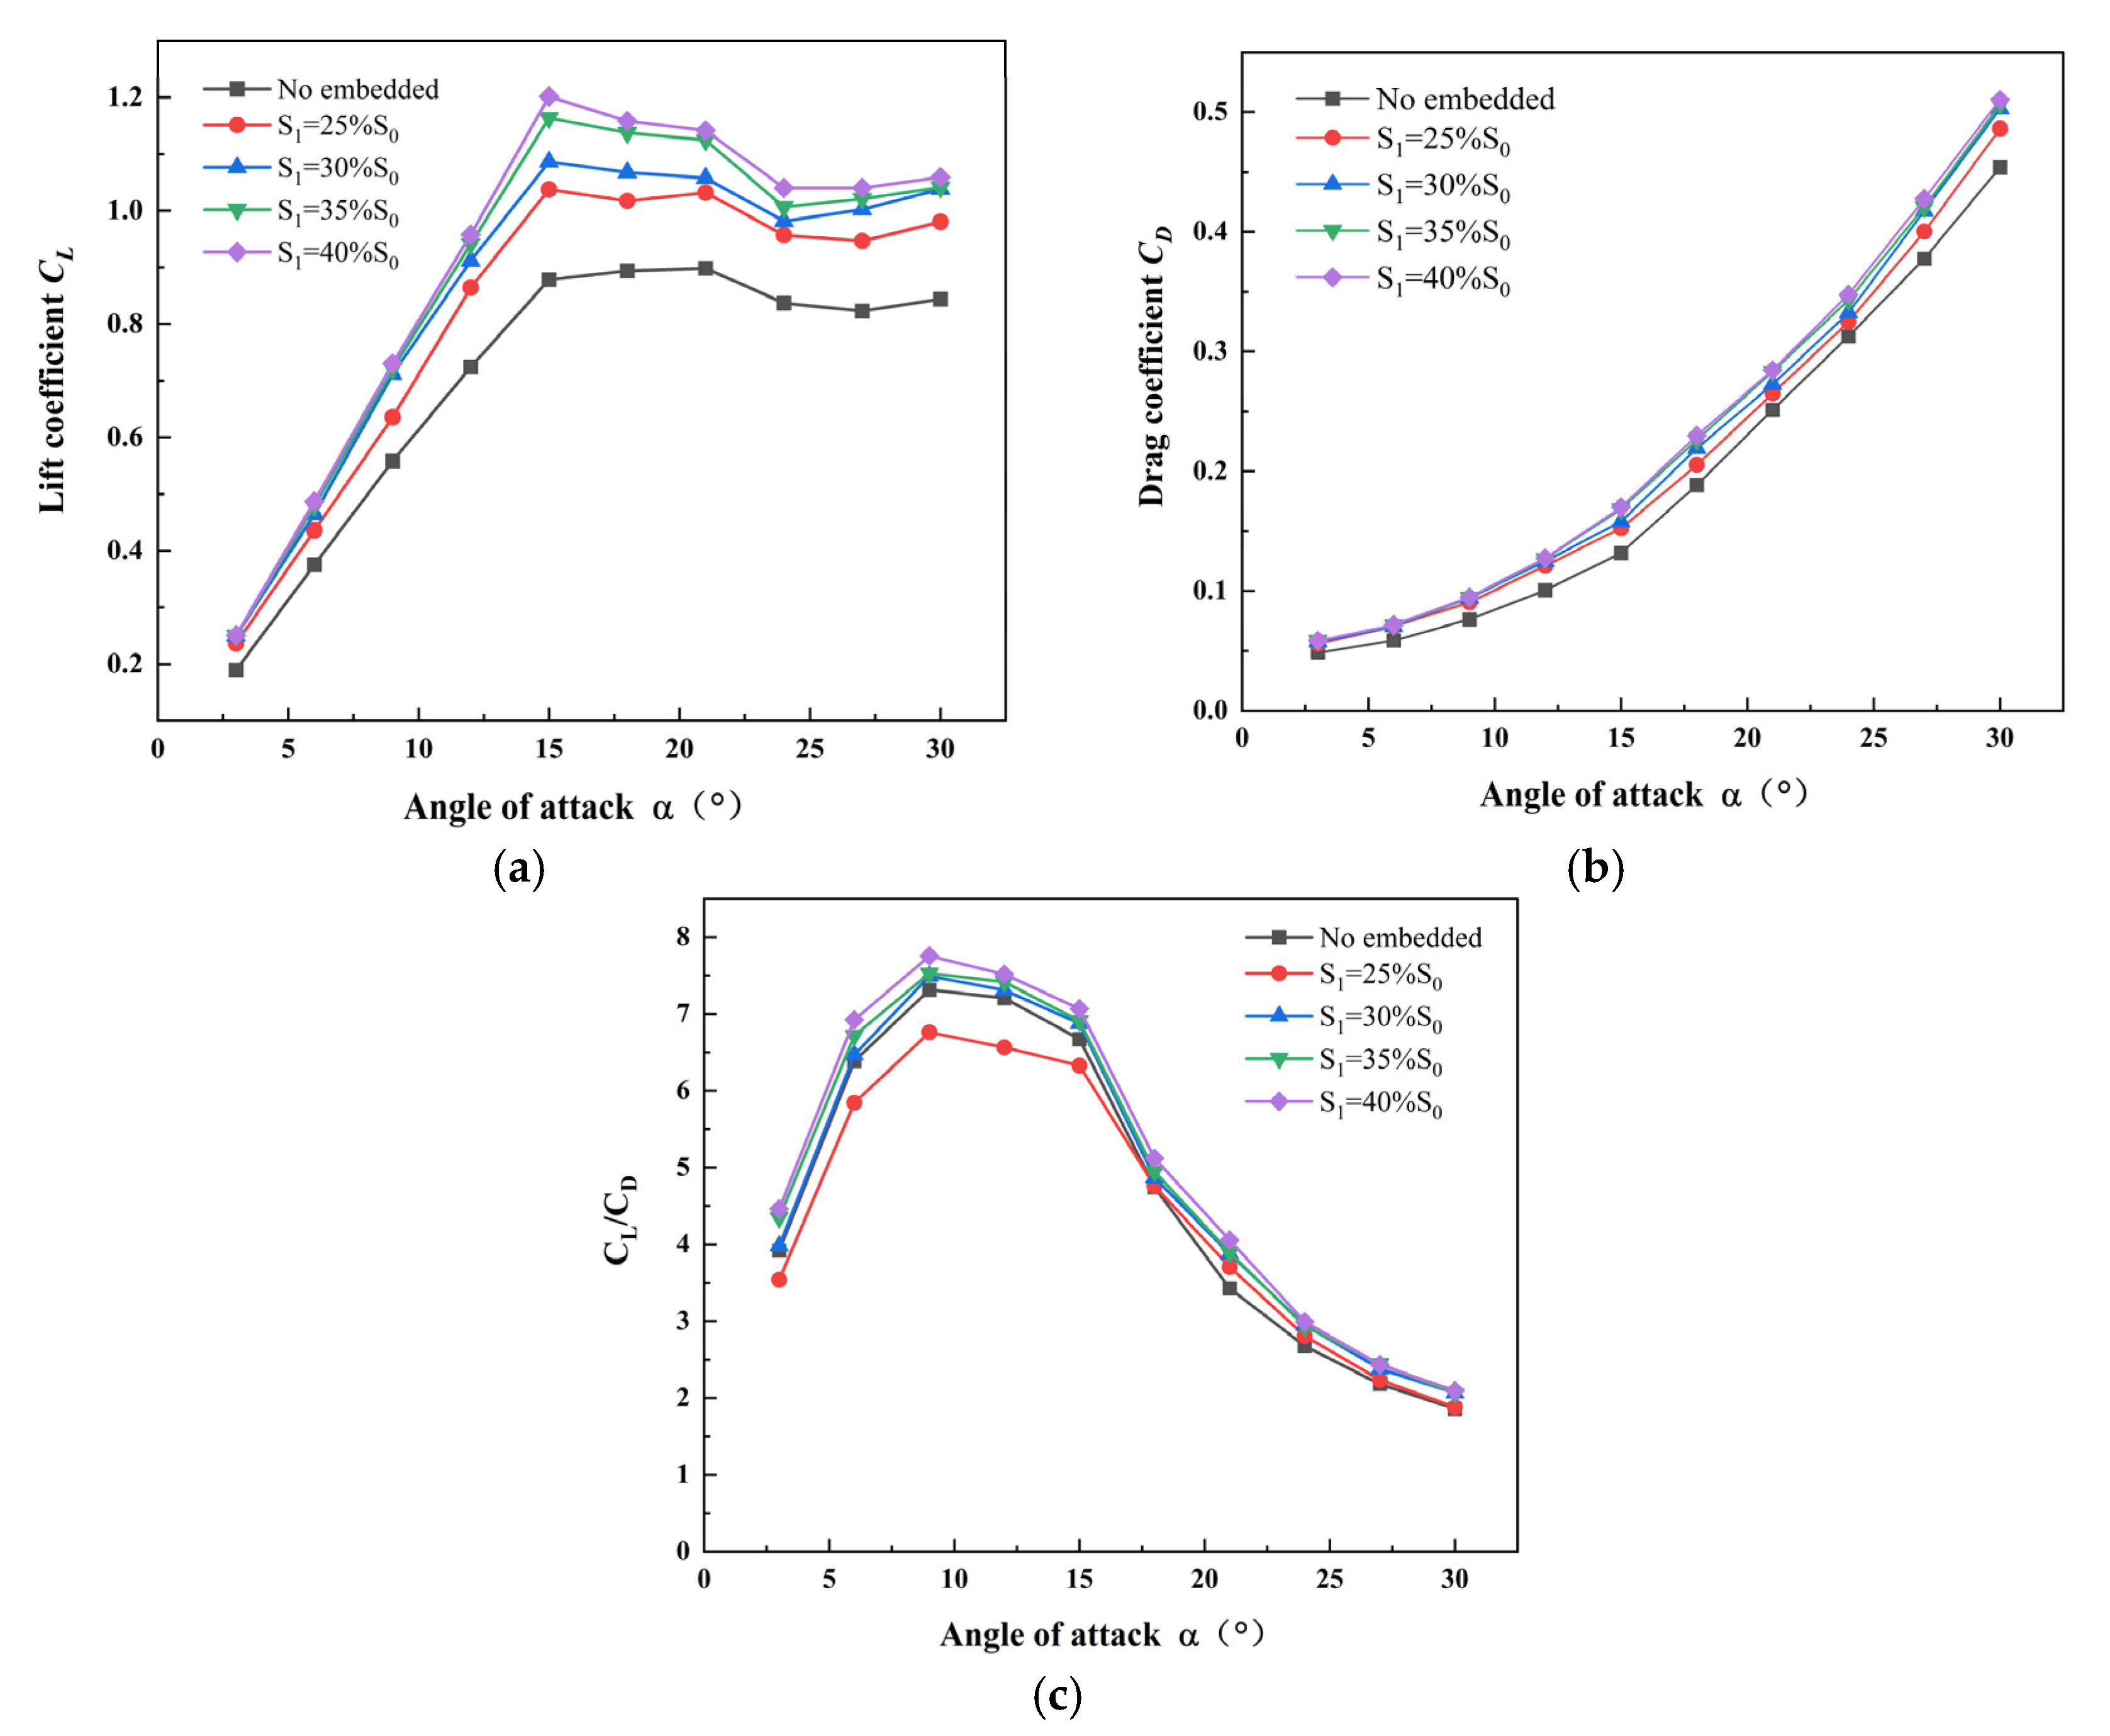
Figure 9a reveals that increasing the embedded area enhances the lift coefficient of the main sail at a given angle of attack. The tail wing modifies the flow separation behavior behind the main sail, reducing turbulent regions on the sail surface. As the tail wing’s area increases, its flow-guiding effect intensifies, enabling more streamlined airflow to be directed toward the trailing edge of the main sail. This reduces pressure differential losses across the main sail surface and enhances lift generation efficiency, resulting in an increased lift coefficient. In addition, as the angle of attack increases, the lift coefficient rises, peaks, and subsequently declines, indicating stall inception near 15°. When the angle of attack exceeds 15°, a dramatic increase in adverse pressure gradient on the upper surface of the airfoil triggers massive boundary layer separation, forming low-pressure vortex separation zones. This leads to a sudden drop in lift coefficient accompanied by a sharp rise in drag, resulting in the stall phenomenon. In contrast, the drag coefficient increases monotonically with angles of attack, as shown in Figure 9b. The lift-to-drag ratio exhibits a gradual rising trend with increasing embedded areas, and the optimal lift-to-drag ratio is obtained at the angle of attack of 10° (Figure 9c). When the embedded area of the tail sail is small, although the lift coefficient is greater than that without an embedded area, the lift–drag ratio is smaller than that without an embedded area. However, this does not mean that the larger the area of the embedded tail sail, the better. An excessively large area may cause the overall system load to exceed the limit, leading to damage to the sail body or affecting navigation stability. On the other hand, it may alter the airflow interaction mechanism, deteriorating lift–drag characteristics under specific conditions such as high wind speeds and even increasing the risk of stalling. Therefore, S1 = 35%S0 was selected as the optimal configuration for further study. This area ratio achieves the lift-to-drag improvement (15.4%) in our CFD simulations.
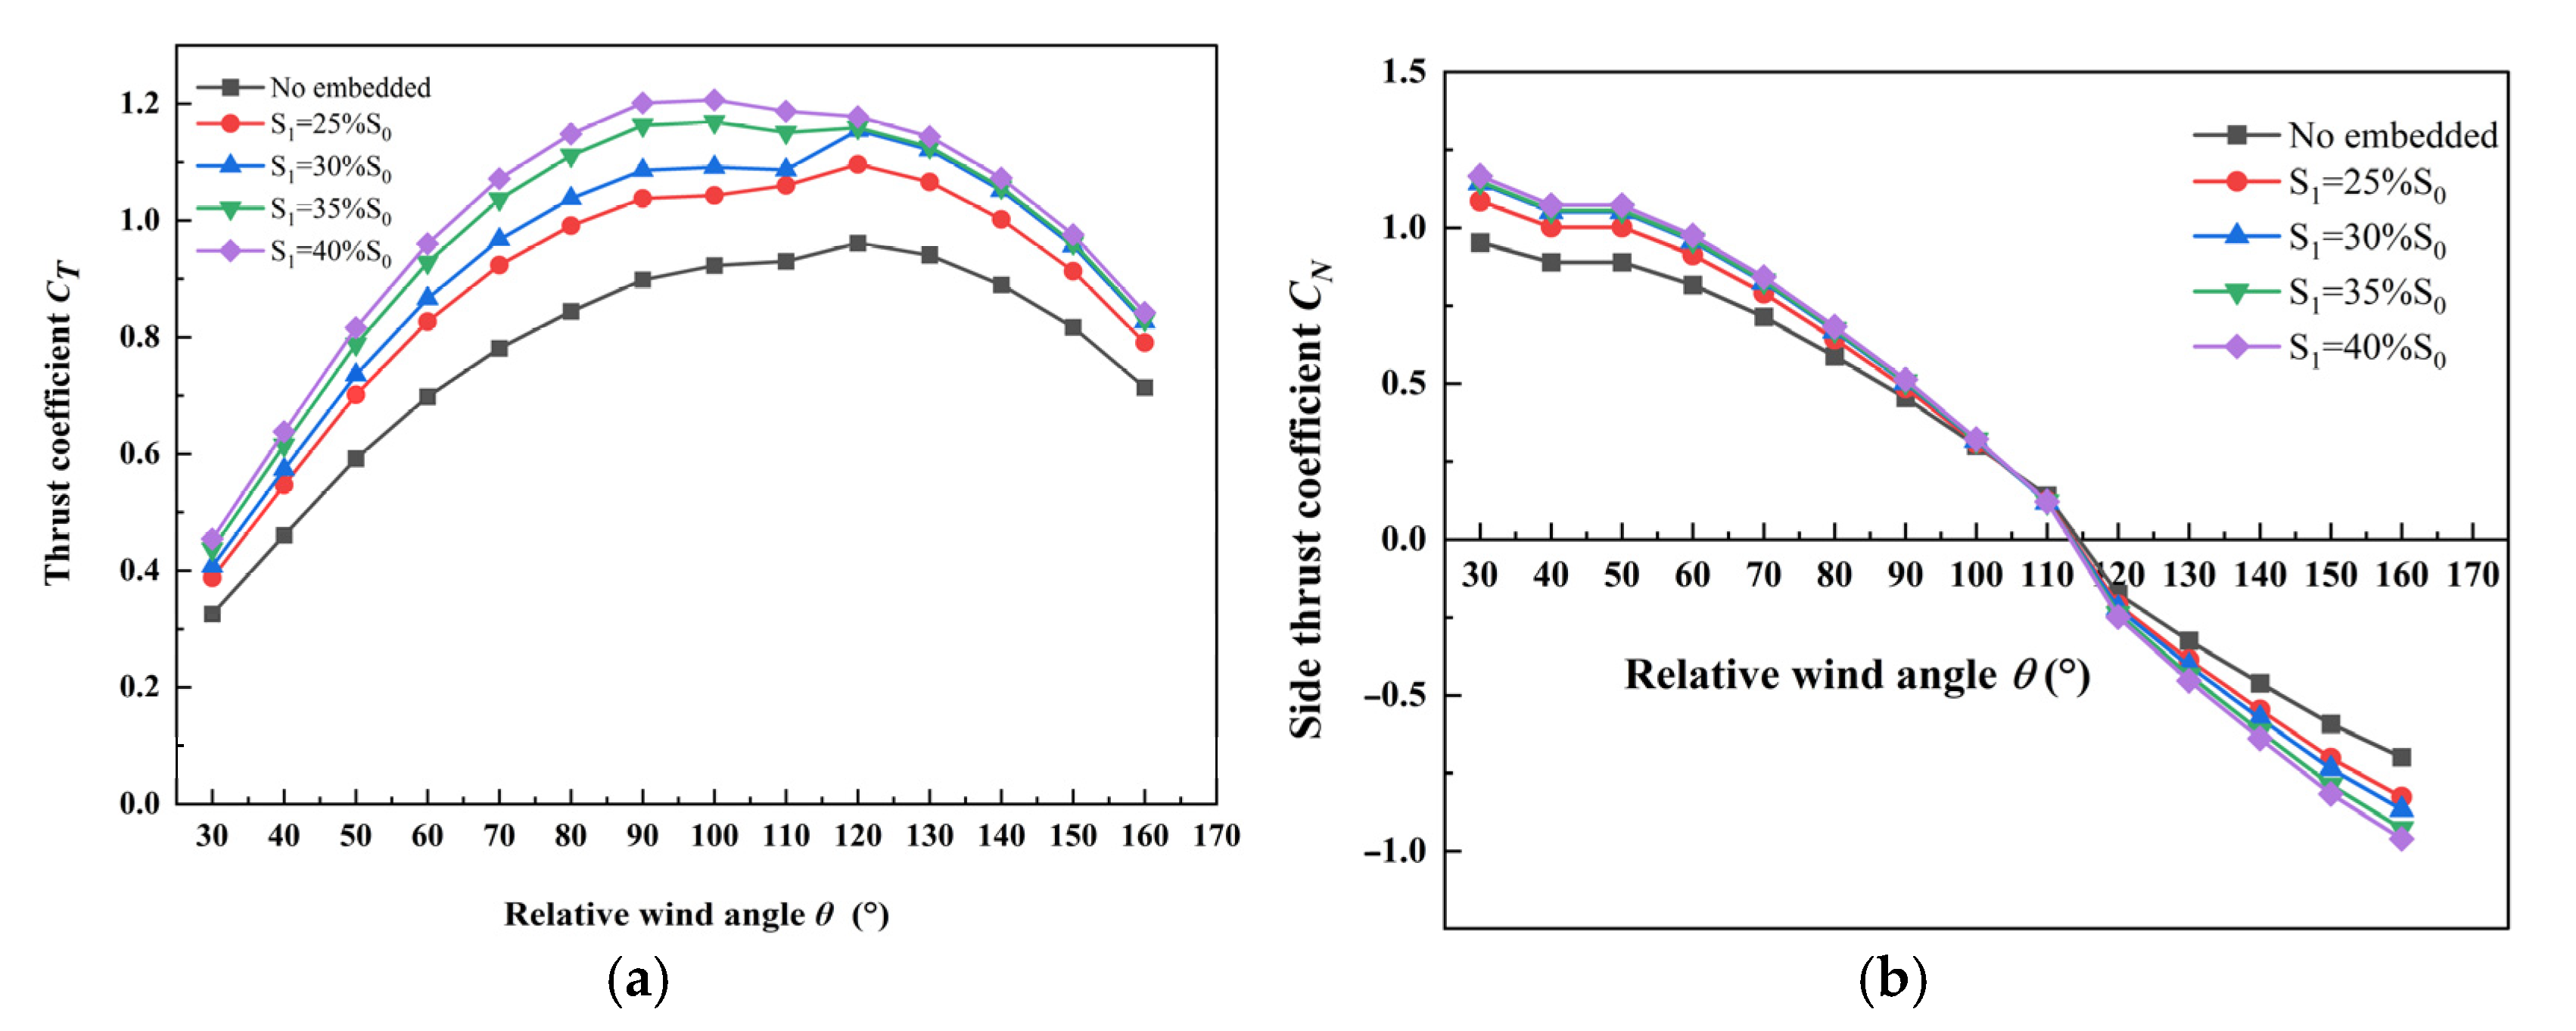
For an uncrewed sailboat, thrust generated by the sail is the main propulsive force. Figure 10 illustrates the variation in the thrust coefficient and the side thrust coefficient of the uncrewed sailboat with respect to the relative wind angle θ in the range of 30° to 160°. Figure 10a reveals that increasing the embedded area of the tail sail enhances the thrust coefficient of the uncrewed sailboat. When θ = 30°, the thrust coefficient is minimal, while the side thrust coefficient is substantial (Figure 10b), adversely affecting the sailboat’s navigation efficiency. For 30° ≤ θ ≤ 100°, the thrust coefficient increases progressively with θ, whereas the side thrust coefficient decreases, which is advantageous for sailing. The thrust coefficient attains its maximum value when the relative wind angle θ reaches 100°. This is because, at this wind angle, the vector sum of the lift and drag components aligned with the thrust direction is maximized. Within the range of 100° to 160°, the thrust coefficient exhibits a decreasing trend as the relative wind angle θ increases. The side thrust coefficient shows a decreasing trend over the range of θ from 30° to 160°, and it transitions to a negative value in the vicinity of 110° to 120°, indicating a reversal in the direction of the side thrust.

4.4. Impact of Deflection Angle for the Tail Sail on the Aerodynamic Performance of the Main Sail

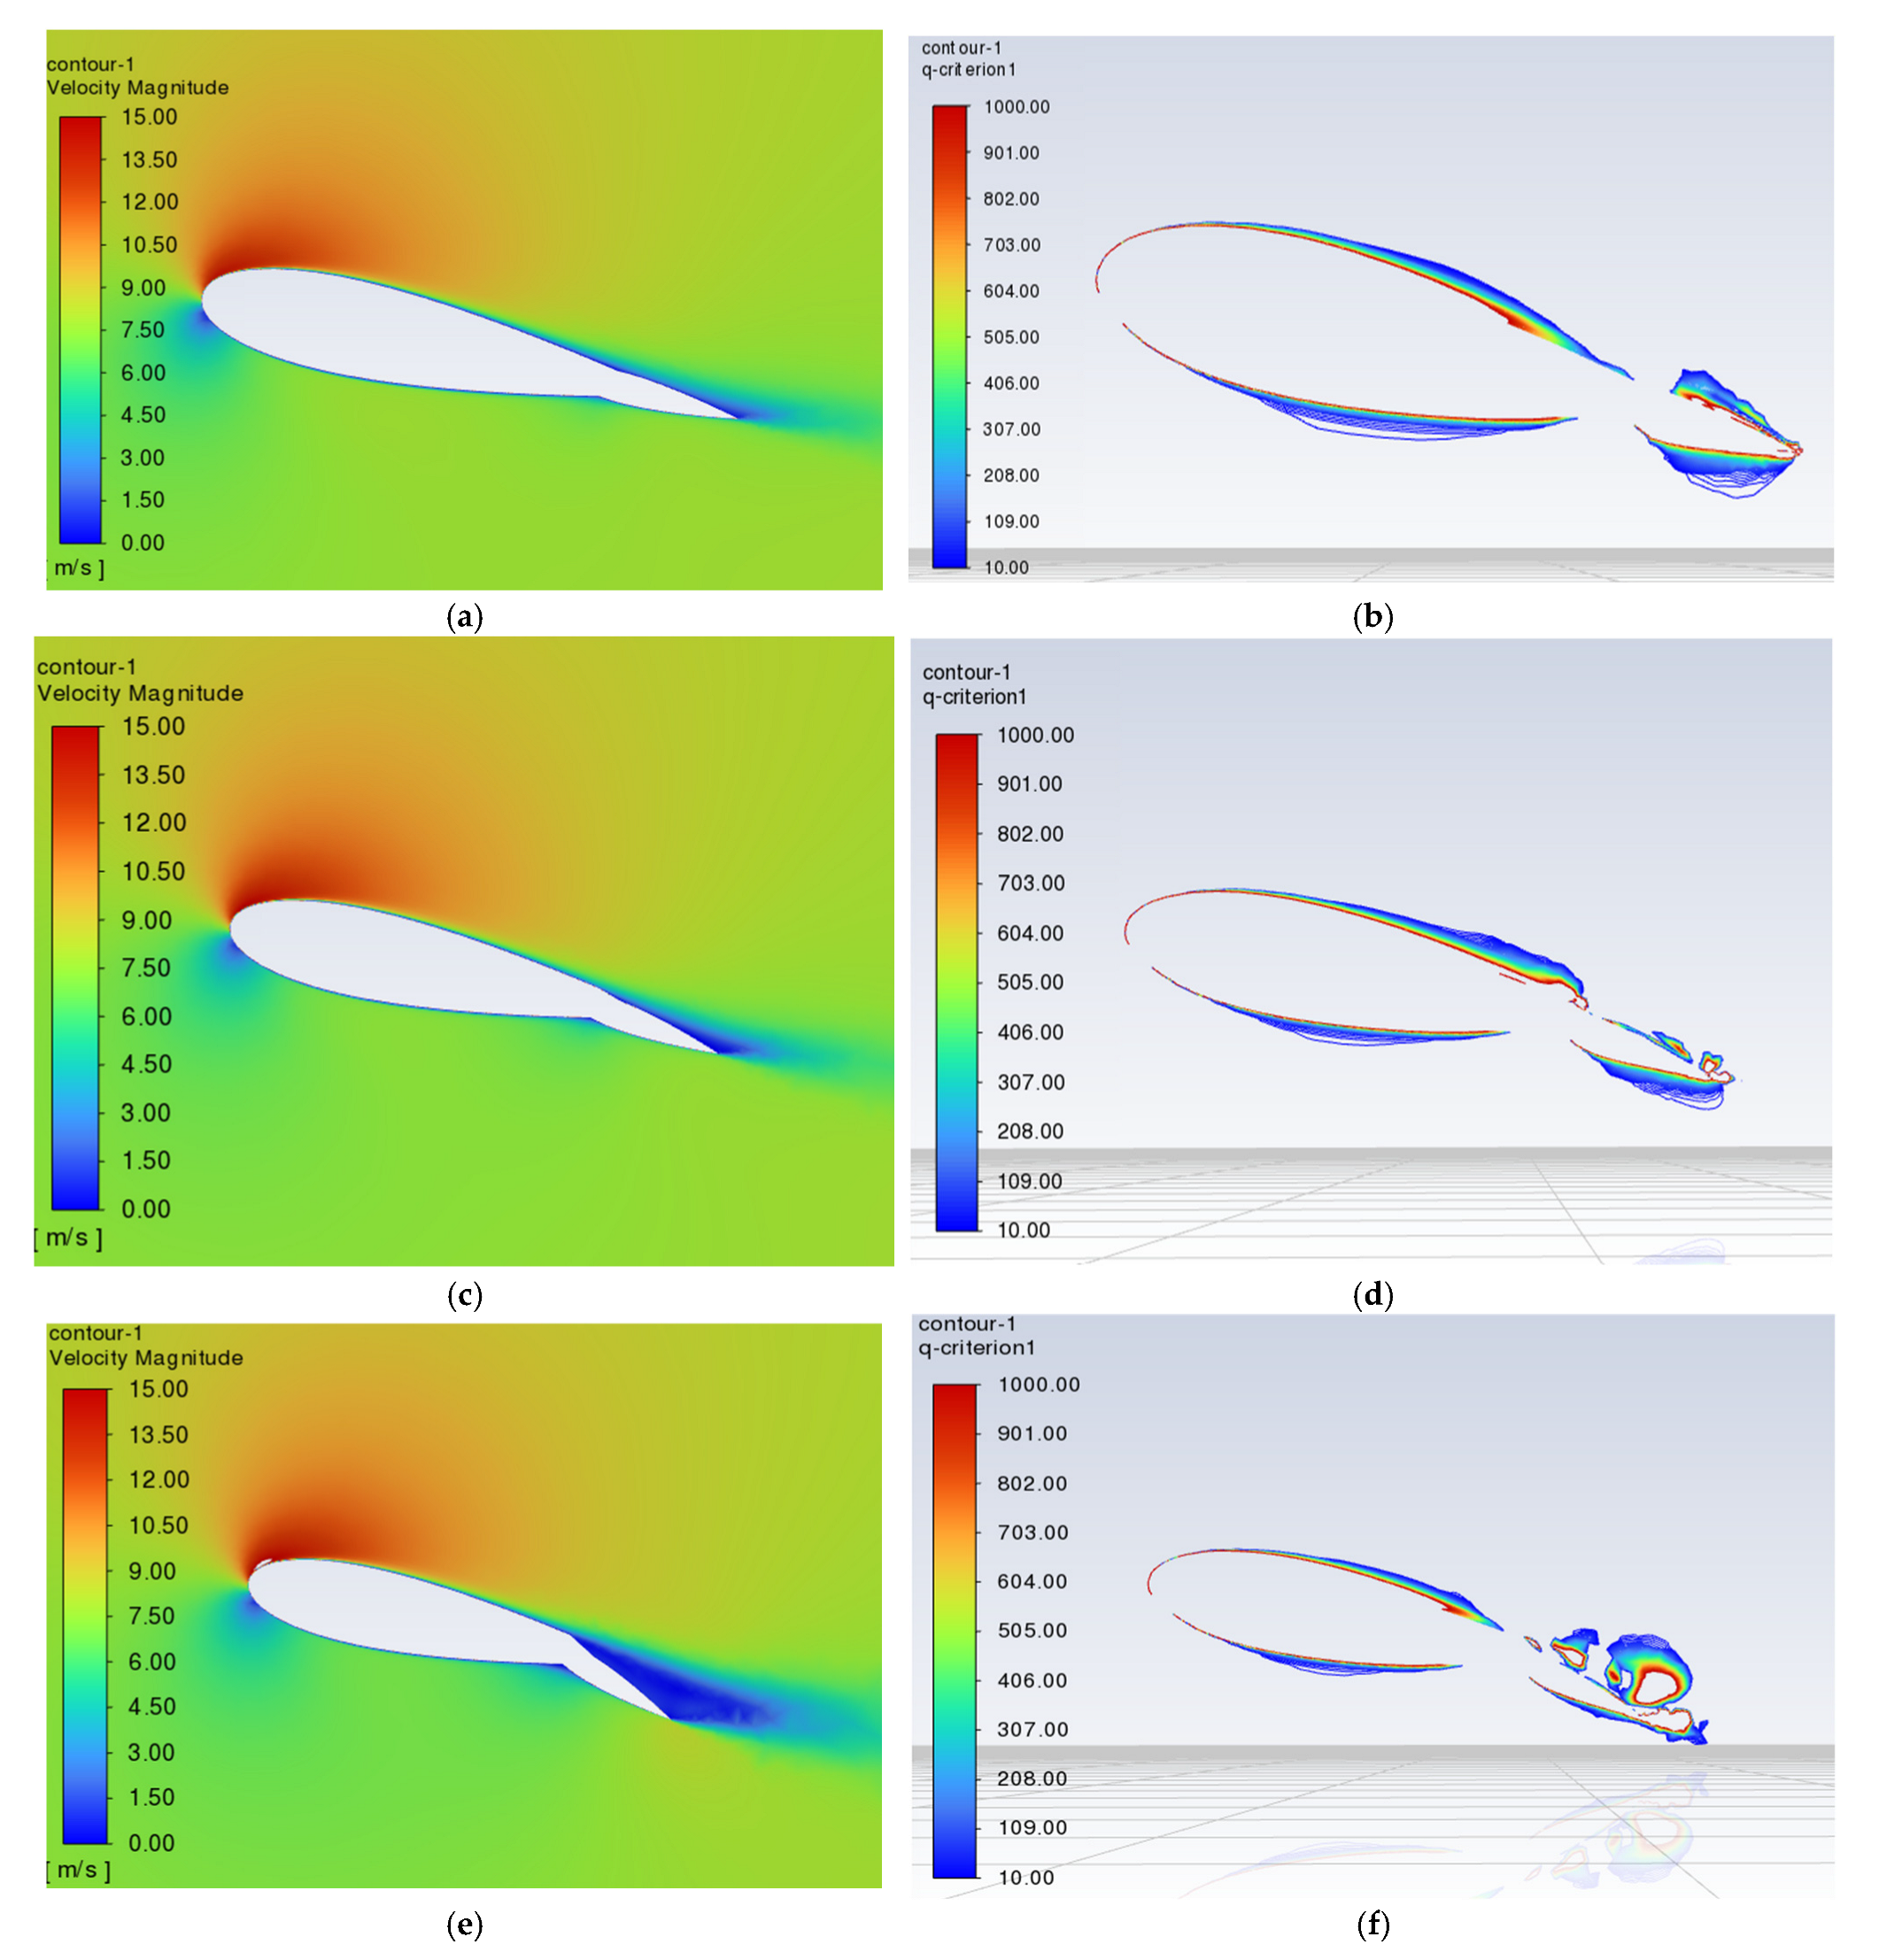
In order to investigate the influence of αf on the aerodynamic performance, simulations were conducted for tail sails with αf values of 0°, 3°, 6°, 9°, 12°, and 15°. The maximum achievable deflection is geometrically constrained to approximately 15° due to the physical interference between the backsail trailing edge and the main sail structure. Figure 11 shows velocity cloud diagrams and Q-criteria contour for three representative cases: αf = 3°, αf = 9°, and αf = 15°, at a fixed angle of attack of 12°. When αf = 3°, only a weak flow disturbance occurs in the wake region. The Q-criterion contour shows that there are low-intensity vortex embryos locally, but no complete vortex structure has been formed. When αf = 9°, the vortex system begins to form in the wake. When αf = 15°, the vortex intensity is further enhanced, the high value range of the Q-criterion is significantly expanded, and the maintenance time of the vortex is extended. It shows that the increase in tail sail angle not only promotes the generation of the vortex but also enhances the strength and stability of the vortex by changing the pressure distribution on the sail surface.
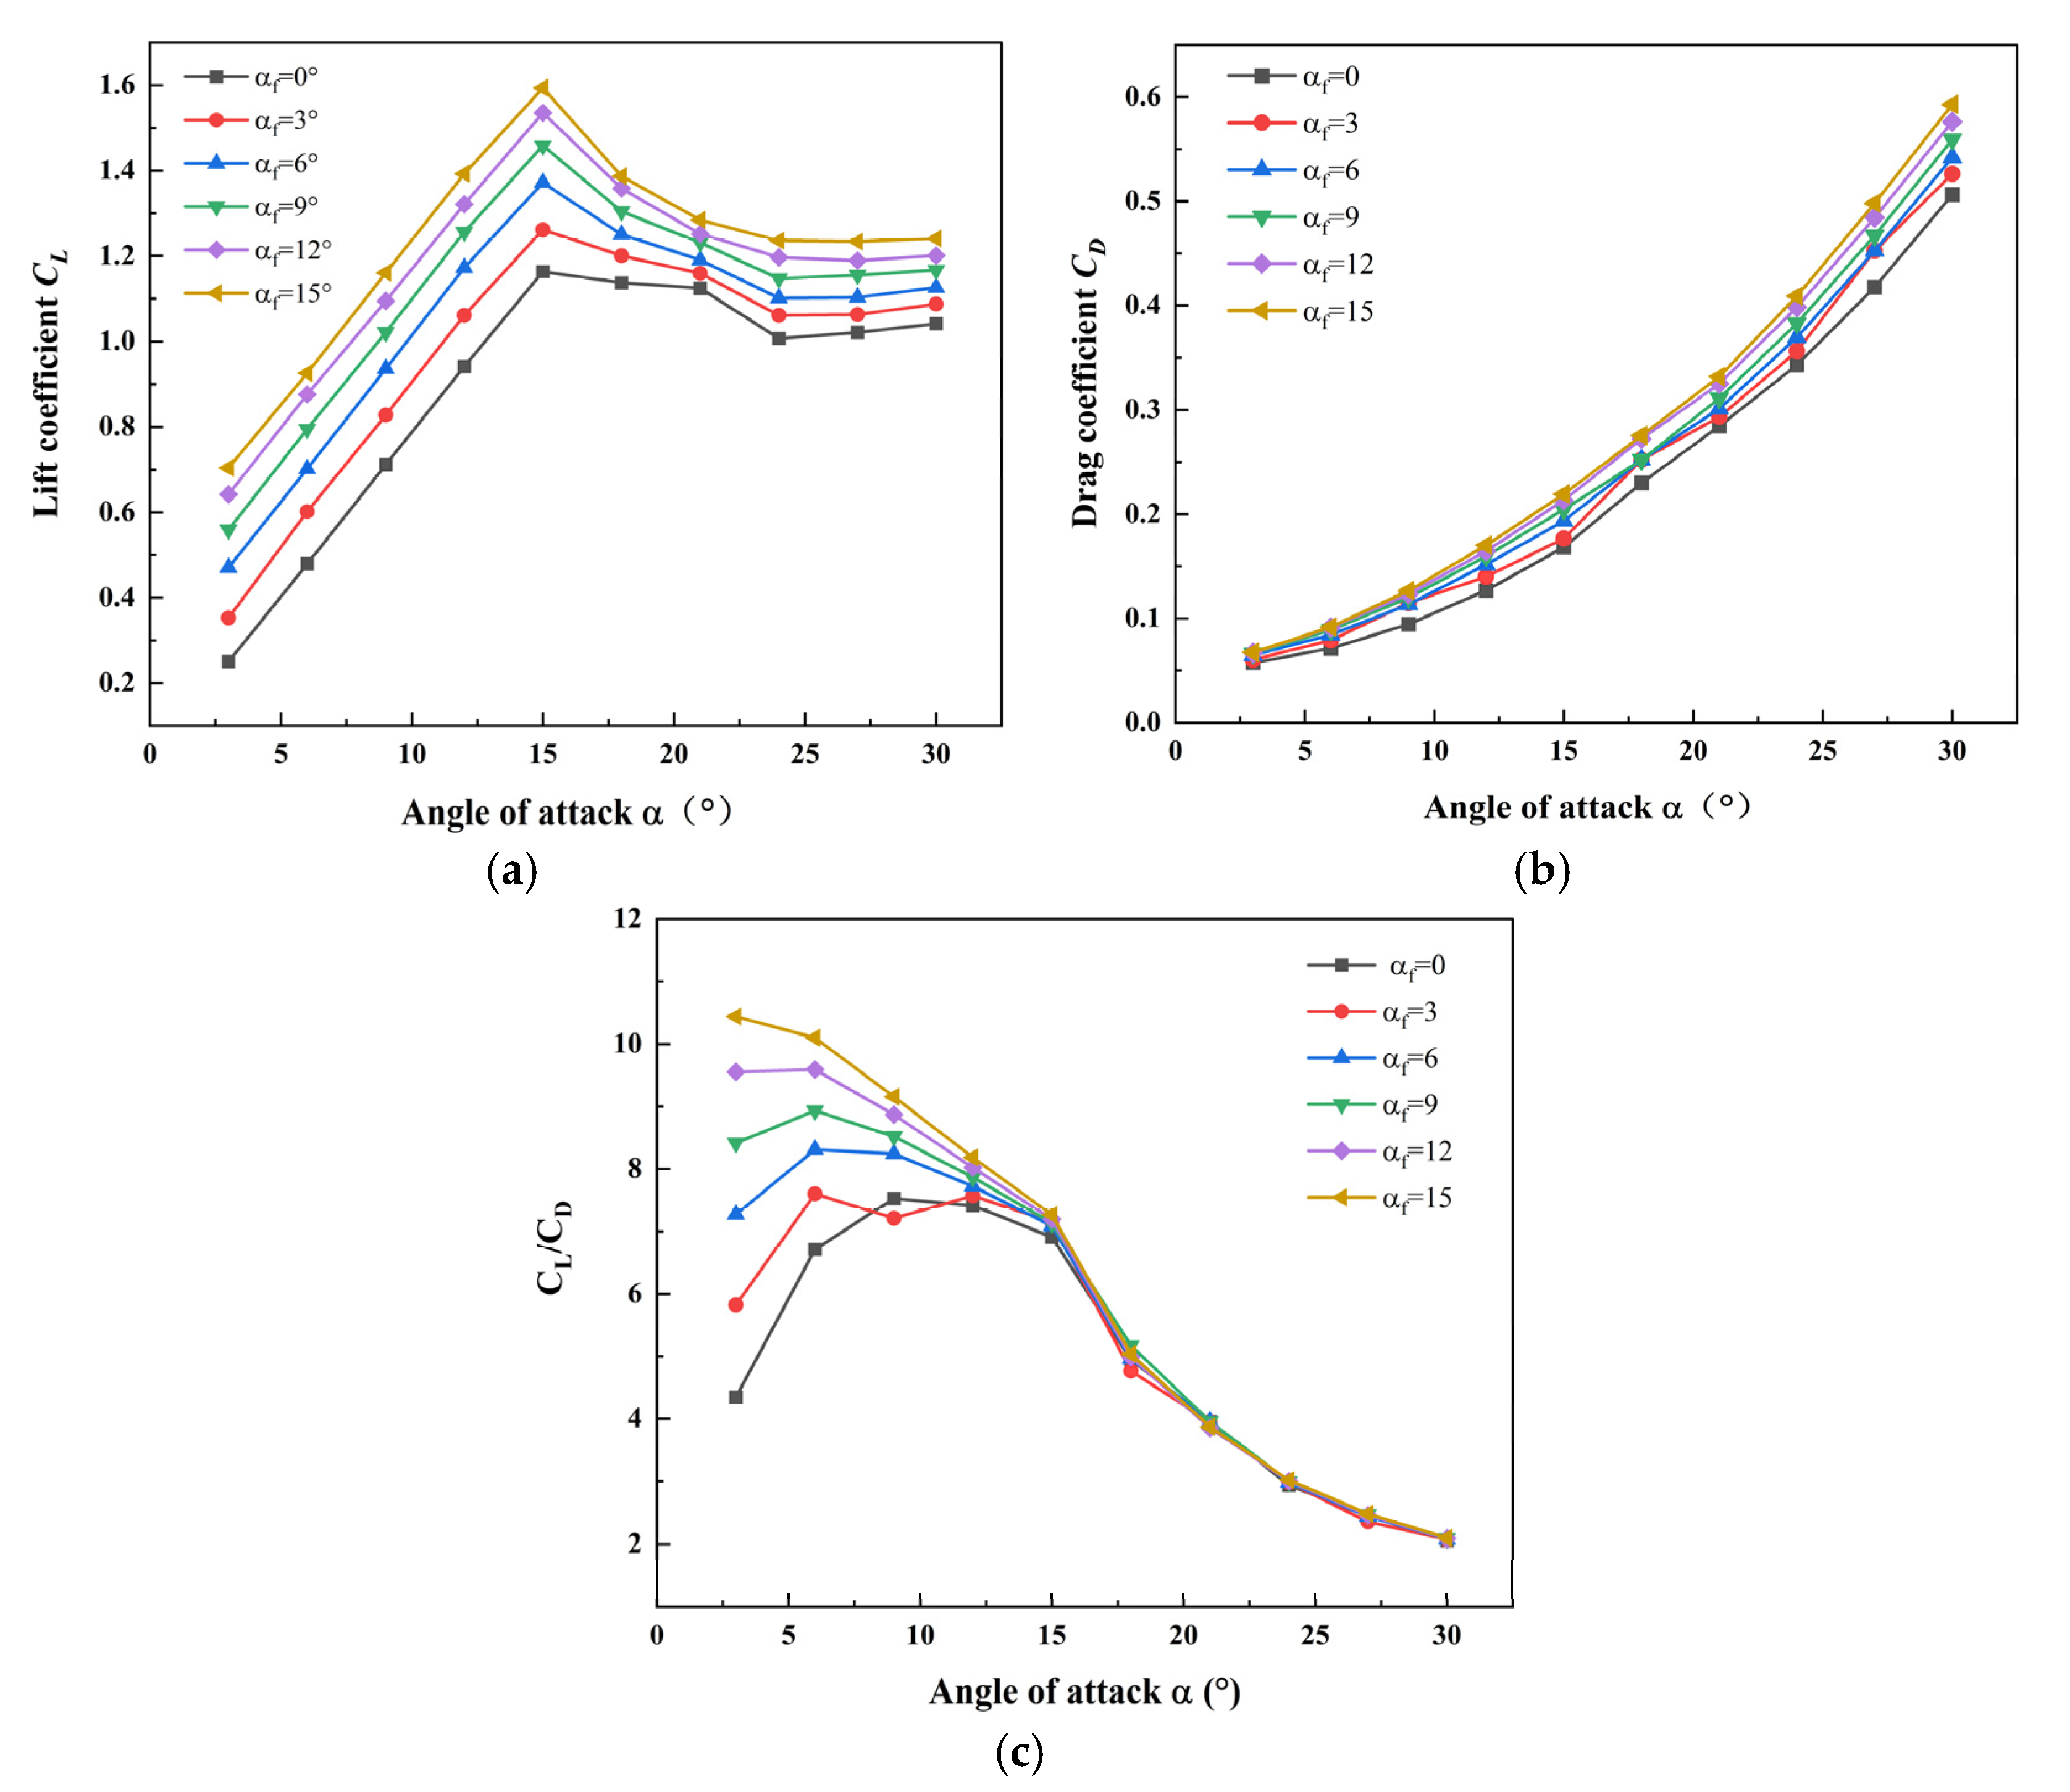
Figure 12a depicts the variation in the lift coefficient (CL) with respect to the angle of attack (α) within the range of 0° to 30° for different values of αf. All curves show a trend wherein the CL initially increases and subsequently exhibits a slight decline as the angle of attack rises. This observation implies that, within a specific range, an increase in the angle of attack leads to a progressive augmentation in the lift generated by the main wing sail. Notably, an increase in the tail flap deflection angle (αf) enhances the effective camber of the combined airfoil system, thereby amplifying the pressure differential and substantially improving lift performance. Under low-angle-of-attack conditions (α < 12°), the airflow maintains predominantly attached flow characteristics, resulting in a linear relationship between lift enhancement and αf. At higher angles of attack (α > 15°), flow separation becomes the dominant flow regime, consequently limiting achievable lift gains. Figure 12b illustrates that the drag coefficient of the main sail exhibits a positive correlation with the angle of attack. An increase in camber intensifies the adverse pressure gradient, leading to a thickening of the boundary layer. A rise in lift will naturally increase induced drag. When the deflection angle of the tail sail (αf) is too large, flow separation at the junction of the tail sail and the main sail will generate vortices, further increasing drag.
As illustrated in Figure 12c, at low angles of attack (α < 15°), the lift-to-drag ratio shows significant improvement as the deflected tail wing delays flow separation and extends the attached flow region. The efficient energy transfer from the tail wing to the main sail’s boundary layer enhances aerodynamic efficiency, causing the peak lift-to-drag ratio to shift toward lower angles of attack—this occurs because the camber effect of the tail wing is most pronounced before stall onset. At high angles of attack (α > 15°), the improvement in the lift-to-drag ratio diminishes as flow separation becomes dominant, reducing the control effectiveness of the tail wing. When the rate of drag increase surpasses the lift gain, the lift-to-drag ratio consequently decreases.

4.5. Computational Fluid Dynamics (CFD) Analysis of Hull–Sail Interaction Effects

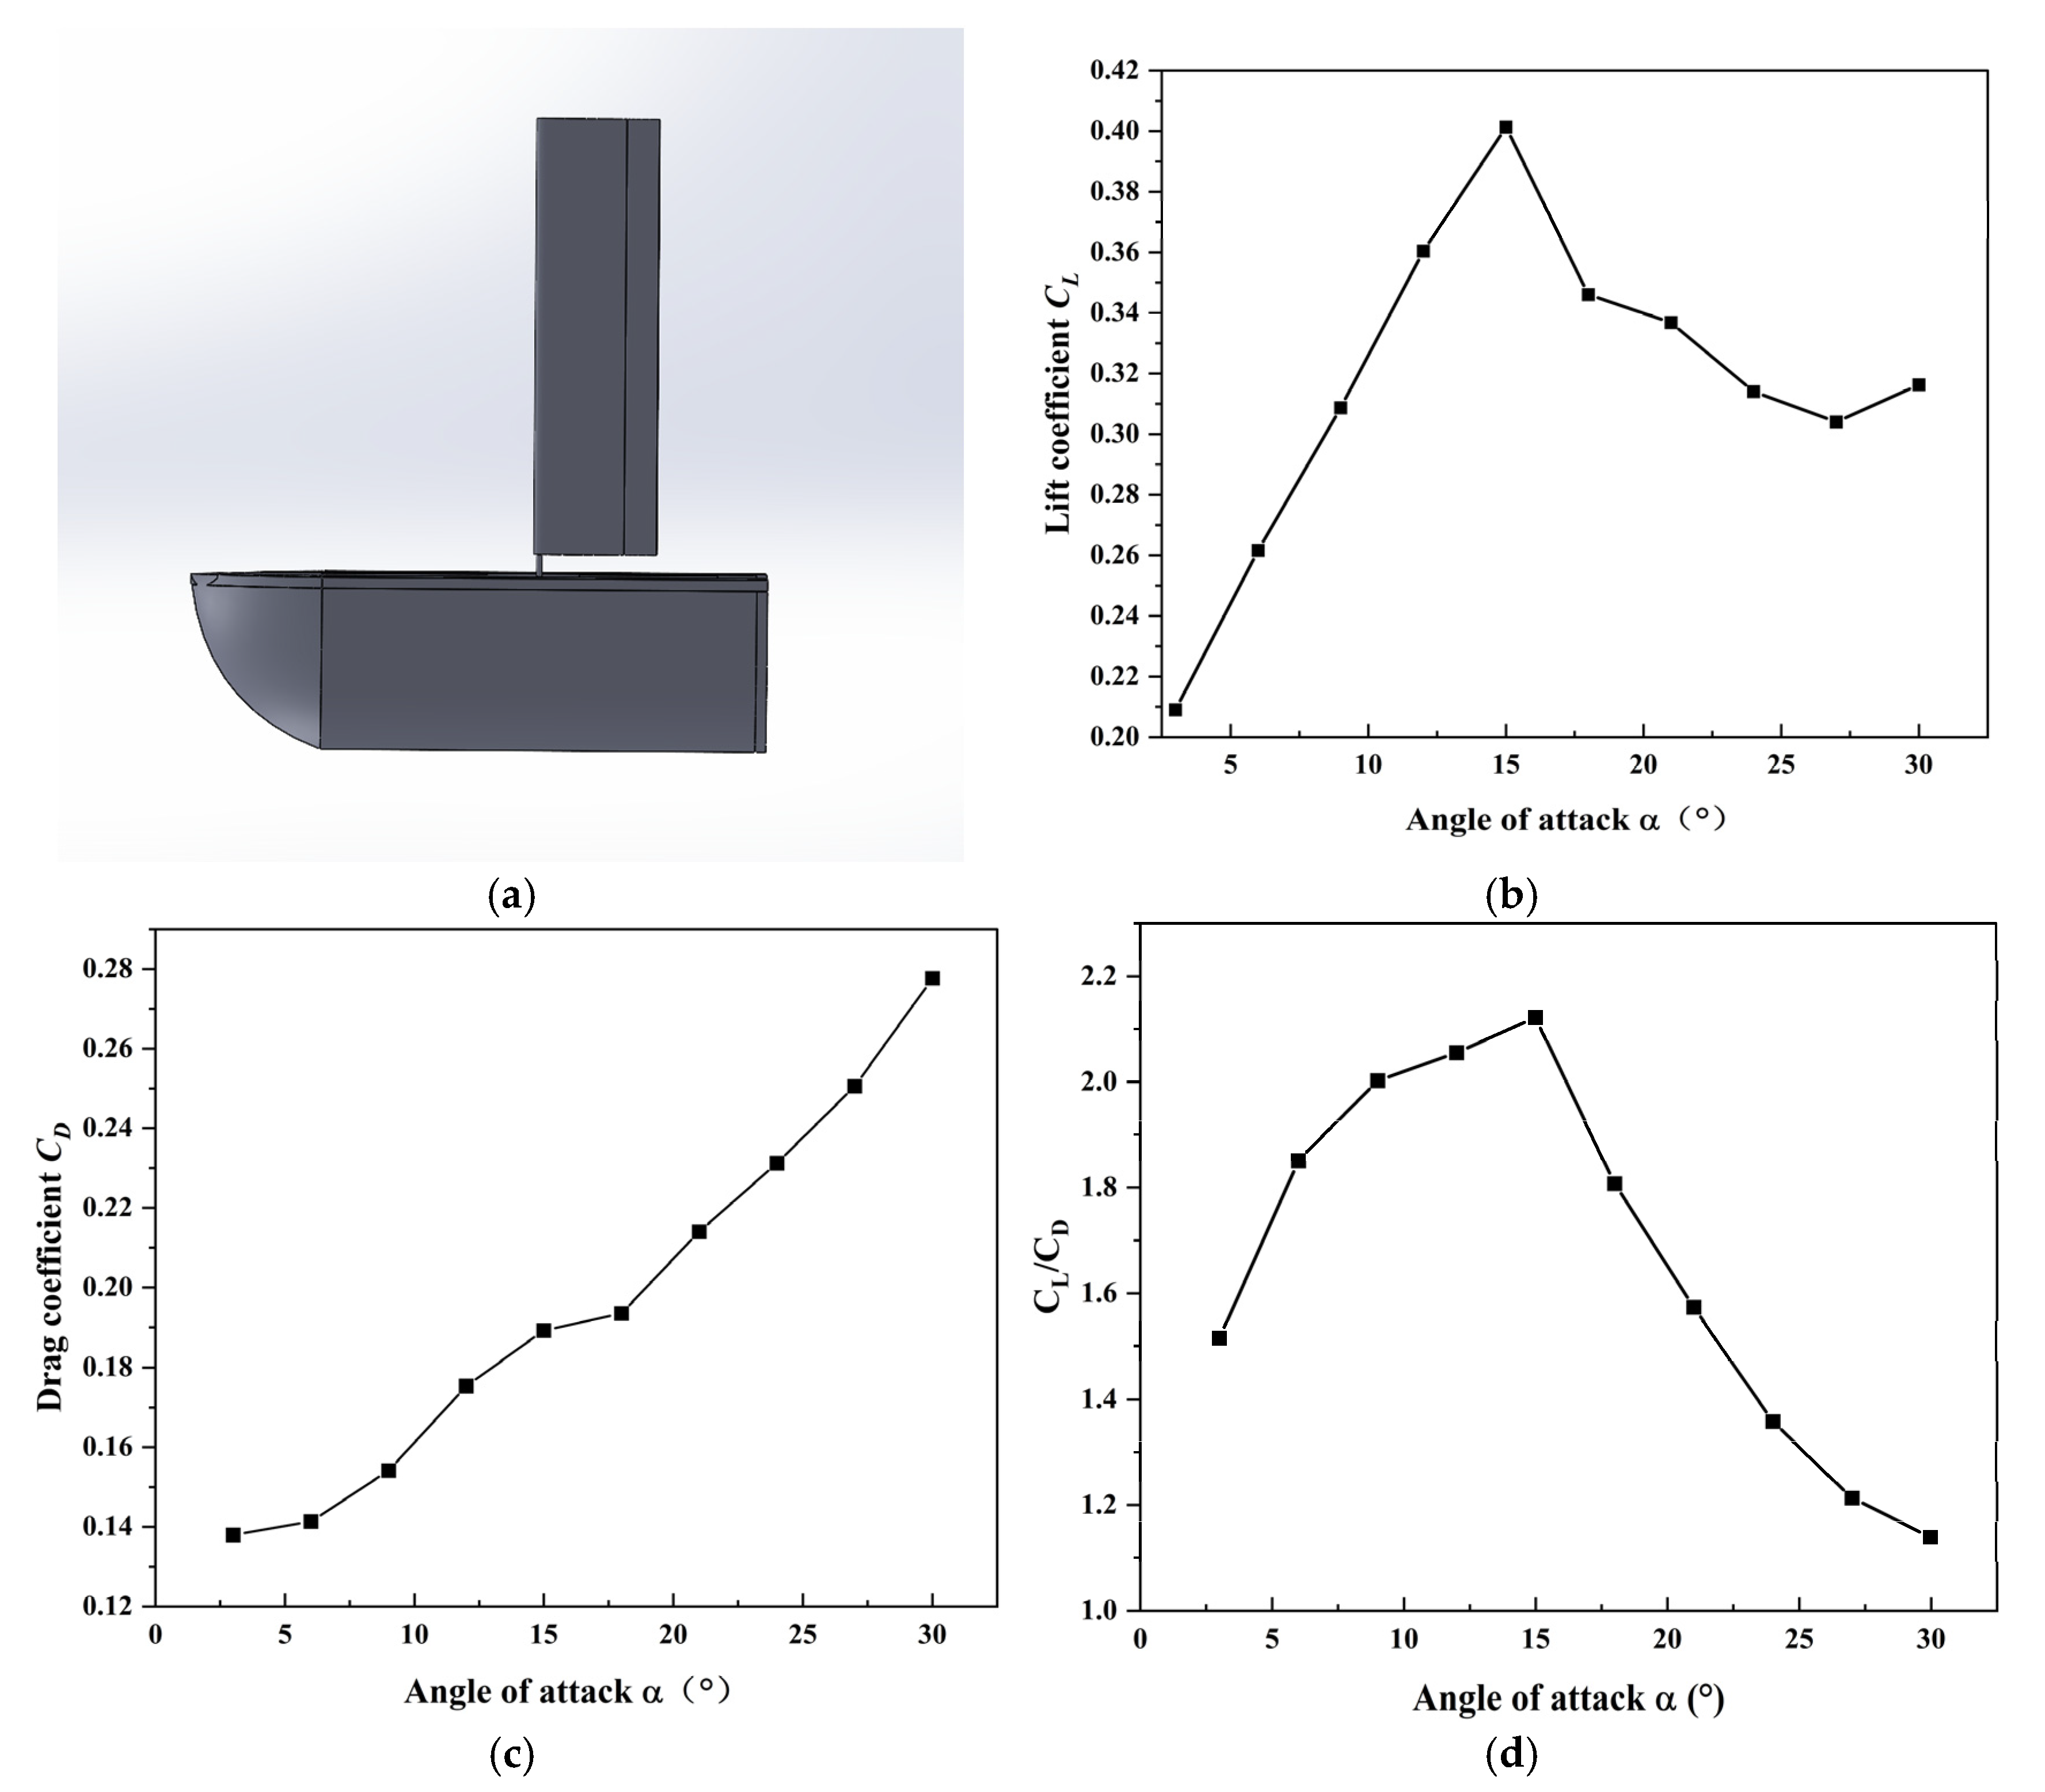
Building on the aerodynamic analysis of the sail presented earlier, this section focuses on the practical interaction effects between the hull and sail under various operating conditions. CFD simulations are employed to evaluate the aerodynamic performance of the integrated hull–sail system, with emphasis on lift coefficient (CL), drag coefficient (CD), and lift-to-drag ratio (L/D). The objective is to determine the optimal sail angle of attack for maximizing propulsion efficiency in real-world sailing applications.
A simplified hull model with a length of 2.5 m and a height of 0.8 m is used, incorporating streamlined bow and stern contours to minimize computational expense while preserving key flow characteristics. The sail has a span of 2 m and a chord length of 0.5 m, representative of a typical small sailing craft. The sail is positioned 1.2 m aft of the bow, aligning with common centerboard boat layouts (Figure 13a). The computational domain and boundary conditions are consistent with those applied in the prior isolated sail study, ensuring comparability of results. Simulations are conducted across a practical range of sail angles of attack (α = 0° to 30° in 3° increments) to assess system performance under feasible sailing conditions.
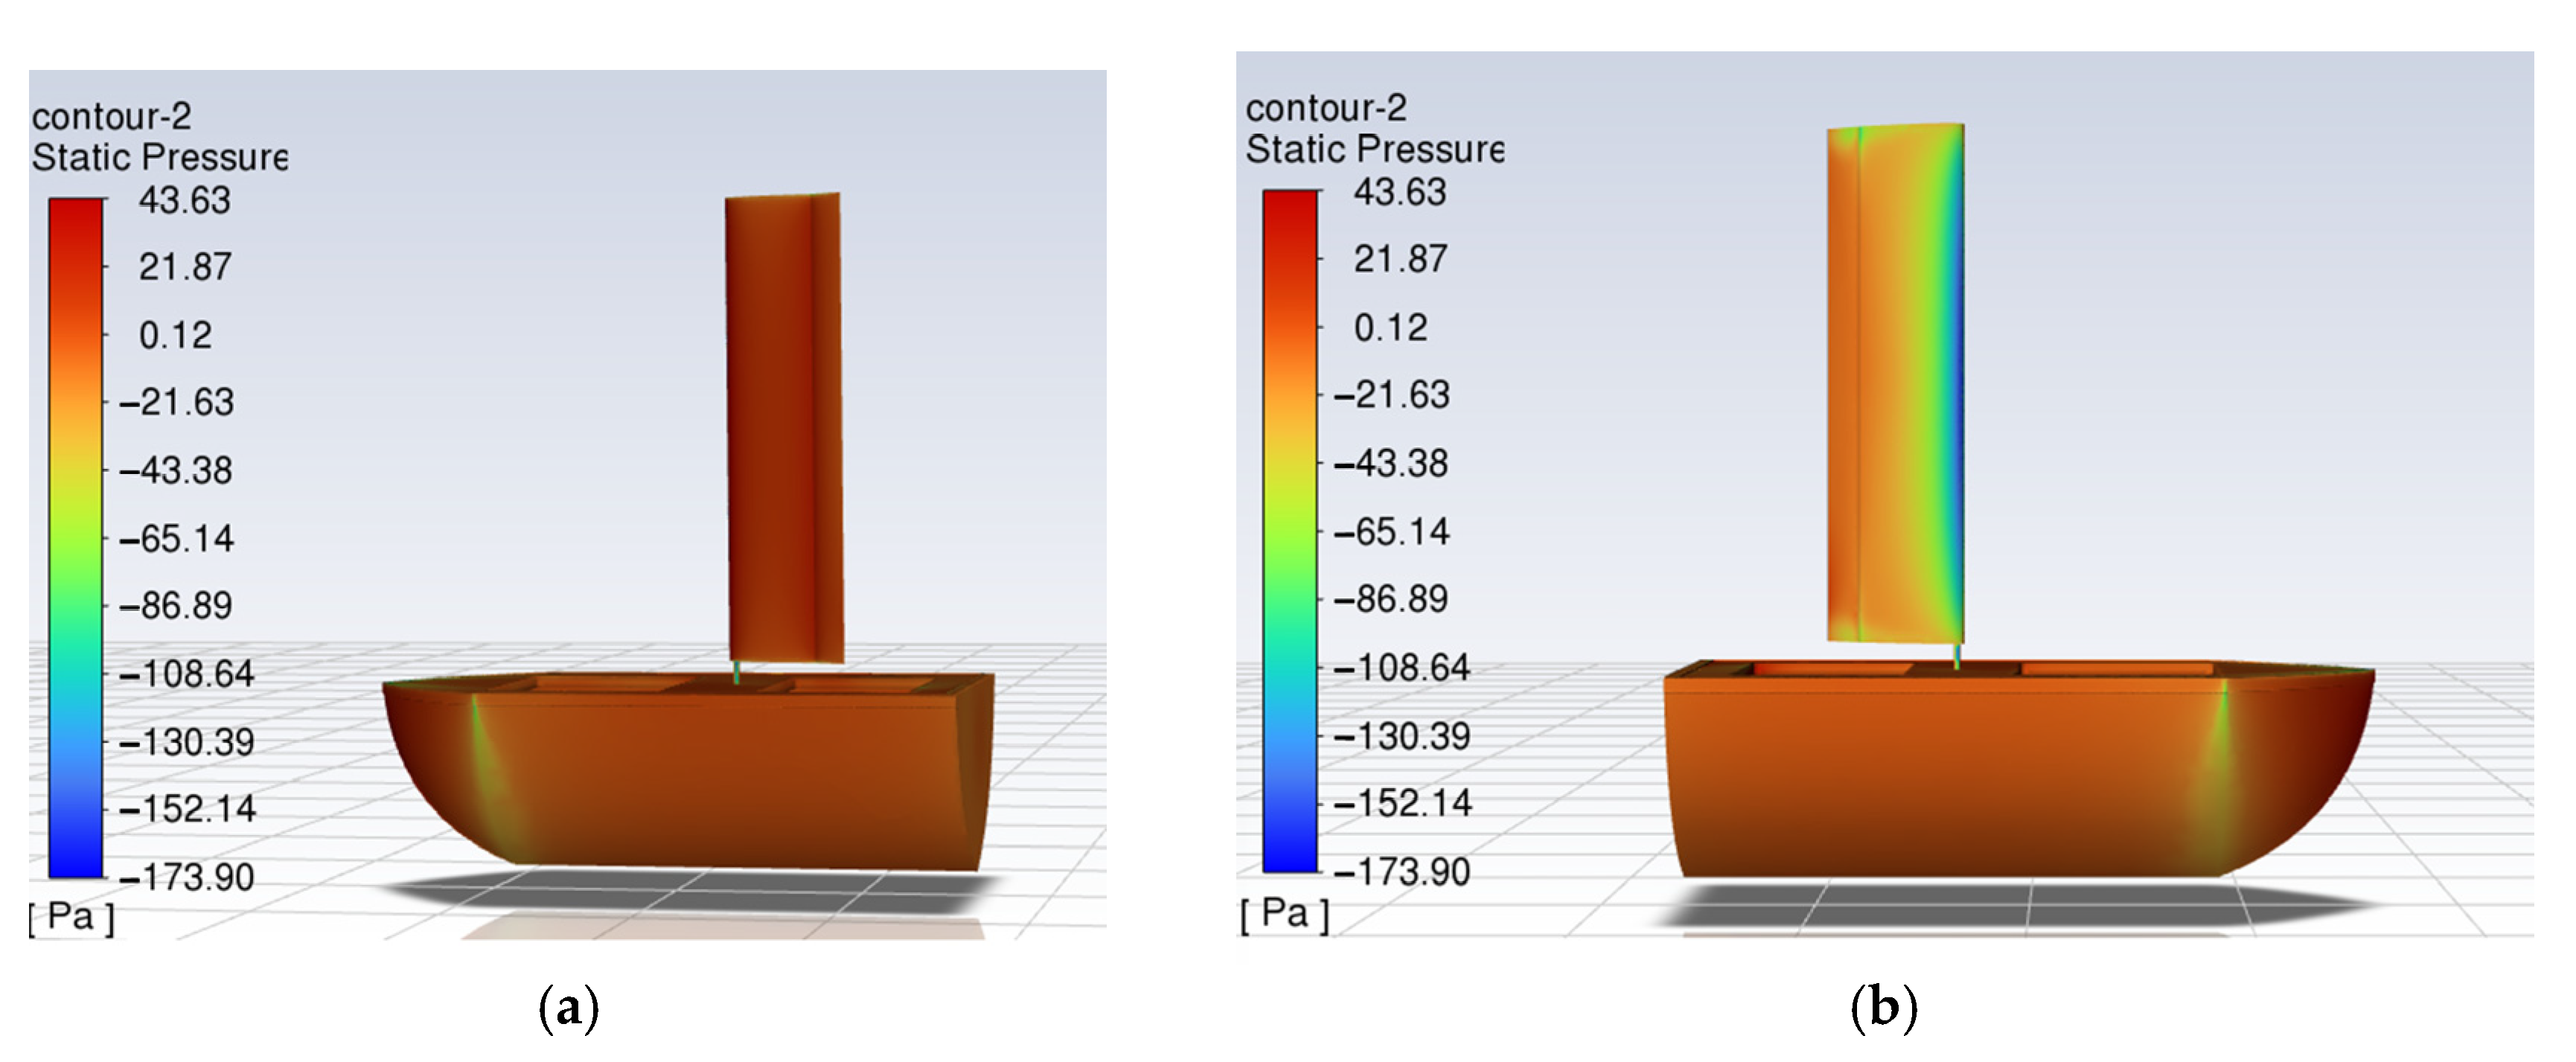
The lift coefficient increases with angle of attack until reaching a maximum at 15°, beyond which flow separation causes a sharp decrease in lift (Figure 13b). This peak defines the operational limit for effective sail force generation. At low angles (α < 15°), attached flow is maintained over the sail surface, with lift generated primarily through pressure differential. At high angles (α > 15°), extensive flow separation occurs on the leeward side, resulting in increased turbulence, loss of lift, and a sharp rise in drag. Drag increases progressively across the angle range, with a notable increase in rate above 15° (Figure 13c). This is critical for estimating hull resistance and predicting vessel performance. At lower angles, skin friction drag dominates. At higher angles, pressure drag becomes the major contributor, significantly impacting overall drag. The lift-to-drag ratio, a direct measure of sail efficiency, peaks in the range of α = 12–15°. This range is identified as optimal for effective power generation. For (α > 15°), the lift-to-drag ratio deteriorates rapidly, confirming the onset of inefficient sailing conditions (Figure 13d). The surface pressure distribution of the windward side and leeward side for the main sail is depicted in Figure 14a,b.

5. Conclusions

This study conducted a systematic analysis of the aerodynamic characteristics of a main sail with an embedded tail sail using CFD simulations. Embedding a tail sail in the aft portion of the NACA0020 main sail increases the effective camber of the sail, thereby significantly enhancing the lift coefficient and lift-to-drag ratio relative to a configuration lacking an embedded tail sail. The proposed sail structure demonstrates a 29.5% improvement in the peak lift coefficient compared to a single main wing sail. Compared to slotted-flap sails, the lift coefficient increased by approximately 11%. Specifically, an increase in the embedded area of the tail sail results in a large lift-to-drag ratio. When the area of the tail sail is 35%S0, it reduces the airflow separation at the rear of the main sail and lowers the pressure difference drag, increasing the L/D by 15.4%. However, an excessively small area will lead to flow separation in the corner region, which instead reduces efficiency. Both thrust coefficient and side thrust coefficient demonstrated a proportional increase with the area of the embedded tail sail. The larger deflection angle of the embedded tail sail is conducive to enhancing the lift coefficient and lift-to-drag ratio of the main wing sail. As the deflection angle of the embedded tail sail increases, the lift coefficient and lift–drag ratio gradually increase, and the maximum lift–drag ratio shifts forward. The findings and autonomous systems presented in this study were developed and validated using a specific 2 m monohull sailboat platform. The direct applicability of the results is therefore most relevant for uncrewed sailboats of comparable scale (e.g., 1.5–3.5 m LOA) and configuration. However, extending these results to significantly larger or smaller vessels would require careful consideration of scaling effects on vehicle dynamics and may necessitate the re-tuning of controller parameters. Future work will focus on validating the proposed methods on different robotic sailboat platforms to further generalize the findings. These results provide significant insights into the design of sail configurations for enhancing aerodynamic performance in uncrewed sailboats.

Author Contributions

Conceptualization, T.D. and C.T.; methodology, T.D. and C.T.; software, T.D.; validation, T.D., H.W. and C.X.; formal analysis, H.W.; investigation, A.G.; resources, T.X.; data curation, T.D.; writing—original draft preparation, T.D.; writing—review and editing, T.D.; visualization, J.Y.; supervision, C.T.; project administration, M.L.; funding acquisition, C.T. All authors have read and agreed to the published version of the manuscript.

Funding

This research was funded by the Shandong Province science and technology SMES innovation ability improvement project of China (Grant No. 2023TSGC0350).

Data Availability Statement

All data generated or collected during this study are included in this published article.

Conflicts of Interest

The authors declare no conflicts of interest.

Abbreviations

The following abbreviations are used in this manuscript:
CFDComputational Fluid Dynamics
αangle of attack
θrelative wind angle
φwind angle
αfdeflection angle
FDdrag force
FLlift force
Tthrust force
Nside thrust force
CLlift coefficient
CDdrag coefficient
CTthrust coefficient
CNside thrust coefficient
ρair density
S0projected area of the main wing sail
N-SNavier–Stokes
RANSReynolds-averaged Navier–Stokes
Ppressure
μhydrodynamic viscous coefficient
gimass force
SSTShear-Stress Transport
kturbulent kinetic energy
ωspecific dissipation rate
Pkgenerating term of turbulent kinetic energy k
μteddy viscosity
ReReynolds number
MaMach number

References

  1. Yodyium, T.; Peerayot, S.; Nattakit, T. Overview and control strategies of autonomous sailboats—A survey. Ocean Eng. 2023, 281, 114879. [Google Scholar] [CrossRef]
  2. Sun, Z.; Feng, A.; Yu, J.; Zhao, W.; Huang, Y. Development of autonomous sailboat sails and future perspectives: A review. Renew. Sustain. Energy Rev. 2025, 207, 114918. [Google Scholar] [CrossRef]
  3. Meinig, C.; Burger, E.F.; Cohen, N.; Cokelet, E.D.; Cronin, M.F.; Cross, J.N.; de Halleux, S.; Jenkins, R.; Jessup, A.T.; Mordy, C.W.; et al. Public–Private Partnerships to Advance Regional Ocean-Observing Capabilities: A Saildrone and NOAA-PMEL Case Study and Future Considerations to Expand to Global Scale Observing. Front. Mar. Sci. 2019, 6, 448. [Google Scholar] [CrossRef]
  4. Meng, X.; Yang, Y.; Yin, S.; Wang, X. Unmanned sailboat with self-balancing rotating sail based on elastic rope: Modeling, optimization, and sea trials. Appl. Energy 2024, 363, 123045. [Google Scholar] [CrossRef]
  5. Domínguez-Brito, A.C.; Valle-Fernández, B.; Cabrera-Gámez, J.; Ramos-de-Miguel, A.; García, J.C. A-TIRMA G2: An oceanic autonomous sailboat. In Proceedings of the World Robotic Sailing Championship and International Robotic Sailing Conference, Mariehamn, Finland, 31 August–4 September 2015; pp. 3–13. [Google Scholar]
  6. Stelzer, R.; Jafarmadar, K. THE ROBOTIC SAILING BOAT ASV ROBOAT AS A MARITIME RESEARCH PLATFORM. Environ. Sci. Eng. 2012. [Google Scholar]
  7. Miller, P.; Sauzé, C.; Neal, M. Development of ARRTOO: A Long-Endurance, Hybrid-Powered, Oceanographic Research Vessel. In Robotic Sailing 2013; Springer: Cham, Switzerland, 2013. [Google Scholar] [CrossRef]
  8. Kuang, L.; Li, H.; Su, X.; Song, X.; Wang, Z.; Zhang, Y.; Ma, W. Effect of chord length ratio on aerodynamic performance of two-element wing sail. Ocean Eng. 2023, 287, 115946. [Google Scholar] [CrossRef]
  9. Li, D.; Zheng, X.; Li, J.; Dai, J.; Li, G. Design and Performance of Contractible Twin-Tail Flap Sails. J. Jiangsu Univ. Sci. Technol. Nat. Sci. Ed. 2017, 31, 707–713. [Google Scholar]
  10. Li, S.; Guan, D.; Xia, T.; Ji, J. CFD-based aerodynamic study of unmanned sailboat flap sails. J. Nav. Archit. 2022, 44, 67–72+144. [Google Scholar] [CrossRef]
  11. Abdolahipour, S. Review on flow separation control: Effects of excitation frequency and momentum coefficient. Front. Mech. Eng. 2024, 10, 1380675. [Google Scholar] [CrossRef]
  12. Taleghani, A.S.; Torabi, F. Editorial: Recent developments in aerodynamics. Front. Mech. Eng. 2025, 10, 1537383. [Google Scholar] [CrossRef]
  13. Soheila, A. Effects of low and high frequency actuation on aerodynamic performance of a supercritical airfoil. Front. Mech. Eng. 2023, 9, 1290074. [Google Scholar] [CrossRef]
  14. Mi, B.; Yu, J. A New Grid-Slat Fusion Device to Improve the Take-Off and Landing Performance of Amphibious Seaplanes. J. Mar. Sci. Eng. 2024, 12, 2303. [Google Scholar] [CrossRef]
  15. Zhang, X.; Yao, W.; Ding, L.; Huang, B. Multi-Objective Optimization Design of Dynamic Performance of Hydrofoil with Gurney Flap. J. Mar. Sci. Eng. 2024, 12, 1147. [Google Scholar] [CrossRef]
  16. Chinnappa, V.; Srinivas, G. Numerical investigation of aerodynamic characteristics of naca 23112 using passive flow control technique—Gurney flaps. Cogent Eng. 2023, 10, 2222566. [Google Scholar] [CrossRef]
  17. Xie, Y.H.; Jiang, W.; Lu, K.; Zhang, D. Numerical investigation into energy extraction of flapping airfoil with Gurney flaps. Energy 2016, 109, 694–702. [Google Scholar] [CrossRef]
  18. Li, H.; Zhao, N.; Zhou, J.; Chen, X.; Wang, C. Uncertainty Analysis and Maneuver Simulation of Standard Ship Model. J. Mar. Sci. Eng. 2024, 12, 1230. [Google Scholar] [CrossRef]
  19. Zheng, Z.; Chen, L.; Melani, P.F.; Nayeri, C.; Bangga, G. Aerodynamic performance and wake development of NACA 0018 airfoil with serrated gurney flaps. Front. Energy Res. 2024, 12, 1363402. [Google Scholar] [CrossRef]
  20. Sun, Z.Y.; Yu, J.C.; Zhang, A.Q.; Jin, Q.L. Analysis of Influencing Factors on Lift Coefficients of Autonomous Sailboat Double Sail Propulsion System Based on Vortex Panel Method. J. Ocean Univ. China 2019, 33, 7. [Google Scholar] [CrossRef]
  21. Vuong, T.H.N.; Nguyen, H.V.; Le, T.L. Numerical study on thin cambered-plate airfoil profiles operating in micro Unmanned Aerial Vehicles. Results Eng. 2025, 25, 104364. [Google Scholar] [CrossRef]
  22. Sun, Z.; Hu, F.; Yu, J.; Zhao, W.; Zhang, A. Influence of Autonomous Sailboat Dual-Wing Sail Interaction on Lift Coefficients. J. Ocean Univ. China 2022, 21, 656–668. [Google Scholar] [CrossRef]
  23. Yang, M.y.; Shao, H.; Zhao, X.; Cheng, G.; Dai, S.; Wang, L.; Mao, X.z. Spatiotemporal distribution, evolution, and complementarity of wind and waves in China’s offshore waters and its implications for the development of green energy. Energy Convers. Manag. 2024, 312, 118567. [Google Scholar] [CrossRef]
  24. Kallath, H.; Lee, J.S.; Kholi, F.K.; Ha, M.Y.; Min, J.K. A multi-objective airfoil shape optimization study using mesh morphing and response surface method. J. Mech. Sci. Technol. 2021, 35, 1075–1086. [Google Scholar] [CrossRef]
  25. Hakan, A.H.; Melike, T.; Serdar, G.M.; Kemal, K. Numerical investigation on NACA0012 airfoil with tubercular structure. EPJ Web Conf. 2022, 269, 01001. [Google Scholar] [CrossRef]
  26. Seeni, A.; Rajendran, P.; Mamat, H. A CFD mesh independent solution technique for low Reynolds number propeller. CFD Lett. 2021, 11, 10. [Google Scholar]
  27. Chen, L.; Hongming, W.; Peiting, S. Study on the Influence of Gradient Wind on the Aerodynamic Characteristics of a Two-Element Wingsail for Ship-Assisted Propulsion. J. Mar. Sci. Eng. 2023, 11, 134. [Google Scholar] [CrossRef]
  28. Riesner, M.; Sigmund, S.; Moctar, O.e. Comparative study of nonlinear wave-induced global loads on a container ship in regular head waves predicted with numerical methods based on weakly nonlinear potential theory and Reynolds-averaged Navier-Stokes equations. Ship Technol. Res. 2024, 71, 239–262. [Google Scholar] [CrossRef]
  29. He, X.; Luo, L.-S. Lattice Boltzmann Model for the Incompressible Navier–Stokes Equation. J. Stat. Phys. 1997, 88, 927–944. [Google Scholar] [CrossRef]
  30. Moshfeghi, M.; Song, Y.J.; Xie, Y.H. Effects of near-wall grid spacing on SST-K-ω model using NREL Phase VI horizontal axis wind turbine. J. Wind Eng. Ind. Aerodyn. 2012, 107–108, 94–105. [Google Scholar] [CrossRef]
  31. Atkins, D.W. The CFD Assisted Design and Experimental Testing of a Wing-Sail with High Lift Devices; University of Salford: Salford, UK, 1996. [Google Scholar]
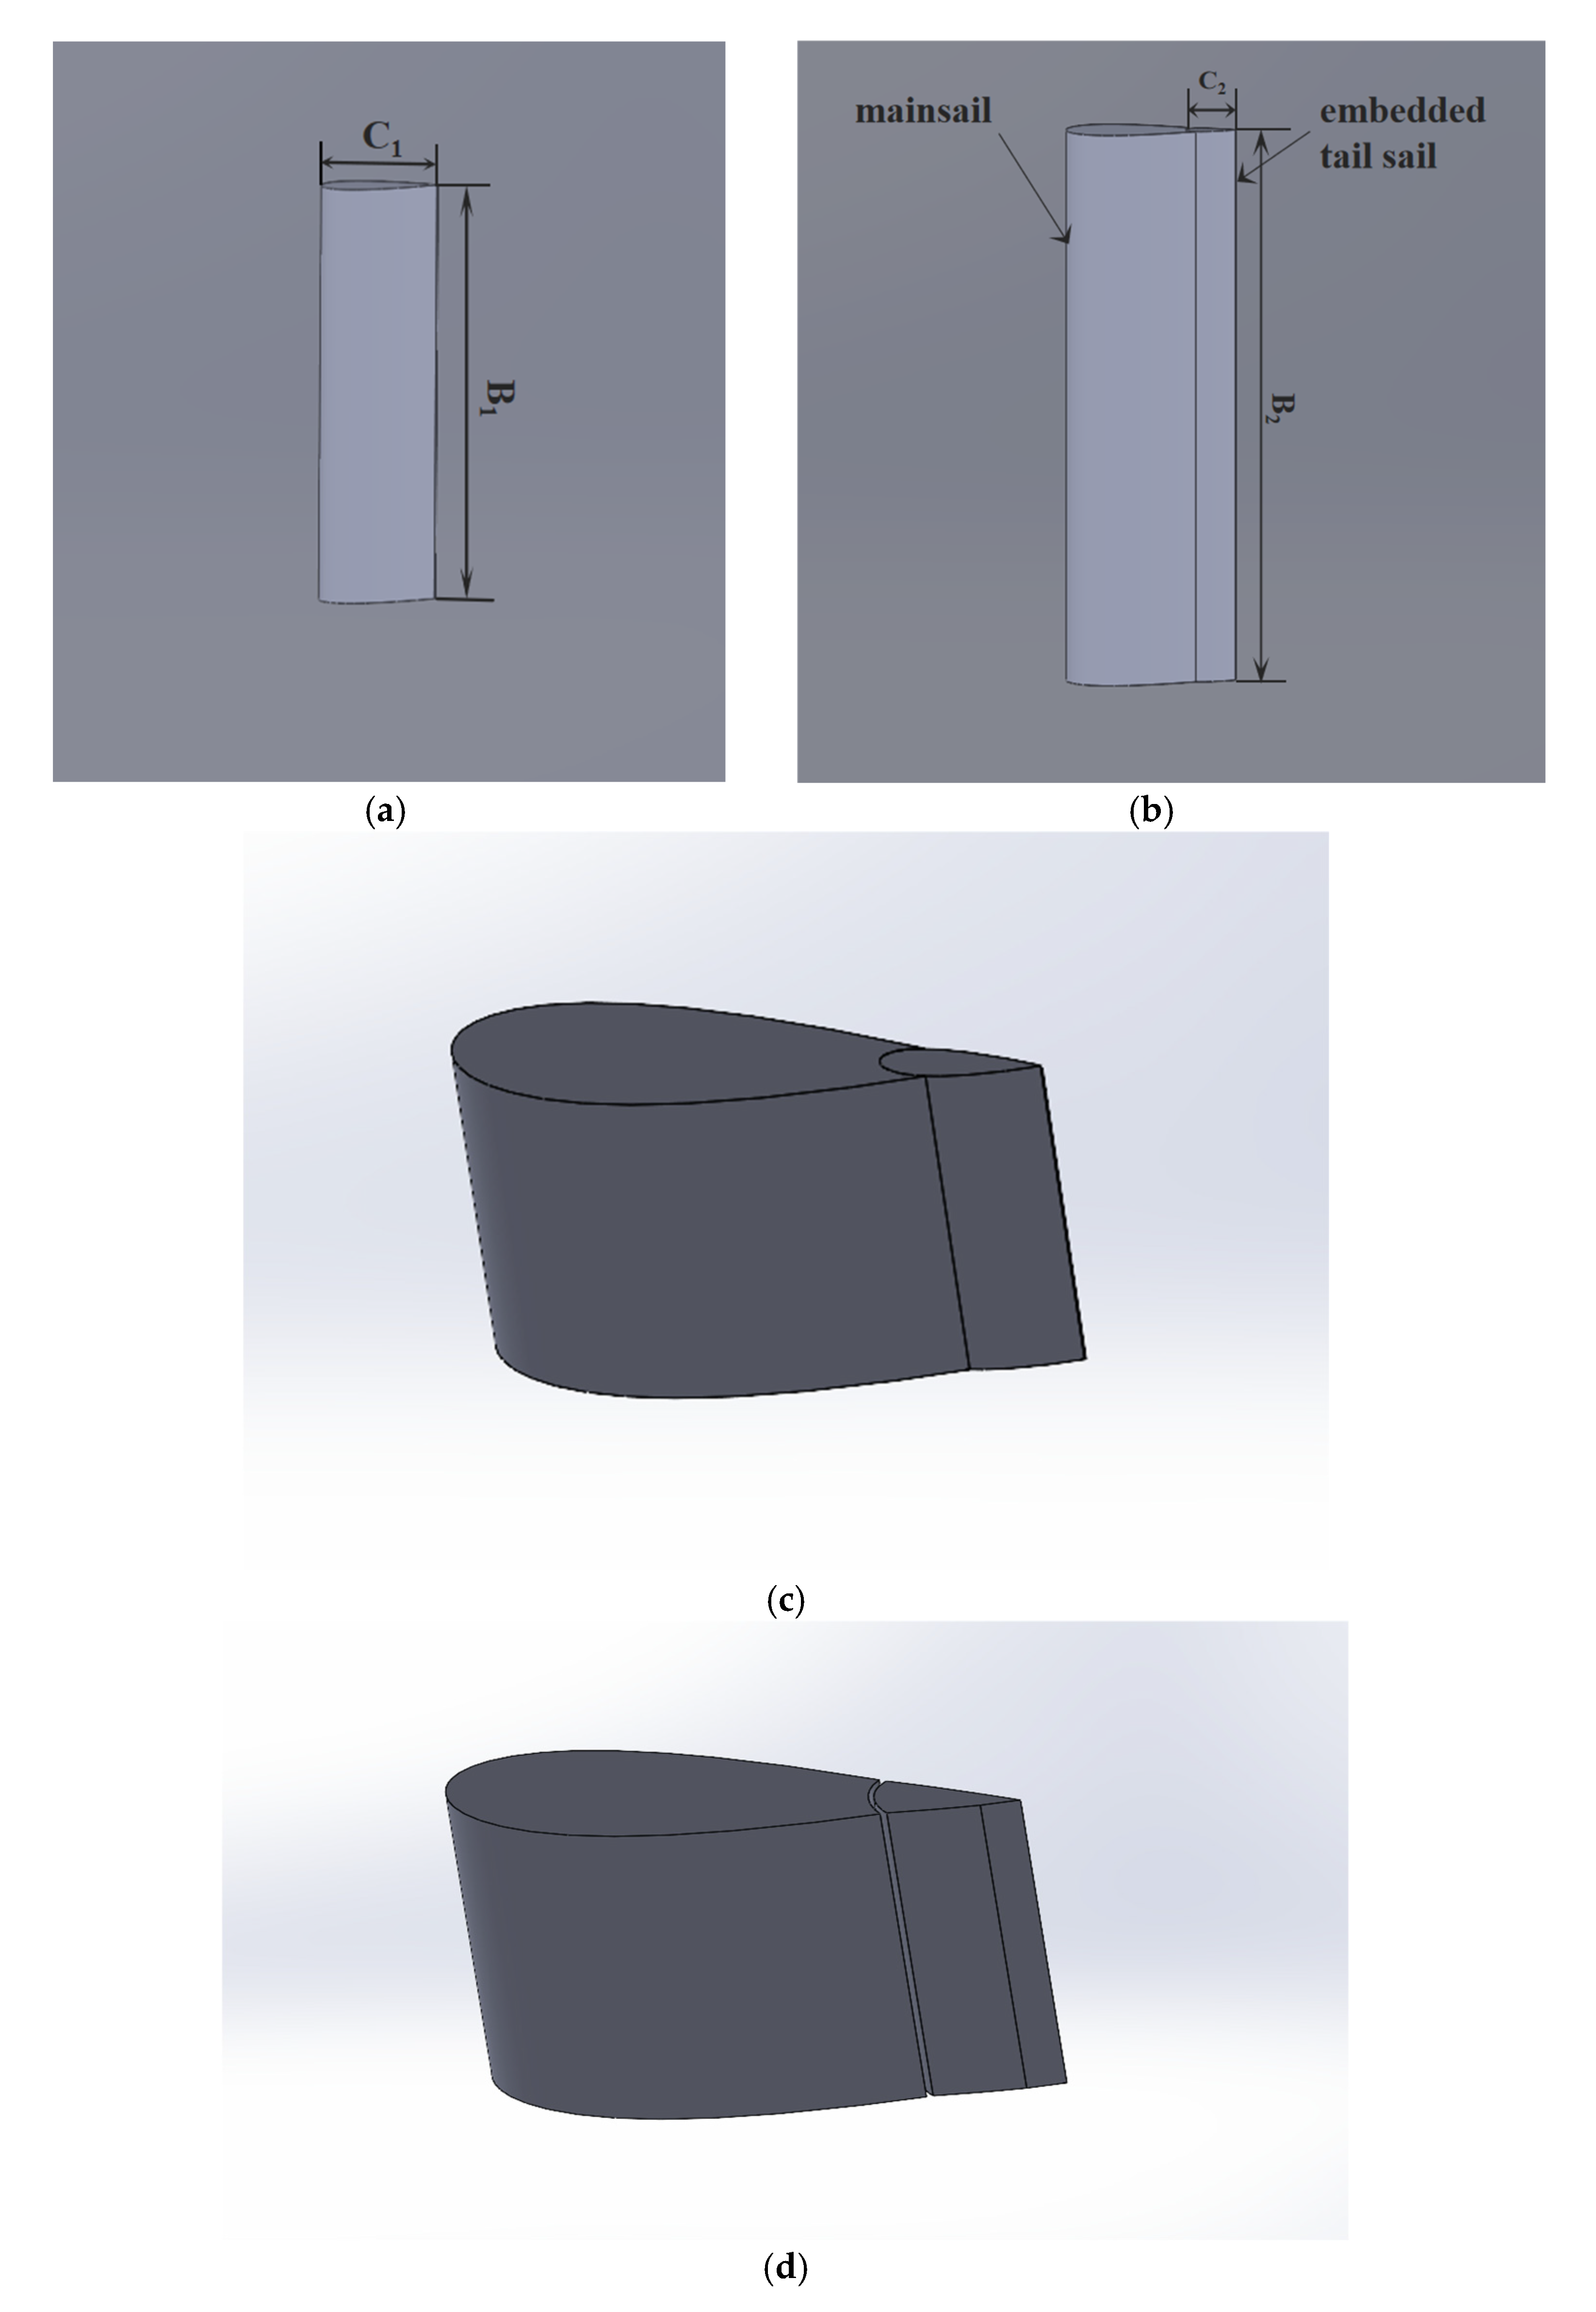
Figure 1. Different configurations of the main wing sails. (a) No tail sail; (b) embedded tail sail; (c) the main wing sail with a tail sail; (d) slotted-flap sail.
Jmse 13 01640 g001
Figure 2. The schematic diagram of force analysis for the main wing sail.
Jmse 13 01640 g002
Figure 3. Boundary condition and grid processing of the simulation model: (a) schematic diagram of the boundary conditions for the model; (b) fluid domain mesh diagram; (c) mesh diagram of the cross-section of the traditional flap sail; (d) mesh diagram of the cross-section of the embedded tail sail.
Jmse 13 01640 g003
Figure 4. Comparison of lift coefficient (a) and drag coefficient (b) between test and CFD.
Jmse 13 01640 g004
Figure 5. Main sail lift and drag coefficient curve: (a) lift coefficient curve of the main sail; (b) drag coefficient curve for the main sail; (c) lift–drag ratio.
Jmse 13 01640 g005
Figure 6. Localized diagrams of the two types of sail flow field: (a) Q-criteria contour of the single wing sail; (b) Q-criteria contour of the embedded tail sail.
Jmse 13 01640 g006
Figure 7. Localized diagrams of the two types of sail flow field: (a) velocity contour diagrams of the slotted-flap sail; (b) velocity contour diagrams of the embedded tail sail.
Jmse 13 01640 g007
Figure 8. Main sail lift and drag coefficient curve: (a) lift coefficient curve of the main sail; (b) drag coefficient curve for the main sail; (c) lift–drag ratio.
Jmse 13 01640 g008
Figure 9. Characteristic curves of lift resistance with different embedded tail sail areas: (a) lift coefficient; (b) drag coefficient; (c) lift–drag ratio.
Jmse 13 01640 g009
Figure 10. Thrust coefficient curve and side thrust coefficient curve: (a) thrust coefficient; (b) side thrust coefficient.
Jmse 13 01640 g010
Figure 11. Velocity cloud diagrams and Q-criteria contour at different tail sail deflection angles: (a) αf = 3°; (b) αf = 3°; (c) αf = 9°; (d) αf = 9°; (e) αf = 15°; (f) αf = 15°.
Jmse 13 01640 g011
Figure 12. Lift–drag characteristic curves for different tail sail deflection angles: (a) lift coefficient; (b) drag coefficient; (c) lift–drag ratio.
Jmse 13 01640 g012
Figure 13. Sailboat lift and drag coefficient curve: (a,b) lift coefficient; (c) drag coefficient; (d) lift–drag ratio.
Jmse 13 01640 g013
Figure 14. Cloud image near the sailboat: (a) pressure cloud image of the windward side of the sailboat; (b) pressure cloud image of the leeward side of the sailboat.
Jmse 13 01640 g014
Table 1. Mesh independence verification.
Number of MeshesMain Sail Lift Coefficient CLMain Sail Drag Coefficient CD
8.0 × 1050.9090.128
9.1 × 1050.9250.126
1.2 × 1060.9340.127
2.2 × 1060.9420.127
4.5 × 1060.9430.126
6.6 × 1060.9440.127
9.3 × 1060.9430.127
1.4 × 1070.9450.127
Table 2. Simulation parameter settings.
Flow field velocity8 m/s
Angle of attack α0°, 3°, 6°, 9°, 12°, 15°, 18°, 21°, 24°, 27°, 30°
Viscous equationSST k-ω
Calculate reference areaThe projected area of the main sail in the Y direction
Calculate reference length0.5 m
Reporting definitionsLift, drag, lift coefficient, drag coefficient
Number of iterations103
Table 3. Lift and drag performance comparison.
Angle of AttackLift Coefficient of Slotted-Flap SailsDrag Coefficient of Slotted-Flap SailsLift Coefficient of the Structure of This PaperDrag Coefficient of the Structure of This Paper
0.240.0420.250.049
0.430.0590.480.069
0.660.0850.720.101
12°0.810.1110.940.143
15°0.900.1361.160.195
Disclaimer/Publisher’s Note: The statements, opinions and data contained in all publications are solely those of the individual author(s) and contributor(s) and not of MDPI and/or the editor(s). MDPI and/or the editor(s) disclaim responsibility for any injury to people or property resulting from any ideas, methods, instructions or products referred to in the content.