Abstract
Aiming at the problem of harrowing target feature extraction for one-dimensional radar signals in the strong sea clutter background, this paper proposes a weak target detection method based on the combination of multi-modal time-frequency map fusion and deep learning in the sea clutter background. The one-dimensional signal is converted into three gray-scale maps with complementary characteristics by three signal processing methods: normalized continuous wavelet transform, Normalized Smooth Pseudo Wigner-Ville Distribution, and recurrence plot; the resulting two-dimensional grayscale maps are adaptively mapped to the R, G, and B channels through an adaptive weighting matrix for feature fusion, ultimately generating a fused color image. Subsequently, an improved multi-modal EfficientNetV2s classification framework was constructed, wherein the decision threshold of the Softmax layer was optimized to achieve controllable false alarm rates for weak signal detection. Experiments are carried out on the IPIX dataset and the China Yantai dataset, and the proposed method achieves certain improvement in detection performance compared with existing detection methods.
1. Introduction
With the continuous advancement of technology, radar systems have become crucial for marine cognition and monitoring. Serving as the “eyes” in naval battlefields and maritime surveillance scenarios, to enhance radar detection capabilities, it is essential to thoroughly understand, accurately perceive, and fully utilize sea clutter characteristics. Sea clutter refers to the clutter signals reflected from the sea surface in radar systems. These signals interfere with the detection of maritime targets (e.g., ships, boats, or buoys) and degrade radar performance. Therefore, researching weak signal detection methods in sea clutter backgrounds is of significant importance.
Detecting weak, slow, and small targets in sea clutter remains a challenging problem in signal processing, primarily due to four factors [1]. First, sea clutter exhibits non-linear, non-stationary, and non-uniform characteristics, making it challenging to model. Second, weak target echoes are often submerged by intense sea clutter noise, resulting in low signal-to-noise ratios. Third, the dynamic and varied movements of ocean waves can obscure targets. Fourth, high-power sea spikes randomly appear, sharing similar time-frequency characteristics with target echoes, which can lead to false alarms in detectors.
To address weak signal detection in sea clutter, numerous methods have been proposed. Hu et al. [2] introduced a fractal detector using the Hurst index as a test statistic. Shui et al. [3,4] proposed detectors based on triple features and joint time-frequency domain analysis, significantly improving detection performance. Subsequent studies have explored more feature-based methods, such as Suo et al.’s [5] PCA-based eight-feature detector and Zhao et al.’s [6] FAST algorithm-enhanced four-feature detector. With the rise in deep learning, recurrent neural networks (RNNs) have been widely applied to sea clutter research. Yan et al. [7] developed an LSTM-based method with error frequency-domain conversion, improving weak signal detection by analyzing Doppler spectra of prediction errors. De Jong et al. [8] proposed a CNN-LSTM hybrid model leveraging temporal amplitude fluctuations for target discrimination. However, traditional feature detection relies on manual feature extraction, risking feature omission or redundancy, while one-dimensional time-series methods fail to exploit signal characteristics fully.
Given data complexity and practical needs, image-based deep learning approaches have emerged. Chen et al. [9] employed the GAF-CNN method to analyze and predict stock candlestick charts, achieving relatively accurate results. Rafia et al. [10] proposed an intelligent fault classification model for induction motors, using GAF (Gramian Angular Field) to convert raw signals into two-dimensional images and combining them with a CNN model for classification and prediction. Zhao et al. [11] employed MTF for fault sequence preprocessing followed by CNN classification, achieving promising results. Liu et al. [12] enhanced key information extraction using RP and GADF for sea clutter processing. Zhang et al. [13] converted one-dimensional signals to time-frequency images via STFT (Short Time Fourier Transform) for neural network classification, boosting accuracy.
Nevertheless, STFT-derived time-frequency images only represent frequency-domain information, neglecting time-domain shape variations, whereas GADF/MTF/RP-based methods capture time-domain shapes but lack frequency discrimination. Existing image-and-CNN-based similarity measurement methods also rely solely on single-modal imaging, unable to jointly consider time-frequency features. To overcome these limitations, this paper proposes a multi-modal time-frequency image fusion method for maritime weak target detection: one-dimensional time-series are converted to grayscale images via NCWT (Normalized Continuous Wavelet Transform), NSPWVD (Normalized Smooth Pseudo Wigner-Ville Distribution), and RP (Recurrence Plot), then fused into RGB images through weighted channel mapping. These are fed into an improved EfficientNetV2s model for feature extraction [14]. A constant false alarm rate (CFAR) is achieved by adjusting the softmax threshold, establishing a classification model for sea clutter and weak targets. The generated time-frequency image dataset and related code have been made openly available at the following link: https://github.com/littleDizzy/fusionRGB.git, accessed on 19 August 2025.
The main contributions of this paper can be summarized as follows:
We integrate three time-frequency transformation methods, overcoming the limitations of existing time-domain and frequency-domain approaches. The fused images incorporate richer features, including state transition characteristics, periodicity, autocorrelation, and time-frequency properties, significantly improving detection accuracy and robustness. By combining the three method outputs into a single RGB composite image, we attempt to provide an intuitive visualization of feature complementarity, serving as an interpretable human–machine collaborative framework for analysis.
An improved EfficientNetV2s-based detection method was developed, incorporating a custom loss function for class imbalance mitigation and enhanced with attention mechanisms to increase sensitivity to critical features and improve detection accuracy. This method exhibits adaptability to existing weak maritime target detection systems. The dataset encompasses diverse sea areas and conditions, significantly advancing the applicability of small maritime target detection technology across broader operational scenarios.
2. Theoretical Basis
2.1. Problem Transformation for Target Detection
Consider a marine surveillance radar transmitting a coherent pulse sequence of length N at a beam position. Each sampling unit in the range dimension is termed a range cell [15,16]. Target detection in sea clutter can be formulated as the following binary hypothesis test:
In the target detection problem, let denote the received time series in the Cell Under Test (CUT) and represent the time series from surrounding Reference Cells (RCs), where is the target echo signal, while and correspond to the sea clutter time series in the CUT and RCs, respectively, with indicating the number of reference cells [17]. The detection is formulated as a binary hypothesis test: hypothesis is accepted when the observed data contains pure sea clutter (indicating no target presence), whereas hypothesis is selected when target echoes are present in the observations. This binary hypothesis testing framework effectively transforms the maritime target detection problem into a binary classification task.
2.2. Normalized Continuous Wavelet Transform
The Continuous Wavelet Transform (CWT) is a time-frequency analysis method that performs joint multi-resolution analysis in both time and frequency domains by convolving the signal with wavelet basis functions at different scales and time shifts [18]. The CWT achieves higher frequency resolution for low-frequency components and finer time resolution for high-frequency components, making it particularly effective for capturing localized time-frequency characteristics of sea clutter signals. Mathematically, it is defined as follows:
where represents the scale parameter, denotes the translation parameter, and is the complex conjugate of the mother wavelet function. This study employs the Morlet wavelet as the mother wavelet. Using sea clutter cells as RCs, we calculate the mean () and variance () of their CWT. Each CUT is then normalized using these and values to enhance the time-Doppler characteristics of target echoes in sea clutter, resulting in the Normalized CWT as expressed in the following formula:
The NCWT was applied separately to both clutter and target waves from different range cells within the same time period, with the resulting grayscale images shown in Figure 1. The brightness in the figure represents the transformed power intensity. As evident from the time-frequency (TF) representations, the target wave’s TF map exhibits distinct high-power regions. In contrast, the pure clutter TF map shows relatively fewer high-power areas with lower peak power values.
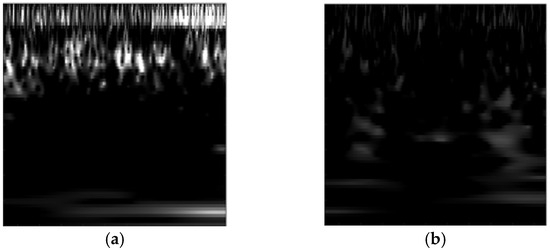
Figure 1.
NCWT. (a) The NCWT results of the target wave, (b) the NCWT results of pure sea clutter.
2.3. Normalized Smooth Pseudo Wigner-Ville Distribution
The Smooth Pseudo Wigner-Ville Distribution (SPWVD) improves upon the classical Wigner-Ville Distribution (WVD) [19] by incorporating smoothing windows. This modification preserves the high-resolution characteristics of WVD while effectively suppressing cross-term interference. For a given complex signal , its mathematical formulation is as follows:
where represents the frequency smoothing window and denotes the time smoothing window. Following the same methodology as before, we use sea clutter cells as reference cells to calculate the mean () and variance () of their SPWVD. Each CUT is then normalized using these and values, yielding the Normalized SPWVD as defined by the following formula:
When detecting weak targets in sea clutter, the target echoes can be modeled as piecewise linear frequency modulated (LFM) signals. The SPWVD demonstrates superior energy concentration for such piecewise LFM signals compared to time-frequency analysis methods like STFT. Figure 2 shows the grayscale images obtained by applying the NSPWVD separately to the clutter and target waves.
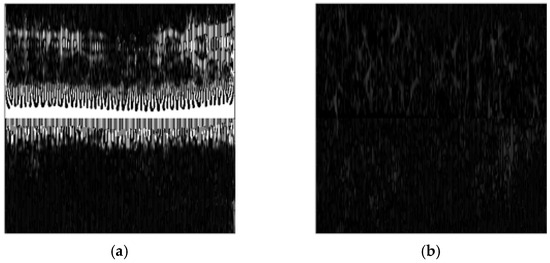
Figure 2.
NSPWVD. (a) The NSPWVD results of the target echo signal, (b) the NSPWVD results of pure sea clutter.
2.4. Recurrence Plot
The recurrence plot is a two-dimensional graphical method for visualizing recurrence characteristics in a time series. It reveals a system’s dynamic behaviors (such as periodicity, chaos, or non-stationarity) by mapping similar or recurring states in the time series as points in a matrix [20]. The specific implementation steps are as follows:
Step 1: Select appropriate embedding dimension and time delay to reconstruct the phase space from the one-dimensional time series, obtaining the spatial vectors as follows:
Step 2: Compute the Euclidean distance between each pair of trajectories in the reconstructed phase space:
Step 3: Construct the recurrence matrix using the following equation:
where represents the distance threshold determining similarity criteria, and denotes the step function.
Step 4: Generate the visualized RP. By applying a color mapping scheme, different distance values within the matrix are converted into distinct colors, producing a color image that encapsulates the complete characteristics of the time series. This forms a color-texture plot that intuitively displays the dynamic properties of the time series.
As shown in Figure 3, the pure sea clutter exhibits randomness and short-term correlation characteristics, with its RP displaying vertical and horizontal line segments. In contrast, the target echo demonstrates deterministic dynamic properties, manifesting as diagonal lines or spiral or rotational structures in its RP.
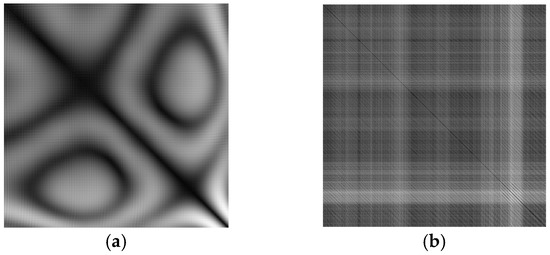
Figure 3.
RP. (a) The RP results of the target echo signal, (b) the RP results of pure sea clutter.
3. The Proposed Target Detection Model Based on Enhanced Multi-Modal EfficientNetV2s
This paper proposes an improved Multi-Modal EfficientNetV2s (IMMEV2s) target detection method, with its framework diagram shown in Figure 4. The method consists of three parts: data augmentation, image fusion, and model detection. For the radar signal time series under test, first the sliding window method is used to slice it to obtain a sufficient number of signals. Then, three signal processing methods including NCWT, NSPWVD, and RP are used for data processing; the obtained three types of grayscale images are mapped to the R, G, and B channels through weighting coefficients for feature fusion, resulting in a type of color image. These are input into the improved EfficientNetV2s classifier for classification to identify target signals.
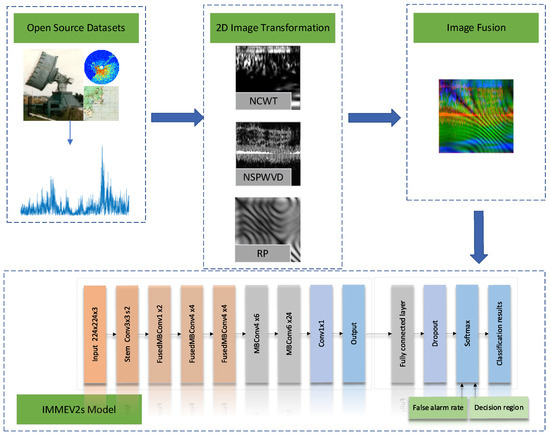
Figure 4.
IMMEV2S framework diagram.
3.1. Signal Processing
This paper processes sea clutter signals from each dataset using a sliding window with a step size of 64 and a window length of 1024. The step size determines the number of obtained signals, yielding over 20,000 time-domain signals per dataset. By restricting the number of “clutter misclassified as targets” to fewer than five, we maintain a constant false alarm rate of 0.0001. The step size only affects the number of slices without influencing prediction results. The window length determines the input signal duration. Theoretically, longer input signals contain more effective information, thereby improving detection accuracy. However, since signal duration corresponds to observation time, practical engineering constraints limit observations to 0.512–2.048 s. Given the radar sampling rate of 1000 Hz, the data length should range from 512 to 2048 points. This study adopts the median value of 1024 points as the standard length. The obtained over 20,000 signals are split into training and test sets at an 8:2 ratio. Each signal segment undergoes CWT, SPWVD, and RP processing to generate three grayscale maps.
Normalization is performed for CWT and SPWVD methods as follows: pure clutter cells are selected as RCs, their CWT and SPWVD mean and variance are computed, and all CUTs are normalized accordingly. This normalization enhances target echo power intensity while suppressing clutter power intensity, thereby improving image discriminability. The results undergo color mapping to produce TF grayscale images. The computational time varies significantly among the three image transformation methods, with NSPWVD being the most time-consuming and RP being the fastest. Specifically, NSPWVD requires approximately three times the processing time of RP. The total processing time for the aforementioned dataset of over 20,000 images was approximately 20 h, yielding an average processing time of 3.27 s per RGB composite image. For practical engineering applications, this computational demand can be effectively addressed through model pre-training, enabling efficient object detection within substantially reduced timeframes.
During TF image generation, CWT effectively captures high-frequency transients in sea clutter, while SPWVD precisely analyzes its frequency-modulation characteristics. Furthermore, RP enables non-linear time-series analysis to reveal dynamical invariants of the system (e.g., attractor structures). This multi-modal time-frequency feature fusion approach achieves complementary physical dimensionality and anti-interference synergy, significantly enriching image features and enhancing weak signal detection and analysis capabilities in complex environments.
3.2. Image Fusion
The three grayscale images generated by signal processing are mapped to the R, G, and B channels through a weight matrix for feature fusion. The resulting color images are resized to a uniform dimension of 224 × 224 to meet the tensor dimension requirements of the model input. This processing method preserves the time-frequency, energy, and dynamic characteristics of the signals, avoiding information loss. Meanwhile, multiple modal inputs can prevent signal contamination from a single modality, improving anti-interference capability. The fused images of target waves and sea clutter are shown in Figure 5. Compared with conventional image stitching methods, the proposed method has smaller input dimensions, lower computational cost, clear physical meaning, intuitive color visualization, natural compatibility with the CNN architecture without adjusting the input layer structure, and is suitable for practical engineering applications.
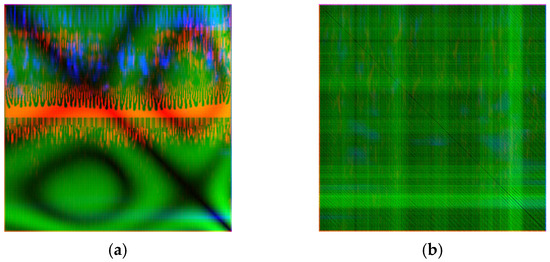
Figure 5.
FusionRGB. (a) The image fusion results of the target wave. (b) The image fusion results of pure sea clutter.
Figure 5 demonstrates that the features extracted via the NSPWVD method are primarily concentrated in the central region of the image, while those obtained through CWT exhibit distinct variations in the upper section. The RP-derived features manifest as characteristic arc-shaped curves across the image. The fused image visually confirms the complementary nature of the discriminative features between clutter and target waves.
The conventional static weighting coefficient fusion method excessively relies on empirical parameters, failing to meet the practical requirements for task transferability. Therefore, we employ an adaptive time-frequency domain weighted fusion method based on local SNR to replace the original static weight fusion. The calculation formula is as follows:
where denotes the noise power estimate, represents the 10th percentile value, indicates the signal-to-noise ratio, corresponds to the signal power, signifies the weighting matrix, denotes any of the three color channels, and refers to the normalized weighting matrix for the i-th channel.
The specific workflow proceeds as follows: First, we calculate the total energy for each channel and estimate the noise energy ratio. Next, the SNR is computed for each pixel. These results then undergo exponential mapping and normalization processing. Finally, a Gaussian smoothing filter is applied to generate the final weighting matrix. In contrast to static weighting coefficient fusion methods, this new approach employs three distinct weighting matrices that enable channel-specific, pixel-level adaptive weighting across all three channels.
3.3. EfficientNetV2s Classifier
To better utilize the obtained multi-modal images, this paper employs EfficientNetV2s as the backbone classification network. EfficientNetV2s is a lightweight and efficient convolutional neural network proposed by Google in 2021 (Google, Mountain View, CA, USA), which significantly improves training and inference efficiency while maintaining high accuracy, making it deployable on embedded devices for engineering-level radar target detection.
Compared to traditional CNN models, EfficientNetV2s utilizes MBConv and Fused-MBConv modules with incorporated attention mechanisms. These modules dynamically enhance feature responses of important channels through convolutional layers combined with Squeeze-and-Excitation (SE) layers, as illustrated in Figure 6.
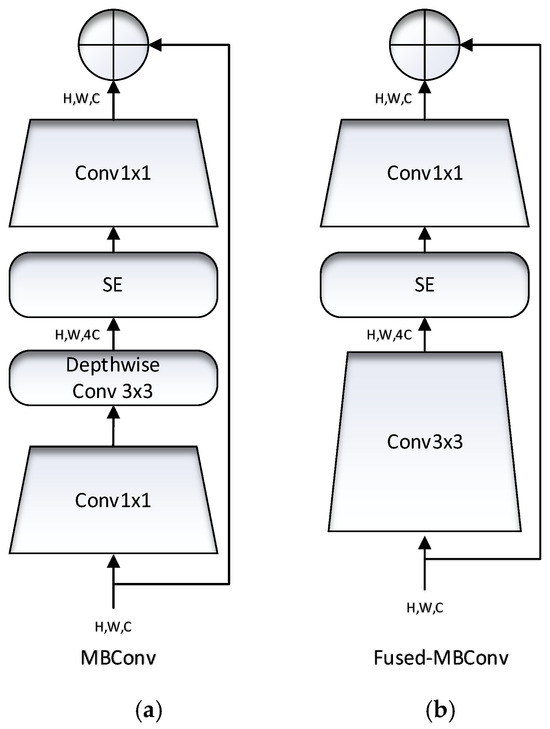
Figure 6.
MBConv and Fused-MBConv structures. (a) Description of what MBConv is, (b) description of what Fused-MBConv modules are.
The SE module represents a lightweight channel attention mechanism that enhances discriminative power for multi-modal fusion features by dynamically learning importance weights for each channel—amplifying critical feature channels while suppressing irrelevant ones. Its core concept involves explicitly modeling inter-channel dependencies to achieve adaptive feature channel recalibration.
The SE module shown in Figure 7 is inserted into the MBConv structure, where features passing through the Depthwise Conv layer are split into two parallel branches upon entering the SE module: one branch preserves the original feature maps while the other first applies global average pooling to the feature maps, then performs dimensionality reduction via the first fully connected layer FC1 followed by dimensionality restoration through the second fully connected layer FC2, ultimately multiplying the feature matrices from both branches through element-wise multiplication.
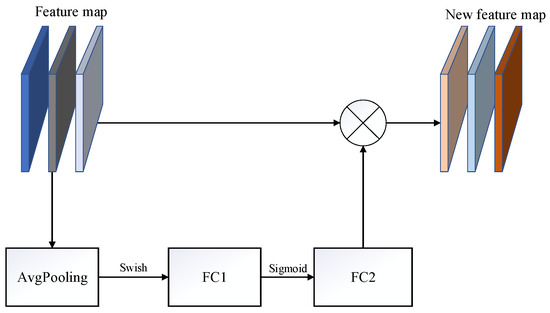
Figure 7.
Structure of the SE module.
The SE module executes three key operations: Squeeze (global information compression), Excitation (channel-wise dependency learning), and Scale (feature recalibration). Their technical meanings are specified as follows:
- Squeeze:
The operation compresses spatial information of each channel into a scalar via global average pooling, generating channel-wise statistical descriptors. This aggregates global spatial information to characterize the overall importance of each channel. The mathematical formulation is as follows:
where and represent the spatial height and width of the feature map, denotes the input feature map of the c-th channel, and corresponds to the global average pooling result for the c-th channel.
- Excitation:
This operation learns non-linear inter-channel relationships through two fully connected layers to generate channel weights, enabling the learning of dynamic dependencies between channels and quantifying the importance of each channel.
where is the compressed channel descriptor vector, and represent the weight matrices of the first two fully connected layers, and denote activation functions, and indicates the final channel weight vector.
- Scale:
The operation multiplies the c-th channel’s weight with the original feature map , enhancing critical channel features while suppressing redundant ones, yielding the final output:
where represents the recalibrated feature map of the c-th channel.
The framework diagram of EfficientNetV2s is shown in Figure 8.
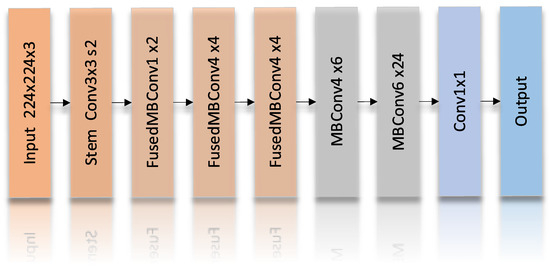
Figure 8.
EfficientNetV2s framework diagram.
3.4. Focal Loss for Class-Imbalanced Radar Target Detection
During radar detection, the area containing targets occupies a tiny proportion of the total surveillance region. Specifically, within the radar range gates, only a limited number of gates can capture target signals, while the majority of gates detect nothing but sea clutter. In radar target detection tasks under sea clutter backgrounds, the class imbalance problem presents a critical challenge. Since the number of sea clutter samples (H0 hypothesis) typically significantly exceeds that of target samples (H1 hypothesis), conventional cross-entropy loss functions cause the model training process to favor the majority class heavily. This consequently diminishes detection capability for weak targets and substantially increases the probability of missed detections. To address this class imbalance issue, we introduce Focal Loss to replace the cross-entropy loss. By adjusting the focusing parameter and class weight , this approach reduces the loss contribution from sea clutter while enhancing the model’s attention to weak targets. The mathematical formulation is as follows:
where represents the model’s predicted probability for the actual class.
3.5. False Alarm Control
In the context of small maritime target detection, the false alarm rate (FAR) and detection probability are the two most critical performance metrics. The false alarm rate refers to the proportion of actual non-target samples that are incorrectly identified as targets, while the detection probability represents the ratio of target samples correctly detected. To prevent model performance from being affected by class imbalance, the false alarm rate is typically controlled at 10−3.
To address the CFAR requirement, this paper proposes a detection strategy based on softmax probability output and employs Monte Carlo methods to determine the decision boundary with controllable FAR. In binary classification scenarios, the softmax output reflects the probability distribution between the two classes, as expressed by the following equation:
The classifier makes decisions based on a predefined threshold (default value 0.5, indicated by the black line in Figure 9). The classification decision rule is as follows:
where is the probability predicted by the model that a sample belongs to Class 1. To control the false alarm rate, this threshold needs to be manually adjusted: when the false alarm rate is below 10−3, lower the threshold to increase the detection probability of the model; when the false alarm rate is above 10−3, raise the threshold to reduce the false alarm rate. As shown in Figure 9, by adjusting the decision threshold to the position indicated by the red line, the number of samples classified as “1” can be controlled, thereby achieving controllable false alarms in target detection.
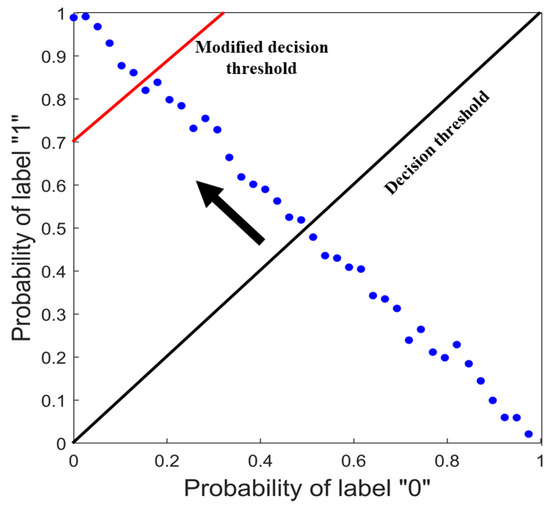
Figure 9.
False alarm control strategy.
3.6. Experimental Platform
The experimental platform consists of an RTX 3090 GPU (NVIDIA Corporation, Santa Clara, CA, USA), utilizing Python 3.10, Ubuntu 22.04, and CUDA 11.8.
4. Experiments and Analysis
This study conducted ablation experiments using the IPIX database [21] to analyze the contribution of different modules to the overall algorithm and demonstrate the superiority of the proposed method. Additionally, the Yantai dataset from China [22] was used to validate the algorithm’s effectiveness in other sea areas.
4.1. Case 1
4.1.1. IPIX Dataset Introduction
The IPIX radar data is provided by McMaster University, offering valuable resources for studying sea clutter characteristics. The IPIX radar operates at a sampling frequency of 1000 Hz with a sampling duration of 131.072 s, and each range gate is 15 m long. It functions at grazing angles less than or equal to 1 degree. The test target is an anchored spherical block of Styrofoam wrapped with wire mesh (diameter about 1 m). This study uses 10 datasets from the 1993 stare mode recordings, each containing time series from 14 consecutive range gates. The cell containing the target is labeled as the primary cell, cells affected by the target are labeled as secondary cells, and the remaining range cells are clutter-only. Information such as filenames, significant wave height, and wind speed for the 10 datasets used is shown in Table 1.

Table 1.
IPIX dataset information.
In Table 1, SWH stands for significant wave height and WS represents wind speed. As can be seen from Table 1, the first eight datasets correspond to sea states 2–3, while the last two datasets correspond to sea states 3–4, with the tenth dataset having the highest significant wave height. Broken wave crests and scattered whitecaps in the sea may submerge target echoes, and waves can easily obscure small targets. When the observation time is too short, sea spikes and small targets become difficult to distinguish.
To quantitatively measure data characteristics, the average signal-to-clutter ratio (ASCR) is introduced as a performance metric to differentiate data under different sea conditions. The ASCR formula is as follows:
where represents the average power of sea clutter, and denotes the sea clutter sequence under test. Using this formula, the ASCR values for ten datasets under four polarization states were calculated as shown in Figure 10.
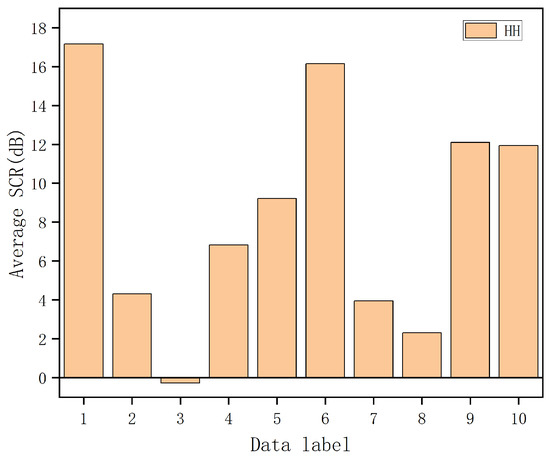
Figure 10.
ASCR of the IPIX dataset in HH polarization mode.
Since the test target moves with the waves, its radar illumination area also changes over time. When the target is at the wave crest, the radar illumination area is larger, resulting in higher SCR; when the target is at the wave trough, the radar illumination area decreases, leading to lower SCR. Meanwhile, sea spikes from the waves may also generate higher SCR that interferes with the target.
4.1.2. Ablation Study
To examine the effects of different processing methods, fusion modes, and various sea state conditions on the experiment, this paper designs three ablation studies.
We first investigate the impact of different transformation methods on detection performance. Using the data17 dataset, three image transformation methods are employed separately to convert one-dimensional signals into two-dimensional images, which are then input into the classifier. The resulting detection probabilities are shown in Table 2, with the false alarm rate controlled at 10−3. Table 2 shows that the combined use of all three methods yields the best detection performance, while using the recurrence plot alone gives relatively poorer results. This is because recurrence plots detect system repetitiveness and chaos based on phase space recurrence, making it challenging to distinguish weak targets when waves cover floating objects.

Table 2.
Detection probabilities of different transformation methods.
In contrast, SPWVD and CWT detect time-frequency energy concentration and exhibit better anti-interference capability. Therefore, SPWVD and CWT can be considered as the primary methods, with RP serving as supplementary information. Combining all three detection methods improves detection probability. The results demonstrate that the combined use of all three methods achieves the best performance.
Next, we examine the influence of different fusion ratios. This paper proposes multiplying the images from NSPWVD, NCWT, and RP by specific coefficients and using them as the R, G, and B channels for image fusion. To determine the optimal coefficients for each channel that contain the maximum target information features, this study uses the data26 dataset as an example and conducts experiments with different coefficients. When NSPWVD is input as the R channel, RP as the G channel, and NCWT as the B channel, the results are shown in Table 3.

Table 3.
Detection probabilities of different fusion ratios.
Different fusion coefficients essentially assign weights to features from different modalities, representing an allocation of importance to different physical dimensions of the signal, which directly affects the sensitivity to key information and anti-interference capability. The results demonstrate that different fusion coefficients influence the detection outcomes, with the best performance achieved when NSPWVD serves as the primary detection method and RP and NCWT assist in detection.
Due to the lack of physical interpretability in empirical parameter selection, we replace static weights with adaptive weights. The results demonstrate that the performance achieved with adaptive weights is comparable to that obtained through optimally tuned empirical parameters. Unlike static parameters, the adaptive weights are dynamically generated based on the SNR of the images, enabling effective domain adaptation in practical engineering applications.
Finally, we systematically evaluate the impact of different models on detection performance. To examine the impact of different classifiers on the results, this study compares the employed EfficientNetV2s classifier with other classifiers, with the learning rate set to 0.001 and epochs set to 15. Using the data30 dataset, the results are shown in Table 4. The “Accuracy” in the table represents the ratio of correctly predicted samples to the total number of samples. It can be observed that nearly all classification models achieve good Accuracy and Detection probability, demonstrating the effectiveness of the proposed multi-modal time-frequency fusion method. The EfficientNetV2s model yields the highest Detection probability and Accuracy, proving its compatibility with the proposed fusion approach.

Table 4.
Ablation study on different prediction models.
4.1.3. Comparison of Different Method Results
Under HH polarization, the detection probabilities of the proposed method were compared with those of the triple-feature detection method [3], time-frequency triple-feature detection method [4], fractal detection method, septuple-feature detection method [1], and FAST four-feature detection method [6], as shown in Figure 11. The training set contained 17,890 samples, and the test set had 4473 samples. To ensure a false alarm rate below 10−3, the number of incorrect detections was controlled to fewer than five. In this study, the false alarm count was maintained at four. If the count fell below four, the threshold was lowered to increase the false alarm rate and improve detection probability; if it exceeded four, the threshold was raised to reduce detection probability and control the false alarm rate.
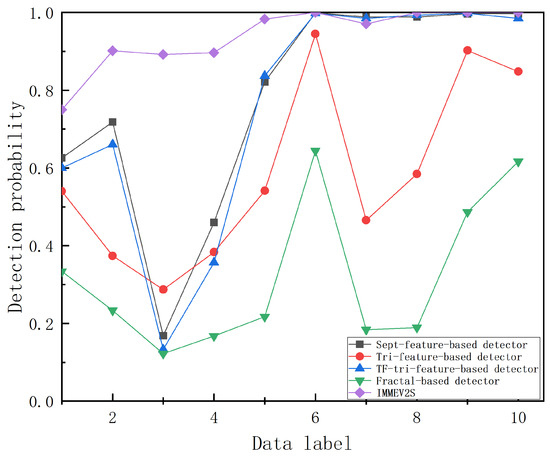
Figure 11.
Comparison of detection probabilities among different schemes.
We calculated the prediction accuracy of the proposed method across ten datasets, obtaining an average detection probability of 0.9394 with a standard deviation of 0.08092. The relatively small standard deviation indicates stable prediction performance. The results demonstrate that the proposed method achieves approximately 21% improvement over existing detection methods. For the latter six datasets, where sea conditions were favorable and the SCR was relatively high, conventional time-frequency detection algorithms performed well. However, for the data26, data30, and data31 datasets, lower SCR or higher wind speeds reduced the accuracy of detection algorithms. Although the data17 dataset had a high SCR, its significant wave height reached 2.2 m, indicating deplorable sea conditions where signals were easily obscured by waves, leading to relatively lower algorithm accuracy.
The proposed algorithm combines SPWVD, CWT, and RP transformation methods to enhance data features and employs an improved classifier for prediction. Experimental results show that the IMMEV2S detector outperforms the other four detectors, particularly under low sea-state conditions.
To systematically compare the performance differences between the proposed method and one-dimensional processing methods, this study designed the following comparative experiment. An LSTM model was employed to directly process one-dimensional sea clutter signals, with the specific workflow as follows: first, the phase space reconstruction method was used to map the original one-dimensional chaotic sequence into a high-dimensional phase space sequence, and this reconstructed signal served as the input to the LSTM network. Experimental results demonstrate that while the model can effectively predict chaotic background signals, it exhibits significant prediction failure for target signals superimposed on the chaotic background, manifesting as notable prediction errors at target locations. Based on this phenomenon, target detection was achieved by setting a prediction error threshold: targets were declared when the error exceeded the threshold and otherwise considered absent.
In tests with fifteen sets of signals from the data17 dataset, this method achieved an average detection probability of only 0.5667, a result significantly lower than both the proposed method in this paper and traditional feature detection methods. Further analysis reveals two critical flaws in the one-dimensional processing approach: the difficulty in determining a well-generalizable error threshold, leading to insufficient detection stability, and computational time consumption far exceeding that of feature detection methods. These limitations render the method impractical for engineering applications.
4.2. Case 2
4.2.1. Yantai Dataset Introduction
To evaluate the model’s tolerance to disturbances such as noisy environments and variations in input data quality, experiments were conducted using the Chinese Yantai dataset to test the model’s robustness in complex environments. The dataset comes from the “Radar Maritime Detection Data Sharing Program” of Naval Aviation University. The latest dataset, 20221112150043_stare_HH, was used. The radar model is Tianao SPPR50P with HH polarization. The transmitted composite pulses consist sequentially of a single pulse signal T1, an LFM pulse signal T2, and an LFM pulse signal T3, with an overall repetition frequency of 2000 Hz. The target is a steel buoy located at 2.97 nautical miles, with a significant wave height of 1.8 m and sea state level 4. This study uses the T2 single pulse signal to detect Buoy 2. There are 1000 echo range gates in total, with the target located at gates 666–674. The signal length is 131000, corresponding to a total observation time of 65.5 s.
4.2.2. Comparison of Different Sea States Results
A segment of pure clutter data and target data, each with an observation duration of 0.512 s and a length of 1024, was selected. The proposed three methods were used to convert the sequences into images, and the results are shown in Figure 12.
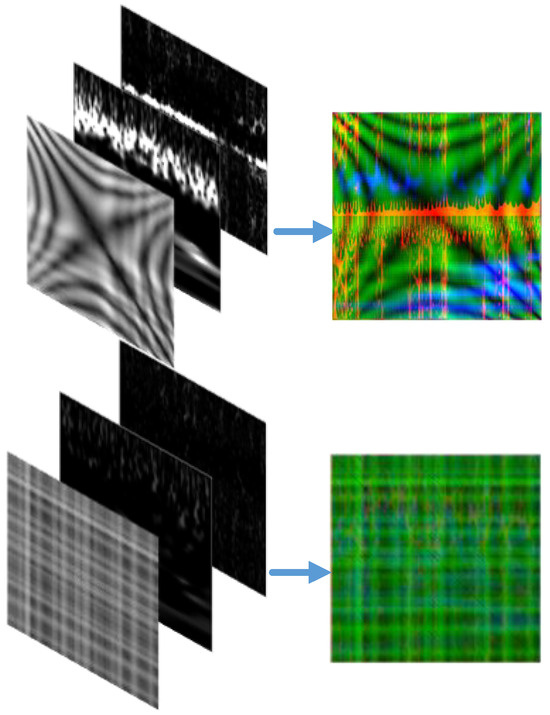
Figure 12.
Images obtained by the three methods. The upper part is the result of the target wave, and the lower part is the result of the pure clutter.
This study took 10 pure clutter range gates (1, 100, 200, 250, 300, 350, 400, 850, 900, 950) and one buoy-containing range gate (at 671) from the dataset. The 11 resulting signal groups underwent the same sliding window processing as described earlier, yielding 22,363 sea clutter sequences of length 1024 with an observation duration of 0.512 s. The proposed method was used to convert these one-dimensional sequences into two-dimensional images via RGB channels, producing the same number of color images. The dataset was split into training and test sets in an 8:2 ratio. After model training, the prediction set achieved the following: Test Loss: 0.0024, detection rate: 0.9720, accuracy: 0.9973, and the following confusion matrix:
Here, 4043 and 418 represent the number of actual sea clutter samples correctly identified as sea clutter and actual target samples correctly identified as targets, respectively. 12 and 0 represent the number of actual target samples misidentified as sea clutter and actual sea clutter samples misidentified as targets, respectively.
At this point, the model’s false alarm rate is 0. The detection probability can be improved by appropriately lowering the Softmax threshold while keeping the false alarm rate below 10−3. After lowering the threshold, the new confusion matrix becomes:
The detection probability increases to 0.9906. In summary, the proposed method effectively detects weak target signals in the Yantai maritime environment under a constant false alarm rate.
To evaluate the performance of the proposed method under different sea conditions, we conducted ten repeated experiments on three datasets with varying sea states. The measured data includes favorable conditions with sea state class 2 and more severe conditions with sea state class 5. The results are shown in Table 5.

Table 5.
Detection performance across different sea states.
From the results, it can be observed that the proposed method demonstrates good detection performance under various sea conditions and maintains relatively high prediction accuracy even in rough sea states. However, when the wave height exceeds two meters, the prediction accuracy shows a relative decline.
4.3. Discussion
The dynamic motion states of sea surfaces vary with environmental factors such as weather conditions, where strong winds generate gravity waves, and local wind disturbances produce capillary waves. Gravity waves exhibit wavelengths ranging from several centimeters to hundreds of meters, while capillary waves typically measure between a few millimeters and several centimeters. The complex characteristics of sea surfaces are determined by the interactions between these wave types under complex environmental conditions.
The predictive results of the proposed method for varying sea conditions in both Canadian and Chinese maritime domains are demonstrated in Case 1 and Case 2. The results show an overall decrease in detection probability as sea conditions deteriorate. This occurs because larger waves can physically obscure targets, affecting radar echo detection, while the loss of wave equilibrium generates breaking waves that produce sea spikes. These sea spikes significantly enhance radar backscattering, appearing as randomly distributed moving or stationary targets at various ranges and azimuths.
We do not directly analyze and extract signal features but instead transform them into two-dimensional images and utilize mature image classification networks to achieve target detection. For neural networks, appropriately increasing the number of input features can improve prediction performance to some extent; however, excessive channels will significantly increase computational complexity, and high correlation between channels may lead to information redundancy. The introduction of irrelevant channels can markedly reduce the signal-to-clutter ratio of effective channels. This paper employs three distinct signal transformation methods, which already comprehensively cover the required feature information. If additional image transformation techniques (such as STFT, GAF, etc.) were incorporated, the generated features would overlap with existing methods like CWT and RP. Moreover, the introduction of more noise features would ultimately degrade prediction performance.
5. Conclusions
This paper proposes a multi-modal detection method based on signal processing and image fusion, employing NSPWVD, NCWT, and RP methods to generate two-dimensional images for fusion. By extracting radar data information from different perspectives, such as time-frequency energy distribution and spatial topological structures, and utilizing an EfficientNetV2s classifier for detection, the method achieves the goal of detecting weak signals in sea clutter backgrounds. Through comparisons with different signal processing methods and classification models, the proposed method demonstrates significant improvement in the detection performance of small maritime targets, outperforming existing methods by approximately 21%. Validation using the IPIX and Chinese Yantai datasets shows that the proposed method achieves high detection effectiveness across various sea conditions and maritime regions. These results confirm the feasibility of combining time-series-to-image transformation with deep learning models for detection. The method holds practical value for coastal surveillance scenarios, significantly enhancing the detection probability of small floating objects at sea and contributing substantially to maritime safety and target recognition capabilities.
However, the proposed detection method still has some limitations. For instance, the three signal processing methods used, particularly NSPWVD, involve relatively high computational costs, which affect detection speed. Future research should focus on investigating the performance variations in multi-modal detection methods across different radar polarization modes, with prediction accuracy potentially enhanced through joint polarization characteristics.
Author Contributions
Conceptualization, H.W. and H.X.; methodology, H.X.; software, H.W.; validation, M.L.; formal analysis, H.W.; resources, H.W. and C.H.; data curation, H.W.; writing—original draft preparation, H.W.; writing—review and editing, H.X. All authors have read and agreed to the published version of the manuscript.
Funding
This work is supported by the National Natural Science Foundation of China (Grant No. 62171228) and Nantong Institute of Technology Science and Technology Innovation Fund (Grant No. KCTD008).
Data Availability Statement
The data were downloaded from the following website: http://soma.ece.mcmaster.ca/ipix/index.html (accessed on 27 May 2021). The data were measured with the McMaster IPIX Radar, a fully coherent X-band radar, with advanced features such as dual transmit/receive polarization, frequency agility, and stare/surveillance mode.
Conflicts of Interest
The authors declare no conflicts of interest.
References
- Guo, Z.-X.; Bai, X.-H.; Li, J.-Y.; Shui, P.-L. Fast Detection of Small Targets in High-Resolution Maritime Radars by Feature Normalization and Fusion. IEEE J. Ocean. Eng. 2022, 47, 736–750. [Google Scholar] [CrossRef]
- Hu, J.; Gao, J.; Yao, K.; Kim, U. Detection of Low Observable Targets Within Sea Clutter by Structure Function Based Multifractal Analysis. In Proceedings of the IEEE International Conference on Acoustics, Speech, and Signal Processing (ICASSP ’05), Philadelphia, PA, USA, 18–23 March 2005; Volume 5, pp. 709–712. [Google Scholar]
- Shui, P.-L.; Li, D.-C.; Xu, S.-W. Tri-Feature-Based Detection of Floating Small Targets in Sea Clutter. IEEE Trans. Aerosp. Electron. Syst. 2014, 50, 1416–1430. [Google Scholar] [CrossRef]
- Shi, S.-N.; Shui, P.-L. Sea-Surface Floating Small Target Detection by One-Class Classifier in Time-Frequency Feature Space. IEEE Trans. Geosci. Remote Sens. 2018, 56, 6395–6411. [Google Scholar] [CrossRef]
- Suo, L.; Zhao, C.; Hu, X. Sea-Surface Floating Small Target Detection Based on Joint Features. In Proceedings of the 2020 IEEE 5th Information Technology and Mechatronics Engineering Conference (ITOEC), Chongqing, China, 12–14 June 2020; pp. 882–887. [Google Scholar]
- Zhao, D.; Xing, H.; Wang, H.; Zhang, H.; Liang, X.; Li, H. Sea-Surface Small Target Detection Based on Four Features Extracted by FAST Algorithm. J. Mar. Sci. Eng. 2023, 11, 339. [Google Scholar] [CrossRef]
- Yan, Y.; Xing, H. A Sea Clutter Detection Method Based on LSTM Error Frequency Domain Conversion. Alex. Eng. J. 2022, 61, 883–891. [Google Scholar] [CrossRef]
- De Jong, R.J.; Heiligers, M.J.C.; Rosenberg, L. Discrimination of Small Targets in Sea Clutter Using a Hybrid CNN-LSTM Network. In Proceedings of the 2023 IEEE International Radar Conference (RADAR), Sydney, Australia, 6–10 November 2023; IEEE: Piscataway, NJ, USA, 2023; pp. 1–6. [Google Scholar]
- Chen, J.-H.; Tsai, Y.-C. Encoding Candlesticks as Images for Pattern Classification Using Convolutional Neural Networks. Financ. Innov. 2020, 6, 26. [Google Scholar] [CrossRef]
- Toma, R.N.; Piltan, F.; Im, K.; Shon, D.; Yoon, T.H.; Yoo, D.-S.; Kim, J.-M. A Bearing Fault Classification Framework Based on Image Encoding Techniques and a Convolutional Neural Network under Different Operating Conditions. Sensors 2022, 22, 4881. [Google Scholar] [CrossRef] [PubMed]
- Zhao, Z.; Li, C.; Dou, G.; Yang, S. Bearing Fault Diagnosis Method Based on MTF-CNN. J. Vib. Shock 2023, 42, 126–131. [Google Scholar]
- Liu, Y.; Xing, H.; Hou, T. Sea Surface Floating Small-Target Detection Based on Dual-Feature Images and Improved MobileViT. J. Mar. Sci. Eng. 2025, 13, 572. [Google Scholar] [CrossRef]
- Zhang, Q.; Deng, L. An Intelligent Fault Diagnosis Method of Rolling Bearings Based on Short-Time Fourier Transform and Convolutional Neural Network. J. Fail. Anal. Prev. 2023, 23, 795–811. [Google Scholar] [CrossRef]
- Tan, M.; Le, Q. EfficientNetV2: Smaller Models and Faster Training. In Proceedings of the 38th International Conference on Machine Learning (ICML), PMLR, Virtual Event, 18–24 July 2021; pp. 10096–10106. [Google Scholar]
- Xu, S.; Zhu, J.; Jiang, J.; Shui, P. Sea-Surface Floating Small Target Detection by Multifeature Detector Based on Isolation Forest. IEEE J. Sel. Top. Appl. Earth Obs. Remote Sens. 2021, 14, 704–715. [Google Scholar] [CrossRef]
- Zhao, W.; Jin, M.; Cui, G.; Wang, Y. Eigenvalues-Based Detector Design for Radar Small Floating Target Detection in Sea Clutter. IEEE Geosci. Remote Sens. Lett. 2022, 19, 3509105. [Google Scholar] [CrossRef]
- Pei, J.; Yang, Y.; Wu, Z.; Ma, Y.; Huo, W.; Zhang, Y.; Huang, Y.; Yang, J. A Sea Clutter Suppression Method Based on Machine Learning Approach for Marine Surveillance Radar. IEEE J. Sel. Top. Appl. Earth Obs. Remote Sens. 2022, 15, 3120–3130. [Google Scholar] [CrossRef]
- Chernyshov, P.; Vrećica, T.; Nauri, S.; Toledo, Y. Wavelet-Based 2-D Sea Surface Reconstruction Method from Nearshore X-Band Radar Image Sequences. IEEE Trans. Geosci. Remote Sens. 2022, 60, 511131. [Google Scholar] [CrossRef]
- Li, G.; Zhang, H.; Gao, Y.; Ma, B. Sea Clutter Suppression Using Smoothed Pseudo-Wigner–Ville Distribution–Singular Value Decomposition During Sea Spikes. Remote Sens. 2023, 15, 5360. [Google Scholar] [CrossRef]
- Shi, Y.; Guo, Y.; Yao, T.; Liu, Z. Sea-Surface Small Floating Target Recurrence Plots FAC Classification Based on CNN. IEEE Trans. Geosci. Remote Sens. 2022, 60, 5115713. [Google Scholar] [CrossRef]
- Bakker, R.; Currie, B. McMaster IPIX Radar. Available online: http://soma.ece.mcmaster.ca/ipix/index.html (accessed on 26 June 2025).
- Guan, J.; Liu, N.; Wang, G.; Ding, H.; Dong, Y.; Huang, Y.; Tian, K.; Zhang, M. Sea-Detecting Radar Experiment and Target Feature Data Acquisition for Dual Polarization Multistate Scattering Dataset of Marine Targets. J. Radars 2023, 12, 456–469. [Google Scholar] [CrossRef]
Disclaimer/Publisher’s Note: The statements, opinions and data contained in all publications are solely those of the individual author(s) and contributor(s) and not of MDPI and/or the editor(s). MDPI and/or the editor(s) disclaim responsibility for any injury to people or property resulting from any ideas, methods, instructions or products referred to in the content. |
© 2025 by the authors. Licensee MDPI, Basel, Switzerland. This article is an open access article distributed under the terms and conditions of the Creative Commons Attribution (CC BY) license (https://creativecommons.org/licenses/by/4.0/).