1. Introduction
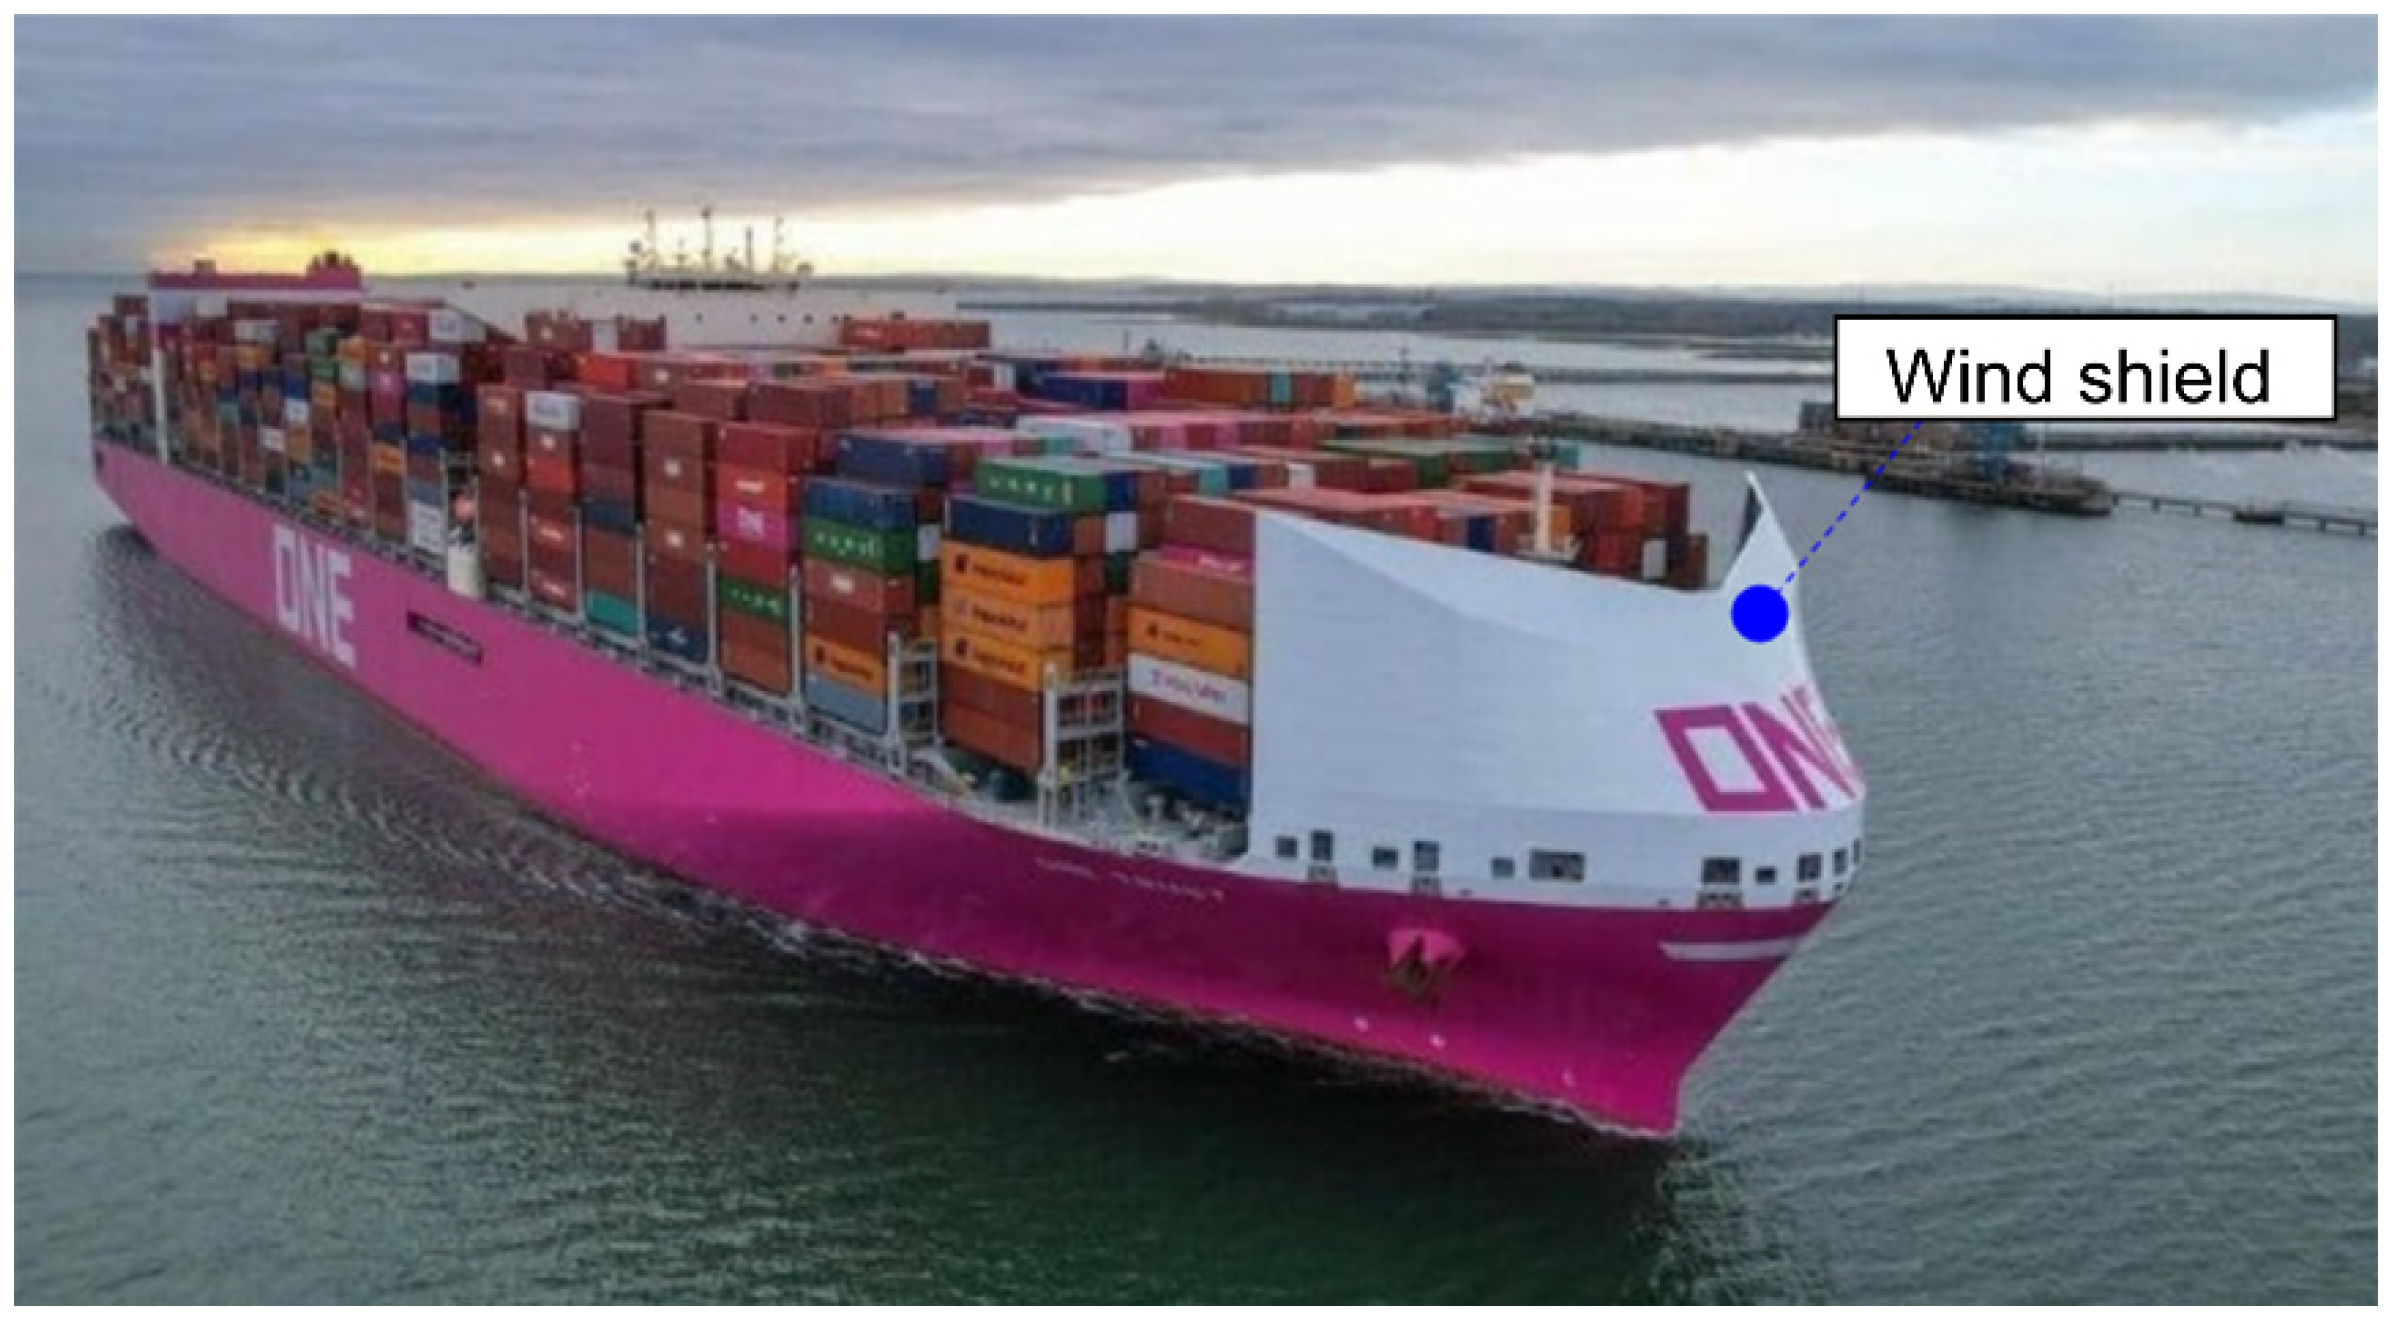
The maritime industry is at the forefront of addressing the dual challenges of sustainability and energy efficiency. Driven by global mandates such as the International Maritime Organization’s (IMO) 2050 decarbonization strategy, the transition toward eco-friendly practices has become increasingly urgent. This ambitious plan seeks to markedly lower greenhouse gas (GHG) emissions by adopting cutting-edge technologies and alternative energy sources. Among numerous solutions, wind energy conversion systems and aerodynamic optimizations emerge as critical strategies for reducing fuel consumption and promoting environmental stewardship within the shipping sector. As wind energy gains viability, efforts have focused on its seamless integration into modern vessel designs. These systems, drawing inspiration from traditional sailing methods yet enhanced with advanced materials and engineering, offer a renewable and cost-effective energy source. For example, NaviScreens and sails are being reengineered as dynamic components that both diminish aerodynamic drag and capture wind power to propel vessels more efficiently. Such innovations highlight the fusion of traditional maritime knowledge with modern technological advancements.
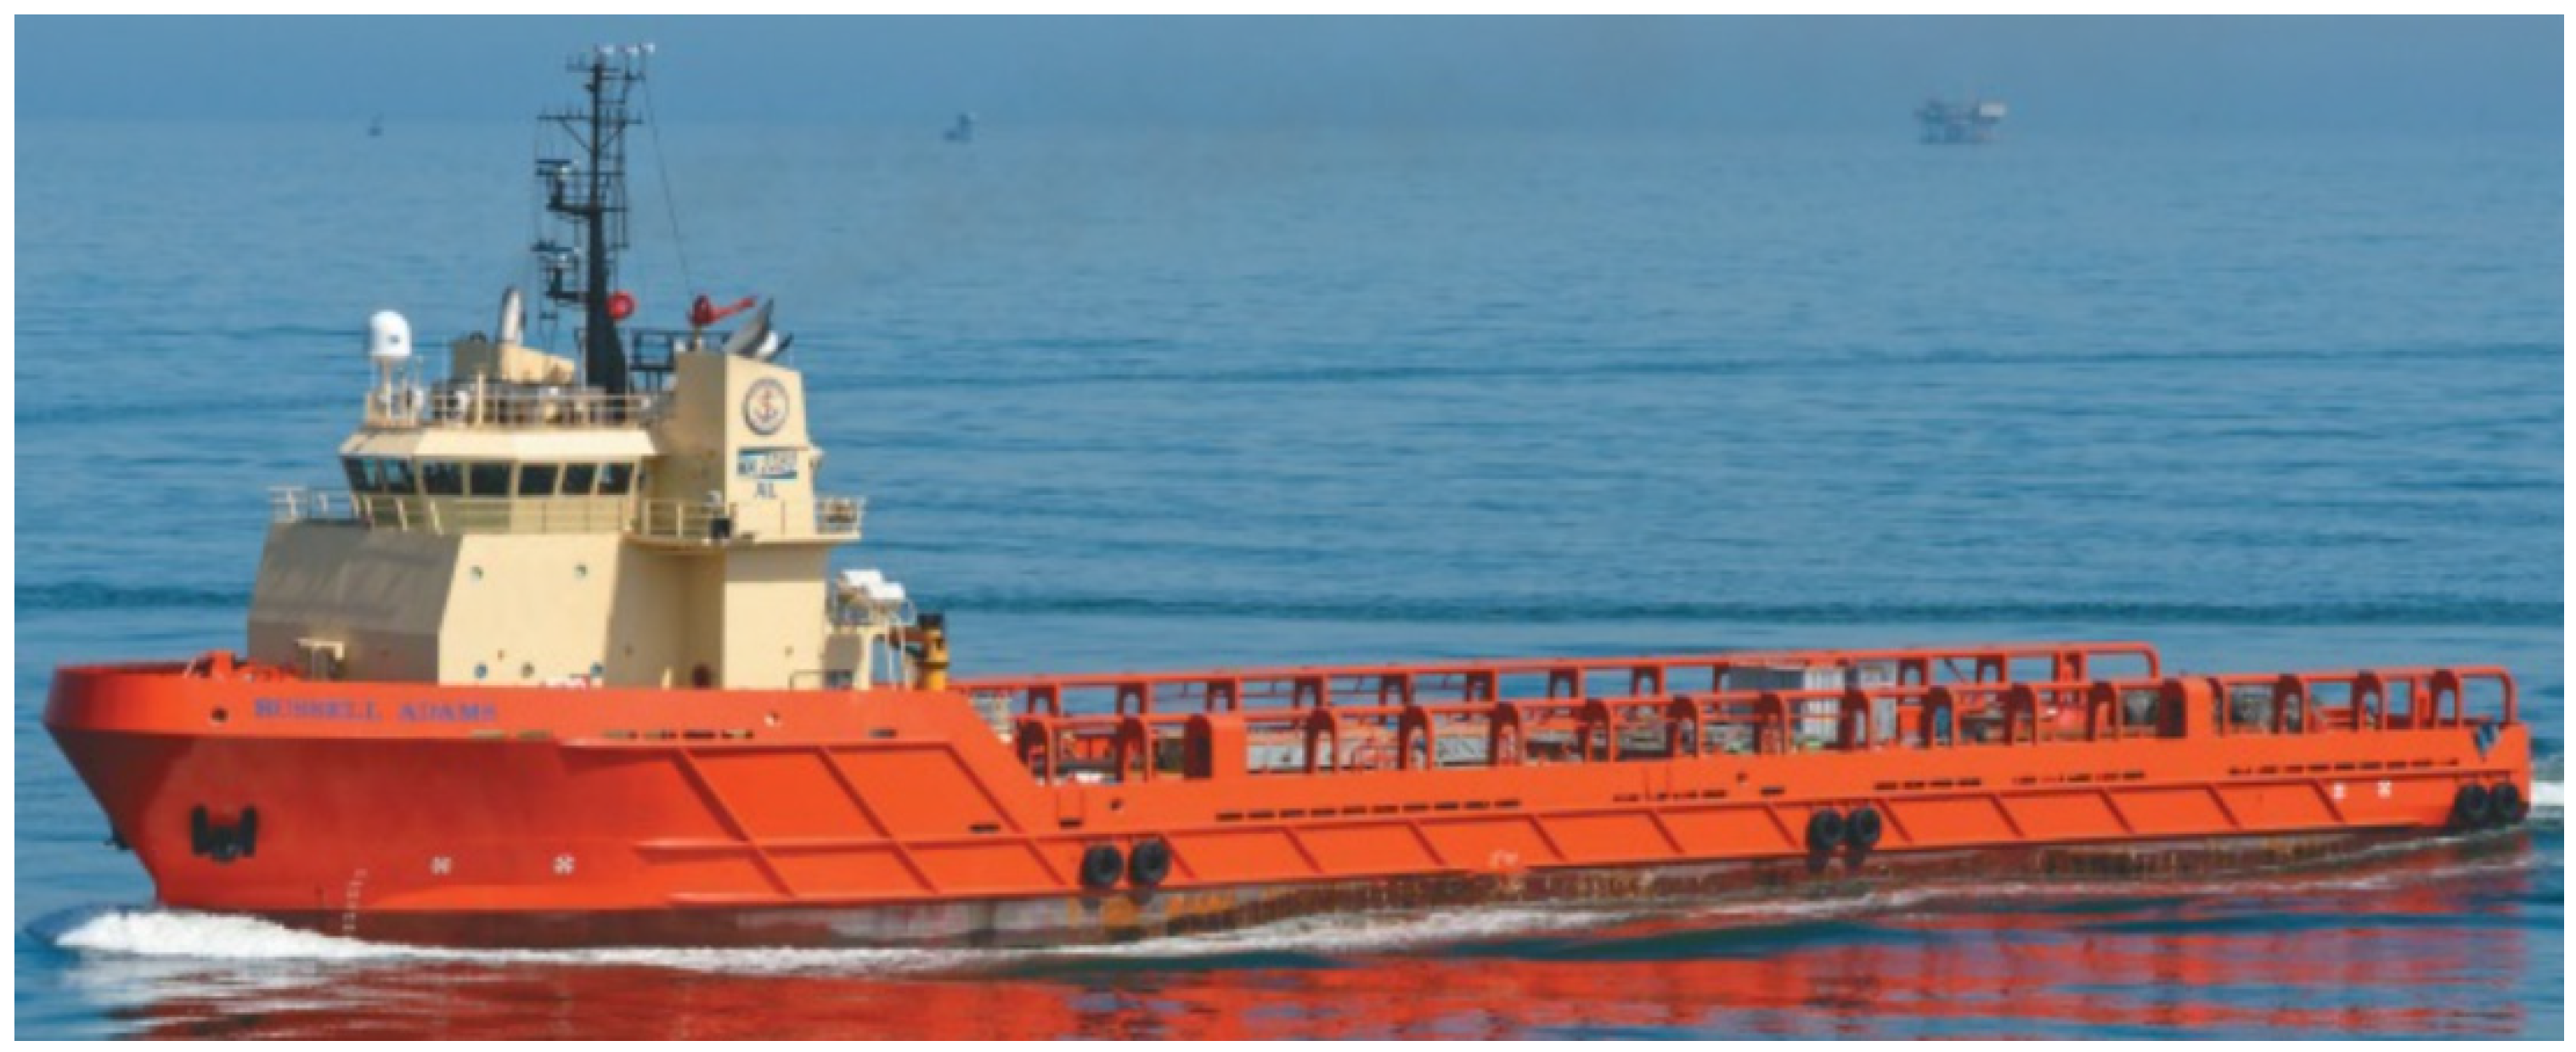
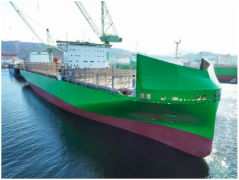
Despite the growing interest in aerodynamic optimization of ship structures, research on Wind Caps (or NaviScreens) has remained limited, with most studies focusing on large container ships or high-speed ferries. Recent advancements in computational fluid dynamics (CFD) have facilitated high-fidelity aerodynamic simulations of Wind Caps across various ship categories, including medium-sized commercial vessels. This study aims to advance the field by investigating the effect of Wind Caps on reducing aerodynamic resistance in an 82 m-class commercial vessel through CFD-based numerical analysis. Furthermore, we explore the structural challenges presented by green water pressure on NaviScreen structures. Green water is a phenomenon where large waves inundate the deck, and it imposes significant loads on the exposed structures, thereby testing their resilience and safety. Analyzing and reinforcing these structures is essential to ensure that energy-saving devices such as Wind Caps function reliably within harsh marine environments.
This research assesses the design and structural integrity of NaviScreens, a drag reduction device for large ships, via numerical analysis and proposes reinforcement strategies, including Carling reinforcement and thickness optimization. The study contributes to the broader discourse on sustainable and efficient shipping by providing practical insights into balancing environmental objectives with engineering feasibility, thereby advancing the progress of the maritime industry toward a greener future. A summary of relevant previous studies is provided below.
Andersen [
1] examines wind loads on a 9000 TEU Post-Panamax container ship through wind tunnel experiments, analyzing the impact of container stacking configurations on wind forces and moments. Their results demonstrated that gaps between container stacks increase resistance by up to 100%, whereas aerodynamically optimized stacking reduces drag and yaw moments significantly.
Wnek & Soares [
2] conducted a comparative study of wind loads on LNG carriers and floating LNG platforms using numerical analysis (CFD) and wind tunnel experiments. They calculated wind coefficients in the X and Y directions, as well as yaw moment coefficients, through numerical analysis, employing various mesh settings and analysis models to enhance result reliability. Generally, the numerical analysis aligned reasonably well with the wind tunnel experiment outcomes. However, the study observed minimal measured loads due to low wind speeds (10 m/s), and sensor sensitivity limitations affected result accuracy. Consequently, additional experimental investigations under high wind speed conditions are required.
Yunsik et al. [
3] concentrate on aerodynamic modifications of container ship superstructures to minimize air resistance. The findings indicate that obstructing airflow between container gaps can decrease air resistance by up to 56%, making it the most effective approach. The findings provide insights into design optimization for fuel efficiency and emission reduction in large container ships.
Janssen et al. [
4] quantitatively examined the impact of increased wind resistance on ship operations and port activities as container ships grow larger, utilizing numerical analyses and wind tunnel test data. The study evaluated how incorporating the spacing between containers and the intricacies of hull shape detail influenced wind load outcomes. Refining the shape of the ship reduced the disparity between numerical analysis and wind tunnel results, and integrating container spacing into the model decreased wind load by approximately 10%.
Fujiwara et al. [
5] introduced a novel method for estimating wind forces and moments on ships using a component-based aerodynamic model. This technique segments a ship’s superstructure into several components, each individually analyzed in wind tunnel tests. Validated against full-scale measurement data, this approach enhances the predictive accuracy for ship design and maneuvering simulations.
Trivyza et al. [
6] investigates aerodynamic effects on megayacht superstructures and their impact on passenger comfort and helicopter operations. Employing CFD simulations, the study assesses flow separation, turbulence, and vortex formation around the superstructure at various wind angles. Findings indicate that airwake turbulence becomes highly unstable at elevated wind speeds, making helicopter landings unsafe above 20 knots.
Majidian et al. [
7] developed an advanced wind resistance prediction model for container ships operating under oblique wind conditions using CFD simulations and statistical data. Their research validates the model against actual voyage data from a 2748 TEU container ship. The proposed image method for modeling wind–sea interactions enhances prediction accuracy compared to conventional models.
Ricci et al. [
8] presented results from a numerical CFD analysis of wind loads on a large passenger ship moored at the Rotterdam passenger terminal under various wind directions. A high-resolution mesh was utilized to accurately represent the ship’s structure and the distribution of wind load in relation to surrounding high-rise buildings. There are some deviations between the numerical analysis results derived from the study and the wind tunnel experiment, and it is necessary to always use the large eddy simulation (LES) model to improve the accuracy.
Portell [
9] demonstrated the aerodynamic performance of a car carrier’s wind sail under extreme conditions using CFD simulations. The simulation results closely aligned with experimental data, though discrepancies appeared at certain angles. To more reliably validate the numerical analysis results, acquiring additional wind tunnel experimental data is necessary, and the impacts of vibration and fatigue induced by dynamic stall and vortex shedding on structural safety require more comprehensive analysis.
Yoo et al. [
10] quantified the wind load generated when an FPSO and a shuttle tanker are positioned side by side during unloading operations through numerical simulations. The variations in wind load and shielding effects relative to the distance between the two vessels were analyzed and compared with wind tunnel experiments. The shuttle tanker exhibits a heightened shielding effect from the FPSO, evidenced by a reduced wind load coefficient. Owing to the limited precision of the experimental data and variations in the testing environment, discrepancies arose between experimental outcomes and numerical analyses at certain angles.
Gu et al. [
11] examined the dynamic response of a structure using a numerical analysis technique that accounts for the combined effects of nonlinear wave loads and structural deformation. The validity of the CFD–FEA method was established by comparison with both the existing latent flow-based model and the nonlinear numerical model. The CFD–FEA method successfully captured nonlinear wave interactions and simulated them more realistically than the latent flow-based model. To mitigate the high computational costs associated with the CFD–FEA method, efficient mesh configurations and enhanced calculation algorithms are necessary. Moreover, obtaining additional tank experimental data is essential to improve the reliability of the numerical analysis results.
Wang et al. [
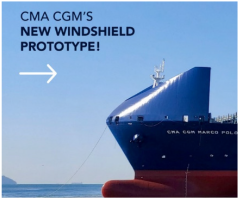
12] assesses various windshield shapes, identifying the optimal design that decreases aerodynamic drag by 20.67% under headwind conditions. The results demonstrate that windshield geometry significantly influences wind resistance and that advanced optimization techniques improve design efficiency.
Extensive research has been conducted to evaluate aerodynamic and hydrodynamic loads on marine structures using computational and experimental methods, yet significant limitations persist in both scope and methodology. Early foundational work by Wnek and Soares [
2] employed comparative analyses between CFD simulations and wind tunnel experiments for LNG carriers and floating platforms, revealing critical discrepancies attributed to sensor sensitivity limitations and low wind-speed conditions; their findings underscored the necessity for high-wind-speed experimental validation to improve computational accuracy, though their focus remained narrowly confined to validation challenges without addressing structural implications. Janssen et al. [
4] expanded the field by examining wind resistance in large container ships, demonstrating how vessel size amplifies aerodynamic drag and advocating for refined geometric modeling using RANS-based simulations; however, their work prioritized aerodynamic performance metrics while neglecting the structural integrity of drag-reduction devices under operational loads—an oversight similarly evident in Ricci et al. [
8], who investigated wind loads on moored passenger ships near urban structures but limited their analysis to localized pressure variations without extending their methodology to structural reinforcement strategies. The most comprehensive aerodynamic optimizations were achieved by Nguyen and Watanabe [
13,
14,
15,
16,
17] in their seminal series on 20,000 TEU container ships, where they systematically evaluated bow modifications, container arrangements, and wake-control devices, achieving up to 24% drag reduction through combined CFD and wind tunnel testing. Despite these advancements, their studies suffered from two critical shortcomings: first, their exclusive focus on ultra-large container ships left smaller vessel classes like MPVs unexplored; second, their optimization protocols ignored structural resilience under extreme environmental loads such as green water impacts, rendering their designs potentially vulnerable in real-world conditions. Similarly, while Portell [
9] and Yoo et al. [
10] made strides in analyzing wind sails and shielding effects, respectively, their work lacked integration with structural finite element analysis, and Gu et al. [
11], though pioneering a CFD-FEA hybrid approach, focused on wave-structure interactions rather than aerodynamic devices, leaving unresolved the dual challenge of drag reduction and structural robustness.
This study transcends these limitations by introducing a holistic CFD-FEA framework that simultaneously optimizes aerodynamic performance and structural integrity for NaviScreens on medium-sized MPVs, a vessel class historically overlooked in prior research. Through systematic parametric analysis of 20 NaviScreen configurations, we identified the Type-15 design as optimal, achieving a 17.1% reduction in aerodynamic resistance under headwinds and 24.5% under oblique winds (30° yaw), while concurrently addressing the structural vulnerabilities inherent in prior designs. Crucially, our nonlinear FEA under combined deadweight, 50 m/s wind, and KR-classified green water pressure revealed localized buckling risks, which we mitigated through carling stiffeners and plate-thickness optimization (6 mm to 8 mm) interventions absent in earlier studies. The reinforced design not only satisfies KR yield limits but also exceeds ABS buckling factors (>1.0) and NORSOK displacement criteria (L/100), ensuring operational resilience in extreme environments.
3. CFD Simulation
3.1. Numerical Analysis Method
The CFD simulations were performed using the commercial software STAR-CCM+ (version 10.03) to evaluate the aerodynamic performance of the proposed NaviScreen configurations for the MPV. The incompressible turbulent flow field was solved using the finite volume method (FVM) with the governing equations consisting of the continuity equation and the Reynolds-averaged Navier–Stokes (RANS) equations. Turbulence closure was achieved with the SST
model, which offers improved predictive accuracy in separating flows under adverse pressure gradients [
12].
The general form of the governing equations can be expressed as follows:
where the Reynolds stress term −
is modeled according to the SST
turbulence closure.
As previously mentioned, the numerical analysis of MPV was conducted using two distinct approaches to enhance computational efficiency. The numerical methods used in each simulation are summarized in
Table 3 and
Table 4.
In this research, the computational domain and boundary conditions were refined based on established methodologies [
19]. As illustrated in
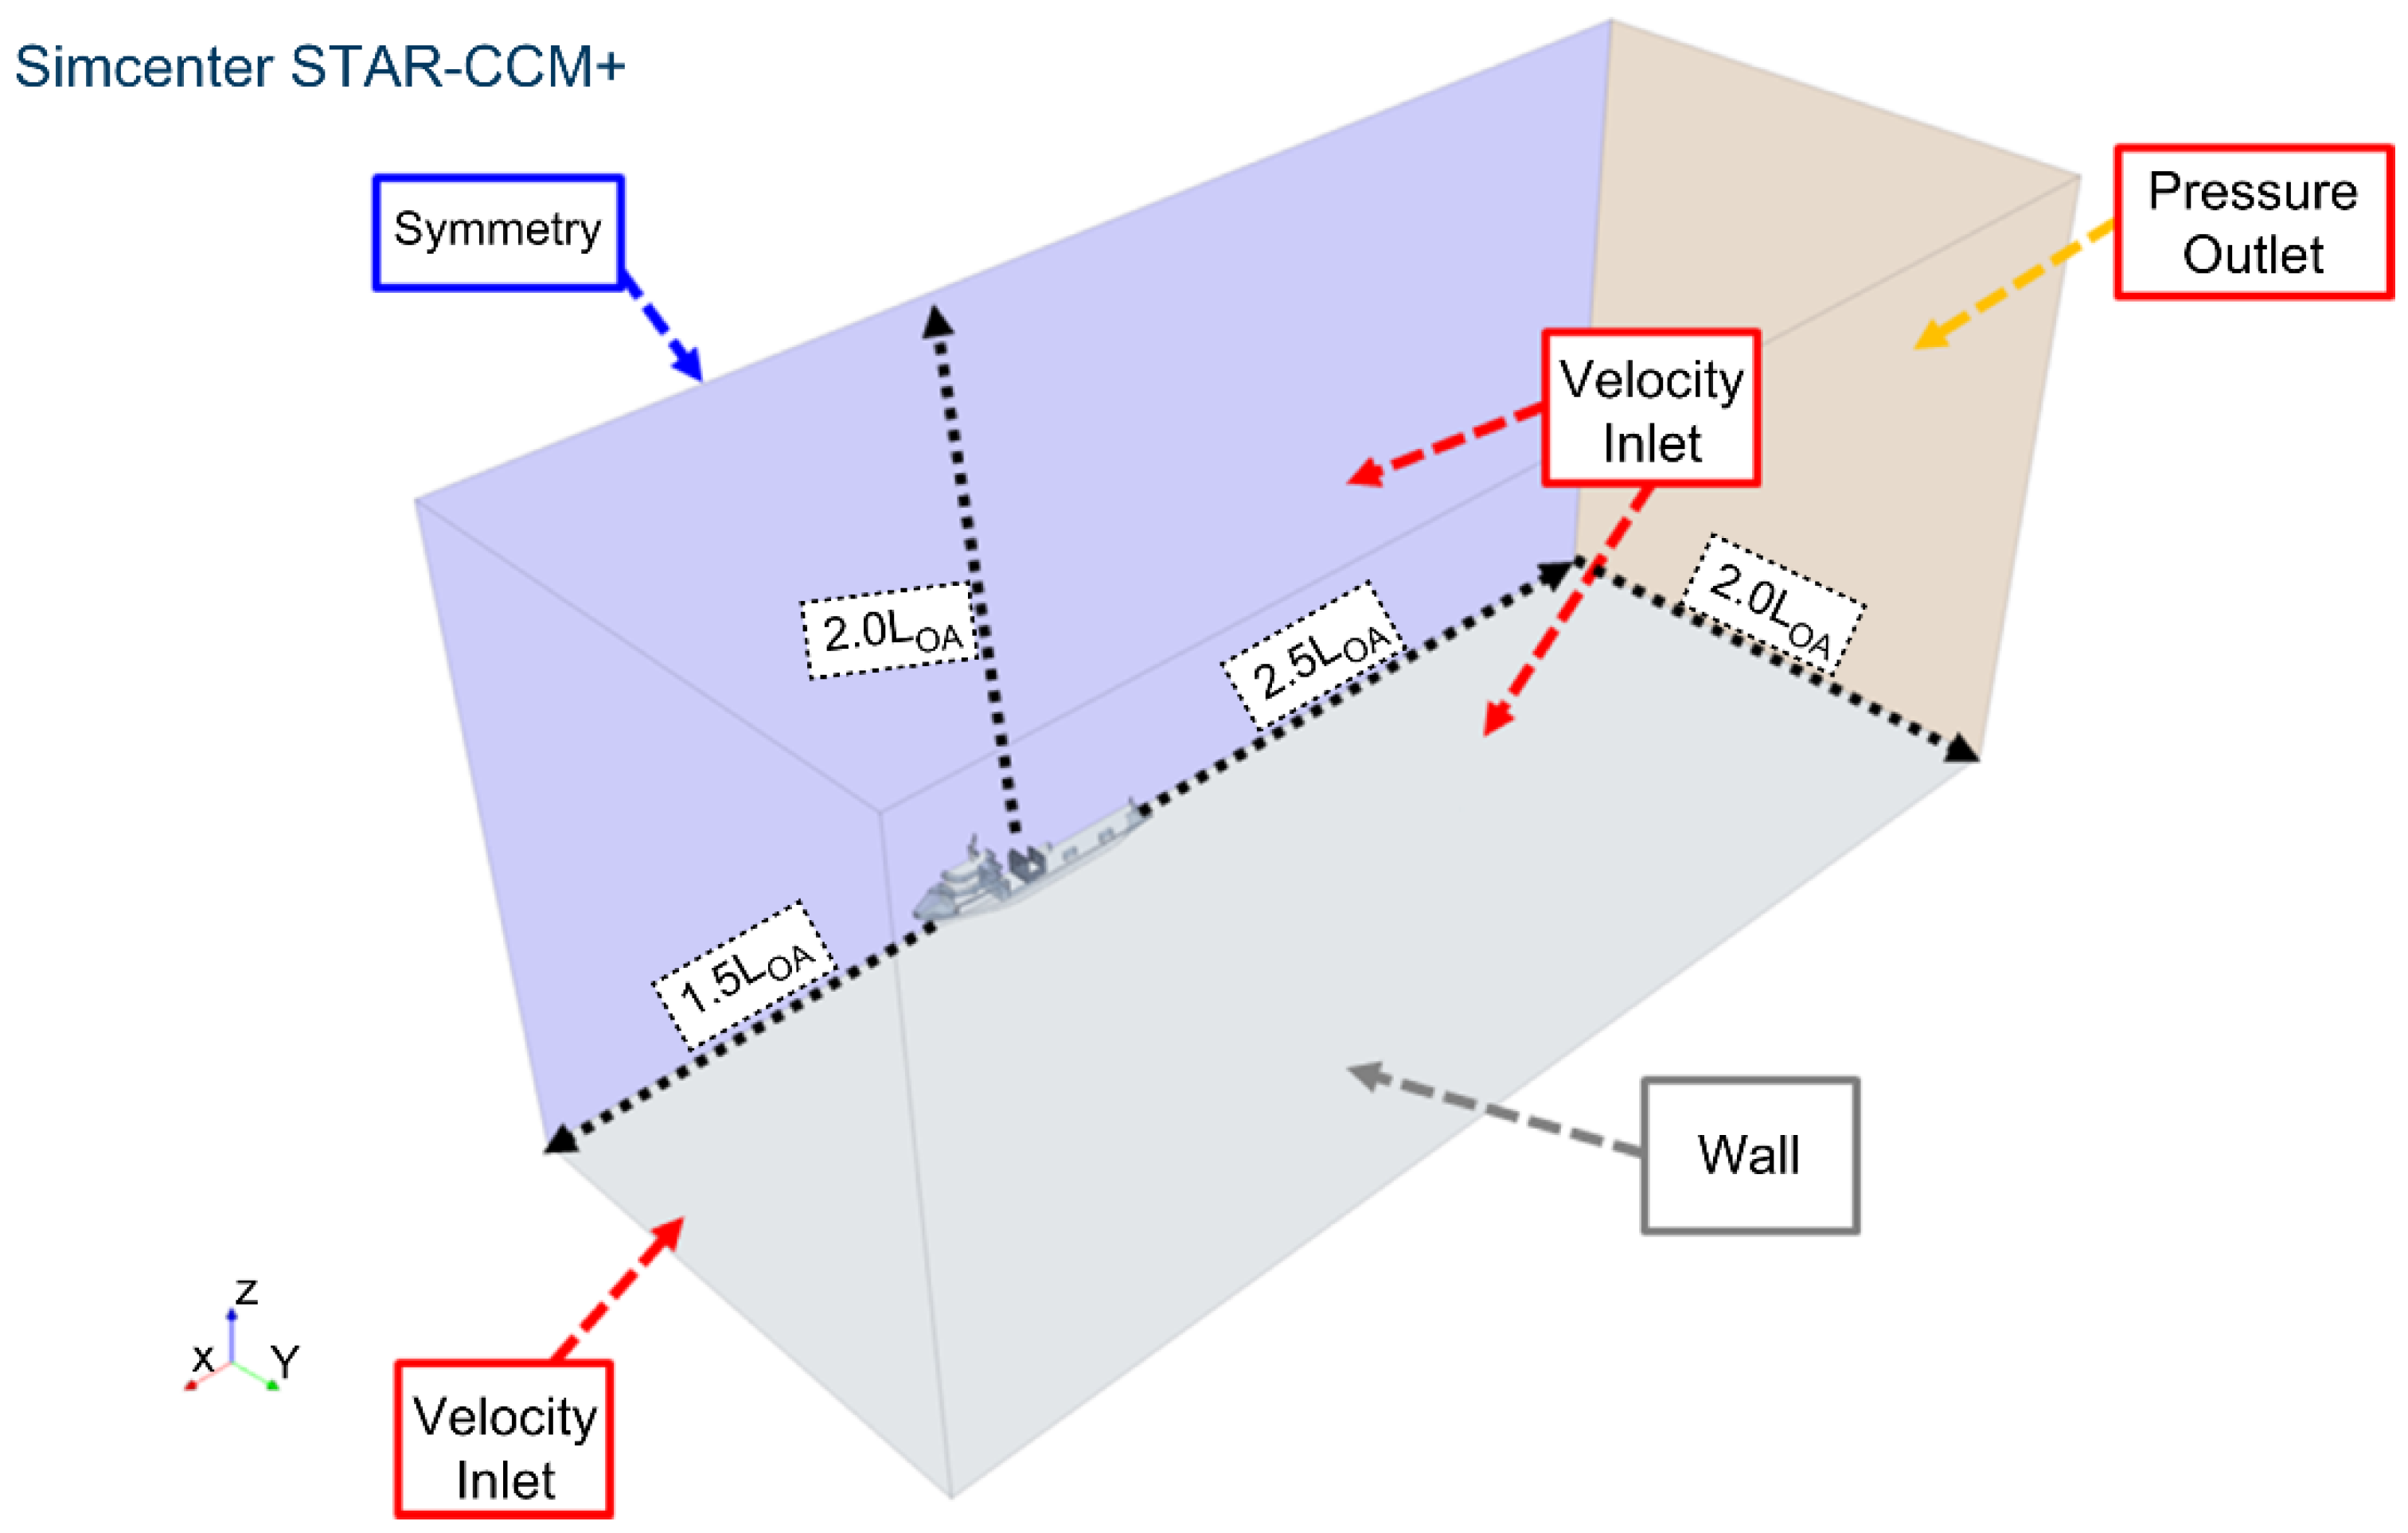
Figure 4, the computational domain was designed to adhere to the minimum length guidelines recommended by the ITTC [
20], corresponding to the length overall (LOA) of the ship. To minimize computational time, a symmetry condition was imposed along the centerline of the ship, and a velocity inlet boundary condition was established at the domain inlet to replicate the ship’s forward speed (Vs).
Additionally, to maintain physical continuity, a velocity inlet condition was applied to the upper boundary of the numerical domain, whereas a pressure outlet condition was designated at the rear boundary. The lower boundary conditions varied between the two simulations: for the multiphase fluid analysis, a velocity inlet condition was utilized to preserve physical continuity; in contrast, for the single-phase aerodynamic simulation, a wall boundary condition was implemented to represent the free surface.
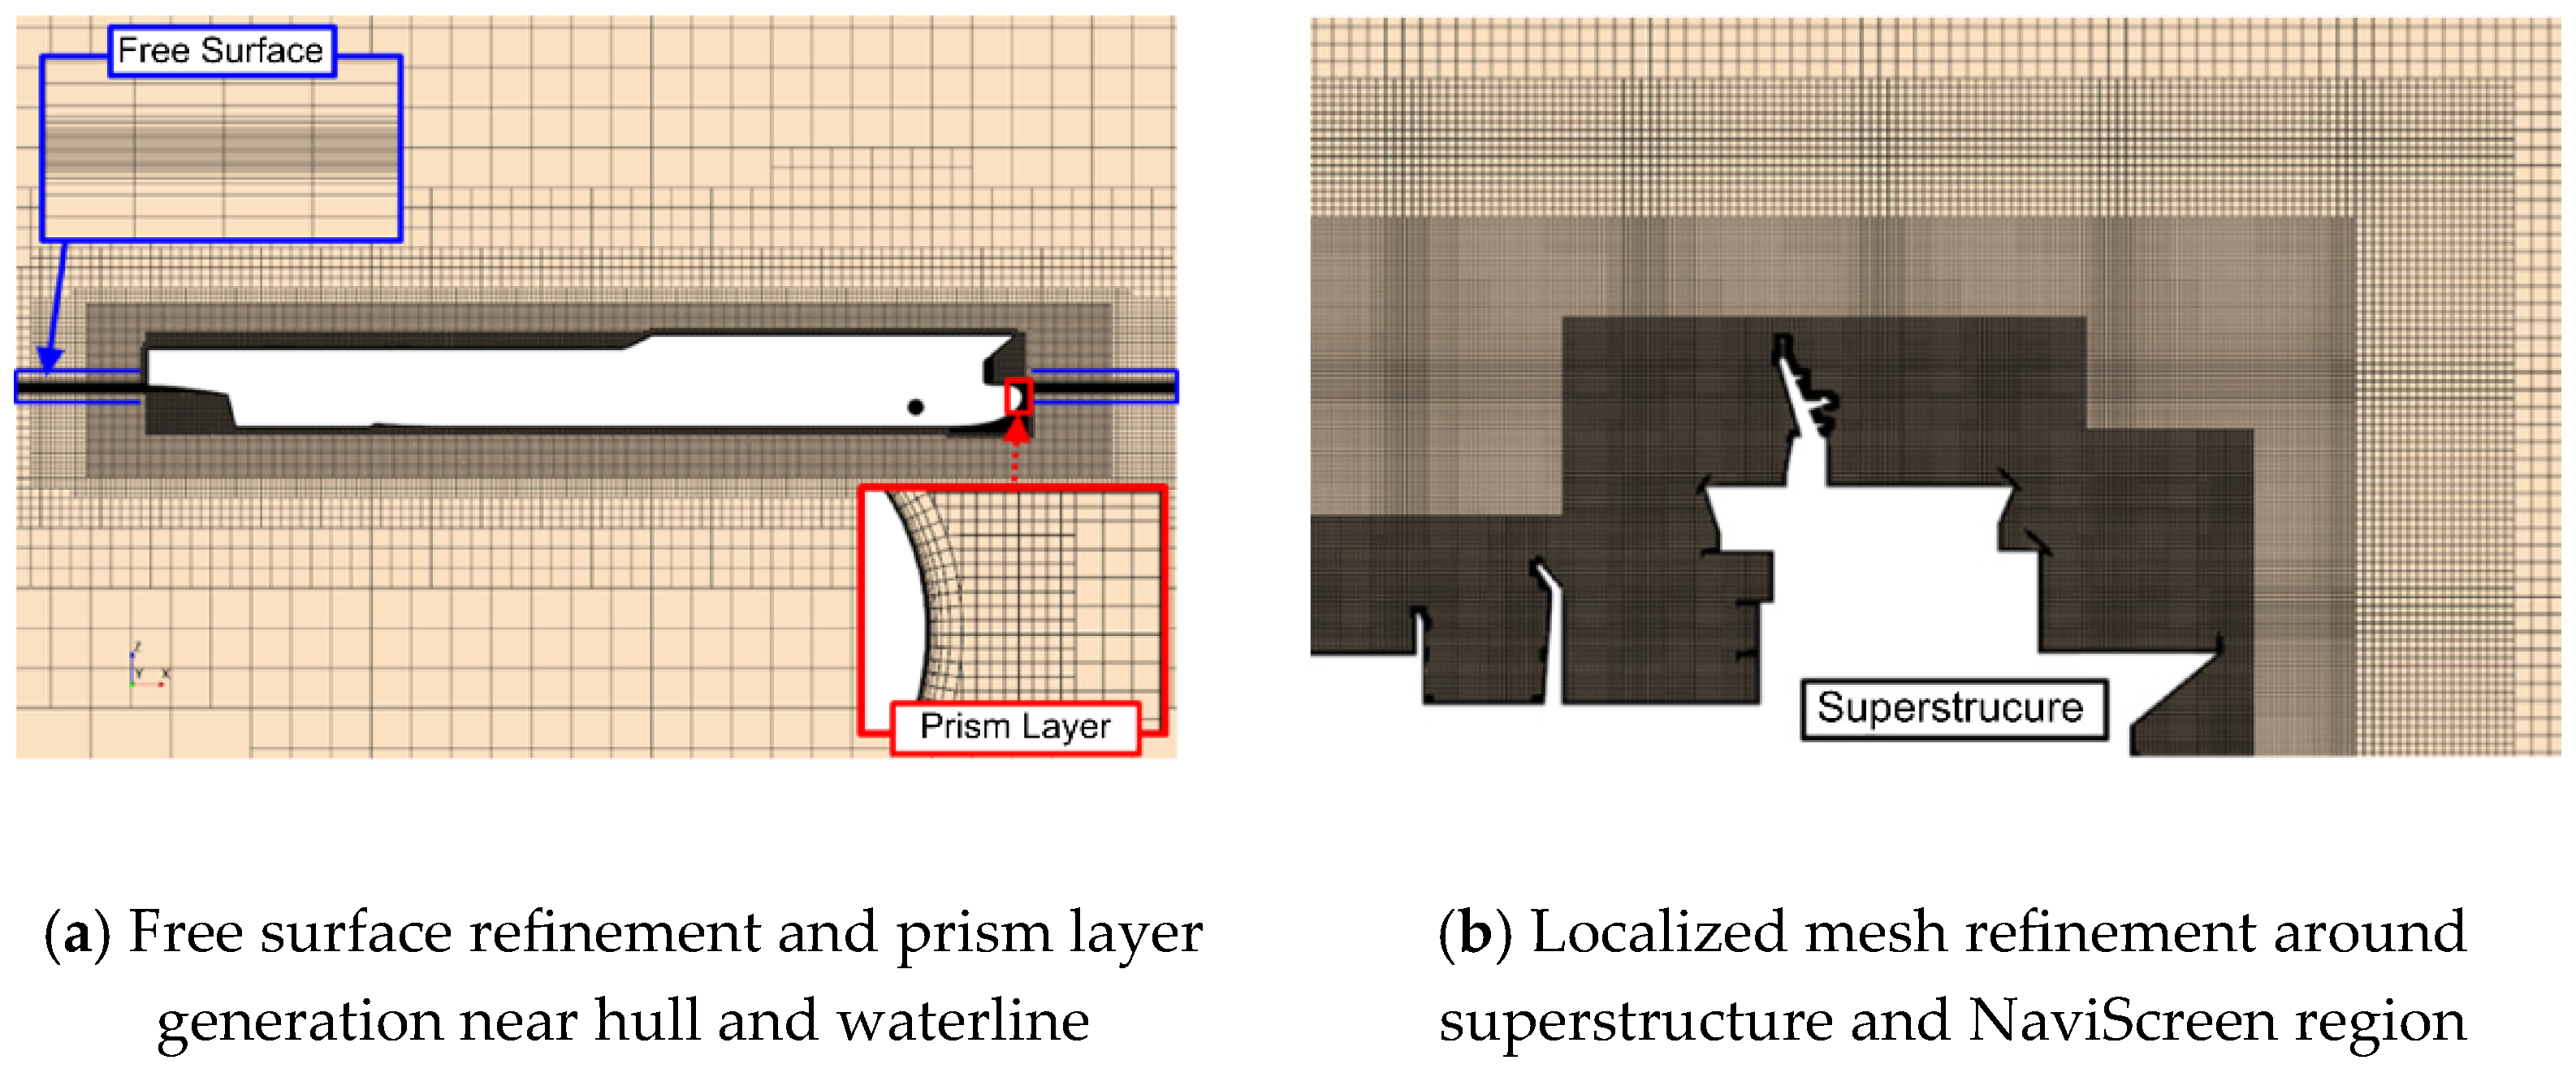
Figure 5 presents the updated mesh generation strategy for both aerodynamic and hydrodynamic simulations. Specifically,
Figure 5a depicts the refinement of the free surface and the incorporation of prism layers adjacent to the hull and waterline, ensuring precise resolution of boundary layers and free surface interactions.
Figure 5b highlights the localized mesh refinement applied to the superstructure and the NaviScreen region, where flow separation and recirculation are expected to occur. A high-resolution unstructured mesh, primarily composed of hexahedral and prismatic elements, was created, encompassing approximately 10.6 million cells for aerodynamic simulations. The mesh topology was refined to satisfy Y+ criteria for the SST
k–
ω turbulence model, ensuring accurate prediction of turbulent flow around the NaviScreen. This advanced meshing technique improves numerical precision in capturing drag-related phenomena and directly supports the aerodynamic efficiency analysis outlined in
Section 3. The analysis of the grid convergence in this study was conducted through grid uncertainty analysis using Richardson’s extrapolation formula, and the convergence of the grid system was determined by estimating the virtual solution (ϕ_0) when the grid spacing becomes 0 [
21].
3.2. Numerical Analysis Results of Design Models
The initial numerical analysis results for the MPV are summarized in
Table 5. These encompass a multiphase hydrodynamic simulation of the lower hull and a single-phase aerodynamic simulation of the upper structure prior to NaviScreen implementation. The total resistance of the hull was calculated as follows:
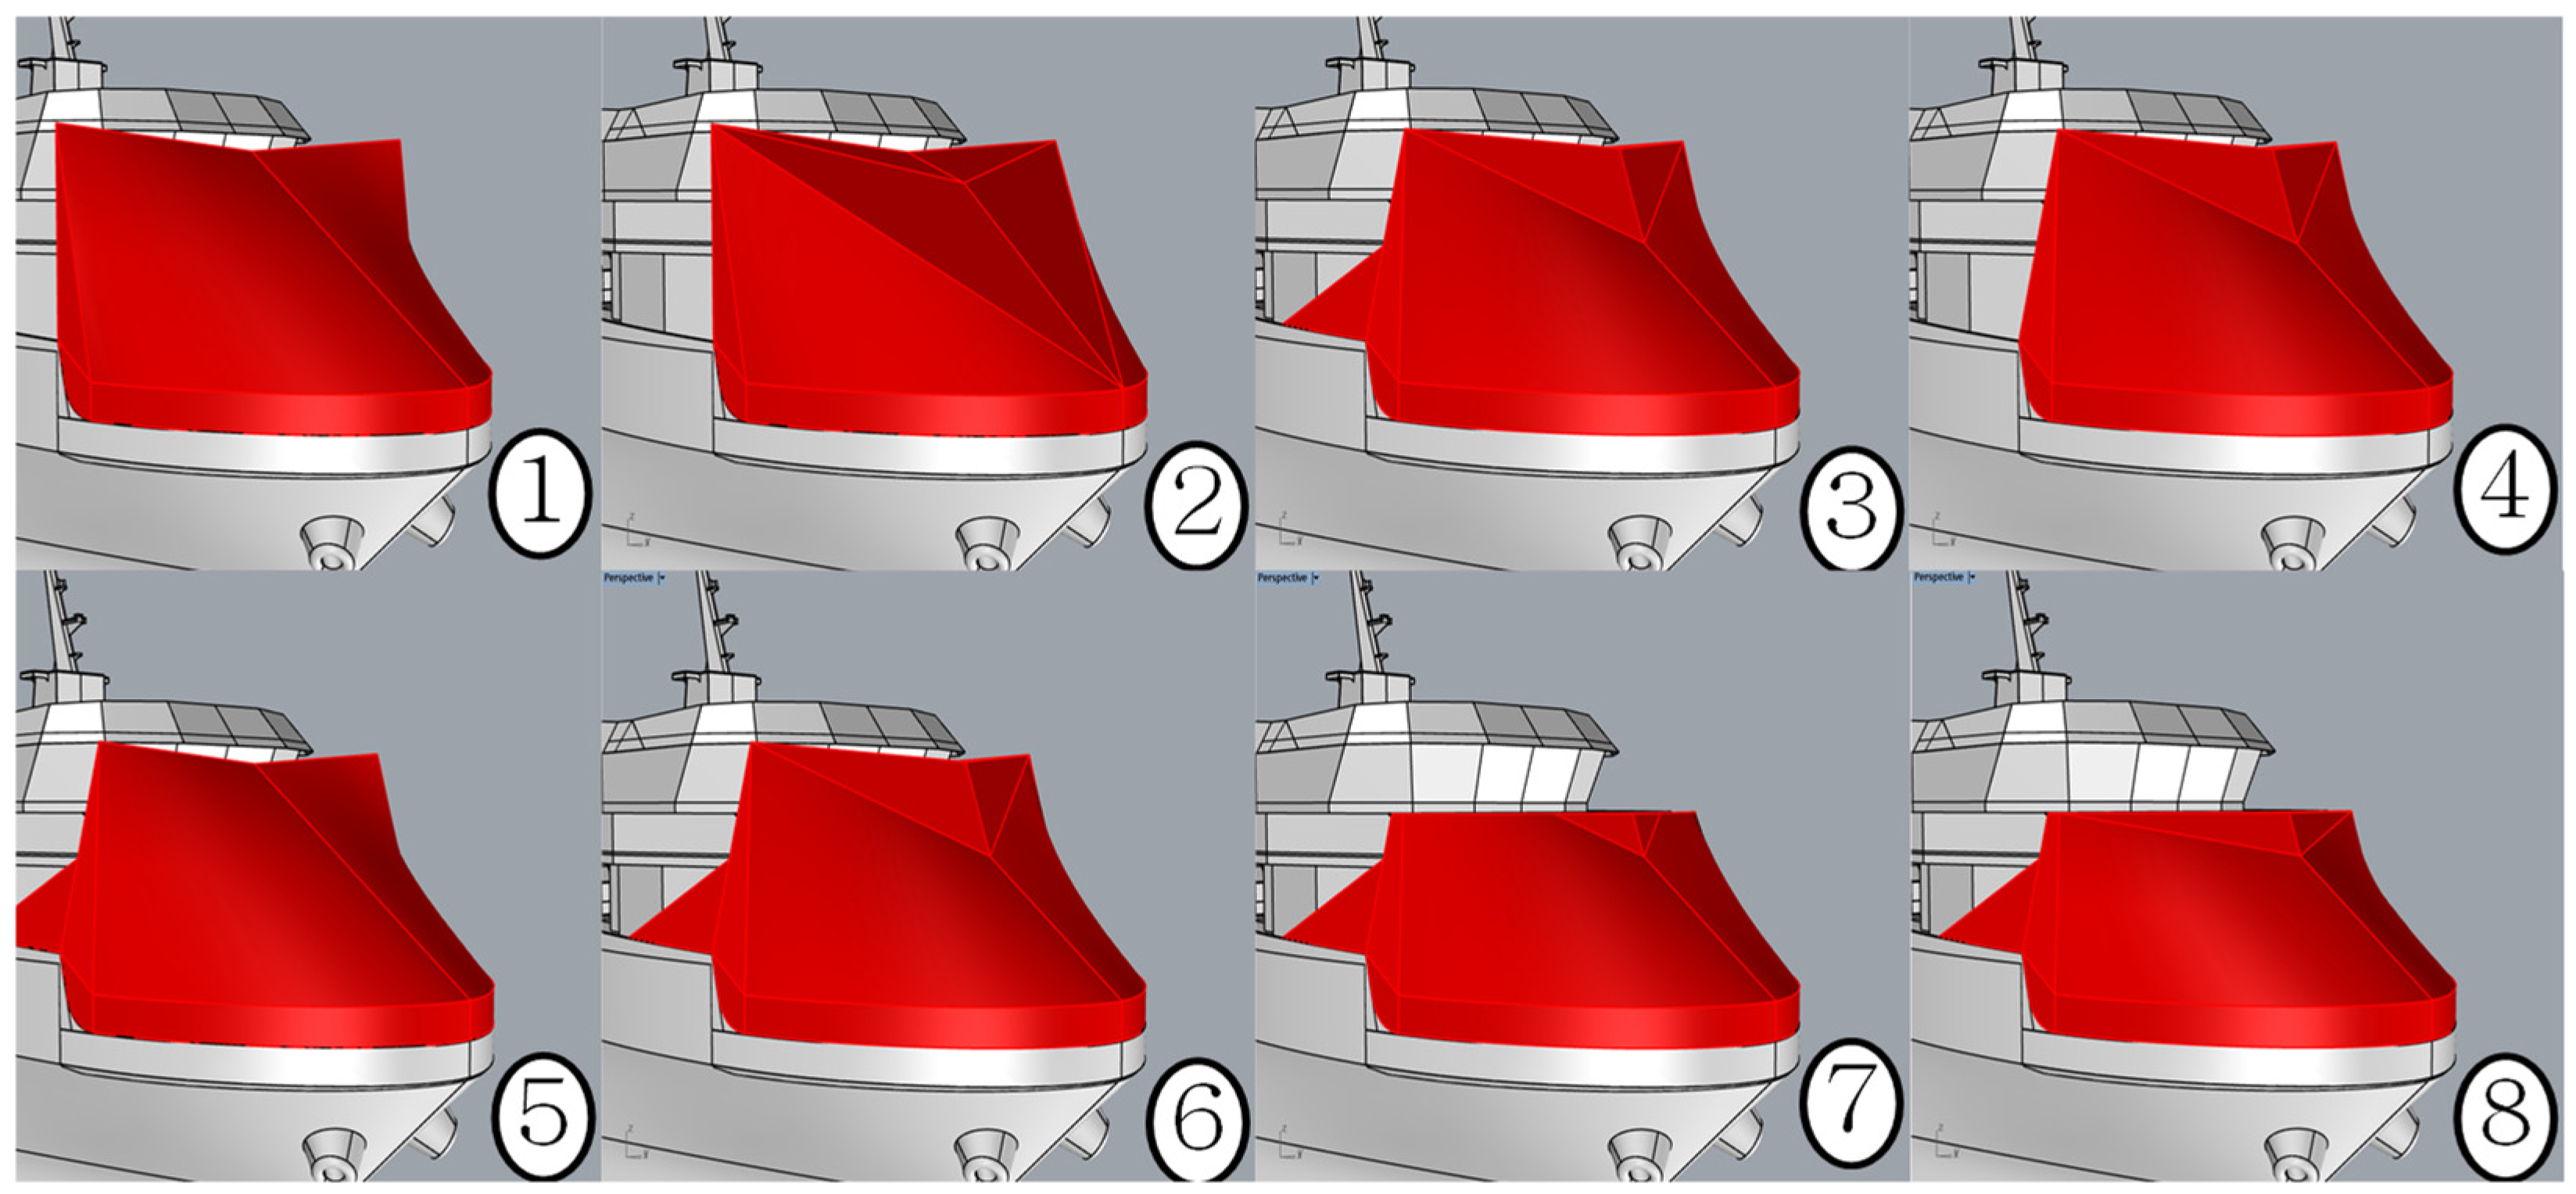
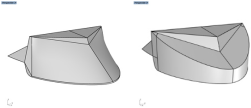
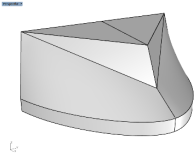
This study focused on the NaviScreen design to minimize aerodynamic resistance in the MPV. The initial NaviScreen shapes were based on actual ship designs and are displayed in
Figure 6. These shapes underwent aerodynamic CFD simulations to assess their effectiveness in reducing resistance. The final NaviScreen designs were optimized through performance analyses and adherence to additional design requirements.
The initial NaviScreen shapes were refined by integrating design criteria to create a NaviScreen suitable for MPV applications.
Table 6 presents a comparative overview of the key design features across eight initial NaviScreen configurations (Type-1 to Type-8) evaluated for aerodynamic drag reduction on multipurpose vessels (MPVs). The table systematically categorizes each model based on four critical design parameters: (1) slope geometry (smooth or angled), (2) width (wide or narrow), (3) presence of a horn (a flow-directing protrusion), and (4) extensions (side or top). Notably, Type-1 and Type-2 represent baseline designs with wide profiles but differ in slope geometry (smooth vs. angled) and the inclusion of a top extension in Type-2. In contrast, Type-3 through Type-8 feature narrower widths, with variations in horn placement and extension configurations. For instance, Type-3 and Type-7 incorporate all three enhancements (horn, side, and top extensions), while Type-5 omits the horn but includes a side extension. This parametric variation underscores the study’s objective to isolate the aerodynamic effects of individual design elements. The absence of horns in Type-1, Type-2, and Type-5 highlights a deliberate exploration of streamlined vs. flow-controlled designs, whereas the consistent use of side/top extensions in later models (e.g., Type-6–Type-8) suggests their hypothesized role in mitigating turbulence. The table’s structured comparison lays the groundwork for subsequent CFD simulations, which quantitatively assess how these features influence drag reduction, a methodology pivotal to identifying optimal configurations like the sloped Type-15 (
Table 7).
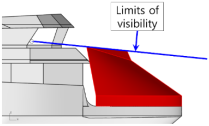
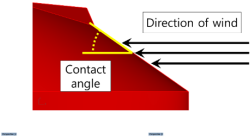
The design requirements included visibility constraints, contact angle, lower edge height, and horn position. Since the NaviScreen is installed on the foredeck, it has the potential to obstruct bridge visibility. Therefore, the visibility from the bridge was calculated, and the NaviScreen was designed to comply with the required visibility range. The contact angle refers to the inclination at which wind interacts with the NaviScreen. Lower edge height measures the vertical dimension of the base of the NaviScreen, which attaches to the vessel. Horn position describes the protruding feature at the upper center of the NaviScreen, while shape type denotes its overall geometric configuration.
Table 7 summarizes these design requirements. To design an effective air resistance reduction structure for the bow area of MPVs, a CFD model was developed, meticulously incorporating multiple design parameters. These parameters were selected to address both operational constraints and aerodynamic optimization goals. The initial modeling phase explored various NaviScreen configurations, focusing on factors affecting flow separation, drag distribution, and bridge visibility. Five key design factors were examined, as detailed in
Table 8:
- (1)
Visibility Constraint (Height Limitation): Installed on the forecastle deck, the NaviScreen must not impede the line of sight from the navigation bridge. Consequently, its maximum height was constrained by a calculated visibility region, ensuring adherence to navigational safety standards and operational feasibility.
- (2)
Contact Angle: This parameter defines the inclination between the NaviScreen surface and the oncoming airflow. Altering the contact angle modifies the aerodynamic interactions on the surface of the shield, affecting flow separation and overall aerodynamic resistance. Models with varying inclination angles were developed to identify nonlinear trends in drag reduction.
- (3)
Bottom Height: The height of the lower edge of the NaviScreen above the deck influences both the available workspace and the wind deflection path. Adjusting this dimension changes the flow pattern around the bow’s lower section, thereby aiding drag management without reducing operational space.
- (4)
Position of Horn (Protrusion Element): A horn-shaped protrusion was installed at the upper center of the NaviScreen. Its placement is a crucial design parameter that directs airflow over the top of the shield. Changes in this position affect turbulence and recirculation zones, which are closely linked to drag characteristics.
- (5)
Shape Type: In addition to the standard sloped design, alternative geometries such as cylindrical and spherical configurations were incorporated to investigate different aerodynamic responses. These shapes differ in curvature and frontal area, significantly impacting pressure drag.
In total, 20 NaviScreen models were created based on combinations of these variables. Additionally, five side NaviScreen configurations were developed to examine crossflow conditions and their effect on total resistance. These models were evaluated using steady-state RANS-based CFD simulations, and their performances were assessed based on resistance reduction rates under constant inflow conditions. The comprehensive modeling approach enables a multivariable optimization study and serves as the foundation for evaluating the aerodynamic viability of NaviScreen installations on MPVs. This configuration facilitates the subsequent evaluation of resistance reduction effectiveness across diverse operating environments and design parameters. To identify the optimal NaviScreen setup for installation on the bow of an MPV, a comprehensive CFD-based aerodynamic analysis was conducted under varying design conditions.
3.3. CFD Results and Optimization
To determine the optimal NaviScreen configuration for application on the bow of an MPV, a comprehensive CFD-based aerodynamic analysis was performed under varying design conditions.
The simulation process was divided into three stages, methodically adjusting key geometric factors: contact angle, bottom height, and horn position. The findings revealed that aerodynamic performance, specifically air resistance reduction, was highly responsive to these variables. Among the 20 modeled configurations, Type-15 emerged as the most effective design, achieving a 17.1% decrease in aerodynamic resistance compared to the baseline model, as presented in
Table 7. This optimal configuration featured a 35° bow angle, a bottom height of 2041 mm, and a horn position at 5338 mm. Additionally, two other configurations—Type-19 and Type-20—demonstrated strong performance, with drag reductions of 17.0%, confirming the efficacy of the sloped design type in mitigating aerodynamic forces. Specifically, Type-19 incorporated a steeper bow angle (50°) and a lower horn position, while Type-20 maintained the same contact angle and horn placement as Type-15 but with a reduced bottom height (1200 mm), as detailed in
Table 9.
These results highlight the significance of synergistic parameter optimization in achieving optimal performance. Theoretical interpretation of the CFD results suggests that changes in contact angle induce alterations in flow separation behavior and stagnation pressure distribution on the shield surface. Nonetheless, the trend in drag reduction did not exhibit a strictly linear relationship with contact angle, indicating shape-dependent thresholds where flow attachment and detachment dictate the aerodynamic response. Similarly, bottom height had a minimal effect on aerodynamic performance unless set to extreme values, whereas horn position markedly influenced flow redirection and turbulence intensity near the shield’s upper edge. Parametric optimization revealed that the optimal aerodynamic benefit is achieved by combining a moderate contact angle with strategically positioned flow-directing elements, such as the horn. These results affirm that advanced CFD simulations are indispensable for the structural–aerodynamic integration of NaviScreen systems, ultimately leading to reduced resistance, fuel savings, and enhanced environmental efficiency in MPV operations.
3.4. Evaluation Under Operational Wind Conditions
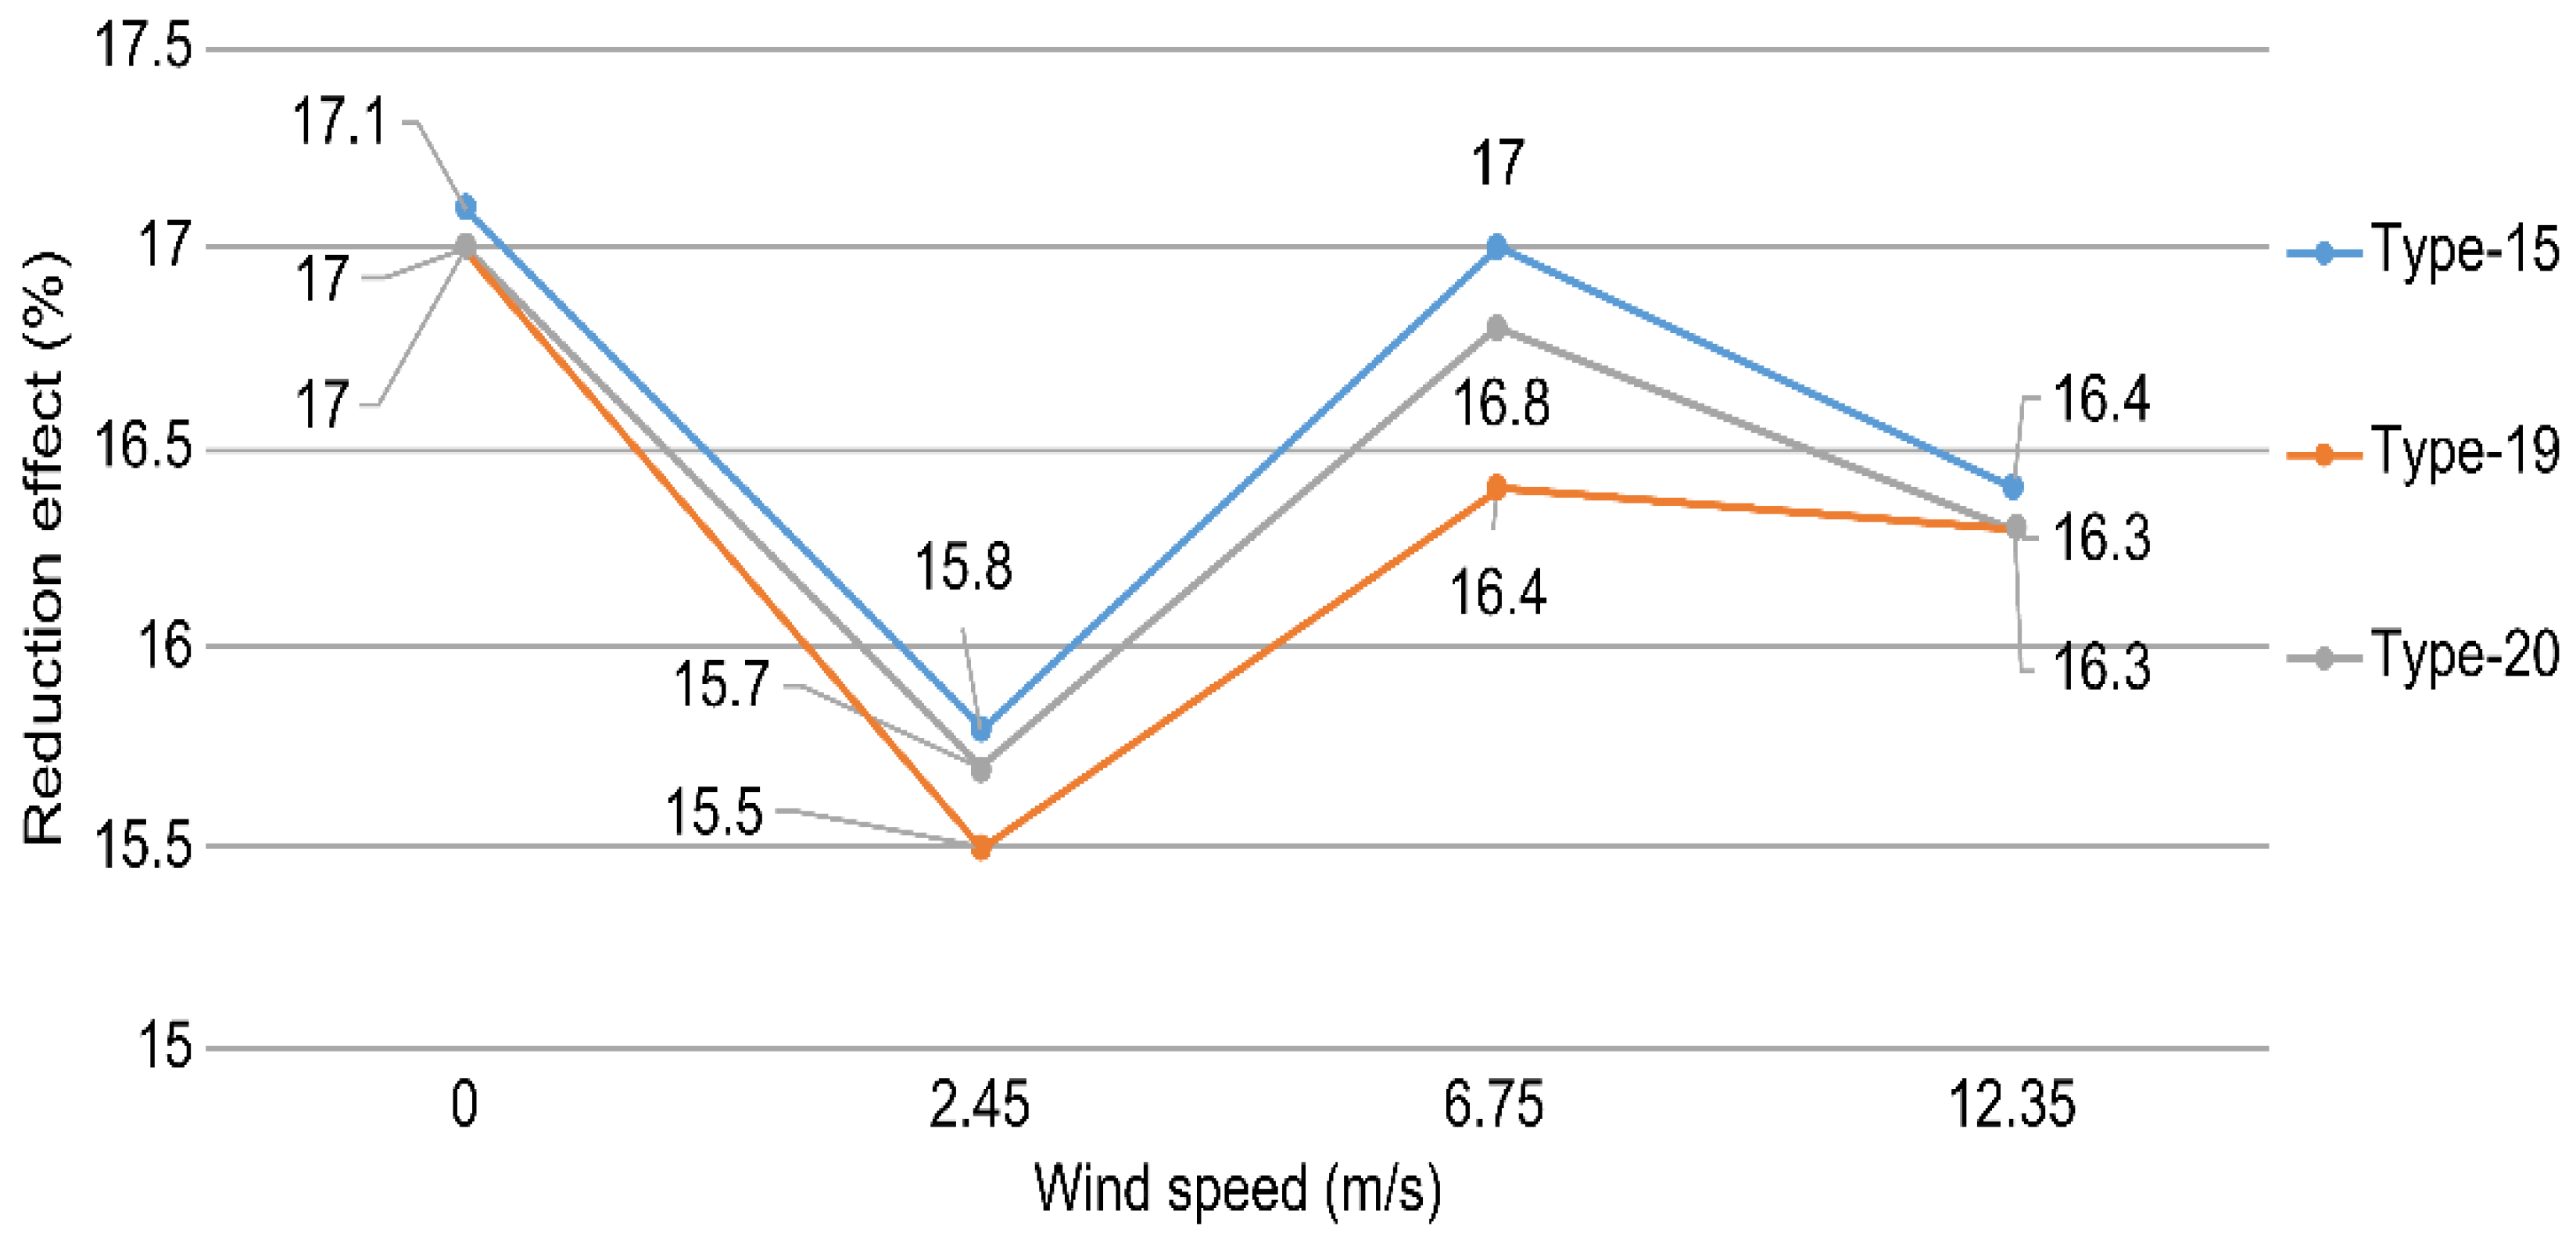
To assess the aerodynamic performance of the proposed NaviScreen configurations under realistic marine environmental conditions, additional CFD simulations were conducted to incorporate variations in wind speed and direction. The analysis concentrated on the three most aerodynamically efficient models—Type-15, Type-19, and Type-20—previously identified through shape optimization studies. Wind speed scenarios were categorized based on the Beaufort scale, spanning from calm (BF.0) to strong breeze (BF.6), as presented in
Table 10. The simulation results revealed that while the percentage reduction in air resistance remained relatively consistent across wind speeds, the absolute amount of reduced aerodynamic force increased substantially at higher wind speeds due to the nonlinear relationship between drag force and velocity.
Table 11 and
Figure 7 show that the baseline vessel experiences an aerodynamic resistance of 22,210 N at Beaufort 6. The optimized Type-15 configuration decreases this resistance to 18,561 N, achieving a 16.4% reduction. Preliminary CFD results reveal that the optimal 35° bow angle and elevated horn position work together to streamline the incoming airflow, reducing stagnation pressure at the leading edge and suppressing flow separation. As noted in the manuscript, the sloped windshield geometry channels the incoming wind smoothly over the upper structure, preventing excessive turbulence and flow separation, while the guiding horn positioned 3.2~5.3 m above deck promotes flow attachment and minimizes the formation of recirculating wakes. This synergy decreases the size of the high-pressure stagnation zone and the low-pressure wake, thereby lowering pressure drag and improving stability in both head-on and oblique winds. To make these mechanisms explicit, we will include additional visualizations of the velocity vectors and pressure contours around the Type-15 configuration. These will show how the smooth 35° slope of the shield allows the flow to reattach along the top surface and how the horn prevents premature flow detachment. We will also discuss how varying each geometric variable—contact angle, lower-edge height, and horn position—modifies the flow. For example, reducing the contact angle to 35° maximizes drag reduction by directing the flow upward and over the structure; increasing the bottom height within 1.2~2.0 m ensures the shield intercepts the highest-velocity portion of the wind without obstructing visibility; and elevating the horn to around 5.3 m further suppresses vortex shedding in the wake.
Similarly, Types 19 and 20 realize reductions of 16.3%, confirming that all three shield geometries effectively mitigate drag as wind speed increases. The alignment between the numerical data in
Table 11 and the trends in
Figure 7 highlights the robustness of the optimized designs under varying dynamic-pressure conditions.
Regarding overall vessel performance,
Table 12 details the total hydrodynamic and aerodynamic resistance for each scenario. Although the aerodynamic component accounts for a minor portion of the total resistance at low wind speeds (a 0.4% reduction at BF.0), its impact grows significantly under higher wind loads, resulting in a 2.9% reduction in total resistance at BF.6 with Type-15. This finding underscores the operational relevance of aerodynamic optimization for MPVs, especially in wind-dominant sea states.
Figure 8 depicts the angular conditions applied during the final stage of aerodynamic performance validation for the optimized NaviScreen model (Type-15). The simulation utilized a fixed wind speed (Beaufort scale 6, 12.35 m/s) and systematically varied the incident wind angle relative to the ship’s heading at 0°, 15°, 30°, and 45°.
According to Nguyen [
16], ships encounter maximum aerodynamic drag within the 30° oblique wind range. This experimental setup was designed to capture the complete spectrum of aerodynamic responses under realistic environmental conditions, particularly focusing on head and quartering winds commonly experienced during navigation.
The results, presented in
Table 13 and
Table 14, offer a comprehensive overview of the aerodynamic and total resistance behavior of the vessel with and without the implementation of the NaviScreen.
Table 13 specifically analyzes aerodynamic resistance (RT_A), isolating the air resistance component due to wind at various angles. The findings confirm that, in the absence of a NaviScreen, air resistance increases markedly with oblique wind angles, reaching a peak of 62.72 N at 45°. Conversely, the Type-15 NaviScreen exhibited a significant mitigation effect, especially at 30°, where aerodynamic resistance decreased from 60.34 N (Base) to 45.54 N—a 24.5% reduction. This suggests that the optimized geometry of the shield enhances airflow redirection and diffusion at critical flow incidence angles. Overall, the shield consistently diminished aerodynamic drag across all tested angles, substantiating its multidirectional effectiveness.
In contrast,
Table 14 provides a comprehensive assessment of total ship resistance (RT), encompassing both hydrodynamic and aerodynamic elements. Although the percentage reduction in total resistance is lower than that of air resistance due to the dominant role of hydrodynamic drag, the trend aligns with that of
Table 13. The highest total resistance reduction (8.9%) occurs at a 30° wind direction, matching the peak decrease in air resistance. This underscores the compounded benefit of minimizing air resistance on overall ship efficiency, especially under conditions where aerodynamic drag constitutes a larger proportion of total resistance. The primary distinction between
Table 13 and
Table 14 lies in the scope of resistance evaluated:
Table 13 isolates aerodynamic effects, whereas
Table 14 contextualizes them within the total operational resistance framework. The theoretical significance of these results resides in the interplay between the angle of attack and boundary layer behavior around the shield. At 30°, the shield facilitates favorable pressure recovery and delays flow separation, resulting in the lowest drag coefficients. These findings emphasize the importance of shape-tailored passive devices in mitigating wind loads, particularly when the ship encounters quartering winds, which are most aerodynamically disruptive.
Collectively, this analysis confirms that NaviScreens not only reduce aerodynamic resistance but also significantly contribute to total resistance reduction. The effectiveness of the shield increases under certain angular exposures, making it a valuable design enhancement for ships operating in high-wind maritime environments. The validated performance at 30° reveals potential for direction-specific optimization in forthcoming adaptive shield designs.
5. Conclusions and Future Work
This study presents a thorough aerodynamic and structural evaluation of a NaviScreen device designed for MPVs, targeting the reduction of aerodynamic drag and ensuring structural integrity under extreme environmental loads, especially green water pressure. Utilizing high-fidelity CFD and FEA, the research optimizes the geometry of the device, assesses its operational performance, and verifies its structural safety.
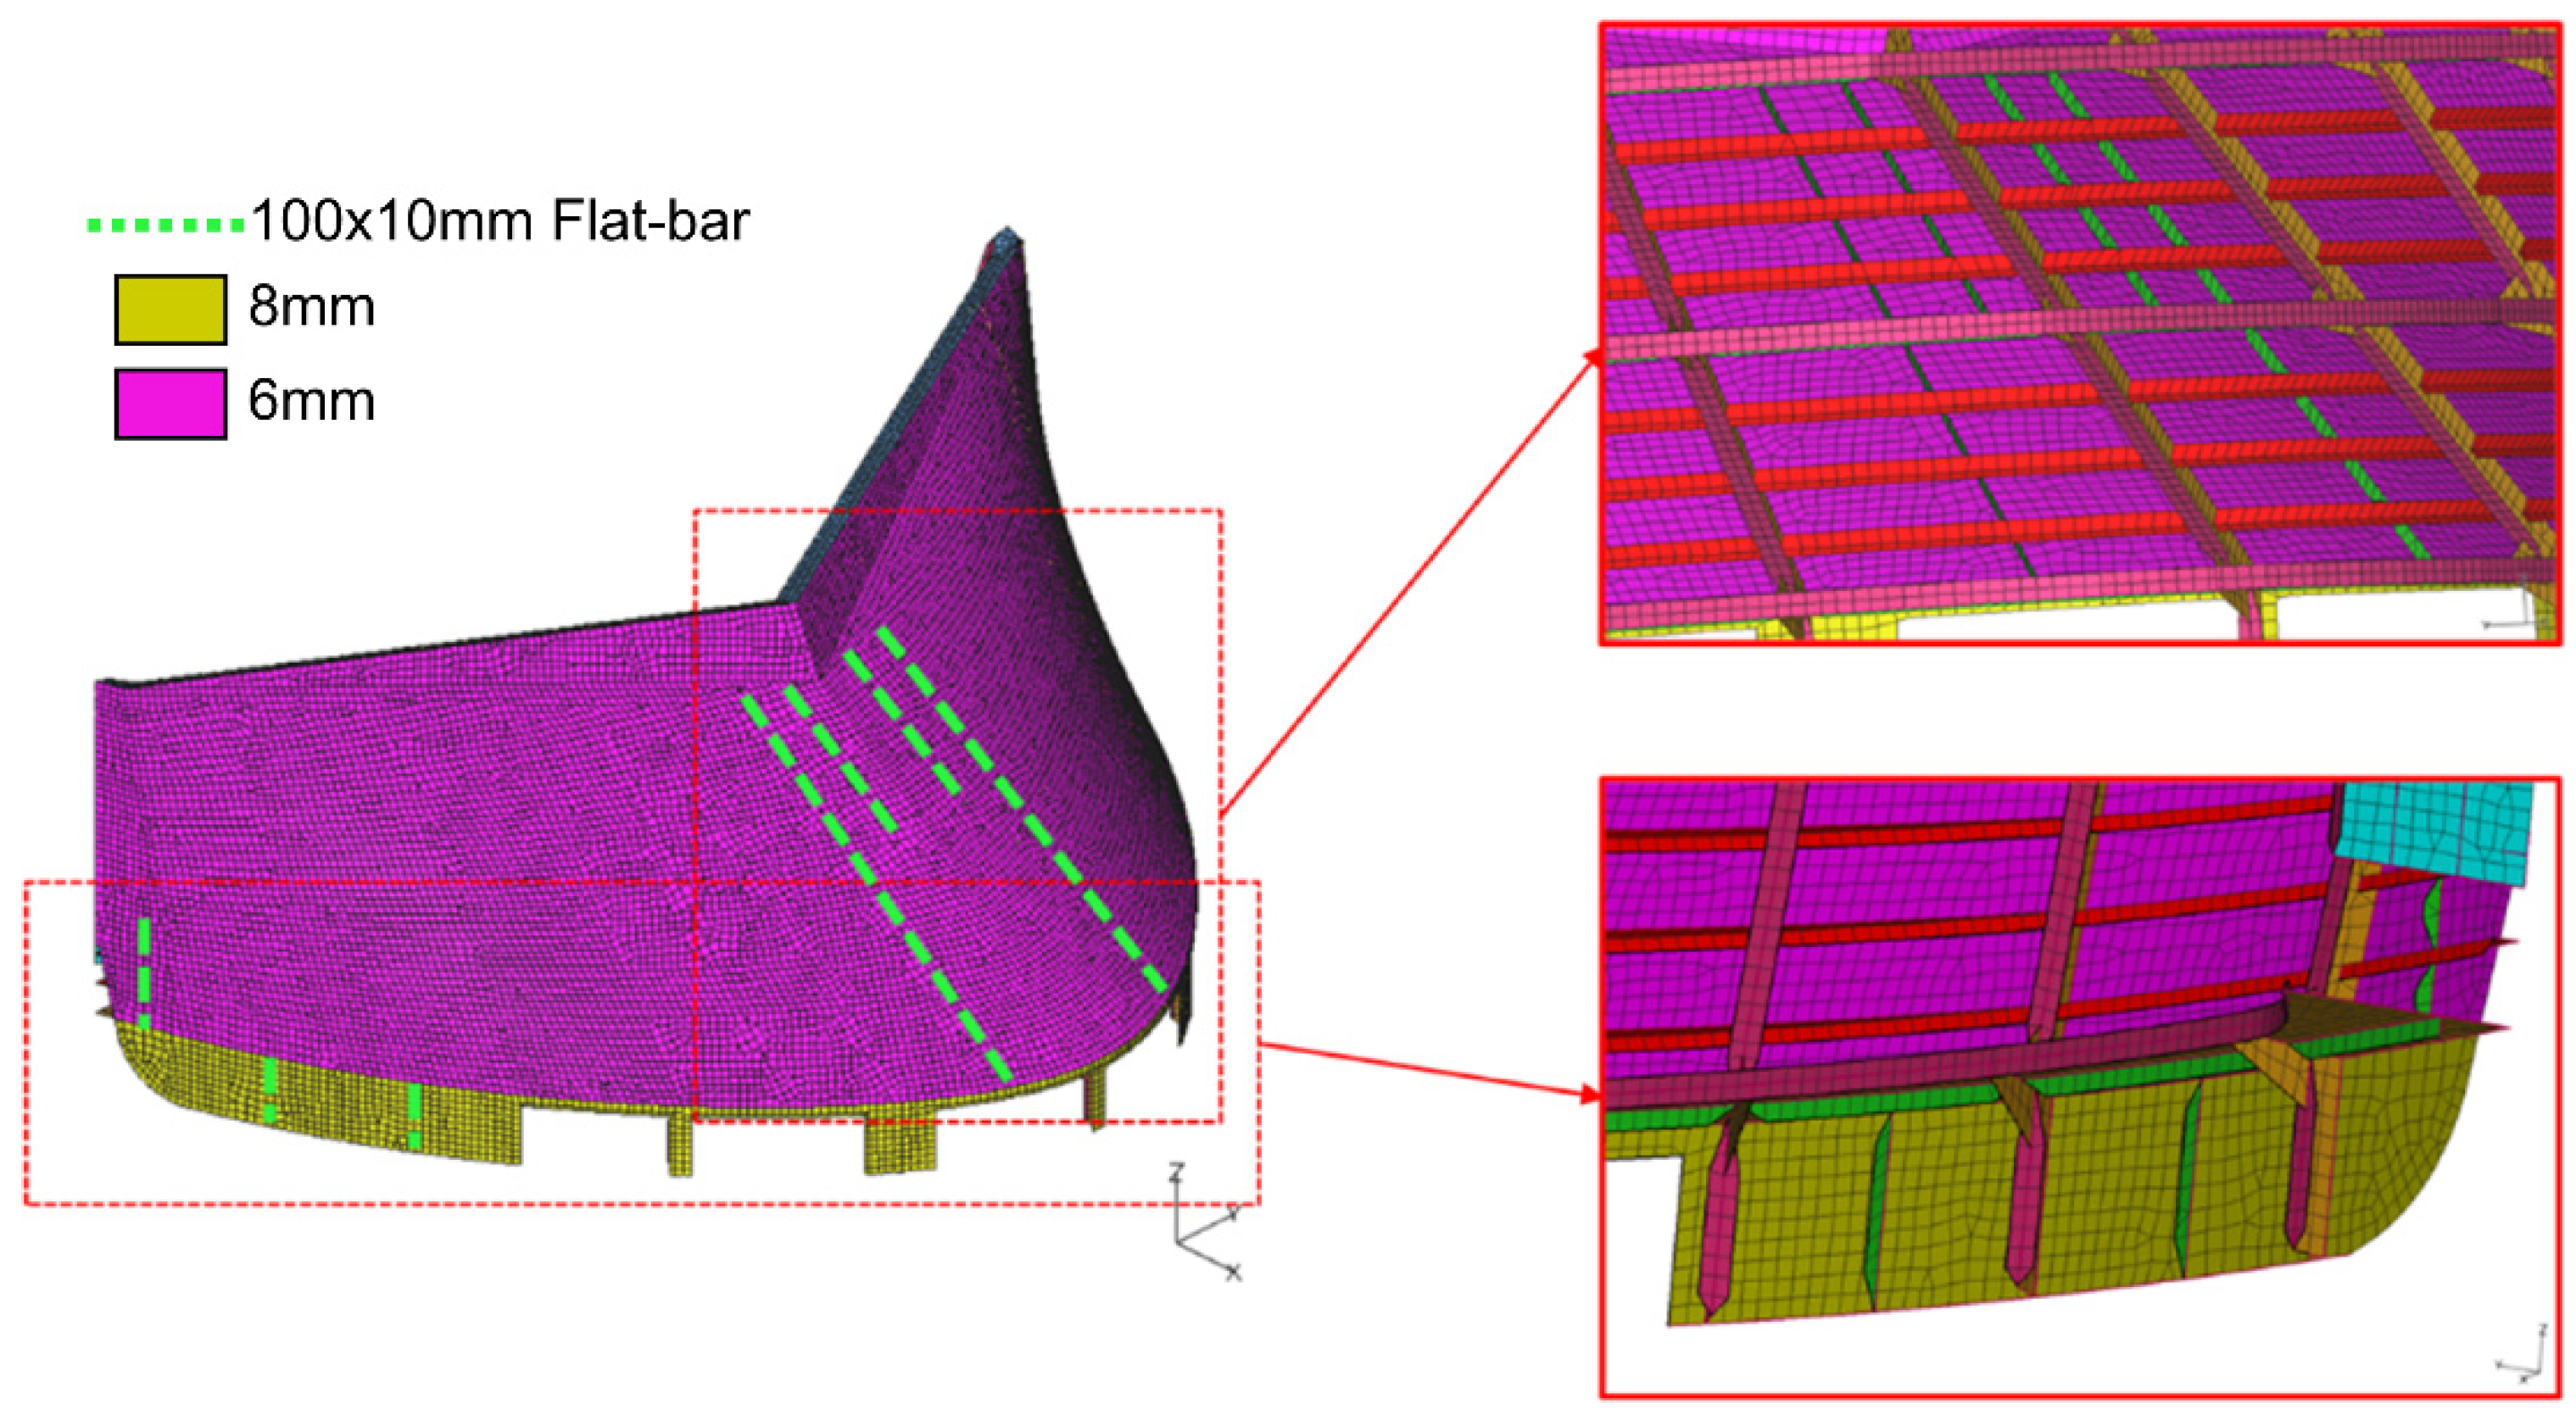
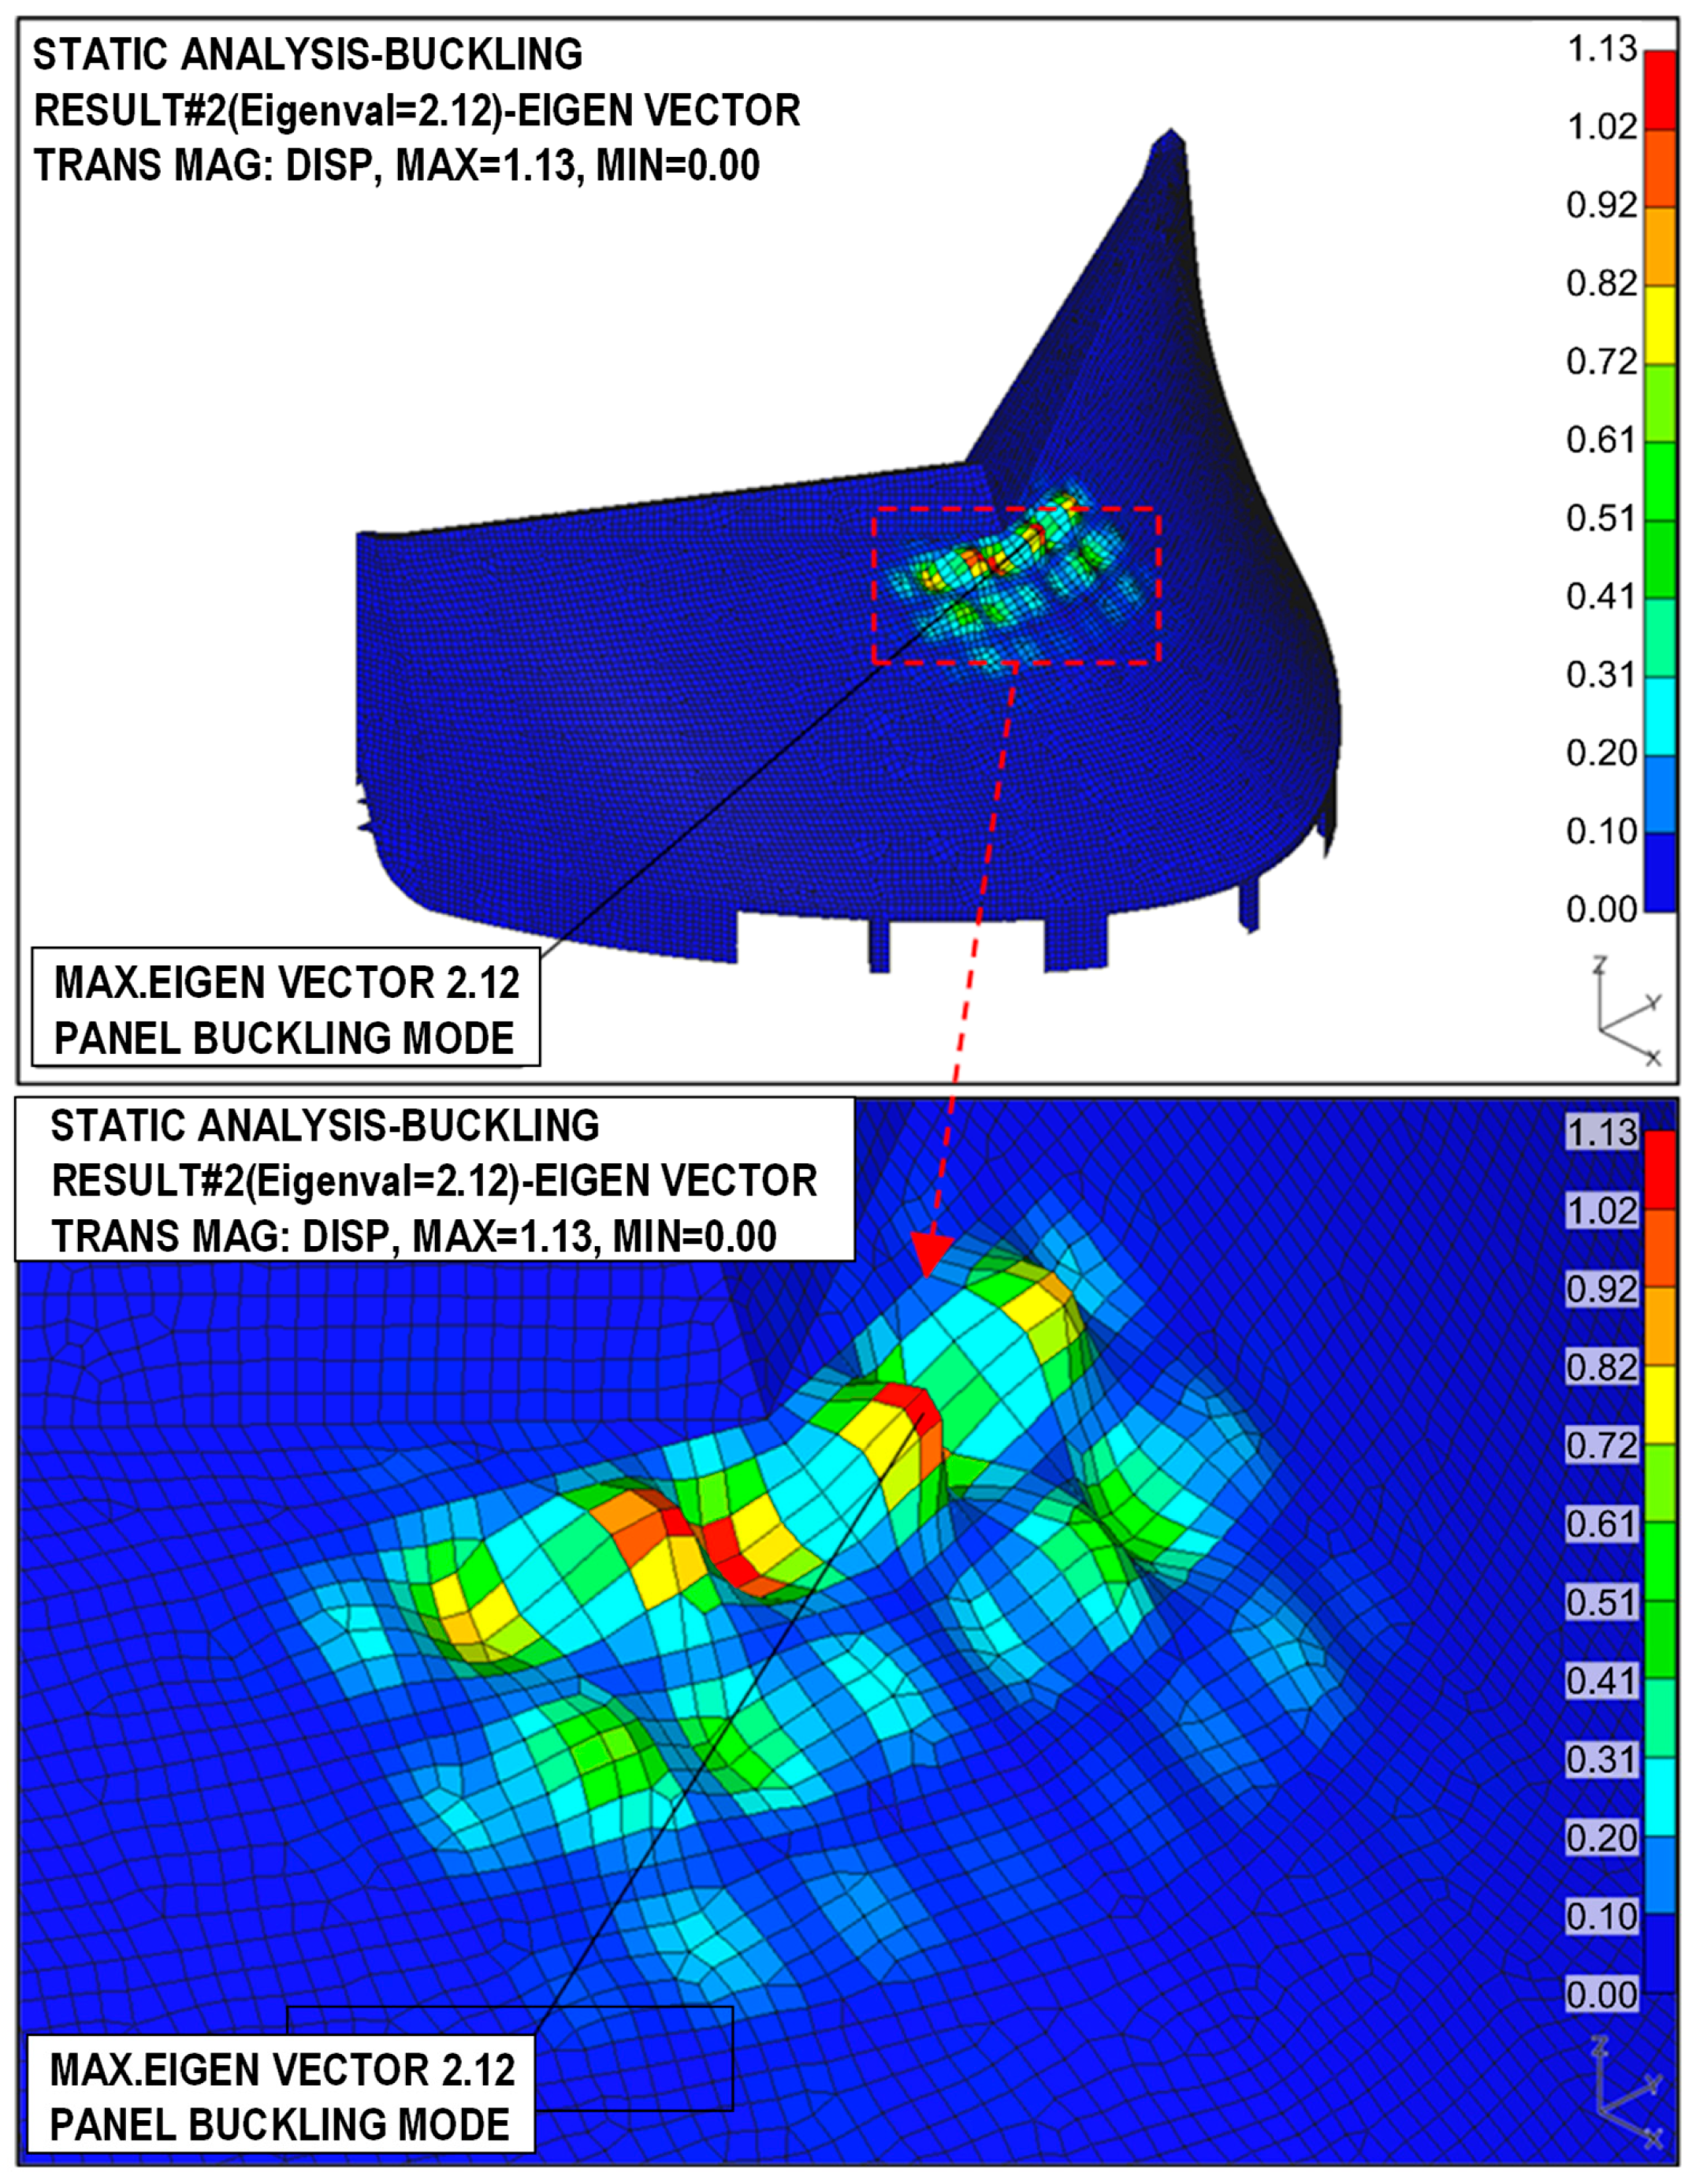
Through CFD-based parametric optimization—varying contact angle, bottom height, and horn position—the NaviScreen configuration designated Type-15 emerged as the optimal design, achieving a maximum aerodynamic resistance reduction of 17.1% under standard headwind conditions. Under Beaufort scale 6 winds, this configuration consistently yielded drag reductions exceeding 16.3%, with total ship resistance decreasing by up to 2.9%, validating the aerodynamic advantages in realistic sea states. Furthermore, under oblique wind conditions (30° incidence), the NaviScreen achieved a 24.5% reduction in air resistance and an 8.9% decrease in total resistance, highlighting its superior performance in quartering wind scenarios. Simultaneously, the structural performance of the NaviScreen was assessed under green water pressure using nonlinear FEA. The initial design was prone to local buckling under vertical compressive loads. To mitigate this, targeted reinforcements were added, including carling stiffeners and increased plate thickness.
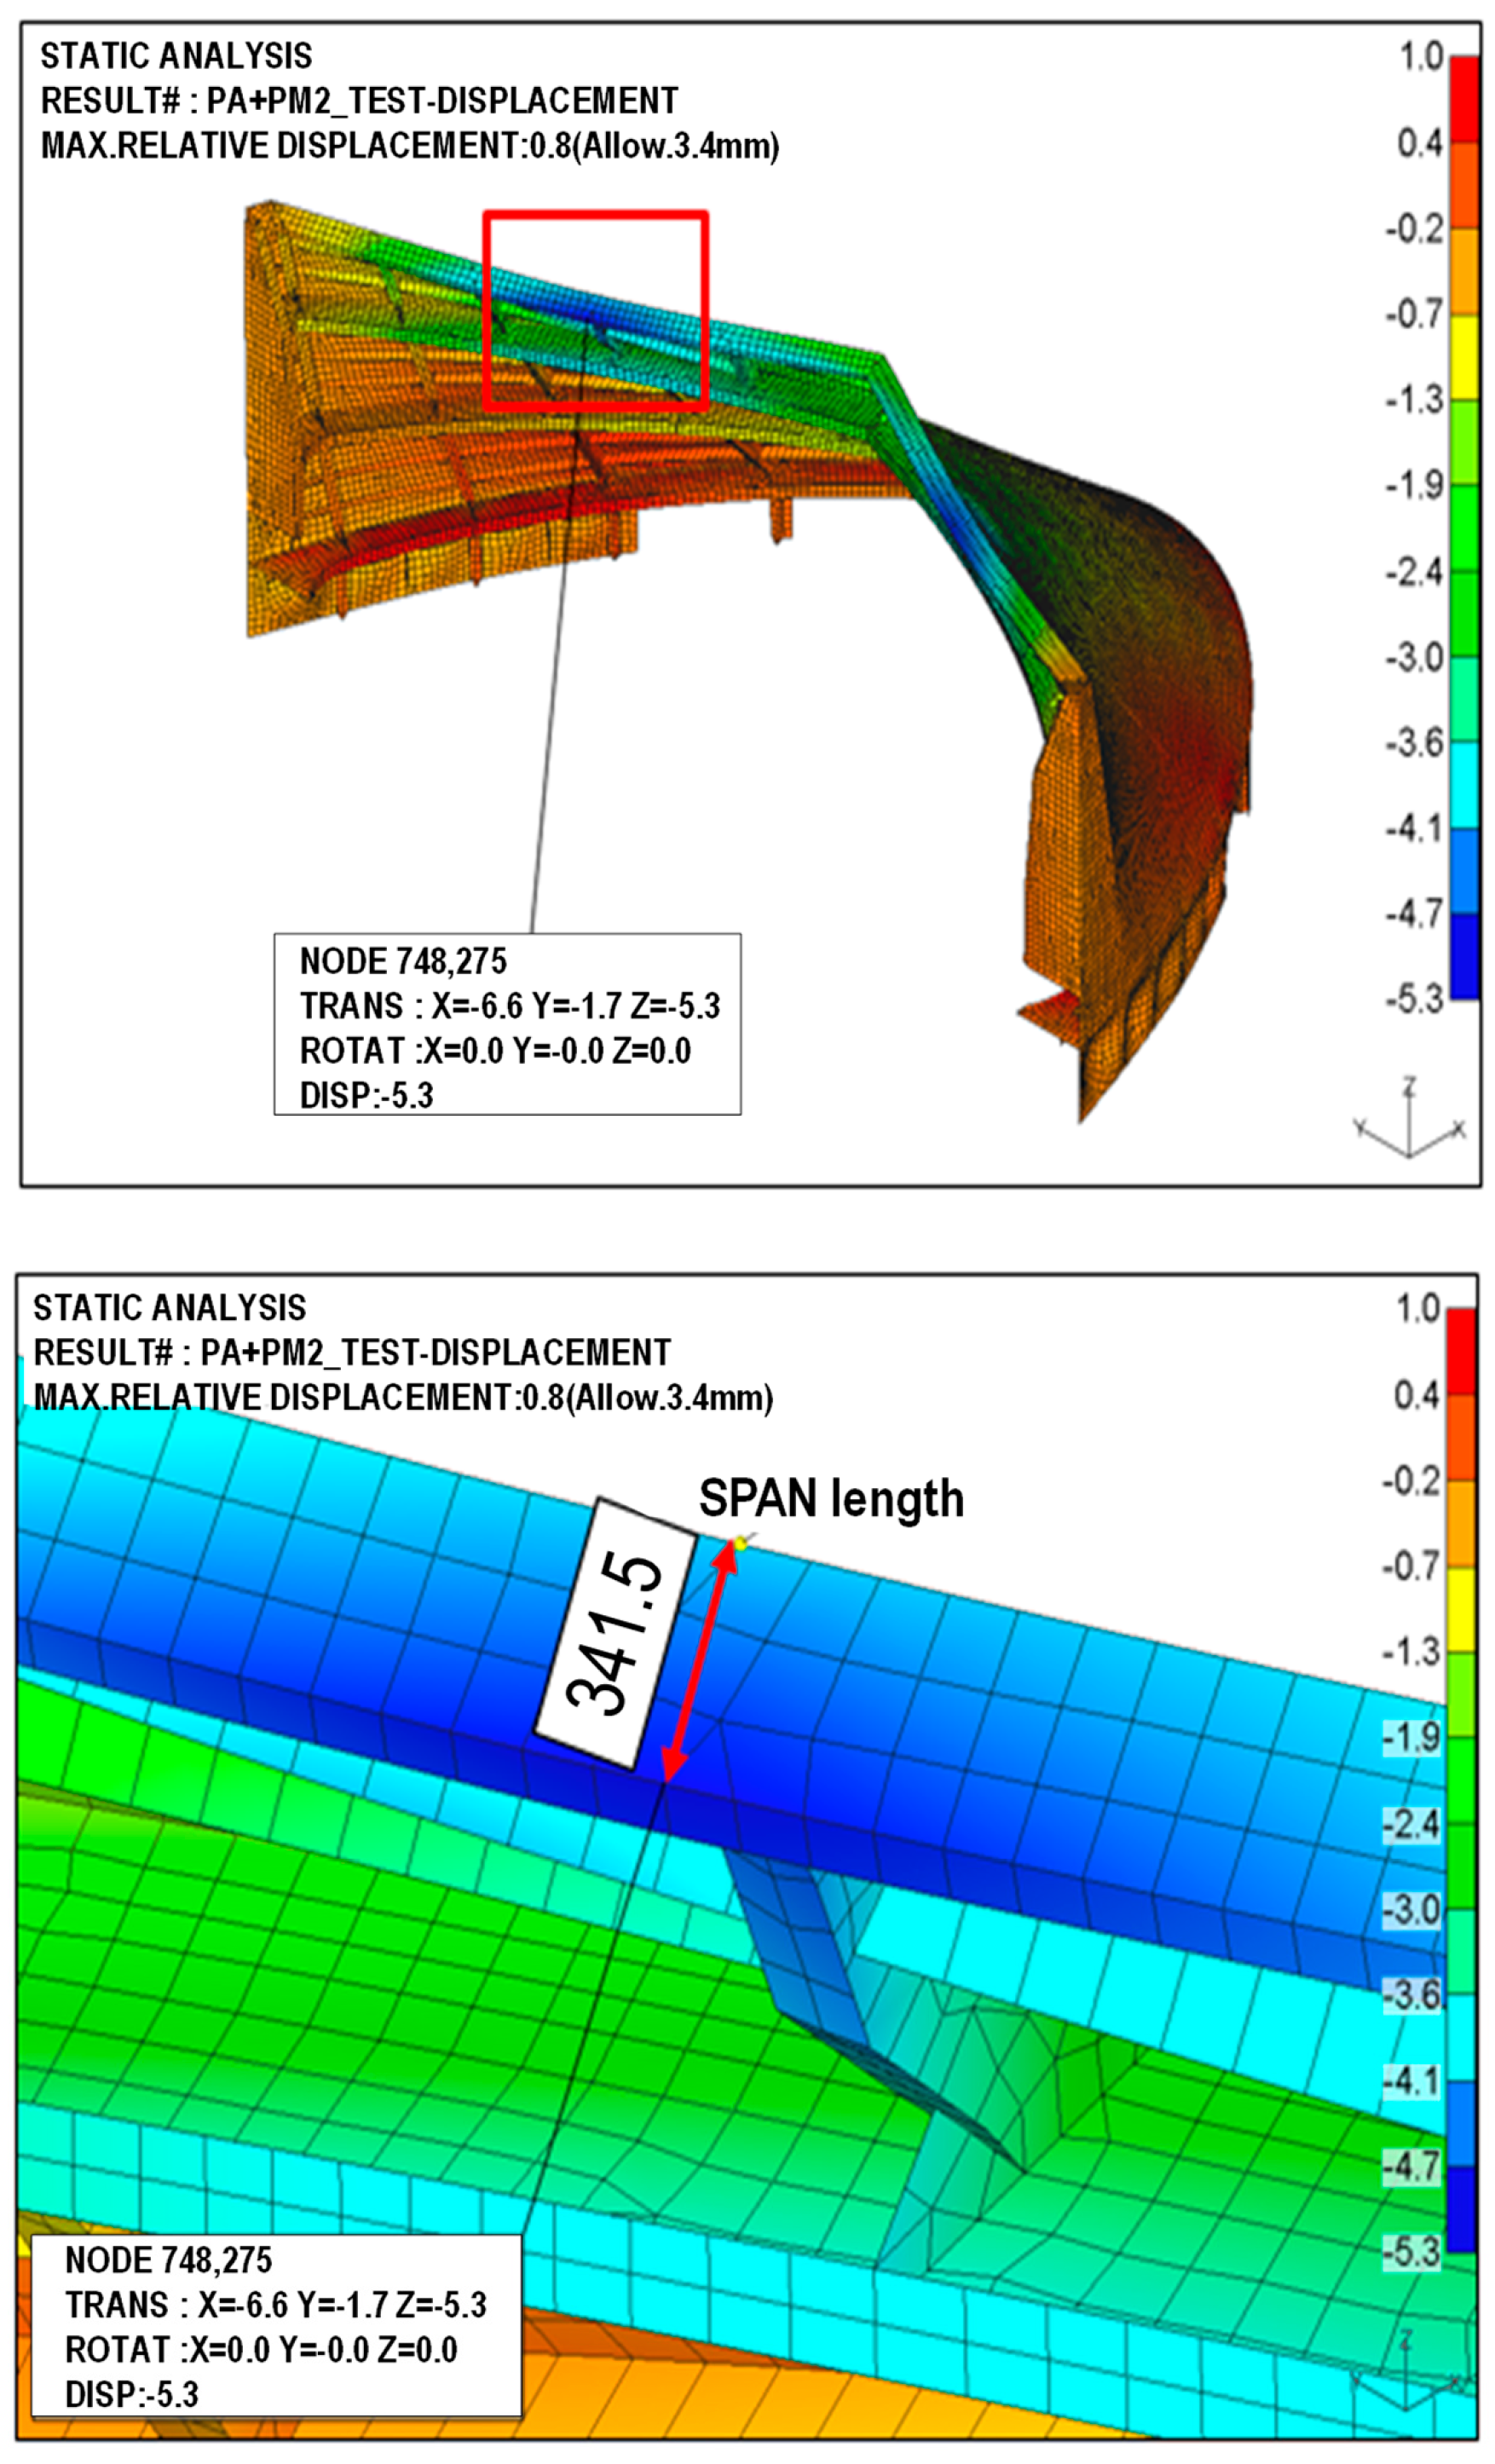
Post-reinforcement analysis confirmed that the structure satisfied critical safety criteria defined by ABS (buckling factor > 1.0), KR (yield strength limits), and NORSOK (displacement within L/100), ensuring operational resilience and serviceability. In summary, the following key conclusions are drawn:
Aerodynamic Performance: The sloped NaviScreen design featuring a 35° bow angle and optimized horn placement (Type-15) achieved the most significant reduction in aerodynamic drag under both head-on and oblique wind conditions.
Operational Effectiveness: The NaviScreen consistently performed across diverse wind speeds and directions, offering practical advantages in real-world marine settings by decreasing overall hull resistance and thus enhancing fuel efficiency.
Structural Reinforcement: The addition of carling stiffeners and increased plate thickness improved structural integrity, reduced localized buckling, and ensured adherence to classification society safety standards under green water loading.
Design Validation: The combination of CFD and FEA methodologies establishes a validated workflow for the safe and efficient implementation of NaviScreens on MPVs, with scalability potential for other vessel types.
Building on the current study, future research should integrate advanced computational and experimental techniques to further optimize NaviScreen designs and enhance their applicability across diverse maritime conditions.
AI-Driven Design Optimization: Leverage machine learning (ML) and deep learning algorithms, such as generative adversarial networks (GANs) or reinforcement learning, to automate the exploration of optimal NaviScreen geometries. These methods can rapidly evaluate thousands of design variants, identifying configurations that maximize aerodynamic efficiency while minimizing structural weight. Implement surrogate modeling techniques (e.g., Gaussian processes or neural networks) to reduce computational costs associated with high-fidelity CFD-FEA simulations, enabling real-time design adjustments.
Digital Twin Technology: Develop a digital twin of the NaviScreen-equipped vessel to monitor performance in real-world conditions. IoT sensors and edge computing can provide live data on wind loads, structural stresses, and fuel efficiency, enabling adaptive control systems to dynamically adjust the NaviScreen’s orientation or retractability based on environmental feedback.
Advanced Materials and Additive Manufacturing: Investigate lightweight composite materials (e.g., carbon fiber-reinforced polymers or graphene-enhanced alloys) to improve strength-to-weight ratios and corrosion resistance. Utilize 3D printing for prototyping and production, allowing complex, topology-optimized designs that are impractical with traditional manufacturing.
Hybrid Renewable Integration: Explore synergies between NaviScreens and onboard renewable energy systems, such as integrating photovoltaic coatings or vertical-axis wind turbines into the shield structure to further reduce GHG emissions.
Autonomous and Adaptive Systems: Incorporate shape-memory alloys or morphing structures to enable adaptive NaviScreens that dynamically alter their geometry in response to wind direction and speed, optimizing performance across varying operational scenarios.
Extended Environmental and Operational Validation: Conduct scaled experiments in wind–wave basins equipped with particle image velocimetry (PIV) and pressure-sensitive paint (PSP) to validate CFD predictions under combined aerodynamic and hydrodynamic loads. Expand fatigue and vibration analyses using nonlinear FEA coupled with machine learning to predict long-term degradation under cyclic loading.
Regulatory and Scalability Frameworks: Collaborate with classification societies to establish standardized testing protocols for aerodynamic devices, ensuring compliance with evolving IMO regulations. Extend the methodology to other vessel classes (e.g., bulk carriers or LNG tankers) by developing modular, scalable NaviScreen designs tailored to distinct superstructure profiles.
By integrating these cutting-edge technologies, future work can transform NaviScreens into intelligent, multifunctional systems that not only reduce drag but also contribute to the broader decarbonization and digitalization goals of the maritime industry. This work distinguishes itself from existing container-ship studies by demonstrating a holistic design framework for MPVs that balances aerodynamic drag reduction and structural safety. While previous research achieved moderate drag reductions on large container ships through CFD analysis alone, we have shown that integrating high-fidelity CFD with nonlinear FEA enables the NaviScreen to reduce aerodynamic resistance by up to 24.5% under quartering winds while remaining resilient to green-water pressures thanks to carling stiffeners and optimized plate thicknesses. These innovations make the NaviScreen a scalable solution aligned with IMO-2050 decarbonization goals.
