1. Introduction
Urban estuarine systems, serving as dynamic interfaces between terrestrial freshwater sources and marine ecosystems, have increasingly become focal points for environmental monitoring due to their ecological significance and vulnerability to anthropogenic pressures [
1,
2,
3]. These zones exhibit complex hydrodynamic interactions driven by tidal oscillations, urban runoff, and sediment transport processes, all of which influence the transport, dilution, and fate of waterborne contaminants. With the rapid urbanization of coastal cities such as Tokyo, estuarine environments are now under considerable stress from combined sewer overflows (CSOs) as well as municipal and industrial discharges. Such overflows, triggered by intense rainfall, channel untreated sewage and stormwater directly into urban waterways, posing a significant risk to water quality and public health [
4,
5].
Sumida River estuary, an enclosed coastal region fringed by dense urban development, exemplifies the challenges faced in managing microbial water quality in a modern metropolis. The region is serviced by a combined sewer system where excess sewage is overflowed into adjacent rivers and canals during precipitation events. These discharges introduce a considerable microbial load into surface waters, particularly fecal indicator bacteria such as
Escherichia coli (
E. coli), which are used globally to monitor the presence of pathogenic organisms [
6,
7]. The microbial degradation of water quality poses both ecological risks to aquatic life and health risks to human users, particularly in areas with high recreational or aesthetic use—often termed amenity water fronts.
Historically, microbial monitoring strategies have focused on surface water sampling, predicated on the assumption that pathogenic contamination is largely restricted to upper layers due to vertical stratification caused by tidal advection or photoinactivation in sunlit zones [
8,
9]. Although rare, some studies have investigated the spatial and vertical distribution of microbial communities—for example, a study conducted such a monitoring scheme in the northern South China Sea [
10]. However, these studies remain limited, largely due to the logistical challenges and labor-intensive nature of multi-depth sampling. Modeling efforts are even more limited.
To address these constraints, alternative approaches have emerged. Autonomous profiling platforms—such as rosette samplers on Conductivity-Temperature-Depth (CTD) profilers, Slocum gliders, and drifting Lagrangian sensor arrays—allow for repeated vertical measurements across tidal cycles without continuous ship presence. High-frequency in situ fluorometric sensors can also be coupled with microbial source tracking assays to infer contamination events in near-real time. In the modeling domain, hydrodynamic–biogeochemical coupling and machine learning algorithms have been applied to predict microbial transport and persistence based on environmental drivers such as salinity, turbidity, and current velocity. Yet, as highlighted by a comprehensive review, predictive accuracy remains hindered by the absence of systematic monitoring programs and the scarcity of reliable data on
E. coli concentrations in riverine and estuarine inputs [
11].
Several recent studies have demonstrated the utility of advanced tools and modeling techniques in estuarine and coastal water quality monitoring. A Bayesian network model was used to forecast enterococci concentrations in Sydney estuaries for bathing water safety predictions [
12]. Lagrangian drift simulations were applied to generate salinity gradient maps and track river plumes in coastal areas of Germany [
13]. Similarly, drifting Lagrangian sensors were used to monitor turbidity, pH, and dissolved oxygen in rivers across New Mexico [
14].
Slocum gliders have also been deployed to assess hydrodynamic and water quality patterns in estuarine environments. One study characterized chlorophyll gradients, thermoclines, and stratification at the Niagara River mouth [
15], while another evaluated spatial variability in temperature, salinity, and dissolved oxygen across a 15 km stretch of bays in Nova Scotia, Canada [
16].
Despite these technological advancements, their application in microbial water quality monitoring—particularly for E. coli—remains limited. This is primarily due to constraints in integrating microbial sampling tools with autonomous platforms, the lack of real-time biosensors, and the reliance on labor-intensive, lab-based analyses.
Despite the aforementioned assumptions, recent evidence suggests that microbial pollutants can exhibit significant vertical variability, influenced by interactions between runoff density, tidal mixing, salinity stratification, and sediment resuspension [
17,
18]. Studies conducted in estuarine systems across Europe and North America have demonstrated that under certain hydrodynamic conditions,
E. coli can persist in subsurface layers for extended periods, especially when embedded in stratified water columns or associated with particulate matter [
19,
20].
Despite these advancements, the literature remains sparse with respect to vertical profiling of microbial contamination in Asian megacities, particularly in relation to varying rainfall intensities and tidal conditions. In Tokyo, limited efforts have been made to characterize the vertical dispersion of microbial contaminants in response to hydrometeorological triggers such as CSO events. Most existing studies either focus on aggregate pollutant loads or utilize surface-only monitoring protocols [
21,
22,
23,
24]. As such, there is a critical gap in understanding how different rainfall intensities—ranging from short, low-intensity events to prolonged, high-intensity downpours—interact with estuarine hydrodynamics to affect the spatial and vertical distribution of fecal bacteria.
Furthermore, the influence of tidal regimes—including spring and neap tides, and flood and ebb tides—on microbial stratification remains poorly understood. While some studies have hinted at the role of tidal backflows in modulating riverine discharge and contaminant transport [
8], there is little empirical data capturing how these variations affect microbial persistence at different depths. In the Tokyo Port Area, where diurnal tidal ranges and anthropogenic inflows co-exist, these interactions are expected to be particularly complex. For instance, rainfall events that coincide with “flood-high” tides may experience hydraulic impedance, leading to longer residence times and deeper penetration of contaminated plumes. Conversely, “ebb-low” conditions may facilitate rapid flushing, thereby altering the microbial load distribution along both horizontal and vertical dimensions.
To address these gaps, the present study undertakes a comprehensive vertical profiling of E. coli and salinity in the Sumida River estuary following rainfall events with varying intensities. Using a transect spanning 8.5 km located at the upper reach of the Tokyo Port Area—from the confluence of the Kanda River with the Sumida River to the Tokyo Bay Tunnel—this study captures microbial and salinity gradient profiles under different tidal conditions using model simulations. Rainfall events are categorized using cluster analysis based on total precipitation and CSO spatial occurrence patterns. The study specifically contrasts light rainfall events with intense rainfall events, while concurrently evaluating the role of tidal phases in shaping vertical dispersion profiles.
The primary objective of this research is twofold: (1) to evaluate the vertical distribution of E. coli and salinity under varying hydrometeorological scenarios; and (2) to identify how tidal regimes modulate the stratification and persistence of microbial contaminants. Through this dual lens, the study provides empirical insights into estuarine pollution dynamics that have direct implications for public health, urban water management, and future climate adaptation strategies. The novelty of the research lies in its simultaneous consideration of both rainfall intensity and tidal modulation, coupled with vertically resolved measurements—an approach rarely implemented in the densely populated coastal megacity of Tokyo.
2. Materials and Methods
2.1. Study Area and Hydrogeomorphological Context
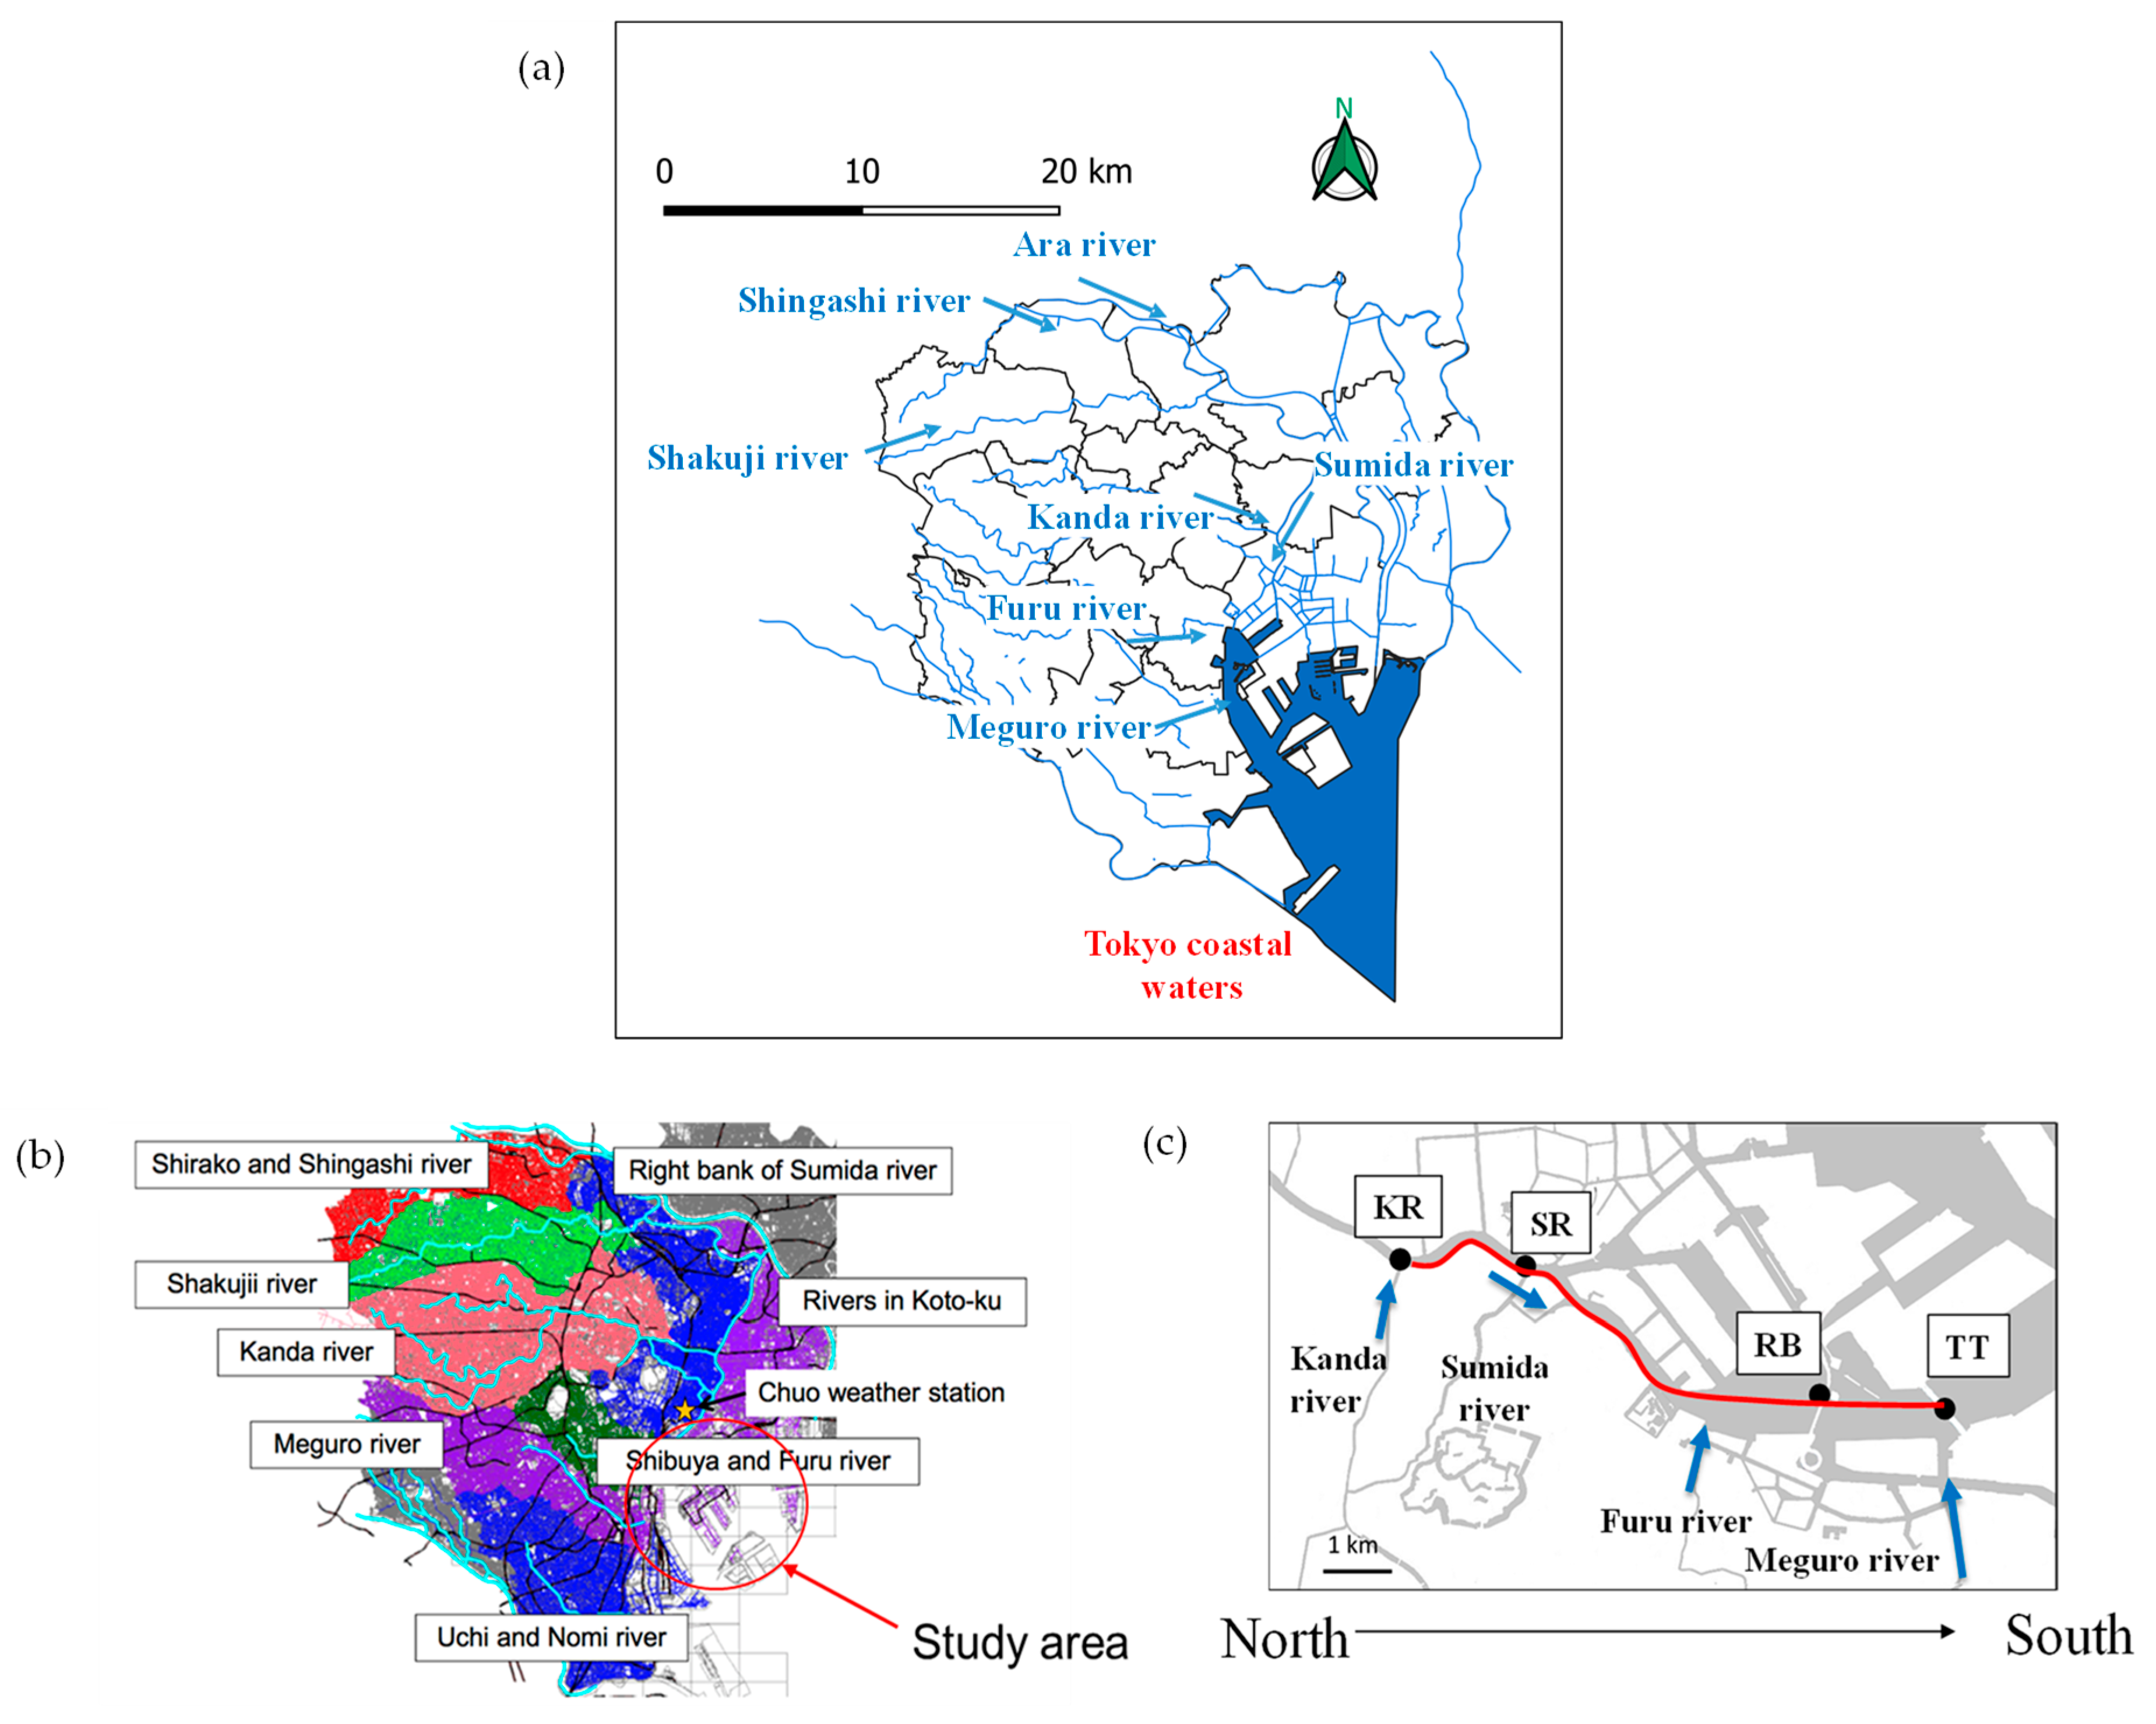
The study was conducted in the lower reaches of the Sumida River estuary in Tokyo, Japan—an urban estuarine system subject to significant anthropogenic influence. As shown in
Figure 1, the Sumida River originates from the Arakawa River system and meanders through the central wards of Tokyo before discharging into Tokyo Bay. The river traverses a highly urbanized landscape characterized by a dense network of sewage infrastructure, impervious surfaces, and numerous stormwater discharge points. The estuarine reach, approximately 8.5 km long, extends from the confluence of the Kanda River (KR) and Sumida River (SR), through the Rainbow Bridge (RB) area, and terminates near the Tokyo Bay Tunnel (TT).
The selected transect includes zones with both upstream and coastal characteristics, enabling spatial comparisons across urban gradients. The lower estuary is also home to multiple amenity water fronts, frequented for recreation and tourism, rendering microbial water quality a critical concern. Hydrologically, this estuary is influenced by semidiurnal tidal cycles with an average range of approximately 2 m. The interplay of tidal backflow, seasonal discharge from tributaries, and episodic inputs from CSOs makes the Sumida River estuary a prime candidate for understanding complex contaminant transport mechanisms [
21,
22,
23,
24].
2.2. Rainfall Event Classification and Cluster Analysis
To classify rainfall events based on their hydrological and pollution potential, rainfall data from 13 rain gauge stations operated by the Tokyo Metropolitan Government (TMG) were collected for the period 2008–2020. These data were aggregated into eight major drainage areas based on station location and corresponding drainage basin size. Each rainfall event was characterized using three parameters: total rainfall (mm), event duration (hr), and average intensity (mm/hr). These parameters were then normalized on a 0–1 scale across the 1003 events to allow consistent comparison and clustering.
While initial clustering considered all three parameters, a previous study [
25] found that classifying events using only total rainfall reduced variability in combined sewer overflow (CSO) volumes within each group, thereby improving group distinctiveness in terms of hydrological response. Based on this finding, only total rainfall was used as the clustering variable.
Ward’s hierarchical clustering method was applied. This method minimizes within-cluster variance, resulting in six distinct rainfall groups (G1 to G6). G2 represents light, short-duration events (e.g., 15 mm over 13 h), while G6 comprises intense, long-duration storms (e.g., 272 mm over 34 h). These two contrasting event types were selected for detailed vertical profiling to represent typical “light” and “intense” rainfall categories, respectively.
2.3. The 3D-Hydrodynamics and Water Quality Model
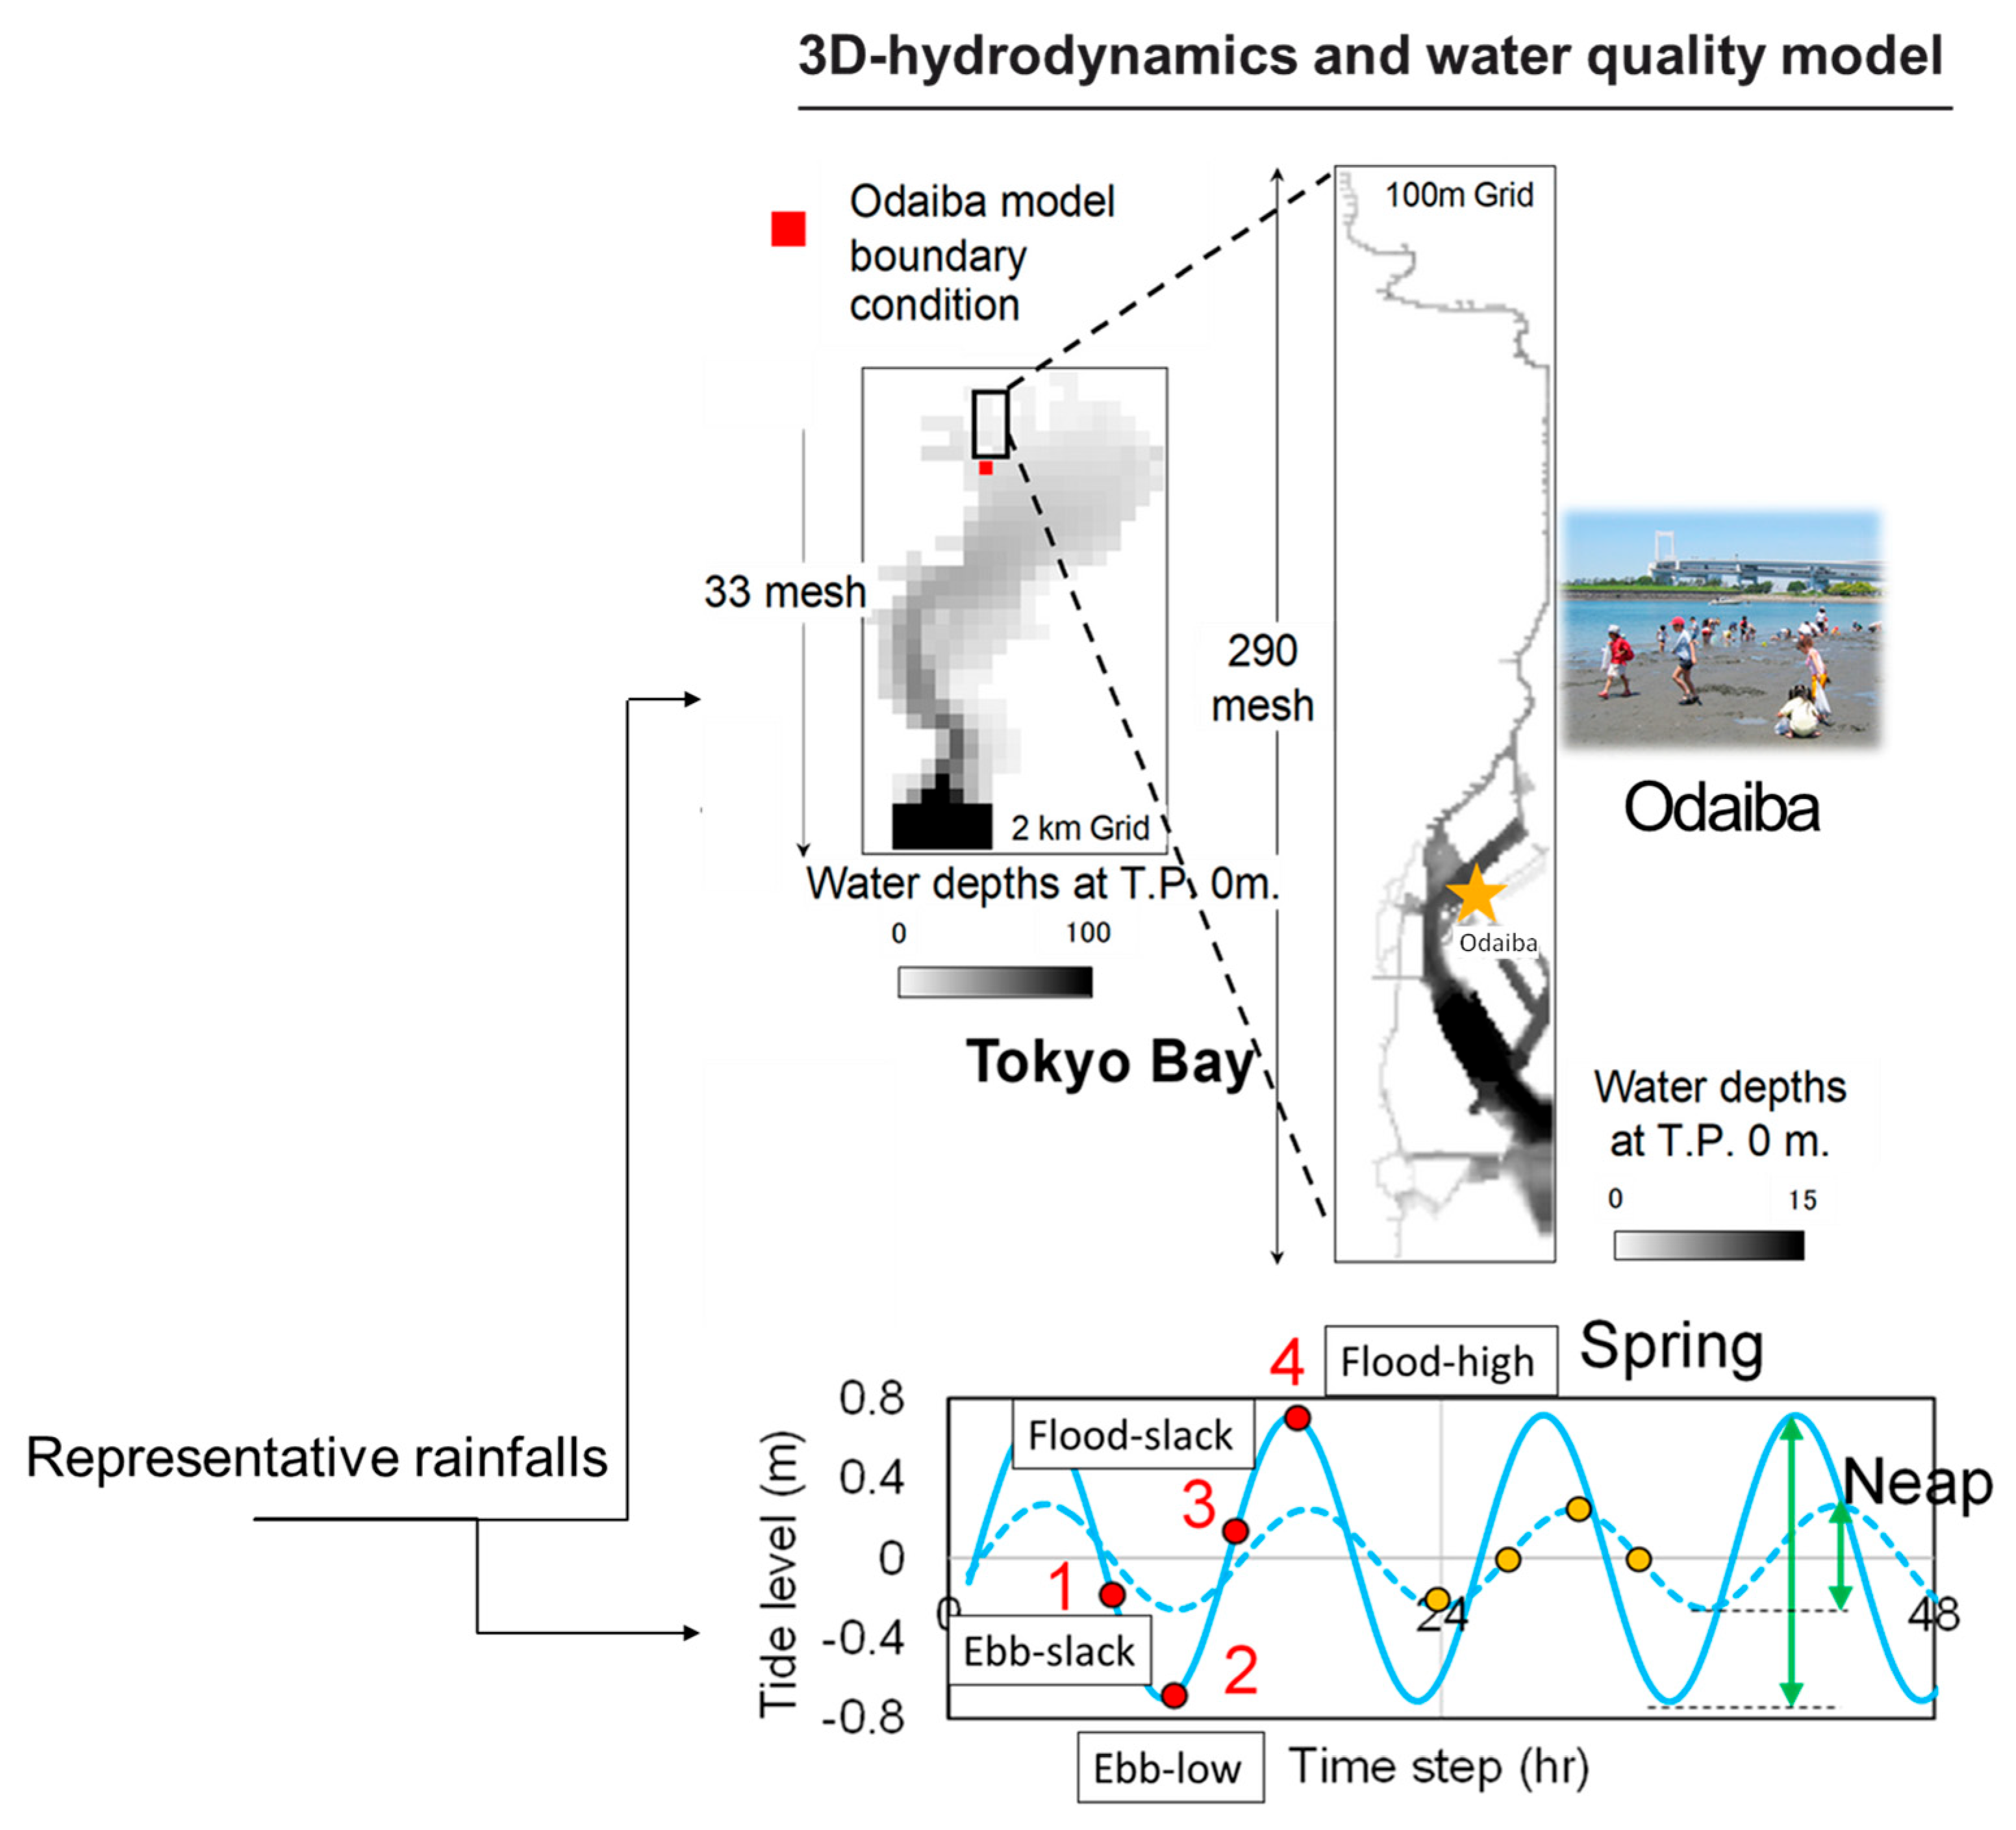
A three-dimensional (3D) hydrodynamic and water quality model was used to simulate flow and pollutant transport in the Tokyo Bay and Odaiba coastal region. The model system consists of two nested computational domains: a coarse-grid Tokyo Bay model (2 km horizontal resolution) and a fine-grid Odaiba model (100 m resolution, 60 × 290 horizontal grids). The vertical structure was represented using a sigma-coordinate system with ten layers, which enabled accurate representation of stratification and variable bathymetry.
The hydrodynamic component solves the Navier–Stokes and continuity equations under the hydrostatic and Boussinesq approximations. The model incorporates temperature- and salinity-driven density stratification to represent realistic circulation patterns within the bay. The Odaiba domain focuses on the Sumida River estuarine system, which receives urban runoff and combined sewer overflows (CSOs) from 6 inflow rivers, 29 pumping stations, and 6 sewage treatment plants (STPs) within Tokyo’s 23 wards.
Boundary conditions included river inflows, tidal elevation, temperature, salinity, and meteorological condition such as precipitation, solar radiation, wind, and air temperature), based on data provided by the Japan Meteorological Agency (JMA) and Tokyo Metropolitan Government (TMG).
Water quality modeling focused on
E. coli as a fecal indicator. The fate of
E. coli was simulated using an advection–diffusion equation with inactivation terms that accounted for settling, salinity-induced inactivation, and inactivation due to solar irradiance. The inactivation rate was calculated using the following Equation (1):
k
b: basic inactivation coefficient = 0.045 (day
−1);
k
s: inactivation coefficient depending on salinity = 0.100 (day
−1ppt
−1);
C
s: salinity level (ppt);
k
I: inactivation factor by sunlight = 0.038 (m
2day
−1W
−1);
I: solar irradiance (Wm
−2);
a: extinction coefficient = 0.65 (m
−1);
h: water depth (m).
This modeling framework is based on a system that was developed and validated in previous studies [
26,
27], where more details can be found.
2.4. Tidal Phase Categorization
Tidal conditions were classified into eight dominant phases based on Tokyo Bay tide charts obtained from the Japan Meteorological Agency. These phases were defined within two primary tidal magnitude regimes: spring tide and neap tide. Each regime comprises four distinct tidal phases—flood-high, ebb-low, flood-slack, and ebb-slack—as shown in
Figure 2, characterizing the temporal variations in tidal flow and elevation during each tidal cycle. This classification allowed for the examination of how tidal amplitude and flow direction modulate contaminant distribution. Events were cross-referenced with tidal phase at the onset of rainfall to discern potential hydraulic impedance or enhanced flushing effects. The “flood-high” phase, characterized by high water levels and reduced seaward gradient, was hypothesized to retard CSO dispersion, while “ebb-low” conditions were expected to promote advection of contaminants toward the bay [
8,
28].
2.5. Data Analysis and Visualization
Statistical analysis such as cluster analysis was conducted using R (version 4.2.1). All spatial and vertical profiles were visualized using contour mapping and 3D plotting packages (e.g., avese software version 0.93). These visualizations facilitated interpretation of how microbial and salinity plumes evolved both vertically and longitudinally.
3. Results and Discussion
The response of E. coli and salinity profiles to rainfall events in urban estuaries is governed by the dynamic interplay between runoff intensity, stratification stability, and tidal modulation. In the Sumida River estuary, which receives both high-density CSO discharges and marine influence from Tokyo Bay, these interactions shape not only the extent of contaminant dispersion but also its vertical distribution and persistence. The results explore how contrasting rainfall characteristics influence the spatial and vertical behavior of E. coli and salinity across a tidal estuarine gradient, with particular attention to the mixing behavior in upstream versus coastal zones, the depth-resolved effects of stratification disruption, and the modulation of these patterns by tidal phase at the onset of rainfall.
3.1. Rainfall Event Classification and Total Precipitation Patterns
To characterize the variability in runoff and CSO behavior, historical rainfall events across Tokyo’s eight drainage areas were classified into six clusters (G1 to G6). This was accomplished using cluster analysis that considered both total precipitation and spatiotemporal patterns of CSO occurrence. The resulting groups capture the hydrological heterogeneity of rainfall events that influence CSOs and subsequent estuarine contamination. Group G2, representing a low-intensity event (15 mm over 13 h), and Group G6, a high-intensity, long-duration storm (272 mm over 34 h), were selected for detailed water quality analysis (
Figure 3).
These two rainfall types correspond to sharply different hydrological responses. G2 induced relatively minor CSO activity, while G6 caused widespread intense CSO activation across nearly all monitored basins. The spatial spread and cumulative magnitude of rainfall for each cluster are illustrated in the precipitation distribution plots. This classification framework provides a mechanistic basis for examining the dispersion of contaminants under rainfall regimes with differing runoff volumes, intensities, and their pollutant inputs.
3.2. Vertical Distribution of E. coli: Depth-Dependent Behavior
Model simulations of depth-resolved
E. coli concentrations revealed distinct vertical dispersion patterns between the two rainfall events. The modeled
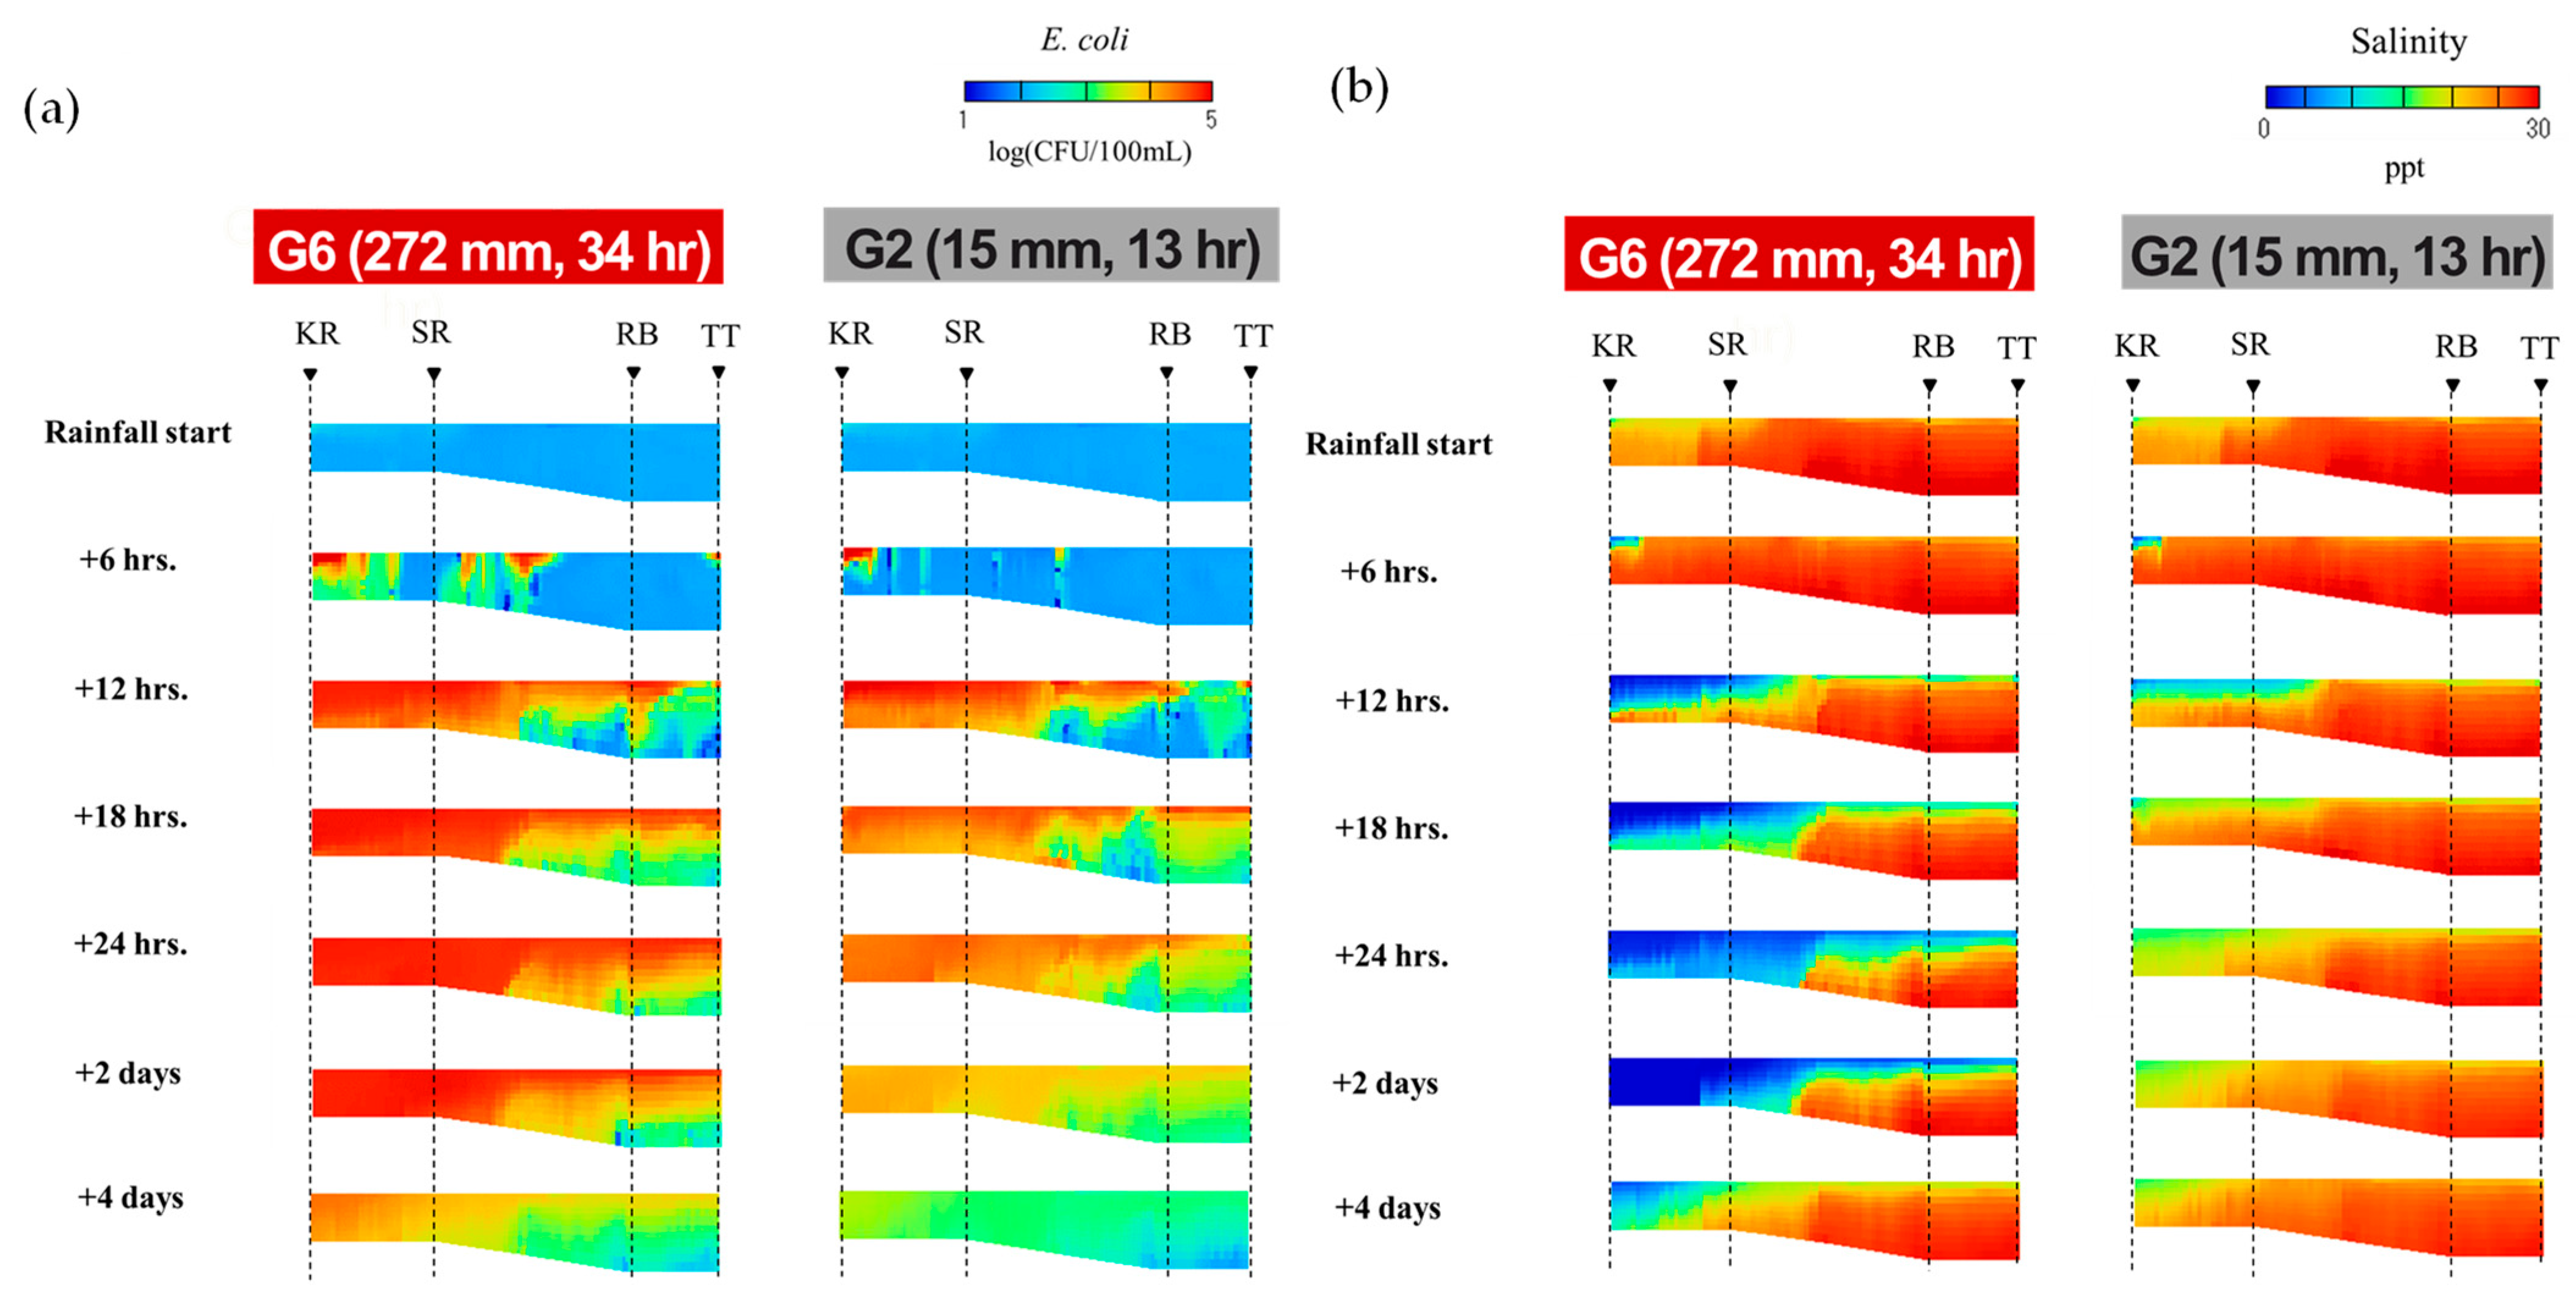
E. coli concentrations and salinity were illustrated along a longitudinal 8.5 km transect spanning from the Kanda–Sumida River confluence (KR) to Tokyo Bay Tunnel (TT) (
Figure 4).
E. coli concentrations and salinity were extracted at a horizontal resolution of 100 m along the transect and across 10 layers representing water depths.
Following the G2 rainfall event, fecal contamination was concentrated in surface layers across most sites (
Figure 4a right). The microbial plume exhibited low vertical dispersion, with mid and bottom depths often showing minimal contamination. This outcome suggests that under low-volume runoff conditions, the CSO plume forms a buoyant, freshwater lens that skims the surface of the estuarine column. The limited kinetic energy and lower density differential between runoff and estuarine water inhibit vertical entrainment.
In contrast, the G6 event generated a dramatically different vertical structure (
Figure 4a left). In the upstream regions of the transect, particularly between KR and Sumida River mouth (SR),
E. coli concentrations were observed to penetrate to the riverbed, reaching depths of approximately 6–7 m. This deeper vertical distribution indicates a breakdown of stratification and vigorous mixing, likely driven by the higher momentum and density of the runoff generated during G6. The increased CSO volume results in a water mass capable of displacing or entraining brackish water across the entire column.
Downstream, in coastal zones such as Rainbow Bridge (RB) and TT, a different pattern emerged. Even under G6 conditions, E. coli concentrations remained primarily restricted to the surface. This suggests that although G6 was energetic enough to cause upstream entrainment, the decreased flow velocity, interaction with tidal inflow, and dilution by saline water near the bay mouth collectively limited vertical transport. These findings reveal a critical spatial transition: upstream zones are more susceptible to full-column microbial contamination during intense rainfall, whereas downstream zones exhibit persistent surface-layer contamination regardless of event magnitude.
3.3. Salinity Profiles and Stratification Breakdown
Reproduced salinity provided insight into the underlying hydrodynamic and mixing processes shaping microbial transport. Under G2 conditions, only a modest reduction in surface salinity (~2 PSU) was observed, with little impact at mid and bottom depths (
Figure 4b left). The stratified estuarine structure remained largely intact. This implies that the inflowing CSO water lacked sufficient density or volume to alter the salinity gradient significantly. In contrast, the G6 event caused a marked disruption of the salinity profile, particularly in upstream segments (
Figure 4b right). Vertical salinity reduction was observed not only at the surface but also in the bottom layer. In several transects, salinity was reduced across the full water column, indicating intrusion of low-salinity, high-volume runoff, and breakdown of natural stratification. This freshwater mass created favorable conditions for
E. coli survival at greater depths, especially where reduced solar exposure and oxygen stress mitigate natural inactivation. These salinity dynamics help explain why microbial penetration was more pronounced during G6. When the density gradient is disrupted, vertical resistance to mixing weakens, enabling microbial plumes to sink and persist in layers that would, otherwise, act as protective barriers in stratified systems.
3.4. Tidal Modulation of Microbial and Salinity Profiles
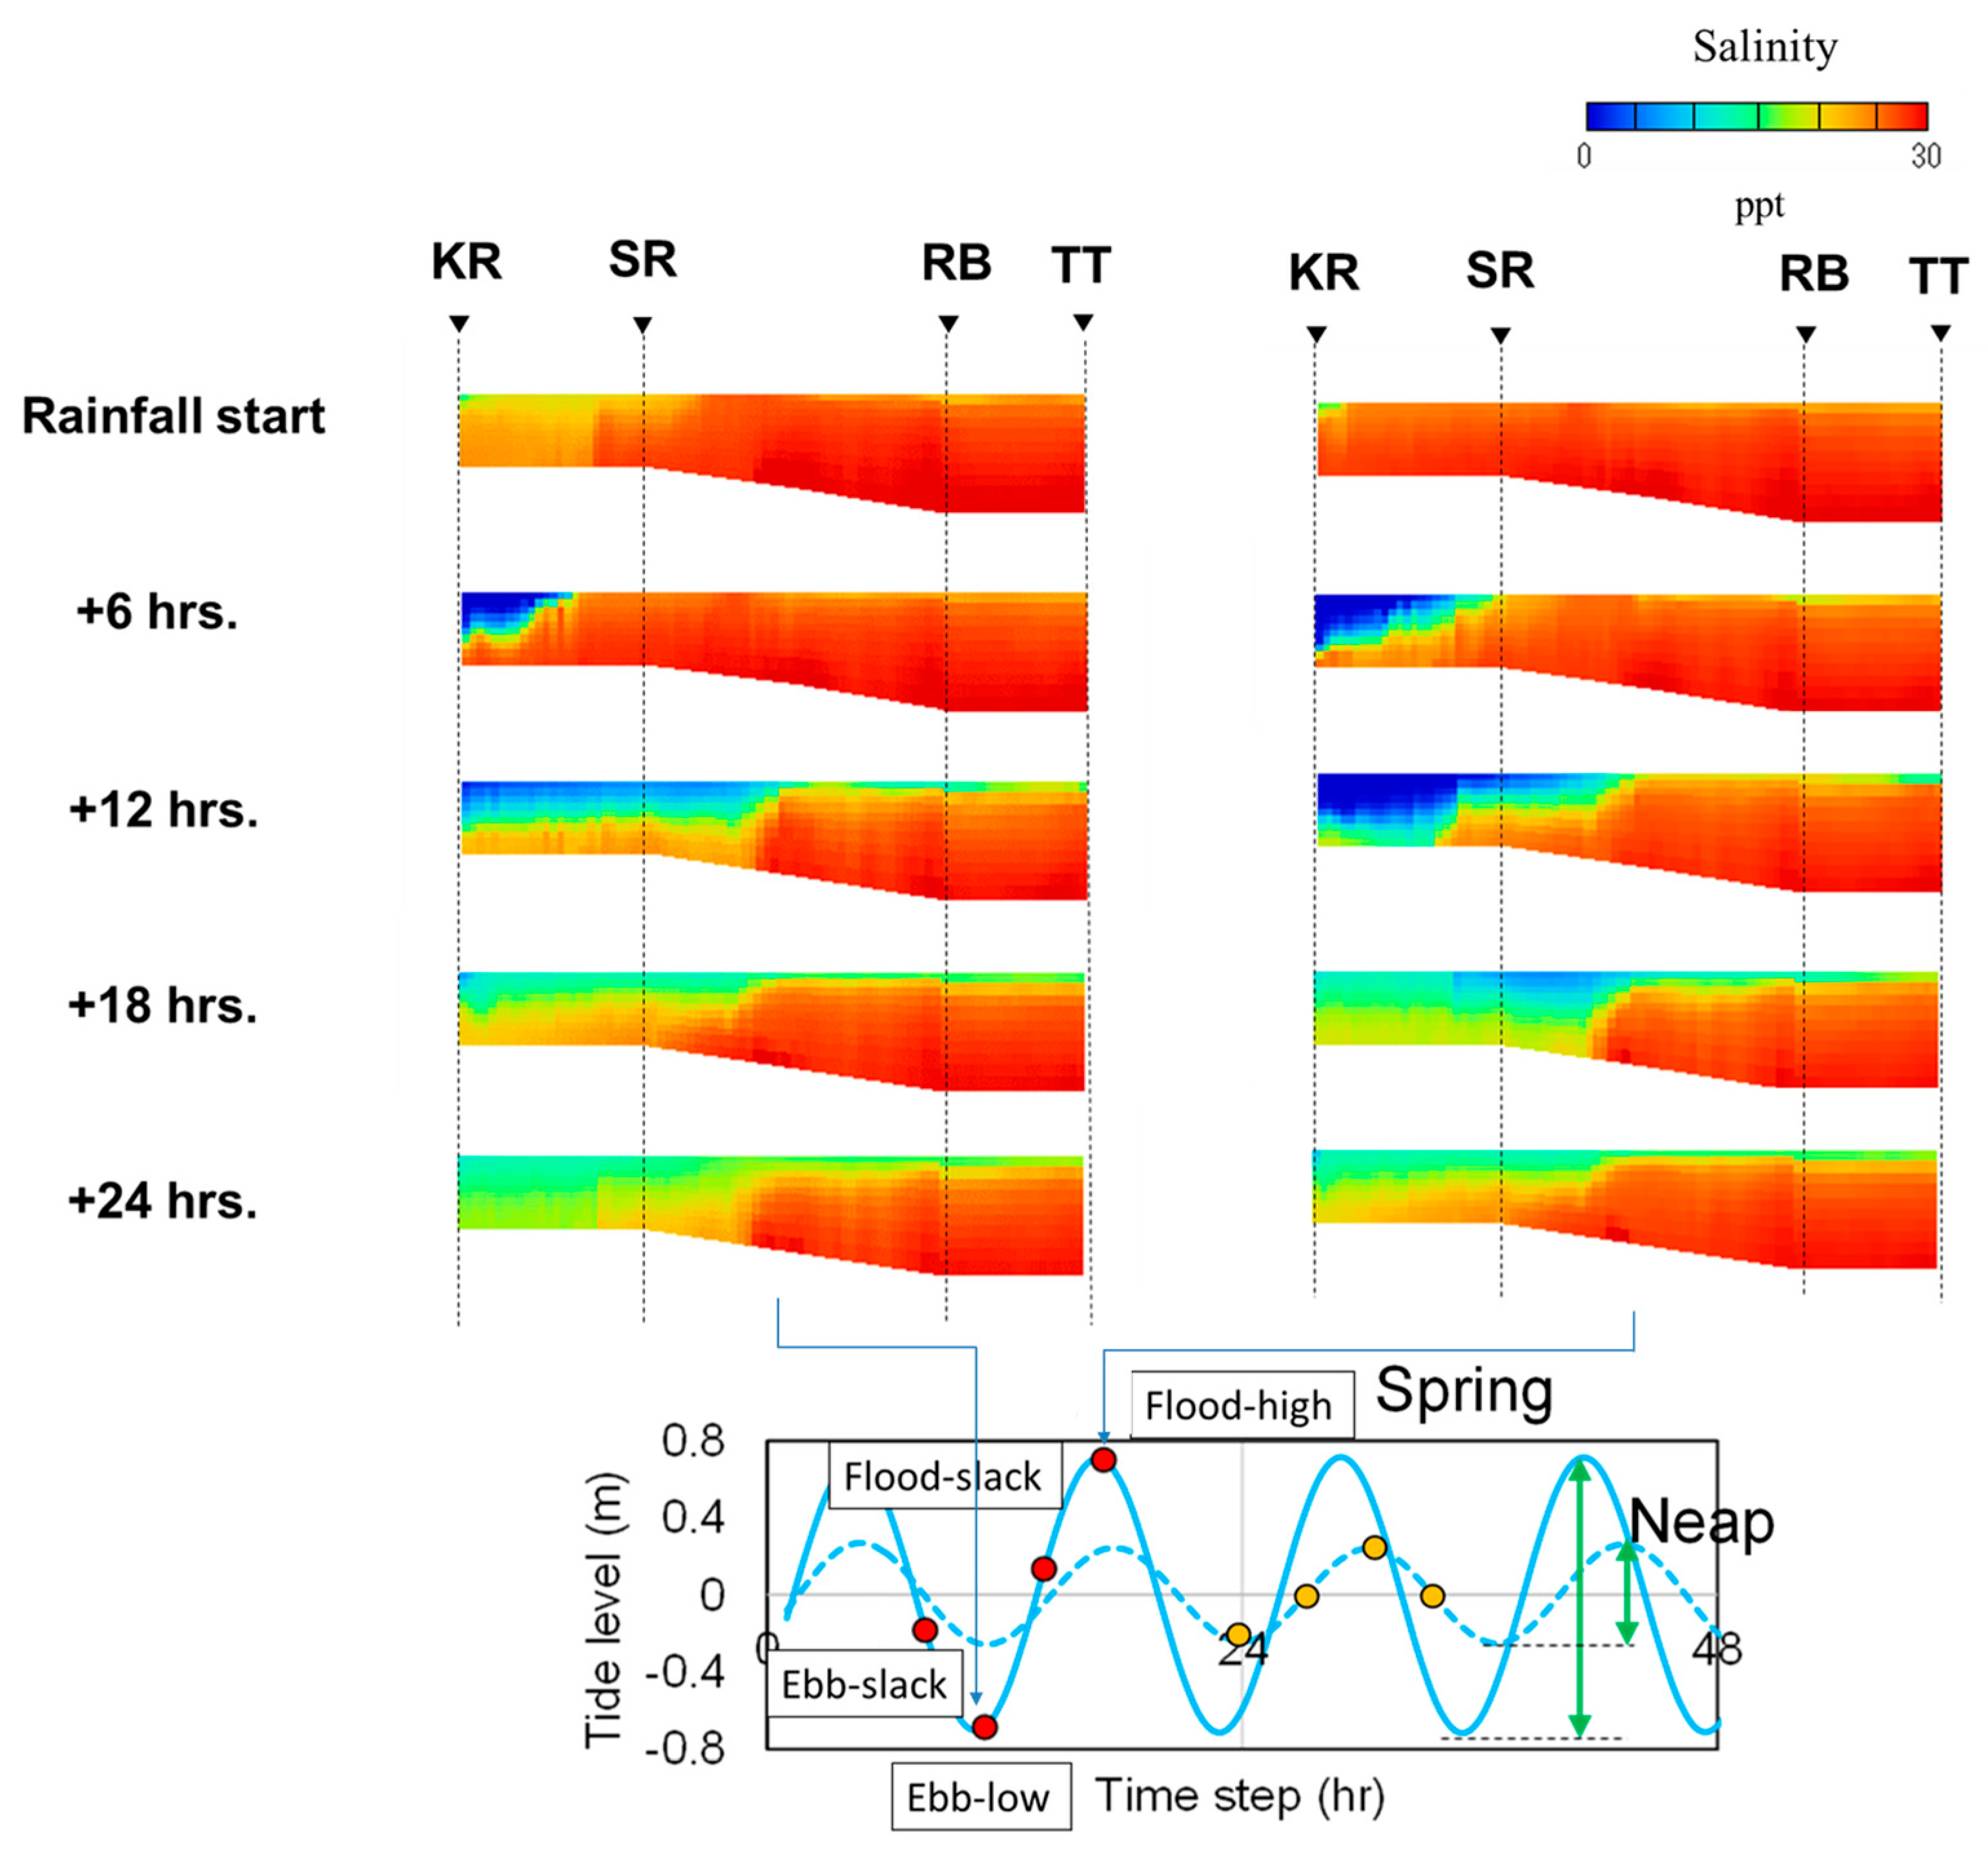
The G3 rainfall (e.g., 16 mm in 13 h) was selected to investigate how rainfall onset during different tidal phases, such as ebb-low and flood-high conditions, affects the dispersion of CSO plume. The influence of tidal phase at rainfall onset was evident in both salinity and
E. coli profiles. No major differences in vertical salinity profiles under flood-high and ebb-low conditions were observed between spring and neap tidal conditions. Therefore, the temporal changes during spring tide are shown in
Figure 5. Rainfall that began during flood-high phases showed stronger plume retention near the riverbed (
Figure 5 right). This is likely due to backflow or hydraulic resistance that impedes river discharge, forcing inflow to remain in the system longer and to displace deeper layers. By contrast, rainfall during ebb-low phases allowed quicker advection of CSO-impacted runoff downstream, preserving the stratified structure and reducing the opportunity for microbial plume entrainment into deeper layers (
Figure 5 left). These results demonstrate that not only rainfall intensity but also its timing relative to tidal cycles plays a vital role in controlling pollutant retention, stratification disruption, and vertical transport mechanisms.
3.5. Conceptual Frameworks and Limitations
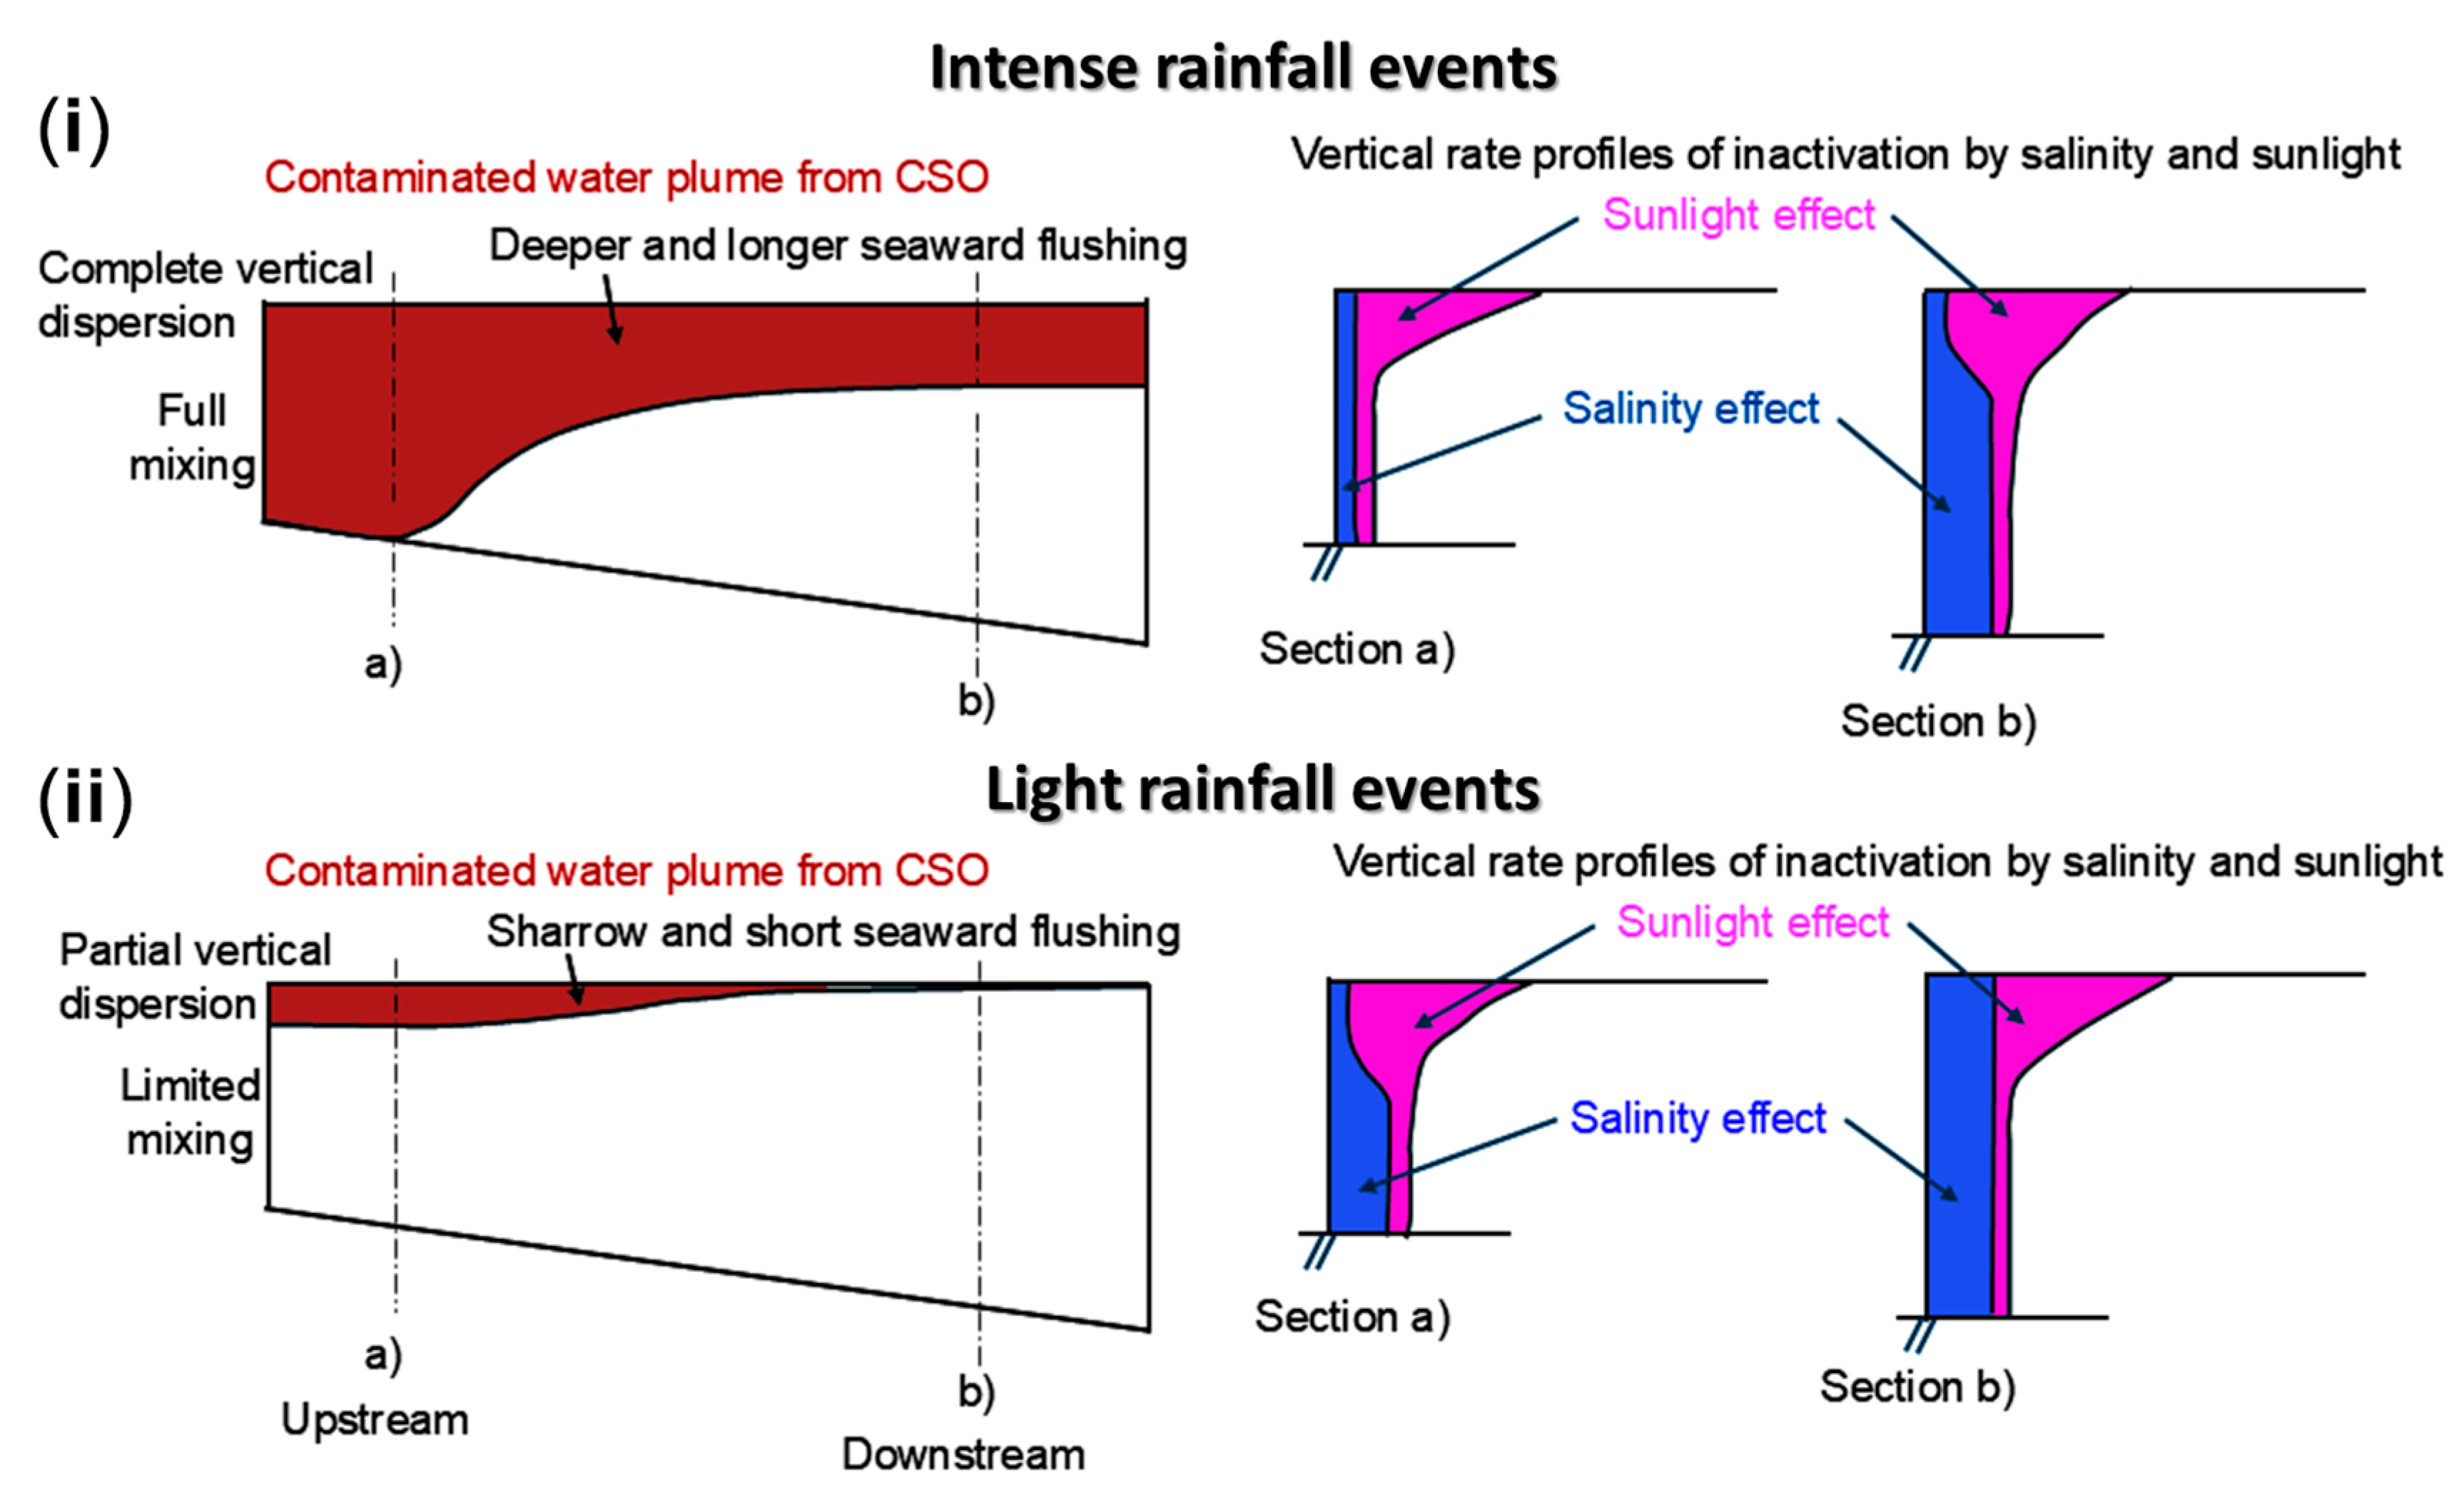
Figure 6 depicts a conceptual framework of summary findings viz. (i)
E.coli dispersion led to dilution, and salinity-mediated reduction during intense rain conditions, and (ii) seaward flushing of microbial load during the low rain conditions. This study provides strong evidence that vertical microbial dispersion in urban estuaries is governed by a complex interplay of rainfall intensity, tidal phase, runoff density, and estuarine geometry. G6-type events, characterized by large precipitation volumes and prolonged CSO activity, were shown to break stratification and disperse microbial contaminants throughout the water column in upstream regions. In contrast, light events like G2 result in surface-layer confinement of microbial loads due to preserved stratification and limited mixing energy. Salinity serves as a robust tracer of plume intrusion and is a key determinant of microbial fate.
Other key findings include the following: (i) Intense rainfall produced high-volume CSO discharges that overcame natural salinity stratification, leading to vertical mixing of microbial contaminants in upstream zones; (ii) salinity profiling served as both a conservative tracer of freshwater CSO plumes and a regulator of microbial persistence through its role in density stratification and osmotic stress; (iii) tidal conditions of flood-high amplified microbial retention by restricting discharge, while ebb-low conditions promoted downstream advection and faster decay; and (iv) coastal areas showed persistent microbial loading in surface waters, which has significant implications for recreational water safety at amenity fronts.
Limitations include the absence of continuous hydrodynamic measurements, and the focus on a single microbial indicator. Nonetheless, the vertical profiling approach adopted here highlights zones of vulnerability, particularly in surface waters of coastal amenity areas, and lays the groundwork for more advanced, sensor-integrated monitoring and real-time risk assessment.
4. Conclusions
This study provides detailed investigations of the vertical distribution of E. coli and salinity in an urban estuarine system under contrasting rainfall and tidal conditions. Using a transect along the Sumida River estuary, we demonstrated that rainfall intensity and tidal phase at event onset play critical roles in determining not just the magnitude but also the spatial and vertical behavior of microbial contamination.
The findings offer important implications for proactive water quality management, especially in urban estuaries subject to increasing climate-related rainfall variability. By integrating vertical microbial fate modeling with event-based rainfall–tide classification, our work supports the development of dynamic and accessible risk advisory systems. As a proof of concept, we are developing a mobile phone application that enables users to input local rainfall data and receive forecasted E. coli concentration trends in the coastal area. This tool provides a rapid and practical way to evaluate microbial water quality risks—empowering the public, local authorities, and water managers to make timely, evidence-based decisions to protect public health. The application enhances early awareness of potential contamination events and can serve as a foundation for broader, community-based water safety monitoring.
More practically, this tool can be integrated into tiered alert protocols to trigger advisories, focused monitoring, or temporary use restrictions during forecasted high-risk periods. While this study focused on Tokyo, the methods and modeling framework are broadly transferable to other urban estuarine systems. However, its success is critically dependent on thorough calibration to local conditions. This requires integrating site-specific data on infrastructure and contamination sources, such as sewer system dynamics and microbial load profiles, with fundamental geographical and hydrological data. Key inputs include river discharge rates, estuarine bathymetry, local tidal patterns, and the unique geometry of the water body, as these factors govern the physical transport and mixing processes that drive contaminant distribution. With this comprehensive calibration, the approach can be adapted to guide water quality management in cities globally.
One important step in the future is the deployment of continuous vertical profiling instruments, such as Acoustic Doppler Current Profilers (ADCP) and automated water samplers. These tools can capture high-resolution data on diel and tidal cycling effects, offering a more detailed picture of how microbial contaminants are transported vertically and temporally through the water column. In addition, techniques such as quantitative polymerase chain reaction (qPCR) and high-throughput sequencing can be utilized to detect a broader spectrum of microbial agents, thereby improving the reliability of public health risk assessments in recreational and urban water bodies. Furthermore, there is a need to develop and validate integrated hydrodynamic–microbial fate models that can simulate various scenarios under different rainfall and tidal conditions.
Ultimately, these insights and tools contribute toward developing safer, more resilient, and sustainable urban estuarine environments—particularly recreational waterfronts like those in Tokyo—under mounting climate pressures.
