Article

Impact of Kara Sea Shelf Water on Seawater Parameters in Subsurface Layer of Laptev Sea

Il’ichev Pacific Oceanological Institute, Baltiyskaya Str. 43, Vladivostok 690041, Russia
*
Author to whom correspondence should be addressed.
J. Mar. Sci. Eng. 2025, 13(8), 1522; https://doi.org/10.3390/jmse13081522
Submission received: 2 July 2025 / Revised: 28 July 2025 / Accepted: 6 August 2025 / Published: 8 August 2025
(This article belongs to the Section Marine Environmental Science)

Abstract

Global climate changes impact the Arctic seas by decreasing the sea ice area and changing the inorganic and organic matter supply via rivers and coastal permafrost thawing. Therefore, climate change may affect biogeochemical processes in the Kara Sea (KS) and Laptev Sea (LS), which form the Arctic Transpolar Drift. This study explores the effect of the KS shelf water supply on seawater parameters in the LS in late summer and early fall 2007, 2008, 2018, 2019, and 2024 using ship-borne (temperature, salinity, dissolved oxygen, nutrients, and pH), satellite-derived (sea surface heights, geostrophic current velocities), and model (current velocities) data. The results demonstrate that an inflow of KS shelf water with salinity of 33.0–34.5, high Apparent Oxygen Utilization values (50–110 µM), and increased concentrations of the dissolved inorganic phosphorus (DIP~ 0.7–1.2 µM), dissolved inorganic nitrogen (DIN~ 4–12 µM) and silicic acid (DSi~ 10–18 µM) enriches the subsurface layer of the LS with nutrients. The distributions of Atlantic—derived water (ADW) and KS shelf water in the LS from August to October depend on water dynamics caused by wind and river discharge. High Lena River discharge and westerly (downwelling favorable) winds promoted the supply of the KS shelf water to the LS through Vilkitsky Strait. In the area of the central trough of the LS, the KS shelf water can be modified by mixing with ADW. Mixing ADW with high DIN/DIP ratios (DIN~ 10 µM at DIP of 0.80 µM) and KS shelf water with low DIN/DIP ratios (DIN~ 8 µM at DIP of 0.80 µM) leads to changes in the DIN vs. DIP ratio in the subsurface layer of the LS.

1. Introduction

The Kara Sea (KS) and Laptev Sea (LS) are marginal seas in the Arctic Ocean. These seas are connected to each other by the Vilkitsky Strait (VStr) and Shokalsky Strait (ShStr) (Figure 1). KS and LS consist of a broad shelf, extending northward from its southern boundary to the shelf/Arctic deep basin boundary. The salinity and chemical parameter distributions in the LS are related to the Lena River inflow, photosynthesis/organic matter degradation, ice formation/melting, supply of Arctic water of Atlantic origin (ADW, Atlantic–derived water) through the shelf/deep basin boundary, and water advection from the KS through the VStr [1,2,3,4]. ADW is characterized by high-salinity (≥34.5), increased concentrations of dissolved inorganic nitrogen (DIN~ 8–10 µM), dissolved inorganic phosphorus (DIP~ 0.6–0.8 µM), and low silicic acid (DSi~ 4–5 µM) [1,2]. The Lena River discharge is characterized by high DSi concentrations (60–100 µM) [3,4]. The Lena River also transports terrestrial organic matter mobilized from extensive watersheds [4]. The thawing of on-land and sub-sea permafrost, increasing coastal and bottom erosion, and changes in river outflow could affect nutrient and carbon cycling in the LS [5,6,7,8]. Other important factors that can impact nutrient concentrations in the Arctic marginal seas are global warming [9] and the spreading of the ADW area [10,11], which lead to decreased ice extent in the Arctic Ocean.
The processes influencing nutrient concentrations in LS have been discussed by many researchers [2,12,13,14,15,16,17]. Most of these studies focused on the Lena River and ADW inputs, sediment resuspension, biological uptake/organic remineralization, and permafrost degradation, but did not focus on the KS input to the nutrient budget of the LS, thereby missing an additional source of nutrients for the LS. This is largely due to the lack of extensive observation of the chemical parameters simultaneously on the shelves of LS and KS. Recent hydrochemical surveys in the KS [18] have studied the impact of the Yenisey and Ob Rivers on nutrient distribution in the KS, but have not considered the influence of the KS on nutrient concentrations in the LS.
In this paper, we explore the effects of KS shelf water supply on nutrient distribution in the LS using the ship–borne and satellite–derived data collected in late summer and early fall 2007, 2008, 2018, 2019, and 2024. The main emphasis here is on the effects of water circulation and water origin on chemical parameters in the subsurface layer of the study regions. Our results demonstrate that the advection of KS subsurface water is one of the main sources of low dissolved oxygen, pH, and increased nutrient concentrations for the LS shelf.

2. Materials and Methods

2.1. Study Area

The KS (an area of around 880,000 km2 and a mean depth of about 110 m) is separated from the Barents Sea to the west by the Novaya Zemlya and from the LS to the east by the Severnaya Zemlya. It connects to the Barents Sea via the Kara Strait and the LS via the VStr. The KS is ice-covered between September/October and May and is influenced by a significant river runoff (1200 km3/year) with main inputs from the Ob (400 km3/year) and Yenisei (600 km3/year) rivers. The KS is also affected by the ADW supply through the continental shelf-deep basin boundary. The area northeast of Novaya Zemlya is considered a dense water formation site due to the cooling of high-salinity ADW in winter [19].
The LS is connected in the west by the KS and in the east by the East Siberian Sea. Its area is about 700,000 km2, and the average depth is about 580 m, over half of which is located on the continental shelf, with an average depth of less than 50 m. The sea floor of the LS is cut by canyon-like troughs (paleo-river valleys). A large (wide and short) trough is situated in the central part of the LS, and meridionally oriented, narrow, and long troughs are located in the eastern and western parts of the LS. These troughs may act as pathways for ADW transport to the southern part of the LS [20]. The fresh water supply to the LS via river (Khatanga, Lena, Olenek, Yana) discharges is approximately 700 km3/year, with the main input from the Lena River (535 km3/year). The water circulation is cyclonic: southward flow in the western part of the LS, eastward flow along the continental coast (amplified by the fresh water supply by Lena River), and north/northwest flow in the eastern part of the LS [21,22].
The LS ecosystems are considered a low-productivity polar ecosystems characterized by light limitation, pronounced seasonality, and spatially and temporally limited phytoplankton blooming [23,24]. The LS has a shorter season of phytoplankton blooming mainly because of harsh ice conditions (the ice-free period is about 60–75 days) [24]. The outer shelf of the LS is characterized by the prevalence of diatom species. On the inner shelf of the LS, which is affected by the Lena River discharge, the local algal assemblages composed of dinoflagellates and marine and freshwater diatoms are observed [25].
VStr is a major pathway from the KS to the LS [22,26]. VStr is a 250-km-long, 80-km-wide submarine trough that is 200–350 m-deep. The annual mean volume of transport through the strait is about 0.5–0.6 Sv (1 Sv = 106 m3/s), and it includes a significant volume of KS freshwater from the Ob and Yenisey [26]. The subsurface water structure in VSt is characterized by a steep front separating relatively warm and saline (t > −0.5 °C, S > 34.7) from cold shelf–transformed water. Shelf–transformed waters dominate above VStr’s slope, measuring near–freezing temperatures (<−1.5 °C) and salinity of 34–35 [27,28].

2.2. Ship-Borne Data

Our study is based on ship-borne data (temperature, salinity, dissolved oxygen, nutrients, and pH) collected during five cruises: R/V “Viktor Buynitskiy” (September 2007), R/V “Yakov Smirnitsky” (August, 2008), R/V “Akademik Mstislav Keldysh” (October 2018), R/V “Professor Multanovskyi” (August–September 2019), and R/V “Akademik Boris Petrov” (September–October 2024) (Figure 1). Temperature and salinity were measured directly using a CTD-profiler (SBE19, SeaBird Electronics, Seattle, WA, USA). Samplings at hydrological stations were carried out with 5- or 10-L Niskin bottles. The dissolved oxygen (DO) concentration was determined using an automatic Winkler titration system with a precision of 1–2 μM. To calculate the Apparent Oxygen Utilization (AOU, the difference between the DO solubility and measured DO), we used the equation of Weiss [29]. DIP, DIN (nitrate, nitrite, and ammonia), and DSi were determined onboard by spectrophotometric manual methods with a precision of 1–2% [30,31]. DIP was measured using the approach elaborated by Murphy and Riley [30,31]. DSi was measured using the method proposed by Grasshoff [30]. Nitrite and nitrate concentrations were determined following the protocol described in [31]. The ammonia concentration was determined using the method proposed by Solorzano and described in [30,31].
The nutrient data collected in 2007, 2018, and 2019 in the deep part of LS on the horizon of 100–250 m were in good agreement with the previously published results. In the salinity range of 34.50–34.85 (ADW salinity range), our observations gave DIP of 0.69 ± 0.08 µM and DSi of 4.4 ± 0.9 µM (N = 80). The values of DIP and DSi observed by us are close to the DIP of 0.60–0.80 µM and DSi of 4–5 µM accepted as ADW in studies of the nutrient distributions in the Arctic [1,2].
The measurement of pH was done on a total hydrogen scale at a temperature of 20 °C (pHT (20 °C)), applying a potentiometric method. To calibrate electrodes, a TRIS buffer in seawater [32] was used. The repeatability of pH measurements was ± 0.005 pH units.
To show the influence of KS shelf water on chemical parameters in the LS, we used six parameters (Salinity, AOU, DSi, DIN, DIP, and pH). The main approach was the data visualization by using the vertical profiles and salinity versus nutrient, AOU, and pH diagrams. By comparison of the vertical distributions of chemical parameters and salinity in the KS and LS, we demonstrate their similarity. Salinity vs. chemical parameter diagrams show the KS water transformation in the Laptev Sea due to mixing with the LS and ADW. To compute statistics (mean, STD), the free and open-source software (XLSTAT version 2020.1.3) was used.

2.3. Ancillary Data

In our study, we used data on sea surface heights (SSHs) and geostrophic current velocities with a spatial resolution of 1/4° × 1/4° (~30 km along the longitude and ~10 km along the latitude for the region under study) according to satellite measurements (AVISO data, http://marine.copernicus.eu (accessed on 30 March 2024)) from 1997 to 2019. To plot velocity maps for the subsurface layer (25 m), we used 41-layer HYCOM + NCODA Global 1/12° Reanalysis data (https://www.hycom.org/data/glbv0pt08/expt-53ptx accessed on 10 May 2025). The monthly flow of the Lena River at Kyusyur gauging station was obtained from the ArcticGRO discharge dataset (version 20250327, https://arcticgreatrivers.org/discharge/ (accessed on 10 May 2025)). The data on wind direction and speed (daily data) were taken from the NOAA Earth System Research Laboratories (http://www.esrl.noaa.gov (accessed on 10 May 2025)). To demonstrate the distribution of chlorophyll concentration in the Kara Sea in June 2019, July 2019, and August 2019 (Figure S1), data from the MODIS Aqua/Terra satellite spectroradiometer with a spatial resolution of 4 km (http://oceancolor.gsfc.nasa.gov (accessed on 15 June 2024)) were used.

3. Results

3.1. Lena River Discharge, Wind Regime, and Water Circulation

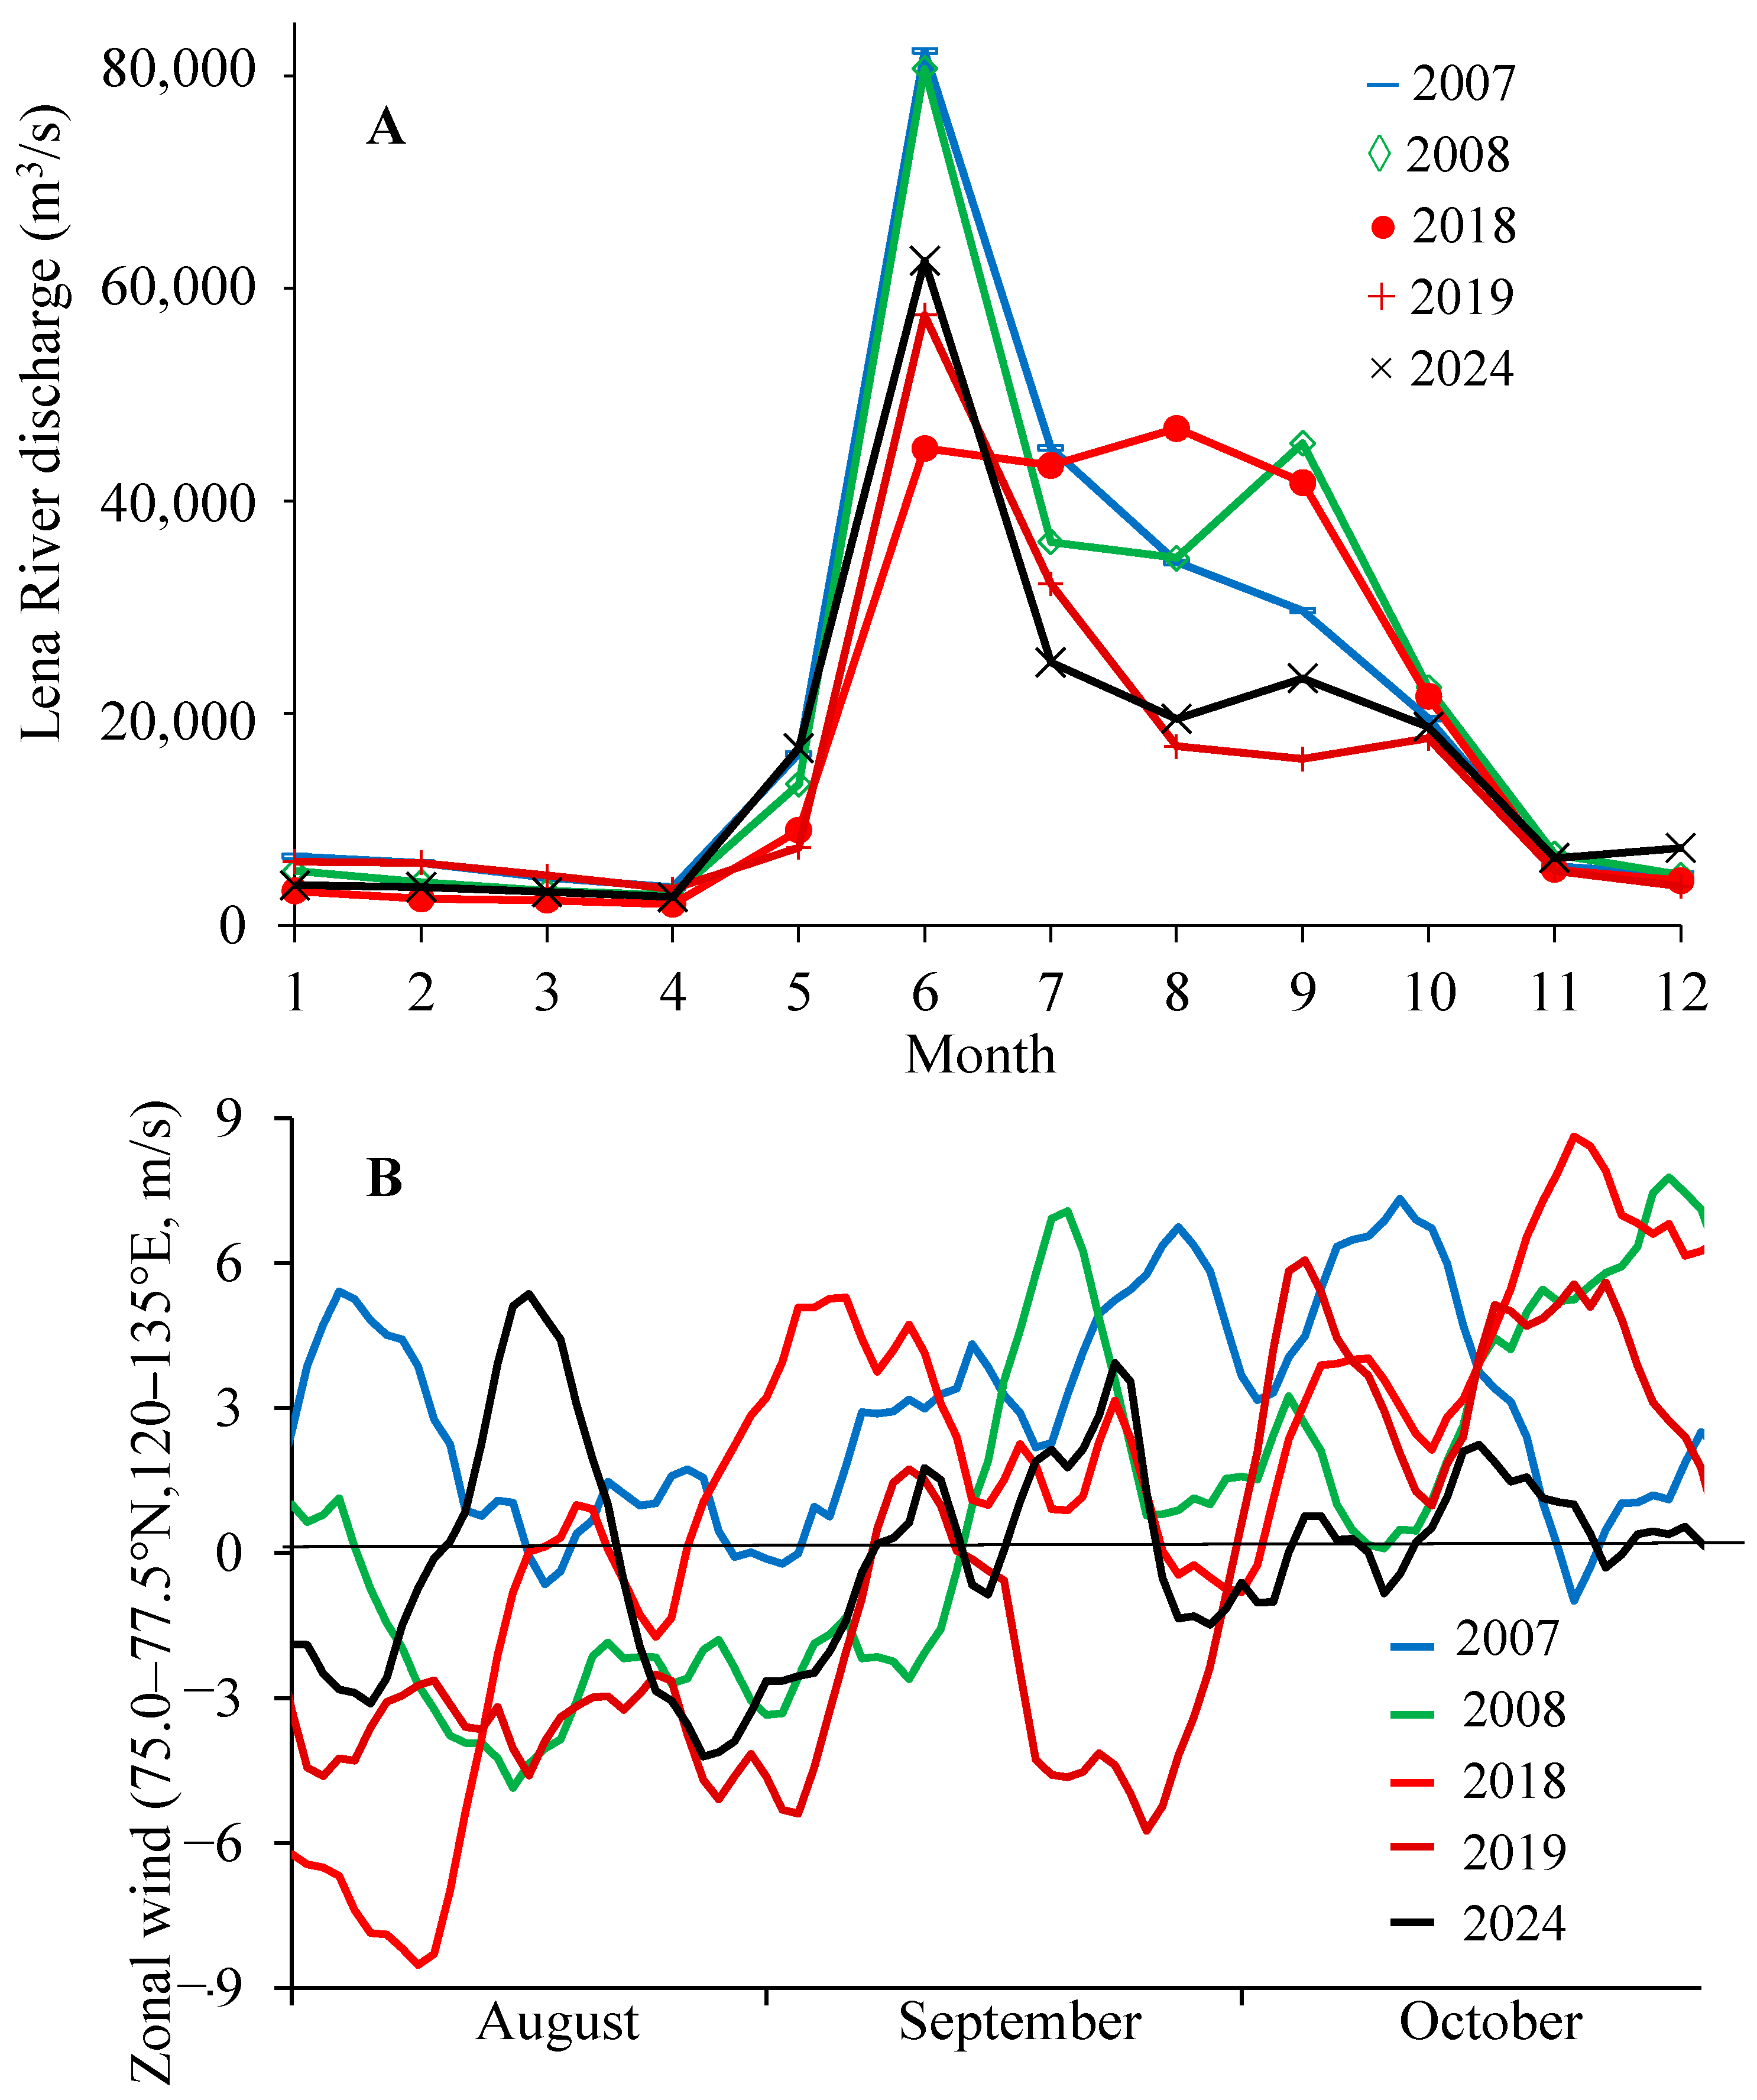
The wind direction and speed, and the fresh water supplied by rivers and ice thawing, determine the water circulation in the shelf areas of the Arctic seas during the ice-free period (from mid-July to mid-October) [22,33]. Increased river outflow and westerly winds promote the eastward Arctic Transpolar Drift [22,23,26,33,34]. In 2007, 2018, 2019, and 2024, the intra-annual variability of Lena River discharge was regular. The maximum river outflow was observed in June (81,000 m3/s in 2007/2008 and 57,000 m3/s in 2019), and it decreased to approximately 20,000 m3/s in October. In 2018, the Lena River discharge was quite uniform between June and October (42,000–47,000 m3/s) (Figure 2A).
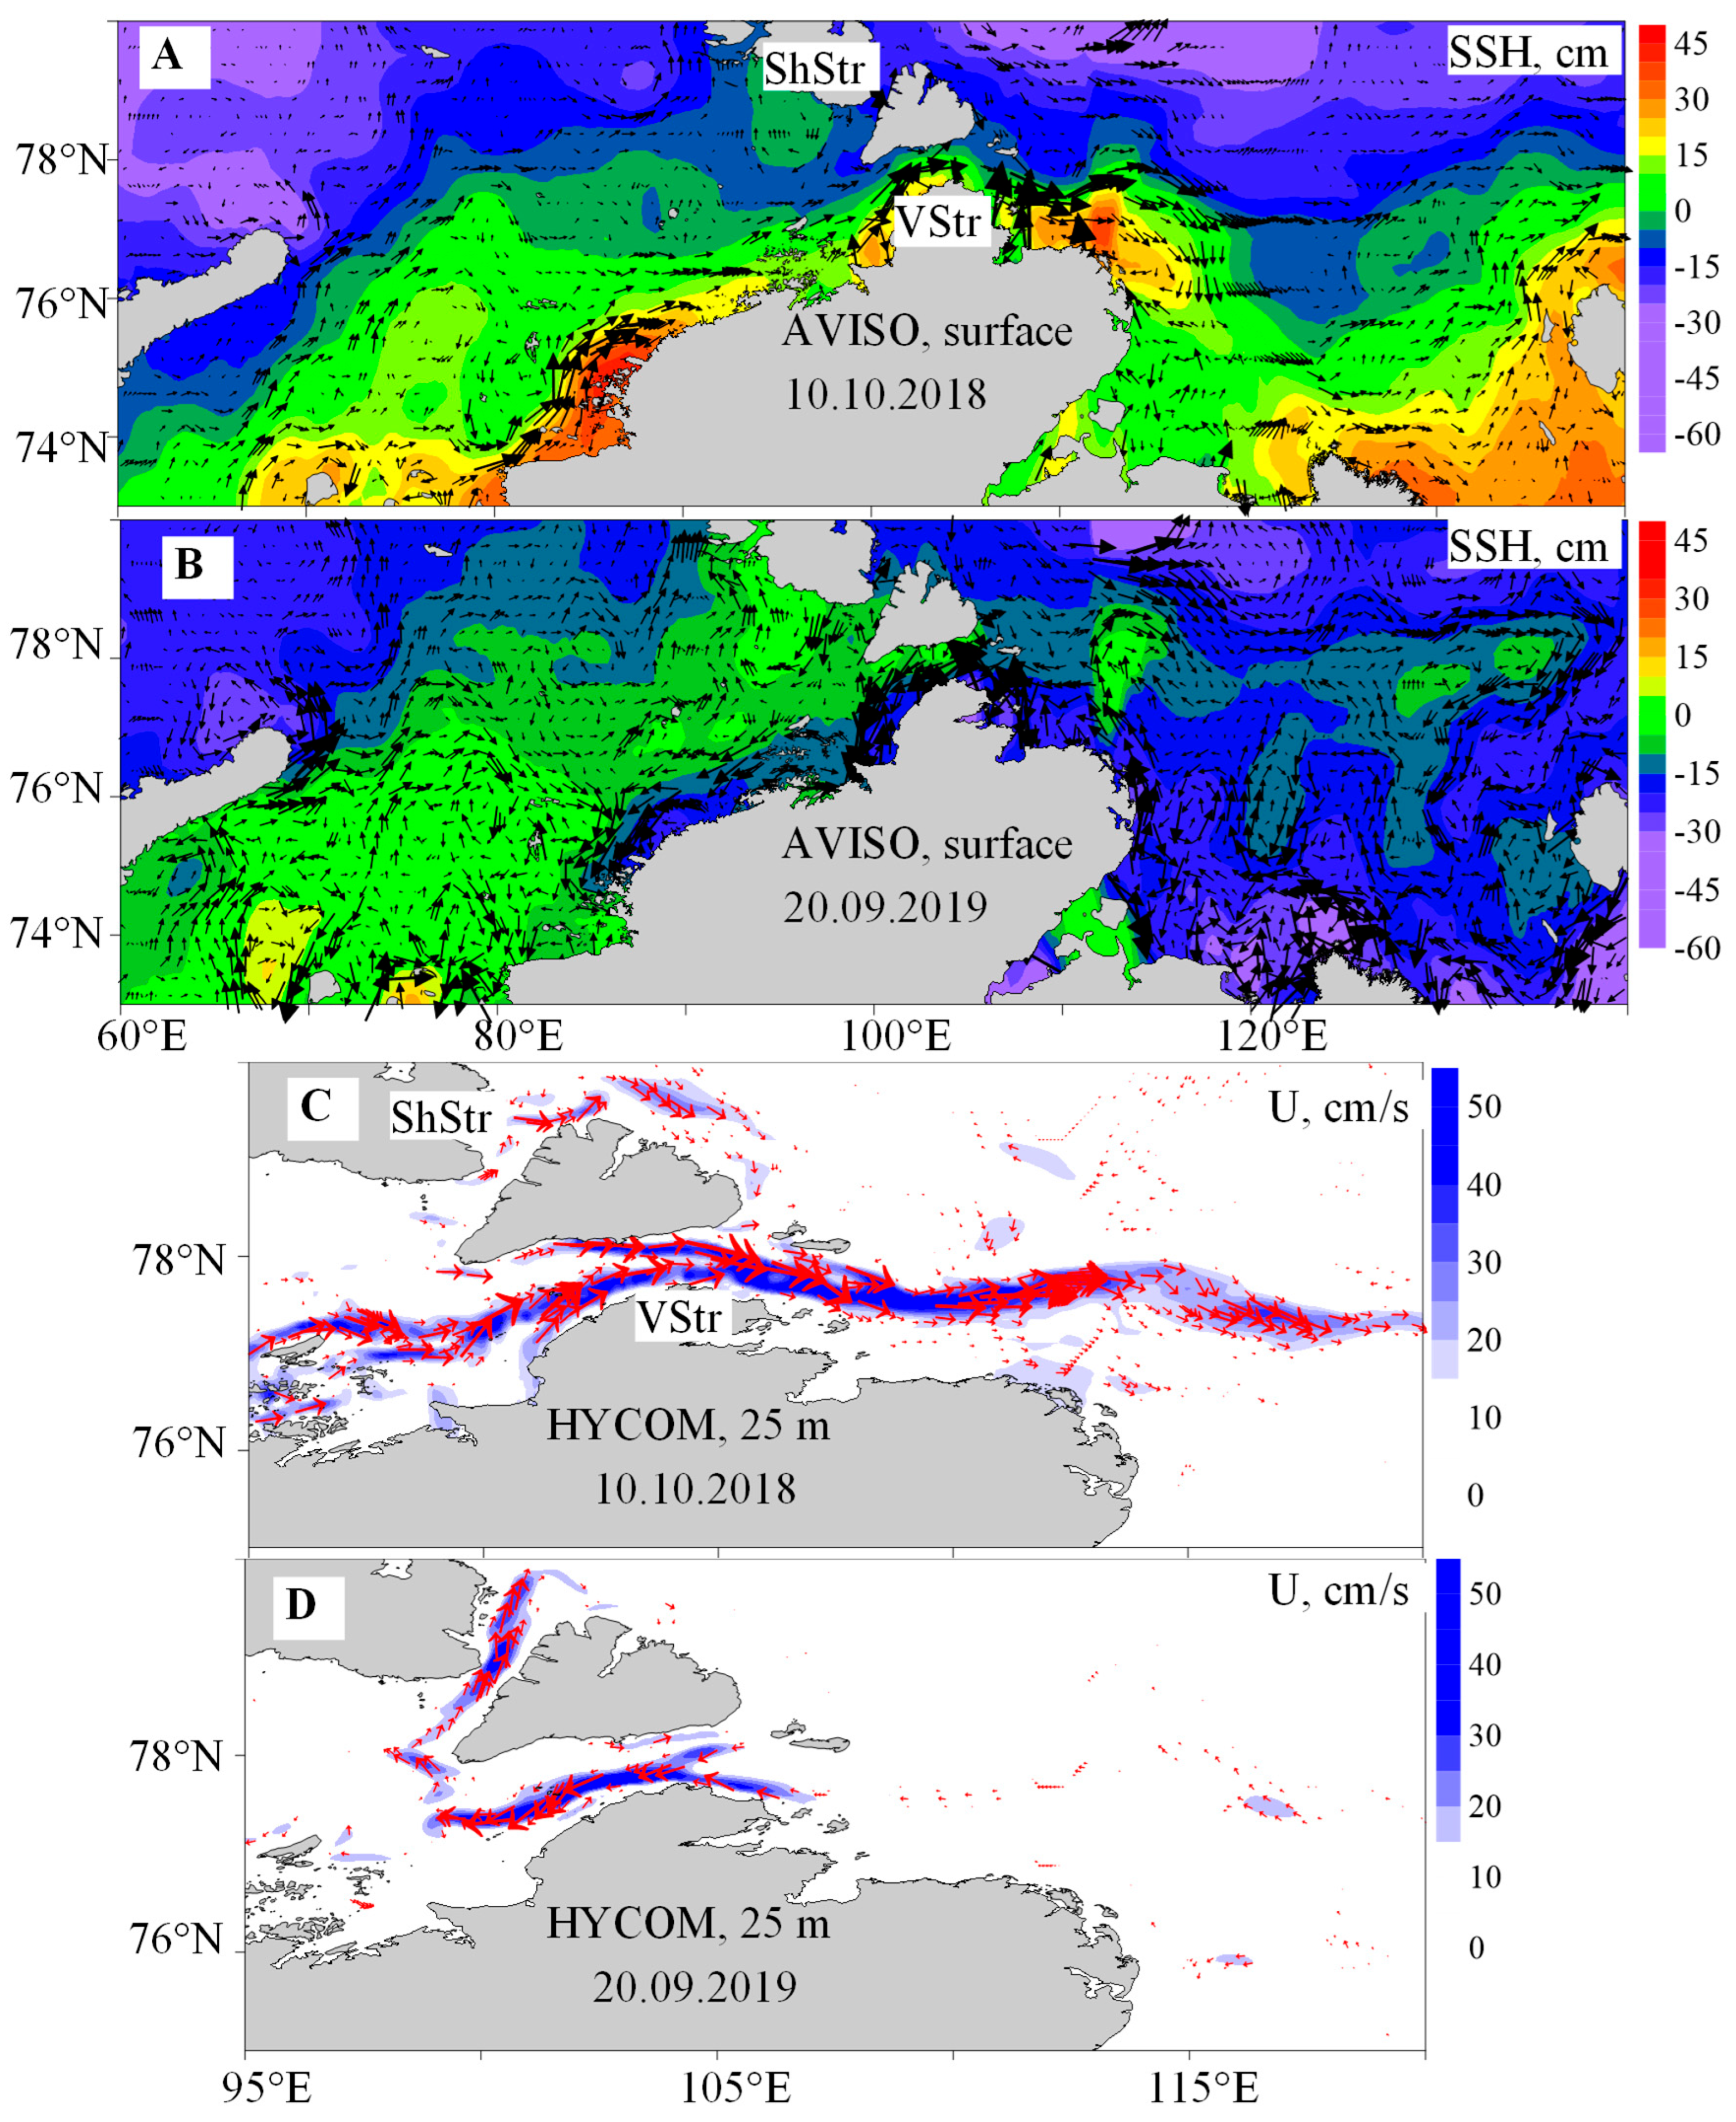
The average (May–October) Lena River outflow was approximately 38,000 m3/s in 2007 and 2008, 34,500 m3/s in 2018, and 24,500 m3/s in 2019 and 2024. The wind direction had a significant impact on the spatial and temporal variability of the SSH and geostrophic currents (determined by horizontal SSH gradient) in the study area. In August–October 2007 and September–October 2018, westerly winds prevailed over the Laptev Sea (Figure 2B). The increased river discharge and westerly wind resulted in eastward, along-shore currents in the KS and LS in October 2018 (Figure 3A,C). During this period, the water circulation pattern in the LS was a regular one [22,23]. The water from the KS was advected to the LS through VStr, and then, it was transported eastward to the eastern LS. In the subsurface layer (depth of 25 m), there was an intensification of the water flow (velocity of 30–40 cm/s) through the VStr (Figure 3C).
The easterly (upwelling favorable) winds in September 2019 forced a decrease in the SSH near the shore and the formation of the anticyclonic water circulation in the surface layer of KS and LS (Figure 3B). During this period, the water circulation was characterized by westward flow along the shore and eastward water advection in the central parts of the basins. In the subsurface layer, the KS shelf water was advected into the LS through the Shokalsky Strait (Figure 3D).

3.2. Chemical Parameter Distributions

3.2.1. Nutrients and AOU in 50–250 m Layer of KS and LS

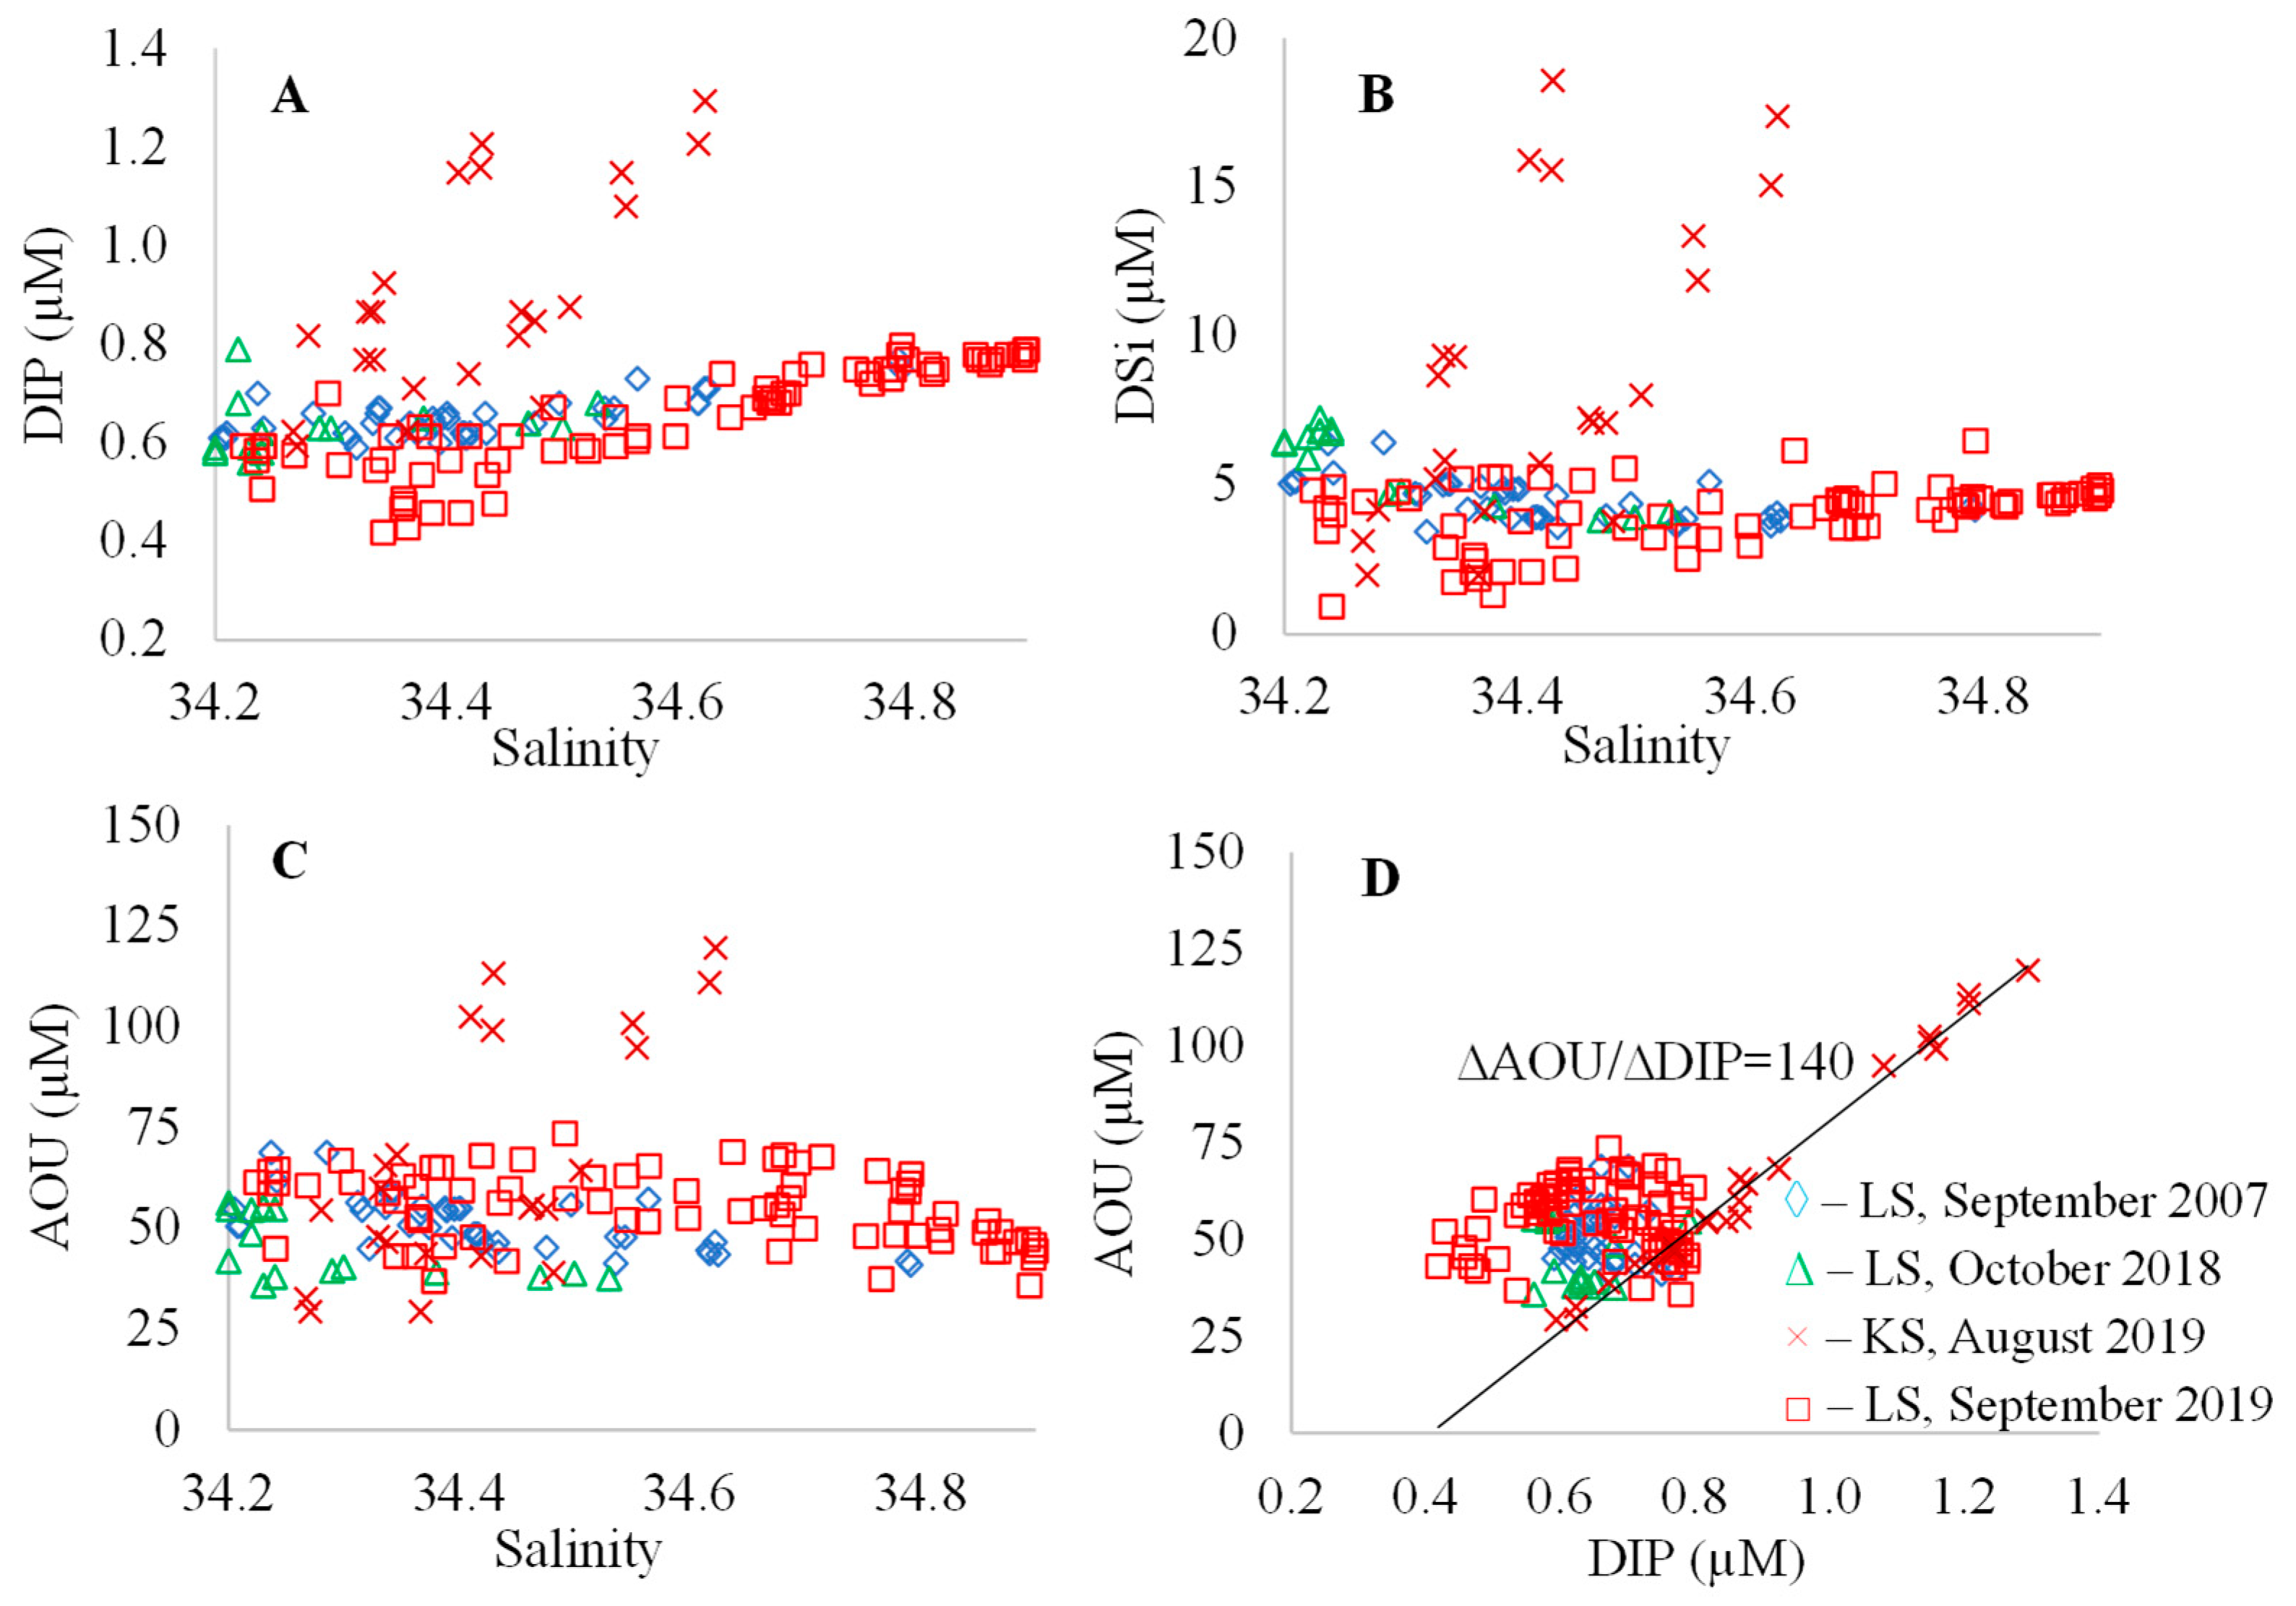
The data collected in 2007, 2018, and 2019 show that the distributions of AOU and nutrients in the 50–250 m layer (salinity of 34.2–34.9) of the LS were quite uniform (AOU = 54 ± 9 (STD) µM, DIP = 0.66 ± 0.10 µM, DSi = 4.6 ± 1.3 µM, N = 145) (Figure 4). In the subsurface layer (50–200 m) of the KS (August 2019), waters with high AOU (95–120 µM), DIP (0.8–1.3 µM), and DSi (8–18 µM) values were observed (Figure 4). The ratio between AOU and DIP changes (equal to 140) indicates that an increase in DIP and AOU in the subsurface layer of the KS was due to organic matter degradation [35].

3.2.2. KS and LS. August- September 2019 and September–October 2024

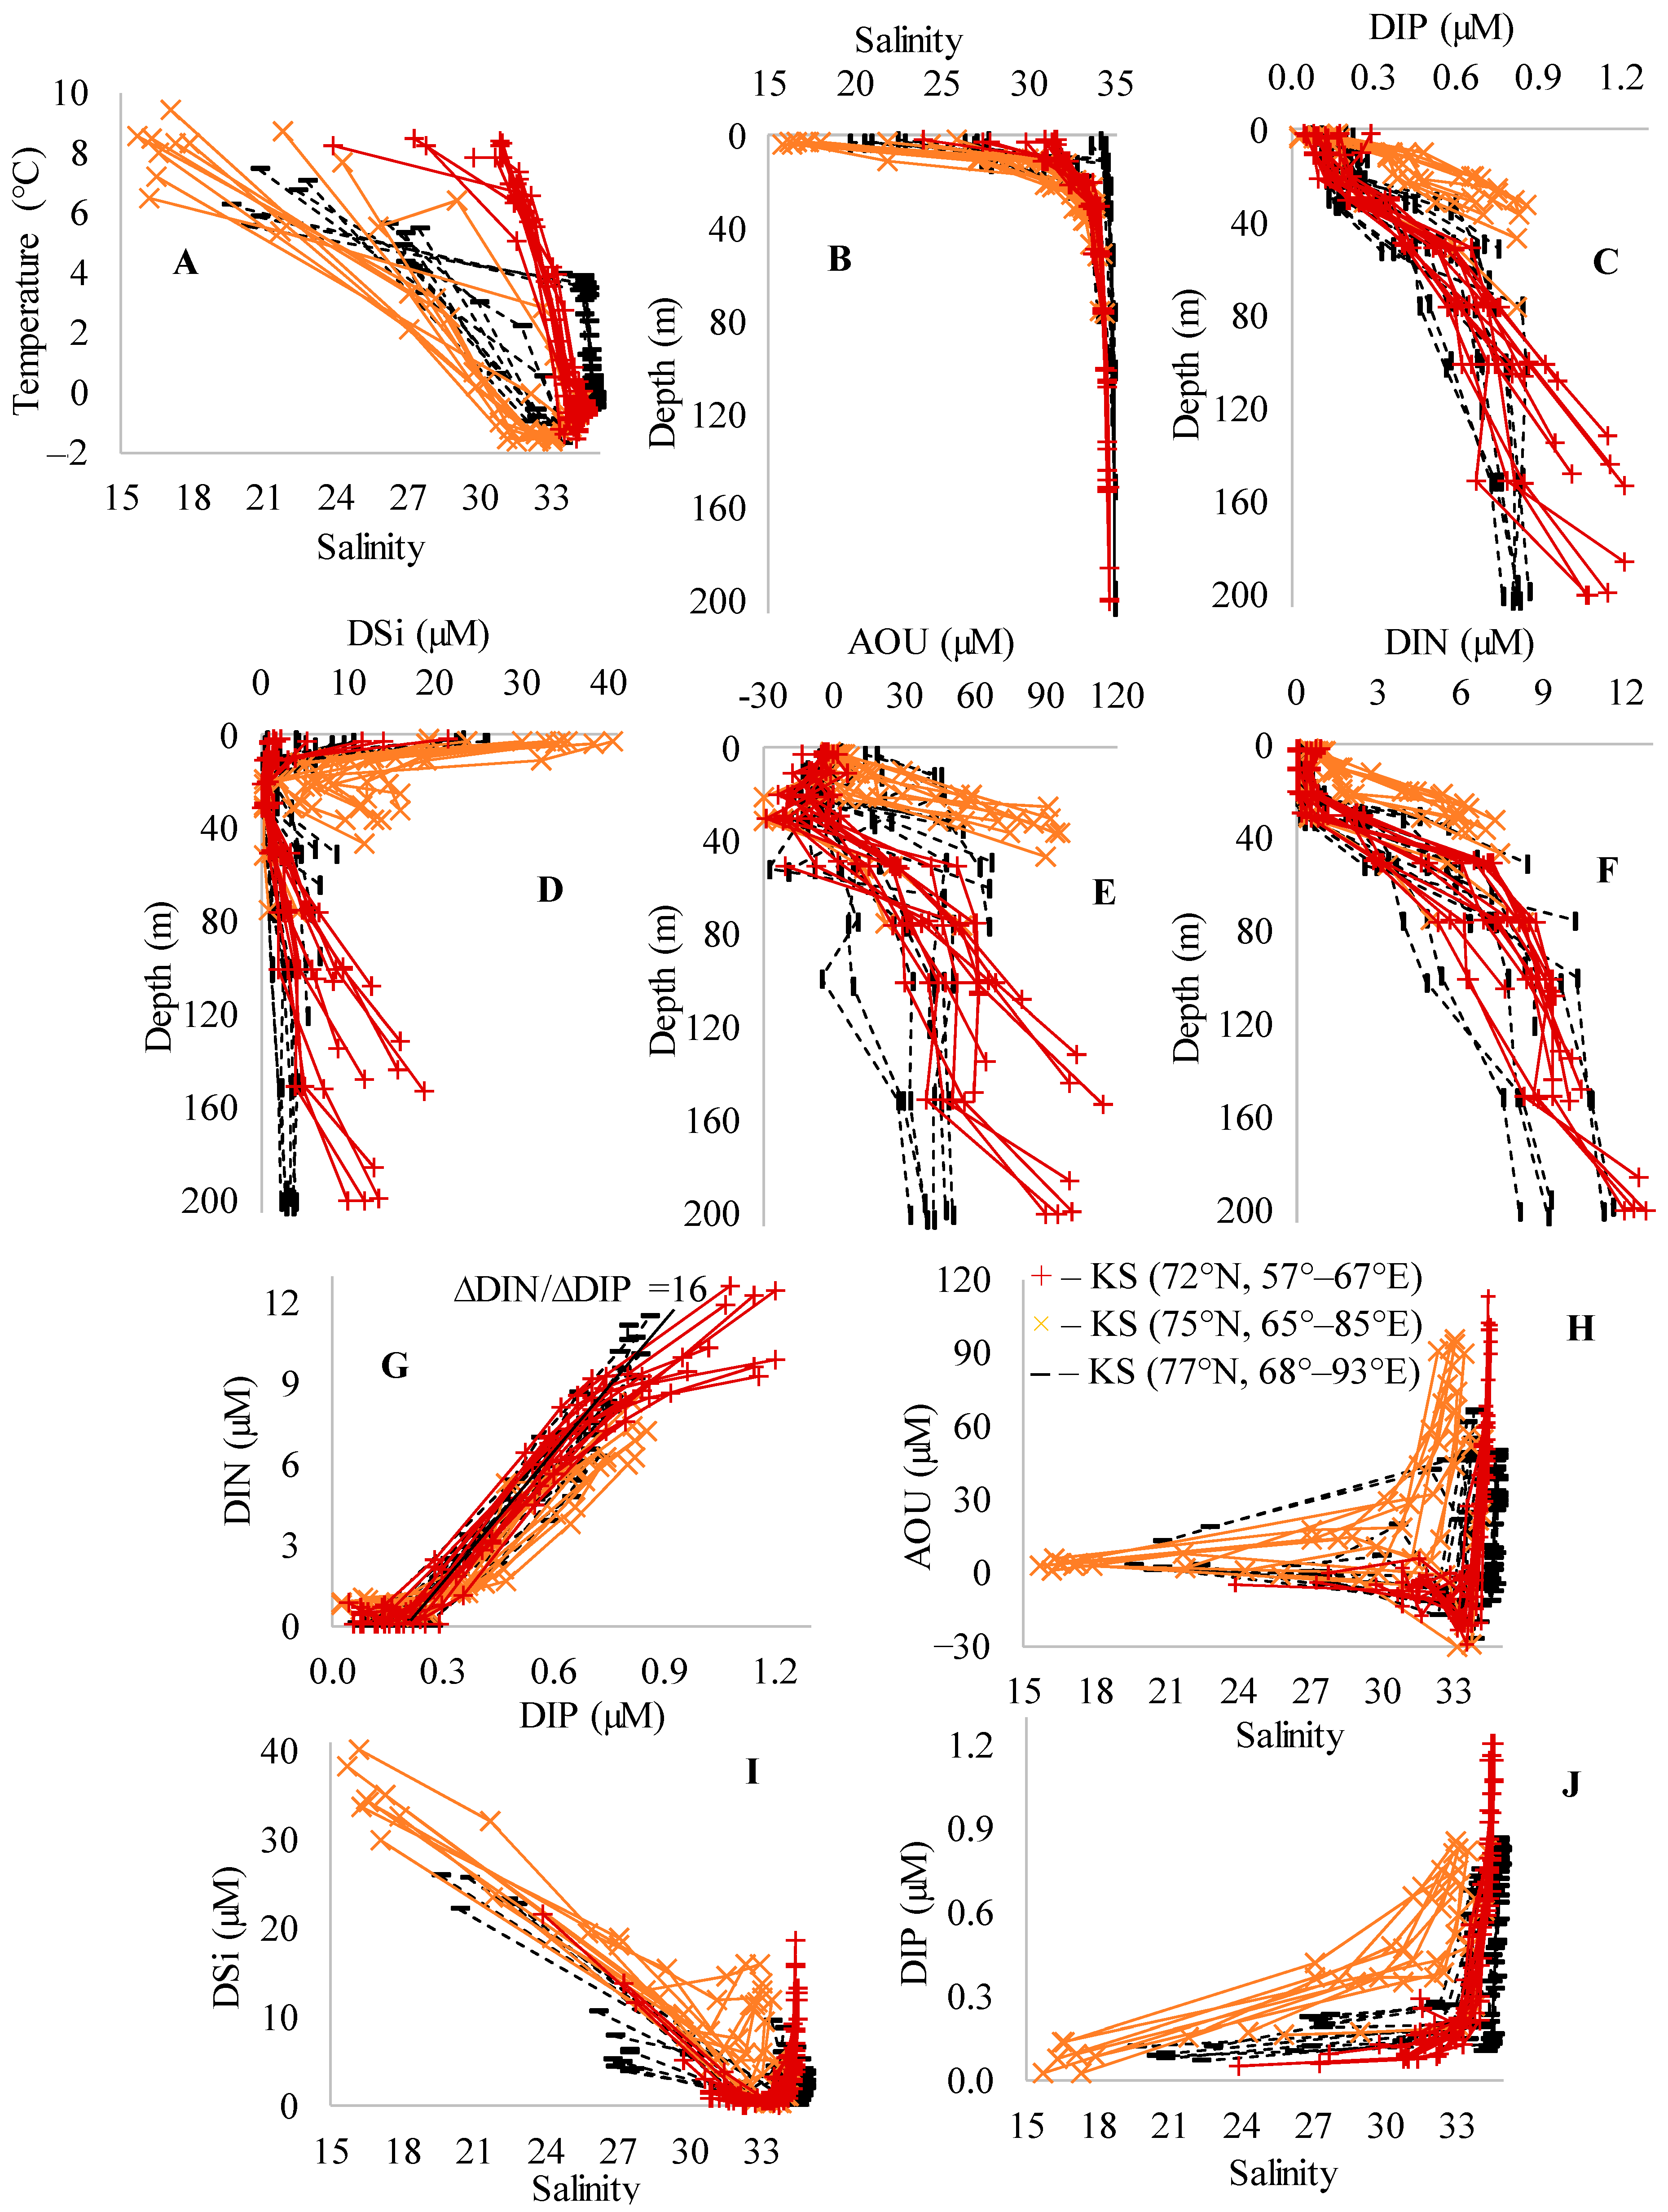
In August 2019, the surface layer in the shelf area of KS (72° N, 58–66° E; 75° N, 66–85° E; 77° N, 71–93° E) was characterized by low salinity (16–27) and a temperature of 5–9 °C. In the subsurface layer (30–200 m), the salinity and temperature ranged from 32.7 to 34.5 and from−1.5 °C to 0 °C, respectively (Figure 5A). In the deep part of the KS (depth of 250–500 m, 77° N, 68–71° E), the salinity (temperature) increased (decreased) from 33.3–34.3 (2–3 °C) on the horizon of 30 m to 34.6–34.8 (−0.6–0 °C) on the horizon of 200 m (Figure 5B). The salinity in the subsurface layer was close to and exceeded the threshold (≥33.5) used for defining the ADW [1].
In the shelf area of the KS, the halocline/pycnocline (5–20 m) provided two-layered chemical parameter distributions with increased AOU (50–110 µM), DIP (0.7–1.2 µM), DIN (4–12 µM), and DSi (10–18 µM) in the subsurface water (30–200 m) overlain by low DIP (<0.20 µM), DIN (<2 µM) and high DSi (20–40 µM) surface water (Figure 5C–F). High DSi (25–40 µM) in the surface layer of KS was associated with low salinity (15–21) water (Figure 5H) due to Ob and Yenisey river outflows.
In the deep part of the KS, the subsurface layer was composed of ADW with DSi of 3–7 µM, DIP of 0.5–0.8 µM, and DIN of 4–10 µM. The negative values of AOU (−30–−10 µM) on the horizons of 20, 30, and 50 m were an indicator of photosynthesis over organic matter degradation. The satellite chlorophyll images (Figure S1) show the shift of high chlorophyll spots from the shelf to the deep part of the KS (northwestern KS) between June and July 2019 and August 2019. The linear approximation of DIN vs. DIP (DIN = 16∙DIP + 0.2, µM) demonstrates that the ratio between changes (due to photosynthesis/organic matter degradation) in DIP and DIN for the deep basin water was close to the ratio of Redfield (16) [35] (Figure 5G). At a DIP concentration of 0.8 µM, the concentration of DIN in the KS shelf water was lower (about 8 µM) than that in the ADW (about 10 µM). The DSi, DIP, and AOU vs. salinity indicate an accumulation of nutrients (due to organic matter degradation) in the bottom layer of the shallow part of the shelf (30–50 m, salinity about of 33.0, temperature of −1.6–−0.4 °C) and the deep part of the shelf (100–200 m, salinity of 34.4–34.5, temperature of −0.7–−0.2 °C) (Figure 5H–J).
The nutrient concentrations observed in the KS in 2019 are in good agreement with those observed in 1985 (“Academician Shuleikin”, August 1985) [36], 1993 (R/V “Dmitry Mendeleev”, September 1993) [19], and 2011 (R/V “Academician Mstislav Keldysh”, September 2011) [19]. In August 1985, the subsurface layer (20–40 m) of the central KS was characterized by negative temperature (−1.4–−1.6 °C), salinity of 32.5–33.5, DIP of 1.0–1.4 µM, DSi of 18–21 µM, DIN of 5–9 µM, and high values of AOU (150–200 µM) [36]. The distribution of nutrients on the meridional transection along 79° E presented by Makkaveev et al. [19] demonstrated that the subsurface layer (35–60 m) of the central KS (74–76° N) in September 1993 and September 2011 was characterized by salinity of ≥33, DSi of 10–20 µM, DIP of 0.6–1.4 µM, and AOU of 100–200 µM.
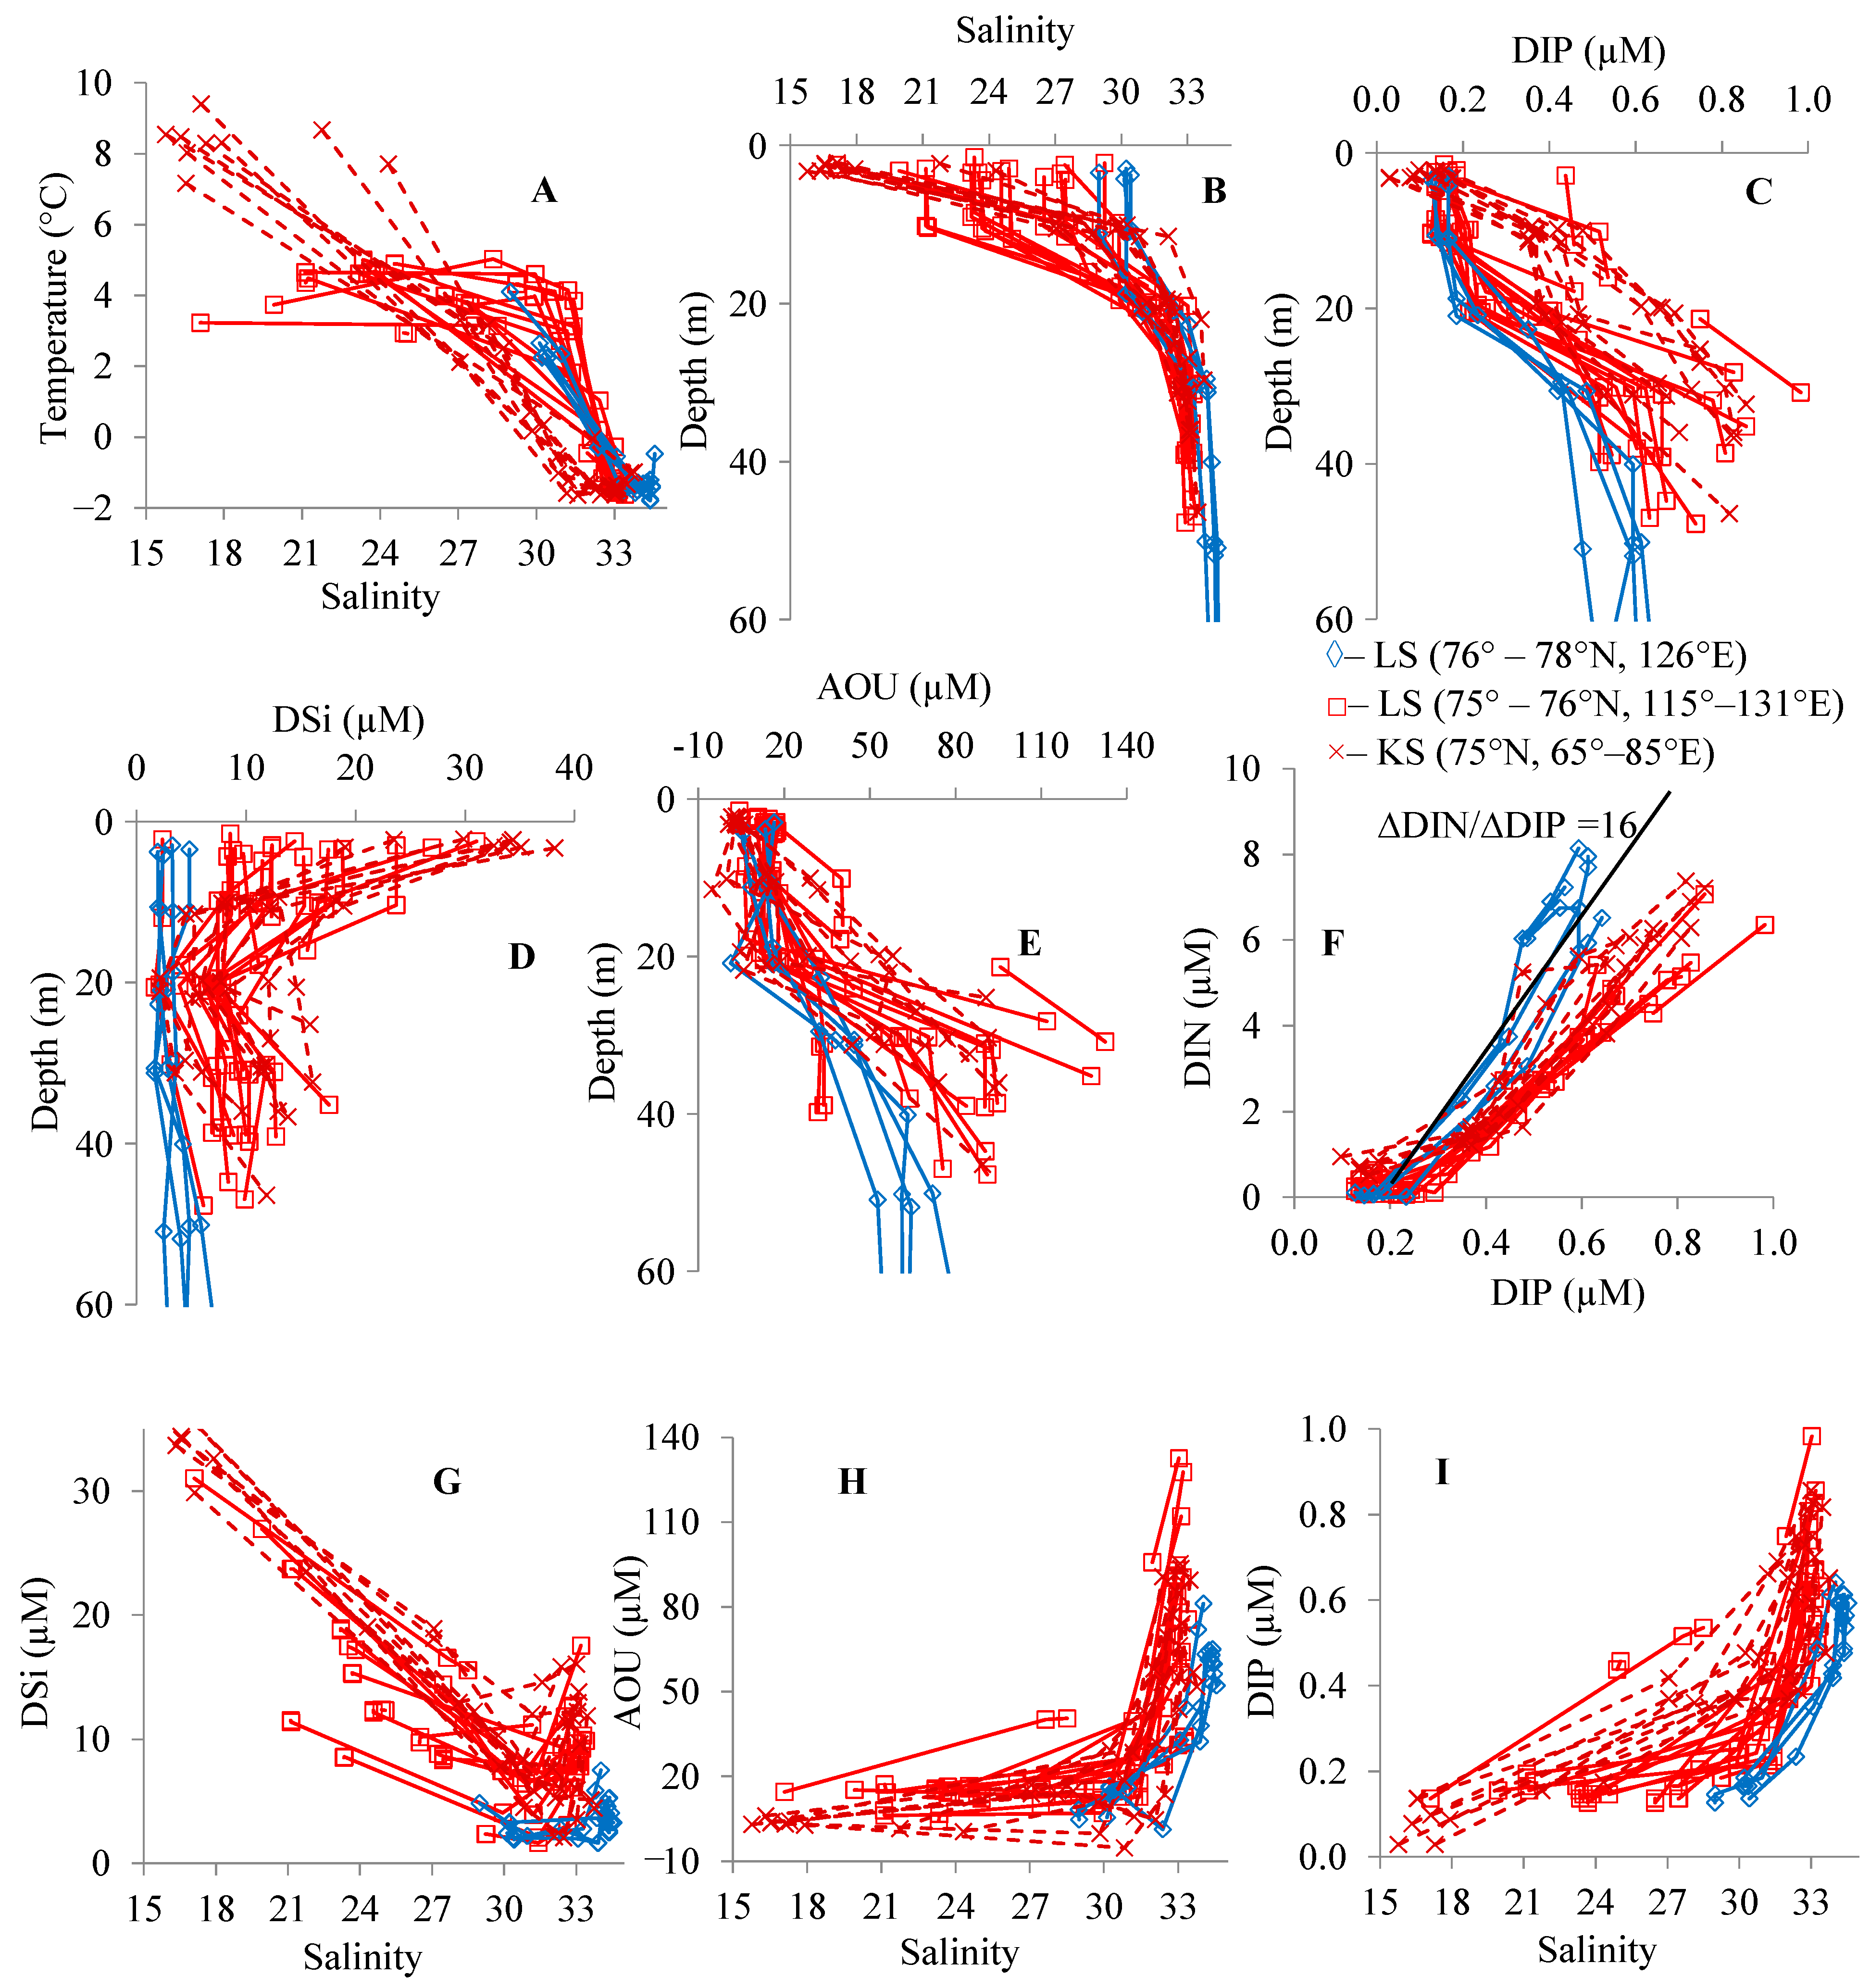
Figure 6 demonstrates the distribution of salinity, DIP, DSi, and AOU in the shelf and continental slope zones of the western and central LS in September 2019. We added to Figure 6 the data collected on the shelf of the KS in August 2019. In the subsurface layer (30–50 m) of the LS, two types of water were observed. The area northward of 76° N (76–78° N, 126° E) was characterized by high salinity (33.90–34.55), temperature of −1.5–−0.5 °C, DIP of 0.4–0.6 µM, DSi of 2–6 µM, and AOU of 47–72 µM. The observed salinity and nutrient concentrations were close to those in ADW (salinity ≥34.5, DIN~ 8–10 µM, DIP~ 0.6–0.8 µM, and DSi~ 4–5 µM). In the area between 75° N and 76° N (115–131° E), the subsurface layer was filled by water with a salinity of 32.9–33.2, temperature of about −1.5 °C, DIP of 0.6–0.9 µM, DSi of 8–16 µM, and AOU of 70–132 µM. The regression curve (DIN = 16∙DIP + 0.2, µM) computed for ADW in the KS (77° N, 68–93° E, Figure 5G) quite well describes the DIN vs. DIP data collected at the shelf margin and slope area (76–78° N) in the LS (Figure 6F). The DIN concentration in the subsurface layer of the middle shelf (75–76° N) in the LS was lower at 2–3 µM (similar to the KS) than the DIN concentration (7–8 µM) in the shelf margin/slope area. The concentration of DSi was equal to 25–40 µM at a salinity of 16–21, decreased to 5–8 µM at a salinity of 31, and then it increased up to 16 µM at a salinity of 33 (Figure 6G). The AOU and DIP were characterized by values of 0–30 µM and 0–0.4 µM at salinity of 16–30 and values of 55–130 µM and 0.4–0.9 µM at salinity of 33 (Figure 6H,I). Except for the bottom layer at shallow stations (depth of 28–35 m, AOU of 112–132 µM), the temperature, salinity, AOU, and nutrient concentrations in the western and central parts of the LS in September 2019 were similar to those observed in the KS (75° N, 65–85° E) in August 2019 (Figure 6). The similar nutrient concentrations and salinities between the shelf water of the KS and the western/central shelf of the LS could indicate the same water origins of the subsurface water masses in the LS and KS.
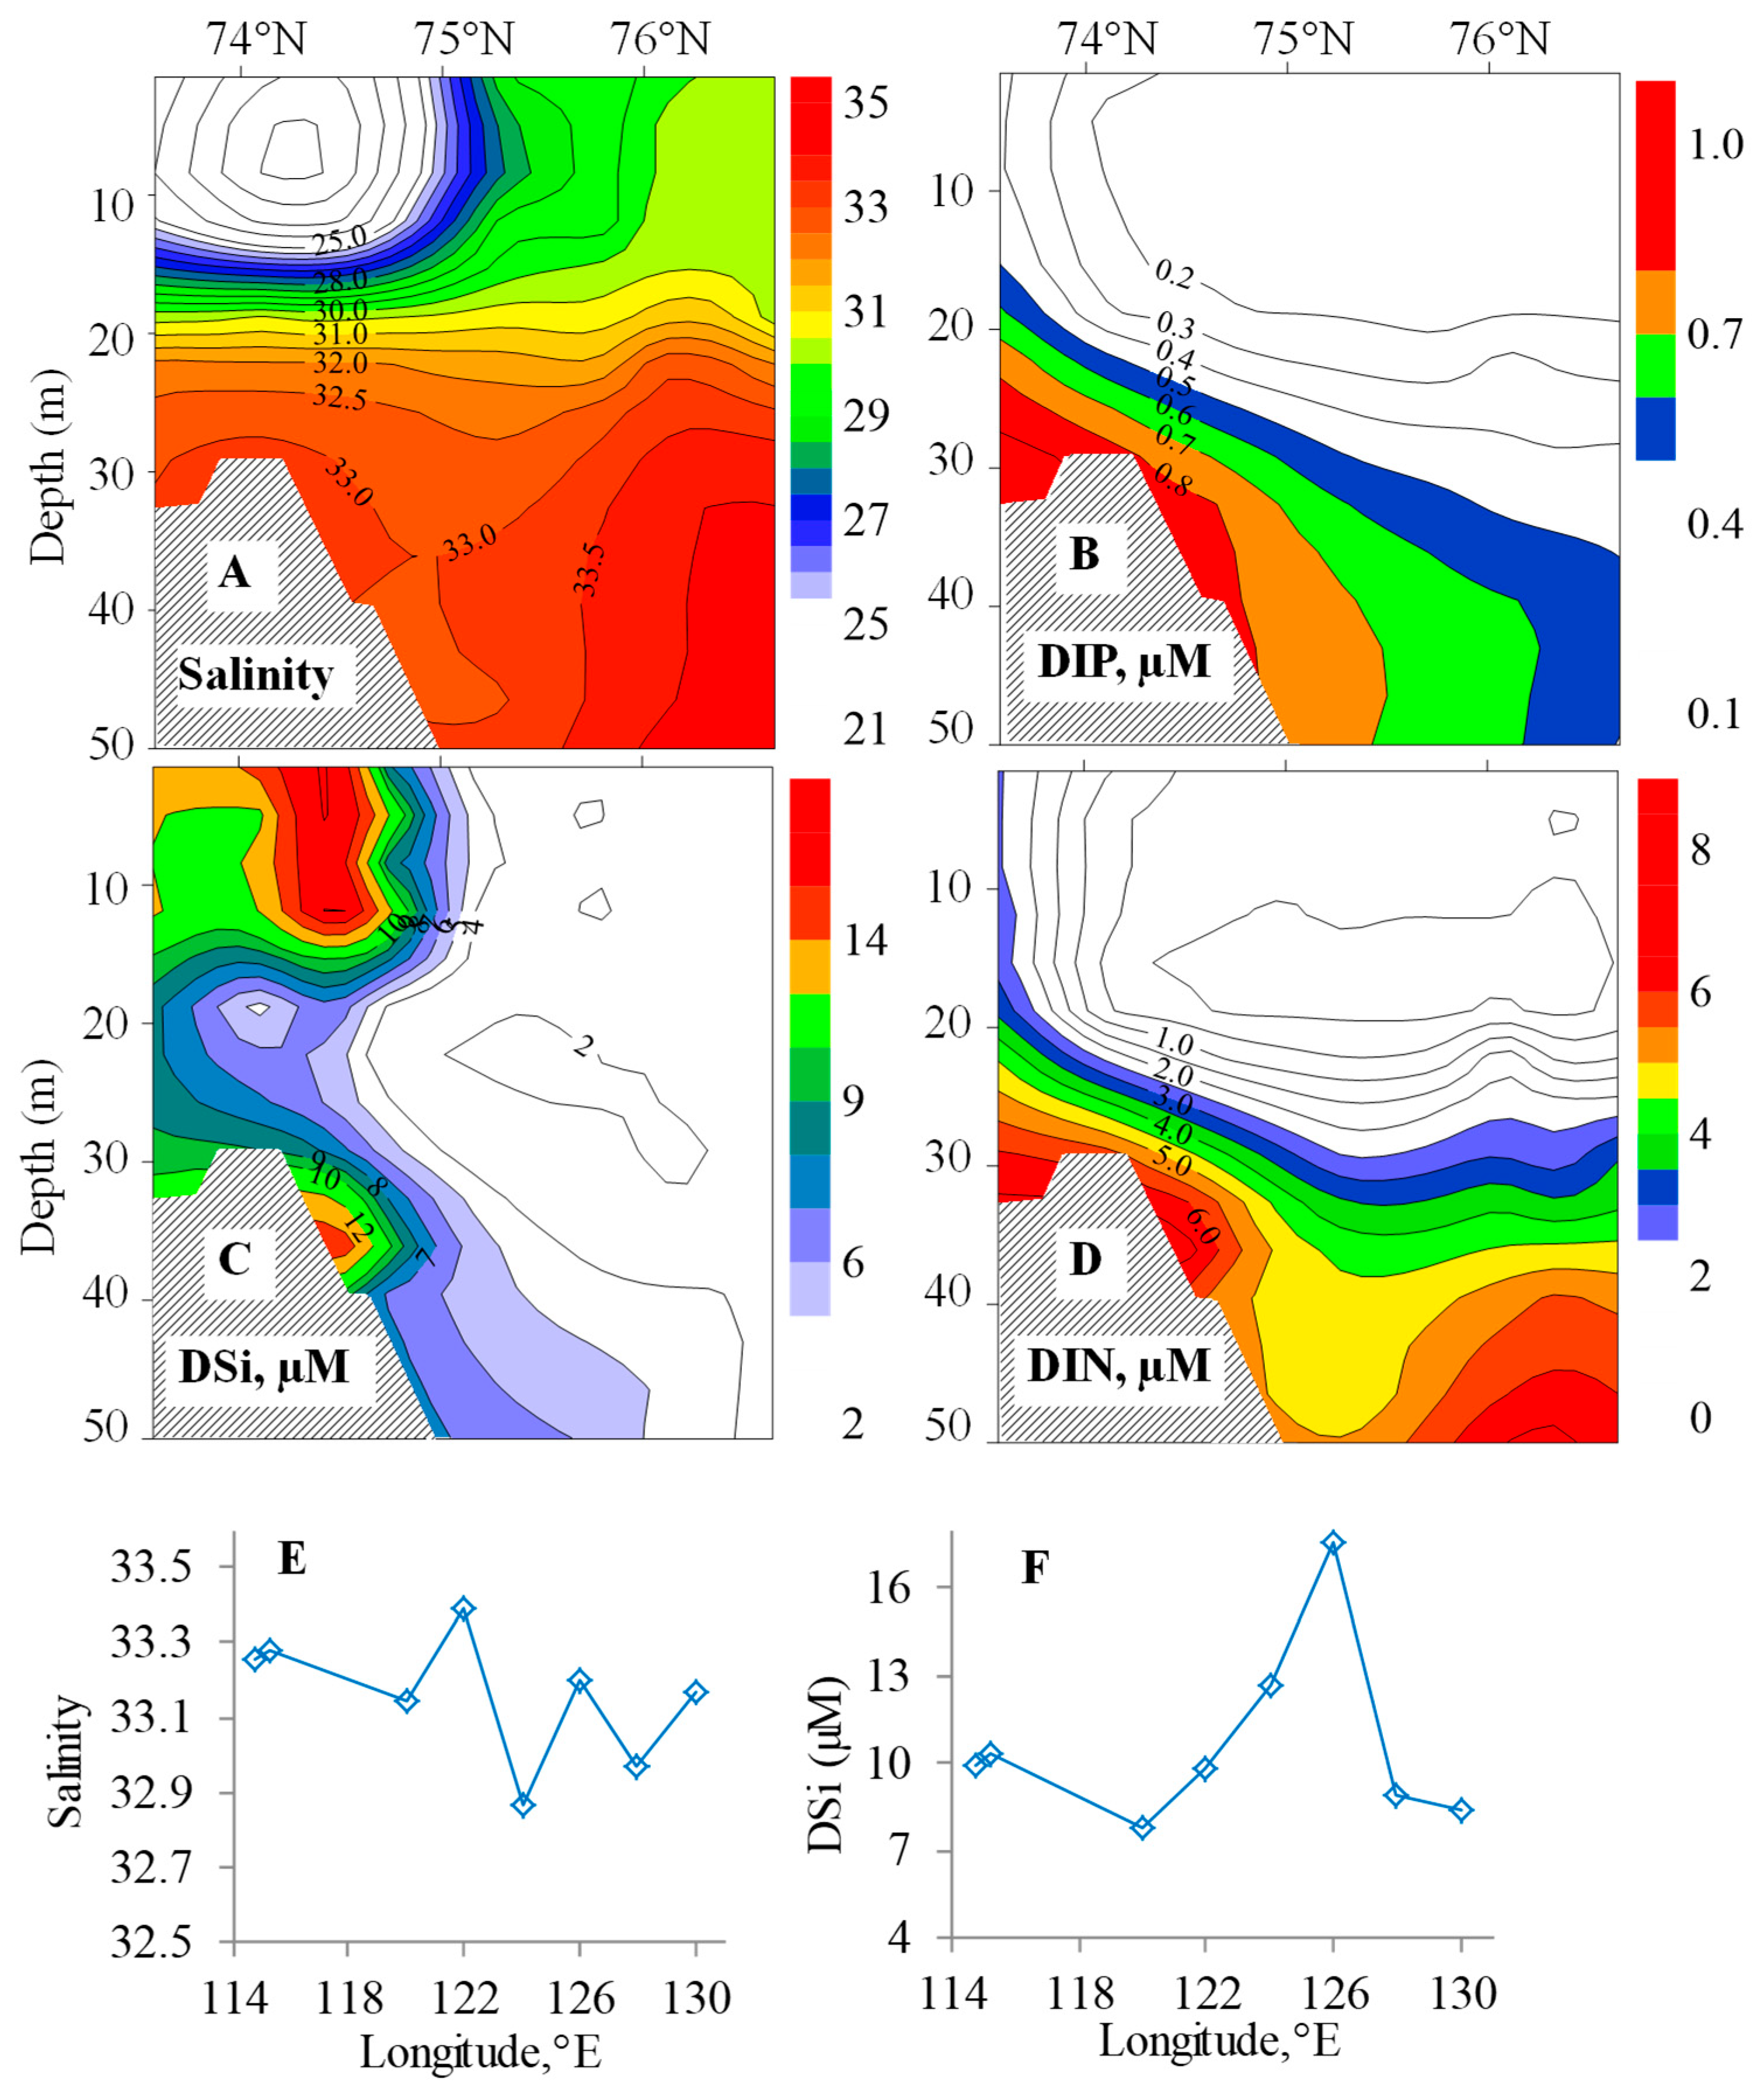
Figure 7A–D shows the meridional sections of salinity, DIP, DSi, and DIN in the central part of the LS (126° E) during the prevailing of easterly (upwelling favorable) winds (September 2019). The easterly winds forced an offshore (northward) shift in the low salinity and high DSi (>20 µM) of coastal water in the surface layer and an onshore supply of subsurface water with a salinity of 33 and increased concentrations of DIP, DSi, and DIN.
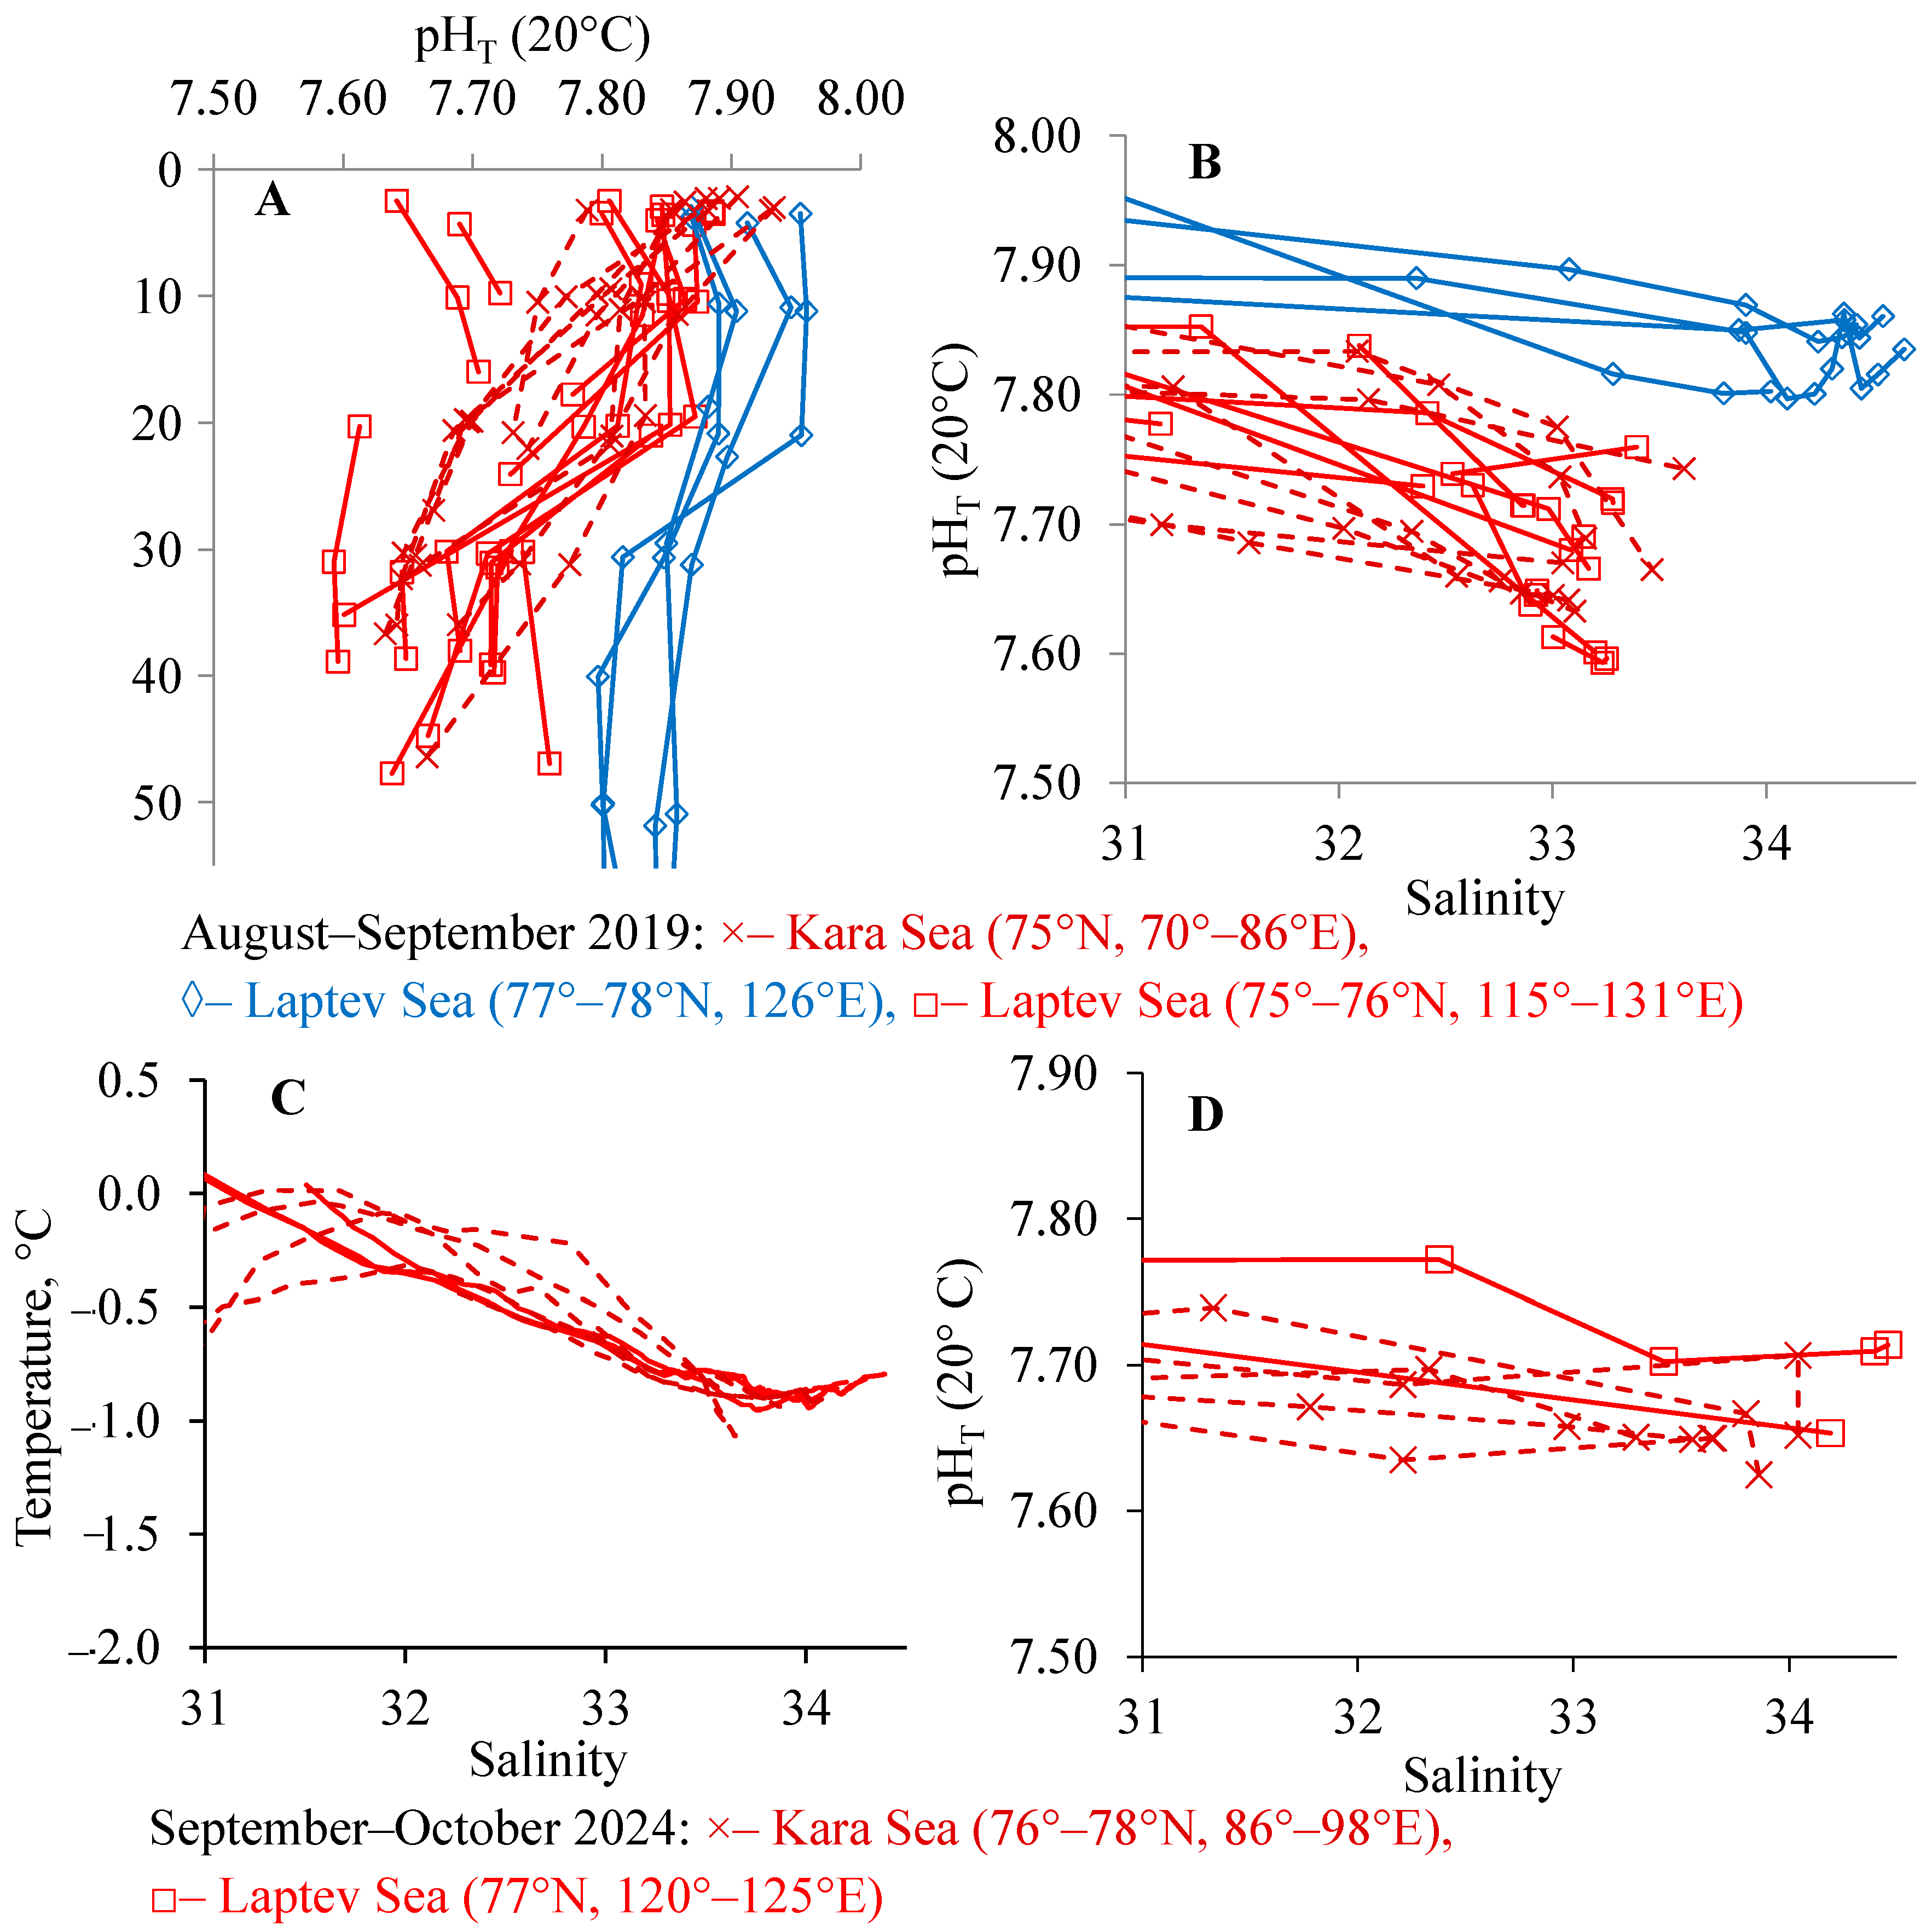
During the synthesis (destruction) of organic matter, dissolved inorganic carbon and nitrate are consumed (released), which is accompanied by an increase (decrease) in pH [35]. Low pH in the Arctic Ocean is an indicator of high seawater pCO2 and undersaturation relative to the aragonite and calcite [37]. In August–September 2019, in the KS and LS shelf areas, pHT decreased from 7.80–7.90 pH unit in the surface layer to 7.60–7.75 pH unit in the subsurface layer (depth of 30–50 m). Similar to AOU and nutrients (Figure 6), in the salinity range of 33.0–34.3, pHT in the western and central part of the LS shelf (75–76° N, 115–131° E) was equal to those in the subsurface layer of KS shelf (75° N, 70–86° E) (Figure 8A,B). In the deeper part of LS (77–78° N, 126° E), pHT was higher than pHT in the central shelf of LS by about 0.15 pH units.
Ship-borne data collected in the KS and LS in September–October 2024 indicate that KS shelf derived water with a temperature of −1–0 °C, salinity of 32–34, and pHT of 7.65–7.70 pH unit was observed in the deep shelf (depth of 100–150 m) part of LS (77.1–77.2° N, 120–125° E) (Figure 8C,D).

3.2.3. LS. September 2007, August 2008, and October 2018

In September 2007, oceanographic observations were conducted in the trough zone of the central LS (75.5–78° N, 122–124° E). The surface layer in the study area was characterized by decreased temperature (−1.5–1 °C), increased salinity (29.5–31.5), DIP of 0.1–0.2 µM, and DSi of 1–2 µM (Figure S2). The subsurface layer (30–75 m) in the deep part of the trough (76.5–78° N) was occupied by ADW with a salinity of 34.5–34.6, temperature of −1.5–0 °C, DIP of 0.6–0.7 µM, DSi of 4–5 µM, and AOU of 45–55 µM.
In the shallow part of the trough (75.5–76.5° N), the subsurface layer was composed of water with a salinity of 33.3–34.0, temperature of −1.5–0 °C, DIP of 0.6– 0.8 µM, DSi of 5– 10 µM, and AOU of 50–100 µM. The DSi, AOU, and DIP vs. salinity show that the water mixing between the KS shelf water with a salinity of 33.0 and ADW with a salinity of 34.5–34.6 determined the AOU and nutrient concentrations in the subsurface layer of the central LS shelf (75.5–76.5° N, 120–122° E) in September 2007 (Figure S2D–F). The KS shelf water enriched the subsurface layer of the LS with DIP and DSi but led to low DO concentrations (high AOU values).
In August 2008 and October 2018, ship-derived data were collected on meridional transection in the eastern part of the LS (130° E). The southern portion of the transect was located near the Lena River delta (Figure 1). There was no difference in the monthly Lena River discharge between July/September 2008 and July/September 2018 (Figure 3A), but there was a difference in wind forcing. The study area was influenced by easterly (upwelling favorable) winds in July–August 2008 and westerly (downwelling favorable) winds in September- October 2018 (Figure 3B).
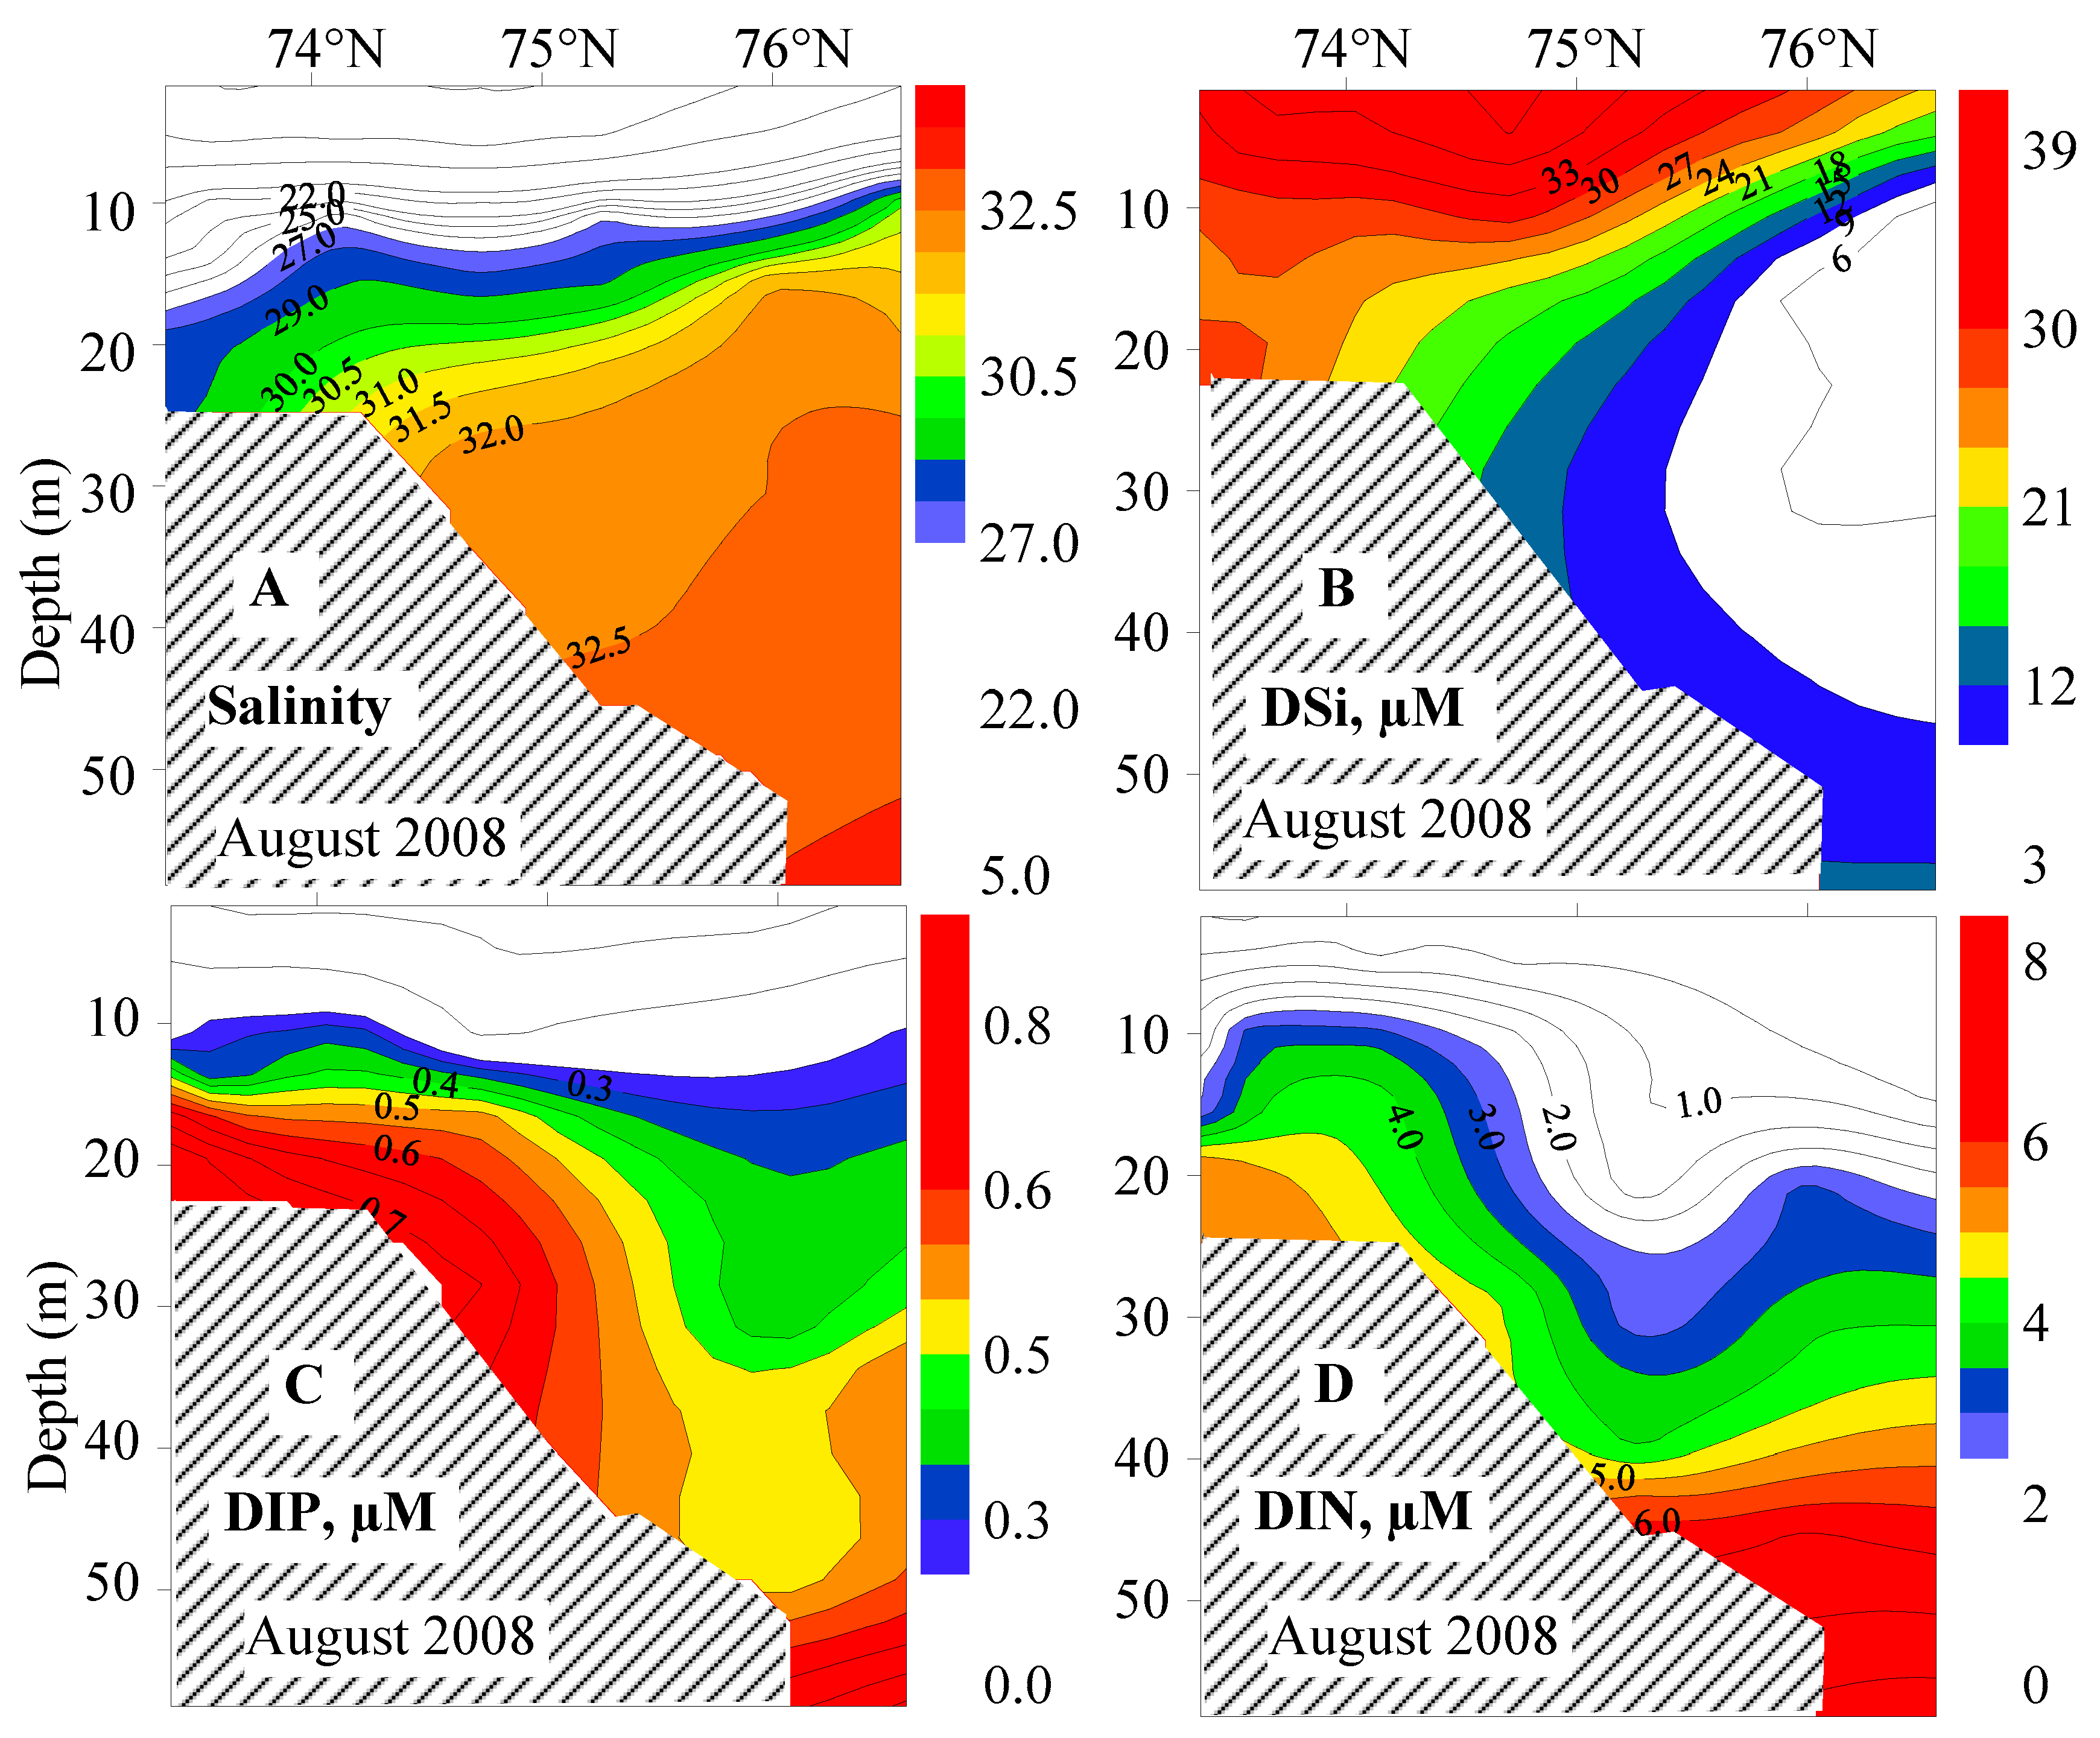
Sections of salinity, DSi, DIN, and DIP indicate the upwelling of subsurface water with increased salinity, DIN, and DIP concentrations but low DSi in the shallow part of the LS shelf in August 2008 (Figure 9A–D). Low-salinity surface water prevented the penetration of subsurface water into the upper surface layer, but upwelling led to the upward doming of the isohaline and isolines of DIN and DIP. The subsurface layer (25–55 m) was filled with water with a salinity of 31–33. The KS-derived shelf water and ADW were not observed on the shelf of the western LS in August 2008, but the influence of the KS shelf water could be seen from the salinity versus DSi, DIN, and DIP diagrams (Figure S3A–C). The diagrams show that the salinity and nutrient concentrations in the subsurface layer of the LS were determined by mixing of KS-origin shelf water with salinity of 34.4, DSi of 16–18 µM, DIN of 10 µM, and DIP of 1.2 µM, and water with salinity of 31, DSi of 4 µM, DIN of 1 µM, and DIP of 0.3 µM.
In September–October 2018, eastward water flow prevailed in the KS and LS shelf zones. The map of current velocities (Figure 3A) shows the advection of the KS shelf water to the LS through VStr and its transport to the eastern part of the LS by the geostrophic current. In October 2018, the subsurface layer of the northern part of the LS shelf (76.4–77.1° N, 125–128° E) was occupied by modified ADW with salinity of 34.0–34.2, DIP of 0.6 µM, and DIN of 9 µM and decreased DSi (6 µM) and AOU (50–70 µM). A significant difference in salinity and DSi between the southern (salinity of 10–14, DSi of 25–30 µM) and northern (salinity of 30, DSi of 3–7 µM) LS shelf was observed. In the southern part of the shelf (73–75° N, 130° E), the subsurface layer is characterized by salinity of 24.3–33.4, DIP of 0.6–0.9 µM, DIN of 6–9 µM, and high values of DSi (18–28 µM) and AOU (110–150 µM). Due to the gap in the ship-borne data (75–76.4° N), a detailed study of the frontal zone separating the low- and high-salinity water was not conducted. The subsurface waters of the LS with a salinity of 32.0–33.4, DIP of 0.8–0.9 µM, DIN of 5–7 µM, DSi of 18–24 µM, and AOU of 130–150 µM were close to the nutrient concentrations and AOU values in the KS shelf water with a salinity of 34.4 (Figure S3D–F).

4. Discussion

The distribution of AOU and nutrients in the LS is an indicator of water mass origin and biological processes (photosynthesis/organic matter degradation). Previous studies have assumed that the distributions of macronutrients (DIN, DIP, and DSi) in the LS reflect the interplay between marine (ADW) and riverine inputs, nutrient consumption by phytoplankton, and nutrient remineralization from the decomposition of organic matter [13,14,15,16,17,38]. High nutrient concentrations in the bottom water of the LS could not be explained by phytoplankton decomposition [38]. The increased DIP and DIN concentrations in the subsurface layer of the LS shelf could be explained by the onshore advection of high-salinity ADW water (DIP of 0.6–0.8 µM, DIN of 8–10 µM, and DSi of 4–5 µM). The formation of excess DIP (>0.8 µM) and high DSi (>10 µM) concentrations in the bottom water is related to sea–ice-derived brine formation, the low primary productivity rate in winter [2], and the resuspension of bottom sediment due to cooling and strong winds [17].
We demonstrate that an inflow of the KS shelf water with a salinity of 33.0–34.5 results in high nutrient concentrations, high AOU values (low DO concentration), and low pH in the subsurface layer of the LS. The KS is a favorable location for the formation of subsurface water with high nutrients and low DO concentrations due to the existence of the deep shelf (100–200 m) (Figure 1). A deep shelf is necessary for nutrient accumulation because of the prevalence of organic matter decomposition over photosynthesis below the euphotic layer [35]. The deep shelf in the LS is small. The subsurface water of the KS shelf is formed by negative temperature and high salinity/density water (dense shelf water) [22]. The high salinity/density of the KS shelf water protects it from mixing (induced by winds and tides) with surface water (characterized by low salinity and low nutrient concentrations) when transported to the LS.
The lower boundary of the euphotic layer in the LS and KS in summer ranges from depths of 14–35 m (inner part of the shelf) to 40–70 m (continental slope and deep basin) [24,25,39]. In the coastal part of the KS shelf, light-absorbing substances, such as colored dissolved organic matter (CDOM), have high concentrations in the river plume and limit the depth of the euphotic zone [40]. CDOM input to satellite-derived chlorophyll concentrations in the KS [25]. High chlorophyll/CDOM concentrations in the surface layer of the KS shelf in June–August (Figure S1) prevented photosynthetically active radiation (PAR) penetration into the subsurface layer, resulting in the shallow (≤20 m) lower boundary of the euphotic layer [25]. It suppresses photosynthesis and thereby promotes nutrient accumulation in the subsurface layer of the KS shelf (75° N, 66–85° E; depth of 30–50 m). In addition, water exchange with the deep shelf could lead to increased concentrations of nutrients and AOU in the subsurface layer of the middle shelf. The high values of DSi, DIP, and DIN in the KS shelf zone are related to the decomposition of the freshwater diatom phytoplankton supplied from the Ob River estuary (Obskaya Guba, area of 44,500 km2) [36,41]. In early summer, high primary production and phytoplankton biomass were observed in the frontal zone of the KS (salinity of 11–16), separating the estuarine zones (Ob and Yenisey rivers) with salinity of 0–2 and the marine zone with salinity of 27–33 [42]. A large biomass of freshwater diatom phytoplankton forms during spring bloom, dies, and accumulates in the bottom layer of KS areas with high-salinity surface water. In the shallow part of the KS shelf, regenerated nutrients are quickly assimilated by phytoplankton, and in the deep part of the shelf, the increased content of these elements persists for a long time: at least for most of the fall [36,41].
The KS shelf–derived water with high nutrient concentration is supplied to the LS through the VStr and then transported to the eastern part of the LS by currents. The KS shelf water was transported to the eastern LS and underwent mixing with the ADW and LS shelf water. Water mixing enriches the surface and subsurface layers of the LS with nutrients that are necessary for diatom phytoplankton growth. The KS shelf-derived waters were observed in the subsurface layer of the western and central parts of the LS in September 2019. Coastal upwelling was accompanied by onshore advection of KS shelf water from the bottom layer of the LS. The KS-derived shelf water was modified by mixing with the LS shelf water and ADW while it was transported from the VStr area to the eastern LS. In September 2007, the KS shelf water was modified by mixing with ADW in the area of the central trough of the LS. Westerly winds (August–September 2007) (Figure 2B) favor on shelf transport of deep basin water with high salinity. The submarine trough in the central part of the LS was probably the pathway for ADW transport on the shelf during downwelling events, and where the KS shelf water and ADW were mixing. The concentration of DIN in the KS shelf water was lower (about 8 µM at DIP concentration of 0.8 µM) than in the ADW (about 10 µM at DIP concentration of 0.8 µM). The modification of the DIN/DIP ratio in the subsurface layer of the LS (Figure S2C) can be explained by mixing ADW and KS shelf water rather than organic matter degradation.
In August 2008 and September–October 2018, water mixing between the LS and KS shelf waters resulted in high nutrient and AOU concentrations (DIP of 0.7–0.9 µM, DSi of 15–30 µM, and AOU of 100–150 µM) in the 20–30 m layer of the southeastern part of LS (Figures S2 and S3). The easterly winds (Figure 2B) forced the upwelling of subsurface water with increased salinity, DIN, and DIP concentrations but low DSi in the shallow part of the LS shelf in August 2008 (Figure 9A–D). The salinity versus DSi, DIN, and DIP diagrams (Figure S3) demonstrate water mixing in the 10–25 m layer (salinity of 20–32.5) of the LS. Water mixing enriched the 10–25 m layer by nutrients and thereby created favorable conditions for photosynthesis in the surface layer of the western LS shelf in August 2008.
In September–October 2018, a high Lena River discharge (Figure 2A) and westerly (downwelling favorable) winds (Figure 2B) enhanced the supply of the KS shelf water through VStr (Figure 3A) and the formation of a salinity/density front separating near-shore low salinity (10–14) water and off-shore high salinity (about 30) in the LS. The salinity/density front prevented water mixing between the LS shelf water and ADW in the southeastern LS.
The degradation of the organic matter (supplied by river discharge and erosion of the coastal ice complexes) leads to anomalously high partial pressures of CO2 and low pH (and low DO) in the bottom water layer of the LS shelf [37]. Our results show that, in addition to river discharge and coastal erosion, the advection of water from the KS shelf contributes to the formation of low DO (high AOU) and pH zones in the subsurface layer of the LS shelf. The time-series data collected on repeat transections in the central and eastern KS and the western and central LS are required to better understand the impact of KS shelf water on seawater parameters in the subsurface layer of LS.

5. Conclusions

Our results demonstrate the important role of the KS shelf water in the formation of high nutrients and low DO concentrations in the subsurface layer of the LS. KS is a favorable place for the location of subsurface water with high nutrients and low DO concentrations due to the existence of the deep shelf (100–200 m) and flux of diatom phytoplankton from the Ob River estuary zone (Obskaya Guba). The KS shelf-derived water with high nutrient concentrations is supplied to the LS through the VStr and then transported to the eastern part of the LS by currents. While KS shelf water is transported to the eastern part of LS, it mixes with ADW and LS shelf water. Coastal upwelling was accompanied by onshore advection of KS shelf water from the bottom layer of the LS. In the area of the central trough of the LS, the KS shelf water could be modified by mixing with ADW during westerly (downwelling favorable winds). Mixing ADW with high DIN/DIP ratios and KS shelf water with low DIN/DIP ratios leads to modification of the DIN vs. DIP ratios in the subsurface layer of the LS. The water mixing between the KS and LS shelf waters enriched the subsurface layer of the southeastern part of LS with nutrients.

Supplementary Materials

The following supporting information can be downloaded at: https://www.mdpi.com/article/10.3390/jmse13081522/s1, Figure S1: The distribution of chlorophyll concentrations (Modis data) in the Kara Sea in June 2019, July 2019 and August 2019; Figure S2: depth profiles of DIP and DSi; DIN vs. DIP and DSi, AOU), and DIP vs. salinity (LS, September 2007); Figure S3: DSi, DIP, DIN, and AOU vs. salinity (LS, August 2008 and October 2018).

Author Contributions

Conceptualization, A.A.; methodology and validation, A.A., I.P., S.P. and I.S.; writing—original draft preparation, A.A., I.P. and S.P.; project administration, I.S. All authors have read and agreed to the published version of the manuscript.

Funding

This work was supported by the Russian Ministry of Science and Higher Education (theme #124022100083-1) and the Russian Science Foundation (project № 25-17-00075).

Data Availability Statement

The satellite-derived and current model data presented in this study are openly available, and the references are given in the paper. The ship-borne data presented in this article are not readily available because the data are part of an ongoing study. Requests to access the datasets should be directed to the authors. All ship-borne data are presented in the article in graphics.

Conflicts of Interest

The authors declare no conflicts of interest.

References

  1. Wilson, C.; Wallace, D.W. Using the nutrient ratio NO/PO as a tracer of continental shelf waters in the central Arctic Ocean. J. Geophys. Res-Ocean. 1990, 95, 22193–22208. [Google Scholar] [CrossRef]
  2. Laukert, G.; Grasse, P.; Novikhin, A.; Povazhnyi, V.; Doering, K.; Hölemann, J. Nutrient and silicon isotope dynamics in the Laptev Sea and implications for nutrient availability in the transpolar drift. Glob. Biogeochem. Cycles 2022, 36, e2022GB007316. [Google Scholar] [CrossRef]
  3. Gordeev, V.V.; Sidorov, I.S. Concentrations of major elements and their outflow into the Laptev Sea by the Lena River. Mar. Chem. 1993, 43, 33–45. [Google Scholar] [CrossRef]
  4. Cauwet, G.; Sidorov, I. The biogeochemistry of Lena River: Organic carbon and nutrients distribution. Mar. Chem. 1996, 53, 211–227. [Google Scholar] [CrossRef]
  5. Peterson, B.J.; Holmes, R.M.; McClelland, J.W.; Vorosmarty, J.V.; Lammers, R.B.; Shiklomanov, A.I.; Rahmstor, S. Increasing river discharge to the Arctic Ocean. Science 2002, 298, 2171–2173. [Google Scholar] [CrossRef]
  6. Semiletov, I.P.; Pipko, I.I.; Shakhova, N.E.; Dudarev, O.V.; Pugach, S.P.; Charkin, A.N. Carbon transport by the Lena River from its headwaters to the Arctic Ocean, with emphasis on fluvial input of terrestrial particulate organic carbon vs. carbon transport by coastal erosion. Biogeosciences 2011, 8, 2407–2426. [Google Scholar] [CrossRef]
  7. Vonk, J.E.; Gustafsson, Ö. Permafrost-carbon complexities. Nat. Geosci. 2013, 6, 675–676. [Google Scholar] [CrossRef]
  8. Terhaar, J.; Lauerwald, R.; Regnier, P. Around one third of current Arctic Ocean primary production sustained by rivers and coastal erosion. Nat. Commun. 2021, 12, 169. [Google Scholar] [CrossRef]
  9. Pörtner, H.-O.; Roberts, D.C.; Tignor, M.; Poloczanska, E.S.; Mintenbeck, K.; Alegría, A. Climate Change 2022: Impacts, Adaptation, and Vulnerability, in Contribution of Working Group II to the Sixth Assessment Report of the Intergovernmental Panel on Climate Change; Cambridge University Press: Cambridge, UK, 2022. [Google Scholar]
  10. Polyakov, I.V.; Pnyushkov, A.V.; Alkire, M.; Ashik, I.M.; Baumann, T.; Carmack, E. Greater role for Atlantic inflows on sea ice loss in the Eurasian Basin of the Arctic Ocean. Science 2017, 356, 285–291. [Google Scholar] [CrossRef]
  11. Polyakov, I.V.; Rippeth, T.P.; Fer, I.; Alkire, M.B.; Baumann, T.M.; Carmack, E.C. Weakening of cold halocline layer exposes sea ice to oceanic heat in the eastern Arctic Ocean. J. Clim. 2020, 33, 8107–8123. [Google Scholar] [CrossRef]
  12. Gordeev, V.V.; Martin, J.-M.; Sidorov, I.S.; Sidorova, M.V. A reassessment of the Eurasian River input of water, sediment, major elements, and nutrients to the Arctic Ocean. Amer. J. Sci. 1996, 296, 664–691. [Google Scholar] [CrossRef]
  13. Nitishinsky, M.; Anderson, L.G.; Hölemann, J.A. Inorganic carbon and nutrient fluxes on the Arctic Shelf. Cont. Shelf Res. 2007, 27, 1584–1599. [Google Scholar] [CrossRef]
  14. Bauch, D.; Cherniavskaia, E. Water mass classification on a highly variable arctic shelf region: Origin of Laptev Sea water masses and implications for the nutrient budget. J. Geophys. Res.-Ocean. 2018, 123, 1896–1906. [Google Scholar] [CrossRef]
  15. Sun, X.; Humborg, C.; Mörth, C.-M.; Brüchert, V. The importance of benthic nutrient fluxes in supporting primary production in the Laptev and East Siberian shelf seas. Glob. Biogeochem. Cycles 2021, 35, e2020GB006849. [Google Scholar] [CrossRef]
  16. Xie, L.; Yakushev, E.; Semiletov, I.; Grinko, A.; Gangnus, I.; Berezina, A.; Osadchiev, A.; Zhdanov, I.; Polukhin, A.; Moiseeva, J.; et al. Biogeochemical structure of the Laptev Sea in 2015-2020 associated with the River Lena plume. Front. Mar. Sci. 2023, 10, 1180054. [Google Scholar] [CrossRef]
  17. Debyser, M.C.F.; Pichevin, L.; Tuerena, R.E.; Doncila, A.; Semiletov, I.; Ganeshram, R.S. The importance of riverine nutrient supply for the marine silica pump of Arctic shelves: Evidence from the Laptev Sea. Glob. Biogeochem. Cycles 2024, 38, e2023GB007828. [Google Scholar] [CrossRef]
  18. Makkaveev, P.N.; Polukhin, A.A.; Nalbandov, Y.R.; Khlebopashev, P.V. Dynamics of nutrients in the Yenisei Gulf during the open water period. Arct. Ecology Economy 2019, 36, 69–82. [Google Scholar] [CrossRef]
  19. Ivanov, V.V.; Golovin, P.N. Observations and modeling of dense water cascading from the northwestern Laptev Sea shelf. J. Geophys. Res. 2007, 112, C09003. [Google Scholar] [CrossRef]
  20. Andreev, A.G.; Pipko, I.I.; Pugach, S.P. Impact of the paleo-river valleys on the chemical parameter distributions in the East Siberian Sea. Reg. Stud. Mar. Sci. 2023, 57, 102763. [Google Scholar] [CrossRef]
  21. Pavlov, V.K.; Timokhov, L.A.; Baskakov, G.A.; Kulakov, M.Y.; Kurazhov, V.K.; Pavlov, P.V. Hydrometeorological Regime of the Kara, Laptev, And East-Siberian Seas. Technical Memorandum, APL-UW TM 1-96; Applied Physics Laboratory, University of Washington: St. Seattle, WA, USA, 1996. [Google Scholar]
  22. Dmitrenko, I.; Kirillov, S.; Eicken, H.; Markova, N. Wind-driven summer surface hydrography of the eastern Siberian shelf. Geophys. Res. Lett. 2005, 32, 1–5. [Google Scholar] [CrossRef]
  23. Sorokin, Y.I.; Sorokin, P.Y. Plankton and Primary Production in the Lena River Estuary and in the South-eastern Laptev Sea. Estuar. Coast. Shelf Sci. 1996, 43, 399–418. [Google Scholar] [CrossRef]
  24. Vinogradov, M.E.; Vedernikov, V.I.; Romankevich, E.A.; Vetrov, A.A. Some components of carbon cycle in the Russian Arctic seas. Oceanology 2000, 40, 221–233. [Google Scholar]
  25. Polyakova, Y.I.; Kryukova, I.M.; Martynov, F.M.; Novikhin, A.E.; Abramova, E.N.; Kassens, H.; Hölemann, J. Community structure and spatial distribution of phytoplankton in relation to hydrography in the Laptev Sea and the East Siberian Sea (autumn 2008). Polar Biol. 2021, 44, 1229–1250. [Google Scholar] [CrossRef]
  26. Panteleev, G.; Proshutinsky, A.; Kulakov, M.; Nechaev, D.A.; Maslowski, W. Investigation of the summer Kara Sea circulation employing a variational data assimilation technique. J. Geophys. Res. 2007, 112, C04S15. [Google Scholar] [CrossRef]
  27. Aksenov, Y.; Ivanov, V.V.; Nurser, A.J.G.; Bacon, S.; Polyakov, I.V.; Coward, A.C.; Naveira-Garabato, A.C.; Beszczynska-Moeller, A. The Arctic Circumpolar Boundary Current. J. Geophys. Res. 2011, 116, C09017. [Google Scholar] [CrossRef]
  28. Janout, M.A.; Hölemann, J.; Timokhov, L.; Gutjahr, O.; Heinemann, G. Circulation in the northwest Laptev Sea in the eastern Arctic Ocean: Crossroads between Siberian River water, Atlantic water and polynya-formed dense water. J. Geophys. Res-Ocean. 2017, 122, 1–18. [Google Scholar] [CrossRef]
  29. Weiss, R.F. The solubility of nitrogen, oxygen and argon in water and seawater. Deep.-Sea Res. 1970, 17, 721–735. [Google Scholar] [CrossRef]
  30. Grasshoff, K.; Ehrhardt, M.; Kremling, K. Methods in Seawater Analysis; Verlag Chemic: Weinheim, Germany, 2009. [Google Scholar]
  31. Parsons, T.R. A Manual of Chemical & Biological Methods for Seawater Analysis; Pergamon Press: New York, NY, USA, 2013. [Google Scholar]
  32. Dickson, A.G.; Sabine, C.L.; Christian, J.R. Guide to Best Practices for Ocean CO2 Measurements; PICES Special Publication: Sydney, BC, Canada, 2007. [Google Scholar]
  33. Proshutinsky, A.Y.; Johnson, M.A. Two circulation regimes of the wind-driven Arctic Ocean. J. Geophys. Res-Ocean. 1997, 102, 12493–12514. [Google Scholar] [CrossRef]
  34. Andreev, A.G.; Pipko, I.I. Variations in sea level and geostrophic currents in the East Siberian Sea and Laptev Sea under the influence of wind and runoff of the Lena River. Izv. Atmos. Ocean. Phys. 2022, 58, 1028–1036. [Google Scholar] [CrossRef]
  35. Sarmiento, J.L.; Gruber, N. Ocean Biogeochemical Dynamics; Princeton University Press: Princeton, UK, 2006. [Google Scholar]
  36. Pivovarov, S.V. 2002 Chemical Oceanography of the Arctic Seas of Russia; Gidrometeoizdat: St. Petersburg, Russia, 2002. [Google Scholar]
  37. Semiletov, I.; Pipko, I.; Gustafsson, Ö.; Anderson, L.G.; Sergienko, V.; Pugach, S. Acidification of East Siberian Arctic shelf waters through addition of freshwater and terrestrial carbon. Nat. Geosci. 2016, 9, 361–365. [Google Scholar] [CrossRef]
  38. Codispoti, L.A.; Richards, F.A. Micronutrient distributions in the East Siberian and Laptev seas during summer 1963. Arctic 1968, 21, 67–83. [Google Scholar] [CrossRef]
  39. Kim, S.; Kim, K.; Jo, N.; Jang, H.-K.; Ahn, S.-H.; Lee, J.; Lee, H.; Park, S.; Lee, D.; Stockwell, D.A. Primary Production in the Kara, Laptev, and East Siberian Seas. Microorganisms 2023, 11, 1886. [Google Scholar] [CrossRef] [PubMed]
  40. Glukhovets, D.; Kopelevich, O.; Yushmanova, A.; Vazyulya, S.; Sheberstov, S.; Karalli, P.; Sahling, I. Evaluation of the CDOM Absorption Coefficient in the Arctic Seas Based on Sentinel-3 OLCI Data. Remote Sens. 2020, 12, 3210. [Google Scholar] [CrossRef]
  41. Artamonova, K.V.; Lapin, S.A.; Luk’yanova, O.N. The features of the hydrochemical regime in Ob inlet during the open water time. Oceanology 2013, 53, 317–326. [Google Scholar] [CrossRef]
  42. Mosharov, S.A.; Druzhkova, E.I.; Sazhin, A.F.; Khlebopashev, P.V.; Drozdova, A.N.; Belyaev, N.A.; Azovsky, A.I. Structure and productivity of the phytoplankton community in the southwestern Kara Sea in early summer. J. Mar. Sci. Eng. 2023, 11, 832. [Google Scholar] [CrossRef]
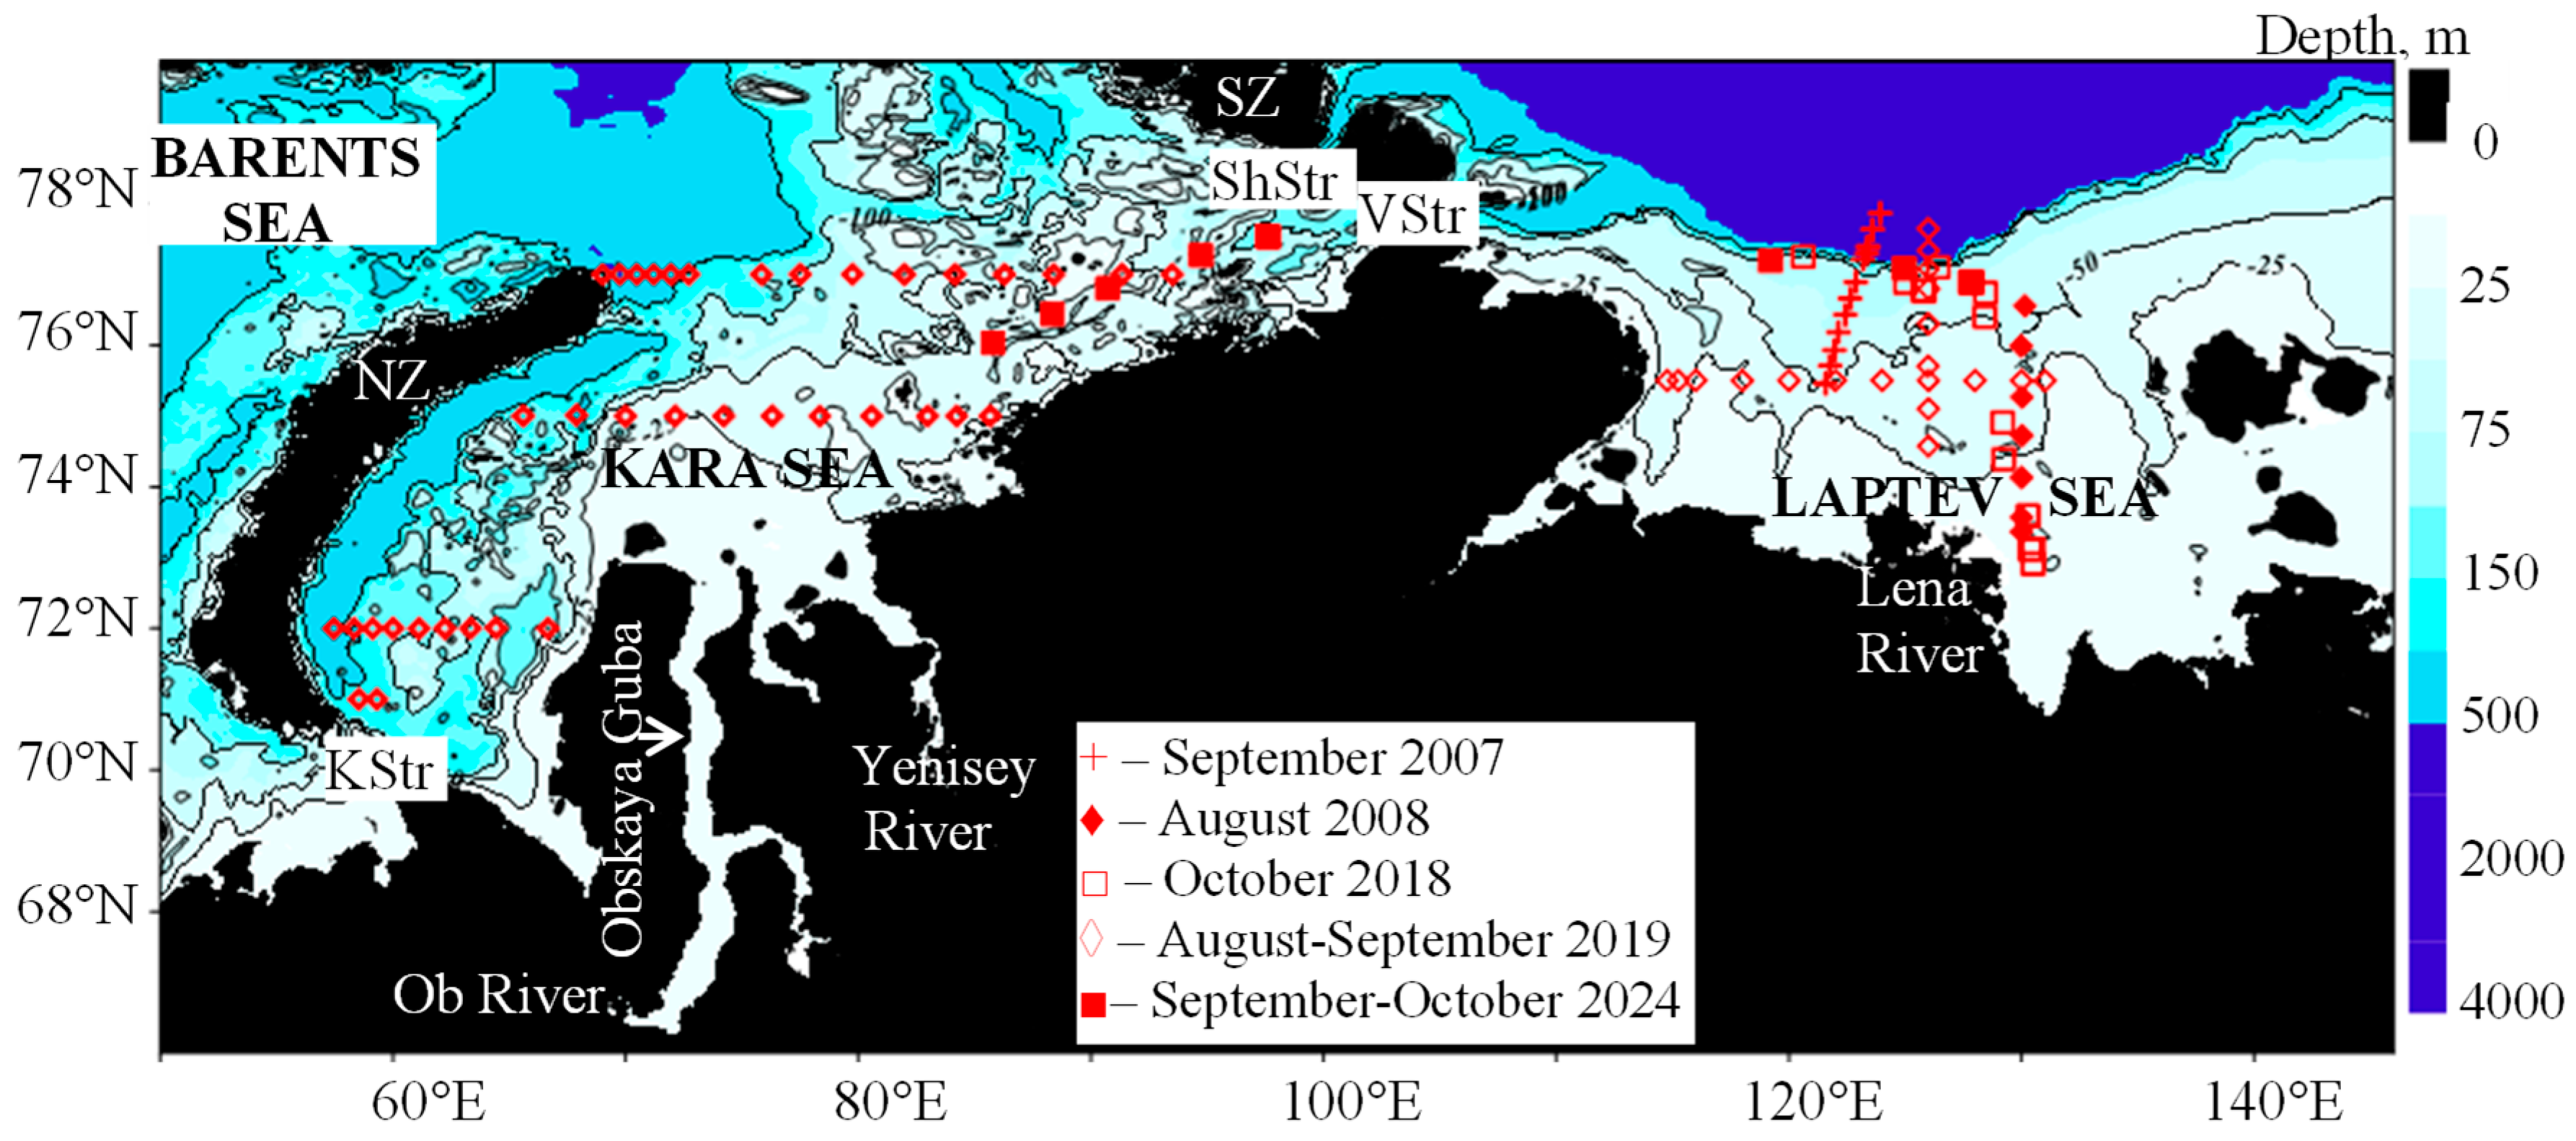
Figure 1. Map of station positions in the Kara and Laptev Seas. KStr–Kara Strait, NZ–Novaya Zemlya, SZ–Severnaya Zemlya, ShStr–Shokalsky Strait, VStr–Vilkitsky Strait.
Jmse 13 01522 g001
Figure 2. Temporal changes in the Lena River discharge (monthly data) (A) and zonal wind speed (daily data smoothed by 7–day filtering, negative values–easterly winds) (B).
Jmse 13 01522 g002
Figure 3. Distribution of SSH, surface geostrophic (AVISO) (A,B), and subsurface (25 m, HYCOM) (C,D) current velocity in the KS and LS during westerly (A,C) (10 October 2018) and easterly (B,D) (20 September 2019) winds. ShStr–Shokalsky Strait. VStr–Vilkitsky Strait.
Jmse 13 01522 g003
Figure 4. DIP (A), DSi (B), and AOU (C) vs. salinity and AOU vs. DIP (D) (50–250 m).
Jmse 13 01522 g004
Figure 5. The temperature vs. salinity (A) and depth profiles of salinity (B), DIP (C), DSi (D), AOU (E), and DIN (F); DIN vs. DIP (G) and DSi (H), AOU (I), and DIP (J) vs. salinity (KS, August 2019) in the KS.
Jmse 13 01522 g005
Figure 6. The temperature vs. salinity (A), depth profiles of salinity (B), DIP (C), DSi (D), and AOU (E); DIN vs. DIP (F) and DSi (G), AOU (H), and DIP (I) vs. salinity (KS and LS, August–September 2019 in the KS and LS.
Jmse 13 01522 g006
Figure 7. Sections of salinity (A), DIP (B), DSi (C), and DIN (D) along 126° E and sections of salinity (E) and DSi (F) along 75.5° N (bottom layer) (LS, September 2019).
Jmse 13 01522 g007
Figure 8. Depth profiles of pHT (20 °C) (A), pHT (20 °C) vs. salinity (B,D), and temperature vs. salinity (CTD data) (C) in the KS and LS in August–September 2019 and September–October 2024.
Jmse 13 01522 g008
Figure 9. Sections of salinity (A), DSi (B), DIP (C), and DIN (D) along 130° E (August 2008).
Jmse 13 01522 g009
Disclaimer/Publisher’s Note: The statements, opinions and data contained in all publications are solely those of the individual author(s) and contributor(s) and not of MDPI and/or the editor(s). MDPI and/or the editor(s) disclaim responsibility for any injury to people or property resulting from any ideas, methods, instructions or products referred to in the content.