Abstract
Within real-world marine settings, the operational performance of floating tidal stream turbines is impacted by wave–current interaction effects and platform motion responses. Leveraging the improved delayed detached eddy simulation (IDDES) method, this research constructs a computational fluid dynamics (CFD) numerical analysis framework for floating turbines in wave–current environments. It further investigates the hydrodynamic behaviors and motion response features of the turbine under wave–current interactions. The results show that under the combined action of regular waves and steady currents, the fluctuation amplitudes of the power coefficient and thrust coefficient of the floating turbine exhibit a positive correlation with wave height, whereas the mean values of these coefficients remain relatively stable; in contrast, the mean values of the Cp and Ct are proportional to the wave period. Additionally, the motion amplitude of the platform shows a proportional relationship with both wave height and wave period. Flow field analysis demonstrates that elevations in wave height and period result in enhanced flow turbulence, disrupted wake vortex shedding patterns, non-uniform pressure distributions across the blades, and a larger pressure differential in the blade tip area. Such conditions may potentially induce cavitation erosion and fatigue loads. The results of the research have certain academic significance and value to the development and engineering of floating tidal current energy devices.
1. Introduction
As mankind increasingly develops and utilizes terrestrial resources [1], the production rate of non-renewable terrestrial energy has been continuously declining. This is constraining sustainable global development [2,3,4]. Meanwhile, the extensive consumption of fossil fuels has exacerbated environmental degradation [5,6,7]. Therefore, countries worldwide have gradually attached importance to the development and utilization of marine clean energy [8,9], which is conducive to reducing carbon emissions and promoting marine economic development [10,11,12]. Forms of marine renewable energy, including offshore wind energy [13,14,15], wave energy [16,17,18,19], and tidal stream energy [20,21,22,23], cause almost no negative impacts on the environment during their development and utilization, demonstrating considerable development potential. Among them, tidal stream energy has gained significant attention due to its huge reserves and high energy flow density [24,25,26]. In recent years, notable headway has been achieved in its development and utilization in terms of technological breakthroughs, policy support, and commercial exploration [27,28]. Tidal stream turbines [29,30,31], as efficient tidal energy conversion devices, can convert the energy contained in tidal currents into electrical energy, meeting energy demands while reducing dependence on traditional energy sources and alleviating environmental pollution [32]. This has attracted extensive attention from researchers and promoted unprecedented development [33,34]. Based on the installation direction of the main shaft, they can be categorized into horizontal-axis [35] and vertical-axis turbines [36]. Compared with the latter, horizontal-axis turbines are more advanced in terms of technology, featuring advantages such as high energy conversion efficiency and stable operation, thus being widely applied in current marine energy development devices.
Tidal stream energy generation devices can be divided into two major types according to their structural composition: fixed-type and floating-type [37,38,39]. The floating-type carriers have many advantages: they can adapt to complex submarine topography, accommodate a wide range of water depths, efficiently utilize water currents, and are convenient for installation and maintenance, which has attracted the attention of domestic and foreign scholars [40,41,42,43]. However, when floating tidal stream turbines operate in real marine environments, the floating carriers will inevitably produce irregular motion responses under wave action, and the turbines rigidly connected to them will also move accordingly, which is called wave-induced motion response [44,45,46]. This may cause the turbine’s angle of attack, relative flow velocity, and deflected inflow direction to deviate from the designed operating conditions, inevitably producing negative impacts. Once the carrier motion is taken into account, the turbine’s hydrodynamic performance turns extremely intricate and hard to forecast, and its research faces many technical challenges.
Nowadays, CFD numerical simulation [47,48,49,50,51,52] has become the mainstream technical means for studying the wave-induced motion response of floating tidal stream turbines. Although it requires substantial computational effort and high computing resources, it can accurately calculate the motion response and the corresponding hydrodynamic performance of floating turbines in various environments, offering a robust basis for the selection, design, and local optimization of floating carriers in specific environments. Due to the current technical challenges in the research on fully coupled dynamics of floating tidal turbines, some scholars primarily concentrate on how simplified forced motions affect turbines’ hydrodynamic characteristics [53,54]. Zhang et al. [55] investigated how surge motion impacts the hydrodynamic loads of a two-bladed turbine using the dynamic mesh technique. Their results displayed that the instantaneous hydrodynamic load values exhibited periodic variations matching the motion’s frequency, whereas the time-averaged counterparts remained largely unchanged. To gain deeper insights into the unsteady forces that such movements caused, a semi-theoretic approach to fit hydrodynamic loads was made with a reference to the method of calculating the hydrodynamic forces in ship principles. In subsequent works, this fitting model was applied to analyze hydrodynamic loads under other degrees of freedom (DoF) motions, such as roll [56], yaw [57], pitch [58], and surge [59], revealing that forced motions of different degrees of freedom have the same influence on the hydrodynamic loads of turbines. Meanwhile, it was found that among all DoF motions, surge and pitch motions exert the most pronounced effects on the turbine’s hydrodynamic loads—a finding congruent with research outcomes in the field of floating wind turbines [60].
However, the above-mentioned studies on simplified forced motions mostly did not consider the coupling interactions between mooring systems and floating platforms. In practical engineering applications, floating tidal stream turbines are connected to floating structures through mooring systems [61]. The combined action of the platform’s stiffness characteristics, tension changes in mooring cables, and wave loads significantly alters the turbine’s motion response and hydrodynamic load distribution. Zhang et al. [62] investigated the hydrodynamic characteristics of turbines supported by mooring systems and floating platforms under surge motion and wave–current interactions. The results showed that smaller wave heights or wavelengths notably influence the hydrodynamic performance of turbines. Guo et al. [63] explored the influence of waves on the dynamic response and power output features of floating tidal turbines with six DoF motions, leveraging potential flow theory and an advanced blade element momentum (BEM) theory model. The results indicated that the floater motion governs the torque and thrust response spectra (exhibiting two peaks); a mutual offsetting effect exists between wave and floater motion loads; positioning the rotor near the floater center can mitigate blade loads; linear influence laws of wave height and period on dynamic loads were uncovered. Wang et al. [64] analyzed the multi-DoF motion responses of a three-floater semi-submersible floating system integrated with a vertical-axis turbine under pure wave, pure current, and wave–current combined conditions via experimental investigations. Their findings revealed that wave–current interactions markedly influence the system’s motion characteristics (wave period dictates motion periodicity, wave height determines amplitude, and flow velocity regulates the equilibrium state); rotor rotation significantly increases mooring tension, with the upstream mooring line sustaining the maximum load. A strong correlation exists between platform motion and anchor chain tension.
In summary, although existing research on floating tidal stream turbines has made certain progress, most studies focus on simplified motions with a single degree of freedom, and the research on multi-DoF motion responses and hydrodynamic characteristics under the coupling effect of mooring systems and floating platforms is still insufficient. Therefore, this study intends to establish a fully coupled dynamic model of floating tidal turbines considering the mooring system based on the CFD method, systematically explore the influence laws of regular wave height, period, and other parameters on the power coefficient and thrust coefficient of the turbine, analyze the multi-degree-of-freedom motion responses such as heave, surge, and pitch and the variation characteristics of mooring tension of the platform, and reveal the evolution mechanism of the flow field structure and blade pressure distribution of the floating tidal turbine under the wave–current coupling effect. The outcomes of the study are set to offer a theoretical foundation for choosing carriers, devising mooring systems, and optimizing the operation-control tactics of floating tidal turbines.
2. Numerical Model
2.1. Governing Equations
In the context of three-dimensional incompressible viscous fluid motion, given that both the fluid density and viscosity coefficient remain constant, the aforementioned equations can be formulated as follows:
where u, v, and w are the velocity components in the x, y, and z-axis directions, respectively.
The momentum conservation equations are
where t is time, μ is the dynamic viscosity coefficient of the fluid, ρ is the fluid density, and p is the flow field pressure.
2.2. Turbulence Model
This study employs the IDDES model, which is built upon the SST k-ω model [65]. The IDDES model uses the RANS model for solving within the boundary layer, while resorting to the LES model for solving at the edge and outside of this boundary layer. Through the introduction of the turbulent length scale, the turbulent kinetic energy dissipation term within the model is modified. The revised formula can be expressed as
where ρ, k, uj, t, μ, μt, σ, τij, and Sij represent the fluid density, turbulent kinetic energy, fluid velocity, time, dynamic viscosity, turbulent viscosity, model coefficient, stress tensor, and mean strain rate tensor, respectively. lIDDES is the IDDES length scale, written as
where lRANS is the RANS length scale; lLES is the LES filtering scale, which can be expressed as
In the formulas, ω is the specific dissipation rate; CDES is the model coefficient, and its general value is 0.65; Δ is the grid length scale; CW is the empirical constant; d is the closest distance from the node to the wall; Δmin is the minimum distance between the grid cell center and the adjacent grid cell center, while Δmax is the maximum distance. In Equation (6), is the mixing function, and fe is the lifting factor, which can be calculated by
When fe is 0, IDDES uses the DDES branch for calculation, and the IDDES length scale is simplified as
When = fB, IDDES enables the WMLES branch for calculation, and the IDDES length scale is simplified as
More detailed formulas of the IDDES model can be found in reference [66].
3. Computational Model and Validation
In this study, the floating tidal turbine is made up of a 1:50 scale OC4 DeepCwind platform [67], a mooring system, and a three-blade tidal stream turbine designed by Hohai University [68]. A schematic diagram of the device is given below in Figure 1.
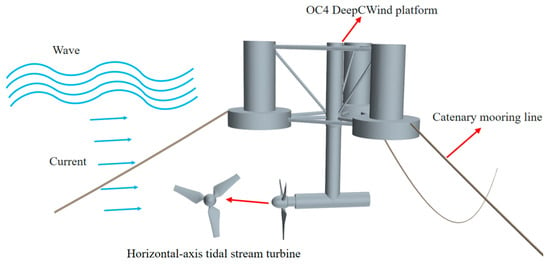
Figure 1.
Schematic diagram of floating turbine device.
3.1. Semi-Submersible Floating Turbine Model
3.1.1. Semi-Submersible Floating Platform
For the calculation model, this research adopts the DeepCwind semi-submersible support platform in the OC4 Phase II project as the calculation model. The platform is composed of a central buoy for installing the tower, three groups of combined buoys providing main buoyancy, and several connecting members [69,70,71]. Its structural form is shown in Figure 2 and Figure 3. The main geometric model dimensions of the semi-submersible platform are described in Table 1 and Table 2.
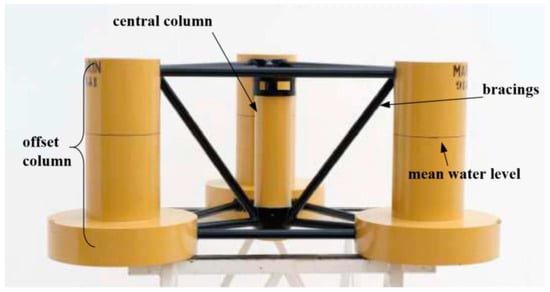
Figure 2.
DeepCwind Semi-submersible Floating Platform (Data from reference [67]).

Figure 3.
Top and side view of semi-submersible support platform (Data from reference [67]).

Table 1.
Floating Platform Structural Properties.

Table 2.
Floating Platform Geometry.
3.1.2. Mooring System
The DeepCwind floating platform achieves mooring constraints via a mooring system made up of three anchor chain lines [72,73,74]. As illustrated in Figure 4, the three anchor chain lines arranged in this mooring system are completely identical, with a 120° included angle between any two adjacent catenary lines. Specific physical parameters are detailed in Table 3. One end of the catenary is connected to the fairleads of the three main buoys of the platform. These fairleads have a draft depth of 14 m and are spaced 40.868 m from the central axis of the platform. The other end is anchored at a seabed mooring point 200 m deep, and the mooring line’s initial length is 835.5 m.
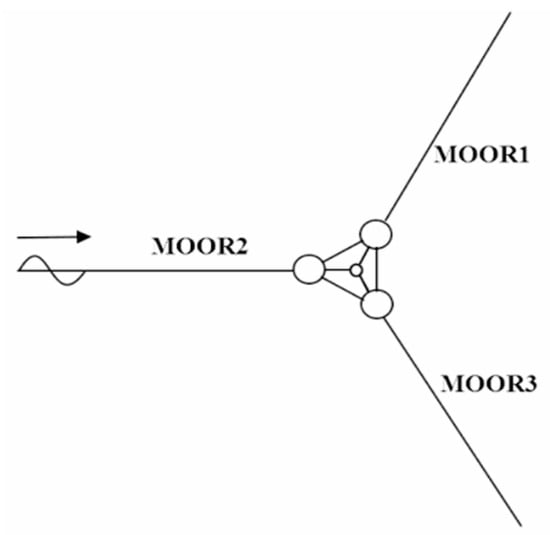
Figure 4.
Arrangement of the mooring system.

Table 3.
Mooring System Properties.
3.1.3. Tidal Stream Turbine Model
The computational model in this paper adopts a three-blade horizontal-axis tidal stream turbine model designed by Hohai University, as shown in Figure 5. The turbine has a diameter D = 0.3 m, a hub diameter Dhub = 0.05 m, and a support structure diameter D1 = 0.036 m. The designed inflow velocity is 0.4 m/s, and the rated tip speed ratio is 3.9. The blades are designed using NREL S822/S823 airfoils, with twist angles and chord length data listed in Table 4.
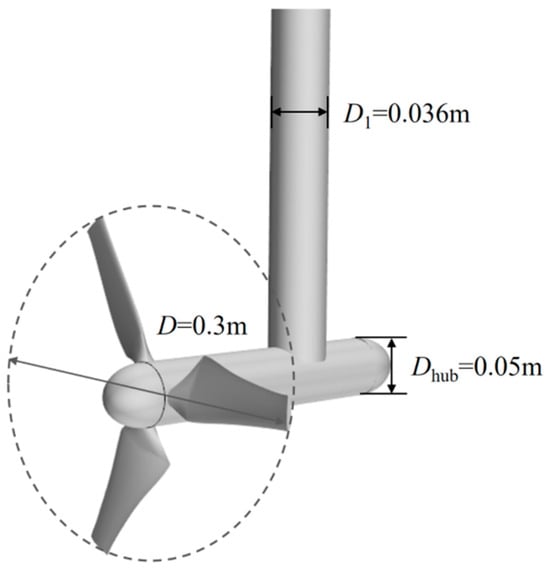
Figure 5.
Turbine model schematic diagram.

Table 4.
Variation of chord length and twist angle along the radial direction.
3.2. CFD Numerical Model
3.2.1. Geometric Model Design
To save calculation time and resources, according to the real sea conditions in Zhoushan Sea Area [75,76,77,78,79], the full-scale model is scaled down to ensure its suitability for the marine environment after scaling back to the full scale, making the research engineering-significant [80,81]. Assuming the scale ratio is λ, the linear length of the full scale is Ls, and the linear length of the model scale is Lm, then:
The corresponding area and volume relationships between the full scale and the model scale are as follows:
Furthermore, the Froude number must be equal:
Based on the above similarity criteria, the conversion relationships of data parameters between the model scale and the full scale can be derived as summarized in Table 5:

Table 5.
Model scale and real scale data conversion relationship.
Considering the above factors and referring to the scale ratios suggested in previous studies, the model scale ratio selected in this study is 1:50. The regular waves are simulated using the VOF wave module in STAR-CCM+ (v19.06), with fifth-order Stokes waves generated by the VOF method as incident waves [82,83]. Meanwhile, considering coupling effects across multiple DoFs for the turbine’s motions, three primary DoFs—surge, pitch, and heave—are released in the numerical simulation [84].
3.2.2. Grid Division and Boundary Condition Settings
To simulate turbine rotation and the three-DoF motions, an overlapping grid technique is employed [85,86,87,88]. This requires defining a background domain, an overlapping domain, and a rotating domain. The overlapping domain must cover the entire motion range of the floating platform, and the grid sizes of the overlapping and background domains must be kept consistent. The rotating domain encloses the entire turbine model, ensuring a certain distance is maintained between the turbine model and the boundary of the rotating domain. The distance between the turbine rotation center and the inlet boundary of the background domain is set as 10D, the distance to the outlet boundary is 15D, and the distance to the top boundary is 5D. For the computational domain, the inlet, two side boundaries and bottom are all defined as velocity inlets, while the outlet and top act as pressure outlets. Additionally, a damping wave-absorbing zone is set within a one-wavelength interval the wavelength ahead of the pressure outlet boundary on the computational domain’s right side. This setup prevents wave reflection at the outlet from interfering with the motion responses of waves and the platform [89,90,91]. The detailed setting are illustrated in Figure 6.
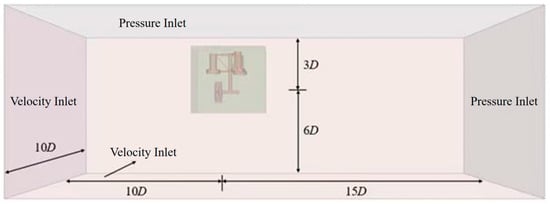
Figure 6.
Computational domain and boundary conditions.
For numerical simulations, grid partitioning stands as a critical step, as the quality of the grid will directly impact the accuracy and efficiency of the calculation results [92,93,94,95]. As shown in Figure 7, the background domain adopts structured grids, and the rotating domain adopts unstructured grids. Since sliding meshes hardly achieve both rotation and free platform motion simultaneously and are prone to errors, while overlapping grids can efficiently simulate the superposition of three-degrees-of-freedom motions and simplify the pre-processing process, improving calculation efficiency and accuracy, they are utilized to simulate the combined turbine rotation and platform motion. When performing hole-cutting on the background and overlapping domains with overlapping grids, the grid sizes at the junction position need to be kept similar. The grid size at the junction position in this study is 0.025 m. Divide the boundary layer grids on the surface of the turbine, with a total of 5 layers and a thickness of 0.008 m, which meets the requirements of the y+ value range. The grid division scheme for the wave area is as follows: within the interval of a single wavelength, the number of grid cells should be set to at least 160; within the interval of a single wave height, at least 20 grid cells should be divided. The grid sizes in the X and Z directions are 0.012 m and 0.003 m, respectively, yielding a total grid count of 5.9 million.
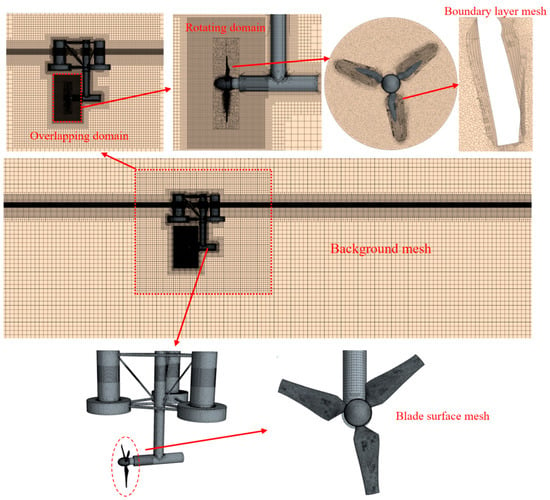
Figure 7.
Grid division diagram.
The boundary conditions applied in this study are defined as follows: Initially, a wave–current model [96,97,98,99] is constructed, with the flow field set as a steady uniform flow and the waves set as regular waves. Wave generation utilizes the velocity boundary approach [100], paired with the force wave absorption method. For the computational domain, the inlet, left, right and bottom sides are designated as a velocity inlet, the outlet as a pressure outlet, and the top as a pressure outlet. Corresponding pressure values and volume fractions of water and air are assigned, and blades and hub surfaces are set as no-slip walls. The platform motion and turbine rotation are enabled via the overlapping grid technique. The stationary and rotation domains connect through an interface, and the overlapping and background domains are also linked by an interface. A transient solver is used, with the IDDES model based on SST k-ω selected as the turbulence model. The setting of the boundary conditions can be referred to in Figure 6. The time step is determined by the duration needed for the turbine to rotate by 1°.
3.3. Numerical Verification
To characterize the turbine’s hydrodynamic performance, dimensionless parameters are defined: power coefficient (Cp), thrust coefficient (Ct), and tip speed ratio (λ). Here, Cp quantifies the turbine’s ability to capture kinetic energy from the incoming flow, Ct represents the axial force generated by the flow, and λ is the dimensionless rotational speed of the turbine. The expressions for these coefficients are as follows:
where Q is the torque exerted on the turbine; ωT is the angular velocity of the turbine rotation; A is the swept area of the turbine’s upstream face; the inflow velocity VA is the steady uniform flow velocity, which is treated as a constant (with a value of 0.4 m/s) in subsequent calculations; F is the axial thrust acting on the turbine; R is the radius of the turbine.
3.3.1. Grid Independence Verification
To perform grid independence verification for the floating tidal turbine in wave–current environments, three sets of grids with distinct basic sizes (M1, M2, and M3) were selected. The computational cases, initial conditions, and boundary conditions were kept consistent across the three grid sets. Following recommendations from the International Towing Tank Conference (ITTC) [101], the rate of change rG between the basic sizes of the three grid sets was set to . The grid numbers and relevant independence results are detailed in Table 6.

Table 6.
Grid independence verification.
When the grid number reached 5.908 million, the variation trends of the Cp and Ct tended to stabilize. Based on this, the M2 grid division scheme was adopted for subsequent numerical calculations. Since the time step calculated from the wave encounter period was much smaller than the time step for the turbine to rotate 1°, no relevant verification is conducted on the time step obtained from the turbine’s rotation degree.
3.3.2. Validity Verification of Wave–Current Environment
This section takes the working condition with wave height 0.04 m, wave period 1 s, and inflow velocity 0.4 m/s as an example to carry out the validity verification of the wave–current environment. The calculated results were compared with the theoretical values, as shown in Figure 8. While minor fluctuations appear in the numerical results, they align closely with the theoretical predictions overall. This phenomenon strongly confirms the effectiveness of the numerical wave simulation employed here.
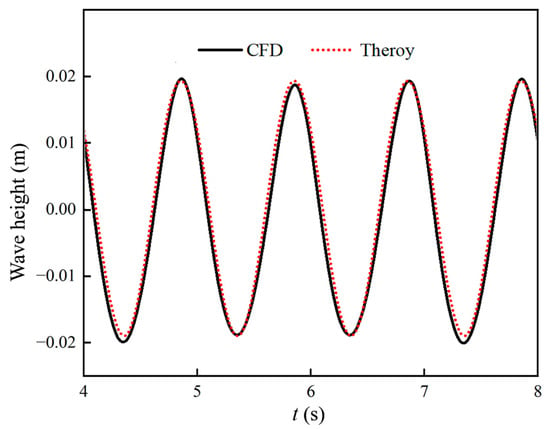
Figure 8.
Comparison of calculated and theoretical values.
3.3.3. Validity Verification of Turbine Model
To validate the accuracy of numerical methods, this study compares the findings with the experimental results from Reference [68]. The experiment employed a T21WN high-precision torque sensor manufactured by HBM for torque measurement, with a rotational speed measurement range up to 20,000 r/min. Figure 9 illustrates the comparison between the numerical calculation values of this study and the experimental results. In this work, power coefficients were calculated for seven different λ. Analysis reveals that the numerical results of power coefficients closely match the experimental data under the optimal tip speed ratio and its equidistant offset conditions. For example, the error at the optimal λ is only 5%. However, numerical results slightly exceed the experimental values under high tip speed ratio conditions. This discrepancy may arise from intensified flow field variations around the blades as the rotational speed increases, leading to larger deviations [102]. Overall, numerical results and experimental data show consistent variation trends. In conclusion, the turbine’s CFD numerical model established using the IDDES method in this study exhibits high accuracy and can effectively predict the turbine’s hydrodynamic characteristics.
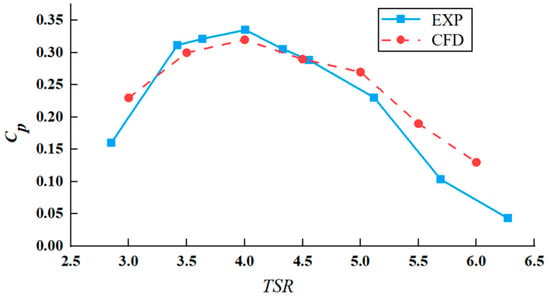
Figure 9.
Comparison of numerical results based on IDDES method.
4. Results and Discussions
4.1. Wave Height Effects
4.1.1. Case Configuration
In the sea area of Zhoushan, China, which is far from the land with a depth of 80–100 m, the special submarine topography can effectively converge the tidal current, and it is an ideal location for the full utilization of tidal current energy. Based on this point, the research in this paper was carried out at a water depth of 90 m, and the water depth for numerical simulation after scale transformation was 1.8 m. The simulated parameters are shown in Table 7.

Table 7.
Numerical simulation parameters under different wave height conditions.
4.1.2. Hydrodynamic Coefficient
After the flow field was stabilized, the Cp and Ct time history curves for different wave height conditions during the stabilized wave period were selected for comparative analysis. As shown in Figure 10, both coefficients exhibited periodic variations. As wave height increased, their fluctuation amplitudes gradually rose. Specifically, the peak value of Cp under the maximum wave height condition was 1.25 times that under the minimum wave height, and the peak Ct showed a 1.2-fold increase. This indicates that the turbine installed on a floating platform in a wave environment may suffer from severe fatigue loads and power fluctuations.
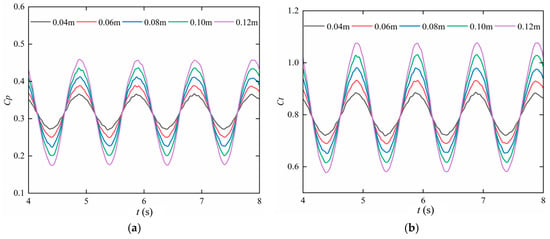
Figure 10.
Time history curves of hydrodynamic coefficients under different wave heights. (a) Cp, (b) Ct.
Through the comparative analysis of power coefficients and thrust coefficients under different wave heights, it can be clearly observed that: with the increase in wave height, the fluctuation amplitudes of Cp and Ct significantly rise, but their mean values are minimally affected. This phenomenon is primarily determined by the transmission characteristics of waves. The essence of wave motion is the periodic vibration of fluid particles around their equilibrium positions, a process accompanied by energy propagation. Under regular wave conditions, the motion of fluid particles exhibits stable periodic characteristics; meanwhile, the rotation of the turbine also has a stable periodicity. The interaction and superposition of these two periodicities ultimately lead to insignificant changes in the mean values of Cp and Ct.
4.1.3. Dynamic Response
To further analyze the motion responses of the platform’s three main DoFs (heave, surge, and pitch) under different wave heights, when the platform motion tended to be stabilized, three typical working conditions were selected to be analyzed, as shown in Figure 11.
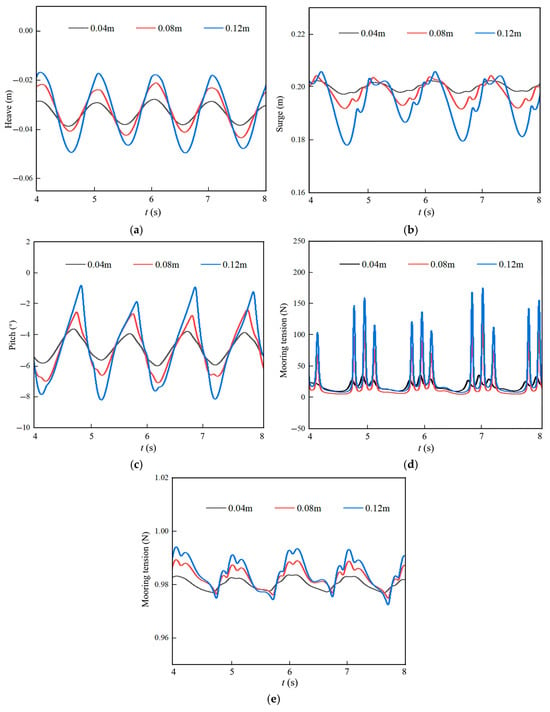
Figure 11.
Time history curves of platform motion and mooring tension. (a) Heave, (b) Surge, (c) Pitch, (d) Mooring 1 tension, (e) Mooring 2 tension.
The platform motion response intensifies with increasing wave height, especially in the pitch direction. At a wave height of 0.12 m, the pitch amplitude is 3.5 times that at 0.04 m. This not only increases the burden on the mooring system but also may affect the normal operation of the single-unit turbine. By comparing the two mooring tension curves, the tension borne by Mooring 1 at a wave height of 0.12 m is approximately 1.5 times that at 0.04 m. This stems from heightened wave impact forces on the floating platform as wave height rises. The mooring system, as the equipment connecting the floating platform and the seabed, must endure greater tension to maintain platform stability. Excessive motion may accelerate fatigue damage of mooring cables and even cause mooring system failure, thus threatening the floating platform’s safety.
4.1.4. Wake Characteristics
To facilitate horizontal comparison of flow field characteristics under different wave heights, the side view of the fluid domain velocity field at time T(0) (i.e., the starting point of a complete wave cycle) after the flow field has stabilized was taken, as shown in Figure 12. The left panel presents the overall planar flow field diagram, while the right panel is the magnified local flow field diagram around turbine. From the overall diagram, as wave height increases, the high-speed region of the flow field approaches the turbine and expands in scope. This is because higher wave heights introduce more energy into the flow. When the flow passes through the turbine, more energy transfers to the blades, increasing the flow velocity around the blades and causing flow turbulence, broadening the high-speed region. Moreover, wave height increases may induce wave breaking. Turbulence, an extremely complex and irregular form of fluid motion, involves vortices of various scales and velocity fluctuations. These turbulent phenomena enhance the flow velocity and complexity, thereby forming a broader red region in the velocity contour.
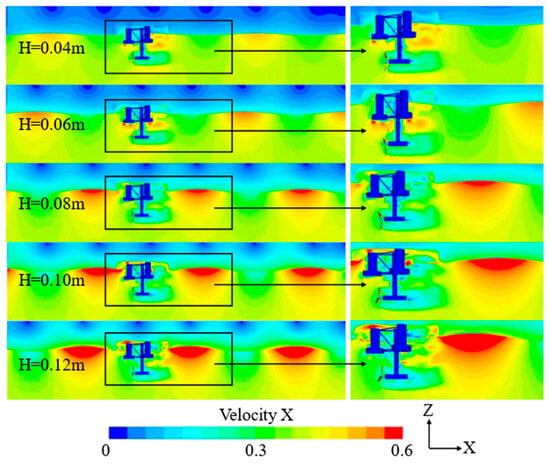
Figure 12.
Velocity cloud maps under different wave height conditions (t/T = 8).
From the flow velocity field behind the turbine depicted in the right figure, when the height of the wave is set to 0.04 m, the flow velocity field behind the turbine can be restored to an incoming flow equivalent to the incoming flow velocity. At a wave height of 0.08 m, the velocity in the velocity field remains at approximately 0.2 m/s, while at 0.12 m, the velocity field is around 0.1 m/s, with a slower recovery speed and a longer recovery distance. This is because under larger wave heights, the turbine captures more energy, leading to a more pronounced velocity deficit. Therefore, the fluid requires a longer travel distance to regain sufficient energy and restore velocity close to the incoming flow.
To further explore how wave height impacts the velocity wake field, this study analyzed the wake vortex structures of a turbine across different wave heights. Figure 13 presents the vorticity distribution map for vortex identification using the Q-criterion (Q = 0.3) in Tecplot, with the transient moment T(0) of the wave period after the flow field stabilizes. It is clearly visible that as the wave height rises, velocity at the platform draft position increases significantly: the velocity is approximately 0.1 m/s at 0.04 m wave height, reaching 0.3 m/s at 0.12 m—nearly three times that at 0.04 m. This occurs because higher wave heights boost the wave force on the floating platform, causing greater motion responses. These motions drive the surrounding water, forming a relative velocity at the platform draft. Larger wave heights intensify the platform motion, and the more pronounced this driving effect, the faster the water velocity at the draft position.
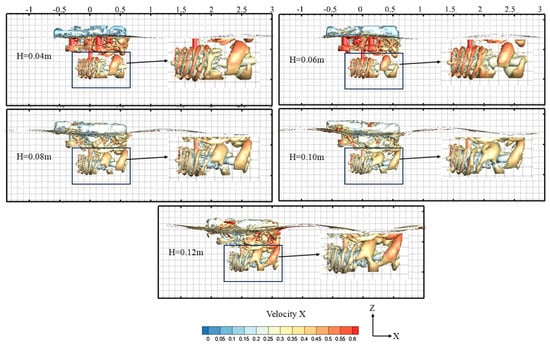
Figure 13.
Wake vortex structure under different wave height conditions (t/T = 8).
With the increase in wave height, the water flow possesses stronger energy and velocity, leading to the formation of very large-scale wake vortices around the turbine blades. As depicted, at a 0.04 m wave height, the wake vortices near the turbine are clear, exhibiting obvious periodicity and regularity, resulting in minimal impact on the floating platform. However, at a wave height of 0.12 m, due to the intense action of the water flow, vortex shedding becomes highly disordered, losing obvious periodicity and regularity. The shape and size of the wake vortices also change drastically, with extremely chaotic vortices around the platform. This is because large-scale wake vortices interfere with wave propagation and flow field characteristics around the platform, influencing its heave, surge, and pitch motion responses. Such interference increase the platform’s motion amplitude, impacting the normal operation of equipment on the platform. For the turbine installed on the platform, excessive motion may affect the structural safety of the floating turbine, even causing structural damage.
4.1.5. Blade Pressure
To deeply explore the intrinsic mechanism of load fluctuations in the floating platform turbine under platform motion within wave–current environments, this study conducted a detailed analysis of pressure distribution on the surface of the blades. Figure 14 presents surface pressure distributions at different blade positions under different wave heights after the stable wave period, where the left panel above each wave height shows the frontal pressure distribution of the turbine, and the right panel shows the negative pressure distribution. From the figure, at low wave heights, only one blade of the turbine exhibits high pressure. As the wave height gradually increases, two blades show high pressure, indicating that waves possess strong energy at high wave heights. Under combined wave–current action, blades endure enormous impact forces and fluctuating loads. The pressure amplitude on the blade surface increases significantly and the maximum pressure may reach several times that or even higher at low wave heights. This poses a serious threat to blade structural strength, easily leading to blade damage.
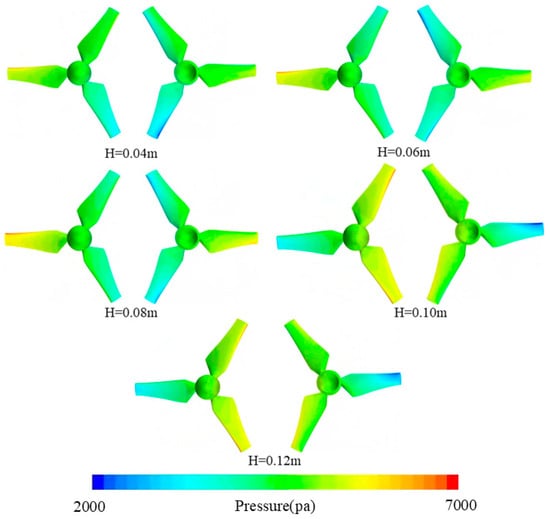
Figure 14.
Pressure cloud maps under different wave height conditions (t/T = 8).
At low wave heights, the color distribution in the blade pressure contour is relatively uniform with gentle color transitions, showing no obvious pressure concentration areas. As the wave height increases, the pressure distribution in the contour becomes non-uniform, with distinct color gradients indicating increased pressure differences across different blade surfaces. High- or low-pressure regions may emerge at the blade leading edge, trailing edge, and tip due to more pronounced flow separation and reattachment, which could induce cavitation and erode the blade surface.
Figure 15a depicts that pressure gradually propagates from the root to the outer edge with increasing wave height, accompanied by an upward trend in pressure coefficient and more complex/unstable pressure coefficient distributions. This subjects the blade to greater dynamic pressure variations, even negative pressure coefficients (indicating potential cavitation), which may erode the blade surface. Figure 15b reveals that the pressure distribution pattern on the surface of the leaf element remains largely consistent, with the absolute values of pressure on both sides decreasing gradually as the distance to the trailing edge shortens, eventually dropping to zero at the trailing edge. As wave height increases, the pressure difference on both sides increases proportionally to the relative flow velocity of the turbine, implying that larger wave heights lead to greater pressure differences. This impacts output power quality and imposes severe fatigue loads on the blade.
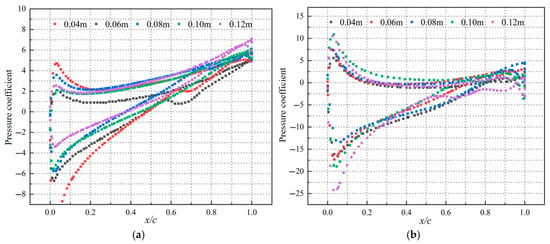
Figure 15.
Pressure coefficients of different blade elements under various wave heights. (a) r/R = 0.2, (b) r/R = 0.8.
Analyzing pressure coefficients across various blade positions shows that as wave height rises, the pressure coefficient of upper blade elements exceeds that of lower blade elements in all operating conditions, with this gap growing more notable. This is attributed to the distinct interactions between waves and currents at different radial positions. At small radial positions, the local size of the blade is relatively smaller compared to the wavelength and scale of waves and currents, leading to a more uniform action of wave–current forces. In contrast, at large radial positions, the local blade size is relatively larger, making the wave–current action on the blade more non-uniform. The wave action on the blade root may be approximately uniform, but on the blade tip, due to its larger span, wave crests and troughs may act simultaneously on different parts of the tip, resulting in more complex wave–current interactions, thereby influencing the variation in pressure coefficients.
4.2. Wave Period Effects
4.2.1. Case Configuration
The variation in wave period alters the wave wavelength, thereby influencing the wave velocity. Changes in wave velocity induce modifications in the motion period of fluid particles near the turbine. Therefore, in this study, by adjusting the wave period, the influence of different wave periods on the hydrodynamic characteristics and flow field characteristics of floating turbines was investigated. Relevant parameters are tabulated in Table 8.

Table 8.
Numerical simulation parameters under different wave period conditions.
4.2.2. Hydrodynamic Coefficient
We compared and analyzed the power coefficient and thrust coefficient time history curves under different wave height conditions within multiple stable wave periods. As shown in Figure 16, the Cp and Ct exhibit periodic variations with obvious temporal fluctuations, though the fluctuation amplitudes are unstable, due to the presence of waves and platform motions. As the wave period increases, the fluctuation amplitudes of Cp and Ct gradually rise, and Cp shows an upward trend. This is because a longer wave period implies more concentrated wave energy distribution and relatively slower changes in wave motion velocity, allowing turbine blades more time to interact with waves, thus enabling more efficient capture of wave energy. When the wave period gradually nears the natural period or rotation period of the turbine, a resonance or resonance-like effect occurs, increasing the energy absorbed by the turbine from wave–current flows and thereby enhancing Cp.
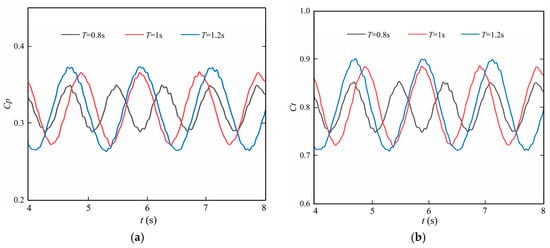
Figure 16.
Time history curves of hydrodynamic coefficients under different wave periods. (a) Cp, (b) Ct.
Similarly to the power coefficient, the thrust coefficient generally increases as the wave period increases. A longer wave period extends how long waves act on the turbine blades. In some cases, the thrust direction of waves may better match the motion direction of the turbine, increasing the turbine’s thrust. When the wave period increases, waves’ up-and-down process becomes gentler, and the thrust experienced by the blades under wave action becomes more sustained and stable, leading to an increase in Ct. Moreover, changes in wave period affect the impact force of waves on the floating platform and the load distribution on the turbine blades; a more stable platform can enable the turbine to obtain more energy.
4.2.3. Dynamic Response
To further analyze the motion responses of different wave periods to three main DoFs of the floating turbine, three typical working conditions were selected for analysis, as presented in Figure 17.
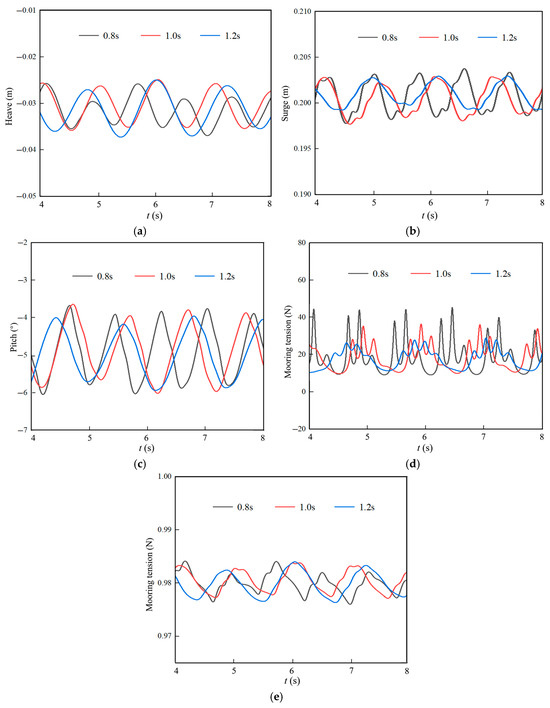
Figure 17.
Time history curves of platform motion and mooring tension under the action of regular waves. (a) Heave, (b) Surge, (c) Pitch, (d) Mooring 1 tension, (e) Mooring 2 tension.
As indicated by the time history curves of heave, surge, and pitch, the floating turbine motion becomes gentler with the increase in wave period, showing less tendency to induce violent movements. This is because long-period waves have longer wavelengths and slower wave speeds, resulting in relatively mild impact forces on the floating platform. In contrast, short-period waves feature shorter wavelengths and faster wave speeds, exerting more intense impact forces on the platform. When comparing the mooring tension curves, the tension in Mooring 1 at a wave period of 0.8 s is twice that at 1.2 s, while the tension in Mooring 2 remains relatively unchanged. This is attributed to the high frequency of short-period waves, which leads to more frequent wave forces acting on the single-unit turbine per unit time, accompanied by drastic force fluctuations. As the mooring system continuously resists these frequent wave forces, the mooring tension rises rapidly and reaches a relatively high value.
4.2.4. Wake Characteristics
Similarly, to facilitate horizontal comparison of flow field characteristics under different wave cycle conditions, a side view (X-Z plane) of the fluid domain velocity field taken at the transient moment T(0) after the flow field stabilized is shown in Figure 18. It can be observed that for a wave period of 0.8 s, there are four deep red troughs, while for a wave period of 1.2 s, only two red troughs appear, with a lighter color indicating a lower velocity compared to the shorter period. This is because longer wave periods result in slower wave motion and fewer undulations per unit time, leading to gradual changes in flow velocity and gentle color gradients in the contour, reflecting an overall stable state. The wake field morphology of the floating platform turbine also varies with wave periods. Short wave periods may cause the wake field to be more turbulent and dispersed, whereas longer periods tend to make it more stable and concentrated. This is attributed to the influence of wave periods on wave–fluid interaction patterns, which in turn affect the wake field morphology and velocity distribution. Specifically, frequent wave impacts and turbulent flow under short periods may slow down wake recovery, while the relatively stable flow under longer periods may accelerate this recovery.
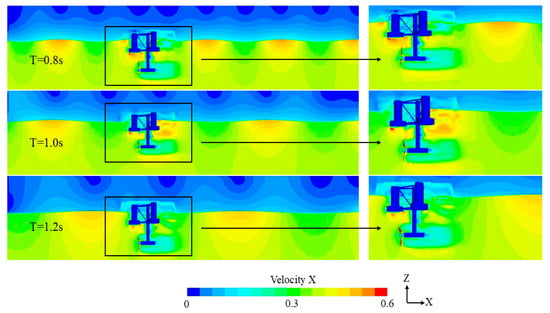
Figure 18.
Velocity cloud maps under different wave period conditions (t/T = 8).
The vorticity distributions in Figure 19, identified using the Q-criterion (Q = 0.3) in Tecplot, are all transient moments after a complete wave cycle. The figure shows that shorter wave periods (higher frequencies) induce more frequent disturbances in the fluid near the turbine, leading to more frequent formation of wake vortices with complex and unstable structures. The vortex contours reveal numerous small-scale vortices, along with interactions and merging between vortices. Conversely, lower wave frequencies (longer periods) result in fewer disturbances, leading to more stable vortex formation with clearer and more regular structures.
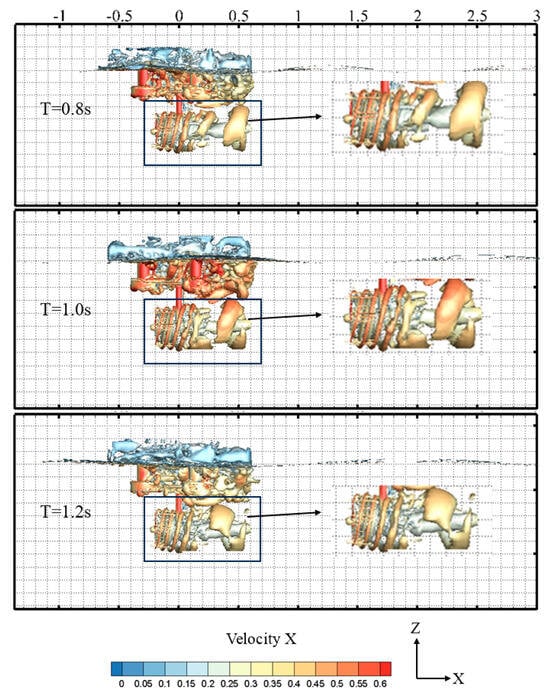
Figure 19.
Wake vortex structure under different wave period conditions (t/T = 8).
Additionally, wave period variations may affect vortex intensity. The increase in wave period leads to a weakened influence of waves on the fluid near the turbine, reducing vortex intensity and velocity deficit. In wave–current environments, the floating platform’s motion response alters the velocity and vorticity fields around the turbine; smoother platform motions under longer wave periods also contribute to reduced vortex intensity and velocity deficit.
4.2.5. Blade Pressure
Figure 20 illustrates surface pressure distribution across distinct blade positions under different wave periods. For each wave period, the upper left panel depicts the turbine’s frontal pressure distribution, and the upper right shows the rear-side pressure distribution. Under different wave periods, the pressure gradients on the turbine blades’ upstream and downstream surfaces shift. For short periods, the pressure cloud diagram of the blade shows frequent fluctuations in pressure values, with rapid and irregular changes in color depth, indicating that the pressure at different positions on the blade surface changes continuously in a short time. Due to the high-frequency disturbance of waves, the separation and reattachment of flow on the blade surface occur frequently, leading to complex and changeable pressure distribution. During long wave periods, the wave movement is relatively slow, and the blade surface pressure changes become relatively gradual and stable. In the pressure cloud diagram, the change in color depth is relatively gentle, and the pressure value remains relatively stable for a long time, indicating that the wave force on the blade changes little, and the flow state of water flow on the blade surface is relatively stable.
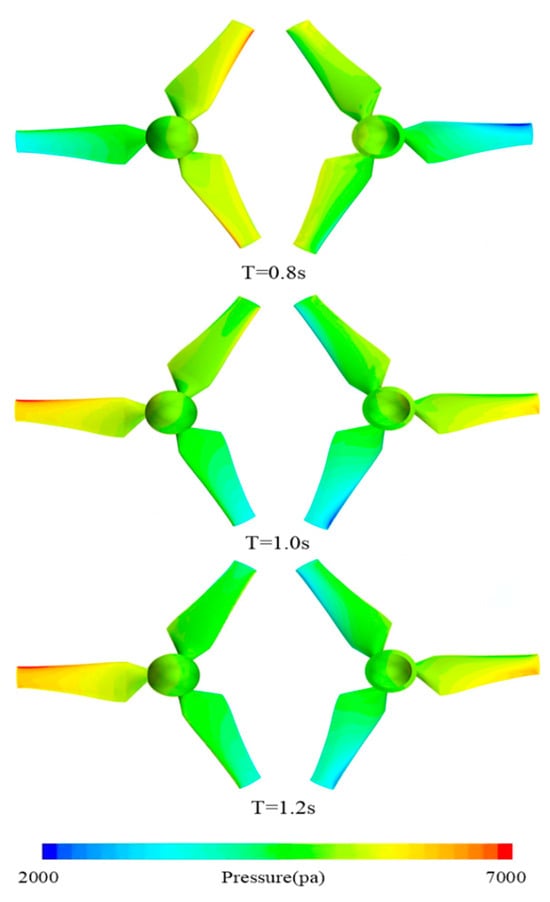
Figure 20.
Pressure cloud maps under different wave period conditions (t/T = 8).
To develop a more comprehensive grasp of blade-load fluctuation characteristics during the movement of the turbine under wave current action, this article analyzed the pressure coefficient on the blade surface. As observed in Figure 21, as the wave period gradually increases, pressure on the blade is slowly transmitted from the root to the outside, and the pressure coefficient shows a gradual upward trend. At the same time, the distribution of the pressure coefficient becomes more complex and unstable. In this case, the blade is very likely to bear more intense dynamic pressure changes. It is worth noting that these changes may also lead to negative pressure coefficients at this position. The occurrence of negative pressure is very likely to cause cavitation, which will erode the blade surface and adversely impact both the turbine’s performance and service life.
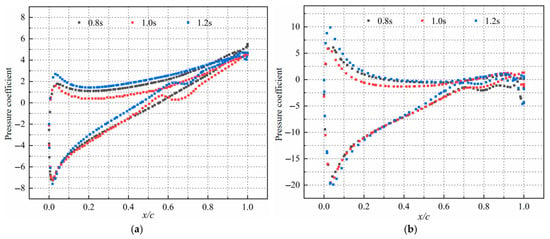
Figure 21.
Pressure coefficients of different blade elements under different wave periods. (a) Blade element (r/R = 0.2), (b) blade element (r/R = 0.8).
From the figure, it can be observed that the slope of the pressure coefficient distribution curve changes significantly from the blade root to the blade tip, reflecting the existence of a pressure gradient. The transition between these regions in the curve is clear, and the overall value of the pressure coefficient near the tip is relatively high, meaning the curve is at a relatively high level. This indicates that the blade is subjected to a large pressure load. Therefore, in practical applications, the impact of wave period on blade pressure coefficient distribution should be thoroughly accounted for to improve turbine structure design and performance optimization.
5. Conclusions
Using the IDDES model, this study investigated the hydrodynamic characteristics of a floating turbine with wave–current interaction across different regular wave heights and periods. It analyzed the platform’s multi-DoF motion responses (heave, surge, and pitch) and the variation law of mooring tension, and uncovered the evolution mechanisms of wake vortex structure in the flow field and pressure distribution on blades. The conclusions obtained are as follows:
- (1)
- Under the combined effect of waves and platform motion, the turbine’s power and thrust coefficients exhibit periodic variations with obvious temporal fluctuations, but the fluctuation amplitudes are unstable. As wave height rises, the fluctuation amplitudes of Cp and Ct gradually increase. At the maximum wave height condition, the peak Cp is 1.25 times that under the minimum wave height, and the peak Ct is 1.2 times that under the minimum wave height.
- (2)
- The platform’s motion response intensifies as the wave height increases. The pitch angle at a 0.12 m wave height is 3.5 times that at 0.04 m, and the mooring tension is 1.5 times. With a longer wave period, platform motion becomes gentler; mooring tension at a wave period of 0.8 s is twice that at 1.2 s.
- (3)
- As wave height and period increase, the flow velocity around the turbine increases, leading to flow turbulence, expanding the range of high-speed regions, and thus slowing down the velocity recovery. Meanwhile, due to the strong effect of the flow, the wake vortex shedding becomes highly disordered without obvious periodicity and regularity, and the shape and size of the wake vortices change drastically, especially those near the platform.
- (4)
- With increases in wave height and period, wave action on the blade root may be approximately uniform, but more complex wave–current interactions occur at the blade tip. This further causes pressure difference between the two sides to grow as the turbine’s relative flow velocity increases, which affects the quality of the output electric energy and causes severe fatigue loads.
- (5)
- Affected by waves and platform motion, the slope of the pressure coefficient distribution curve changes significantly from the blade’s suction surface to pressure surface and from the blade root to the tip, with clear transitions between curves. The overall value of the pressure coefficient at the tip of the blade is relatively higher.
Based on the fundamental exploration achievements of this study, the research will be deepened in multiple aspects in the future: expanding to more complex sea conditions such as irregular waves and unsteady currents that are closer to reality, and analyzing the dynamic response and safety performance of floating turbines under extreme conditions; strengthening the strong nonlinear coupling mechanism of the turbine-platform-mooring system and incorporating the multi-physical field effects such as structural elastic deformation and fluid–structure coupling to improve the fully coupled dynamic model. Physical model tests were carried out to verify the numerical simulation results, and the structure of the floating carrier and the configuration of the mooring system were optimized based on the parameter influence law to enhance stability and energy conversion efficiency. Based on the measured sea conditions data from specific sea areas such as Zhoushan, future work will explore the engineering operation control strategies for turbines to provide technical support for the large-scale application of floating tidal current energy devices. This research, as the first step in constructing a coupled dynamics analysis framework, will provide theoretical and methodological references for subsequent studies and promote the research and development and engineering processes for related marine renewable energy equipment.
Author Contributions
Conceptualization, R.J.; Methodology, X.Z., R.J., H.W., M.Y. and R.R.; Software, M.K., X.Z., R.J., M.Y. and H.L.; Validation, M.K., M.Y. and H.L.; Formal analysis, M.Y. and H.L.; Investigation, M.K., X.Z., H.L., K.S. and R.R.; Resources, H.W. and K.S.; Data curation, X.Z.; Writing—original draft, M.K., H.L. and R.R.; Writing—review & editing, M.K. and R.R.; Visualization, R.R.; Supervision, R.J.; Project administration, R.J., H.W. and K.S.; Funding acquisition, R.J., H.W. and K.S. All authors have read and agreed to the published version of the manuscript.
Funding
This research is financially supported by the National Natural Science Foundation of China (No. 42276228), the Guangdong Basic and Applied Basic Research Foundation of China (No. 2024A1515240027), the Basic Science (Natural Science) Foundation of the Jiangsu Higher Education Institutions of China (No. 24KJB570001), the Zhenjiang Social Development Guiding Science and Technology Plan Project (No. FZ2024116), and the MTIC-JUST Joint Innovation Center Development Fund (No. 2025MTIC-JUST001).
Data Availability Statement
Dataset available on request from the authors.
Conflicts of Interest
The authors declare no conflict of interest.
Nomenclature
| A | Swept Area of the Turbine’s Upstream Surface (m2) |
| c | Chord length (m) |
| Cp | Power coefficient of turbine (–) |
| Ct | Thrust coefficient of turbine (–) |
| D | Diameter of turbine (m) |
| F | Axial thrust exerted on the turbine (N) |
| Fi | Volume fraction of the i-th phase flow in the element (–) |
| Fr | Froude number (–) |
| g | Gravitational acceleration (m/s2) |
| H | Wave height (m) |
| k | Turbulent kinetic energy (m2/s2) |
| lIDDES | IDDES length scale (m) |
| lLES | Length scales of the LES (m) |
| lRANS | Length scales of the RANS (m) |
| m | Mass (kg) |
| Q | Torque applied to the turbine (N·m) |
| r | Radius from the center of blade (mm) |
| R | Radius of turbine (m) |
| Sij | Mean strain rate tensor (s−1) |
| t | Time (s) |
| T | Wave period (s) |
| VA | Inflow velocity (m/s) |
| θ | Twist angle (°) |
| λ | Tip speed ratio (–) |
| δ | Blade thickness (mm) |
| μ | Molecular viscosity (kg/ms) |
| μt | Turbulent viscosity (kg/ms) |
| ρ | Fluid density (kg/m3) |
| σ | Model coefficients (–) |
| τij | Stress tensor (N/m2) |
| ω | Rotational angular velocity (rad/s) |
| ωT | Rotational frequency of the turbine (rad/s) |
| CFD | Computational fluid dynamics |
| CM | Center of mass |
| IDDES | Improved delayed detached eddy simulation |
| SWL | Still water level |
References
- Veers, P.; Dykes, K.; Lantz, E.; Barth, S.; Bottasso, C.; Carlson, O.; Clifton, A.; Green, J.; Green, P.; Holttinen, H.; et al. Grand challenges in the science of wind energy. Science 2019, 366, eaau2027. [Google Scholar] [CrossRef]
- Zeng, X.; Shao, Y.; Feng, X.; Xu, K.; Jin, R.; Li, H. Nonlinear hydrodynamics of floating offshore wind turbines: A review. Renew. Sustain. Energy Rev. 2024, 191, 114092. [Google Scholar] [CrossRef]
- Chen, Y.; Kuang, L.; Su, J.; Zhou, D.; Cao, H.; Han, Z.; Zhao, Y.; Fu, S. Investigation of pitch angles on the aerodynamics of twin-VAWT under staggered arrangement. Ocean Eng. 2022, 254, 111385. [Google Scholar] [CrossRef]
- Cheng, Y.; Gong, J.; Zhang, J. Hydrodynamic investigation on a single-point moored offshore cage-wave energy converter hybrid system. Ocean Eng. 2024, 299, 116848. [Google Scholar] [CrossRef]
- Nachtane, M.; Tarfaoui, M.; Goda, I.; Rouway, M. A review on the technologies, design considerations and numerical models of tidal current turbines. Renew. Energy 2020, 157, 1274–1288. [Google Scholar] [CrossRef]
- Gong, S.; Gao, J.; Song, Z.; Shi, H.; Liu, Y. Hydrodynamics of fluid resonance in a narrow gap between two boxes with different breadths. Ocean Eng. 2024, 311, 118986. [Google Scholar] [CrossRef]
- Bosah, C.; Li, S.; Ampofo, G.; Sangare, L. A continental and global assessment of the role of energy consumption, total natural resource rent, and economic growth as determinants of carbon emission. Sci. Total Environ. 2023, 892, 164592. [Google Scholar] [CrossRef]
- Ji, R.; Kong, M.; Sun, K.; Zhang, J.; Zhu, R.; Yin, M.; Zhang, Y.; Fernandez-Rodriguez, E. Wake interference of tandem wind turbines considering pitch strategy based on the AL-LDS-Ωnew coupling method. Front. Energy Res. 2024, 12, 1449454. [Google Scholar] [CrossRef]
- Cheng, Y.; Fu, L.; Dai, S.; Collu, M.; Ji, C.; Yuan, Z.; Incecik, A. Experimental and numerical investigation of WEC-type floating breakwaters: A single-pontoon oscillating buoy and a dual-pontoon oscillating water column. Coast. Eng. 2022, 177, 104188. [Google Scholar] [CrossRef]
- Liu, W.; Cheng, Y.; Dai, S.; Yuan, Z.; Incecik, A. Wave energy harvesting performance of a novel Dual-mode Oscillating Buoy-Parabolic Oscillating Water Column (DOB-POWC) hybrid system. Renew. Energy 2025, 248, 123157. [Google Scholar] [CrossRef]
- Mi, C.; Gao, J.; Song, Z.; Yan, M. Gap resonance between a stationary box and a vertical wall induced by transient focused wave groups. China Ocean Eng. 2025, 39, 441–454. [Google Scholar] [CrossRef]
- Zhou, B.; Zheng, Z.; Jin, P.; Wang, L.; Zang, J. Wave attenuation and focusing performance of parallel twin parabolic arc floating breakwaters. Energy 2022, 260, 125164. [Google Scholar] [CrossRef]
- Zhang, Y.; Ji, R.; Sun, K.; Zhang, Z.; Zheng, Y.; Zhang, J.; Zhang, X.; Fernandez-Rodriguez, E. Research on complex wake interference of aligned rotors considering the precone variation of the upstream wind turbine. Front. Mar. Sci. 2022, 9, 1039233. [Google Scholar] [CrossRef]
- Chen, S.; Wang, K.; Wen, Y.; Le, C.; Gao, Z. Fully coupled dynamic analysis of novel floating dual-rotor wind turbines. Phys. Fluids 2025, 37, 017114. [Google Scholar] [CrossRef]
- Ji, R.; Li, X.; Ye, Y.; Zhu, R.; Sun, K.; Wu, M.; Huang, F.; Reabroy, R. Hydrodynamic characteristics of offshore wind turbine pile foundations under combined focusing wave-current conditions. J. Mar. Sci. Eng. 2024, 12, 2068. [Google Scholar] [CrossRef]
- Zhou, B.; Hu, J.; Wang, Y.; Jin, P.; Jing, F.; Ning, D. Coupled dynamic and power generation characteristics of a hybrid system consisting of a semi-submersible wind turbine and an array of heaving wave energy converters. Renew. Energy 2023, 214, 23–38. [Google Scholar] [CrossRef]
- Cheng, Y.; Song, F.; Fu, L.; Dai, S.; Yuan, Z.; Incecik, A. Experimental investigation of a dual-pontoon WEC-type breakwater with a hydraulic-pneumatic complementary power take-off system. Energy 2024, 286, 129427. [Google Scholar] [CrossRef]
- Jungrungruengtaworn, S.; Reabroy, R.; Thaweewat, N.; Hyun, B. Numerical and experimental study on hydrodynamic performance of multi-level OWEC. Ocean Syst. Eng. 2020, 10, 359–371. [Google Scholar]
- Ji, R.; Sheng, Q.; Wang, S.; Zhang, Y.; Zhang, X.; Zhang, L. Array characteristics of oscillating-buoy two-floating-body wave-energy converter. J. Mar. Sci. Appl. 2019, 18, 325–333. [Google Scholar] [CrossRef]
- Wang, Y.; Zhang, Y.; Zhang, Z.; Ji, R.; Lee, Y.; Fernandez-Rodriguez, E. Experimental investigation of wake dynamics and power fluctuations of a horizontal-axis tidal stream turbine under co-and counter-directional wave-current environment. Phys. Fluids 2025, 37, 075127. [Google Scholar] [CrossRef]
- Ji, R.; Sun, K.; Wang, S.; Li, Y.; Zhang, L. Analysis of hydrodynamic characteristics of ocean ship two-unit vertical axis tidal current turbines with different arrangements. J. Coast. Res. 2018, 83, 98–108. [Google Scholar] [CrossRef]
- Fan, M.; Sun, Z.; Yu, R.; Dong, X.; Li, Z.; Bai, Y. Effect of leading-edge tubercles on the hydrodynamic characteristics and wake development of tidal turbines. J. Fluids Struct. 2023, 119, 103873. [Google Scholar] [CrossRef]
- Peng, B.; Zhang, Y.; Zheng, Y.; Wang, R.; Fernandez-Rodriguez, E.; Tang, Q.; Zhang, Z.; Zang, W. The effects of surge motion on the dynamics and wake characteristics of a floating tidal stream turbine under free surface condition. Energy Convers. Manag. 2022, 266, 115816. [Google Scholar] [CrossRef]
- Li, F.; Yao, J.; Eskilsson, C.; Pan, Y.; Chen, J.; Ji, R. Investigations on the wave performance of Savonius turbine operating under initial phase-locked strategy. Phys. Fluids 2023, 35, 9. [Google Scholar] [CrossRef]
- Yin, M.; Ji, R.; Zhu, R.; Sun, K.; Wu, M.; Li, X.; Ye, Y.; Reabroy, R.; Zhang, Y. Hydrodynamic performance of a horizontal-axis tidal turbine subjected to terrain-induced turbulence using the lattice Boltzmann method. Phys. Fluids 2025, 37, 035169. [Google Scholar] [CrossRef]
- Zhang, Z.; Zhang, Y.; Zheng, Y.; Zhang, J.; Fernandez-Rodriguez, E.; Zang, W.; Ji, R. Power fluctuation and wake characteristics of tidal stream turbine subjected to wave and current interaction. Energy 2023, 264, 126185. [Google Scholar] [CrossRef]
- Zhang, Y.; Fernandez-Rodriguez, E.; Zheng, J.; Zheng, Y.; Zhang, J.; Gu, H.; Zang, W.; Lin, X. A review on numerical development of tidal stream turbine performance and wake prediction. IEEE Access 2020, 8, 79325–79337. [Google Scholar] [CrossRef]
- Cheng, Y.; Fu, L.; Dai, S.; Collu, M.; Cui, L.; Yuan, Z.; Incecil, A. Experimental and numerical analysis of a hybrid WEC-breakwater system combining an oscillating water column and an oscillating buoy. Renew. Sustain. Energy Rev. 2022, 169, 112909. [Google Scholar] [CrossRef]
- Mei, Y.; Jing, F.; Lu, Q.; Guo, B. Study on the hydrodynamic and wake characteristics of variable speed control of horizontal axis tidal turbine under surge motion. Energy 2024, 298, 131380. [Google Scholar] [CrossRef]
- Yuan, Z.; Jiang, J.; Zang, J.; Sheng, Q.; Sun, K.; Zhang, X.; Ji, R. A fast two-dimensional numerical method for the wake simulation of a vertical axis wind turbine. Energies 2020, 14, 49. [Google Scholar] [CrossRef]
- Ji, R.; Zheng, J.; Xue, M.; Sun, K.; Ye, Y.; Zhu, R.; Fernandez-Rodriguez, E.; Zhang, Y. Investigations on the performance and wake dynamics of a tidal stream turbine under different yaw-offset conditions. Phys. Fluids 2025, 37, 015192. [Google Scholar] [CrossRef]
- Wang, B.; Bai, X.; Lei, G.; Zhang, W.; Ji, R. Effect analysis of the V-angle and straight edge length on the performance of V-shaped blades for a Savonius hydrokinetic turbine. J. Mar. Sci. Eng. 2025, 13, 1240. [Google Scholar] [CrossRef]
- Cheng, Y.; Liu, W.; Dai, S.; Yuan, Z.; Incecik, A. Wave energy conversion by multi-mode exciting wave energy converters arrayed around a floating platform. Energy 2024, 313, 133621. [Google Scholar] [CrossRef]
- Xue, M.A.; Yang, J.; Yuan, X.; Lu, Z.; Zheng, J.; Lin, P. Vibration controlling effect of tuned liquid column damper (TLCD) on support structural platform (SSP). Ocean Eng. 2024, 306, 118117. [Google Scholar] [CrossRef]
- Ji, R.; Wu, M.; Zheng, J.; Sun, K.; Zhang, J.; Xue, M.; Reabroy, R.; Zhang, Y. Lagrangian dynamic large-eddy simulation of the performance of a horizontal-axis tidal turbine with an actuator-line method. Phys. Fluids 2025, 37, 075169. [Google Scholar] [CrossRef]
- Kong, M.; Ji, R.; Wu, M.; Sun, K.; Zhang, J.; Zhang, Y.; Zhu, R.; Reabroy, R. Correction of sidewall blockage effect for twin-rotor vertical axis tidal stream turbine subjected to different solidities. Phys. Fluids 2025, 37, 035157. [Google Scholar] [CrossRef]
- Zhang, Y.; Zhang, Z.; Zheng, J.; Zheng, Y.; Zhang, J.; Liu, Z.; Fernandez-Rodriguez, E. Research of the array spacing effect on wake interaction of tidal stream turbines. Ocean Eng. 2023, 276, 114227. [Google Scholar] [CrossRef]
- Chen, W.; Wang, S.; Zhang, Y.; Guo, W.; Wang, K.; Chen, L. A fast hydrodynamic prediction method of horizontal axis tidal turbine with surging motion under wave-current condition. Ocean Eng. 2023, 290, 116318. [Google Scholar] [CrossRef]
- Wang, S.; Li, C.; Zhang, Y.; Jing, F.; Chen, L. Influence of pitching motion on the hydrodynamic performance of a horizontal axis tidal turbine considering the surface wave. Renew. Energy 2022, 189, 1020–1032. [Google Scholar] [CrossRef]
- Zhang, Y.; Peng, B.; Chen, F.; Zang, W.; Fernandez-Rodriguez, E.; Zhang, D.; Zhu, W. Numerical prediction of the surge-induced response of a tidal twin-turbine system. Energy 2025, 330, 136748. [Google Scholar] [CrossRef]
- Xu, J.; Zhang, Y.; Peng, B.; Zheng, Y.; Li, C.; Zang, W.; Fernandez-Rodriguez, E. Study on the dynamics and wake characteristics of a floating tidal stream turbine with pitch motion under free surface. Phys. Fluids 2023, 35, 085101. [Google Scholar] [CrossRef]
- Li, C.; Zhang, Y.; Zheng, Y.; Qian, Y.; Hua, H.; Ren, S.; Fernandez-Rodriguez, E. Effects of surge and roll motion on a floating tidal turbine using the actuator-line method. Phys. Fluids 2023, 35, 075125. [Google Scholar] [CrossRef]
- Wang, S.; Tang, J.; Li, C.; Ji, R.; Fernandez-Rodriguez, E. Performance evaluation and fast prediction of a pitched horizontal-axis tidal turbine under wave-current conditions using a variable-speed control strategy. J. Fluids Struct. 2025, 133, 104265. [Google Scholar] [CrossRef]
- Zang, W.; Zhang, Y.; Zheng, Y.; Zhang, J.; Guan, D.; Fernandez-Rodriguez, E. On the impact of waves and turbulence on the power fluctuations and wake structure of a tidal-stream turbine. Phys. Fluids 2023, 35, 055115. [Google Scholar] [CrossRef]
- Yang, H.; Zheng, X.; Chen, Y.; Yan, H.; Chen, S.; Lai, W. Coupled dynamic response and energy conversion characteristics of 10 MW floating vertical axis wind turbine with different configurations. Ocean Eng. 2024, 309, 118610. [Google Scholar] [CrossRef]
- Hua, H.; Zhang, Y.; Qin, Z.; Yang, Y.; Fernandez-Rodriguez, E. Dynamic response of a semi-submersible floating wind turbine-point absorption wave energy hybrid energy system under rated and extreme conditions. Phys. Fluids 2025, 37, 017144. [Google Scholar] [CrossRef]
- Xue, M.A.; Dou, P.; Zheng, J.; Lin, P.; Yuan, X. Pitch motion reduction of semisubmersible floating offshore wind turbine substructure using a tuned liquid multicolumn damper. Mar. Struct. 2022, 84, 103237. [Google Scholar] [CrossRef]
- Wang, K.; Li, Y.; Ong, M.C.; Wan, L.; Li, L.; Cheng, Z. Extreme responses of an integrated system with a semi-submersible wind turbine and four torus-shaped wave energy converters in different survival modes. China Ocean Eng. 2024, 38, 877–892. [Google Scholar] [CrossRef]
- Yi, Y.; Sun, K.; Liu, Y.; Zhang, J.; Ji, R.; Wu, S. Hydrodynamic performance investigation of the floating wind turbine and point-absorber array hybrid system using a fully-coupled CFD model. Ocean Eng. 2024, 313, 119215. [Google Scholar] [CrossRef]
- Mi, C.; Gao, J.; Song, Z.; Lin, Y. Hydrodynamic wave forces on two side-by-side barges subjected to nonlinear focused wave groups. Ocean Eng. 2025, 317, 120056. [Google Scholar] [CrossRef]
- Gao, J.; Mi, C.; Song, Z.; Liu, Y. Transient gap resonance between two closely-spaced boxes triggered by nonlinear focused wave groups. Ocean Eng. 2024, 305, 117938. [Google Scholar] [CrossRef]
- Cheng, X.; Huang, X.; Xu, D.; Zhao, Z.; Liu, H.; Kong, M.; Ji, R. Ship Optimization Based on Fully-Parametric Models for Hull, Propeller and Rudder. J. Mar. Sci. Eng. 2024, 12, 1635. [Google Scholar] [CrossRef]
- Zhang, Y.; Peng, B.; Zheng, J.; Zheng, Y.; Tang, Q.; Liu, Z.; Xu, J.; Wang, Y.; Fernandez-Rodriguez, E. The impact of yaw motion on the wake interaction of adjacent floating tidal stream turbines under free surface condition. Energy 2023, 283, 129071. [Google Scholar] [CrossRef]
- Jing, F.; Mei, Y.; Lu, Q.; Yang, L.; Guo, B. Study on the performance of a floating horizontal-axis tidal turbine with pitch motion under wave–current interaction. Phys. Fluids 2024, 36, 047122. [Google Scholar] [CrossRef]
- Zhang, L.; Wang, S.; Sheng, Q.; Jing, F.; Ma, Y. The effects of surge motion of the floating platform on hydrodynamics performance of horizontal-axis tidal current turbine. Renew. Energy 2015, 74, 796–802. [Google Scholar] [CrossRef]
- Wang, S.; Sun, K.; Xu, G.; Liu, Y.; Bai, X. Hydrodynamic analysis of horizontal-axis tidal current turbine with rolling and surging coupled motions. Renew. Energy 2017, 102, 87–97. [Google Scholar] [CrossRef]
- Wang, S.; Xu, G.; Zhu, R.; Wang, K. Hydrodynamic analysis of vertical-axis tidal current turbine with surging and yawing coupled motions. Ocean Eng. 2018, 155, 42–54. [Google Scholar] [CrossRef]
- Wang, S.; Li, C.; Xie, Y.; Xu, G.; Zhu, R.; Liu, K. Research on hydrodynamic characteristics of horizontal axis tidal turbine with rotation and pitching motion under free surface condition. Ocean Eng. 2021, 235, 109383. [Google Scholar] [CrossRef]
- Wang, S.; Cui, J.; Ye, R.; Chen, Z.; Zhang, L. Study of the hydrodynamic performance prediction method for a horizontal-axis tidal current turbine with coupled rotation and surging motion. Renew. Energy 2019, 135, 313–325. [Google Scholar] [CrossRef]
- Zhang, B.; Jin, Y.; Cheng, S.; Zheng, Y.; Chamorro, L. On the dynamics of a model wind turbine under passive tower oscillations. Appl. Energy 2022, 311, 118608. [Google Scholar] [CrossRef]
- Zhang, X.; He, H.; Hao, H.; Ma, Y. Prediction of ultimate tensions in mooring lines for a floating offshore wind turbine considering extreme gusts. Eng. Appl. Comput. Fluid Mech. 2024, 18, 2356223. [Google Scholar] [CrossRef]
- Zhang, Y.; Wei, W.; Zheng, J.; Peng, B.; Qian, Y.; Li, C.; Zheng, Y.; Fernandez-Rodriguez, E.; Yu, A. Quantifying the surge-induced response of a floating tidal stream turbine under wave-current flows. Energy 2023, 283, 129072. [Google Scholar] [CrossRef]
- Guo, X.; Yang, J.; Lu, W.; Li, X. Dynamic responses of a floating tidal turbine with 6-DOF prescribed floater motions. Ocean Eng. 2018, 165, 426–437. [Google Scholar] [CrossRef]
- Wang, G.; Zhang, J.; Lu, B.; Lin, X.; Wang, F.; Liu, S. Experimental investigation of motion response and mooring load of semi-submersible tidal stream energy turbine under wave-current interactions. Ocean Eng. 2024, 300, 117445. [Google Scholar] [CrossRef]
- Lei, H.; Zhou, D.; Bao, Y.; Li, Y.; Han, Z. Three-dimensional Improved Delayed Detached Eddy Simulation of a two-bladed vertical axis wind turbine. Energy Convers. Manag. 2017, 133, 235–248. [Google Scholar] [CrossRef]
- Mikhail, L.S.; Philippe, R.S.; Mikhail, K.S.; Andrey, K.T. A hybrid RANS-LES approach with delayed-DES and wall-modelled LES capabilities. Int. J. Heat Fluid Flow 2008, 29, 1638–1649. [Google Scholar]
- Robertson, A.; Jonkman, J.; Masciola, M.; Song, H. Definition of the Semisubmersible Floating System for Phase II of OC4; National Renewable Energy Lab (NREL): Golden, CO, USA, 2014.
- Zhang, Y.; Zang, W.; Zheng, J.; Cappietti, L.; Zhang, J.; Zheng, Y.; Fernandez-Rodriguez, E. The influence of waves propagating with the current on the wake of a tidal stream turbine. Appl. Energy 2021, 290, 116729. [Google Scholar] [CrossRef]
- Zhao, W.; Wan, D. Numerical Study of Interactions Between Phase II of OC4 Wind Turbine and Its Semi-Submersible Floating Support System. J. Ocean. Wind. Energy 2015, 2, 45–53. [Google Scholar]
- Yang, Y.; Liu, Y. Three-degree-of-freedom vortex-induced motions of an OC4 floating offshore wind turbine platform under different current incidences. Ocean Eng. 2025, 330, 121240. [Google Scholar] [CrossRef]
- Li, X.; Xiao, Q.; Wang, E.; Peyrard, C.; Gonçalves, R. The dynamic response of floating offshore wind turbine platform in wave–current condition. Phys. Fluids 2023, 35, 087113. [Google Scholar] [CrossRef]
- Liu, Y.; Xiao, Q.; Incecik, A.; Peyrard, C.; Wan, D. Establishing a fully coupled CFD analysis tool for floating offshore wind turbines. Renew. Energy 2017, 112, 280–301. [Google Scholar] [CrossRef]
- Tran, T.T.; Kim, D.-H. Fully coupled aero-hydrodynamic analysis of a semi submersible FOWT using a dynamic fluid body interaction approach. Renew. Energy 2016, 92, 244–261. [Google Scholar] [CrossRef]
- Tran, T.T.; Kim, D.-H. A CFD study into the influence of unsteady aerodynamic interference on wind turbine surge motion. Renew. Energy 2016, 90, 204–228. [Google Scholar] [CrossRef]
- Jin, W. Evaluation of Tidal Current Energy Resources in Zhoushan Sea Area and Site Selection of Tidal Current Energy Power; Zhejiang Ocean University: Zhoushan, China, 2021. (In Chinese) [Google Scholar]
- Wang, S.; Peng, Y.; Dong, L.; Jiao, Y. An overview of ocean renewable energy in China. Renew. Sustain. Energy Rev. 2011, 15, 91–111. [Google Scholar] [CrossRef]
- Gao, P.; Zheng, J.; Zhang, J. Potential Assessment of Tidal Stream Energy Around Hulu Island, China. Procedia Eng. 2015, 116, 871–879. [Google Scholar] [CrossRef]
- Liu, X.; Chen, Z.; Si, Y.; Qian, P.; Wu, H.; Cui, L.; Zhang, D. A review of tidal current energy resource assessment in China. Renew. Sustain. Energy Rev. 2021, 145, 111012. [Google Scholar] [CrossRef]
- Dai, P.; Huang, Z.; Zhang, J. A modelling study of the tidal stream resource around Zhoushan Archipelago, China. Renew. Energy 2023, 218, 119234. [Google Scholar] [CrossRef]
- Zhang, H.; Zhou, B.; Vogel, C.; Willden, R.; Zang, J.; Zhang, L. Hydrodynamic performance of a floating breakwater as an oscillating-buoy type wave energy converter. Appl. Energy 2020, 257, 113996. [Google Scholar] [CrossRef]
- Hu, J.; Song, C.; Ji, R.; Deng, J.; Zhang, H.; Xu, G. Hydrodynamic sheltering characteristic assessment for a ship using wave attenuation systems in numerical wave tanks. Phys. Fluids 2025, 37, 075163. [Google Scholar] [CrossRef]
- Chen, Y.; Yu, D.; Duan, Y.; Zhang, J.; Jiang, L. Investigation of coupled motion and power generation characteristics in a star-CCM-based floating wind-wave-current power generation platform. Ocean Eng. 2025, 331, 121255. [Google Scholar] [CrossRef]
- Edera, O.; Niosi, F.; Casalone, P.; Bonfanti, M.; Paduano, B.; Mattiazzo, G. Understanding wave energy converters dynamics: High-fidelity modeling and validation of a moored floating body. Appl. Energy 2024, 376, 124202. [Google Scholar] [CrossRef]
- Hu, C.; Tang, C.; Yu, W.; Ma, Y. Coupled interactions analysis of a floating tidal current power station in uniform flow. J. Mar. Sci. Eng. 2021, 9, 958. [Google Scholar] [CrossRef]
- Boger, D.; Paterson, E.; Noack, R.W. FoamedOver: A Dynamic Overset Grid Implementation in OpenFOAM. In Proceedings of the 10th Symposium on Overset Composite Grids and Solution Technology, NASA Ames Research Center, Moffet Field, CA, USA, 20–23 September 2010. [Google Scholar]
- Wang, Z.; Fan, Z.; Liu, F.; Jiang, X.; Li, B.; Qiu, M. Large-scale parallel simulation with implicit conservative overlapped grid technique for compressor flow. Comput. Fluids 2022, 238, 105375. [Google Scholar] [CrossRef]
- Nini, M.; Motta, V.; Biodolino, G.; Guardone, A. Three-dimensional simulation of a complete Vertical Axis Wind Turbine using overlapping grids. J. Comput. Appl. Math. 2014, 270, 78–87. [Google Scholar] [CrossRef]
- Mittal, K.; Dutta, S.; Fischer, P. Multirate timestepping for the incompressible Navier-Stokes equations in overlapping grids. J. Comput. Phys. 2021, 437, 110335. [Google Scholar] [CrossRef]
- Zhang, Y.; Kim, B. A fully coupled computational fluid dynamics method for analysis of semi-submersible floating offshore wind turbines under wind-wave excitation conditions based on OC5 data. Appl. Sci. 2018, 8, 2314. [Google Scholar] [CrossRef]
- Nematbakhsh, A.; Olinger, D.J.; Tryggvason, G. Nonlinear simulation of a spar buoy floating wind turbine under extreme ocean conditions. J. Renew. Sustain. Energy 2014, 6, 033121. [Google Scholar] [CrossRef]
- Zhang, H.; Cao, X.; Zeng, F.; Zhang, N.; Gu, Q. Hydrodynamic analysis of three semi-submersible floating offshore wind turbines under wave and current conditions. Ocean Eng. 2025, 331, 121322. [Google Scholar] [CrossRef]
- Wang, K.; Zhao, M.; Chen, S.; Zha, R. Aerodynamic performance analysis of a floating wind turbine with coupled blade rotation and surge motion. Eng. Appl. Comput. Fluid Mech. 2024, 18, 2301524. [Google Scholar] [CrossRef]
- Zeng, X.; Shi, W.; Feng, X.; Shao, Y.; Li, X. Investigation of higher-harmonic wave loads and low-frequency resonance response of floating offshore wind turbine under extreme wave groups. Mar. Struct. 2023, 89, 103401. [Google Scholar] [CrossRef]
- Huang, B.; Zhao, B.; Wang, L.; Wang, P.; Zhao, H.; Guo, P.; Yang, S.; Wu, D. The effects of heave motion on the performance of a floating counter-rotating type tidal turbine under wave-current interaction. Energy Convers. Manag. 2022, 252, 115093. [Google Scholar] [CrossRef]
- Cheng, X.; Wang, D.; Huang, X.; Yan, X.; Dou, P.; Ji, R. Comparative investigations on hull line optimization based on traditional and fully parametric methods for saving energy. Front. Energy Res. 2024, 12, 1359957. [Google Scholar] [CrossRef]
- Deng, X.; Law, A.; Zhang, J.; Lin, X. Two phase fluid-actuator line-immersed boundary coupling for tidal stream turbine modeling with scouring morphology under wave-current loading. Energy 2025, 329, 136757. [Google Scholar] [CrossRef]
- Draycott, S.; Payne, G.; Steynor, J.; Nambiar, A.; Sellar, B.; Venugopal, V. An experimental investigation into non-linear wave loading on horizontal axis tidal turbines. J. Fluids Struct. 2019, 84, 199–217. [Google Scholar] [CrossRef]
- Whelan, J.I. A Fluid Dynamic Study of Free-Surface Proximity and Inertia Effects on Tidal Turbines; Imperial College: London, UK, 2019. [Google Scholar]
- Li, X.; Li, M.; Jordan, L.-B.; McLelland, S.; Parsons, D.; Amoudry, L.; Song, Q.; Comerford, L. Modelling impacts of tidal stream turbines on surface waves. Renew. Energy 2019, 130, 725–734. [Google Scholar] [CrossRef]
- Cheng, Y.; Dai, S.; Dai, S.; Ji, C.; Collu, M.; Yuan, Z.; Incecik, A. Energy conversion and hydrodynamic analysis of multi-degree-of-freedom wave energy converters integrated into a semi-submersible platform. Energy Convers. Manag. 2022, 252, 115075. [Google Scholar] [CrossRef]
- International Towing Tank Conference. Uncertainty Analysis in Cfd, Verification and Validation Methodology and Procedures; ITTC: Ankara/Istanbul, Turkey, 2017. [Google Scholar]
- Ji, R.; Sun, K.; Zhang, J.; Zhu, R.; Wang, S. A novel actuator line-immersed boundary (AL-IB) hybrid approach for wake characteristics prediction of a horizontal-axis wind turbine. Energy Convers. Manag. 2022, 253, 115193. [Google Scholar] [CrossRef]
Disclaimer/Publisher’s Note: The statements, opinions and data contained in all publications are solely those of the individual author(s) and contributor(s) and not of MDPI and/or the editor(s). MDPI and/or the editor(s) disclaim responsibility for any injury to people or property resulting from any ideas, methods, instructions or products referred to in the content. |
© 2025 by the authors. Licensee MDPI, Basel, Switzerland. This article is an open access article distributed under the terms and conditions of the Creative Commons Attribution (CC BY) license (https://creativecommons.org/licenses/by/4.0/).