Abstract
The expansion of offshore renewable energy development in Portugal necessitates accurate geological and geotechnical site characterization, especially in regions with limited baseline information. This study focuses on the S. Pedro de Moel area (NW central Portugal), which is characterized by sandy sediments, with the aim of supporting the preliminary design of anchoring and foundation systems for renewable energy structures. An integrated methodology was applied, combining multibeam bathymetry, acoustic backscatter data, high-resolution seismic reflection profiling, sediment sampling, and onshore laboratory testing. Seismic interpretation identified three subsurface units: (1) a deformed carbonated sandstone serving as the acoustic basement; (2) a well-graded sandy gravel layer, up to 8 m thick, interpreted as a marginal marine deposit; and (3) a modern sandy deposit, up to 7 m thick, with variable silt content. Geotechnical analyses yielded effective friction angles for sandy sediments ranging from 39 to 44°, and deformation moduli between 22 MPa and 54 MPa. The sedimentary succession exhibits marked lateral and vertical heterogeneity, which must be considered in engineering design. This cost-effective methodology offers a viable alternative to offshore in situ testing, enabling medium-scale site characterization and providing essential information to support the development of offshore renewable energy infrastructure.
1. Introduction
The growing demand for sustainable energy solutions has positioned renewable energy production as a central component of the European Union (EU) energy policy. Binding targets established by EU Directives [1,2] and the Europe 2020 strategy aim to significantly increase the share of renewable energy in the overall energy mix by 2030 [3]. In response, EU Member States, including Portugal, have implemented strategies to reduce energy consumption, enhance technological efficiency, and promote renewable energy production, particularly in the electricity sector.
Although onshore renewable technologies such as wind farms, solar parks, biomass facilities, and hydroelectric plants have reached a mature stage of development, their further expansion is increasingly constrained by spatial limitations and visual impacts concerns. These challenges have driven growing interest in offshore renewable energy sources, which offer greater spatial availability and resource potential [4,5,6].
In this context, the Portuguese government has supported several pilot initiatives focused on offshore renewable energy technologies, notably through the legal designation of a Pilot Zone for the testing of offshore devices [7]. These initiatives have enabled active private sector participation in the development, demonstration, and testing of various concepts and technologies. Notable examples include floating wind energy through the WindFloat project (2016) [8], and wave energy technologies such as the Pelamis device (2005, 2007) and the oscillating wave surge converter WaveRoller (2012).
More recently, the Portuguese government, through a Resolution of the Council of Ministers [9], approved the Allocation Plan for Offshore Renewable Energies (PAER). This plan designates five concession zones for the development of marine renewable energy, encompassing a total area of 2711.6 km2 and targeting an installed capacity of 9.4 GW.
However, the development of offshore renewable energy infrastructure depends on more than resource potential and supportive policy frameworks. A critical prerequisite is marine spatial planning, which must account for a range of interdependent factors. These include oceanographic conditions (e.g., wind regimes, wave dynamics, currents, and tide patterns), logistical considerations (such as proximity to ports and maintenance infrastructure), and potential conflicts with existing maritime activities (including shipping routes, fishing grounds, and maritime protected areas) [10,11].
Within this background, geological and geotechnical site characterization plays a fundamental role in the planning, design, and installation of offshore energy structures. Geotechnical soil properties directly influence the selection, sizing, and performance of foundation systems [12,13]. Insufficient knowledge of seabed conditions can lead to suboptimal designs, increased costs, or even structural failures [14,15,16].
In Northern Europe, the integration of geotechnical data into offshore renewable energy projects is well documented, particularly in the case of offshore wind farms [17,18,19]. However, such studies often treat marine soil characterization as a secondary or supporting task. Recognizing the relevance of geotechnical information, several initiatives have sought to develop detailed geological models for the UK and Irish continental shelves, increasing the understanding of the seabed conditions [20,21].
In France, a group of technical experts from the French Committee for Soil Mechanics and Geotechnics developed a set of recommendations for planning and design of anchor foundations for floating wind turbines, as summarized by [22]. In Italy, Ref. [23] compiled a geotechnical database derived from offshore site investigation performed by the oil and gas sector since the 1950s.
In contrast, Portugal remains at an early stage in the systematic incorporation of geotechnical assessments into offshore renewable energy planning. Although geological maps of the continental shelf have been published, comprehensive geotechnical datasets are still lacking. This gap is particularly relevant along the West Iberian margin of the Atlantic Ocean, where the continental shelf is predominantly composed of coarse siliciclastic sediments, mainly sands [24,25,26], and is subject to moderate- to high-energy oceanographic conditions.
Despite the critical role of soil behavior, which is strongly influenced by physical and chemical properties as well as stress history, there remains a significant lack of geotechnical information for the Portuguese offshore.
This study addresses the current knowledge gap by presenting a geotechnical case study for a site located off the central west coast of Portugal (Figure 1), with the objective of contributing to the safe and cost-effective development of marine renewable energy infrastructure. This approach is aligned with the holistic site investigation methodology proposed by Det Norske Veritas (DNV).
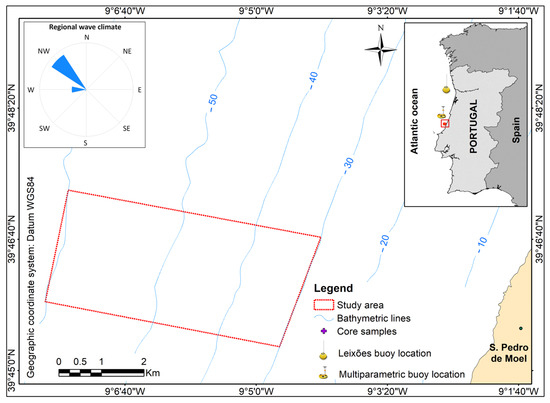
Figure 1.
The study area location.
2. Regional Setting
2.1. Oceanography
Due to its geographic position, the western coast of Portugal is directly exposed to ocean wave systems generated in the North Atlantic and influenced by prevailing westerly winds. The local wave regime is dominated by long-period swell originating from distant storms, which typically results in higher significant wave heights and longer wave periods compared to locally generated wind waves.
The Leixões buoy, situated to the north of the study area at a depth of 83 m (Figure 1), provides long term oceanographic data. According to [27], wave records from the Leixões buoy between 1999 and 2010 show that the region is predominantly influenced by waves from the northwest (NW), occurring 71% of the time during the period 1999–2009. Waves from the west (W) accounted for 25%, while those from the southwest (SW) represented only 3% of observations (Figure 2).
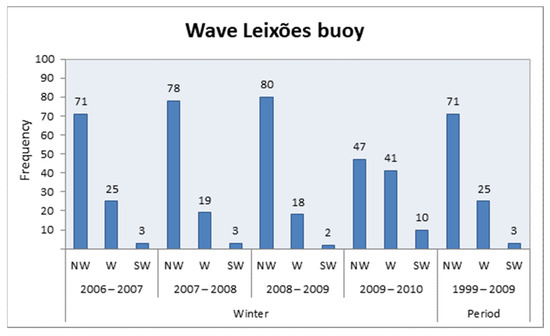
Figure 2.
Distribution of sea state occurrences during winter at the Leixões buoy, based on data presented by [27].
Analysis of winter data from 2006 to 2010 confirms this directional pattern, except for the winter of 2009–2010, during which there was an increased incidence of W and SW wave conditions. This anomaly is associated with a higher frequency of low-pressure systems and their associated frontal boundaries [28].
The prevailing of NW wave direction is primarily attributed to the persistent influence of the Azores semi-permanent high-pressure system over the North Atlantic. In contrast, W and SW wave events are generally linked to the development and passage of Atlantic depressions and their frontal systems.
Additional confirmation of the regional wave climate is provided by a multiparametric buoy located at a depth of 60 m, approximately 11 km north of the study area (Figure 1). Data recorded between December 2011 and June 2012 corroborate the findings from the Leixões buoy [27,29]. Notably, in December 2011, significant wave heights exceeding 12 m were recorded at this location [30], highlighting the region’s potential for extreme sea states.
2.2. Geomorphological and Geological Settings
The Portuguese continental shelf between Nazaré and Figueira da Foz has an average width of approximately 46 km, extending from the coastline to a depth of around 160 m. It is generally characterized by a relatively flat surface, although minor topographic features locally disrupt this morphology (Figure 3). The most prominent of these is the Pinhal relief, an elevated feature of about 20 m high located at a depth of 100 m [31]. Seafloor slopes across this segment of the shelf are gentle, ranging between 0.3% and 1.0% (Figure 3).
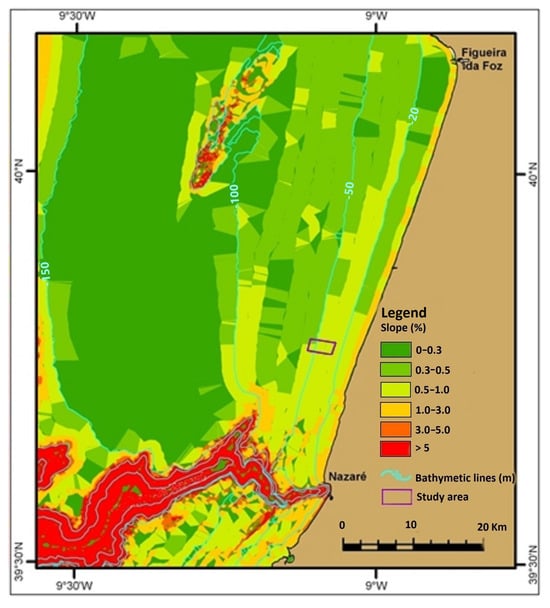
Figure 3.
Map of offshore slopes in the region between Figueira da Foz (N) and Nazaré (S). Adapted from [24].
This smooth seafloor morphology observed in the study area can be attributed to the underlying geological structure, which consists predominantly of a westward-tilting monocline [32,33,34], locally disrupted by tectonic features. This structural configuration reflects the Meso-Cenozoic geodynamic evolution of the Iberian Peninsula, closely associated with the opening of the North Atlantic Ocean. Following the counterclockwise rotation of the Iberian Peninsula, the newly formed Lusitanian Basin was progressively infilled with marine and terrestrial sediments originating from the adjacent continental margin [33,34].
Seismic profiles acquired in the study area reveal two distinct stratigraphic units, designated B and F. Seismic unit B, of Mesozoic age, represents the acoustic basement (Figure 4). Where this unit is exposed on the seafloor, a distinctive rough morphology is observed, consistent with carbonate detrital formations [35]. According to [34], these outcrops are composed of compact rock exhibiting evidence of chemical weathering and structural deformation features, including joints, dissolution features, and faults.
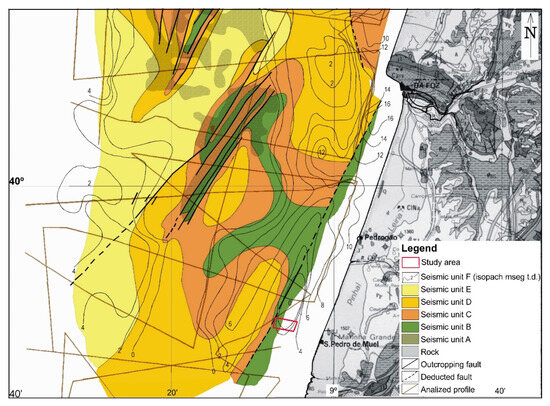
Figure 4.
Seismic formations mapping of the continental shelf between Nazaré and Figueira da Foz. Adapted from [34].
The second stratigraphic unit identified in the seismic data, referred to as seismic unit F (Figure 4), overlies all older units except where localized topographic highs expose deeper strata. This unit is relatively recent, dating to the Upper Quaternary and Holocene (less than 20,000 years ago) [34].
According to the seismic unit map (Figure 4), the thickness of this superficial unit at the study site is generally less than 4 milliseconds in two-way travel time (TWT). Surface sediment composition varies across the shelf: coastal zones are predominantly covered by coastal deposits [24], while the mid-shelf region is largely composed of sandy gravel (Figure 5). Between depths of 30 m and 50 m, marine sediments are primarily fine sand, whereas between 50 m and 60 m depth range, coarser sediments, ranging from coarse to very coarse sand, and occasionally including gravel, are more prevalent.
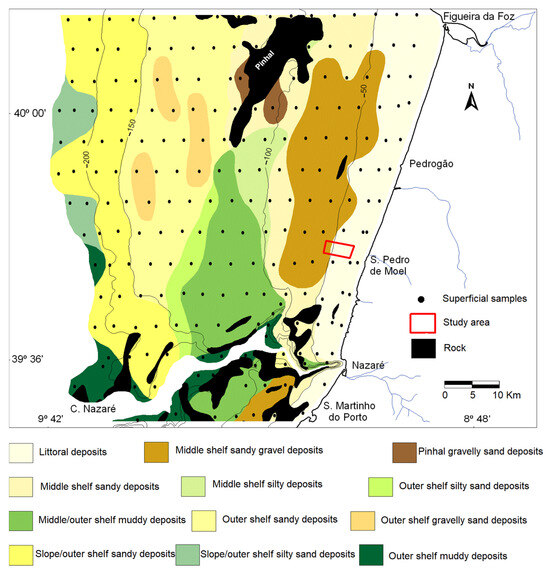
Figure 5.
Distribution of the superficial sedimentary deposits. Adapted from [24].
Based on McManus’s classification [36], these coarser sediments are considered relict, indicating deposition under different environmental conditions that differ from the present. This interpretation is consistent with earlier studies [37,38], and supports the hypothesis that these deposits are remnants of a paleo-littoral zone [24], likely formed approximately 10,000 years ago when the sea level was about 60 m lower than it is today [25,37].
The sediments are predominantly terrigenous in origin, composed mainly of quartz (~55%) and micas (~15%). Biogenic components account for approximately 15% and consist mostly of mollusk shell fragments.
3. Methods
The characterization of the study area was carried out using a combination of geophysical techniques, including multibeam echo sounding (EM710) and high-resolution seismic reflection profiling, complemented by both surface and vertical sampling of the unconsolidated sedimentary layer. All datasets were georeferenced using a Differential Global Navigation Satellite System (DGNSS).
A survey was conducted by the Portuguese Instituto Hidrográfico (IH) aboard research ship NRP Almirante Gago Coutinho. The campaign involved the simultaneous acquisition of full-coverage bathymetric data using a Simrad—Kongsberg multibeam echo sounder and the acquisition of 50 high-resolution seismic profiles using the Echoes 3500 sub-bottom profiler system—Ixsea (Figure 6). In addition, a boomer system (Applied Acoustics) was also used to acquire nine supplementary seismic reflection profiles with greater penetration depth (Figure 6).
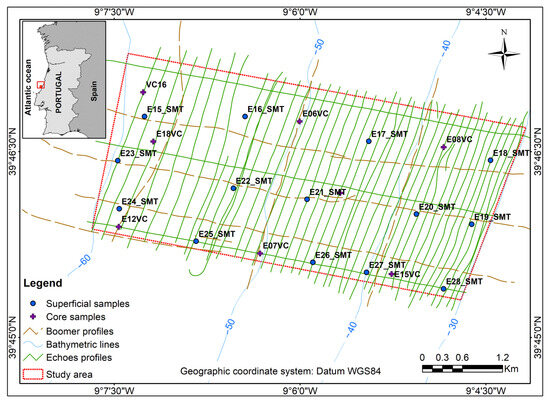
Figure 6.
Seabed sampling grid of the study area.
The hydrographic survey complied with the International Hydrographic Organization’s Special-Order standards, IHO S-44 - 5th edition, for Hydrographic Surveys. Bathymetric soundings were validated and processed following the CARIS HIPS standard workflow. Multibeam data were processed using the Combined Uncertainty Bathymetric Estimator (CUBE) algorithm, implemented within CARIS HIPS and SIPS software v4.2.5 (Teledyne CARIS; Fredericton, NB, Canada). The resulting product was a gridded surface representing the best-estimated bathymetry.
The processed data were integrated into a GIS platform and visualized both as raster surfaces derived from BAG files and as a sun-illuminated image (illumination parameters: azimuth 307°, elevation 7°) generated from GeoTIFF files.
Seismic profiles were processed and interpreted following the criteria defined by [39,40,41]. A P-wave velocity of 1785 m/s [42] was applied to convert two-way travel times (TWT) into physical thicknesses of the identified seismic units.
Following preliminary geophysical analysis, sediment sampling was undertaken to characterize the physical and mechanical properties of the seafloor. A total of 14 surface sediment samples were collected using a Smith–McIntyre grab sampler (Kahl Scientific Instrument Corporation. El Cajon, California, USA), while eight vertical core samples were obtained using a Rossfelder P-5C electric vibrocorer (Rossfelder Corporation, Poway, USA), (Figure 6).
Laboratory analyses were performed in accordance with internationally recognized standards for physical and mechanical characterization. Non-destructive tests included magnetic susceptibility and P-wave velocity measurements, followed by destructive tests such as grain size distribution, carbonate content, water content, unit weight, and triaxial shear testing.
Grain size distribution was determined by sieve analysis [43] and laser diffraction [44]. Water content, bulk density, particle density, triaxial shear strength, and Atterberg limits were determined according to procedures described in [45,46,47,48,49]. Total inorganic carbon content was quantified according to [50], and magnetic susceptibility and P-wave velocity were measured following the ODP Technical Note 26 protocol [51]. Soil classification was completed using the Unified Soil Classification System (USCS), as per [52].
Triaxial compression tests were conducted on six undisturbed soil specimens using anisotropic consolidation under CK0D conditions. All tests were performed under drained conditions, with a monotonic increase in vertical stress.
Specimens, approximately 70 mm in diameter and 140 mm in height, were carefully extruded from the sampling tubes to preserve natural structure. After placement into the triaxial cell, naturally deaired saline water was percolated through the specimens to expel entrapped air. Saturation was achieved by gradually increasing the back pressure up to 500 kPa while maintaining an effective confining pressure of 10 kPa. Saturation was considered adequate when the Skempton B-value exceeded 0.95.
Isotropic consolidation was then performed under the selected effective stress, followed by anisotropic consolidation to achieve a K0 stress condition of 0.5. This state was maintained for 24 h to ensure equilibrium before the shearing phase.
Shearing was conducted through drained axial compression by increasing the major principal stress—σ1, under constant confining stress—σ3, while continuously monitoring axial and volumetric strains. A constant axial strain rate was applied to maintain uniform loading conditions throughout the test.
4. Results and Discussion
The description of the study area was developed through the analysis and interpretation of the acquired datasets, resulting in two distinct models: a geophysical model and a geological–geotechnical model, as described hereafter. This methodological approach is largely compliant with the French recommendations for the planning and design of anchor foundations for floating structures [22].
4.1. Geophysical Model
4.1.1. Morphology
Analysis of the digital bathymetric model (DBM) generated from multibeam echosounder data (Figure 7) reveals that the seafloor exhibits a generally smooth and uniform morphology, with no visible hard rock outcrops. This monotony is interrupted at a water depth of approximately 55 m, where a subtle slope break of about 1.0 m occurs.
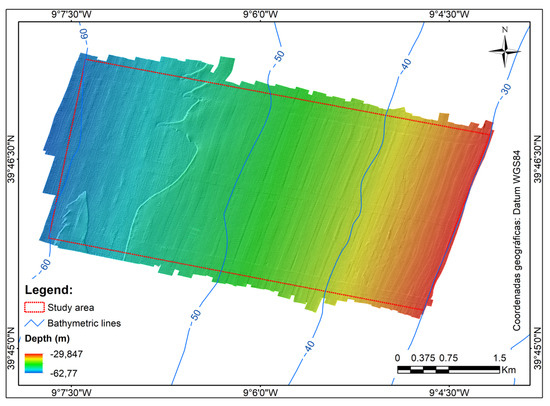
Figure 7.
Digital model of the seafloor.
The slope map (Figure 8), derived from the DBM, confirms that the area exhibits a very gentle gradient (generally less than 1.5%) between 30 m and 55 m water depth. These values are consistent with those reported by [53,54] for continental shelf environments. At approximately 55 m water depth, a pronounced slope break is observed, where the slope exceeds 5%, indicating a morphological transition of approximately 1.0 m. This feature marks the beginning of a more irregular seabed zone, located between the 55 m and 61 m isobaths.
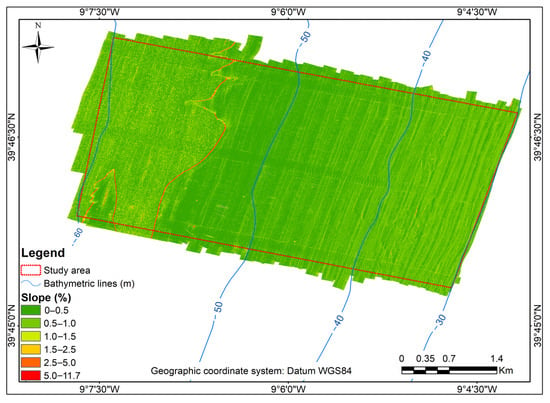
Figure 8.
Map of slopes of the study area.
4.1.2. Acoustic Backscatter Analysis
Using multibeam backscatter data, an acoustic mosaic of the seafloor was generated (Figure 9). Backscatter analysis provides a reliable method for remote acoustic classification of seafloor properties, particularly sediment type and composition [30,55,56]. Additionally, backscatter data yield insights into seafloor roughness and the presence of morphological structures such as lineations and ripples, as observed in the study area.
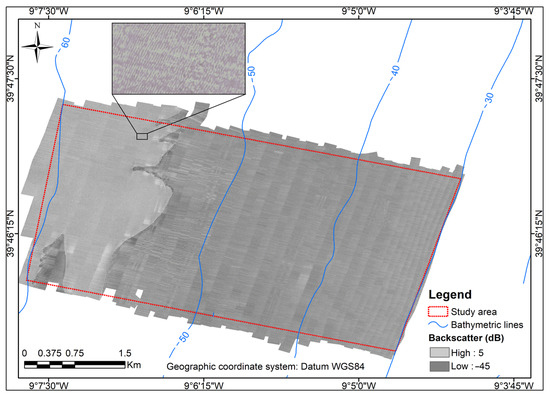
Figure 9.
Acoustic backscatter mosaic of the seabed and details of the ripples’ marks.
A detailed inspection of the backscatter mosaic (Figure 9) reveals two distinct acoustic classes:
- Between 30 m and 55 m water depth, the backscatter intensity is low (represented in dark gray), indicating a smooth, fine-grained sandy seabed with minimal structural features.
- Between 55 m and 61 m, the backscatter intensity is high (light gray), suggesting an increased bottom roughness and the presence of coarser sediments, consistent with interpretations by [55,56].
Within the high-intensity backscatter zone, close inspection of the mosaic reveals linear features identified as wave ripples, using the classification of [57]. These ripples exhibit rectilinear crests-oriented NE–SW, with an average wavelength of approximately 3 m and a crest height of around 0.19 m (Figure 9). Their origin was attributed to the high-energy wave regime and storms events, which promote sediment resuspension and remobilization [53,54].
4.1.3. Seismic-Stratigraphic Structure
The seismic-stratigraphic structure of the study area was interpreted from seismic profiles using the classification criteria defined by [39,40,41]. Three main seismic units (Figure 10) were identified:
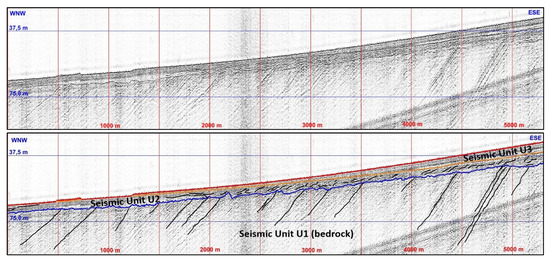
Figure 10.
Boomer profile illustrates the structure of the study area. The upper profile shows no interpretation; the lower profile is interpreted with main reflectors and seismic unit identifications.
- The top of seismic unit U1 (bedrock) is bounded by the blue reflector (R1), which exhibits an erosional surface with irregular morphology. This unit is characterized by high-amplitude, continuous, and parallel reflections that dip westward. According to [34], U1 corresponds to deformed and dolomitized carbonate sandstones with varying degrees of competence. These formations likely account for the irregular character of reflector R1, which is interpreted as a fossilized “coastal type” morphology by the overlying U2 unit (Figure 10). The monocline structure of U1 (bedrock), composed of sub-parallel reflectors and distinct acoustic signatures, is consistent with a detrital carbonate formation, typically associated with the infill of marginal marine basins. The irregularity of R1, at the top of the U1 formation, suggests differential erosion of layers with variable resistance, likely due to subaerial exposure prior to burial.
- Seismic unit U2 overlies U1 and is present across the study area. In the western sector (Figure 10), it crops out and is bounded at the top by reflector R3 (red), while in the eastern sector, it is overlain by unit U3 and capped by reflector R2 (orange). U2 exhibits strong, laterally variable reflectivity with diverse geometry. In the shallower eastern areas (between 45 m and 35 m water depths), internal reflections dip more steeply toward the south and to the mainland, while in deeper areas, they become diffused or disappear entirely (Figure 10). Thicknesses range from 5 m to 8 m (Figure 11). Internal facies variability within U2 likely reflects temporal variations in sediment transport intensity and texture. Steeply inclined reflectors (>20°) are interpreted as indicators of westward sediment transport, from the coast to deeper shelf waters.
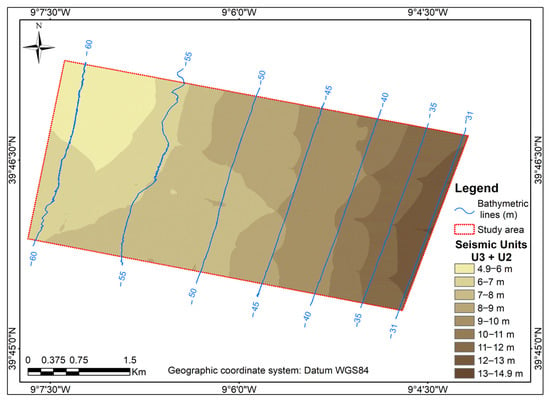 Figure 11. Thickness map of seismic units U2 and U3: the different classes represent the thickness, in meters, measured between the seafloor and reflector R1.
 - The uppermost seismic unit, U3, is bounded at the top by the red reflector (seafloor) and is characterized by low-amplitude, laterally continuous reflectors. These features are indicative of a low energy depositional environment with minimal lateral and vertical heterogeneity (Figure 10). U3 exhibits semi-transparent seismic facies and no apparent internal stratification. It is present in all profiles and represents the most recent sedimentary layer. In the eastern part of the study area, U3 overlies U2 and forms a landward-thickening wedge from 1 m to 7 m (Figure 12). A small patch of U3 is also observed in the lower-left sector of the area (Figure 7 and Figure 9), where it reaches approximately 1.2 m of thickness and corresponds to a seafloor morphological feature identified in Figure 7.
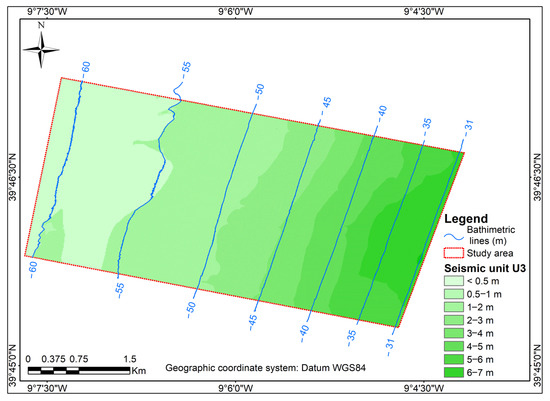 Figure 12. Thickness map of seismic unit U3: the different classes represent the thickness of seismic unit U3, in meters, measured between the seafloor and reflector R2.
A 3D geophysical model of the study area was developed based on the interpretation of seismic profiles, providing a comprehensive visualization of the subsurface structure and depositional architecture (Figure 13) viewed from the southwest.
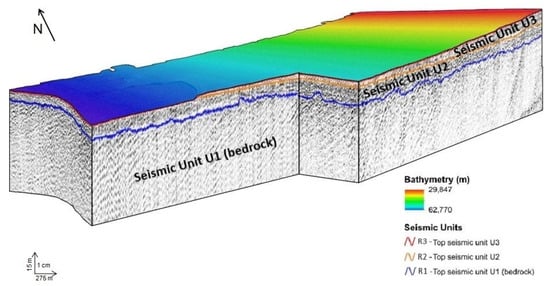
Figure 13.
Three-dimensional geophysical model viewed from SW to NE.
4.2. Geological and Geotechnical Model
4.2.1. Characteristics and Mapping of Superficial Sediments
Remote classification of the seafloor based on multibeam backscatter data (Figure 9) was validated through laboratory testing and enabled the mapping of three distinct sediment types (Figure 14):
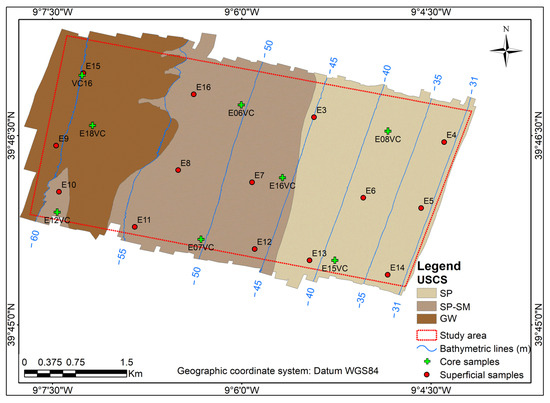
Figure 14.
Distribution of the distinct geotechnical sediments on the study area and sampling sites.
- Poorly graded sand (SP): located between 30 m and 45 m depth, composed predominantly of fine sand (97%) with less than 3% silt-clay content; coefficient of uniformity (Cu) = 1.95 and coefficient of curvature (Cc) = 1.02.
- Poorly graded sand with silt (SP-SM): found between 45 m and 55 m water depth, consisting of 91% poorly sorted fine sand and ≈9% silt-clay; Cu = 3.89 and Cc = 1.68.
- Well-graded gravel (GW): located between 55 m and 61 m depth, consisting of 78% well-graded gravel, 19% sand, and 3% silt-clay; Cu = 5.62 and Cc = 2.31.
4.2.2. Internal Textural Variation in the Sedimentary Layer
Eight vertical cores collected throughout the area revealed internal grain size variability and indicated the presence of two main sediment types: a sandy deposit and a sandy gravel deposit (Figure 15).
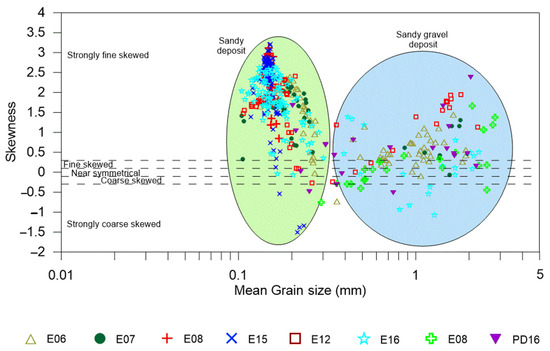
Figure 15.
Relationship between mean grain size and skewness of the analyzed vertical soil samples. Sand deposit (green); sandy gravel deposit (blue).
Vertical cores collected across the area indicate that the poorly graded sands (SP) and poorly graded sand with silt (SP-SM) are predominantly sandy sediments, with mean grain sizes ranging from 0.1 to 0.25 mm. These materials are poorly graded and exhibit positive skewness. In contrast, sediments from the well-graded gravel (GW) deposit are characterized by coarser sand and gravel particles, with mean grain sizes ranging from 0.4 to 2 mm, well-graded distribution and variable skewness.
Vertical cores E06VC, E07VC, E12VC, and E16VC (Figure 15) display a stratigraphy comprising a sandy layer overlying a sandy gravel layer. In contrast, cores E08VC and E15VC (eastern zone) contain only sandy material, while E18VC and VC16 consist exclusively of sandy gravel.
Three representative vertical cores, E07VC, E12VC, and E15VC, were selected along a cross-shore transect for in-depth analysis of physical and mechanical properties (locations shown in Figure 2). These samples were analyzed for magnetic susceptibility, P-wave velocity, textural parameters, water content, unit weight, specific gravity, and CaCO3 content (Figure 16, Figure 17 and Figure 18).
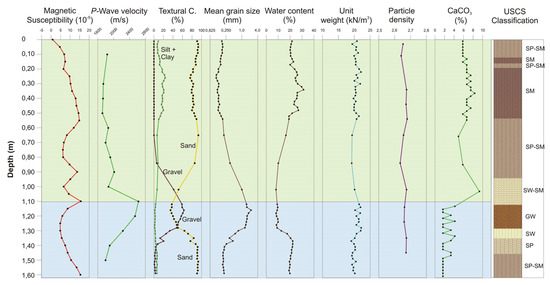
Figure 16.
Vertical geotechnical properties along sample E12VC. Sand deposit (green); sandy gravel deposit (blue).
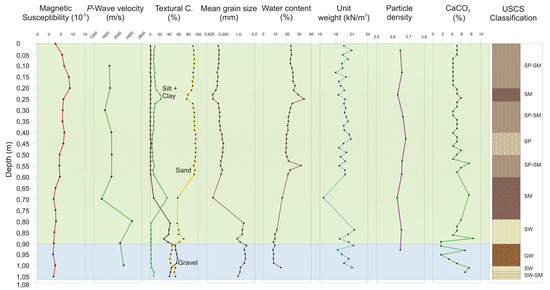
Figure 17.
Vertical geotechnical properties along sample E07VC. Sand deposit (green); sandy gravel deposit (blue).
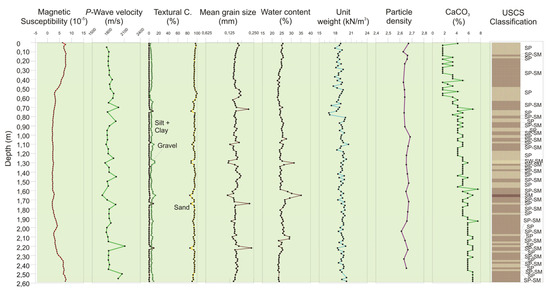
Figure 18.
Vertical geotechnical properties along sample E15VC. Sandy deposit (green).
Magnetic susceptibility averaged ≈5 × 10⁻⁵ SI in sandy sediments and increased to ≈10 × 10−5 SI in sandy silt layers, which is consistent with the expected correlation between susceptibility and finer sediments fractions [58].
The P-wave velocity variability reflects sedimentary transitions. In sandy soils, velocities average ~1800 m/s; in sandy mud, velocities drop to ~1680 m/s, which is consistent with Hamilton’s findings [59,60]; and in sandy gravel soils, velocities range from 2000 to 2500 m/s, indicating high compaction of particles in this sedimentary class.
Water content varied significantly with texture. In sandy sequences, the water content ranges between 20 and 30%, with the highest values (35–40%) found where silt and clay content are higher, and the lower values (10–20%) found in sandy gravel levels. For moist unit weight, sandy deposits show values between 19 and 20 kN/m3, decreasing to 16–18 kN/m3 with higher fine content. Sandy gravel soils present values between 20 and 21 kN/m3.
Calcium carbonate (CaCO3) content throughout the sediment column ranges from 1.7% to 12% (Figure 16, Figure 17, Figure 18 and Figure 19), indicating a predominantly lithoclastic origin. Although CaCO3 content generally decreased with depth, no clear correlation was found between carbonate content and the sediment type.
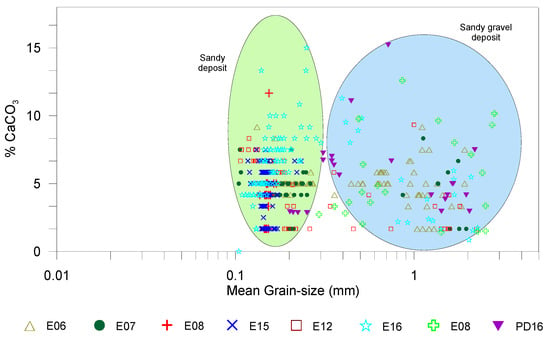
Figure 19.
Relationship between mean grain size vs. percentage of CaCO3 content. Sand deposit (green); sandy gravel deposit (blue).
Geotechnical properties observed in Figure 16, Figure 17 and Figure 18, cores E12VC (59.0 m), E07VC (50.5 m), and E15VC (38.6 m) were consistent with other samples (E06VC, E08VC, E16VC, E18VC, and PD16) and considered representative of the middle-shelf deposits along the Portuguese margin. Variations in composition and geotechnical properties reflect the dynamic nature of the marine depositional environment.
Grain size analyses and classification, based on the USCS [52], revealed pronounced textural transitions in E12VC and E07VC, with surface layers of fine sands (SP, SP–SM) overlying coarser and more heterogeneous layers (SW–SM, SM). These patterns are indicative of variable depositional energy and sediment supply. In contrast, E15VC displayed a homogeneous sandy profile, indicative of sedimentation under more stable hydrodynamic conditions.
Physical–dynamical properties were evaluated through P-wave velocity tests, bulk density, and moisture content, allowing inference of the degree of sediment compaction and cohesion. P-wave velocities were most variable in cores with heterogeneous grain size, with E12VC exhibiting values between 1760 and 2630 m/s, while E15VC maintained more consistent values around 1800 m/s. Moisture content, ranging from 18.3% to 34%, inversely correlated with compaction degree and directly related to fine fraction content. Magnetic susceptibility was higher in samples with greater fine content, suggesting elevated concentrations of ferromagnetic minerals in these zones.
Bulk unit weight values ranged from 16 to 21.4 kN/m3, reflecting both textural variability and consolidation state, critical aspects for offshore foundation bearing capacity and stability analyses. The generally low calcium carbonate content (<10%) further supports the lithoclastic nature of these sediments.
In conclusion, integrated sediment characterization revealed significant heterogeneity in both grain size and physical properties, especially in cores E12VC and E07VC. These conditions pose challenges for geotechnical modeling and foundation, and anchorage infrastructure design. For such transitional zones, it is recommended that finite element method (FEM) analyses be used to model soil response under structural loading.
Conversely, the homogeneity of core E15VC supports more predictability in mechanical behavior, facilitating simplified modeling. These findings underscore the importance of detailed, site-specific sediment evaluations in defining offshore geotechnical parameters in alignment with internationally recognized best practices and standards.
4.2.3. Effective Stress Parameters and Elastic Modulus
Shear strength parameters (effective friction angle, φ′, and cohesion, c′) were obtained from vertical soil samples using CK0D triaxial tests under effective stress conditions. A total of six specimens were tested, comprising three samples representative of SP soils and three samples SP-SM soils.
The test results are consistent with those obtained from surface sediments analyses. SP soils were composed of 86.6% poorly graded sand, 9.6% gravel, 3.8% fines, with Cu = 3.4, Cc = 1.0, and an average carbonate content of 8%. SP-SM soil consisted of 91.9% sand, 6.7% fines, 1.4% gravel, Cu = 2.8, Cc = 1.1, and a carbonate content of 5% [61].
To evaluate the mechanical behavior of these soils, deviatoric stress–axial strain curves and volumetric strain–axial strain curves were generated from the triaxial tests, as shown in Figure 20 and Figure 21.
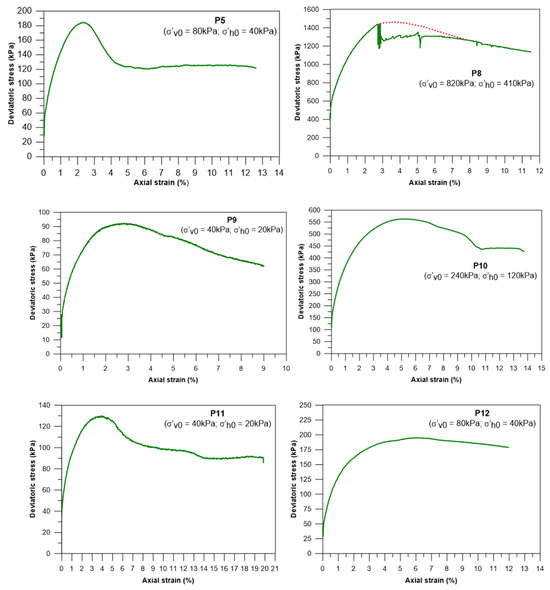
Figure 20.
Deviatoric stress–axial strain curves for the six specimens tested.
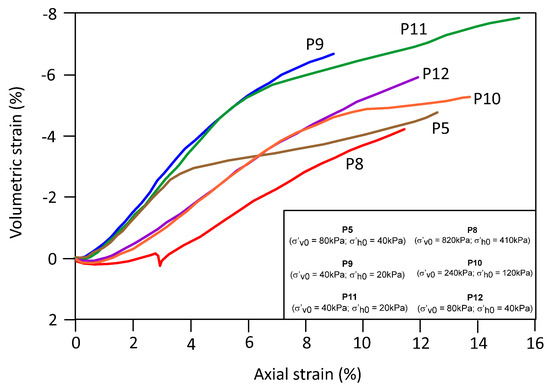
Figure 21.
Volumetric strain–axial strain for the specimens tested.
Figure 20 illustrates stress–strain behavior of the marine sediments that was generally consistent across specimens. Initially, the stress–strain response was stiff and approximately linear up to a clearly defined yield point. Beyond this point, plastic deformation progressively increases until failure. Post-failure, specimens P5 and P11 exhibit a pronounced and rapid drop in deviatoric stress, stabilizing at a residual strength level; this behavior is characteristic of strain-hardening sands under drained conditions.
Figure 21 depicts the volumetric strain versus axial strain curves for specimens tested under different consolidation stresses. All specimens initially underwent compression, followed by significant volumetric expansion up to failure, corresponding to maximum dilation. Beyond failure, the expansion rate decreased, approaching a constant value at large strains. This behavior is typical of medium-dense to dense sand.
According to [61], the effective peak friction angles (φ′p) were 39° for SP soils and 44° for SP-SM soils. The residual effective friction angles (φ′r) were 34° and 35°, respectively, values consistent with those reported by [62] for quartz-rich soils (≈33°), suggesting that mineralogy plays a dominant role in shear strength behavior.
Elastic modulus (E50) and Poisson’s ratio (ν) were also determined. SP soils exhibited E50 ≈ 22 MPa and ν = 0.30, whereas SP-SM soils showed E50 ≈ 54 MPa and ν = 0.31 [42].
4.2.4. Three-Dimensional Geological and Geotechnical Model
The integration of geophysical, sedimentological, and geotechnical datasets enabled the construction of a 3D geological–geotechnical model (Figure 22).
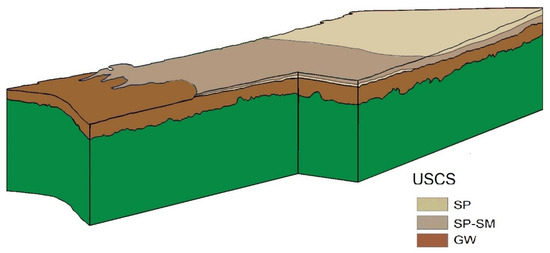
Figure 22.
Three-dimensional geological and geotechnical model viewed from SW to NE.
In this model, seismic unit U1 corresponds to carbonate formations, as identified in previous studies [34].
The seismic unit U2, described in the geophysical model, is present throughout the study area and corresponds to gravelly sandy soils (USCS classification GW; GW-GM). This older deposit, formed approximately 11,000 years ago [25,34,37], reflects a marginal marine environment. It crops out in deeper zones and is overlain by a sandy deposit in areas shallower than 55 m. Its thickness varies from ≈5 m in the western sector to ≈8 m in the eastern part of the study area.
The youngest seismic unit U3, representing the youngest sedimentary deposit, dated to less than 5000 years [37] and is typical of a marine shelf environment. It consists of sandy soils (USCS classifications SP, SP-SM, SM, SW, SW-SM) and is in shallower zones (<55 m depth), overlying Unit U2. At 55 m depth, Unit U3 is ≈1 m thick, gradually increasing towards the coast to ≈7 m near the 30 m isobath. It is primarily composed of fine to very fine sands, with an average silt–clay content of ≈10%. The gravel fraction, when present, is vestigial and predominantly of biogenic clasts derived from fragmented mollusk shells.
A summary of the main geotechnical properties of the sandy and gravelly sand units is provided in Table 1.

Table 1.
Characteristics of the geotechnical units; mean value (min–max).
During the construction, operation, and decommissioning of the foundations of renewable energy devices, as well as associated substations and cable routing, marine habitats are directly impacted due to sediment removal and resuspension [63]. The mobilization of sediments can lead to the direct degradation of local habitats and may also affect adjacent areas. However, in the study area, the sediment resuspension is expected to be limited given the low proportion of fine particles within the local deposits.
The magnitude of the impact on benthic communities primarily depends on the duration and intensity of the disturbance [64], as well as the resilience of local fauna [65]. Conversely, it is widely established that the introduction of new structures related to renewable energy installations, such as piles, drag anchors, and substations, may foster the development of artificial habitats [66], which can be colonized by hard-substrate-associated species [67].
5. Conclusions
This study presents the integrated geophysical, geological and geotechnical characterization of a 12 km2 area of the Portuguese continental shelf, aimed at supporting renewable energy applications and aligned with the European Eurocode-based design methodology.
The main findings are summarized below:
- The substratum consists of Mesozoic carbonates sandstone formations (seismic unit U1), highly deformed and dolomitized, with heterogeneous mechanical competence. The top of this acoustic basement is marked by an erosive and irregular reflector (R1), suggesting past subaerial exposure and differential erosion.
- Overlying the basement is a sandy gravel deposit (seismic unit U2), attributed to a marine-marginal depositional environment. This unit, characterized as well-graded gravel (GW), is present throughout the entire study area, cropping out in the deeper western sector and buried under younger sediments in the eastern shallower zones. Its thickness ranges from ≈5 m in deeper zones to 8 m nearshore.
- The youngest sedimentary unit (U3) comprises poorly graded sand (SP) and poorly graded sand with silt (SP-SM), deposited in a modern marine environment. It forms a wedge-shaped body that thickens landward from ~1 m at 55 m water depth to ~7 m at 30 m depth. The unit reflects active sedimentary processes and displays spatial variability in texture and composition.
- Geotechnical properties determined by laboratory testing of SP and SP-SM soils yielded effective internal friction angles (φ′p) of 39° and 44°, respectively, and residual friction angles (φ′r) of 34° and 35°. The corresponding deformation moduli (E50) were 22 MPa for SP and 54 MPa for SP-SM soils, with Poisson’s ratios of 0.30 and 0.31. These values are consistent with the mineralogical composition (quartz and carbonates) and the degree of compaction observed.
- The methodological framework, integrating high-resolution seismic data, backscatter analysis, and targeted sediment sampling, proved efficient for site characterization of the medium-scaled offshore area (≈12 km2). The initial geophysical interpretation guided the sampling strategy, which in turn informed and refined the geological and geotechnical models.
- Based on the geotechnical and morphological characteristics of the site, the risk associated with geohazards is considered low. The seabed has gentle slopes, and the mechanical behavior and the thickness of the surficial sediments are favorable for the installation of anchoring and foundation systems, compliant with offshore design standards. Nevertheless, design-phase considerations must address the potential for cyclic liquefaction under seismic loading and seabed scour, in the vicinity of anchor points, as suggested by observed erosion features in GW deposits.
In summary, the methodology applied in this study demonstrates the feasibility of obtaining reliable geotechnical data through an integrated geophysical approach, potentially complementing or partially replacing costly in situ testing. In the absence of national offshore testing facilities, this approach offers a valuable alternative to support medium-scale pilot projects, particularly in the context of wave energy development.
Aligned with the holistic methodology proposed by DNV, the adopted methodology moves beyond site-specific testing (e.g., anchoring or foundation trials), favoring a broader, environmentally informed framework based on geophysical and geotechnical integration. This contributes to both the timely delivery of infrastructure and compliance with the EU energy transition targets.
Moreover, the availability of detailed subsurface data enhances the safety and efficiency of anchor and foundation design, facilitates adaptability during project implementation, and reduces the risk of failure. However, in areas with a higher proportion of fine sediments (e.g., silts or fine sands), site-specific evaluations, particularly those related to the potential for liquefaction, remain essential, especially in seismically active regions of the Portuguese margin.
The dataset generated in this study is suitable for use in FEM analyses for foundations sizing in the design stage. It may also serve as baseline input for preliminary geotechnical modeling in adjacent areas of the northern Portuguese shelf, where similar sedimentary conditions prevail.
Nevertheless, for any offshore renewable energy project, the execution of a dedicated geophysical and geotechnical survey remains indispensable due to the inherent variability of sediment types and their mechanical behavior.
Finally, comprehensive environmental impact assessments and the implementation of appropriate mitigation measures are key to minimizing the ecological footprint of offshore energy infrastructure, from installation through decommissioning.
Author Contributions
Conceptualization and methodology, J.P., A.R., and P.F.d.S.; investigation, J.P.; writing—original draft preparation, review and editing, J.P., A.R., and P.F.d.S. All authors have read and agreed to the published version of the manuscript.
Funding
This research received no external funding.
Data Availability Statement
Data is contained within the article.
Acknowledgments
Paula F. da Silva acknowledges the support given by R&D Unit GEOBIOTEC—UID/04035: GeoBioCiências, GeoTecnologias e GeoEngenharias.
Conflicts of Interest
The authors declare no conflicts of interest. The research was conducted without commercial or financial relationships that could be construed as a potential conflict of interest.
References
- Directive 2009/28/EC. On the Promotion of the Use Of Energy From Renewable Sources and Amending and Subsequently Repealing Directives 2001/77/Ec And 2003/30/Ec; European Parliament and of the Council: Brussels, Belgium, 2009; Available online: https://eur-lex.europa.eu/LexUriServ/LexUriServ.do?uri=OJ:L:2009:140:0016:0062:en:PDF (accessed on 1 August 2025).
- Directive (EU) 2018/2001 On the Promotion of the Use of Energy From Renewable Sources; European Parliament and Council: Brussels, Belgium, 2018; Available online: https://eur-lex.europa.eu/eli/dir/2018/2001/oj/eng (accessed on 1 August 2025).
- EU Strategy to Harness the Potential of Offshore Renewable Energy for a Climate-Neutral Future. Communication from the Commission to the European Parliament, the Council, the European Economic and Social Committee and the Committee of the Regions. SWD (2020) 273 Final. Brussels, 2020. COM (2020) 741 Final. Available online: https://eur-lex.europa.eu/legal-content/EN/TXT/HTML/?uri=CELEX:52020DC0741 (accessed on 1 August 2025).
- Bernhoff, H.; Sjostedt, E.; Leijon, M. Wave energy resources in sheltered sea areas: A case study of the Baltic Sea. Renew. Energy 2006, 31, 2164–2170. [Google Scholar] [CrossRef]
- Clément, A.; McCullen, P.; Falcão, A.; Fiorentino, A.; Gardner, F.; Hammarlund, K.; Lemonis, G.; Lewis, T.; Nielsen, K.; Petroncini, S.; et al. Wave energy in Europe: Current status and perspectives. Renew. Sustain. Energy Rev. 2002, 6, 405–431. [Google Scholar] [CrossRef]
- Defne, Z.; Haas, K.A.; Fritz, H.M. Wave power potential along the Atlantic coast of the southeastern USA. Renew. Energy 2009, 34, 2197–2205. [Google Scholar] [CrossRef]
- Decree-Law No. 5/2008. Legal Regime for the Use of Public Maritime Domain Assets, Including the Use of Territorial Waters, to Produce Electricity from Wave Energy in the Pilot Zone. 1st Series. Official Gazette (Diário da República) No. 5/2008, of January 8. Available online: https://diariodarepublica.pt/dr/detalhe/decreto-lei/5-2008-386865 (accessed on 1 August 2025). (In Portuguese).
- Available online: https://www.windfloat-atlantic.com/the-wind-farm/#project (accessed on 9 July 2025).
- Resolution of the Council of Ministers n.º 19/2025, de 7 de Fevereiro. Available online: https://diariodarepublica.pt/dr/detalhe/resolucao-conselho-ministros/19-2025-906519104 (accessed on 9 July 2025). (In Portuguese).
- Galparsoro, I.; Liria, P.; Legorburu, I.; Bald, J.; Chust, G.; Ruiz-Minguela, P.; Pérez, G.; Marqués, J.; Torre-Enciso, Y.; González, M.; et al. A Marine Spatial Planning Approach to Select Suitable Areas for Installing Wave Energy Converters (WECs), on the Basque Continental Shelf (Bay of Biscay). Coast. Manag. 2012, 40, 1–19. [Google Scholar] [CrossRef]
- Murat, S.; Akpınar, A.; Bingolbali, B.; Kankal, M. Geo-spatial multi-criteria evaluation of wave energy exploitation in a semi-enclosed sea. Energy 2021, 214, 118997. [Google Scholar] [CrossRef]
- Zhang, M.; Niu, M.; Shen, S.; Dai, S.; Xu, Y. Review of natural gas hydrate dissociation effects on seabed stability. Nat. Hazards 2021, 107, 1035–1045. [Google Scholar] [CrossRef]
- Zavvar, E.; Majidi, A.G.; Santos, P.R.; Taveira-Pinto, F. Optimal probability distribution for SCFmax in KT-joints strengthened with concrete in wind turbine support structures. J. Constr. Steel Res. 2024, 222, 108994. [Google Scholar] [CrossRef]
- Bogossian, F. Offshore geotechnics in Brazil, applied to the oil industry. Rev. Geotec. 2004, 100, 23–29. (In Portuguese) [Google Scholar] [CrossRef] [PubMed]
- Randolph, M.F.; Cassidy, M.J.; Gourvenec, S.; Erbrich, C.J. Challenges of offshore geotechnical engineering. In Proceedings of the 16th International Conference on Soil Mechanics and Geotechnical Engineering, Osaka, Japan, 12–15 September 2005. [Google Scholar]
- Young, A.G.; Phu, D.R.; Spikula, D.R.; Rivette, J.A.; Lanier, D.L.; Murff, J.D. An approach for using integrated geoscience data to avoid deepwater anchoring problems. In Proceedings of the Offshore Technology Conference, Houston, TX, USA, 4–7 May 2009. [Google Scholar]
- Houlsby, G.T.; Byrne, B.W.; Martin, C.M. Novel Foundations for Offshore Wind Farms; Oxford University: Oxford, UK, 2001; p. 9. [Google Scholar]
- Byrne, B.W.; Houlsby, G.T. Assessing novel foundation options for offshore wind turbines. In Proceedings of the World Maritime Technology Conference, London, UK, 6–10 March 2006. [Google Scholar]
- Firouzianbandpey, S.; Ibsen, L.B.; Andersen, L.V. CPTu-based geotechnical site assessment for offshore wind turbines—A case study from the Aarhus site in Denmark. In Proceedings of the Twenty-second International Offshore and Polar Engineering Conference, Rhodes, Greece, 17–22 June 2012. [Google Scholar]
- Hue Le, T.M.; Eiksund, G.R.; Strøm, P.J.; Saue, M. Geological and geotechnical characterisation for offshore wind turbine foundations: A case study of the Sheringham Shoal wind farm. Eng. Geol. 2014, 177, 40–53. [Google Scholar] [CrossRef]
- Mellett, C.L.; Long, D.; Carter, G. Geology of the seabed and shallow subsurface: The Irish Sea. Commissioned Report CR/15/057. Br. Geol. Surv. 2015, 15, 52. [Google Scholar]
- Puech, A.; Ropers, F. A French recommended practice for planning and designing anchor foundations of floating wind turbines. In Proceedings of the ISFOG 2025, 5th International Symposium on Frontiers in Offshore Geotechnics, Nantes, France, 9–13 June 2025; ISBN 978-2-85782-758-0. [Google Scholar]
- Orlando, G.; Govoni, L.; Pontani, N.; Panico, A.F.; Murianni, A. A Database for the Offshore Geotechnical Site Characterization of Italian Seas. In Proceedings of the ISFOG 2025, 5th International Symposium on Frontiers in Offshore Geotechnics, Nantes, France, 9–13 June 2025; ISBN 978-2-85782-758-0. [Google Scholar]
- Pombo, J. Superficial Sediments of the Portuguese Continental Shelf Between Cabo Mondego and São Martinho do Porto. Master’s Thesis, Universidade de Coimbra, Coimbra, Portugal, 2004. (In Portuguese). [Google Scholar]
- Dias, J. Sedimentary Dynamics and Recent Evolution of The Northern Portuguese Continental Shelf. Doctoral Thesis, University of Lisbon, Lisboa, Portugal, 1987. (In Portuguese). [Google Scholar]
- Magalhães, F.M. Sediments of the Portuguese Continental Shelf: Spatial Contrasts, Temporal Perspective, Economic Potentials. Doctoral Thesis, University of Lisbon, Lisboa, Portugal, 2001. (In Portuguese). [Google Scholar]
- Esteves, R.; Silva, F.; Pinto, J.P.; Costa, M. Characterization of Extreme Sea Agitation Events in Mainland Portugal. 1.as Jornadas de Engenharia Hidrográfica; Instituto Hidrográfico: Lisboa, Portugal, 2010; pp. 205–208. (In Portuguese) [Google Scholar]
- Cunha, P.P.; Dinis, J. Current Coastal Erosion in the Cabo Mondego—Figueira da Foz Stretch: Description and Causes. Actas do V Congresso Nacional de Geologia; Tomo 84, fascículo 1; Instituto Geológico e Mineiro: Lisboa, Portugal, 1998; pp. 79–82. (In Portuguese) [Google Scholar]
- Costa, M.D.S. Wave conditions on the Portuguese coast. An. Inst. Hidrográfico 1992, 13, 35–40. (In Portuguese) [Google Scholar]
- Bizarro, A.; Oliveira, A.; Santos, A.I.; Rosa, L.; Pinto, J.P.; Pólvora, C.; Ferreira, F.; Lapa, N.; Cruz, I.; Pombo, J.; et al. Geophysical Characterization of the Pilot Zone; Instituto Hidrográfico: Lisboa, Portugal, 2012; p. 177. (In Portuguese) [Google Scholar]
- Vanney, J.; Mougenot, D. La plate-forme continentale du Portugal et les provinces adjacentes: Analyse géomorphologique. Mem. Serv. Geol. 1981, 28, 86. [Google Scholar]
- Mougenot, D. Géologie du Plateau Continental Portugais (Entre le Cap Carvoeiro et le Cap de Sines). Ph.D. Thesis, University of Rennes, Rennes, France, 1976. [Google Scholar]
- Mougenot, D. Geology of the Portuguese Shelf; Documentos Técnicos; Instituto Hidrográfico: Lisboa, Portugal, 1989; Volume 32, 259p. (In Portuguese) [Google Scholar]
- Rodrigues, A. Ectono-Stratigraphy of the Northern Portuguese Continental Shelf; Documentos Técnicos; Instituto Hidrográfico: Lisboa, Portugal, 2004; Volume 35. (In Portuguese) [Google Scholar]
- Musellec, P. Geologie du Plateau Continental Portugais au Nord du Cap Carvoeiro. Ph.D. Thesis, University of Rennes, Rennes, France, 1974. [Google Scholar]
- McMannus, D. Modern versus relict sediment on the continental shelf. Geol. Soc. Am. Bull. 1975, 86, 1154–1160. [Google Scholar] [CrossRef]
- Dias, J.M.A.; Boski, T.; Rodrigues, A.; Magalhães, F. Coastline evolution in Portugal since the Last Glacial Maximum until present—A synthesis. Mar. Geol. 2000, 170, 177–186. [Google Scholar] [CrossRef]
- Peuchen, J. Site characterization in nearshore and offshore geotechnical projects. In Geotechnical and Geophysical Site Characterization 4; Coutinho, R.Q., Mayne, P.W., Eds.; Taylor & Francis Group: London, UK, 2012; ISBN 978-0-415-62136-6. [Google Scholar]
- Damuth, J.E. Use of high-frequency (3.5–12 kHz) echograms in the study of near-bottom sedimentation processes in the deep-sea: A review. Mar. Geol. 1980, 38, 51–75. [Google Scholar] [CrossRef]
- Damuth, J.E. Echo character of the western equatorial Atlantic floor and its relationship to the dispersal and distribution of terrestrial sediments. Mar. Geol. 1975, 18, 17–45. [Google Scholar] [CrossRef]
- Mitchum, J.R.; Vail, P.R.; Sangree, J.B. Seismic stratigraphy and global changes of sea level, Part 6: Stratigraphic interpretation of seismic reflection patterns in depositional sequences. AAPG Mem. 1977, 26, 117–133. [Google Scholar]
- Pombo, J. Geotechnical Investigations for the Foundation Design of Offshore Wave Energy Converters Structures. Ph.D. Thesis, Universidade Nova de Lisboa, Lisbon, Portugal, 2016. (In Portuguese). [Google Scholar]
- NP EN 933-1; Testing of the Geometric Properties of Aggregates. Part 1: Sieve Analysis—Sieving Method. Instituto Português da Qualidade: Lisboa, Portugal, 2014. (In Portuguese)
- ISO 13320-1; Particle Size Analysis—Laser Diffraction Methods. International Organization for Standardization: Geneva, Switzerland, 2009.
- ISO/TS 17892-1; Geotechnical Investigation and Testing—Laboratory Testing of Soil—Part 1: Determination of Water Content. International Organization for Standardization: Geneva, Switzerland, 2004.
- ISO/TS 17892-2; Geotechnical Investigation and Testing—Laboratory Testing of Soil—Part 2: Determination of Density Of Fine-Grained Soil. International Organization for Standardization: Geneva, Switzerland, 2004.
- ISO/TS 17892-3; Geotechnical Investigation and Testing—Laboratory Testing of Soil—Part 3: Determination of Particle Density—Pycnometer Method. International Organization for Standardization: Geneva, Switzerland, 2004.
- ISO/TS 17892-9; Geotechnical Investigation and Testing—Laboratory Testing of Soil—Part 9: Consolidated Triaxial Compression Tests on Water-Saturated Soil. International Organization for Standardization: Geneva, Switzerland, 2004.
- ISO/TS 17892-12; Geotechnical Investigation and Testing—Laboratory Testing of Soil—Part 12: Determination of the Atterberg limits. International Organization for Standardization: Geneva, Switzerland, 2004.
- EN 13137; Characterization of Waste. Determination of Total Organic Carbon (Toc) in Waste, Sludges and Sediments. European Standard; Beuth-Verlag: Berlin, Germany, 2001.
- Blum, P. Physical Properties Handbook: A Guide to the Shipboard Measurement of Physical Properties of Deep-Sea Cores; ODP Tech. Note: College Station, TX, USA, 1997. [Google Scholar] [CrossRef]
- ASTM D2487-06; Standard Practice for Classification of Soils For Engineering Purposes. Unified Soil Classification System: Philadelphia, PA, USA, 2006.
- Walker, R.G.; James, N.P. (Eds.) Facies Models: Response to Sea Level Change; Geological Association of Canada: St. John’s, NL, Canada, 1992. [Google Scholar]
- Suter, J.R. Facies models revisited: Clastic shelves. In Facies Models Revisited: 339–397; Posamentier, H.W., Walker, R.G., Eds.; SEPM Special Publication: Tulsa, OK, USA, 2006; Volume 84. [Google Scholar] [CrossRef]
- Dartnell, P.; Gardner, J. Predicting Seafloor facies from multibeam bathymetry and backscatter data. Photogramm. Eng. Remote Sens. 2004, 70, 1081–1091. [Google Scholar] [CrossRef]
- Fonseca, L.; Brown, C.; Calder, B.; Mayer, L.; Rzhanov, Y. Angular range analysis of acoustic themes from Stanton Banks Ireland: A link between visual interpretation and multibeam echosounder angular signatures. Appl. Acoust. 2009, 70, 1298–1304. [Google Scholar] [CrossRef]
- Nichols, G. Sedimentology and Stratigraphy, 2nd ed.; Wiley-Blackwell: Hoboken, NJ, USA, 2009; ISBN 978-1-4051-9379-5. [Google Scholar]
- Ellwood, B.B.; Balsam, W.L.; Roberts, H.H. Gulf of Mexico sediment sources and sediment transport trends from magnetic susceptibility measurements of surface samples. Mar. Geol. 2006, 230, 237–248. [Google Scholar] [CrossRef]
- Hamilton, E.L. Sound velocity and related properties of marine sediments, North Pacific. J. Geophys. Res. 1970, 75, 4423–4446. [Google Scholar] [CrossRef]
- Hamilton, E.L.; Bachman, R. Sound velocity and related properties of marine sediments. J. Acoust. Soc. Am. 1982, 72, 1891–1904. [Google Scholar] [CrossRef]
- Pombo, J.; Rodrigues, A.; Silva, A.P.F. Geotechnical Characterization of Sands from the Portuguese Continental Shelf to Support the Design of Renewable Energy Converters Installation. In Proceedings of the IIAEG/AEG Annual Meeting Proceedings, San Francisco, CA, USA, 17–21 September 2018; Available online: https://link.springer.com/chapter/10.1007%2F978-3-319-93127-2_7 (accessed on 1 August 2025). [CrossRef]
- Bolton, M.D. The strength and dilatancy of sands. Geotechnique 1986, 36, 65–78. [Google Scholar] [CrossRef]
- Gill, A.B. Offshore renewable energy: Ecological implications of generating electricity in the coastal zone. J. Appl. Ecol. 2005, 42, 605–615. [Google Scholar] [CrossRef]
- Van Dalfsen, J.A.; Essink, K.; Madsen, H.T.; Birklund, J.; Romero, J.; Manzanera, M. Differential response of macrozoobenthos to marine sand extraction in the North Sea and Western Mediterranean. ICES J. Mar. Sci. 2000, 57, 1439–1445. [Google Scholar] [CrossRef]
- Drabsch, S.L.; Tanner, J.E.; Connell, S.D. Limited infaunal response to experimental trawling in previously untrawled areas. ICES J. Mar. Sci. 2001, 58, 1261–1271. [Google Scholar] [CrossRef]
- Degraer, S.; Carey, D.A.; Coolen, J.W.P.; Hutchison, Z.L.; Kerckhof, F.; Rumes, B.; Vanaverbeke, J. Offshore wind farm artificial reefs affect ecosystem structure and functioning—A Synthesis. Oceanography 2020, 33, 48–57. [Google Scholar] [CrossRef]
- Petersen, J.K.; Malm, T. Offshore windmill farms: Threats to or possibilities for the marine environment. AMBIO A J. Hum. Environ. 2006, 35, 75–80. [Google Scholar] [CrossRef]
Disclaimer/Publisher’s Note: The statements, opinions and data contained in all publications are solely those of the individual author(s) and contributor(s) and not of MDPI and/or the editor(s). MDPI and/or the editor(s) disclaim responsibility for any injury to people or property resulting from any ideas, methods, instructions or products referred to in the content. |
© 2025 by the authors. Licensee MDPI, Basel, Switzerland. This article is an open access article distributed under the terms and conditions of the Creative Commons Attribution (CC BY) license (https://creativecommons.org/licenses/by/4.0/).