
Bow Thruster at Normal and Off-Design Conditions


Abstract
1. Introduction
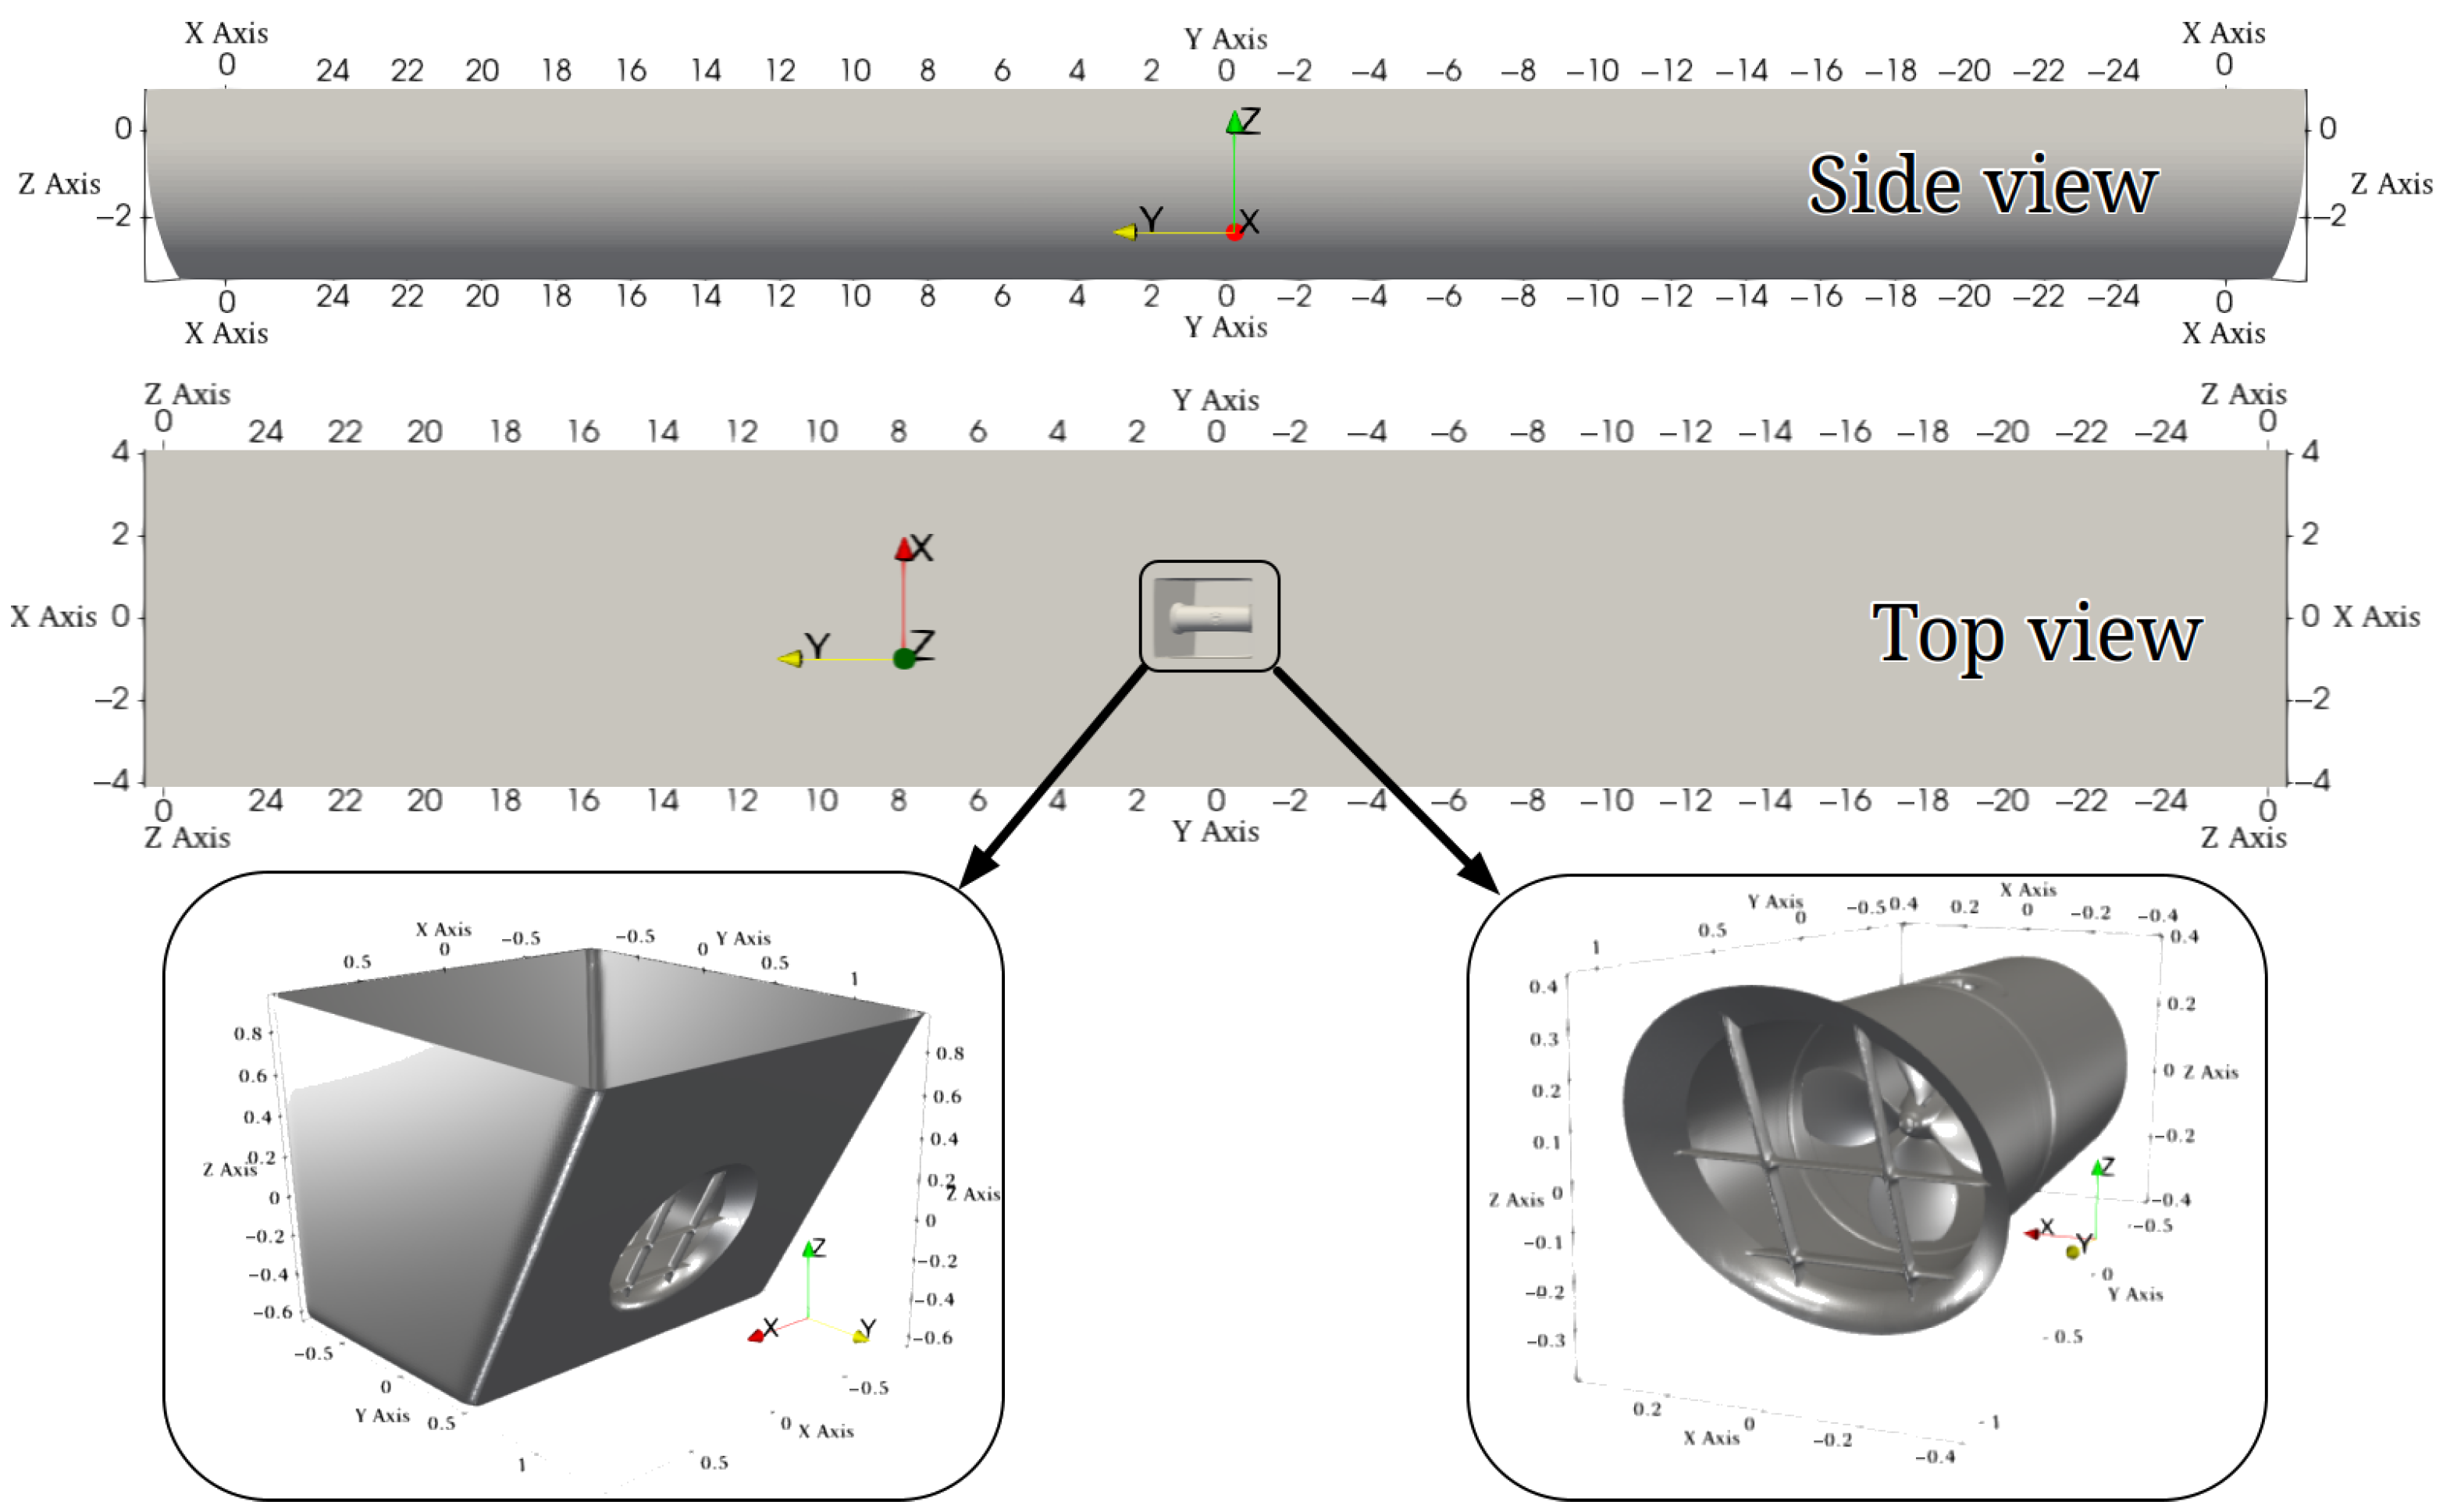
2. Object of Investigations
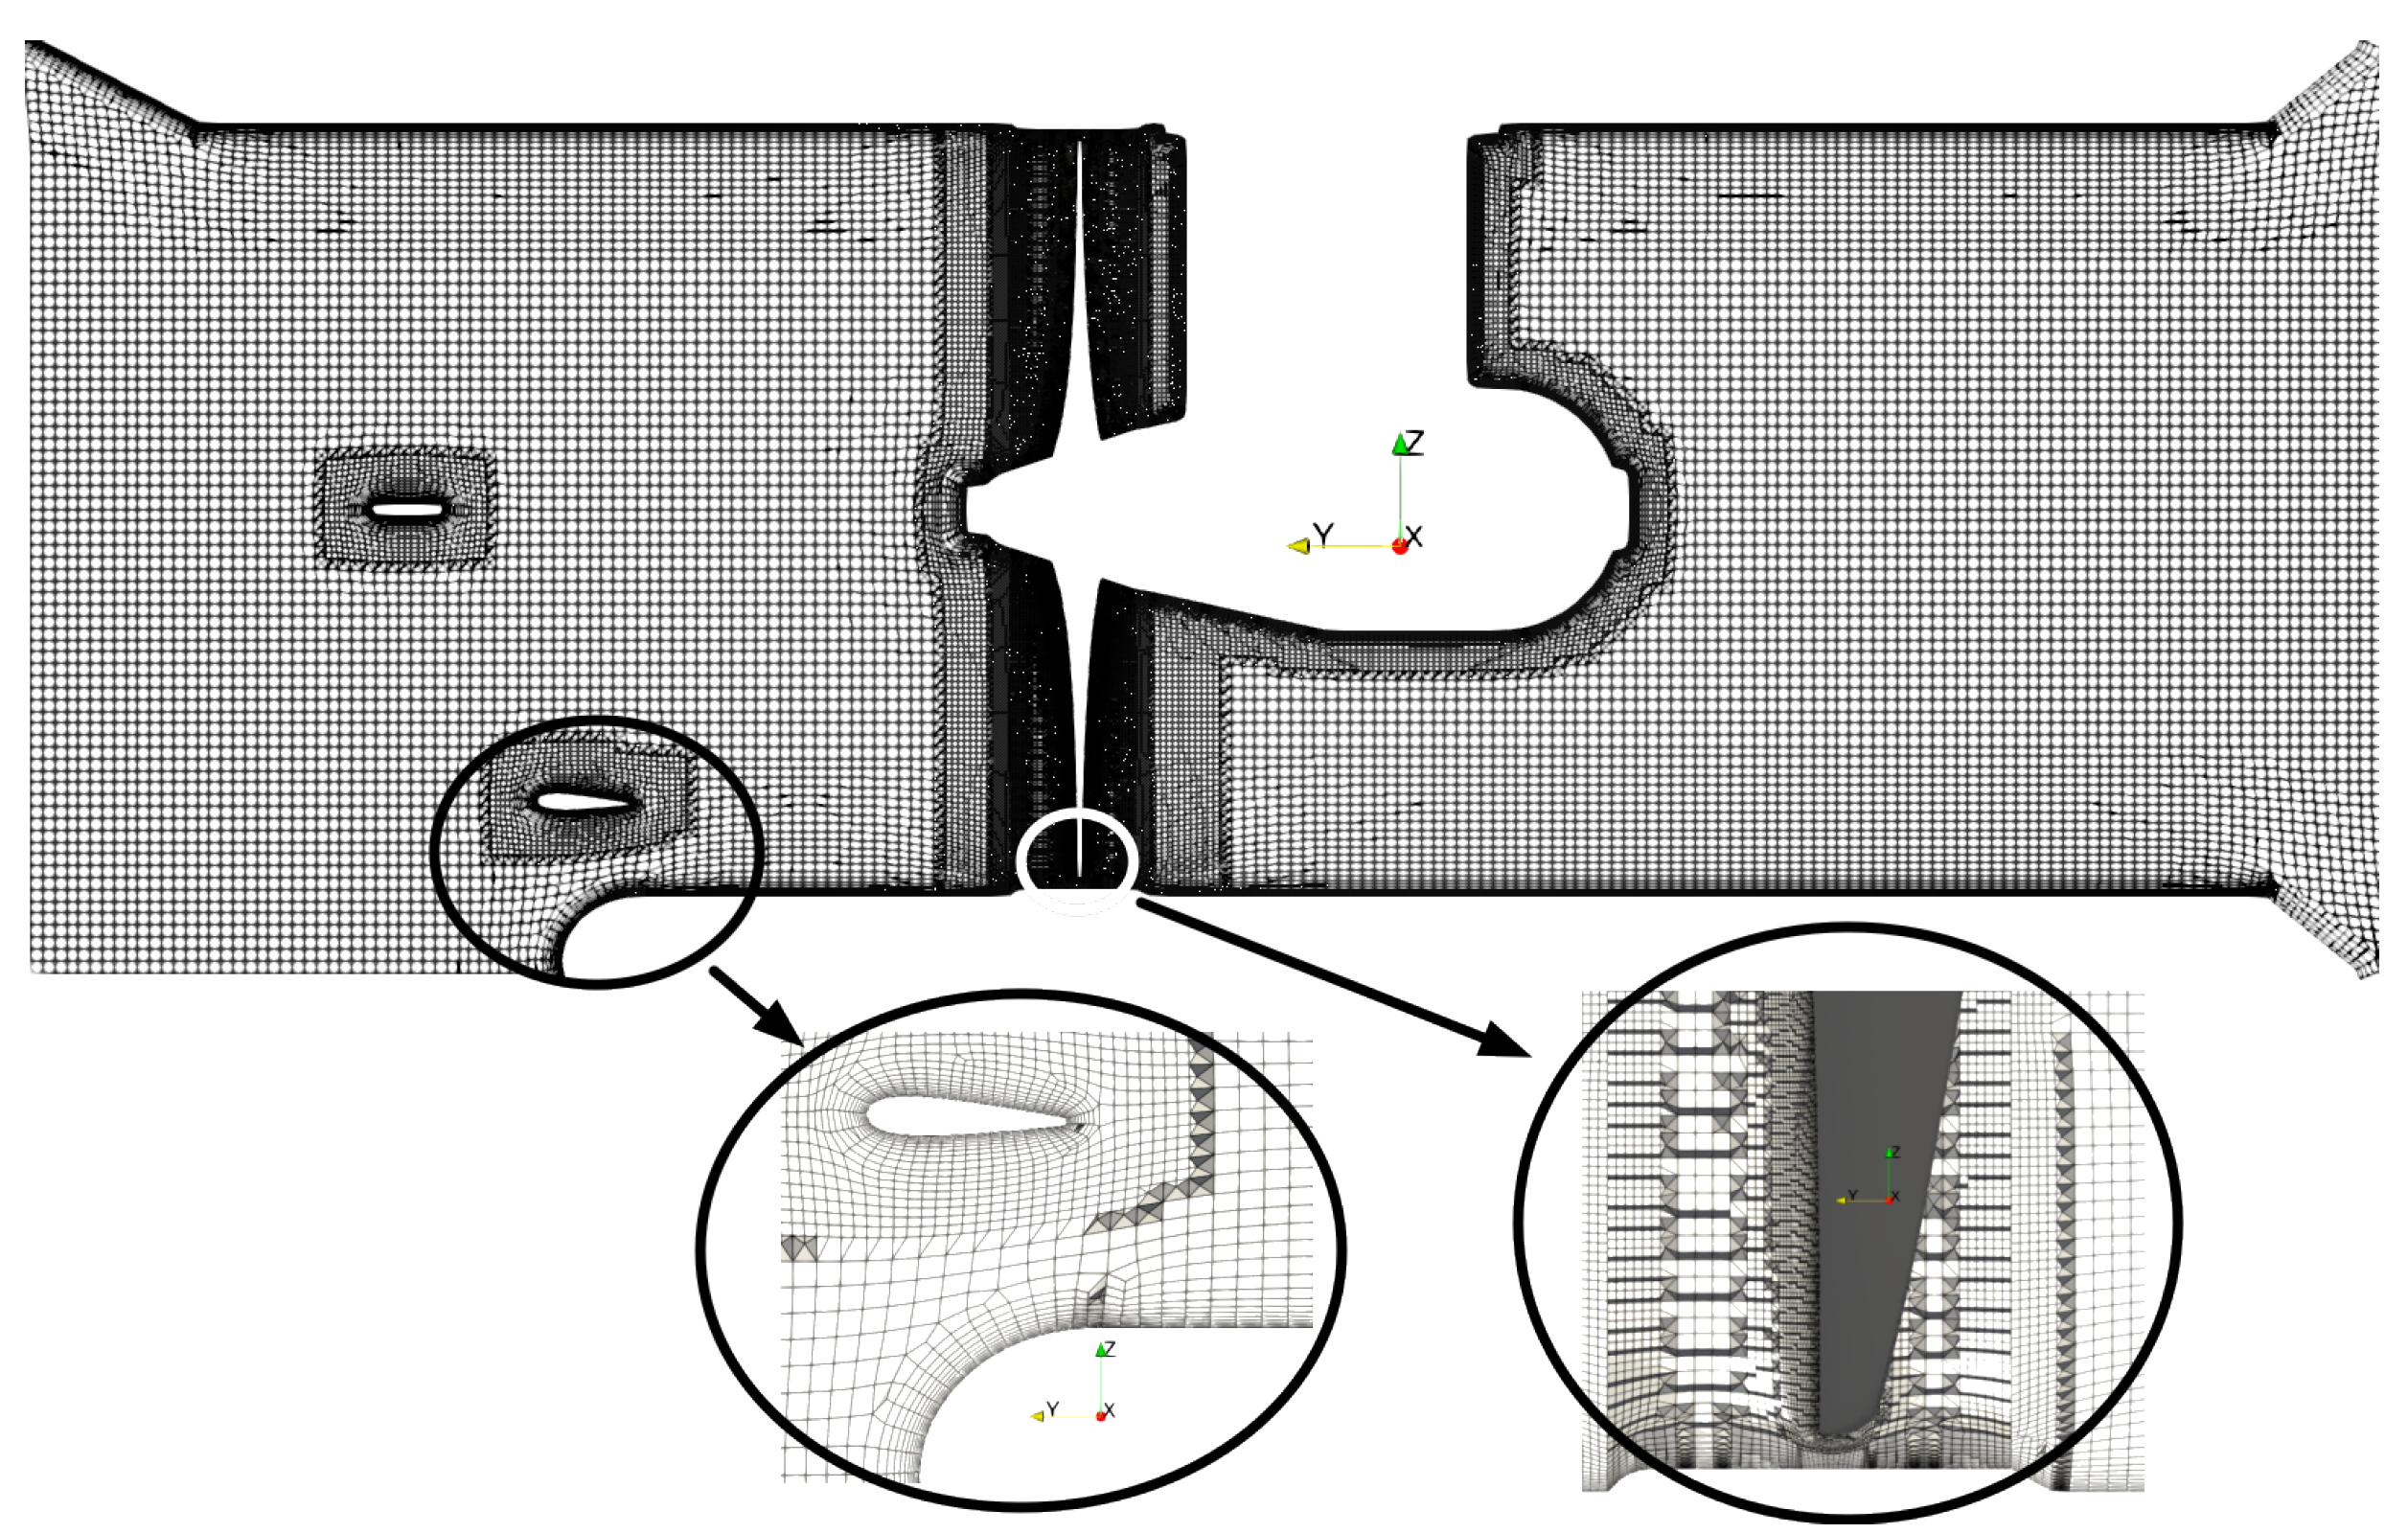
3. Mathematical Model of Hybrid Simulations
4. Results
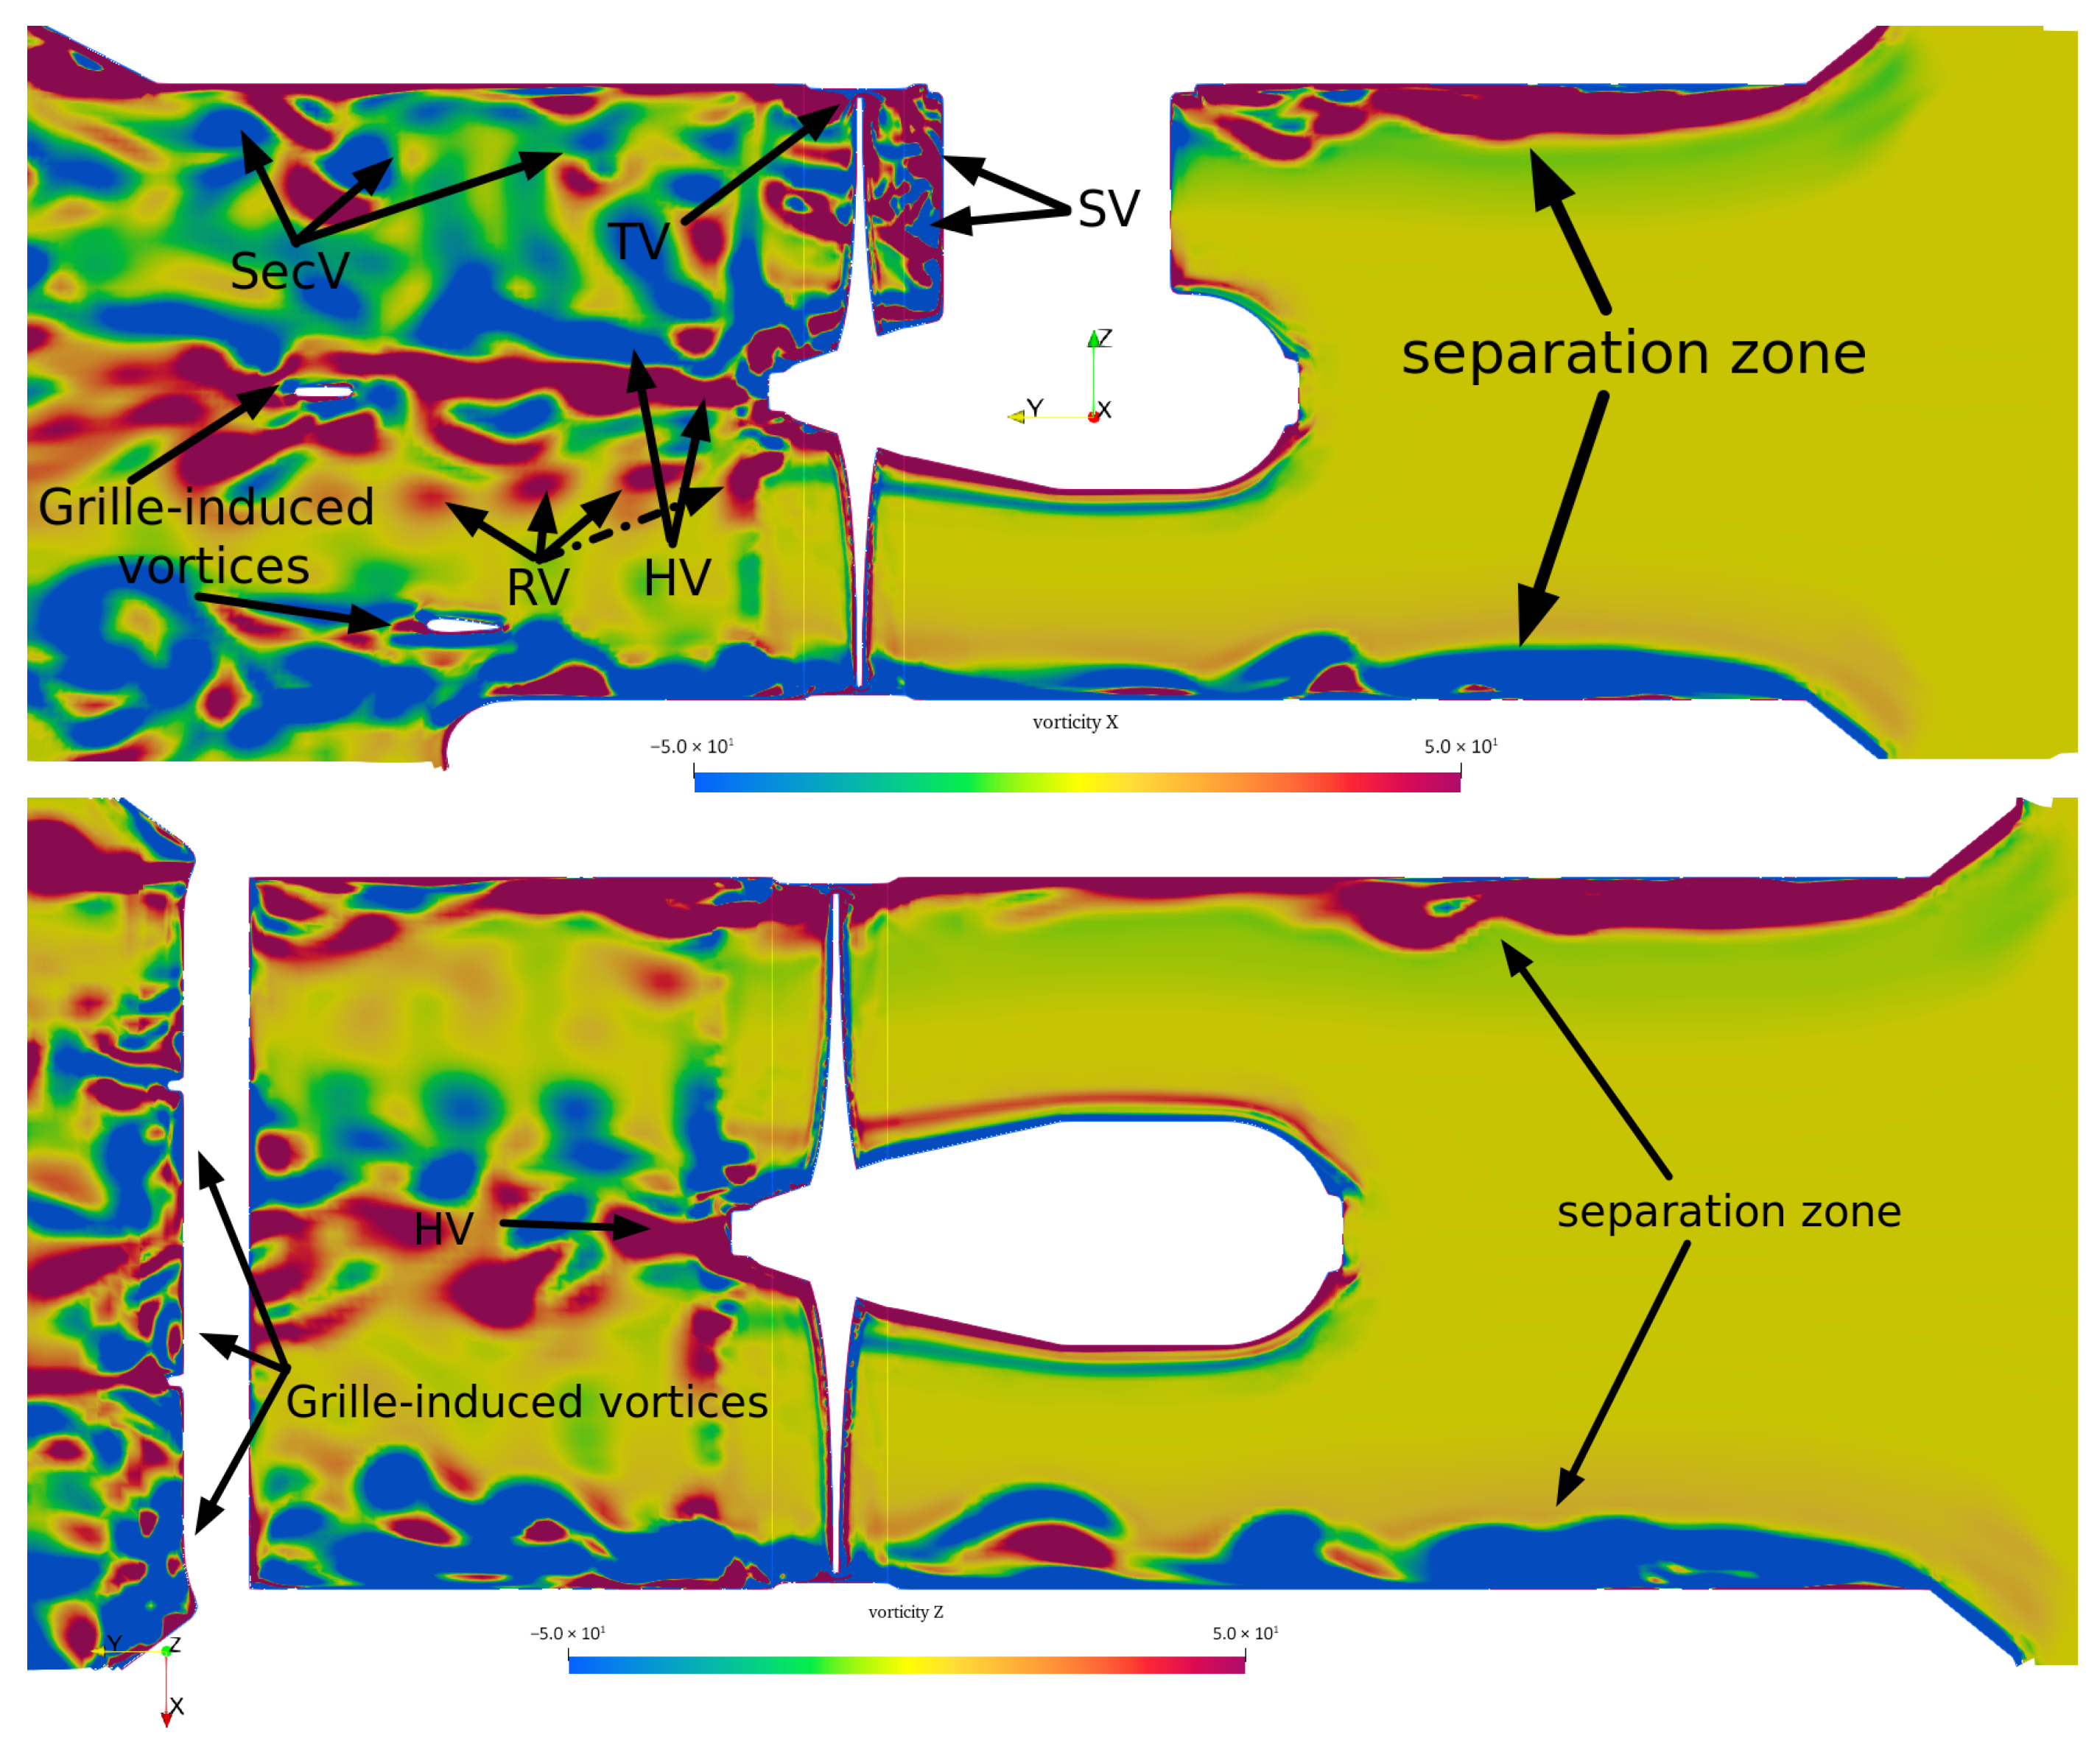
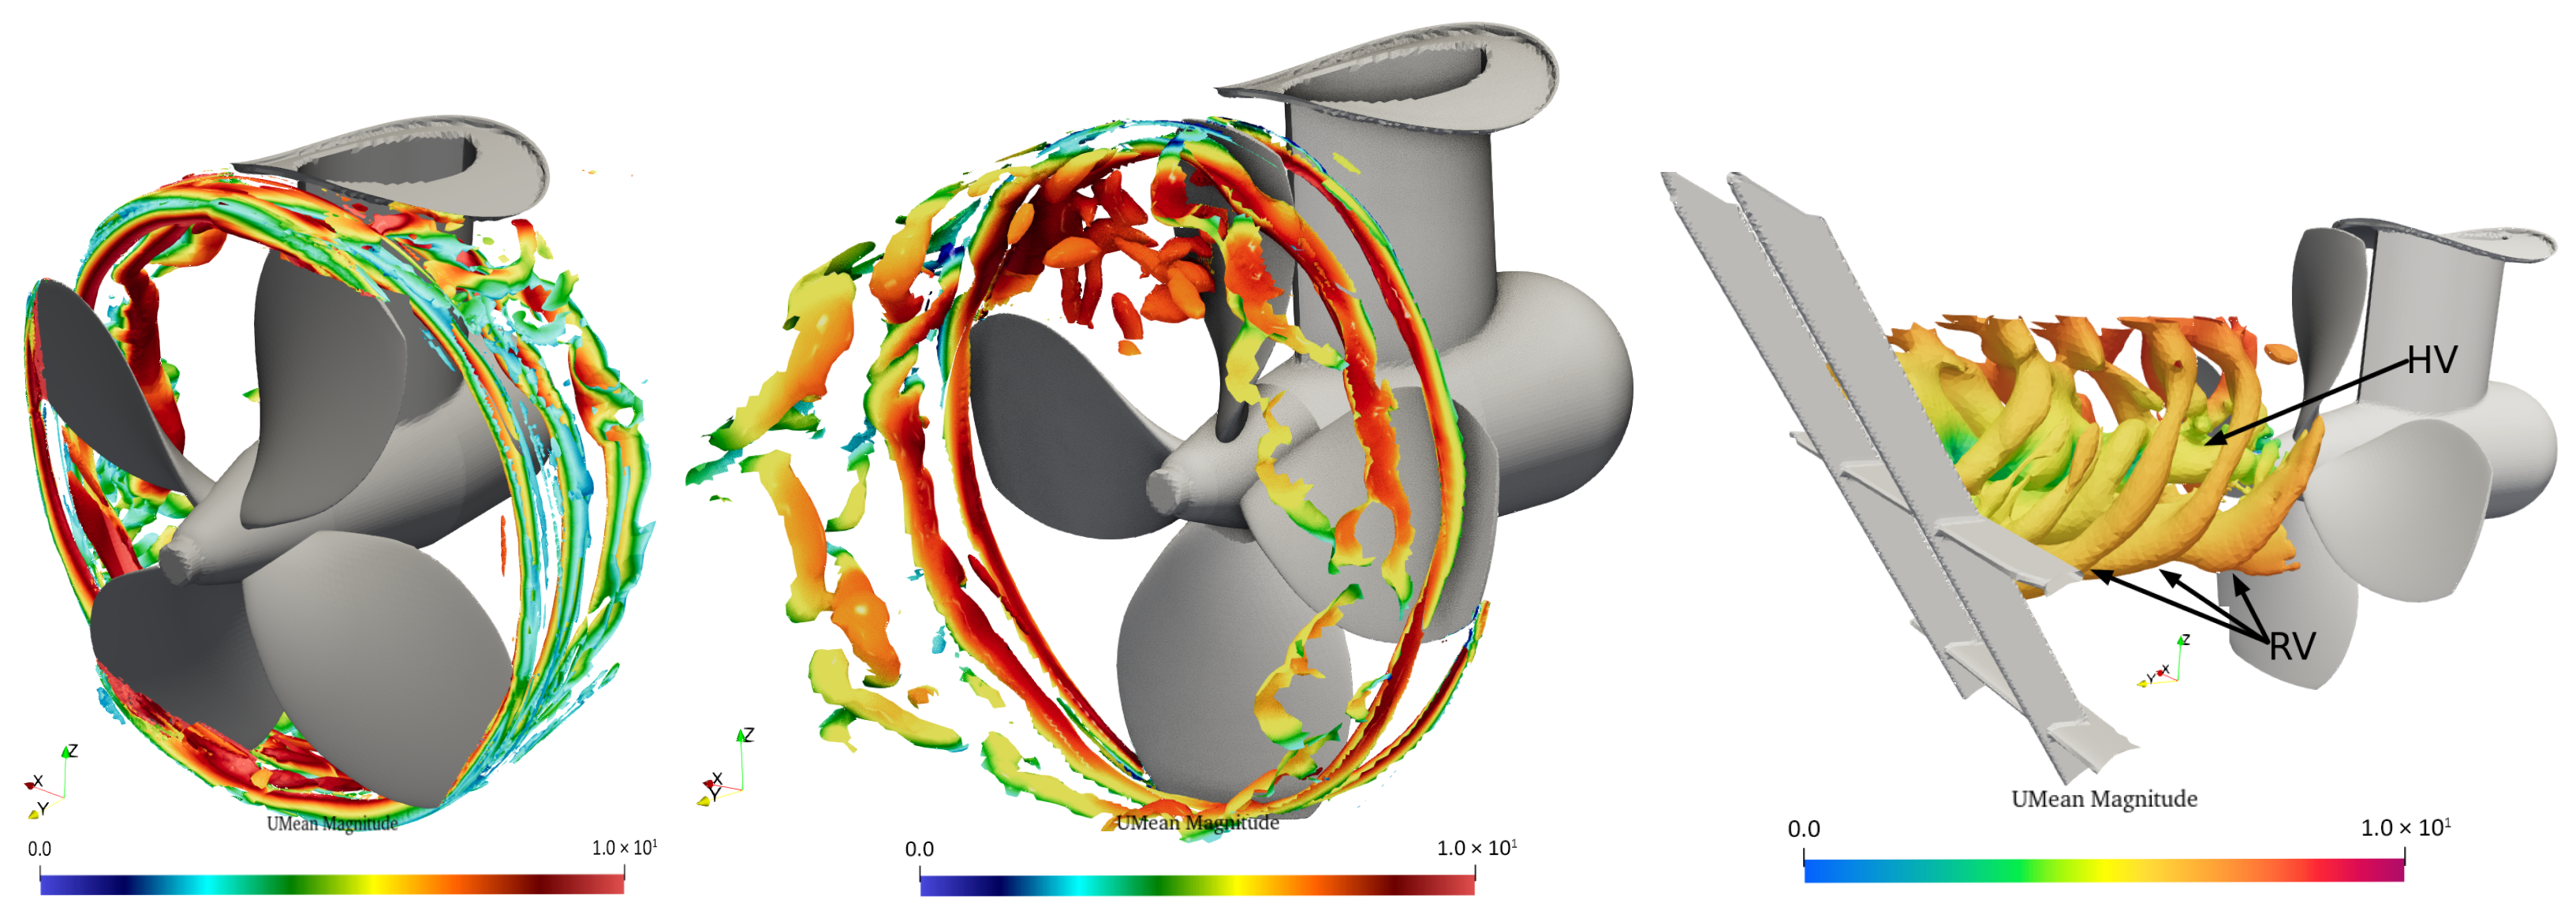
4.1. Flow Physics
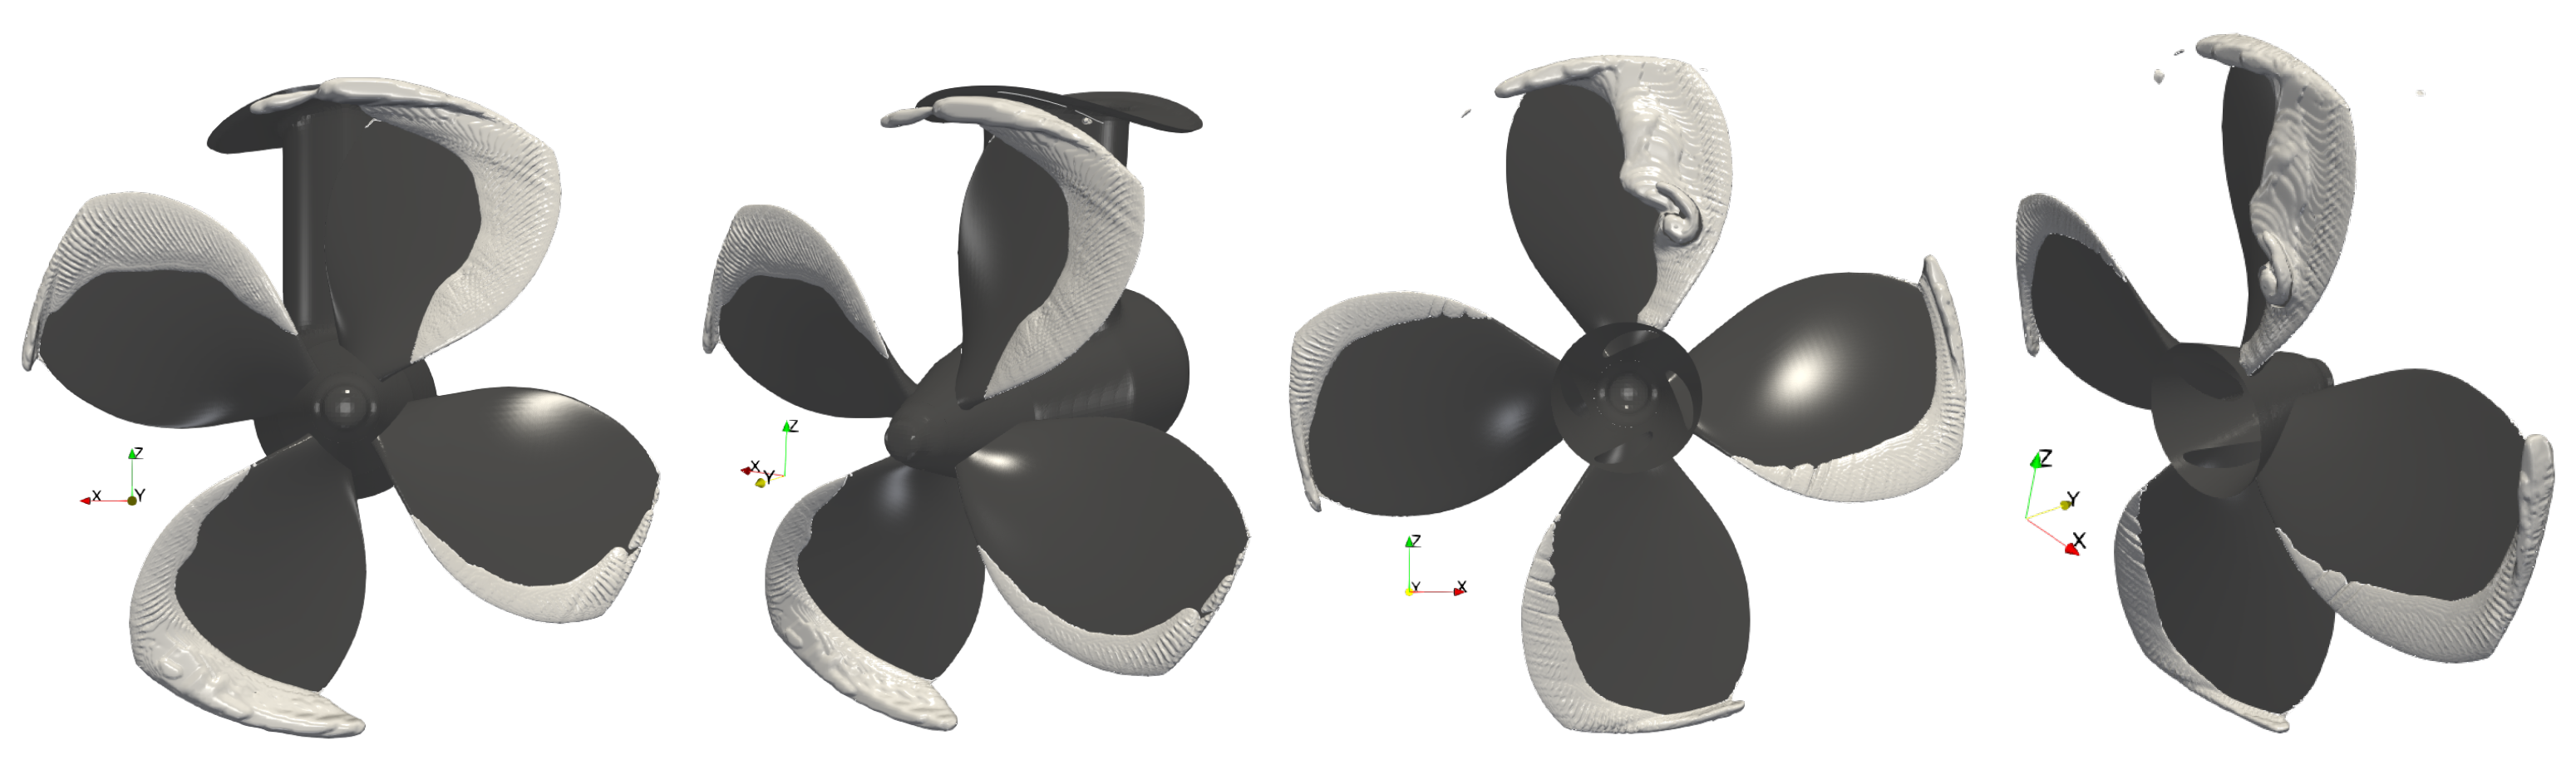
- In the NOD case, an accumulative cavitation region appears in front of the propeller at the bottom of the tunnel. This feature is absent in the ROD configuration.
- In ROD, cavitation accumulates (cavitation sheet has the largest extension) at a radius of approximately near the top of the tunnel (), which can be attributed to flow stagnation behind the strut.
- There are notable differences in cavitation volume between angular position in the ranges and in ROD and NOD. In NOD, the maximum cavitation volume occurs at the tunnel bottom (). The cavitation sheet does not collapse but instead follows the blade rotation, resulting in increased cavitation for compared to ROD. Conversely, in ROD, the peak cavitation volume occurs at the top (), leading to a greater cavitation sheet for .
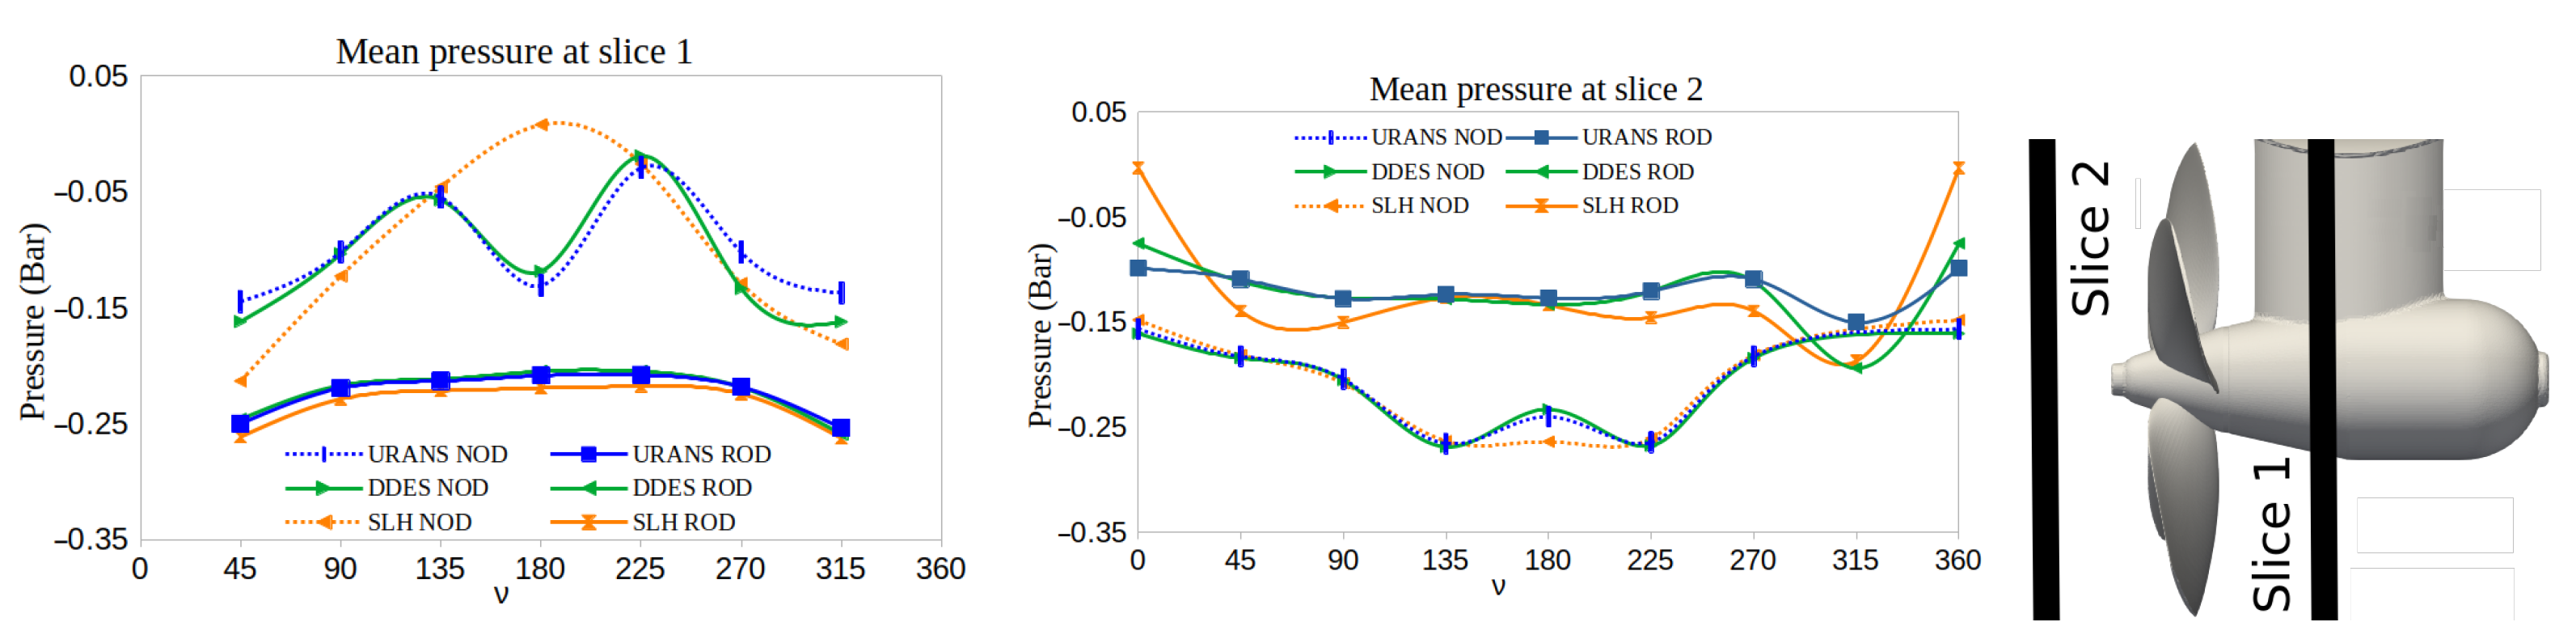
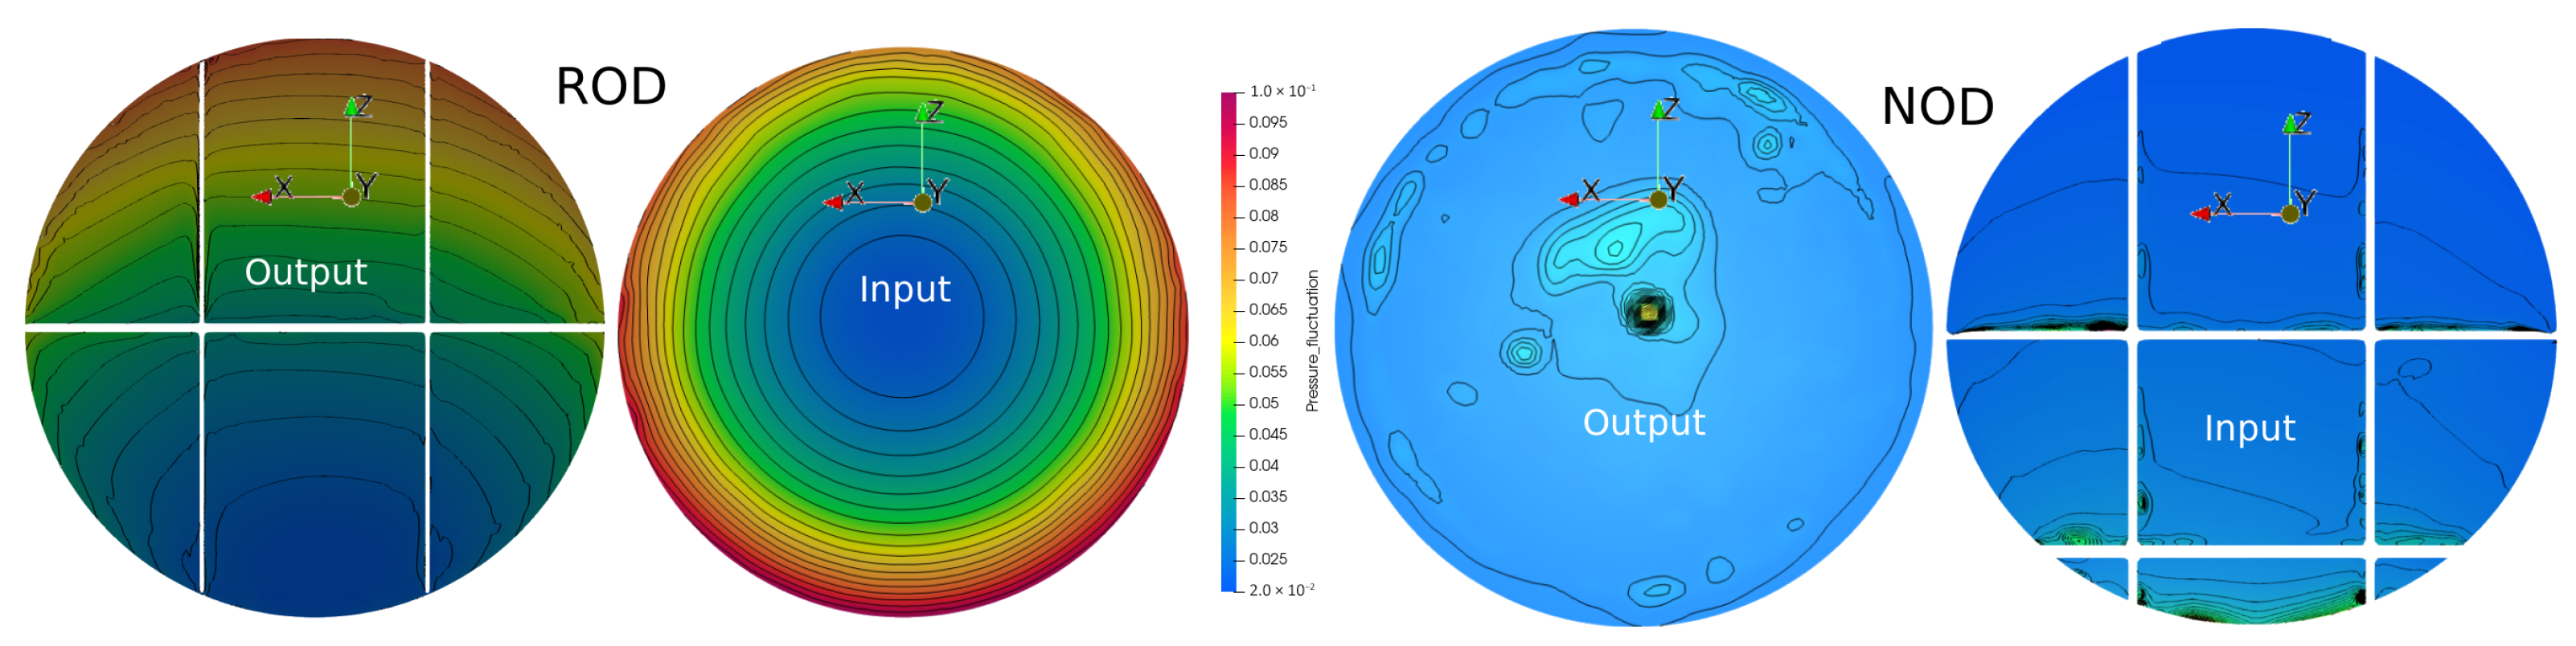
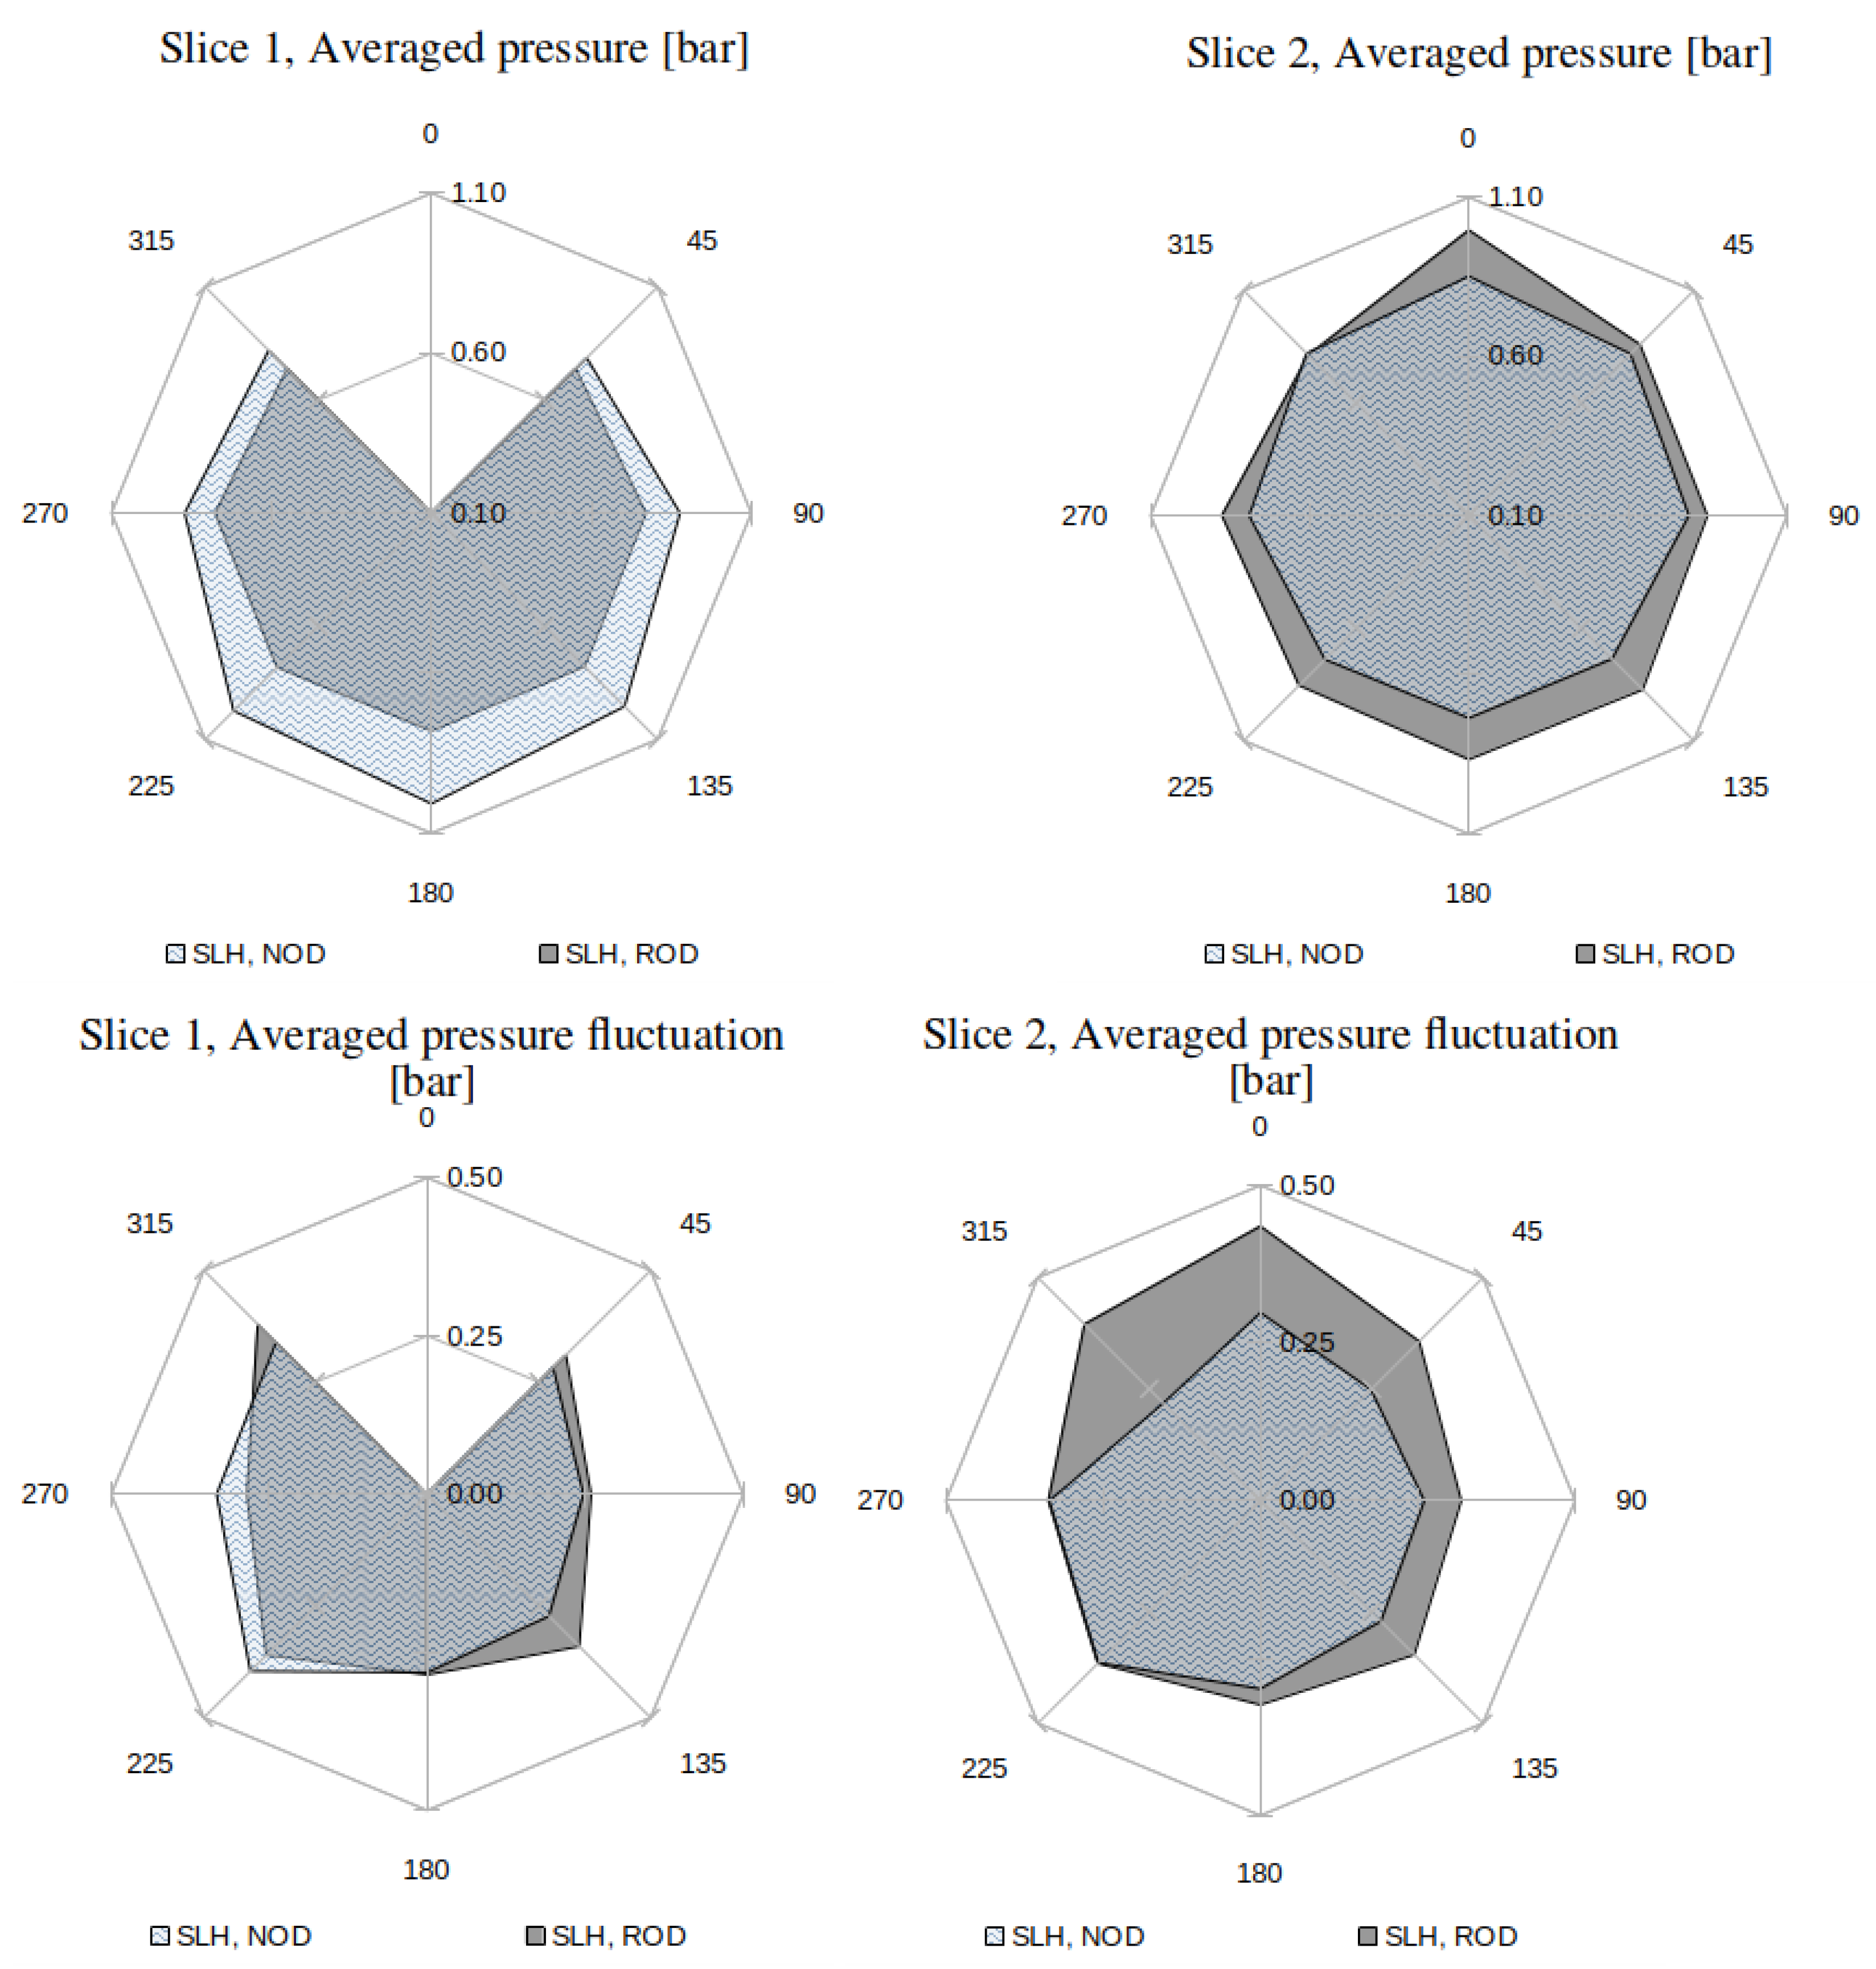
4.2. Pressure Study
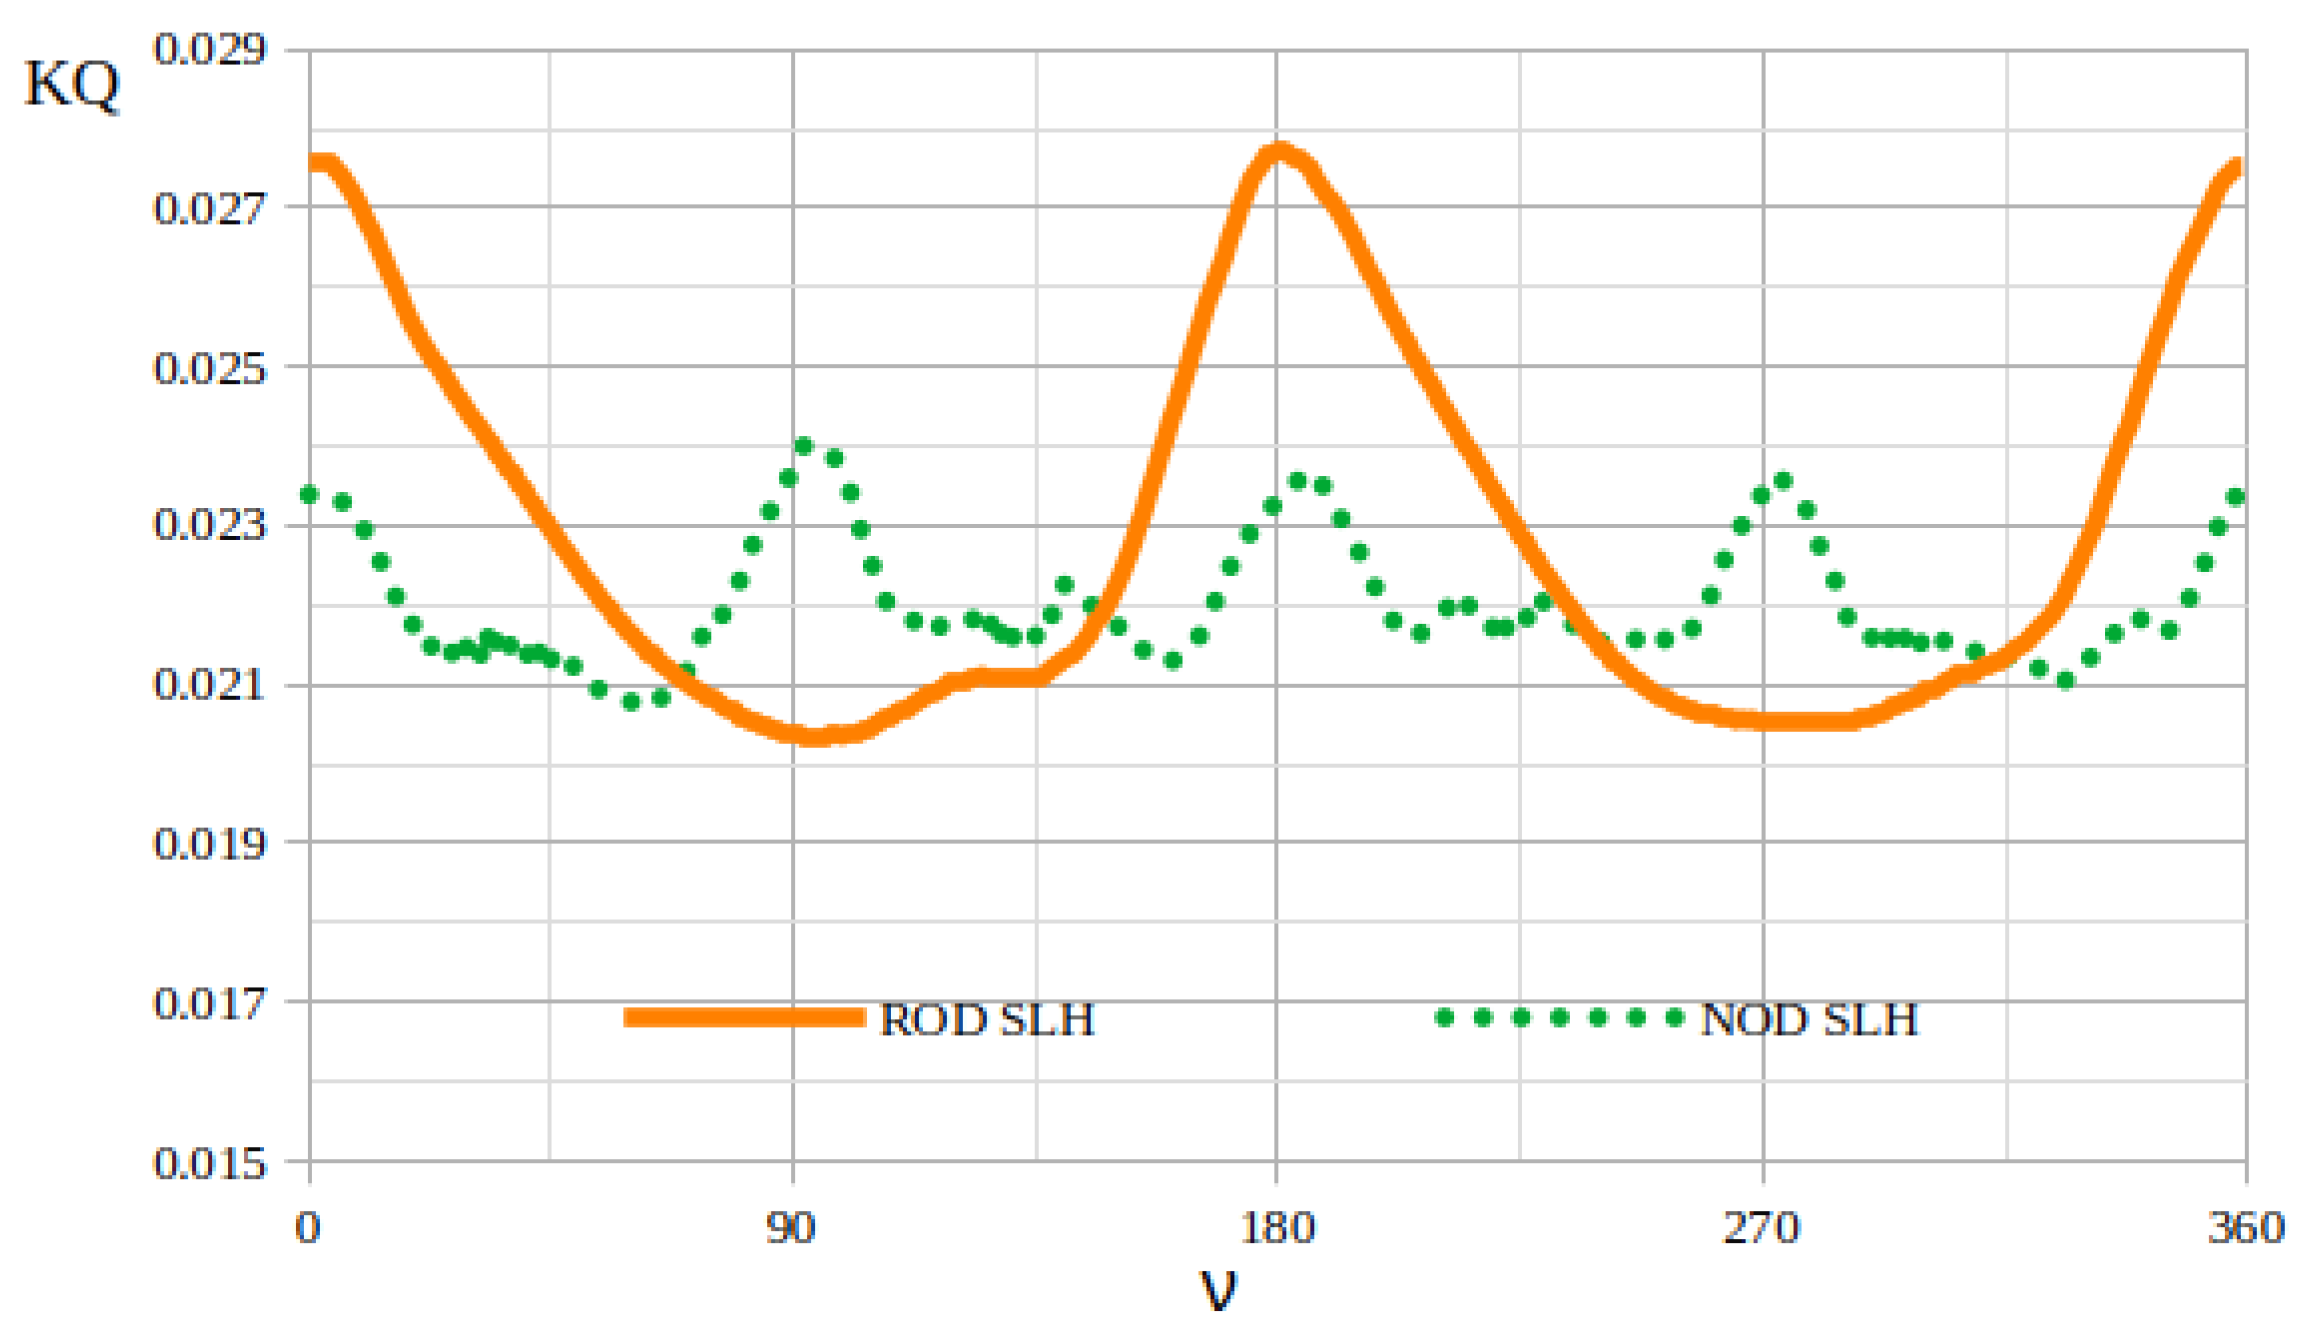
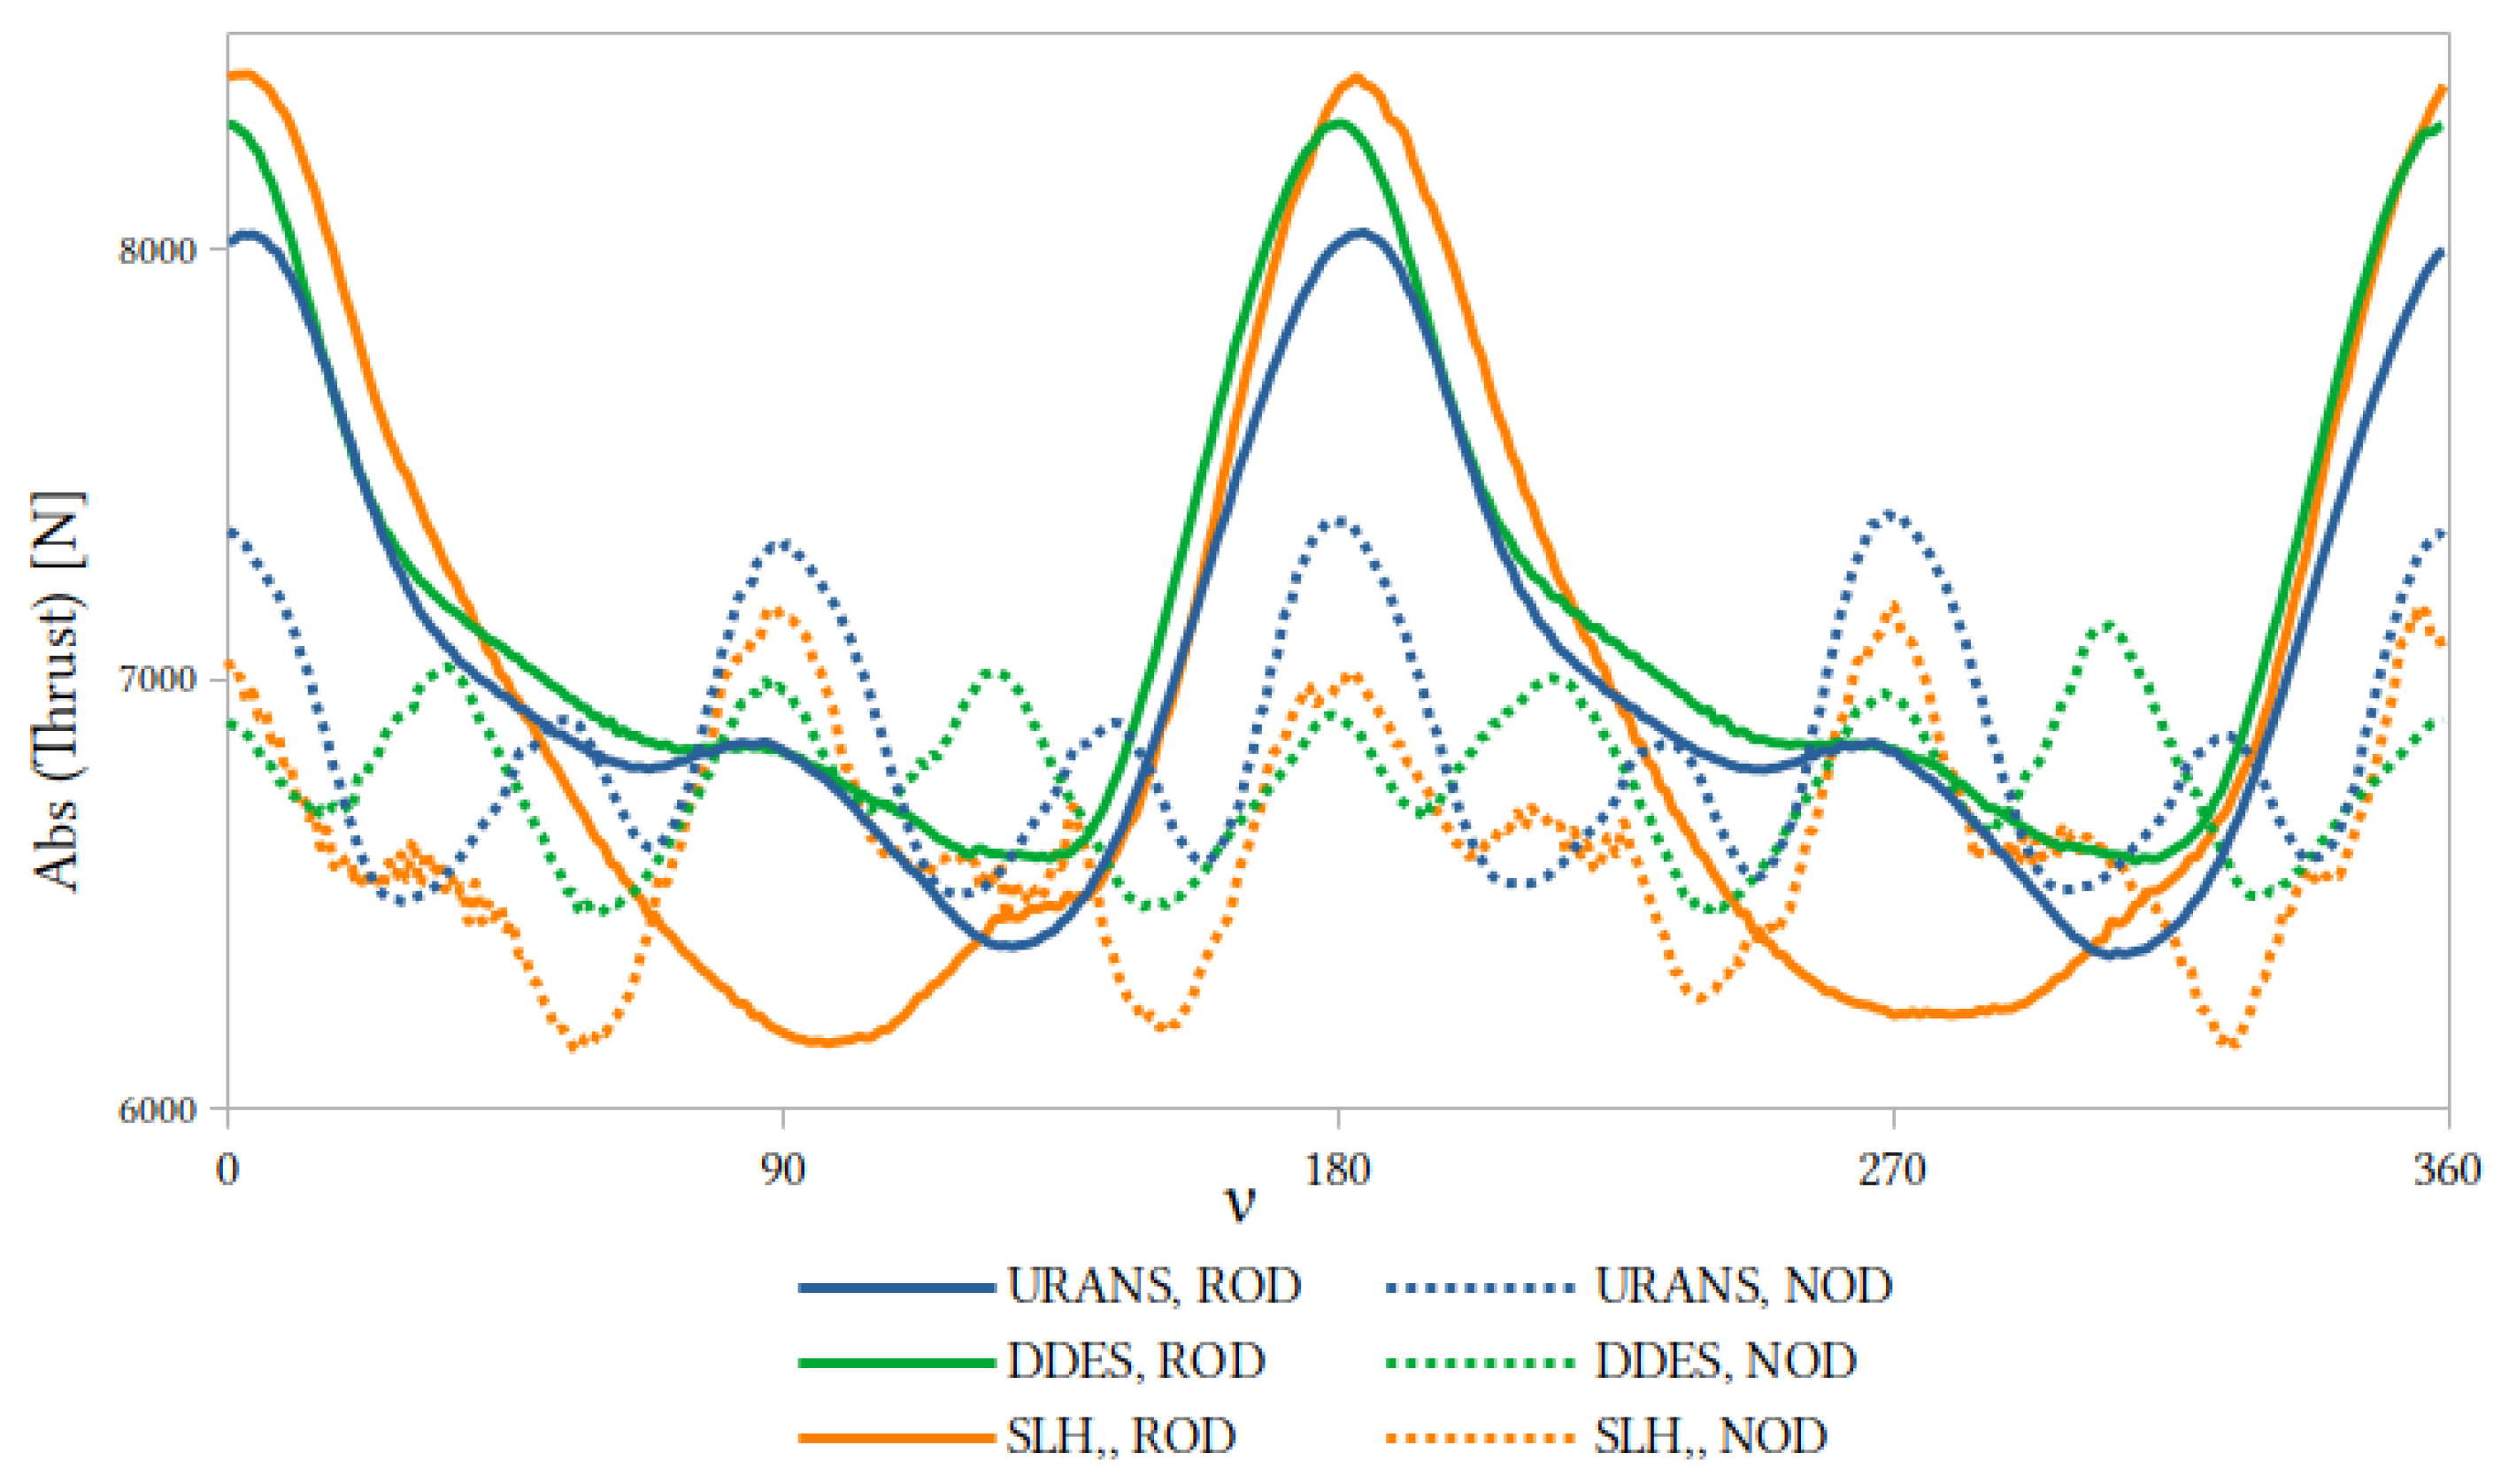
4.3. Forces and Moments
- In the ROD curve, the torque coefficient exhibits two pronounced peaks near and , reaching values around . Between these peaks, deep troughs appear at approximately and , with minima near . This “double-hump” pattern indicates a strong twice-per-revolution fluctuation in the loading on each blade when operating in the reverse-direction (ROD) configuration.
- By contrast, the NOD curve is much flatter: the torque coefficient oscillates gently between and , with only minor local peaks at and . This indicates a comparatively uniform torque distribution throughout each rotation under the normal operation (NOD) condition.
- Overall, the ROD configuration yields a larger mean and significantly larger amplitude of cyclic variation compared to NOD. In other words, ROD operation introduces stronger periodic torque fluctuations, whereas NOD operation maintains a more constant torque loading over the full sweep.
5. Conclusions
Author Contributions
Funding
Data Availability Statement
Acknowledgments
Conflicts of Interest
References
- Kazemi, M.; Kornev, N.; Hinnenthal, J. Scale resolving simulation of unsteady bow thruster hydrodynamics. Ocean Eng. 2024, 298, 117212. [Google Scholar] [CrossRef]
- Ozdemir, Y.; Bayraktar, S.; Yilmaz, T.; Guner, M. Determining Optimum Geometry for a Bow Thruster Propeller. Ph.D. Thesis, Yildiz Technical University, Istanbul, Türkiye, 2008. Available online: https://www.researchgate.net/publication/288705948 (accessed on 3 July 2025).
- Yao, Z.; Yan, Z. Hydrodynamic performance analysis and verification of transverse thrusters. J. Ship Mech. 2012, 16, 236–245. [Google Scholar]
- Yu, C.; Yang, C. Study of Tunnel Thruster Performance and Flow by Quasi-Steady Reynolds-Averaged Navier-Stokes Simulation. J. Shanghai Jiaotong Univ. (Sci.) 2016, 21, 662–671. [Google Scholar] [CrossRef]
- Brizzolara, S.; Brizzolara, E. Long Tunnel Configurations for High Efficiency Thrusters. In Proceedings of the 5th International Symposium on Marine Propulsors SMP’17, Espoo, Finland, 12–15 June 2017. [Google Scholar]
- Mohan, A. Numerical Analysis of Bow Tunnel Thruster Performance. Master Thesis, TU Delft, Delft, The Netherlands, 2017. [Google Scholar]
- Ermolaev, A.; Saifullin, T.; Shevtsov, S. Effect of the thruster inlet configuration upon the force arising on the side. Trans. Krylov State Res. Cent. 2015, 88, 109–116. [Google Scholar]
- Ermolaev, A.; Shevtsov, S. Vibration of thrusters and ways to combat it. Trans. Krylov State Res. Cent. 2018, 67–74. [Google Scholar] [CrossRef]
- He, C.; Ma, X.; Wen, T.; Sun, Y.; Yang, Z.; Tan, Y.; Zhuo, J. Numerical simulation investigation on hydrodynamic performance of bow thruster under different velocity conditions. J. Mar. Sci. Eng. 2024. submitted. [Google Scholar]
- Dubensky, L.; Krikalo, T.T.V.; Pustoshny, A. Reduction of periodic forces arising on the propeller by artificial redistribution of the velocity field in the propeller disk using passive devices. Mater. Exch. Exp. Sci. Res. Inst. Named After Acad. A.N. Krylov L. Shipbuild. 1976, 241, 91–94. [Google Scholar]
- Kazemi, M.; Dause, M.; Hinnenthal, J.; Kornev, N. Numerical study of reduction of unsteady effects in bow thruster. Ocean Eng. 2025, 324, 120660. [Google Scholar] [CrossRef]
- Guo, W.; Yan, Z.; Han, Y.; Liu, M.; Sun, D.; Zhu, M. Design and Optimization of Non-Penetrating Tunnel Thruster for Small Vessels Using CFD. J. Mar. Sci. Eng. 2024, 12, 1960. [Google Scholar] [CrossRef]
- McNeill, D.; Wang, K.; Ning, Y.; Xu, L. Study on the Influence of Bow Thrusters on AUV Hydrodynamic Performance and a Novel Retractable Design. J. Mar. Sci. Eng. 2024, 12, 2021. [Google Scholar]
- Okuda, R.; Yasukawa, H.; Hirata, N.; Matsuda, A. A Study on Berthing and Unberthing of a Single-Shaft Ship with a Bow Thruster. J. Mar. Sci. Technol. 2024, 29, 53–74. [Google Scholar] [CrossRef]
- Li, B.; Zhang, J.; Chen, F.; Zhang, Z. Decay of Bow Thruster-Induced Near-Bed Flow Velocities. J. Coast. Harb. Struct. 2024, 11, 41–55. [Google Scholar]
- Tan, Y.; Sun, Y.; Cai, H.; Zhuo, J. Analysis of Pressure Fluctuations Caused by Bow Thrusters in Different Operating Directions. J. Mar. Sci. Eng. 2024, 12, 2054. [Google Scholar] [CrossRef]
- Hodge, R. Design Issues and Failure Modes in OSV Propulsion Systems. In Proceedings of the Dynamic Positioning Conference, Houston, TX, USA, 13–14 October 2009. [Google Scholar]
- Bui, T. Numerical simulation of the performance of bow thruster taking into account turbulence model influence using RANS method. In Proceedings of the Seventh International Symposium of Marine Propulsors (SMP’22), Wuxi, China, 17–21 October 2022; pp. 109–114. [Google Scholar]
- Weller, H.G.; Tabor, G.; Jasak, H.; Fureby, C. A tensorial approach to computational continuum mechanics using object-oriented techniques. Comput. Phys. 1998, 12, 620–631. [Google Scholar] [CrossRef]
- Schnerr, G.H.; Sauer, J. Physical and numerical modeling of unsteady cavitation dynamics. In Proceedings of the Fourth International Conference on Multiphase Flow, ICMF, New Orleans, LO, USA, 27 May–1 June 2001; Volume 1. [Google Scholar]
- Anschau, P.; Kornev, N.; Samarbakhsh, S. Unsteady hydrodynamic loads on energy saving ducts. Ocean Eng. 2023, 269, 113431. [Google Scholar] [CrossRef]
- Shevtsov, S. Investigation of Hydrodynamic Characteristics of Thrusters of the “Screw in the Pipe” Type. Clarification of the Design Methodology of These Devices, Including High Power Installations. Ph.D. Thesis, Krylov Research Centre, St. Petersburg, Russia, 2014. (In Russian). [Google Scholar]

| URANS | DDES | SLH | |
|---|---|---|---|
| NOD | 6830.47 | 6757.33 | 6608.36 |
| ROD | 7073.37 | 7058.8055 | 6997.14 |
| NOD | ROD | |||||
|---|---|---|---|---|---|---|
| URANS | DDES | SLH | URANS | DDES | SLH | |
| 0.0219 | 0.0216 | 0.0209 | 0.0216 | 0.0220 | 0.0216 | |
| 0.1578 | 0.1561 | 0.1526 | 0.1619 | 0.1650 | 0.1608 | |
| 0.2126 | 0.2125 | 0.2113 | 0.2135 | 0.2139 | 0.2158 | |
Disclaimer/Publisher’s Note: The statements, opinions and data contained in all publications are solely those of the individual author(s) and contributor(s) and not of MDPI and/or the editor(s). MDPI and/or the editor(s) disclaim responsibility for any injury to people or property resulting from any ideas, methods, instructions or products referred to in the content. |
© 2025 by the authors. Licensee MDPI, Basel, Switzerland. This article is an open access article distributed under the terms and conditions of the Creative Commons Attribution (CC BY) license (https://creativecommons.org/licenses/by/4.0/).
Share and Cite
Kazemi, M.; Kornev, N. Bow Thruster at Normal and Off-Design Conditions. J. Mar. Sci. Eng. 2025, 13, 1463. https://doi.org/10.3390/jmse13081463
Kazemi M, Kornev N. Bow Thruster at Normal and Off-Design Conditions. Journal of Marine Science and Engineering. 2025; 13(8):1463. https://doi.org/10.3390/jmse13081463
Chicago/Turabian StyleKazemi, Mehrdad, and Nikolai Kornev. 2025. "Bow Thruster at Normal and Off-Design Conditions" Journal of Marine Science and Engineering 13, no. 8: 1463. https://doi.org/10.3390/jmse13081463
APA StyleKazemi, M., & Kornev, N. (2025). Bow Thruster at Normal and Off-Design Conditions. Journal of Marine Science and Engineering, 13(8), 1463. https://doi.org/10.3390/jmse13081463