Abstract
The maritime sector faces escalating demands to minimize emissions and optimize operational efficiency under tightening environmental regulations. Although technologies such as the Internet of Things (IoT), Artificial Intelligence (AI), and Digital Twins (DT) offer substantial potential, their deployment in real-time ship performance analytics is at an emerging state. This paper proposes a machine learning-driven framework for real-time ship performance management. The framework starts with data collected from onboard sensors and culminates in a decision support system that is easily interpretable, even by non-experts. It also provides a method to forecast vessel performance by extrapolating Key Performance Indicator (KPI) values. Furthermore, it offers a flexible methodology for defining KPIs for every crucial component or aspect of vessel performance, illustrated through a use case focusing on fuel oil consumption. Leveraging Artificial Neural Networks (ANNs), hybrid multivariate data fusion, and high-frequency sensor streams, the system facilitates continuous diagnostics, early fault detection, and data-driven decision-making. Unlike conventional static performance models, the framework employs dynamic KPIs that evolve with the vessel’s operational state, enabling advanced trend analysis, predictive maintenance scheduling, and compliance assurance. Experimental comparison against classical KPI models highlights superior predictive fidelity, robustness, and temporal consistency. Furthermore, the paper delineates AI and ML applications across core maritime operations and introduces a scalable, modular system architecture applicable to both commercial and naval platforms. This approach bridges advanced simulation ecosystems with in situ operational data, laying a robust foundation for digital transformation and sustainability in maritime domains.
1. Introduction
The maritime industry is at a critical crossroads, driven by the converging imperatives of decarbonization, digitalization, and operational resilience. As maritime transport is responsible for approximately 3% of global CO2 emissions, the need for transformative solutions to mitigate environmental impact has never been more urgent [1]. The Fourth International Maritime Organization (IMO) Greenhouse Gas (GHG) Study [1] underscores this urgency, catalyzing a global push toward the adoption of energy-efficient technologies, emissions-reduction strategies, and advanced decision support systems powered by big data and Artificial Intelligence (AI) [2,3]. In response, Industry 4.0 technologies—including the Internet of Things (IoT), big data, cloud computing, and AI—are reshaping the operational landscape of the maritime sector, offering unprecedented opportunities for optimizing vessel performance while minimizing environmental footprints, with minimal human intervention.
Predictive maintenance is a cornerstone of digital transformation, enhancing asset reliability, reducing costs, and improving safety. Machine learning (ML) techniques have proven effective in this domain. For instance, Kimera and Nangolo [4] apply Support Vector Machines and Principal Component Analysis for ballast pump maintenance in resource-limited settings. Cheliotis et al. [5] combine behavior modeling and statistical process control to detect faults with limited data, while Asimakopoulos et al. [6] use ensemble methods like Random Forest and XGBoost to identify early-stage faults in marine engines. Spandonidis and Paraskevopoulos [7] propose a deep learning-based index to predict vessel propeller–hull degradation, using real-world sensor data from multiple ships over 18 months. Theodoropoulos et al. [8] leverage 1D-CNNs (One dimension Convolution Neural Networks) for real-time fault detection in ship engines, showcasing the growing sophistication of ML in maritime maintenance.
Beyond maintenance, performance prediction plays a vital role in enhancing fuel efficiency and advancing sustainability. Karatuğ et al. [9] develop a decision support system that combines engine optimization and neural networks to accurately estimate ship fuel consumption using real-time data, providing a cost-effective way to monitor energy efficiency. Di Bonito et al. [10] combine AI and analytical models to improve SO2 absorption in scrubbers, while Gupta et al. [11] use non-linear regression and probabilistic artificial neural networks to predict hydrodynamic performance degradation due to biofouling. Ji et al. [12] propose a dynamic framework using Long Short-Term Memory (LSTM) networks and Particle Swarm Optimization–Random Forest (PSO-RF) to predict hull corrosion, considering real-world voyage conditions. These studies highlight the potential of data-driven methods in optimizing performance and sustainability.
Among the most promising innovations is Digital Twin (DT) technology, which creates virtual replicas of vessel systems for real-time monitoring, simulation, and lifecycle optimization [13,14]. DTs enable predictive analytics and operational foresight, enhancing safety, efficiency, and sustainability [15]. Moreover, the work of Karatuğ et al. [16] combines engine simulation and Adaptive Neuro-Fuzzy Inference System (ANFIS)-based machine learning to predict ship performance and improve energy efficiency using noon report data: as the authors remark, their approach can be easily incorporated into a DT framework in the maritime sector.
Augmented by reduced-order models, physics-informed simulations, and hybrid AI frameworks, DTs significantly improve situational awareness and risk mitigation, such as predicting cargo displacement and vessel instability under dynamic sea conditions [17,18].
Despite the significant promise of these technological advancements, the maritime industry continues to face challenges in widespread adoption. Key barriers include a lack of accessible data and a simple framework for non-experts. Alarmingly, fewer than 2% of vessels currently utilize Condition-Based Maintenance (CBM) systems [19], a situation exacerbated by the complexity of data integration and the lack of interoperable decision support platforms [20]. Proprietary performance monitoring solutions often operate within closed ecosystems, which limit transparency and collaboration across the maritime supply chain [21]. Additionally, challenges in scalability, real-time data reliability, cybersecurity, and the interpretability of AI-driven systems continue to hinder the sector’s ability to fully leverage these innovations at scale [13,22,23]. A critical gap also exists in the absence of standardized methodologies for validating AI-generated Key Performance Indicators (KPIs), particularly with respect to their responsiveness, domain relevance, and trustworthiness [24].
Conventional vessel performance assessment still depends heavily on sea trial and shop test curves, but these reference datasets exhibit critical limitations. They are obtained under near-ideal environmental and loading conditions and remain valid only within a narrow operational envelope. Their extrapolation to off-design conditions is unreliable because hydrodynamic and propulsion behaviors are highly non-linear, and they fail to account for in-service aging, fouling, or lifecycle-driven degradation. Although weather and draft correction methods exist, their predictive capability beyond the conditions of initial trials is limited due to compounding uncertainties. Collectively, these constraints hinder accurate, data-driven performance monitoring across the full range of real operating states. To address this gap, we propose an AI-enabled KPI framework that continuously learns from operational sensor data and delivers adaptive, interpretable indicators of performance degradation throughout a vessel’s lifecycle.
In light of these challenges, this paper proposes a machine learning-powered framework for real-time ship performance management, centered around dynamic, AI-enhanced KPIs (ML-KPIs). In contrast to the aforementioned studies, our approach introduces a comprehensive framework that spans from data acquisition to the delivery of actionable insights for the end-user. It is designed to be applicable across various shipboard systems without requiring extensive technical expertise, enabling the effective monitoring of all critical components. Moreover, the framework can be tailored to each individual vessel by taking into account its operational history and specific characteristics. This framework begins with data acquisition and data transferring, then integrates artificial neural networks with hybrid data fusion techniques to evaluate essential operational metrics such as fuel consumption, engine health, and emissions performance. It supports adaptive performance monitoring, anomaly detection, and proactive decision-making, enabling the real-time optimization of vessel operations. Unlike existing proprietary systems, the proposed framework is designed to be open, modular, and scalable, ensuring its applicability across a broad range of vessel types and operational contexts. While not intended as a one-size-fits-all solution, the proposed framework represents a practical and impactful approach to applying AI for optimizing maritime operations and advancing sustainability. A key feature of the system is its rigorous validation methodology, which quantitatively assesses the reliability and responsiveness of KPIs using both historical and real-time operational data. Developed under the DigitSense program, the framework offers broad applicability across both commercial and defense maritime sectors. DigitSense is an innovative intelligent DT for ship energy systems. This DT will serve as an integrated platform for the collection, processing, and visualization of measurements from various onboard sensors. Simultaneously, these measurements will be used to feed simulation models—featuring varying levels of physical fidelity—that represent the ship’s energy systems.
The remainder of the paper is structured as follows: Section 2 establishes the principles of the KPI framework; Section 3 details the architecture and logic of the proposed KPI framework; Section 4 presents a use case of the methodology; Section 5 discusses implementation scenarios and system behaviors under real-world conditions; Section 6 outlines deployment challenges and mitigation strategies; and Section 7 concludes the paper with recommendations for future research and development.
2. Principles of KPI Design
The effectiveness of a machine learning-powered KPI framework depends not only on algorithmic accuracy but also on the operational relevance, interpretability, and robustness of the metrics it produces. To ensure the proposed KPIs are technically sound and practically actionable, their design was guided by a set of core principles developed through a multi-pronged process involving empirical modeling, domain literature, and participatory co-design methodology.
These principles were not arbitrarily defined. Rather, they emerged from a structured Future Workshop [25] involving 18 stakeholders across the maritime ecosystem—including shipboard personnel, fleet managers, marine engineers, and AI specialists. The workshop enabled a collaborative critique of existing performance systems, the speculative envisioning of ideal future capabilities, and consensus-building around actionable KPI design requirements. The process was further triangulated with a systematic literature review and empirical findings from the DigitSense program. The resulting five principles underpin every KPI within the framework and ensure alignment with both data-driven best practices and operator-centered design considerations:
Component-Specific Relevance. Each KPI is explicitly mapped to a key subsystem—such as the hull, propeller, main engine, or auxiliary machinery—to enable localized diagnostics and targeted maintenance strategies. This granularity supports modular scalability and facilitates system-level root-cause analysis.
Environmental and Operational Adaptability. The KPI’s behavior is context-sensitive, adapting to changing operational conditions (e.g., load, displacement, weather, sea state) and vessel-specific attributes (e.g., ship age, route profile). These dynamic inputs are essential to prevent false alerts and ensure performance evaluation remains accurate under real-world variability.
Sensor Quality and Data Resilience. Given the inherent variability and occasional degradation of onboard sensor data, all the KPIs are engineered to remain robust under noise, latency, or partial loss. Preprocessing steps—including filtering, outlier detection, and signal fusion—ensure that metric computation remains stable and trustworthy.
Interpretability and Operator Usability. Each KPI is designed for clarity, allowing both onboard crews and shore-side analysts to easily understand and act upon the insights. This principle was heavily emphasized during the workshop, with ship engineers stressing the importance of intuitive units, threshold markers, and trend visualizations for day-to-day decision-making.
Trend Sensitivity and Degradation Tracking. The KPIs are inherently time-aware and sensitive to gradual phenomena such as fouling, wear, corrosion, and efficiency loss. This temporal awareness enables the framework to serve not just as a real-time indicator but as a long-range early warning system for asset deterioration and life-cycle optimization.
Together, these principles form the conceptual backbone of the KPI framework. By embedding both expert knowledge and operator insight into the design process, the system is better equipped to address the unique demands of real-world maritime operations—where variability, complexity, and safety-critical conditions are the norm.
3. KPI Framework Overview
Building upon the principles established in Section 2, this section presents a robust and extensible framework for Key Performance Indicators (KPIs) that serves as the operational backbone of AI-assisted ship performance management. The framework has been designed not only to support real-time operational diagnostics and decision-making but also to offer methodological transparency and reproducibility, facilitating future adoption by researchers, naval architects, and system integrators.
The framework is initiated through a systematic data acquisition process, whereby operational data are gathered from multiple onboard sensors that capture information relevant to the key performance indicators (KPI) and to the vessel’s operational state. The data are subsequently stored in a centralized database for preprocessing and training. Our framework introduces machine learning-driven KPIs (m-KPIs), which leverage data-driven models to provide enhanced insights. Upon completion of the model training phase, the system transitions to real-time monitoring, wherein incoming data are processed for the vessel condition assessment. The resulting m-KPIs are interpreted through predefined threshold ranges, delivering actionable insights that are accessible even to non-specialist users. Furthermore, a linear projection technique is employed to enable the short-term forecasting of KPI trends, supporting anticipatory decision-making. An overview is shown in the figure below (Figure 1).
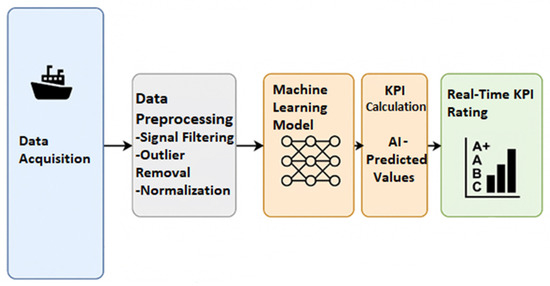
Figure 1.
An overview of the framework.
We note that the framework is independent of vessel type, as it relies on sensor data that is uniformly collected across different ships regardless of category. This uniformity in data acquisition allows the framework to be adaptable and scalable to various vessel types, including tankers, Ro-Ro ships, and high-speed vessels. Since the methodology focuses on analyzing the operational parameters derived from sensor inputs rather than vessel-specific characteristics, it can be effectively applied across a wide range of maritime platforms.
3.1. Data Collection
The foundation of the proposed framework lies in the structured acquisition of high-frequency operational and condition-monitoring data from onboard systems. Data collection encompasses condition data (e.g., fuel consumption, engine load, scavenge air pressure, vibration, emissions), operational data (e.g., speed over ground, payload), and environmental data (e.g., wind direction, wave height). Given the inherent characteristics of Artificial Neural Networks (ANNs) and the complexity of shipboard systems, there is no strictly defined or optimal number and type of sensors required. In general, increasing the number of relevant sensors tends to improve model accuracy; however, it is essential to avoid collecting redundant data or incorporating measurements that are clearly irrelevant to the target KPIs.
While various methods exist to address the discrepancies in sensor sampling rates, it is generally recommended—for ease of implementation—that all sensors operate with a common temporal resolution. Uniform sampling allows for straightforward integration into Deep Neural Networks (DNNs). In cases where resolutions differ, additional preprocessing steps or the use of more complex model architectures may be required to ensure compatibility.
In addition to sensor-derived data, event-based information (e.g., maintenance logs, system faults, alarms) is essential to the proposed framework. These event data help delineate the model’s training window, enabling the algorithm to adapt to the specific operational history and critical incidents of each vessel, which have a significant impact on performance.
3.2. Data Preperation
Data preparation is a critical step in creating reliable and accurate machine learning models. It ensures that the raw data collected from various shipboard systems are refined and transformed into a form suitable for training machine learning models and generating KPIs. This subsection describes the data preparation pipeline employed in the system.
The pipeline starts with primary feature removal. Three types of features are removed in this step. Firstly, features that are obviously irrelevant to the KPIs and add useless complexity to the whole process are removed from the initial dataset. Also, features that measure the exact same physical quantity add useless complexity are removed.
Finally, the third category of features that must be eliminated comprises those exhibiting a strong correlation with the target variable but lacking a causal path through the component of interest. Such features often demonstrate an almost perfect correlation with the target; however, they are removed because our goal is to model the behavior of a specific component and how its performance varies with respect to certain inputs, rather than merely predicting the target value. If these non-causal yet highly correlated features were retained, the model could accurately predict the target even if the corresponding KPI component were malfunctioning. A clear example of this issue can be illustrated as follows: suppose we aim to estimate the propeller’s rotational speed to assess its performance—using the shaft’s Revolutions Per Minute (RPM) as an input feature would be inappropriate.
The next step involves essential data preparation techniques, as is standard in all machine learning workflows. By the end of this process, the data must be in a usable form—free of missing values and, preferably, normalized. Before reaching their final structure, the dataset should be cleansed of outliers and erroneous measurements. Any transformations applied to the training data must also be consistently applied to the real-time execution data to ensure coherence and model reliability.
3.3. Artificial Neural Network
ANNs constitute a class of machine learning models inspired by the architecture and function of the human brain. They are particularly effective in capturing complex, non-linear relationships within high-dimensional data. ANNs consist of interconnected layers of nodes (neurons), where each neuron applies a transformation to its inputs and propagates the results forward through the network. Through iterative training processes such as backpropagation, the network adjusts its internal parameters to minimize prediction errors; in this way, the system does not require expert intervention, relying solely on the availability of sufficient and representative data. The flexibility and adaptability of neural networks make them ideal for modeling dynamic and multi-variable systems, such as those found in maritime applications, where traditional rule-based methods often fall short. In the context of ship performance monitoring, and provided that the data structure allows it, the use of DNNs is recommended, as these models can identify all possible relationships between input and output data. Figure 2 below illustrates the architecture of a typical DNN.

Figure 2.
Architecture of DNN.
To properly integrate the model into the KPI framework, an initial training phase must be implemented. The objective of this phase is for the model to learn and approximate the behavior of the specific component whose performance is being evaluated. The training dataset must be representative of the component’s operational conditions. This requirement highlights a key advantage of m-KPIs: their ability to adapt to each individual vessel, including its historical profile. If the training data reflect a period following a significant event—such as maintenance or a system failure—then the model will capture the post-event operational state of the component. This stands in contrast with traditional KPI systems, which typically benchmark performance against the vessel’s condition when it was new, often disregarding degradation or adaptive behavior over time.
Moreover, traditional KPIs are typically constrained to ideal operating conditions—such as low sea state and specific speed ranges—defined by the vessel manufacturer. In contrast, m-KPIs offer the flexibility to incorporate data from a wide range of real-world operating scenarios during the training phase. This enables the model to account for the full spectrum of conditions that a vessel may encounter throughout its operational profile. As a result, m-KPIs are not only applicable across a broader set of contexts, but they also possess the ability to detect performance degradations that manifest only under extreme conditions. This enhances their diagnostic precision and practical utility in continuous performance monitoring.
Before the training process is finalized, the m-KPIs must be evaluated using appropriate performance metrics to ensure their reliability and suitability for deployment. Upon completion of the training process, the resulting model will have learned to approximate the performance behavior of the specific component and will be capable of estimating its output under varying operational conditions, based on the patterns captured from the training data.
In the subsequent phase, the trained model is supplied with real-time data collected during the vessel’s operation. These incoming data are subjected to the same preprocessing pipeline as applied during the training phase, ensuring consistency. The model’s output represents the expected performance of the component or system, assuming conditions similar to those observed during training. If a significant deviation is observed between the model’s predicted output and the actual measured value, this discrepancy may indicate the presence of a fault or degradation that is negatively impacting the vessel’s performance.
3.4. KPI Domains
To support comprehensive performance oversight, the framework categorizes KPIs into four principal domains:
- Energy Efficiency
- Hull and Propeller Condition
- Engine and Mechanical Health
- Environmental Performance (e.g., GHG emissions, vibration, noise)
Within each domain, ML-KPIs are recalibrated dynamically using models that learn from each vessel’s specific operating profile, age, and maintenance history. These models ensure that the KPI predictions reflect individualized baselines rather than generic fleet averages, making performance deviations more contextually meaningful. Table 1 summarizes the representative KPIs and their roles within each domain.

Table 1.
KPI Domains and Their Application.
Of course, due to its scalability, the framework is not restricted solely to these domains; it can be extended to other sectors as well, by defining corresponding ML-based KPIs, as will be demonstrated in the following sections.
3.5. ML-Based KPI Definition
This section presents the ML-KPI framework, designed to support real-time ship performance monitoring and diagnostic evaluation. The framework is built upon the foundational methodology introduced by Themelis et al. [26] for establishing target feature values, now significantly enhanced through the integration of a deep learning-based prediction model.
The primary performance indicator is the percentage deviation between the measured and predicted values, providing an intuitive and normalized metric for real-time assessment. This is expressed as:
where this deviation-based approach enables the system to dynamically evaluate operational efficiency and detect anomalies or underperformances relative to the machine-learned expectations. A detailed definition and explanation of each ML-KPI follows in the subsequent sections.
Deviation = (Mean Measured − Mean Predicted)/(Mean Measured) × 100%
3.5.1. m-K1—Vessel Performance
A key aspect captured by this indicator is the vessel’s fuel efficiency, specifically the performance of distance traveled relative to fuel oil consumption by the main engine. Since the two target features are linearly correlated, it is deemed redundant to use this KPI for both; therefore, it is applied solely to monitor vessel performance. As described in [1], this vessel performance indicator, K1—Vessel Performance, is defined as the percentage deviation between the measured and expected distance traveled per 1 ton of fuel oil consumed:
where d/FOCm represents the measured distance per unit of fuel oil consumed and d/FOCp represents the expected distance per unit of fuel oil consumed.
m-K1 = (d/FOCm − d/FOCp)/(d/FOCm) × 100%
In this regard, a modified indicator is introduced, utilizing the deep learning model-predicted values of the distance traveled per 1 ton of fuel oil consumed and the measured values acquired from the monitoring systems on board as follows:
modified-K1 (m-K1), which is defined as the % difference between the measured and the predicted distance traveled per 1 ton of fuel oil consumed:
where d/FOCp represents the predicted distance per unit of fuel oil consumed.
m-K1 = (d/FOCm − d/FOCp)/(d/FOCm) × 100%
This form of deviation aids in measuring the difference between the actual observations and the model’s predictions, offering valuable insights into the model’s effectiveness and dependability.
3.5.2. m-K2—Vessel Efficiency
To assess the efficiency of the vessel’s hull and propeller, we use the K2—Vessel Efficiency indicator. This KPI is defined as the percentage deviation between the measured and expected distance traveled per unit of power delivered by the main engine for one hour.
It provides insight into the vessel’s performance in terms of distance per unit of power used:
where d represents the distance traveled, and P is the power delivered by the main engine.
K2 = d/P (m/kWh),
Reference values for this KPI are established based on data obtained from sea trials, allowing for consistent performance evaluation. This indicator specifically reflects the condition of the hull and propeller, helping to monitor and optimize vessel efficiency.
In this regard, a modified indicator is introduced, utilizing the deep learning model-predicted values of the distance per unit of power used and the measured values acquired from the monitoring systems on board as follows:
modified-K2 (m-K2), which is defined as the % difference between the measured and the predicted distance per unit of power delivered by the main engine for one hour:
where the predicted power Pp refers to the predicted values of the power that stemmed from the neural networks.
m-K2 = (d/Pm − d/Pp)/(d/Pm) × 100%
3.5.3. m-K3—Main Engine Performance and Conditions
A crucial aspect attempted to be captured by this indicator is the performance related to the degradation of the main engine. Since the two target features are linearly correlated it is redundant to use the KPI defined below to screen both, hence it is selected to be used only for the power generated by the main engine. In [7], the authors described a vessel condition performance indicator based on the ISO (International Organization for Standardization) 19030 [27] procedure as follows:
K3—Vessel Condition, which is defined as the % difference between the measured and the expected power for a specific ship’s speed:
where the expected power Pe is read from a speed-power reference curve (obtained from sea trials). Pm are measures by the CMS values.
K3 = (Pm − Pe)/Pm × 100%
In this regard, a modified indicator is introduced, utilizing the deep learning model- estimated values of power and the measured values acquired from the monitoring systems on board as follows:
modified-K3 (m-K3), which is defined as the % difference between the measured and the predicted power for a specific ship’s speed:
where the predicted power Ppr refers to the predicted values of the power that stem from the neural networks at the measured speed through water (Vm) and at the measured displacement and trim. The performance indicator is calculated according to the ISO 19030 procedure [27] in terms of filtering for reference conditions. This KPI targets energy efficiency and well-functioning ship behaviors would be expressed by the m-K3 with a value close to 0.
m-K3 = (Pm − Ppr)/Ppr × 100%
3.5.4. m-K4—Vessel Condition
K4—Main Engine performance and conditions is defined as the % deviation between the measured and expected Specific Fuel Oil Consumption (SFOC):
where SFOC is the amount of fuel consumed per unit of power produced per hour and is expressed in grams per kilowatt-hour (g/kWh). The expected SFOC and SFOCe, is read from the SFOC curve obtained from shop tests at the measured power load and is applied for the monitoring of the main engine’s degradation by checking whether the engine is consuming fuel oil correctly as per power load.
K4 = (SFOCm − SFOCe)/SFOCm × 100%
In this regard, a modified indicator is introduced, utilizing the predicted values generated by the deep learning models and the measured values acquired from the monitoring systems on board as follows:
modified-K4 (m-K4), which is defined as the % difference between the measured and the predicted SFOC:
where and denote the actual and the predicted SFOC based on the ML model, respectively. The degradation of the main engine leads to a substantial increase in the value of K4, while the well-functioning ship behavior can be expressed with a value of 0. The advantages of using an ML model for calculating the K4 metric over traditional estimations from shop tests are as follows:
m-K4 = (SFOCm − SFOCp)/SFOCm × 100%,
Firstly, ML models can capture non-linear relationships in the data, providing a more accurate prediction of the SFOC. This enhanced accuracy stems from the ML model’s ability to learn complex patterns and interactions within the dataset, which traditional methods may fail to recognize.
Secondly, ML models require less filtering during data preparation, streamlining the process and reducing potential data loss. The reduced need for extensive data preprocessing ensures that more data can be utilized, improving the model’s robustness and reliability.
Thirdly, using ML models avoids the need for extrapolation, which can introduce inaccuracies, when the estimations are based on shop tests. Unlike traditional methods that often rely on extrapolations from limited data points, ML models can interpolate within the dataset more effectively, ensuring that predictions remain consistent and accurate across different operating conditions.
Lastly, ML models can continuously improve over time as more data becomes available, leading to progressively better performance and adaptability to changing conditions. This dynamic learning capability is a significant advantage over static shop test estimations, which do not evolve once they are established.
3.5.5. m-K5—D/G Performance and Condition
To monitor the performance and condition of the diesel generators (D/G), we use the K5—D/G Performance and Condition indicator. This KPI is defined as the percentage deviation between the measured and expected power output per unit of fuel oil consumed over one hour. It provides an insight into the fuel efficiency of the diesel generators:
where (P/FO))m is the measured power output per unit of fuel oil consumed, and (P/FO))e is the expected power output per unit of fuel oil consumed.
K5 = ((P/FO)m − (P/FO)e)/(P/FO)m × 100%
This indicator helps in assessing the operational efficiency of the diesel generators by evaluating deviations in power output per fuel unit, which can highlight areas for maintenance or optimization.
A modified indicator is introduced, utilizing the deep learning model-estimated values of the power output and the measured values acquired from the monitoring systems on board as follows:
modified-K6 (m-K5), which is defined as the % difference between the measured and the predicted power output per unit of fuel oil consumed:
where (P/FO)p is the predicted measurement of power output per unit of fuel oil consumed in the ML model.
m-K5 = ((P/FO)m − (P/FO)p)/(P/FO)m × 100%
3.5.6. m-K6—T/C Performance
This indicator monitors the condition of the turbocharger (T/C) by evaluating the scavenge air pressure, an important aspect of engine performance. This indicator, K6—T/C Performance, is defined as the deviation between the measured scavenge air pressure (Pscav,m) and the expected scavenge air pressure (Psc,e), both measured at the same engine load.
K6 = (Pscm − Psce)/(Pscm) × 100%
The expected values are derived from a reference curve obtained during shop tests. This KPI provides insight into the condition of the turbocharger, allowing for effective monitoring and maintenance.
A modified indicator is introduced, utilizing the deep learning model-estimated values of the power and the measured values acquired from the monitoring systems on board as follows:
modified-K6 (m-K6), which is defined as the % difference between the measured and the predicted scavenge air pressure for a specific ship’s speed:
m-K6 = (Pscm − Pscp)/(Pscm) × 100%
The prediction of scavenge air pressure for a ship is achieved through the application of ANNs. As already noted above, ML estimators are constantly improved over time, in comparison to the K6 KPI.
3.6. KPI Assessment and Adaptability
The framework’s modular design enables continuous adaptation to new insights and technological developments. KPI computation is unified under consistent deviation-based logic, simplifying benchmarking and enabling clear, cross-domain comparisons. As operational complexity increases, the inclusion of more nuanced or mission-specific KPIs is supported through dynamic model retraining and expert feedback loops.
The integration of AI agents allows the system to move beyond threshold-based alerts toward anticipatory diagnostics—identifying degradation trends and inefficiencies before they impact operations.
3.7. KPI Ranking Methodology
To convert the raw KPI outputs into actionable and interpretable insights, the proposed framework incorporates a structured ranking methodology based on deviation classification and domain-specific thresholds. KPI deviations from nominal behavior are mapped onto qualitative performance categories (ranging from A++ to D), enabling rapid assessment and operational relevance. These categories are defined through a combination of domain knowledge, expert elicitation, and empirical analysis of historical data. The resulting classification provides a human-centered layer of interpretation, allowing even non-specialist users to understand the operational implications of complex AI-driven assessments.
Performance classes are tailored to the nature of each KPI and benchmarked to the vessel’s design parameters and historical performance envelope. For instance, the energy efficiency KPIs are associated with tighter deviation thresholds due to their direct impact on fuel consumption and emissions, whereas mechanical indicators, such as vibration, tolerate broader variance due to their different risk and optimization profiles. Environmental KPIs are aligned with international regulatory frameworks, such as IMO’s EEXI and CII standards, ensuring compliance-driven benchmarking. These context-aware thresholds are integrated into the vessel’s Digital Twin interface and serve as a foundation for decision supporting maintenance prioritization, crew guidance, and mission planning. Ultimately, this approach bridges the gap between technical evaluation and operational usability, providing a scalable and extensible methodology for intelligent vessel management throughout its lifecycle. Table 2 presents the standardized scoring ranges.
Table 2.
Ranking table for KPIs. Ranks can be associated with colors to enable instant readability by humans.
3.8. KPI Forecasting and Human-Centric Interpretation
Our framework incorporates a lightweight methodology for forecasting future KPI values, thereby supporting more informed decision-making. By analyzing historical KPI trends, the system estimates the rate of degradation over time. For the sake of simplicity, a constant degradation rate is assumed, allowing for the use of linear interpolation to project KPI evolution into future time horizons. These projections can then be translated into metrics that are easily interpretable by non-specialist personnel. For example, a KPI related to fuel consumption can be directly expressed as a monetary value, enabling the end-user to understand the financial impact of maintenance deferral or operational inefficiencies. In this way, the framework transforms large volumes of raw sensor data into actionable information that remains accessible even to personnel without technical expertise.
The following section explores how these insights are operationalized within broader decision support systems for proactive mission planning and lifecycle optimization.
4. Use Case and Comparison with Traditional KPI
This chapter presents a representative use case of the proposed framework, specifically focusing on its application to the m-K1 indicator. m-K1 serves as a fuel efficiency KPI, designed to estimate engine performance in terms of the distance traveled per unit of fuel consumed. In addition to the implementation of m-K1 within the framework, a comparative analysis will be conducted against its traditional KPI counterpart. The evaluation aims to highlight the enhanced precision and operational relevance of the machine learning-based approach. Supporting visualizations will be included to illustrate the improved accuracy of m-KPI, offering a clear demonstration of its ability to capture real-world performance fluctuations and subtle degradations that conventional methods may overlook.
To ensure the robust validation of the machine learning-powered KPI framework, a comprehensive dataset was employed, collected over 18 months from a modern bulk carrier operating under real-world commercial conditions. The vessel was newly commissioned at the start of the monitoring campaign, enabling the study of progressive performance evolution and system degradation. Throughout this period, routine operations were complemented by two scheduled maintenance events—specifically, hull and propeller cleanings—which provide natural benchmarks for evaluating performance shifts captured by the framework. Table 3 summarizes the vessel’s specifications.
Table 3.
Vessel Technical Specifications.
4.1. Use Case Data Acquisition
To support resilient and high-resolution data acquisition for real-time performance modeling, a hybrid sensor network architecture was deployed aboard the vessel. This architecture integrates both wired and wireless subsystems, including engine control units, Global Positioning System/Automatic Identification System (GPS/AIS) trackers, environmental sensors, power analyzers, and auxiliary subsystem monitors. Communication is enabled via maritime-grade protocols—such as Modbus, Controller Area Network (CAN), and IEEE 802.15.4-based mesh networking—ensuring secure and low-latency data transfers between smart collectors and the central data gateway. In specific configurations, high-frequency analyzers and dedicated collectors are used to capture transient signals and power quality metrics. Data from onboard systems are acquired at one-minute intervals and transmitted via the Transmission Control Protocol/Internet Protocol (TCP/IP) or Ethernet to centralized storage environments, including cloud infrastructure. The proposed architecture facilitates efficient data collection and fusion, minimizing computational demands on the onboard server. Combined with the lightweight nature of the trained models, this design allows the system to operate on low-cost, compact computing platforms (e.g., Intel NUC). A device equipped with more than 8 GB of Random Access Memory (RAM) is sufficient to support the data acquisition and processing requirements of the framework.
All sensor data streams are timestamped and geo-referenced using a unified clock and message broker, allowing for an accurate spatial–temporal correlation and consistent data fusion across the subsystems. The data are logged in a versioned, queryable database supporting both historical analysis and real-time inference pipelines. Key operational parameters—including torque, flow rate, pressure, and wind speed—are measured using precision-grade instruments such as torque meters, pressure transducers, anemometers, and gyroscopic compasses. These diverse inputs contextualize ship performance under various voyage profiles, weather conditions, and loading states, forming the foundational dataset for machine learning model training, evaluation, and real-time inference.
Table 4 provides an overview of the core signals collected from each vessel subsystem, the associated sensors, and their role within the KPI framework, while Table 5 provides a detailed overview of the collected parameters and their associated measurement sources.
Table 4.
Reference Signals and Data Collection Points.
Table 5.
Monitored Parameters and Measurement Sources.
4.2. Use Case Data Preparation
Data preparation is a critical step in creating reliable and accurate machine learning models. It ensures that the raw data collected from various shipboard systems are refined and transformed into a form suitable for training machine learning models and generating KPIs. This subsection describes the data preparation pipeline employed in the system. For the implementation of the pipeline, we consulted the guidelines of the ISO 19030, without being strictly limited to them. The selection of techniques presented is indicative; however, as with nearly all machine learning applications, some form of preprocessing is required in order to produce meaningful and reliable results.
The pipeline starts with primary feature removal. In this step, features are removed from the initial dataset that are obviously irrelevant to the KPIs and add useless complexity to the whole process. Also, features that are highly correlated with the target but do not depend on the component being assessed are removed (e.g., speed over ground as a target and speed through water as a feature). Finaly, features that measure the exact same physical quantity add useless complexity and thus are removed.
Then we move on by handling missing values, a common challenge in real-world datasets. To maintain data continuity and avoid misleading model predictions—such as those caused by zero speed entries—missing values are imputed using the distribution and temporal patterns of each feature. After this, the process moves on to outlier detection and removal. Outliers, which are extreme values that fall far outside the typical range, can negatively impact model performance. To identify them, the Interquartile Range (IQR) method is used. This involves calculating the 25th (Q1) and 75th (Q3) percentiles for each feature to determine the IQR. Any value below Q1 minus 1.5 times the IQR or above Q3 plus 1.5 times the IQR is flagged as an outlier. Rows containing at least one such value are removed, resulting in a cleaned dataset composed only of valid, in-range entries. The IQR is defined by the following equation:
IQR = Q3 − Q1.
Next, data smoothing is applied to reduce noise and enhance signal patterns. A Simple Moving Average (SMA) algorithm is used, which computes the unweighted average of the last n samples. This technique helps filter out high-frequency noise while preserving the underlying trends and fluctuations relevant to the KPI calculations. The SMA is defined as:
where n is the window size and xi represents the data points in the window. By smoothing the data, the system increases the Signal-to-Noise Ratio (SNR), which aids in more accurate KPI predictions.
SMA = 1/n ∑xi,
Finally, feature selection is performed to identify the most relevant features for model training. A random forest regressor is used to assess the importance of each feature relative to the target KPI. Features with importance scores below a specified threshold are discarded, ensuring that only the most predictive variables are included in the model. This step minimizes dimensionality and enhances the model’s efficiency and performance.
Figure 3 illustrates the overall flow of the data preparation pipeline, from the initial data collection to the final feature selection phase, ensuring that only high-quality data is used for training and real-time inference.
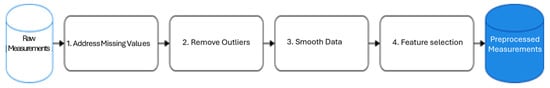
Figure 3.
Flowchart of the data preparation pipeline used to train the ANNs.
4.3. Artificial Neural Networks
This section outlines the methodology for employing ANNs—specifically DNNs—to estimate a Key Performance Indicator (KPI) related to the main engine’s operational efficiency. ANNs are well-suited to capture non-linear and high-dimensional relationships between input features and target variables. The network structure comprises an input layer (representing predictor variables), one or more hidden layers that extract latent patterns, and an output layer that returns the predicted KPI value (a single continuous output in this case).
To validate the robustness of the proposed framework, we implemented and compared two model configurations: one using manually tuned hyperparameters and another optimized through automated tuning using the Hyperband algorithm, with all implementations carried out using the Keras library:
- Manual Hyperparameter Tuning
The manually tuned model leverages multiple linear regression as a baseline and a neural network architecture built with Keras and a TensorFlow backend for regression tasks. The network consists of three fully connected (dense) layers with 128, 64, and 32 neurons, respectively, each employing the Rectified Linear Unit (ReLU) activation function to introduce non-linearity. Dropout layers are interleaved to mitigate overfitting. The output layer consists of a single neuron with a linear activation function, appropriate for continuous regression output.
The model is compiled using the Adam optimizer [28] with its default settings and the mean squared error (MSE) loss function. A learning rate scheduler is incorporated to reduce the learning rate by a factor of 0.5 if the validation loss stagnates over 10 consecutive epochs, with a lower bound set at 10−6.
- Automated Tuning with Hyperband
To enhance model performance through automated hyperparameter optimization, we employed the Hyperband algorithm [29]. The tuning process explored various architectural and training parameters, including the number of neurons in the first and second hidden layers (64, 96, 128), activation functions (ReLU, Tanh, Sigmoid, ELU), and dropout rates (0.2–0.5). The learning rate for the Adam optimizer was sampled logarithmically within the range [10−4, 10−2], enabling both coarse and fine-grained exploration (e.g., 2 × 10⁻⁴, 3 × 10⁻⁴, 4 × 10⁻⁴ etc.). The Keras Tuner library systematically evaluated combinations of these hyperparameters to identify the model configuration that minimized validation loss.
4.4. Training Phase
The initial phase is dedicated to assessing the predictive accuracy of the model, ensuring its configuration is appropriate before advancing to more extensive evaluation stages. The dataset is partitioned into two subsets, with 70% used for training and the remaining 30% reserved for validation. Both models were trained for 100 epochs with a batch size of 32. Figure 4 shows the learning curves of the first model. The training process lasted less than 10 min on a standard desktop computer, indicating that training time is not a significant obstacle.
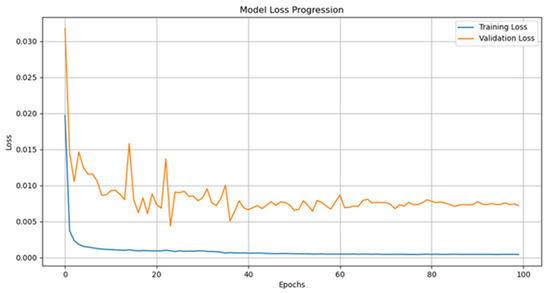
Figure 4.
Learning curves for the first (manually tuned model). Even though the loss does not significantly decrease beyond 40 epochs, the learning rate is reduced when no progress in training is observed. This strategy helps mitigate the negative effects of extensive training.
4.5. Validation Phase
In this phase, the trained model is applied to the curated validation set to compute regression performance metrics, including the Mean Absolute Error (MAE), Mean Squared Error (MSE), Root Mean Squared Error (RMSE), and Coefficient of Determination (R2 score). These metrics are benchmarked against predefined acceptance thresholds to determine whether the model satisfies the required performance standards and is suitable for operational deployment.
4.6. Monitoring Phase
This phase focuses on evaluating the model’s long-term consistency and robustness by monitoring the KPI behavior over an extended operational horizon, typically between three and six months. It plays a critical role in assessing the model’s reliability under real-world conditions and in detecting potential performance drift, gradual degradation, or shifts in the system dynamics that may impact predictive accuracy. The whole workflow can be seen in Figure 5.

Figure 5.
Validation Workflow.
4.7. Cores of the KPI Validation
The validation approach is structured around three core dimensions: accuracy, consistency, and robustness. These are evaluated using real-world operational data gathered across a variety of sailing conditions.
4.7.1. Evaluation on m-K1 and m-K2
Among the full suite of developed indicators, two have been selected for a detailed presentation of the validation approach: m-K1, which captures the overall vessel performance through fuel efficiency estimation, and m-K3, which measures main engine power deviation as an indicator of mechanical health. These two KPIs were chosen not only for their central roles in vessel monitoring but also for their capacity to reflect critical operational domains—namely energy efficiency and propulsion system reliability. Validation involves comparing the machine learning-generated KPI predictions against both measured values and classical performance benchmarks, with statistical and regression-based analyses used to evaluate predictive accuracy and signal stability. Different parts of the approach are focused on the presentation of KPI validation in each one of the cases in order not to have identical figures and presentations. A table summarizing the final outcome of the validation for all KPIs is provided at the end of the section.
4.7.2. m-K1 Validation: Vessel Performance Deviation
The m-K1 metric quantifies the deviation between the predicted and measured fuel efficiencies, expressed as the distance traveled per unit of fuel consumed. Table 6 summarizes the comparative descriptive statistics between the ML-based m-K1 and the classical K1 indicator.
Table 6.
Descriptive Statistics for K1 and m-K1 Indicators.
The ML-based indicator exhibits a substantially lower mean deviation and variance, reflecting improved accuracy and stability. A paired t-test confirms the statistical significance of this improvement (p < 0.01), indicating that m-K1 more closely tracks actual vessel performance.
Figure 6 illustrates the relationship between the measured and predicted fuel consumption values. The coefficient of determination (R2) is 0.99, with a near-perfect regression slope (y = 0.9917x + 0.0170), confirming the model’s predictive strength. The error metrics also support these findings (MAE = 0.40, RMSE = 0.73).
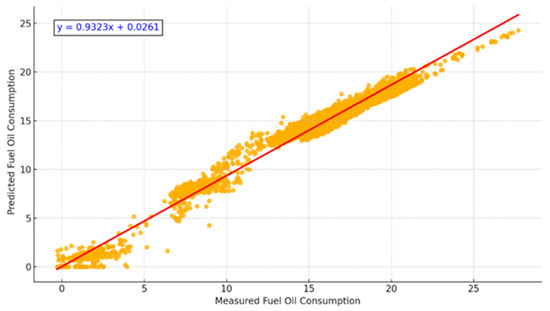
Figure 6.
Scatterplot of Measured vs. Predicted Fuel Consumption. A near-linear correlation demonstrates high prediction accuracy (R2 = 0.99).
To benchmark against conventional practices, Figure 7 compares the measured fuel consumption values to reference sea trial data. While both comparisons are positively correlated, the ML-based predictions align more closely with actual measurements, underscoring the limitations of static trial curves under operational variability.
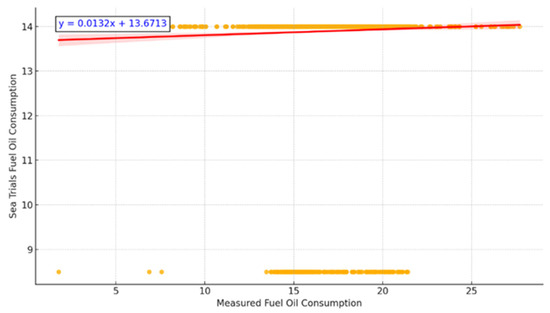
Figure 7.
Measured Fuel Consumption vs. Sea Trials.
4.7.3. Hypertuned m-K1 Model
A refined version of the m-K1 model was developed using the Hyperband algorithm for hyperparameter optimization in Keras. Parameters including the neuron count, dropout rate, learning rate, and activation functions were systematically tuned.
The optimized model achieved superior performance metrics: R2 = 0.994, MAE = 0.264, RMSE = 0.588, Regression Line: y = 1.0052x − 0.1148. These improvements are illustrated in Figure 8, which shows the regression and residuals plots for the hypertuned model.

Figure 8.
Regression and Residuals of Hypertuned m-K1. (a) Regression line closely aligns with identity; (b) Residuals show no significant bias. The red lines represent the points where the predicted values are equal to the actual ones.
Table 7 compares the descriptive statistics of m-K1 across the original and hypertuned models.
Table 7.
m-K1 Indicator Across Model Versions.
Notably, the hypertuned model achieves a mean deviation closer to zero and retains a low variance, highlighting its robustness across operating conditions. Furthermore, we studied the absolute values of the residuals, which show the magnitude of the deviations from the measured values. Figure 9 shows that the empirical distribution of the residuals is stochastically dominated by the distribution of the half-normal variable; that is, letting F(x) and G(x) denote the cumulative distribution function of the empirical distribution and half-normal distribution, respectively, we may see that G(x) ≤ F(x). The main implication of this fact is that the probability of the large residual (in magnitude) is exponentially small; in particular, letting X denote the amplitude of a residual, we deduce that for each t > 2/√π:
given that the half-normal distribution has the location parameter 0 and scale √2. This fact adds confidence to the strength and prediction capabilities of our hypertuned model; the probabilities of large deviations are really small. For example, the probability that the magnitude of a residual is larger than 3 is at most approximately 10.5%.
P(X > t) ≤ 2 exp(−t2/2),

Figure 9.
Plot of empirical cumulative density functions of absolute residuals and of half-normal distribution.
4.7.4. m-K3 Validation: Main Engine Power Deviation
The m-K3 indicator measures the deviation between the actual and predicted power output at a given vessel speed and load. Table 8 presents a comparative statistical analysis between classical K3 and the ML-based m-K3.
Table 8.
Descriptive Statistics for K3 and m-K3 Indicators.
We deduce from the table above that m-K3 is better centered around zero, with a lower variability and a more stable distribution. Figure 10 and Figure 11 illustrate the regression and residual plots, respectively.

Figure 10.
Measured vs. Predicted Power Output (m-K3). Strong correlation with R2 = 0.99 confirms model accuracy. The red line represents the points where the predicted values are equal to the actual ones.
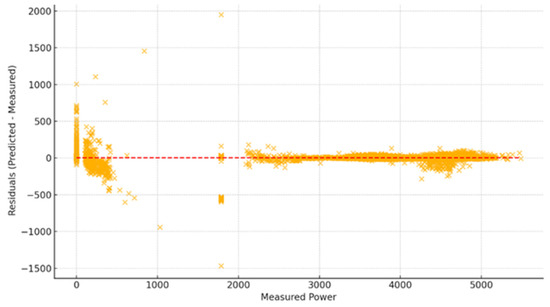
Figure 11.
Residual Plot of m-K3 Predictions. Minimal, randomly distributed residuals suggest no model bias. The red dotted line represents the points where the predicted values are equal to the actual ones.
Further, the distributional characteristics of the two KPIs were visualized using side-by-side histograms. Figure 12 reveals a distinct contrast between the two indices: m-K3 is narrowly concentrated around zero, with a clean and symmetric shape, while Classic K3 exhibits a much broader distribution, skewed negatively and with prominent outliers. This highlights a key strength of the m-K3 formulation—its ability to remain statistically stable and bounded, ideal for use as a deviation-based performance metric. The erratic shape of Classic K3, by comparison, reflects a higher sensitivity to noise or inconsistencies in underlying assumptions, limiting its effectiveness for reliable performance tracking.
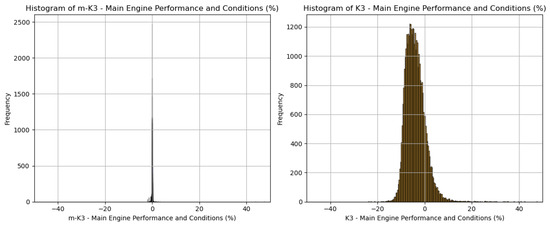
Figure 12.
Histogram comparison. Distribution analysis further supports m-K3’s stability.
Table 9 illustrates the descriptive statistics deduced from our analysis. The comparison between the classic KPIs (K*) and machine learning-enhanced KPIs (m-K*) reveals notable improvements in stability and consistency achieved through machine learning. In particular, m-K2 and m-K5 demonstrate significant reductions in both their mean deviation and standard deviation compared to their classic counterparts. For example, the mean of K2 drops from 29.04 to 1.61, and its standard deviation decreases from 13.60 to 1.70, indicating that the machine learning model effectively corrected a strong bias and reduced variability. Similarly, K5, which originally had a standard deviation of 15.90 and a wide range, became much more stable in m-K5 with a standard deviation of only 3.15. While the improvements for K4 and K6 are more subtle, the overall trend suggests that machine learning-based KPI adjustments can lead to more reliable and interpretable performance indicators in comparison with traditional methods.
Table 9.
Representative descriptive statistics of m-K2, m-K4, m-K5, and m-K6, along the classical indices.
4.8. KPI Validation Overview
KPI validation for ML ensures that the performance metrics chosen to evaluate a model are both meaningful and aligned with business objectives. It involves assessing how well the model performs using key indicators such as MAE and RMSE, based on a validation dataset. The goal is to verify that these KPIs effectively reflect the model’s true performance, generalizability, and ability to solve the intended problem. This process also helps identify potential issues such as overfitting, bias, or data drift, ensuring that the model provides reliable and actionable insights in real-world applications.
The results demonstrate that the ML-powered indicators consistently outperform traditional approaches. The m-KPIs yield significantly lower prediction errors and exhibit greater stability in their output profiles. Their regression models achieve high coefficients of determination and well-distributed residuals, indicating both a strong model fit and reliable generalization. These characteristics position the m-KPIs as robust, data-driven tools capable of supporting real-time performance assessments across varying operational conditions. Their adaptability and precision make them particularly relevant for modern maritime operations, where dynamic decision-making and regulatory compliance depend on continuous, high-fidelity monitoring. While this section focuses on m-K1 and m-K3 as representative indicators, the remaining KPIs follow the same validation methodology and exhibit similarly consistent performances.
5. Evaluation of KPI Scoring Impact
While the statistical validation of the m-KPIs in Section 4 demonstrates their accuracy and stability, their practical value lies in how effectively they influence real-world decisions. In this section, we evaluate the operational and environmental impact of dynamic KPI scoring using data derived from a 2-month deployment on a bulk carrier. By linking the m-KPI outputs to maintenance decisions, fuel use, and emissions, we assess their potential to enhance both economic and environmental performance at sea.
During the observation period, the vessel’s performance was continuously assessed using m-K1, the KPI associated with overall vessel performance. This metric estimates the deviation between the actual and predicted fuel economy, expressed as nautical miles per ton of fuel consumed. The scoring system, which classifies vessel condition from A++ (optimal) to D (critical), provided a clear and interpretable representation of performance evolution over time. Notably, the KPI trajectory exhibited a gradual decline over several weeks prior to both scheduled hull and propeller maintenance interventions. These observations validate m-K1’s ability to detect performance degradation linked to biofouling and hydrodynamic resistance. In Figure 13 below, we may see an indicative screenshot of the LAROS platform, developed by Prisma Electronics, with the impact scorings of Accident Detection, Performance, and Health Status.

Figure 13.
LAROS web application screenshot.
One particularly instructive period occurred in the three months leading up to the second maintenance event, during which the vessel’s m-K1 score declined from A to B. Despite predictive indicators suggesting an imminent efficiency downgrade, the operator elected not to accelerate the cleaning schedule due to port constraints and commercial priorities. This delay presented a valuable case study to quantify the opportunity cost of deferring actions in the presence of a credible early-warning signal.
Forecasting
In this section we present a concrete application of our approach to validation of our KPIs. We aim to advance the investigation by prognosticating the condition of a vessel’s main engine. This prognostication is accomplished by employing a linear regression model to the KPI values over a designated period, referred to as the hindcast period. The linear regression model can be extrapolated into the future, beyond a specified time point to ascertain the future values of the indicator, which is known as the forecast period. We have opted to employ a simple regression model as it can serve as an effective baseline model. Prior research has demonstrated that simple regression is a valuable tool for diagnosing the degradation of a vessel’s hull-propeller [7].
Using predictive trend extrapolation and fuel consumption logs (Figure 14), the deviation from optimal performance was estimated at an average of 9.8%. Over the course of 12 voyages during the degradation period, this translated into approximately 73.2 additional tons of fuel oil consumed beyond what would have been expected under optimal hull conditions. When converted using a standard carbon emission factor of 3.16 tons of CO2 per ton of marine fuel, this equates to an estimated increase of 231.4 metric tons of CO2 emissions attributable to deferred maintenance. Financially, this excess consumption corresponded to an additional operating expense of nearly USD 44,000, based on prevailing bunker fuel prices of USD 600 per ton at the time.
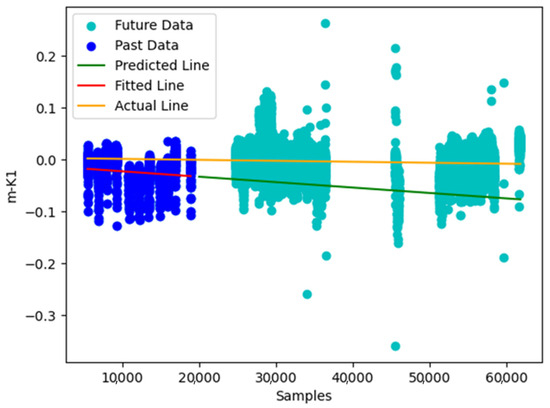
Figure 14.
Plot showing the KPI1 degradation; a linear regression model (red line) was fitted to the m-KPI values of the first voyage (blue dots). Estimation of the m-KPI values for the future (green line) can be made in contrast with the degradation (yellow line).
The operational and environmental cost of inaction is summarized in Table 10, highlighting the tangible benefits of responding to the KPI-based early warnings.
Table 10.
Quantified Impact of Deferred Maintenance Based on m-K1 KPI Scoring.
These findings underscore the broader significance of the proposed framework. The m-KPI scoring system is not merely a retrospective analysis tool; it provides actionable foresight that can materially impact fuel management, voyage planning, and compliance with environmental regulations. In the context of industry-wide sustainability goals and tightening emissions controls—such as the Carbon Intensity Indicator (CII) and the Energy Efficiency Existing Ship Index (EEXI)—tools that can detect, forecast, and quantify inefficiencies in real time are of critical importance.
Moreover, while this section focuses on m-K1 as a representative indicator, similar scoring-based diagnostics can be applied to other KPIs, including m-K3 (main engine performance) and m-K5 (diesel generator efficiency), extending the framework’s predictive capacity across multiple shipboard systems. The ability to detect mechanical wear, combustion anomalies, and fuel system inefficiencies through dynamic KPI scoring positions the framework as a holistic decision support tool.
Looking ahead, integration of these capabilities into fleet-level monitoring dashboards will enable operators to conduct system-wide performance benchmarking and coordinate proactive interventions across vessels. Coupling KPI trajectories with lifecycle cost models, predictive maintenance scheduling, and carbon accounting systems will further elevate the strategic value of the framework—supporting smarter, cleaner, and more cost-efficient maritime operations.
6. Discussion
In the current work we presented a machine learning-powered framework for real-time ship performance monitoring using dynamic ML-KPIs. The proposed approach represents a significant departure from traditional methods, which rely on static performance models or simple deviations from fixed thresholds. By incorporating machine learning techniques, we provide a system that continuously adapts and evolves based on operational data, providing real-time monitoring vessel efficiency, engine health, fuel consumption, and environmental performance. In addition, the proposed methodology includes mechanisms for translating numerical KPI outputs into interpretable insights, thereby facilitating informed decision-making by non-specialist users and enhancing the overall accessibility of the system’s diagnostic capabilities.
Advancements Over Traditional KPIs. The framework’s core strength lies in the integration of machine learning models—specifically, ANNs—to generate predictive baselines for each KPI. Unlike classical models that use pre-determined performance curves (e.g., sea trials), our system learns directly from historical and real-time operational data, allowing for better modeling of non-linear behaviors and dynamic maritime conditions. This shift enhances performance prediction accuracy and provides a more granular, vessel-specific understanding of operational trends. One of the main challenges faced by traditional KPIs is their inability to adapt to changing conditions such as fouling, degradation, or operational changes. For example, traditional indicators often fail to account for the variability in power consumption due to sea states, cargo load, or aging vessel components. Our machine learning-enhanced KPIs, on the other hand, continuously recalibrate based on real-time data, offering a much more robust and accurate depiction of ship performance under different conditions.
Real-Time Adaptability and Predictive Insights. Real-time KPI evaluation allows for the early detection of performance deviations, which is essential for proactive maintenance and optimization. By detecting performance issues early, such as reduced engine efficiency or increased fuel consumption, the system enables timely interventions, reducing the likelihood of breakdowns and improving vessel uptime. This is particularly critical in commercial shipping, where downtime due to mechanical failures can result in significant operational and financial losses. Moreover, the integration of real-time anomaly detection helps the crew make better-informed decisions on the operational status of the vessel. For instance, an increase in fuel consumption due to hull fouling can trigger a maintenance check before the issue becomes a larger problem. This predictive approach to performance management is a key advantage of the proposed system, as it shifts maritime operations from a reactive to a more proactive, data-driven approach.
Challenges in Deployment and Data Quality. Despite its promise, the deployment of such a system in real-world environments poses several challenges. The maritime environment is inherently harsh—sensor performance can degrade due to vibration, extreme temperatures, and exposure to saltwater, which affects the data quality. To mitigate these risks, we have employed data validation and redundancy techniques, which ensure that faulty or missing data are handled gracefully. Nevertheless, the system’s effectiveness depends heavily on the quality of the data being inputted. Future work will focus on enhancing sensor resilience and exploring robust data fusion techniques to further improve the system’s reliability. Another challenge lies in the scalability and flexibility of the framework. The system has been designed to be modular and scalable, allowing it to be deployed on a wide range of vessels, from small commercial ships to larger naval vessels. However, the customization of the system for different types of ships and operational profiles requires fine-tuning of the machine learning models and KPIs. Ensuring the system works across various vessel types with diverse operational and environmental conditions will be critical for broader adoption.
Broader Implications for Maritime Digitalization. The proposed framework is a step toward a fully digitalized maritime industry. As the industry increasingly adopts Industry 4.0 technologies, the integration of AI, IoT, and DT will transform operational management, enabling more efficient and sustainable operations. By providing real-time, interpretable performance metrics, this system supports regulatory compliance (e.g., IMO’s CII) and helps vessel operators meet stringent emission standards. In addition, the system contributes to the broader trend of maritime sustainability. By improving fuel efficiency and optimizing vessel operations, the framework supports efforts to reduce emissions, thereby aligning with global sustainability goals. Real-time monitoring can also facilitate more efficient routing and scheduling, further reducing the environmental impact of shipping operations.
Legal Considerations. The legal aspects of applying AI in the maritime sector are particularly important when it comes to decision-making. In this context, two main directions are typically considered: responsible AI, which ensures ethical and safe usage, and explainable AI, which focuses on transparency and interpretability of the outcomes. Our proposed framework falls under the category of decision support, aiming at human enhancement and incorporating a human-in-the-loop approach. This choice does not indicate any doubt about the performance of our system; rather, it acknowledges that the human operator remains the most reliable filter for final decision-making, ensuring compliance with regulatory and ethical standards. At the same time, such an approach contributes to optimized vessel operation by combining advanced analytics with human expertise.
7. Conclusions
This study introduces a machine learning-powered framework for real-time ship performance management, featuring adaptive and interpretable KPIs. The system leverages AI to process high-frequency sensor data, enabling continuous monitoring, early anomaly detection, and predictive decision-making. The core innovation of this framework lies in its deviation-based KPI ranking methodology, which transforms raw data into actionable performance scores. This approach significantly improves the accuracy, consistency, and reliability of ship performance evaluations compared to traditional methods.
The system’s modular design and scalability make it suitable for deployment across a wide range of vessels, from commercial ships to naval platforms. Its ability to adapt to varying operational conditions and vessel profiles ensures its relevance in diverse maritime environments. The integration of AI not only enhances operational efficiency but also plays a pivotal role in reducing environmental impacts, such as fuel consumption and emissions, thus contributing to the global effort toward maritime sustainability.
Key findings from the validation process demonstrate the superiority of the machine learning-enhanced KPIs over traditional performance metrics. Specifically, KPIs like m-K1 (vessel performance) and m-K3 (main engine performance) have been shown to provide more accurate and stable predictions, supporting the reliability and robustness of the system in real-world applications. The broader implications of this work extend beyond technical advancements in performance monitoring. This framework can be a foundational tool in the digital transformation of the maritime sector, enabling smarter, safer, and more sustainable shipping operations. By bridging the gap between advanced digital models and real-world applications, the proposed system serves as a scalable, adaptable solution for the maritime industry’s evolving needs.
Looking forward, future research will focus on enhancing model robustness through federated learning, integrating emissions monitoring to provide comprehensive environmental KPIs and further developing explainable AI techniques to improve transparency and trust in the system’s predictions. As the maritime industry moves toward greater autonomy and digital resilience, this work lays the groundwork for more efficient, data-driven operations, marking a significant step toward achieving smarter and more sustainable maritime operations.
Author Contributions
Conceptualization, C.S.; methodology, V.I. and I.A.; software, V.I. and I.A.; validation, V.I., I.A. and C.S.; formal analysis, V.I. and I.A.; investigation, V.I. and I.A.; resources, C.S.; data curation, V.I.; writing—original draft preparation, V.I. and I.A.; writing—review and editing, C.S.; visualization, V.I. and I.A.; supervision, C.S.; project administration, C.S.; funding acquisition, C.S. All authors have read and agreed to the published version of the manuscript.
Funding
This research received no external funding.
Data Availability Statement
The data presented in this study are available on request from the corresponding author due to proprietary restrictions, as the dataset is owned by the author’s employer and not publicly shareable without prior authorization. During the preparation of this work, the authors used the Ahrefs tool to edit the English language of the text. After using these tools, the authors reviewed and edited the content as needed; they take full responsibility for the content of the publication.
Acknowledgments
This research has been co-financed by the European Regional Development Fund of the European Union and Greek national funds through the Operational Program Competitiveness, Entrepreneurship, and Innovation, under the call RESEARCH—CREATE—INNOVATE (project code: ΤAΕΔΚ-06178).
Conflicts of Interest
Author Christos Spandonidis, Vasileios Iliopoulos and Iason Athanasopoulos were employed by the Electronics SA, Athens. The remaining authors declare that the research was conducted in the absence of any commercial or financial relationships that could be construed as a potential conflict of interest.
References
- IMO. Fourth IMO GHG Study 2020; International Maritime Organization: London, UK, 2020. Available online: https://www.imo.org/en/OurWork/Environment/Pages/Fourth-IMO-Greenhouse-Gas-Study-2020.aspx (accessed on 27 May 2025).
- Lee, H.; Aydin, N.; Choi, Y.; Lekhavat, S.; Irani, Z. Decision support for vessel speed using weather big data. Comput. Oper. Res. 2018, 98, 330–342. [Google Scholar] [CrossRef]
- Moradi, M.H.; Brutsche, M.; Wenig, M.; Wagner, U.; Koch, T. Marine route optimization using reinforcement learning. Ocean. Eng. 2022, 259, 111882. [Google Scholar] [CrossRef]
- Kimera, D.; Nangolo, F.N. Predictive maintenance for ballast pumps. Transp. Eng. 2020, 2, 100020. [Google Scholar] [CrossRef]
- Cheliotis, M.; Lazakis, I.; Theotokatos, G. Machine learning and data-driven fault detection for ship systems operations. Ocean. Eng. 2020, 216, 107968. [Google Scholar] [CrossRef]
- Asimakopoulos, I.; Avendaño-Valencia, L.D.; Lützen, M.; Rytter, N.G.M. Data-driven condition monitoring of two-stroke marine diesel engine piston rings with machine learning. Ships Offshore Struct. 2024, 19, 1241–1253. [Google Scholar] [CrossRef]
- Spandonidis, C.; Paraskevopoulos, D. Evaluation of a Deep Learning-Based Index for Prognosis of a Vessel’s Propeller-Hull Degradation. Sensors 2023, 23, 8956. [Google Scholar] [CrossRef]
- Theodoropoulos, P.; Spandonidis, C.C.; Giannopoulos, F.; Fassois, S. Deep learning for maritime fault detection. Sensors 2021, 21, 5658. [Google Scholar] [CrossRef]
- Karatuğ, Ç.; Tadros, M.; Ventura, M.; Soares, C.G. Decision support system for ship energy efficiency management based on an optimization model. Energy 2024, 292, 130318. [Google Scholar] [CrossRef]
- Di Bonito, L.P.; Campanile, L.; Napolitano, E.; Iacono, M.; Portolano, A.; Di Natale, F. Analysis of a marine scrubber operation with a combined analytical/AI-based method. Chem. Eng. Res. Des. 2023, 195, 613–623. [Google Scholar] [CrossRef]
- Gupta, P.; Rasheed, A.; Steen, S. Ship performance monitoring using machine-learning. Ocean. Eng. 2022, 254, 111094. [Google Scholar] [CrossRef]
- Ji, H.; Wang, H.; Chen, Q.; Ma, X.; Cai, Y. Corrosion behavior prediction for hull steels under dynamic marine environments. Ocean. Eng. 2024, 300, 117371. [Google Scholar] [CrossRef]
- Madusanka, N.S.; Fan, Y.; Yang, S.; Xiang, X. Digital Twin in the Maritime Domain: A Review. J. Mar. Sci. Eng. 2023, 11, 1021. [Google Scholar] [CrossRef]
- Mauro, F.; Kana, A.A. Digital twin for ship life-cycle: A critical systematic review. Ocean. Eng. 2023, 269, 113479. [Google Scholar] [CrossRef]
- Assani, N.; Matić, P.; Katalinić, M. Ship’s Digital Twin—A Review of Modelling Challenges and Applications. Appl. Sci. 2022, 12, 6039. [Google Scholar] [CrossRef]
- Karatuğ, Ç.; Tadros, M.; Ventura, M.; Soares, C.G. Strategy for ship energy efficiency based on optimization model and data-driven approach. Ocean. Eng. 2023, 279, 114397. [Google Scholar] [CrossRef]
- Rogers, A.; Ebrahimi, F. Digital twin for maritime instability detection. Ocean. Syst. Eng. 2022, 12, 289–310. [Google Scholar]
- Liu, Y.; Yang, C.; Lu, Y. Digital twin-enabled safety monitoring for marine structures. Autom. Constr. 2020, 119, 103313. [Google Scholar] [CrossRef]
- Jimenez, A.; Panella, M.; Shah, N. The state of condition-based maintenance in maritime. J. Mar. Eng. Technol. 2020, 19, 249–261. [Google Scholar]
- Coraddu, A.; Oneto, L.; Anguita, D. Data analytics for CBM in shipping. Expert Syst. Appl. 2021, 179, 115015. [Google Scholar] [CrossRef]
- Nikolopoulos, E.; Boulougouris, E. Barriers to digital transformation in maritime. Marit. Econ. Logist. 2020, 22, 395–417. [Google Scholar]
- Borén, T.; Strandberg, S.; Sundström, O. Trustworthy AI in the maritime sector. J. Mar. Sci. Eng. 2022, 10, 794. [Google Scholar] [CrossRef]
- Kytariolou, I.; Themelis, N. Maritime AI interpretability challenges. Mar. Technol. Soc. J. 2022, 56, 55–64. [Google Scholar]
- Uhlenkamp, J.-F.; Baalsrud Hauge, J.; Broda, E.; Lütjen, M.; Freitag, M.; Thoben, K.-D. Digital Twins: A Maturity Model for Their Classification and Evaluation. IEEE Access 2022, 10, 69605–69635. [Google Scholar] [CrossRef]
- Jungk, R.; Müllert, N.R. Future Workshops: How to Create Desirable Futures; Institute for Social Inventions: London, UK, 1987. [Google Scholar]
- Themelis, N.; Spandonidis, C.C.; Giordamlis, C. Data acquisition and processing techniques for a novel performance monitoring system based on KPIs. In Proceedings of the 18th International Congress of the International Maritime Association of the Mediterranean (IMAM 2019), Varna, Bulgaria, 9–11 September 2019; CRC Press: Boca Raton, FL, USA, 2019; pp. 306–315. [Google Scholar] [CrossRef]
- ISO 19030-2:2016; Ships and Marine Technology—Measurement of Changes in Hull and Propeller Performance—Part 2: Default Method. International Organization for Standardization: Geneva, Switzerland, 2016.
- Kingma, D.P.; Ba, J. Adam: A Method for Stochastic Optimization. arXiv 2014, arXiv:1412.6980. [Google Scholar]
- Li, L.; Jamieson, K.; DeSalvo, G.; Rostamizadeh, A.; Talwalkar, A. Hyperband: A novel bandit-based approach to hyperparameter optimization. J. Mach. Learn. Res. 2017, 18, 6765–6816. [Google Scholar]
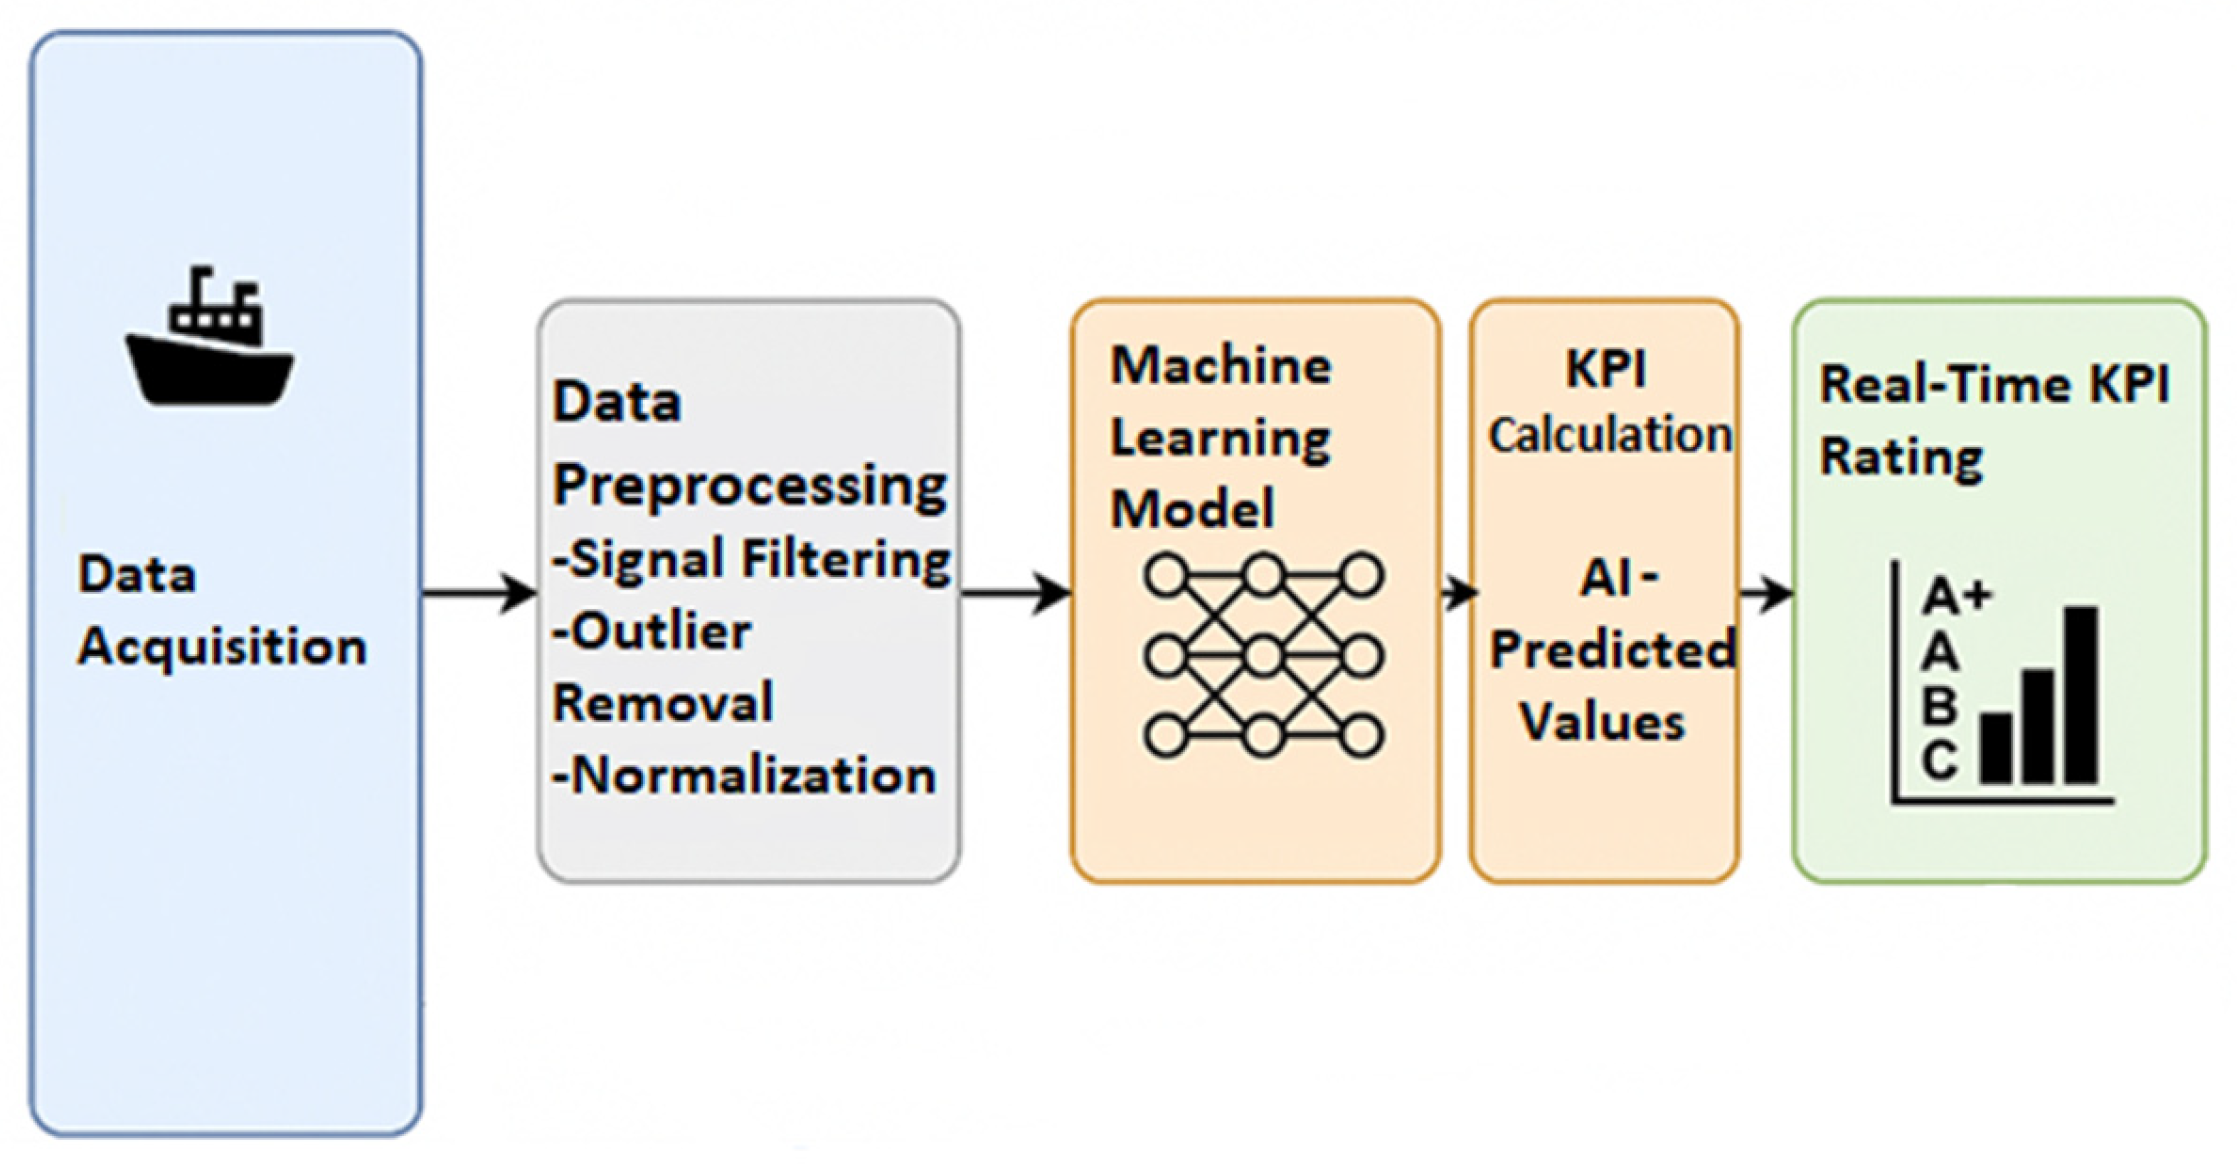
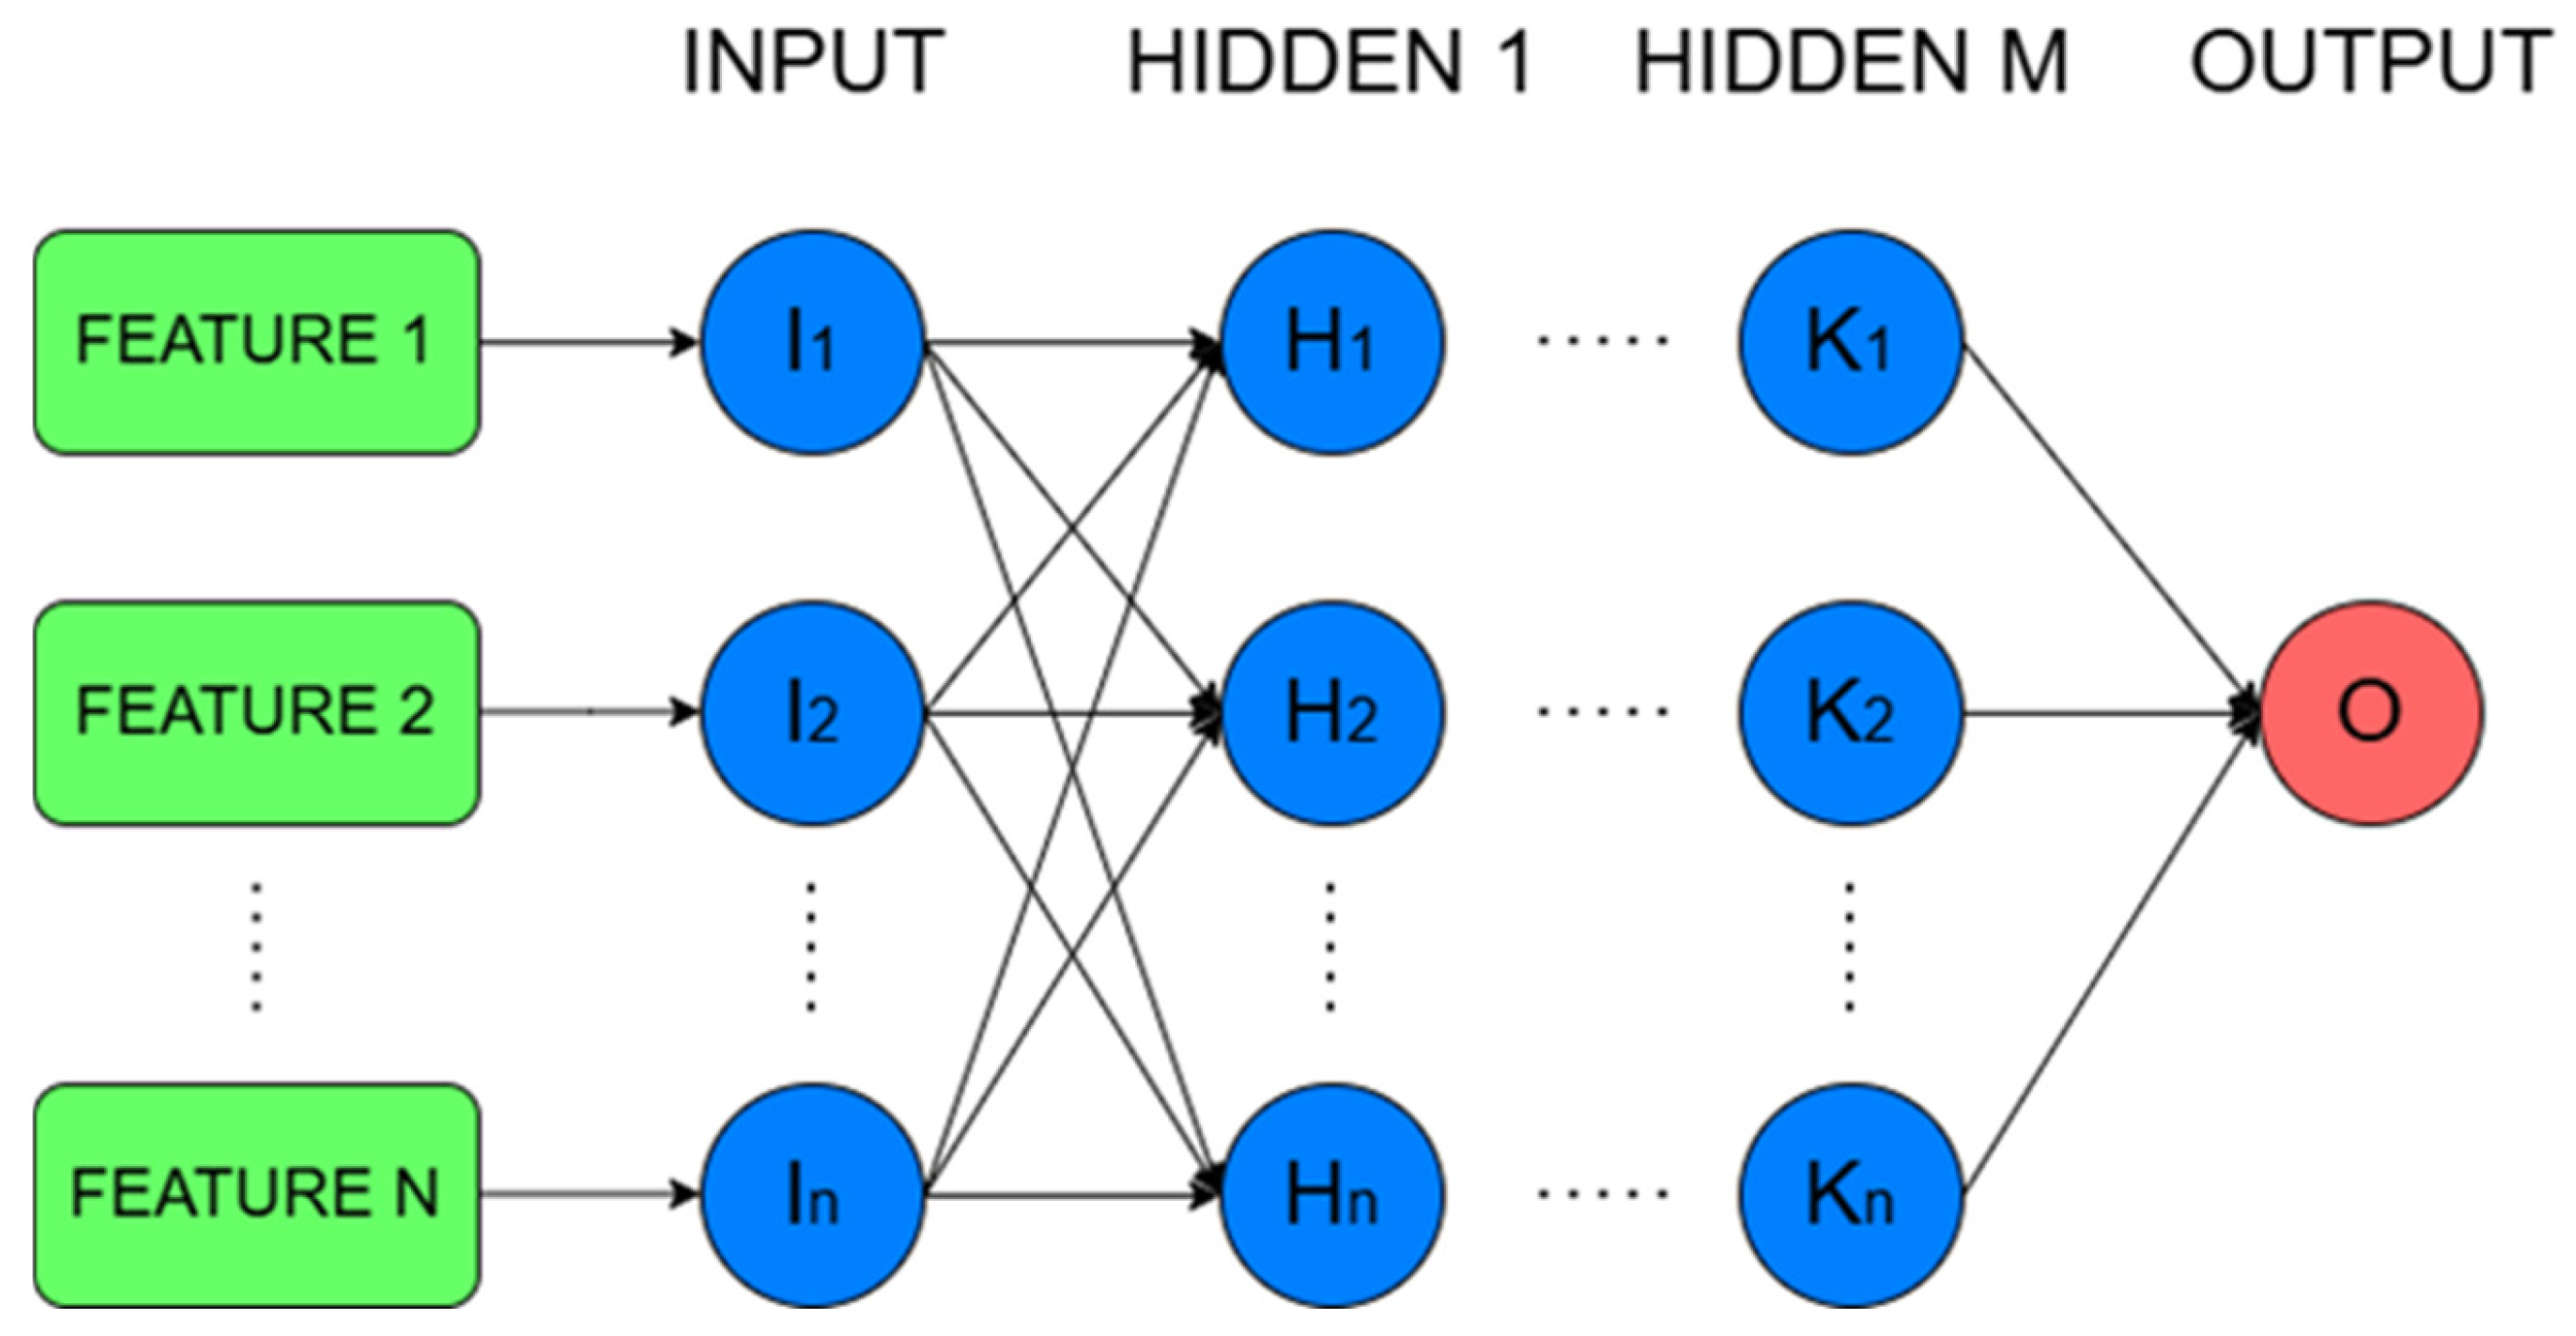
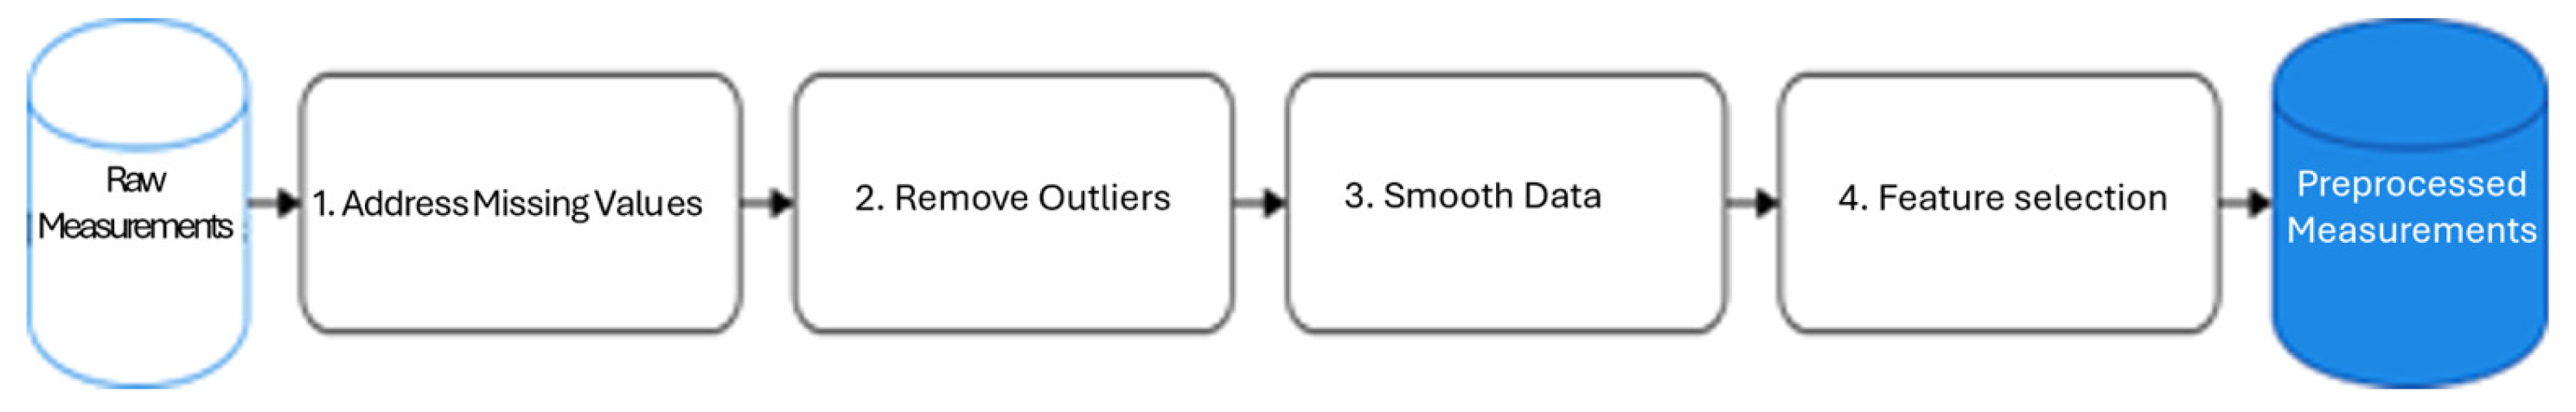
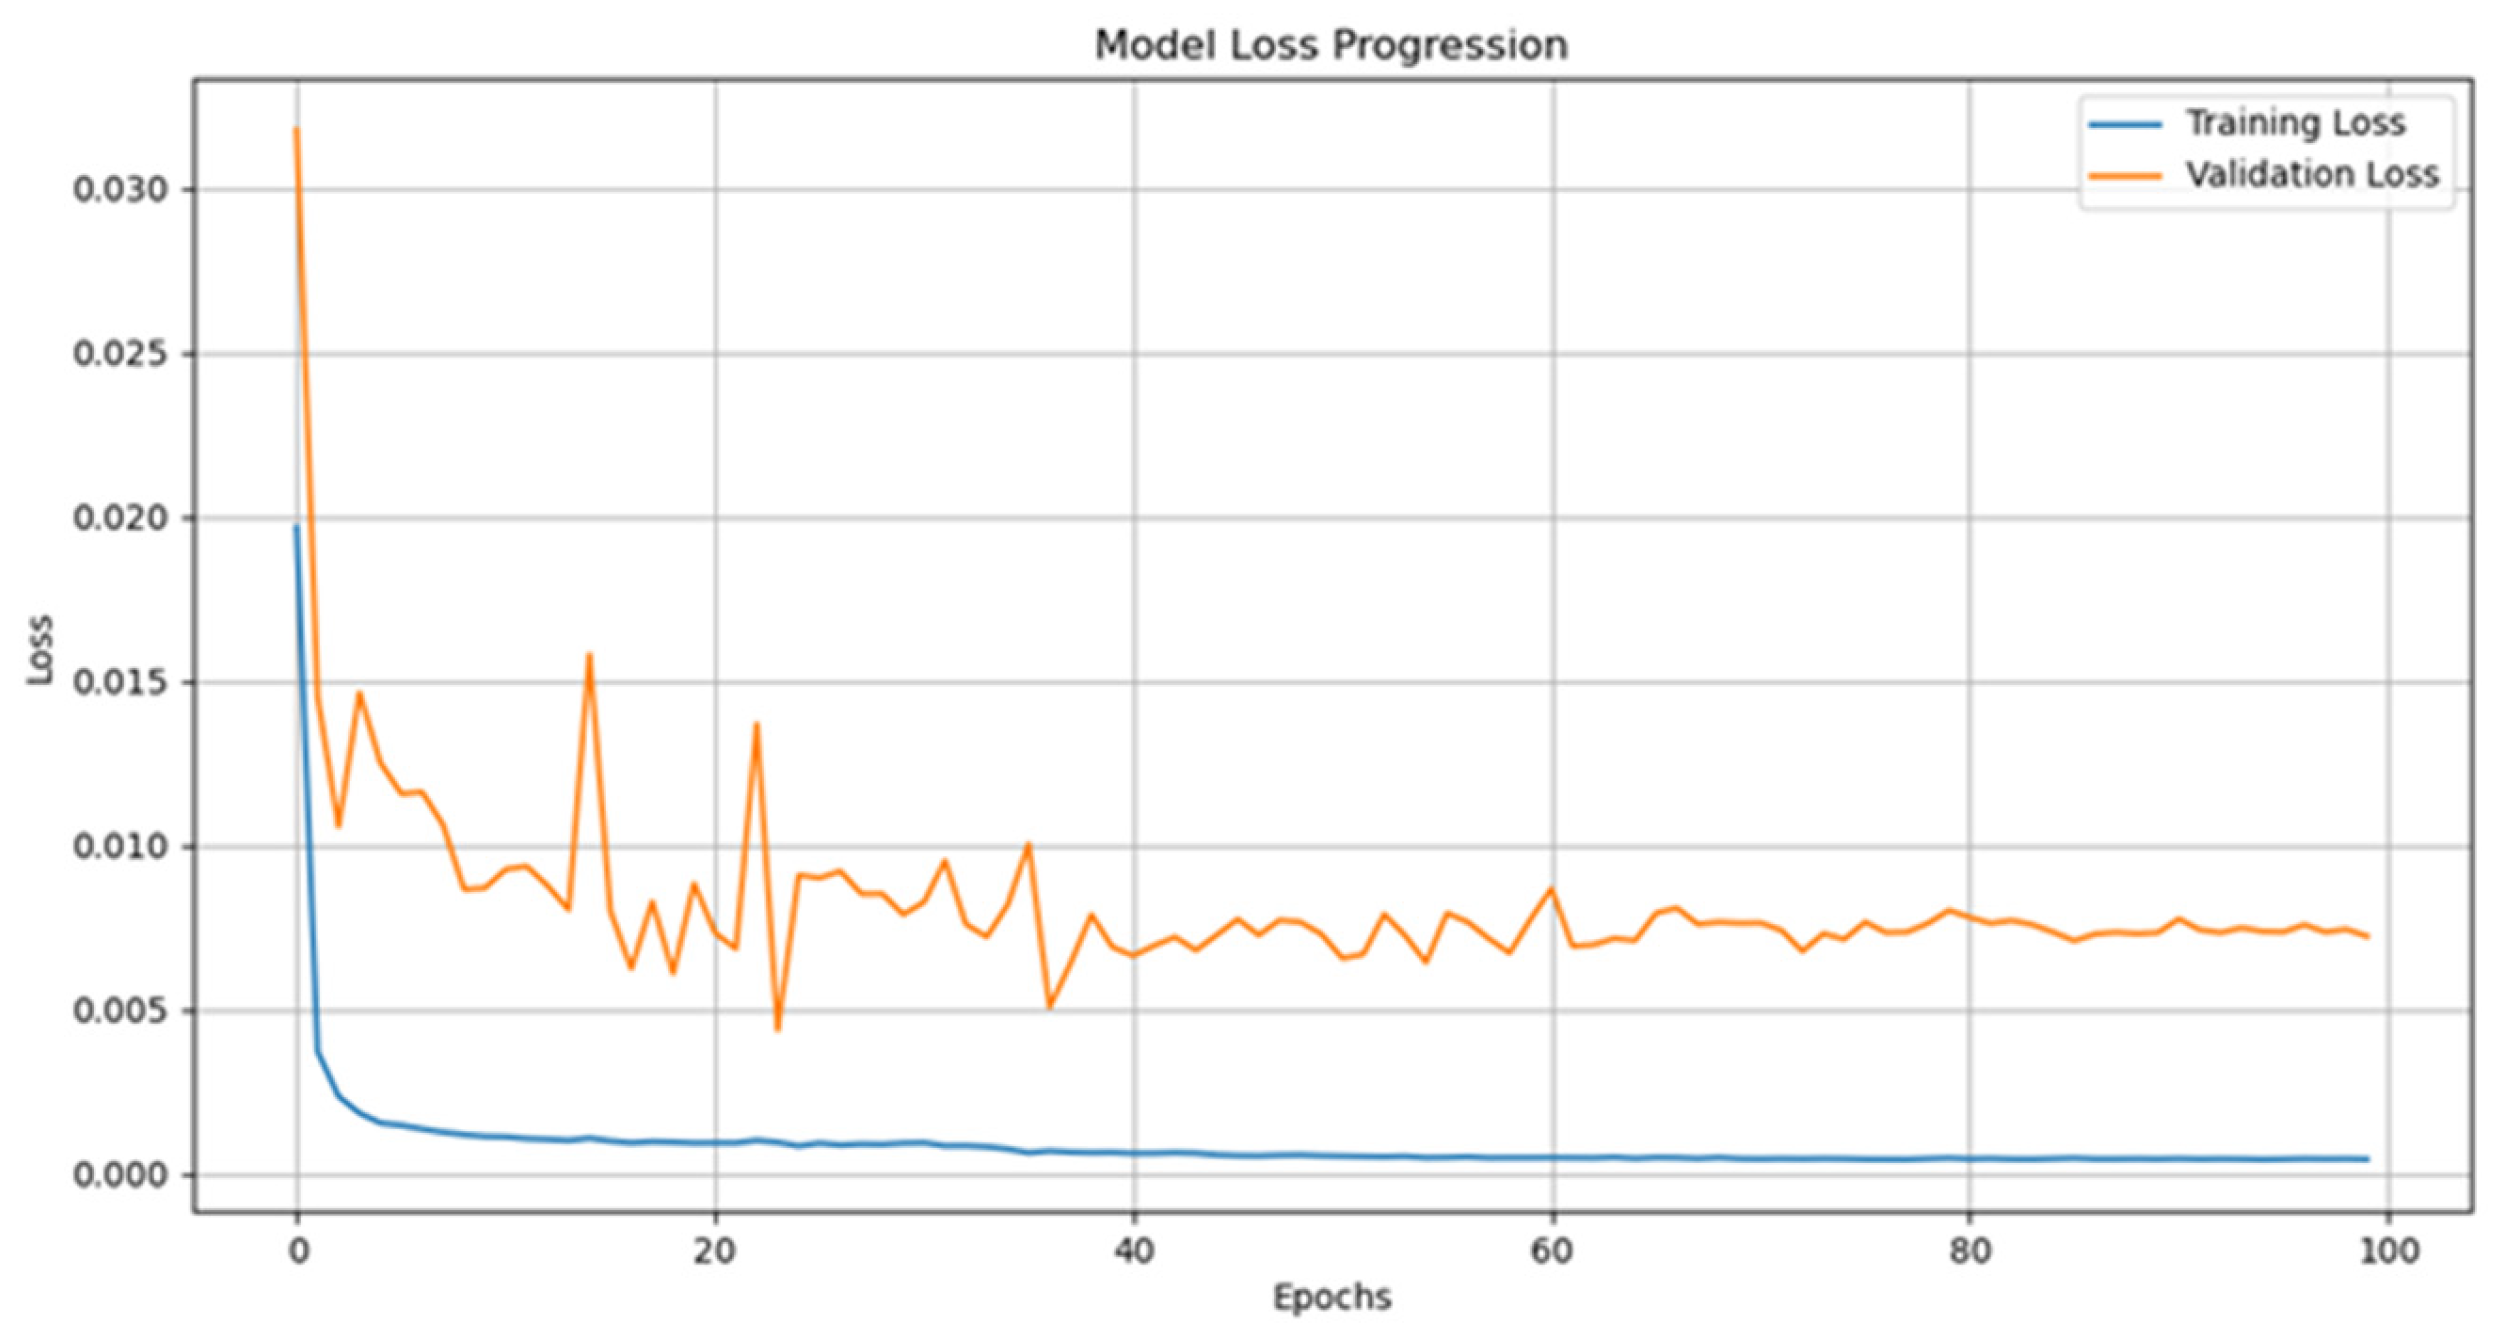
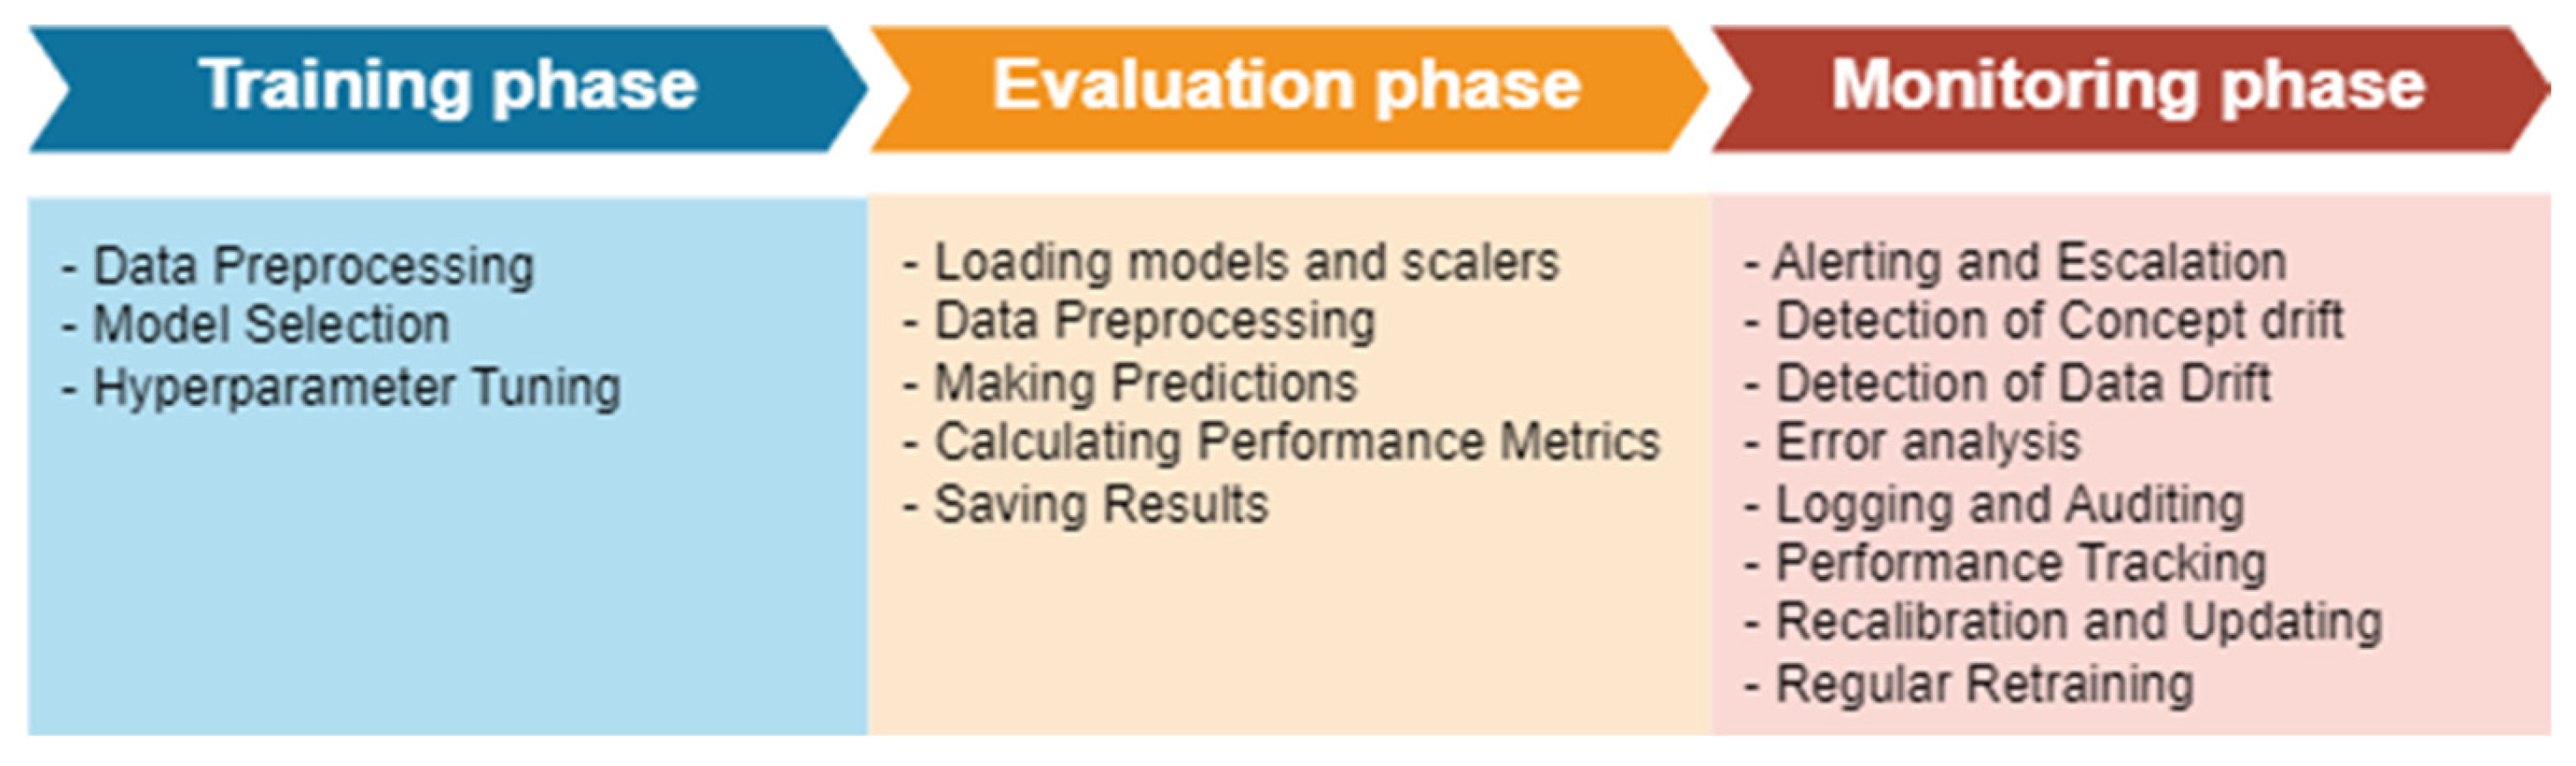
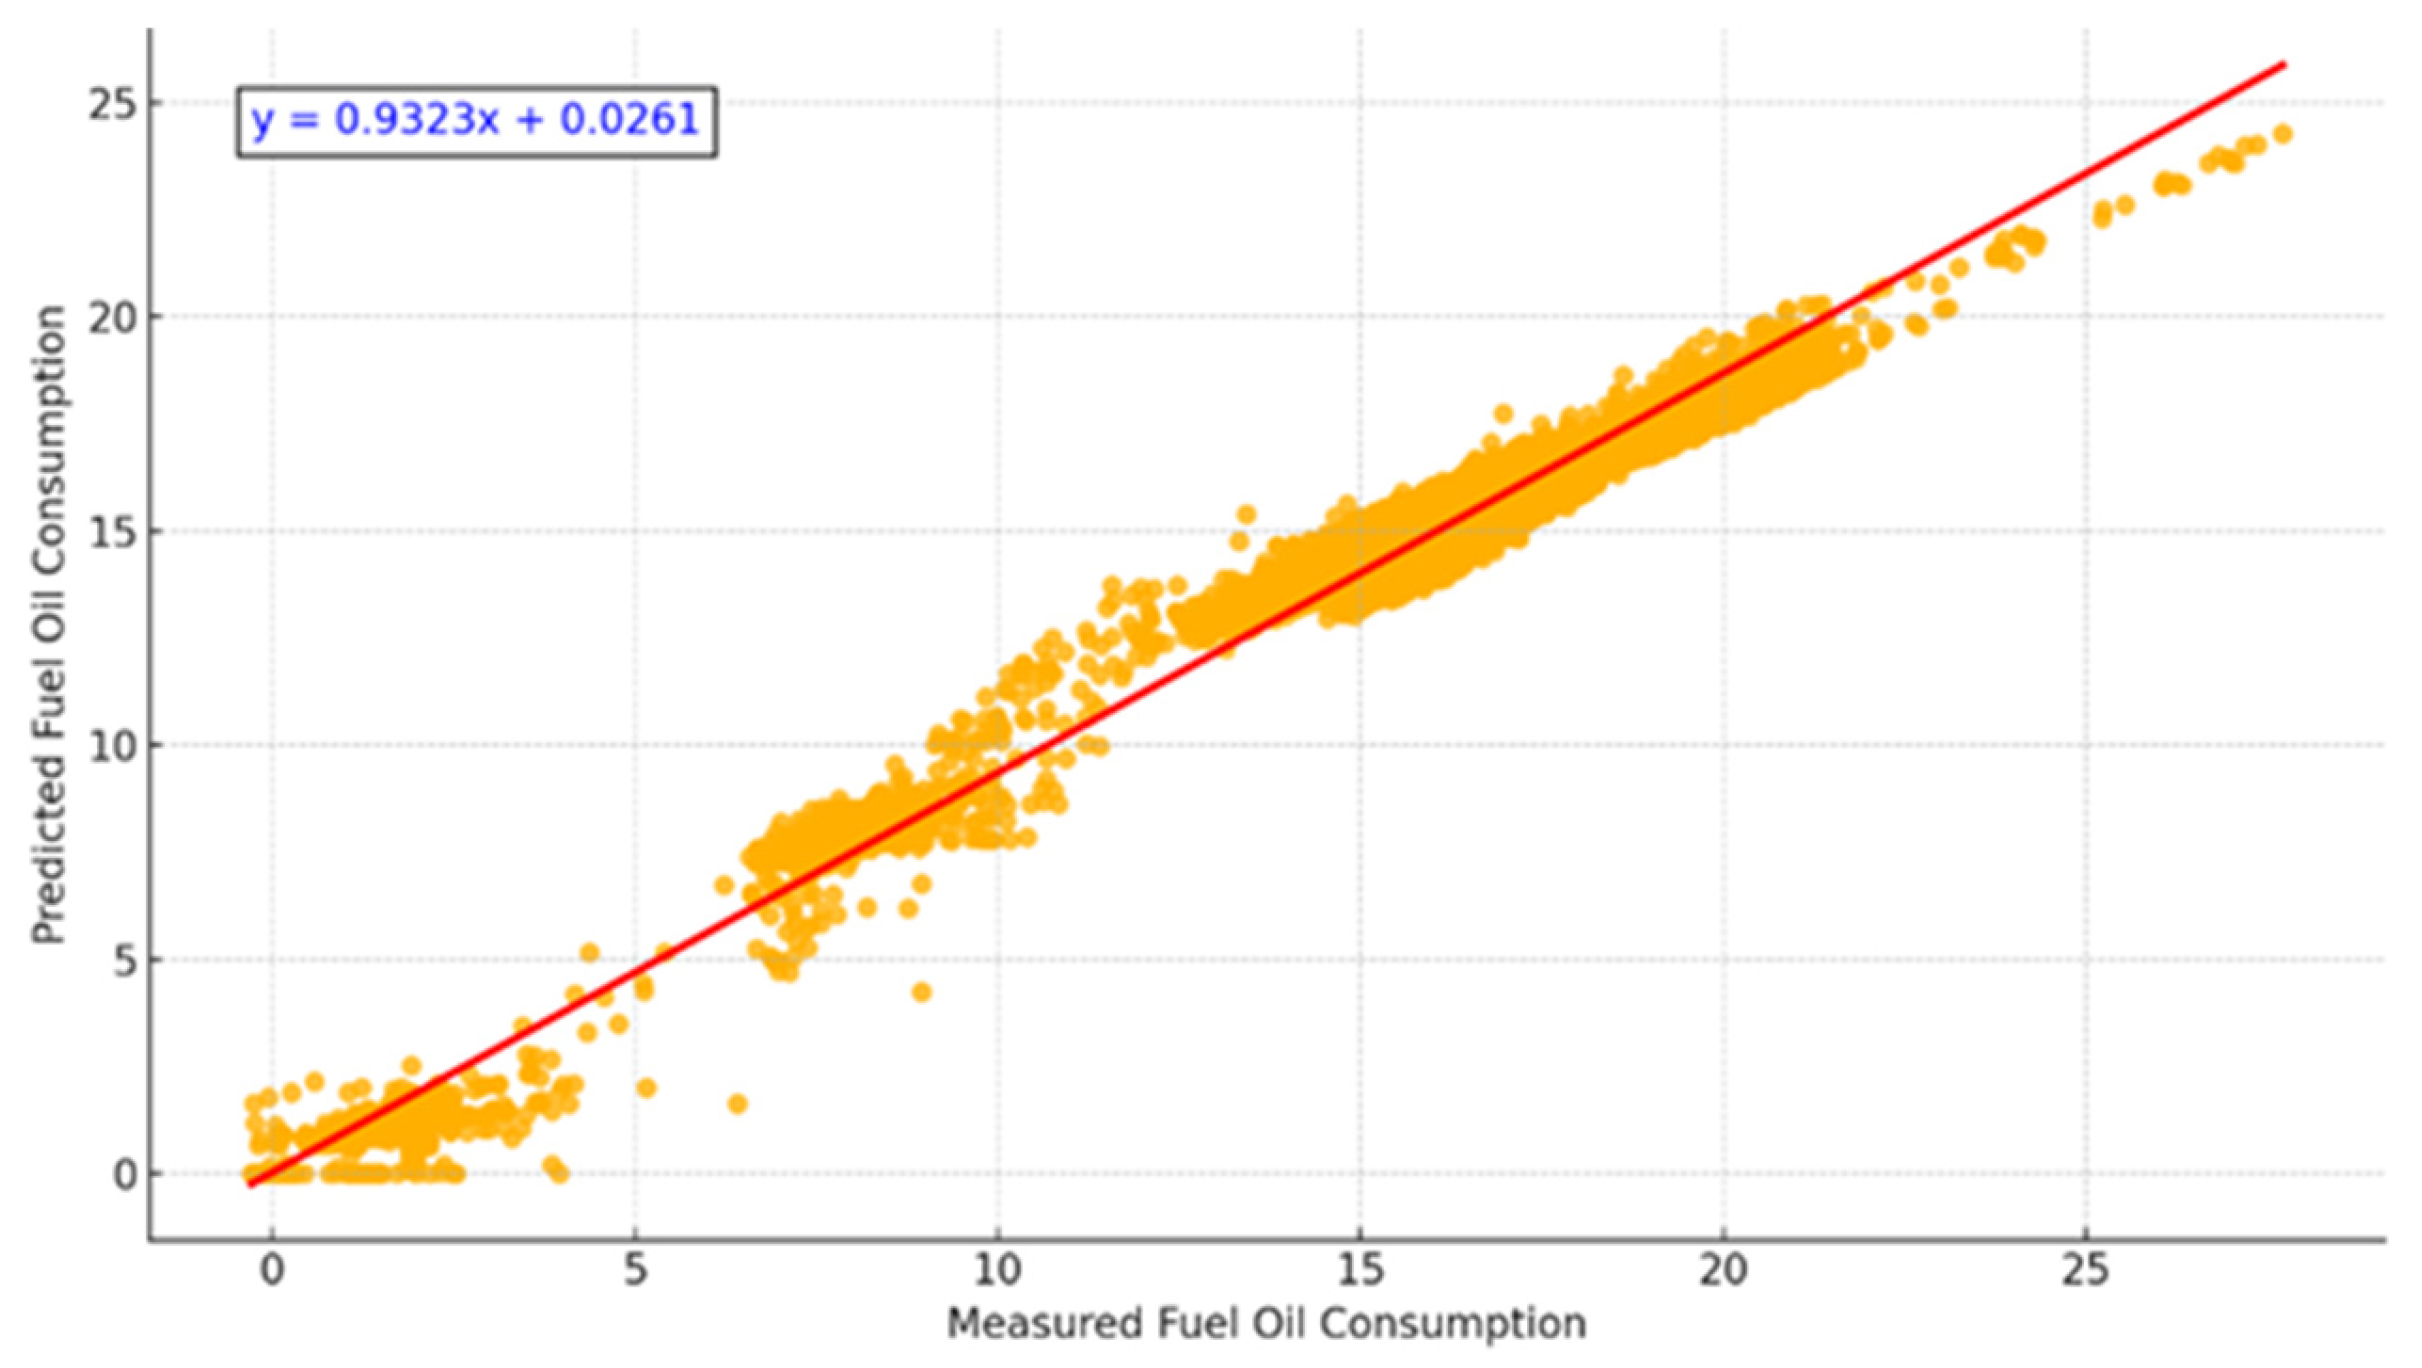

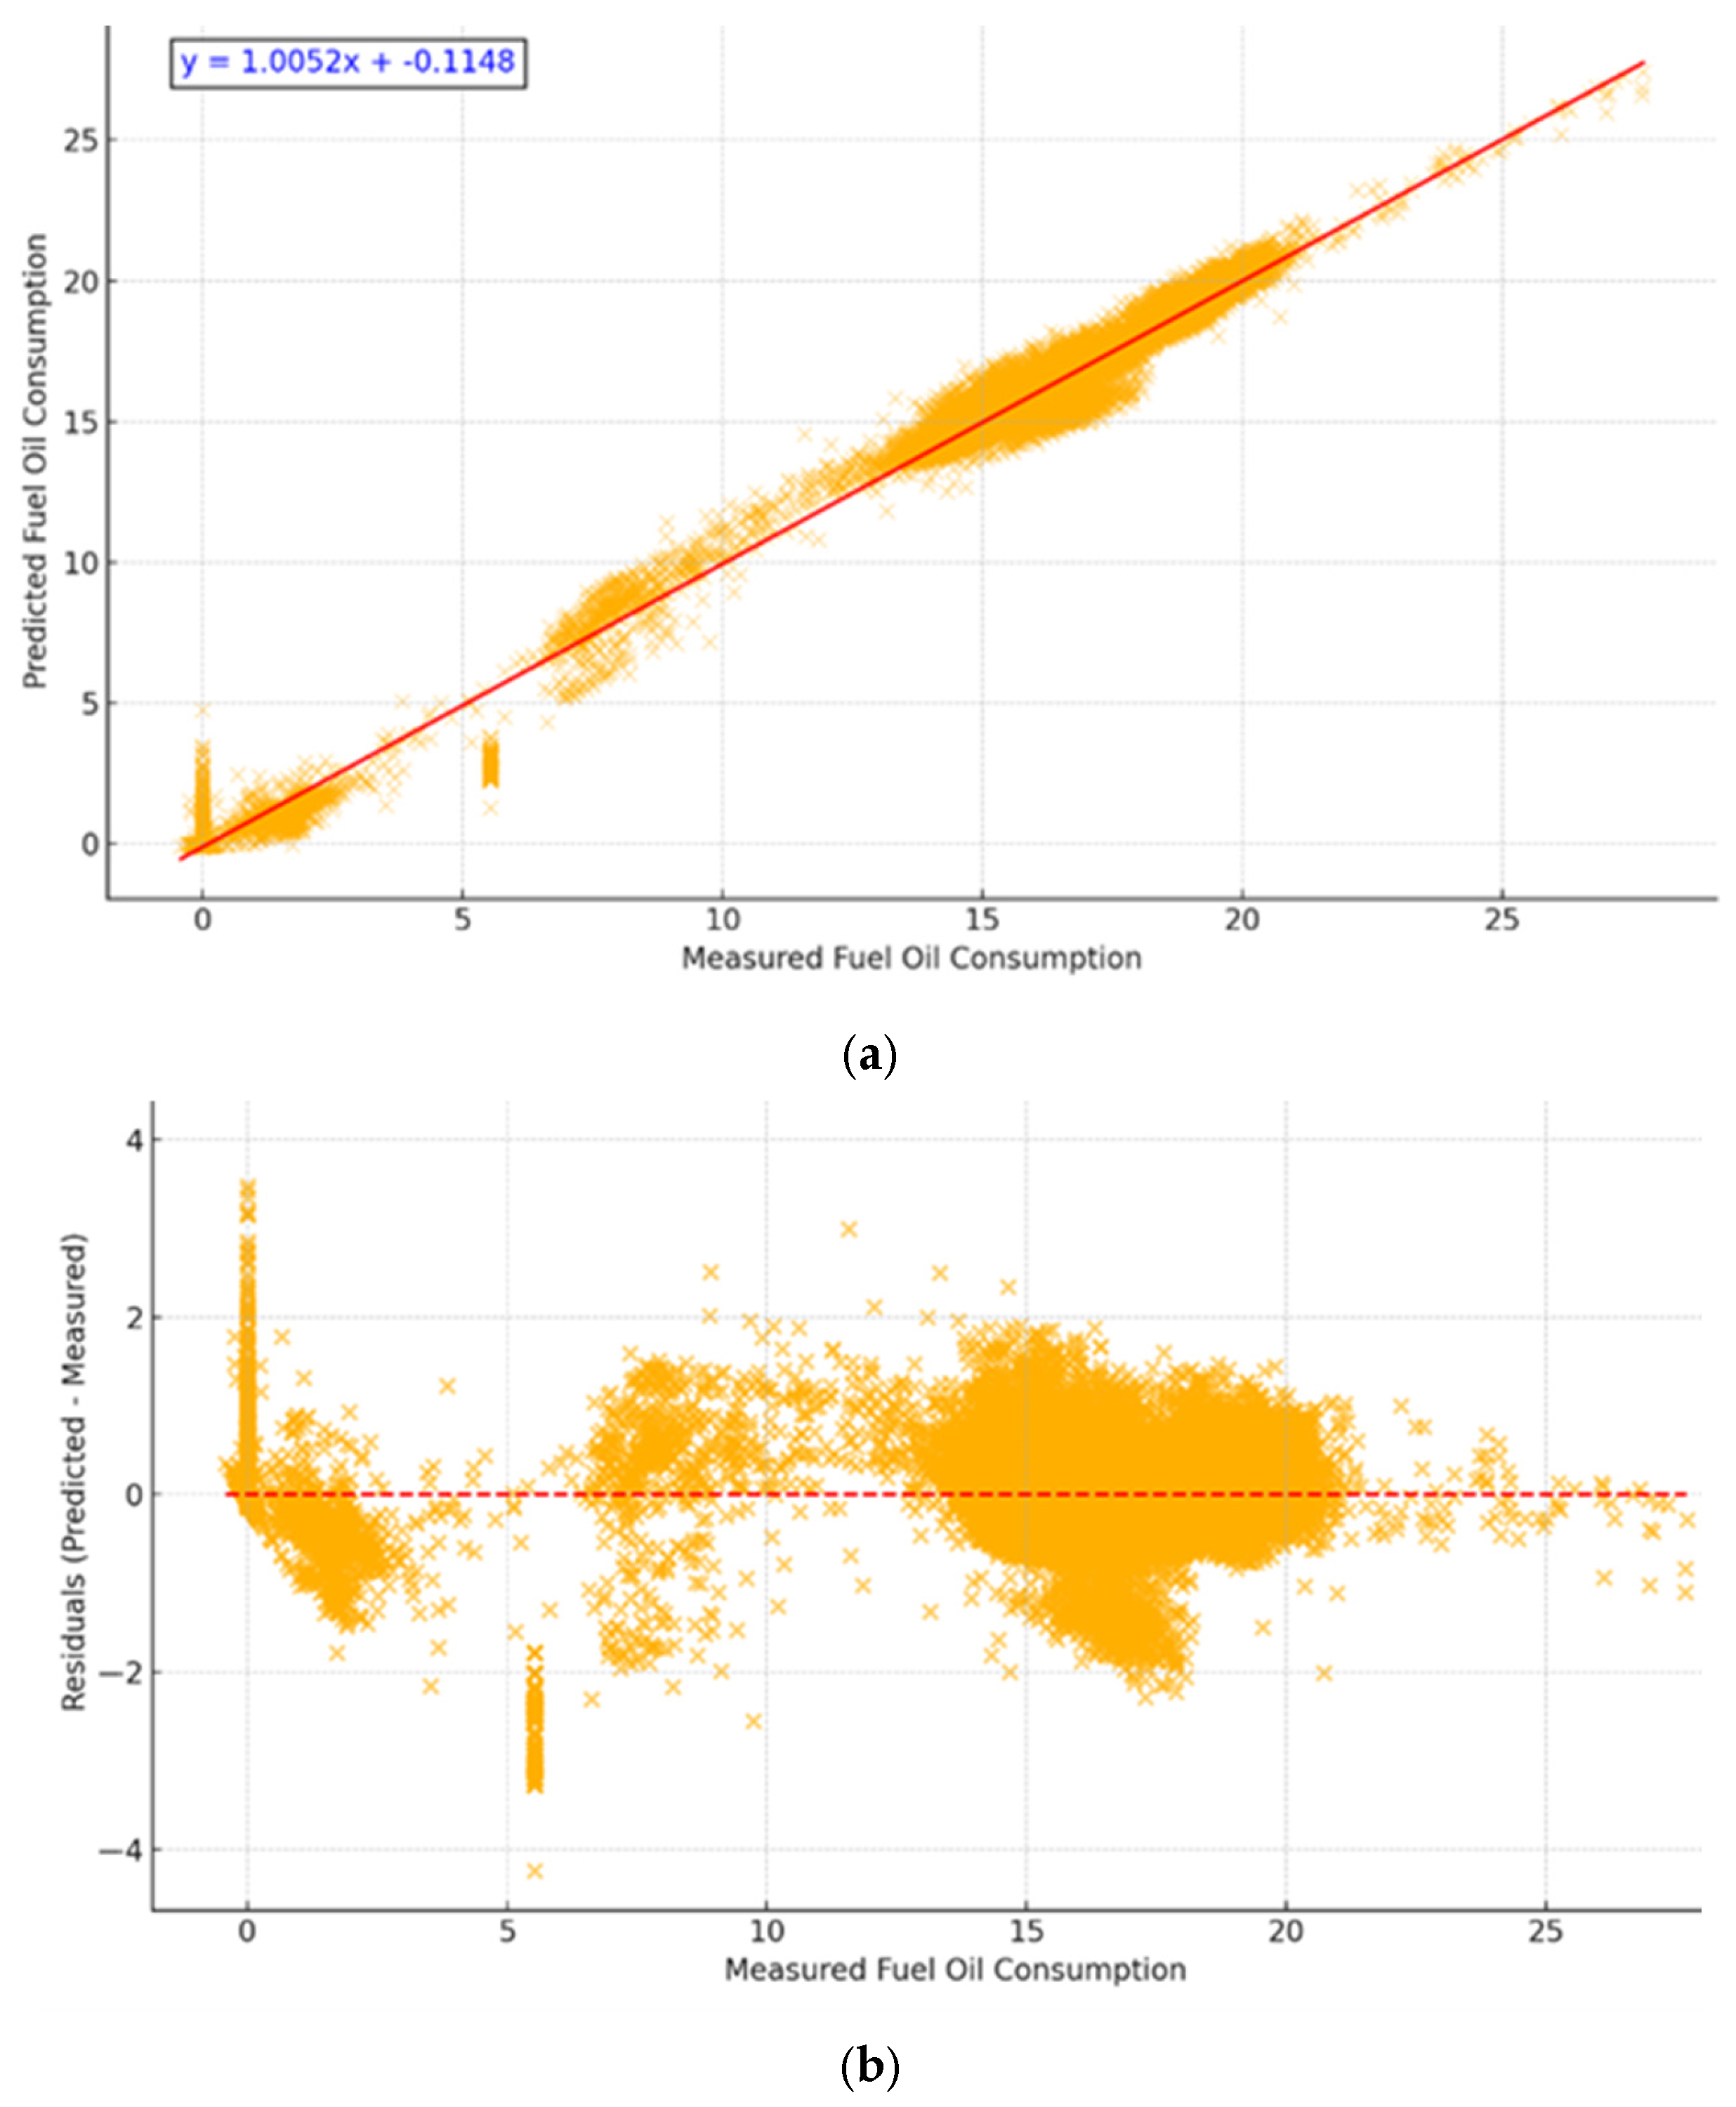
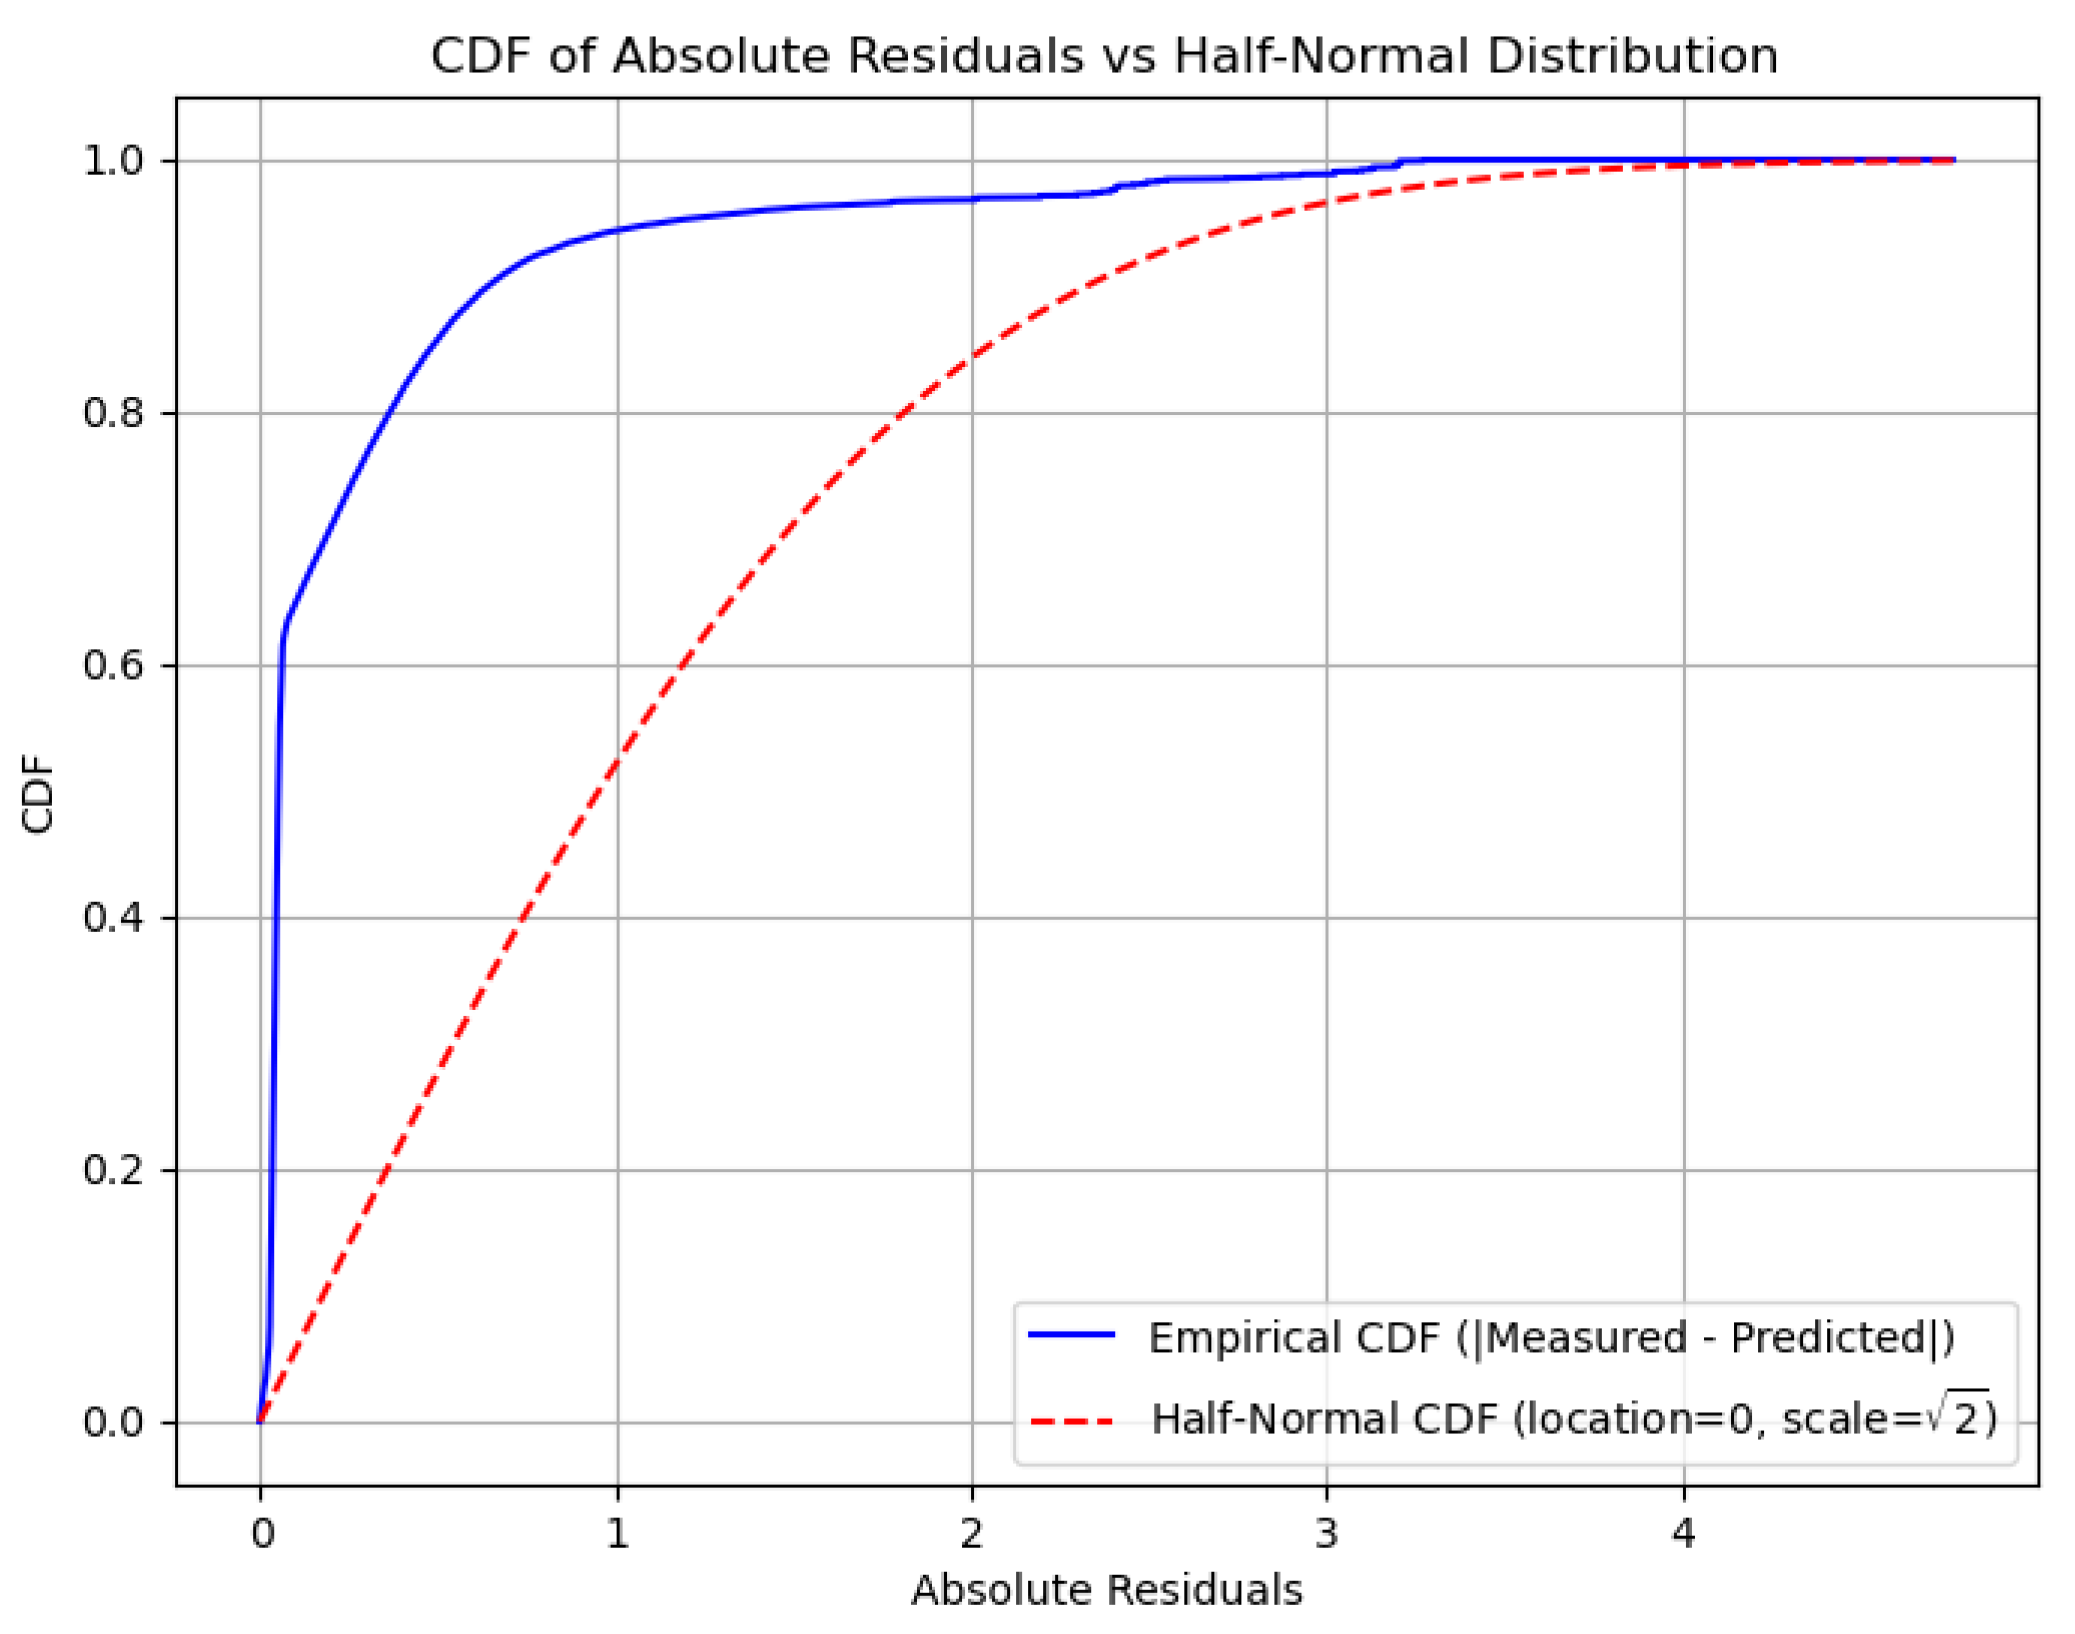
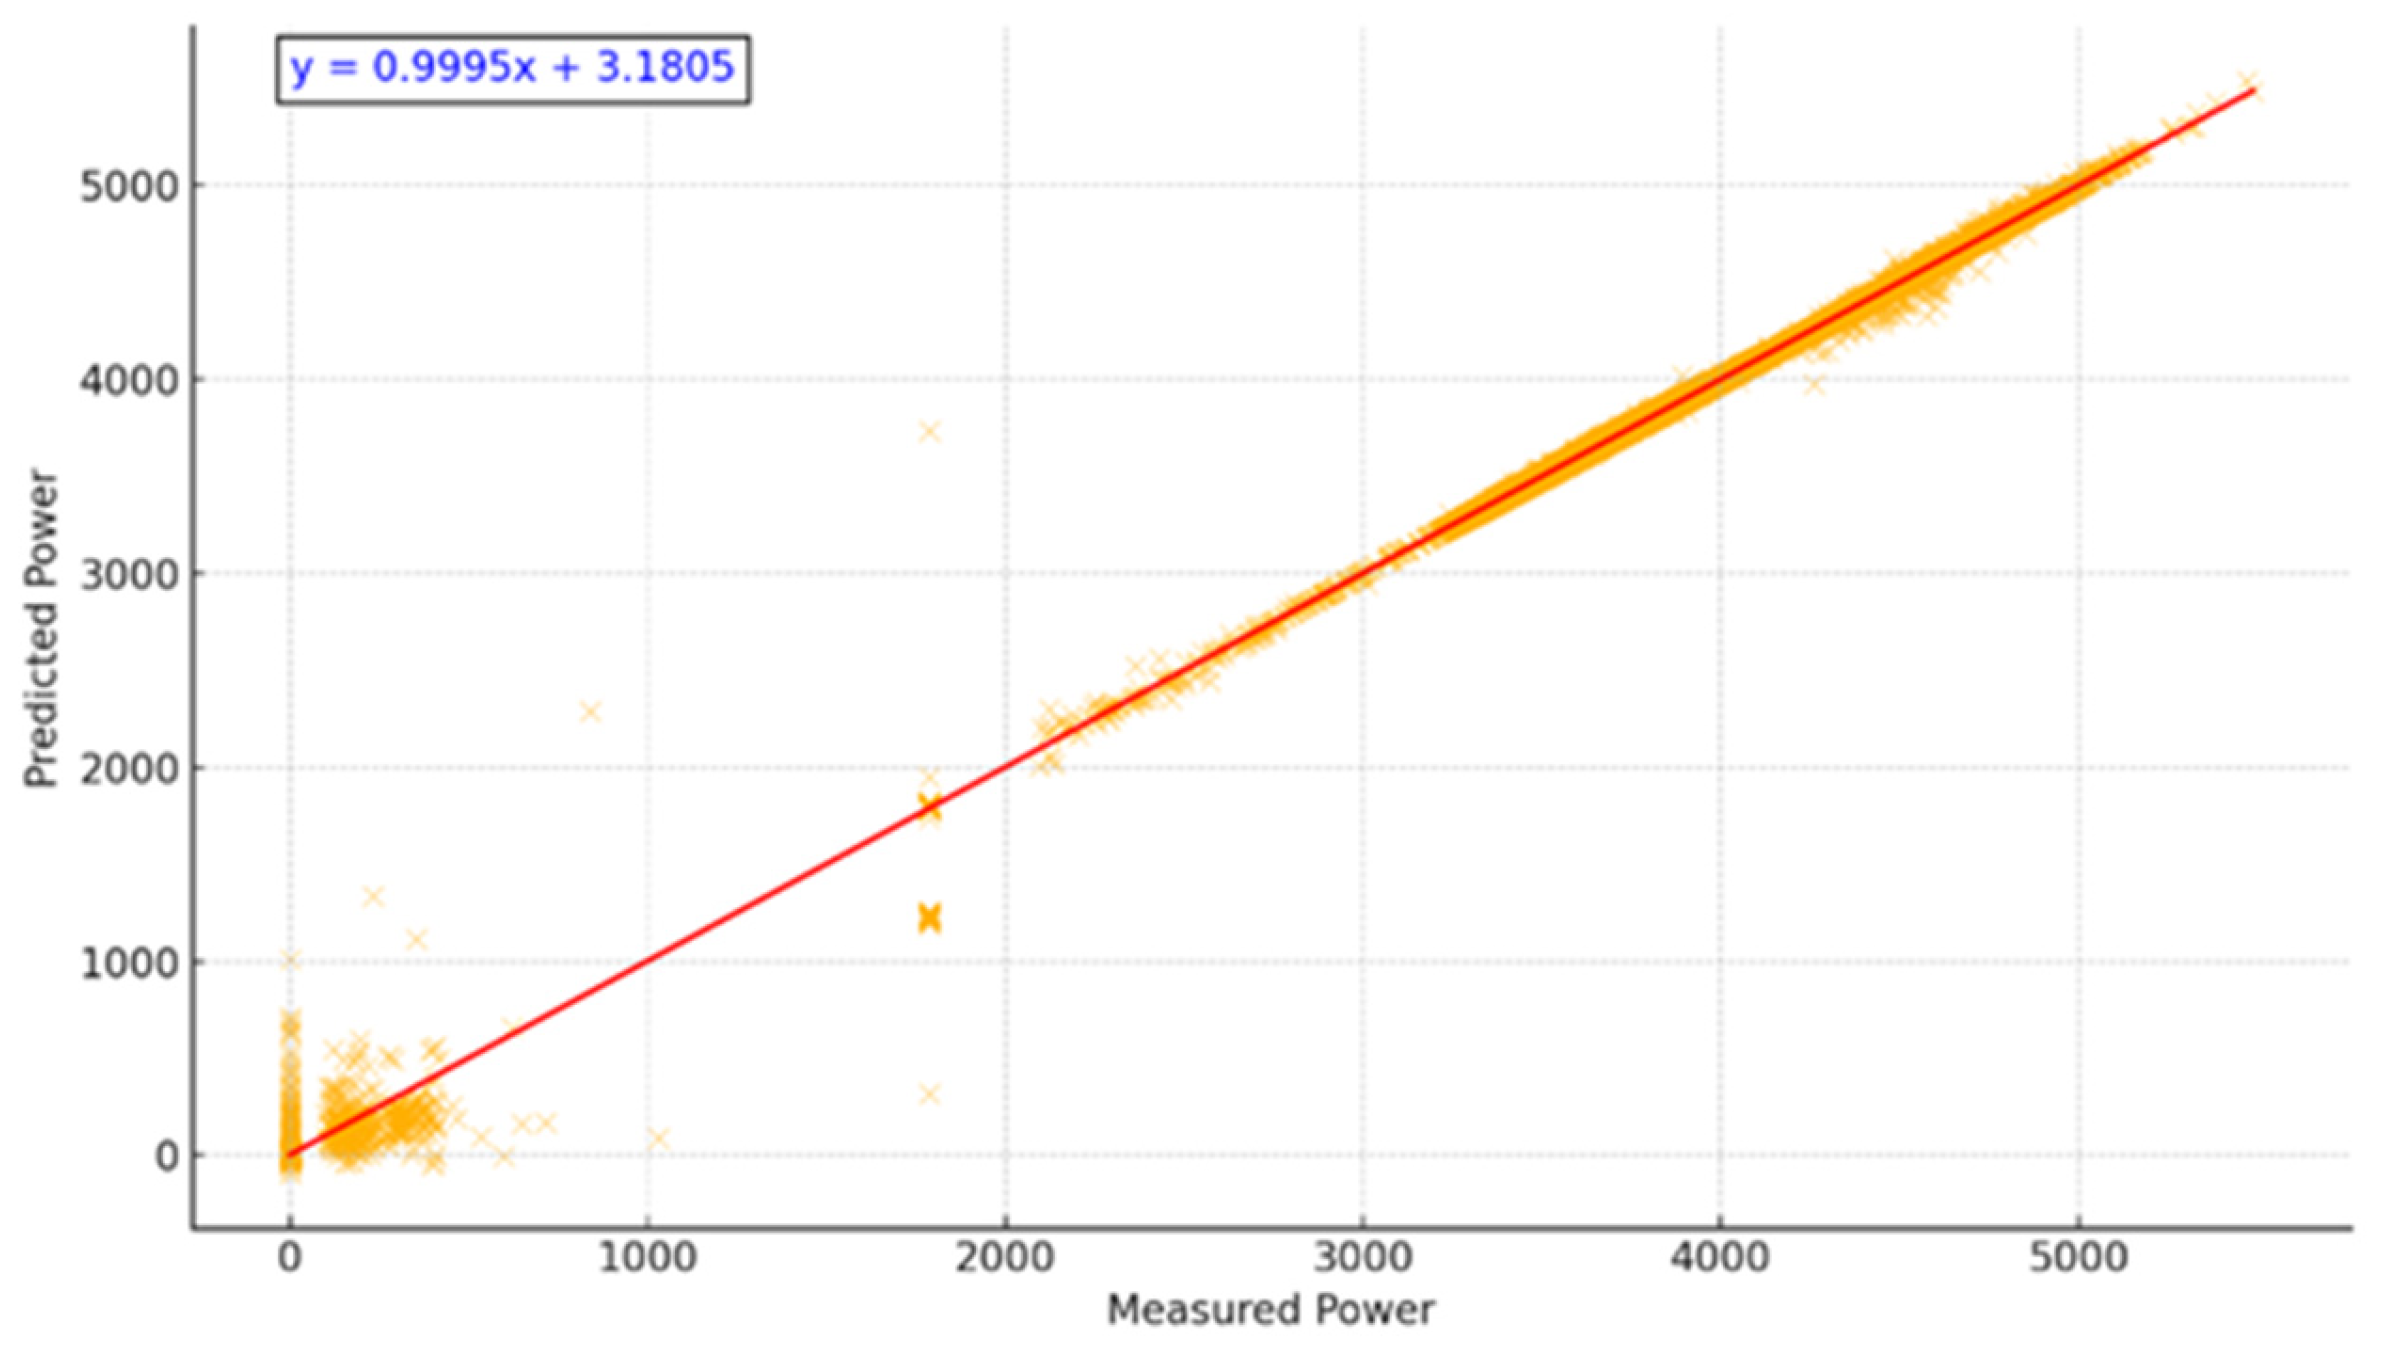
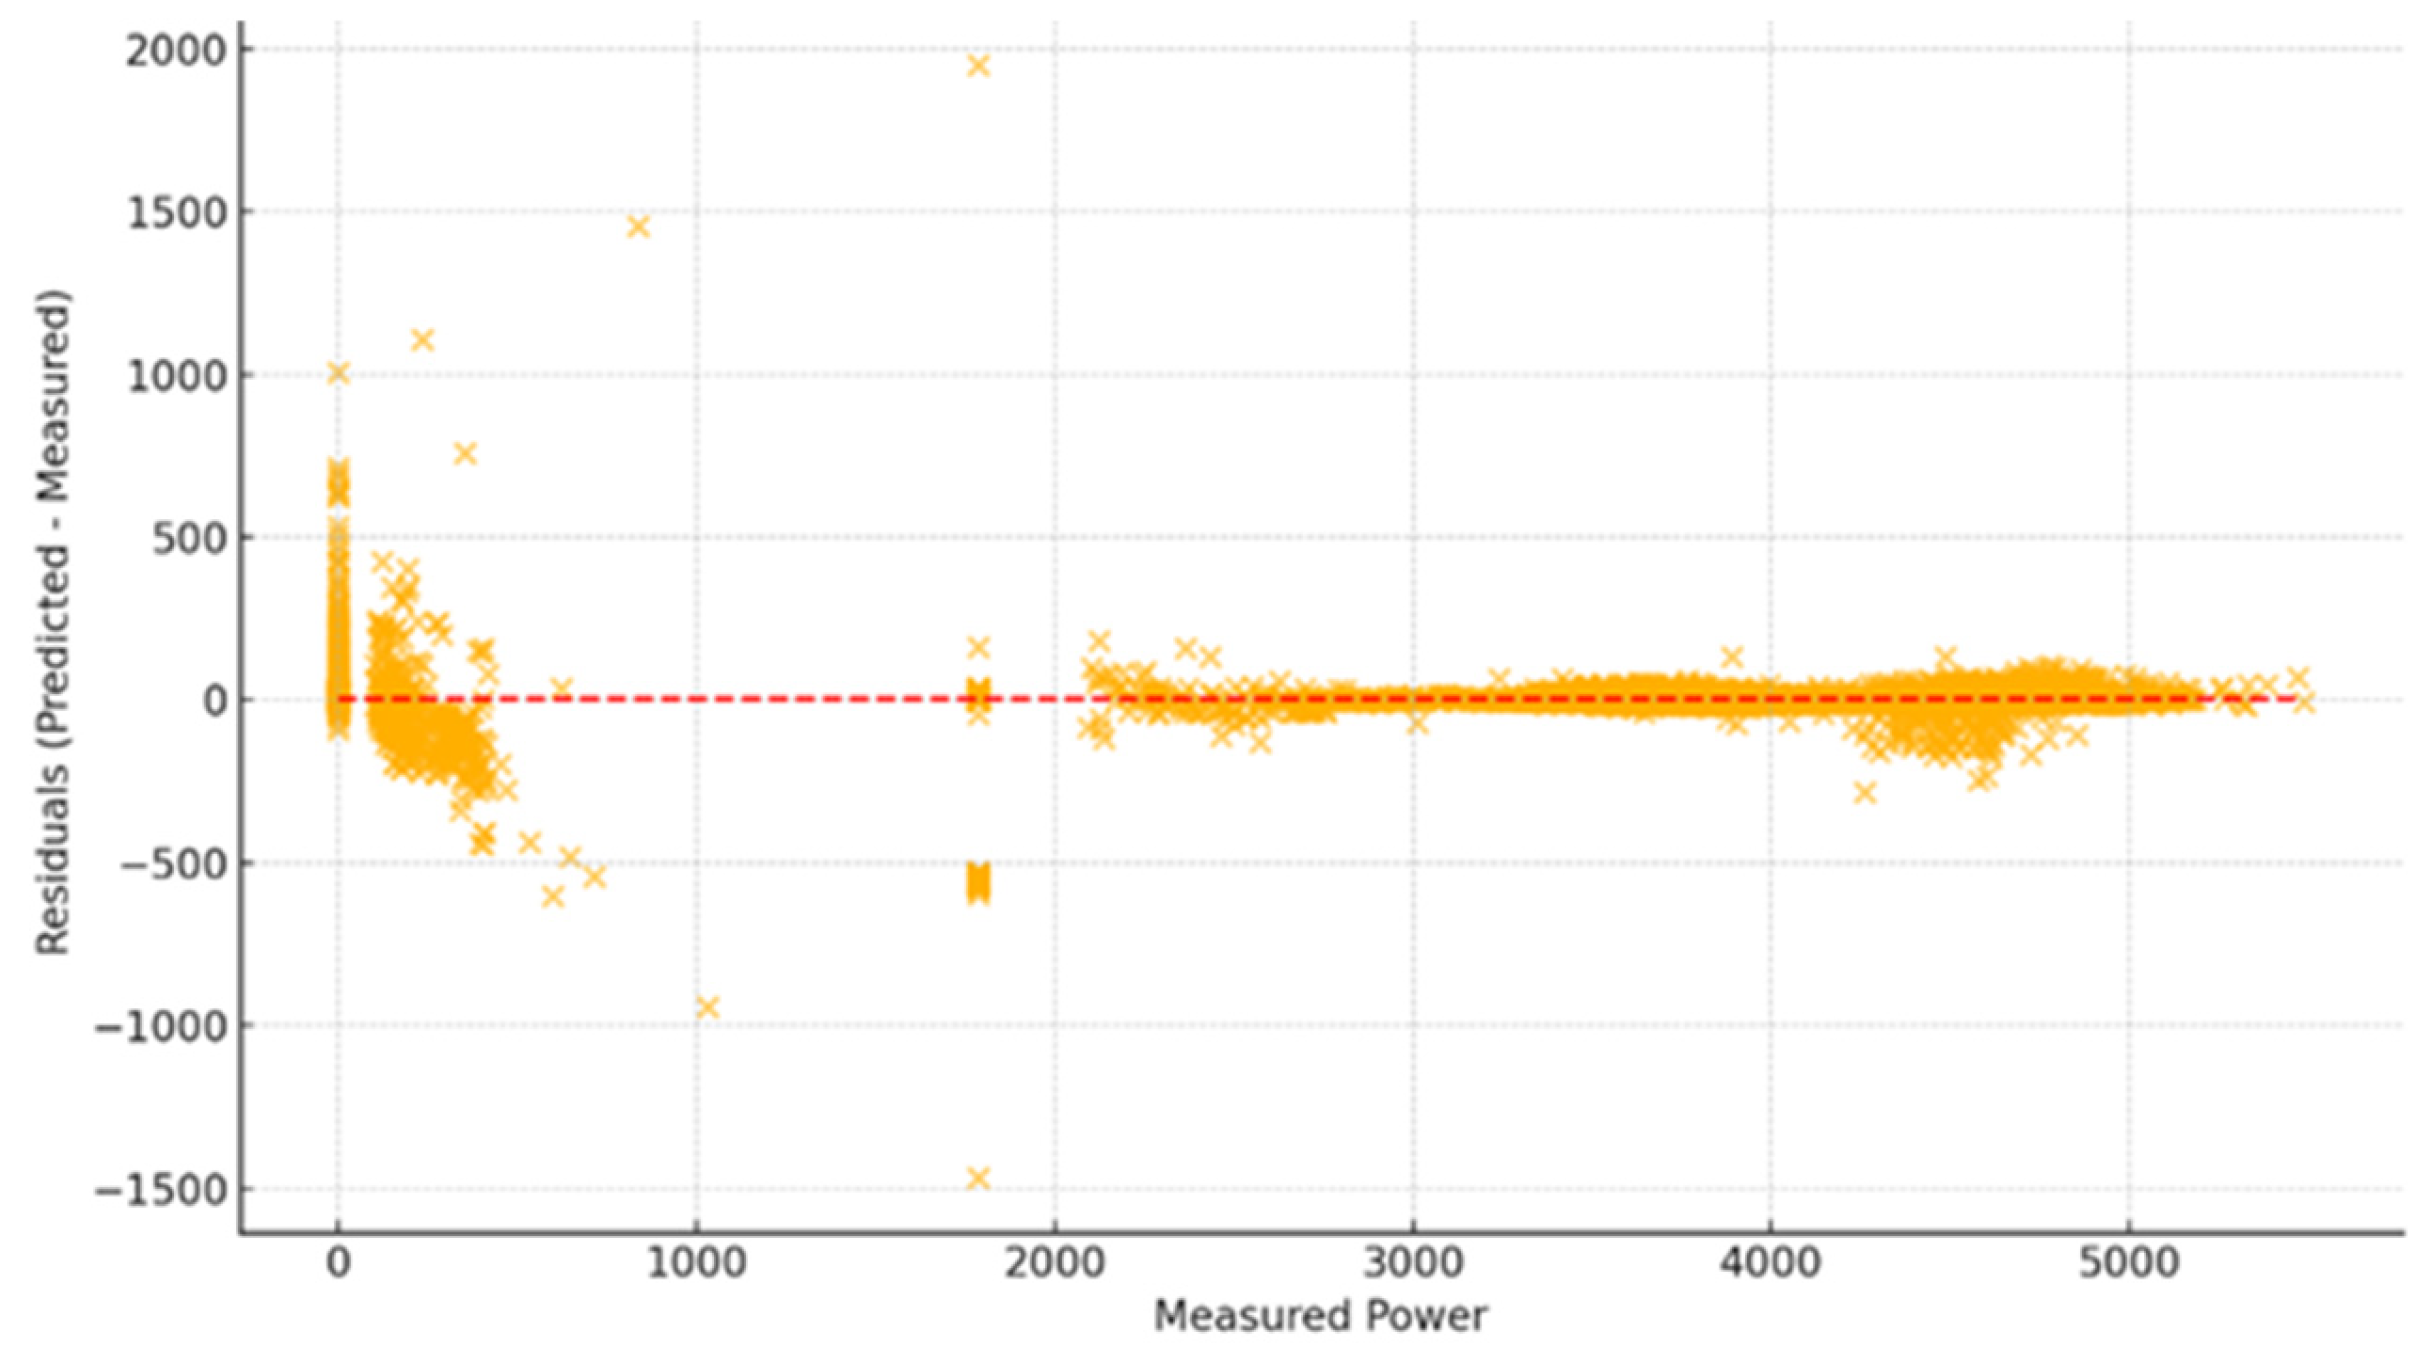
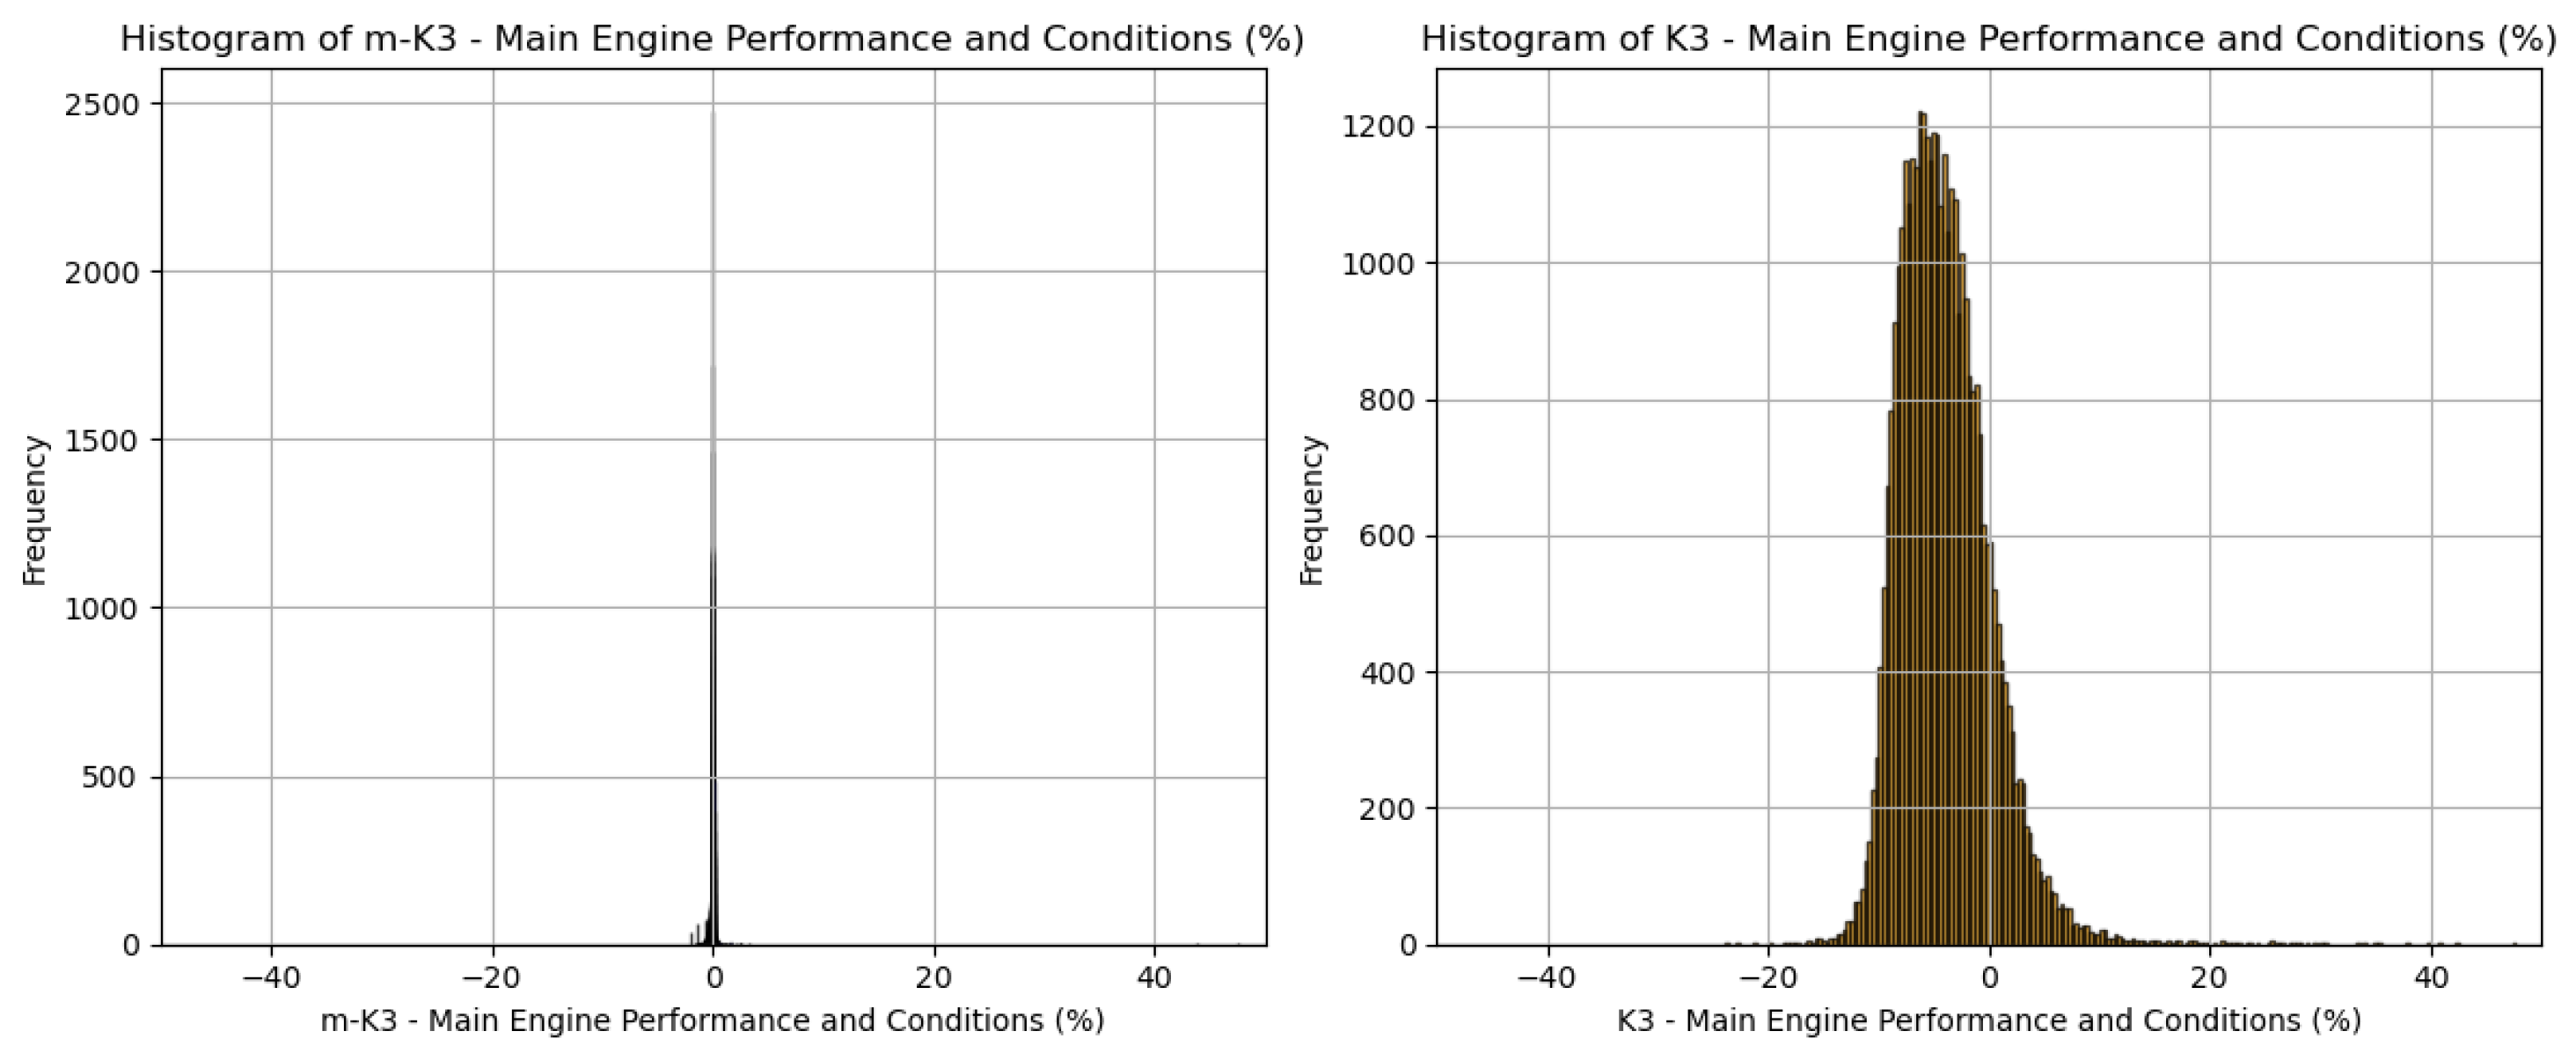
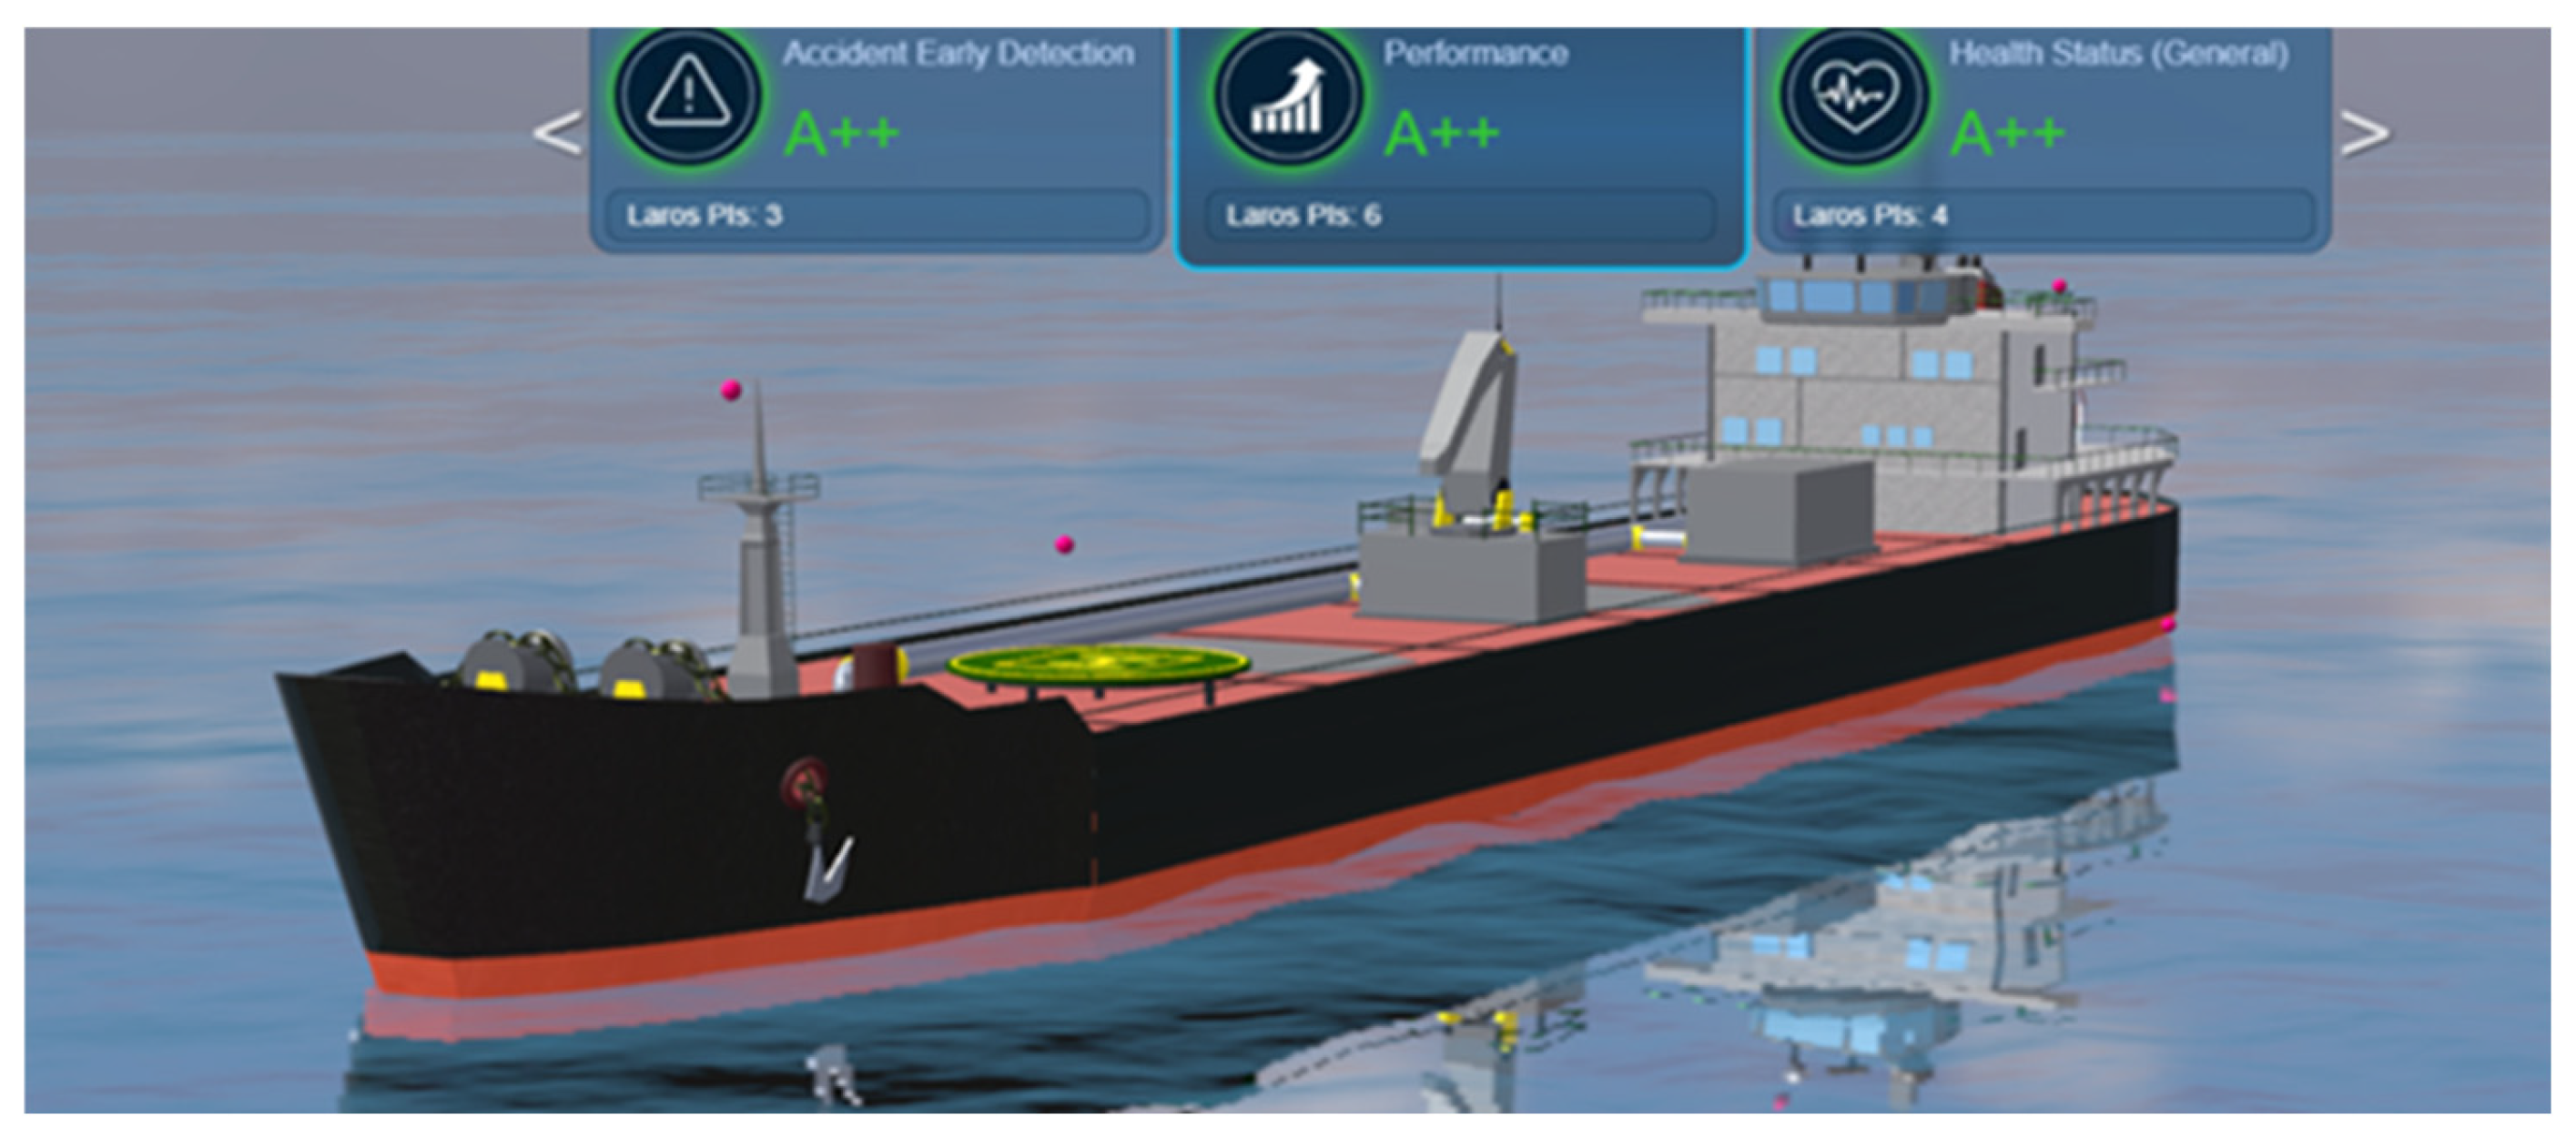

Disclaimer/Publisher’s Note: The statements, opinions and data contained in all publications are solely those of the individual author(s) and contributor(s) and not of MDPI and/or the editor(s). MDPI and/or the editor(s) disclaim responsibility for any injury to people or property resulting from any ideas, methods, instructions or products referred to in the content. |
© 2025 by the authors. Licensee MDPI, Basel, Switzerland. This article is an open access article distributed under the terms and conditions of the Creative Commons Attribution (CC BY) license (https://creativecommons.org/licenses/by/4.0/).