Abstract
Waterborne transportation serves as a critical pillar of trunk-line freight systems, offering unparalleled advantages in transport capacity, energy efficiency, and cost-effectiveness. As cargo throughput demands escalate, optimizing lock capacity becomes imperative. This study investigates ship sinkage dynamics through computational fluid dynamics (CFD) simulations for a representative inland cargo vessel navigating the Three Gorges on the Yangtze River. We develop a predictive sinkage model that integrates four key hydrodynamic parameters: ship velocity, draft, water depth, and bank clearance, applicable to both open shallow water and lockage conditions. The model enables determination of maximum safe drafts for lock transit by analyzing upstream/downstream water levels and corresponding chamber depths. Our results demonstrate the technical feasibility of enhancing single-lock cargo capacity while maintaining safety margins. These findings provide (1) a scientifically grounded framework for draft control optimization, and (2) actionable insights for lock operation management. The study establishes a methodological foundation for balancing navigational safety with growing throughput requirements in constrained waterways.
1. Introduction
Waterway transport is a cornerstone of trunk-line freight transportation, distinguished by its high capacity, low energy consumption, and cost-effectiveness. The Yangtze River, one of the world’s busiest inland waterways, has the Three Gorges (as shown in Figure 1) at its middle reaches, serving as the core hub of China’s inland waterway system. In 2021, the Three Gorges Ship Lock facilitated 10,100 lock cycles and 40,400 vessel passages, marking a 6.83% year-on-year increase. By 2022, these figures rose to 10,400 cycles and 41,600 vessel passages, with a freight volume of 156 million tons, reflecting a 6.78% growth from the previous year [1]. Projections indicate that annual cargo throughput will approach 200 million tons by 2025 and surpass 250 million tons by 2030.
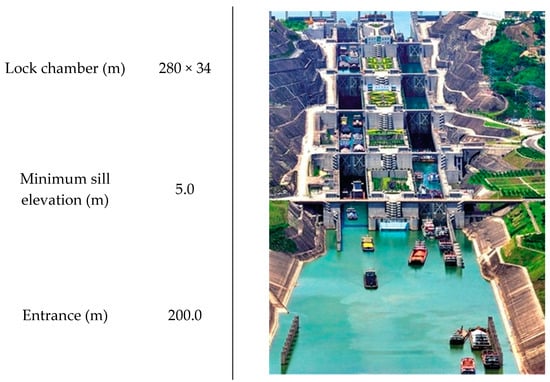
Figure 1.
Dual-line five-stage consecutive ship lock system in the Three Gorges Ship Lock.
To meet the growing demand for enhanced lock passage capacity, optimizing the daily number of lockage operations and cargo carriage is essential. At the same time, the Three Gorges Ship Lock benefits from a robust management system and systematic vessel scheduling; maximizing cargo capacity remains critical. Given the constraints of ship dimensions and lock chamber size, optimizing ship draft in relation to hydrological conditions and lock chamber characteristics offers a viable solution. During lock passage, insufficient underkeel clearance (UKC) risks vessel grounding, whereas excessive UKC reduces lock capacity. Therefore, maintaining optimal UKC, considering lock sill water depth, is crucial for ensuring navigational safety and maximizing lock capacity.
Ship sinkage is a key hydrodynamic problem of ships in restricted waters [2], which can be estimated using empirical methods or calculated through numerical simulations. Wang et al. [3] conducted a comprehensive study based on actual ship lift operations, identifying primary factors influencing vessel squat during lift chamber entry and exit. They proposed a prediction formula and provided normative recommendations for water-depth-to-draft ratios and draft control standards. Tan et al. [4] applied spline interpolation to regress measured ship draft and cargo load data from the Three Gorges Locks, analyzing relationships among maximum ship draft, rated tonnage, and actual cargo tonnage. Their work derived an expression for permissible maximum draft relative to lock sill water depth, guiding optimal draft settings for transiting ships.
Serban et al. [5] compared ship sinkage prediction models, including Millward, Barrass, Eryuzlu, and ICORELS [6] methods, and evaluated their applicability to maximum cargo ship sinkage under channel conditions. Almström et al. [7] performed multiple regression analyses on water level data from two adjacent locations along the Furusund channel in the Stockholm Archipelago, developing models for ship wave and attitude prediction. Verwilligen et al. [8] integrated multi-source environmental data, including tidal variations, current flows, wave conditions, water depth, and AIS information, to study vertical ship motions under steady-state and unsteady-state conditions. Their research explored relationships between vertical motion, ship sinkage, hydrostatic pressure, seakeeping performance, maneuverability, and ship-to-ship interactions. Delefortrie et al. [9] developed a modified ship squat calculation method for partially dredged channels, incorporating seabed silt effects based on ship model towing tests.
Numerous numerical simulations have investigated ship sinkage, attitudes, and resistance characteristics, employing methods such as Rankine source Green’s function [10], slender body theory, empirical formulas [11], and Reynolds-Averaged Navier-Stokes (RANS) methods [12,13,14]. Miao et al. [15] studied ship sinkage for 1000 to 3000 DWT ships under varying channel widths, water depths, and ship speeds, proposing a modified sinkage prediction model incorporating ship block coefficient, speed, and blockage ratio. Elsherbiny et al. [16] used slender body theory and empirical formulas to examine the effects of speed, water depth, and ship-to-bank clearance on the sinkage characteristics of a scaled KCS model. Kaidi et al. [17] employed the volume of fluid (VOF) method to investigate the effects of mud properties, mud layer thickness, and UKC on ship resistance and squat in muddy seabed environments. Debaillon et al. [18] developed a physics-based modeling system to replicate ship navigation processes, incorporating hydrodynamic performance metrics such as sinkage, resistance, and maneuverability, validated through full-scale trials and empirical formulas.
In short, Empirical methods offer fast approximation solutions with compromised predictive accuracy, experimental methods provide high accuracy with significant cost, and computational fluid dynamics (CFD) strikes a balance between accuracy and cost while providing detailed process insights. Current research primarily focuses on ship hydrodynamic performance and flow details in open water, harbor approach channels, and canals, with less emphasis on draft control optimization for improving lock passage capacity, particularly regarding hydrodynamic forces and attitude variations.
This study is structured as follows: First, numerical setups are validated against benchmark towing tank tests to ensure reliability before conducting a series of CFD simulations. Using these validated methods, comprehensive studies are performed on a typical inland cargo ship, operating in Yangtze River, under open shallow water and lockage conditions. Hydrodynamic performance, including resistance, sinkage, and free-surface flow characteristics, are analyzed. A sinkage prediction model is then developed, incorporating critical factors such as ship velocity, draft, water depth, and bank clearance. Finally, taking the Three Gorges Ship Lock as a case study, the maximum safe draft for ship passage is estimated and analyzed, considering upstream and downstream water levels and corresponding lock chamber water depths.
2. Numerical Methods and Study Outlines
2.1. Numerical Methods
In this study, computational simulation platform FLOW-3D [19] is employed to model the ship straight sailing motion, and obtain resistance characteristics and evoked attitude amplitudes. To simulate the motion of a ship in Cartesian cells, the FAVOR (Fractional Area-Volume Obstacle Representation) method is used to represent the interface between the ship and water, which brings a source term into the governing equations. Under the viscous and incompressible assumption of water, the continuity equation is expressed as follows:
where (u, v, w) and (Ax, Ay, Az) denote the velocity vector and fluid area fraction on x, y, z directions, respectively. RSOR is the mass source term related to the ship motion, and ρ is the fluid density.
The momentum conservation equations are expressed as follows:
where t is the time, VF the fluid volume fraction, p the pressure, ρ the fluid density, g the gravity acceleration, (fx, fy, fz) the viscous force term, (uw, vw, ww) the velocity of the mass source at the interface of ship and water.
To quantify the flow field around the full-scale ship, RNG k-ε turbulence model is adopted for governing equation closure, and the finite difference method is utilized to discretize the governing equation. All numerical simulations are transient, and the maximum Courant number is 1.0; the numerical time step is adaptive.
2.2. Studied Ships and Computational Cases
This study takes the model-scale DTMB-5415 [20] and a full-scale inland cargo ship as research subjects. Initially, a DTMB-5415 model with a scale ratio of 24.83, supported by accessible experimental data, is analyzed to validate the effectiveness and accuracy of the numerical methods employed. Subsequently, a series of CFD simulations is conducted on a full-scale 5000-ton cargo ship navigating the Yangtze River to investigate the effects of draft (T), velocity (U), water depth (h), and bank clearance (yB) on ship resistance characteristics and sinkage variations. Based on these findings, a sinkage prediction model is developed for the target ship. The principal dimensions of the studied ships and the CFD simulation matrix are presented in Table 1 and Table 2.

Table 1.
Main dimension of the studied ships.
Table 2.
CFD matrix.
2.3. Validation of Numerical Methods
Since the resistance and sinkage amplitudes of the studied ship at constant speeds are focused, a mesh convergence study is adopted. Comparisons of resistance components and free-surface layout, of a model-scale DTMB-5415, between experimental measurement and numerical simulations are conducted, to validate the adopted numerical setups.
Based on the ITTC recommended CFD procedures [21] and working scenario, a rectangular calculation domain is modeled. Overall description of the calculation domain and boundary conditions is shown in Table 3.
Table 3.
Calculation domain setups and boundary conditions.
In this work, dynamic motion of the ship is directly simulated, namely, the ship sails in the pre-set calculation domain. For the capture of flow details around the ship hull, a refinement block, with X [−0.75 Loa, 3.0 Loa], Y [0, 0.5 Loa], Z [−0.07 Loa, 0.035 Loa], is set, and a gradient grid size is applied to the far-field regions. In the grid convergence study, the mesh density of the refinement block is set with a growth ratio of . The mesh details under different mesh resolutions are shown in Figure 2.
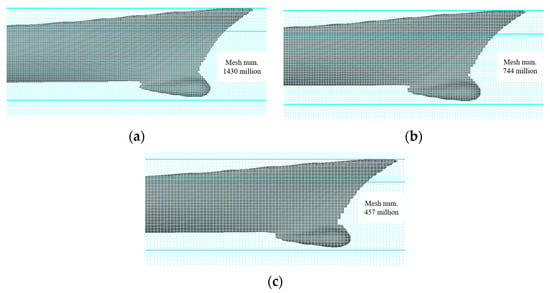
Figure 2.
Mesh details around the ship hull under different mesh densities. (a) Mesh density S1, basic size = 0.015 m. (b) Mesh density S2, basic size = 0.021 m. (c) Mesh density S3, basic size = 0.03 m.
Comparisons between the EFD data and CFD simulations are listed in Table 4, where EFD is the acronym of experimental fluid dynamics, and CFD is the acronym of computational fluid dynamics. It is found that the finest mesh indicates better accuracy on the ship resistance, while the moderate mesh density also presents satisfactory results with only half the amount of the fine mesh condition. Moreover, with the mesh density S2, the wave elevation on the free-surface complies with the EFD observations, as shown in Figure 3.
Table 4.
Comparison of resistance components between EFD and CFD.
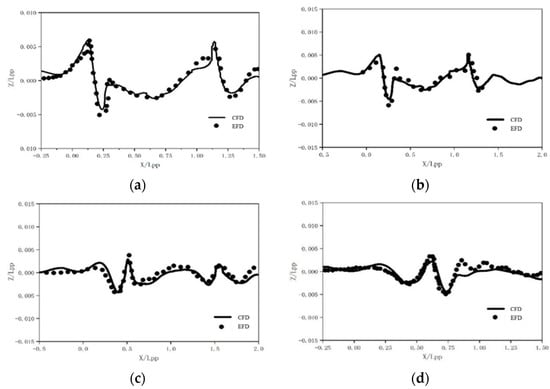
Figure 3.
Wave elevation at different longitudinal sections. (a) y/Loa = 0.082. (b) y/Loa = 0.0965. (c) y/Loa = 0.172. (d) y/Loa = 0.232.
As listed in Table 4, the result of the convergence factor presents monotonic convergence. Hence, it is concluded that the adopted numerical setup could obtain the ship hydrodynamic characteristics. Such methods are used to calculate the ship resistance and sinkage under open shallow water and lockage conditions.
3. Results Analyses
The hydrodynamic behavior of a ship in lockage conditions shares similarities with open shallow water conditions, particularly in the vertical direction. Studying ship resistance and sinkage in open shallow water provides valuable insights for analyzing ship attitude variations during lockage. In this section, we first investigate the resistance and squat characteristics of the target inland cargo ship under open shallow water conditions before extending the analysis to lockage scenarios. Key influencing factors—including velocity, water depth, ship draft, and bank clearance—are systematically evaluated to assess their effects on ship resistance and squat.
3.1. Ship in Open Shallow Water Conditions
Direct simulations on ship straight ahead are performed. Detailed numerical methods have been discussed in Section 2.3. The outline of the calculation domain and mesh alignments are illustrated in Figure 4.
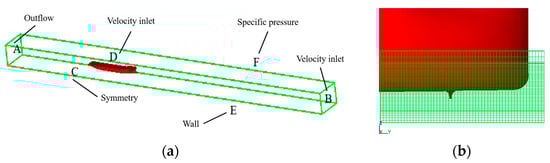
Figure 4.
Calculation domain and mesh details around ship hull under open shallow water. (a) Calculation domain and boundary conditions. (b) Transverse mesh details.
In this work, the sinkage of the ship is calculated based on the hydrodynamic forces in the vertical direction as follows:
where σ indicates the average sinkage, Z represents the average hydrodynamic force in the vertical direction, ρ is the fluid density, and As is the wetted surface area of the ship.
3.1.1. Effects of Velocity
Figure 5 presents the squat characteristics of the cargo ship under varying water depths and draft conditions. The results demonstrate that the magnitude of ship squat increases with sailing velocity, while shallower water depths and larger drafts lead to more pronounced sinkage. The study covers water depth-to-draft ratios ranging from 1.22 to 1.6, corresponding to very shallow water conditions. Notably, under open shallow water conditions, the speed-induced sinkage remains at the centimeter level, a variation deemed acceptable from the perspective of lockage safety management.
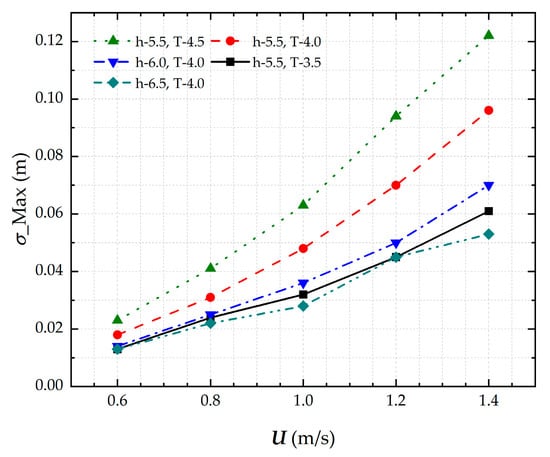
Figure 5.
Maximum sinkage of ship under different sailing speeds in open waters.
3.1.2. Effects of Water Depth
Figure 6 presents the squat characteristics of the cargo ship under varying speed conditions at different water depths. The results show that for a fixed ship draft (T = 4.0 m), squat decreases as water depth increases, with water depth-to-draft ratios ranging from 1.375 to 1.625. This demonstrates that under open shallow water conditions, water depth variations induce centimeter-level sinkage magnitude changes for the 5000-tonnage inland cargo ship.
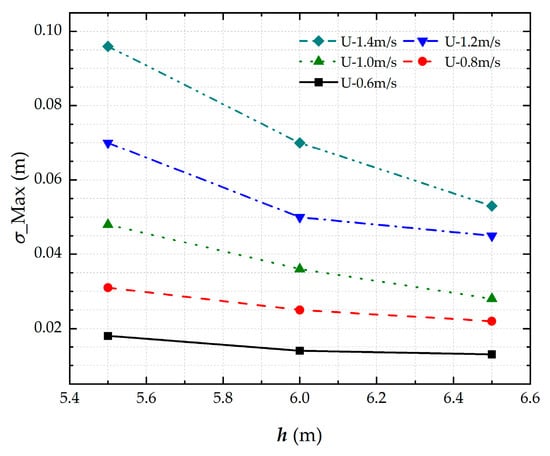
Figure 6.
Maximum sinkage of ship in open waters of different water depths.
3.1.3. Effects of Ship Draft
Figure 7 presents the squat characteristics of the cargo ship under varying speed conditions for different ship drafts. With a fixed water depth (h = 5.5 m), the results demonstrate that squat increases with ship draft, covering water depth-to-draft ratios from 1.22 to 1.57. This observation aligns with established hydrodynamic principles. Notably, under open shallow water conditions, meter-scale variations in ship draft produce centimeter-level squat magnitudes, which fall within the safe navigation requirements.
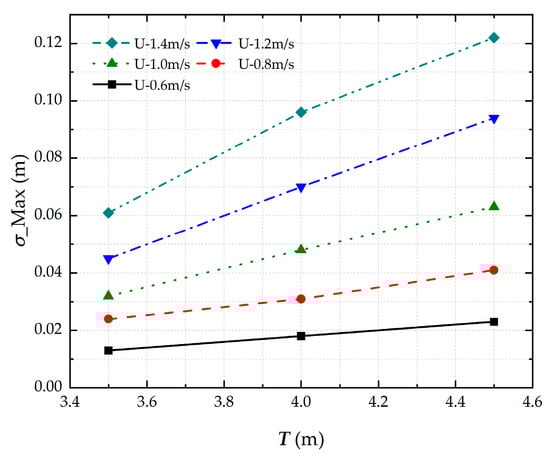
Figure 7.
Maximum sinkage of ship under different sailing draught in open waters.
3.1.4. Development of Flow Field Around Ship Hull
The pressure distribution reveals the hull stress conditions during navigation and provides valuable reference data for structural stress analysis. As the studied cases exhibit similar pressure patterns, we selected the representative condition (U = 1.0 m/s, h = 5.5 m, T = 4.0 m) to illustrate the free surface pressure development. The detailed pressure distribution is presented in Figure 8.
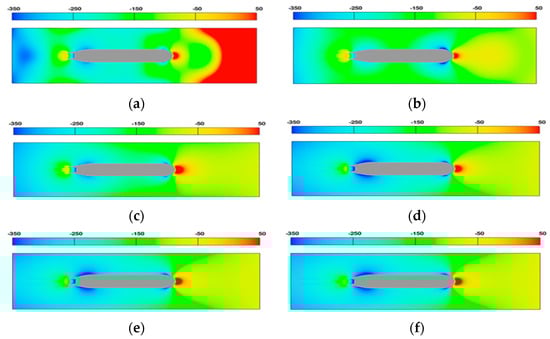
Figure 8.
Pressure distribution on free surface. (a) t = 10 s. (b) t = 20 s. (c) t = 30 s. (d) t = 40 s. (e) t = 50 s. (f) t = 60 s.
The pressure distribution around the hull demonstrates distinct temporal evolution characteristics. During the initial 10–20 s period, it exhibits continuous instability; transitional stabilization emerges in the pressure field between 30 and 40 s; and a quasi-steady flow regime develops when time exceeds 40 s. The resulting flow field maintains symmetry about the hull’s longitudinal center plane, with comparative analysis revealing that the bow section sustains relatively higher pressure magnitudes than those observed during the initial unstable phase.
3.2. Ship in Lockage Conditions
During lock transit operations, bank clearance emerges as a critical parameter that significantly influences ship hydrodynamics. The confined waterway geometry not only increases frictional resistance but also, through its interaction with water depth and draft variations, creates hydrodynamic characteristics distinct from open shallow water conditions. This subsection presents numerical simulations of lock entry maneuvers, systematically analyzing the effects of navigation speed, water depth, ship draft, and bank clearance on resistance and sinkage characteristics.
The study employs numerical simulation of both straight-ahead motion and lock entry scenarios, following the computational methodology detailed in Section 2. Figure 9 illustrates the computational domain configuration and mesh arrangement used in these simulations.
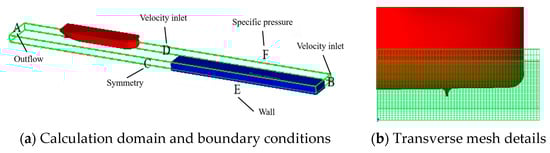
Figure 9.
Calculation domain and mesh details around ship hull under lockage conditions.
3.2.1. Effects of Velocity
Figure 10 presents the speed-dependent squat characteristics of the cargo ship under varying hydrodynamic conditions, including water depth, draft, and bank clearance. The results clearly demonstrate a positive correlation between ship speed and squat magnitude. More significantly, the analysis reveals that restricted under-keel clearance (shallower water depth relative to draft) and reduced bank clearance both contribute to substantially increased sinkage. These findings highlight the compounded effect of confined waterway geometry on ship hydrodynamics during navigation.
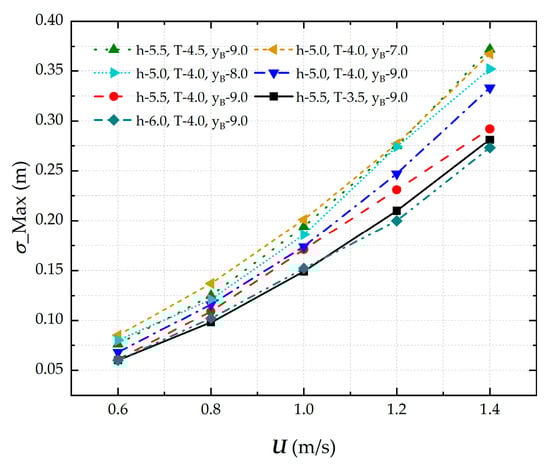
Figure 10.
Maximum sinkage of ship under different sailing speeds in confined waters.
3.2.2. Effects of Water Depth and Ship Draft
Figure 11 presents the water depth- and draft-dependent squat characteristics of the cargo ship under varying speed conditions. The results demonstrate three key findings as follows: (1) squat magnitude increases proportionally with ship velocity; (2) a strong negative correlation exists between water depth and squat; and (3) squat shows a positive correlation with ship draft. These relationships confirm that reduced under-keel clearance (shallower water depth relative to draft) leads to significantly greater ship sinkage. However, despite meter-scale variations in ship draft, the resulting squat remains constrained to centimeter-level magnitudes, indicating that while the relative effects are substantial, the absolute sinkage values remain operationally manageable.
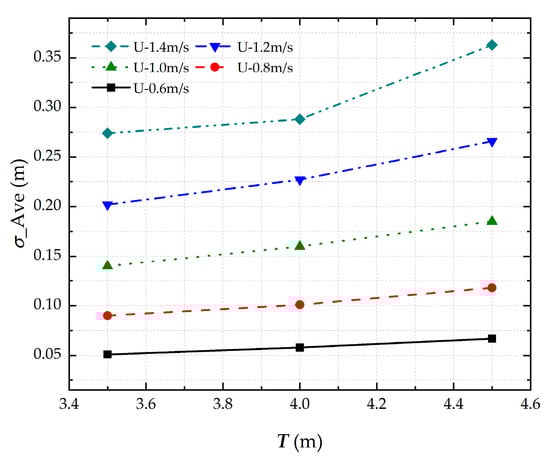
Figure 11.
Maximum sinkage of ship under different sailing draughts in confined waters.
3.2.3. Effects of Bank Clearance
Figure 12 illustrates the ship draft-dependent squat characteristics under varying bank clearance conditions, with fixed water depth (h = 5.0 m) and ship draft (T = 4.0 m). The analysis reveals three significant relationships as follows: (1) ship sinkage exhibits a positive correlation with bank clearance; (2) reduced bank clearance necessitates greater water depth to maintain safe navigation during lockage; and (3) for any given bank clearance, increased ship velocity results in proportionally greater sinkage. These findings demonstrate the critical interplay between lateral confinement (bank clearance) and vertical clearance (water depth) in determining ship squat behavior during lock transit operations.
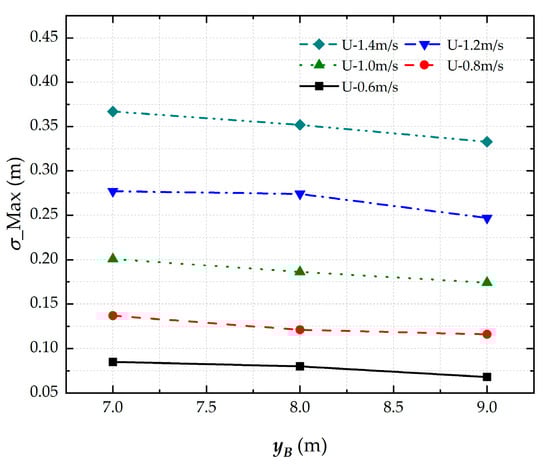
Figure 12.
Maximum sinkage of ship under different bank clearances in confined waters.
3.2.4. Development of Flow Field Around Ship Hull
Since the pressure distribution of the studied working conditions presents similarities, the ‘U-1.0 m/s, h-5.5 m, T-4.0 m, yB-9.0 m’ case is selected to depict the pressure development on the free surface and indicate the dynamic stress conditions of the lockage entry condition. The details are shown in Figure 13.
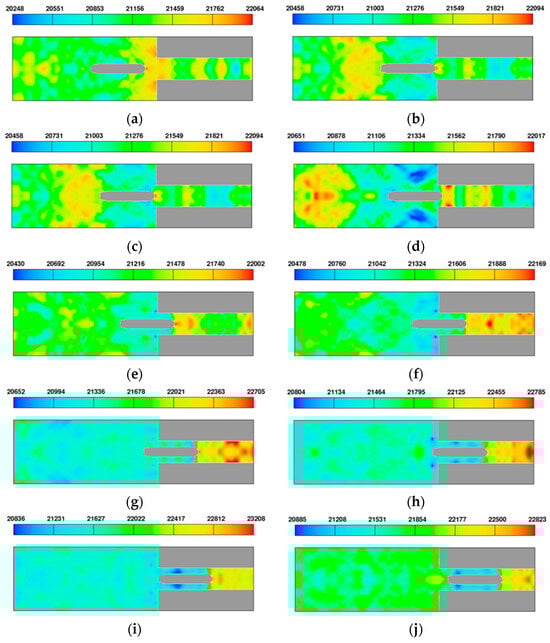
Figure 13.
Pressure distribution on free surface. (a) Ready to get into the chamber. (b) Bow is about to get into the chamber. (c) Bow starts to get into the chamber. (d) Bow gets into the chamber. (e) 1/3 Loa of Hull gets into the chamber. (f) 1/2 Loa of Hull gets into the chamber. (g) 2/3 Loa of Hull get into the chamber. (h) Stern is about to get into the chamber. (i) Stern gets into the chamber. (j) The entire hull gets into the chamber.
Figure 13a,b demonstrates that as the hull approaches the lock chamber entrance, the surrounding flow field exhibits patterns similar to the initial 20 s under open shallow water conditions, though with distinct fluid accumulation within the chamber. The hydrodynamic evolution during entry reveals three key stages as follows: (1) during initial bow entry (Figure 13c,d), a significant pressure increase occurs that persists until approximately 2/3 Loa of the hull enters; (2) subsequent stern entry results in a moderate pressure decrease while maintaining elevated levels; and (3) upon complete entry (Figure 13i,j), the pressure distribution stabilizes with sustained high pressure at the bow and gradual equilibration to initial channel pressure near the stern. These observations highlight the dynamic pressure variations during the entire lock entry process.
4. Ship Sinkage Prediction and Draft Control Optimization
This section establishes ship sinkage prediction models for both open shallow water and lockage conditions, developed from simulation-derived sinkage data incorporating key hydrodynamic parameters, including ship speed, water depth, draft, and bank clearance. Building upon these models, we propose a draft control optimization framework specifically tailored to the unique hydrological characteristics of the Three Gorges waterway, addressing the critical need for navigational safety and efficiency in this constrained environment.
4.1. Ship Sinkage Prediction Model
The sinkage prediction models were developed using First Optimization, a mathematical optimization suite, to perform multivariate nonlinear regression fitting on the simulation-derived dataset. The fitting procedure employed a global optimization algorithm with randomized initial values to ensure robust convergence to the optimal solution.
For the open shallow water condition, the regression equation is parameterized by ship speed, water depth, and ship draft, and is concluded as follows:
where σ indicates the average sinkage, h represents the water depth, v is ship velocity, T is ship draft, and a0, a1, a2, a3 are the coefficients.
The nonlinear regression analysis achieved convergence after 1316 iterations, demonstrating excellent model performance with the following statistical metrics: root mean square error (RMSE) = 2.22 × 10⁻³, residual sum of squares (RSS) = 1.24 × 10⁻⁵, Pearson’s correlation coefficient (R) = 0.996, squared correlation coefficient (R2) = 0.997, and coefficient of determination = 4.00 × 10⁻³. The complete fitting results are presented in Table 5, confirming the model’s high predictive accuracy and robust fitting quality.
Table 5.
Results of open-shallow-water regression fitting formula coefficients.
And hence, Equation (4) could be expressed as:
For the lockage condition, the regression equation is parameterized by ship speed, water depth, ship draft, and bank clearance, and is formed as follows:
where σ indicates the average sinkage, h represents the water depth, v is ship velocity, T is ship draft, yB is bank clearance, and k0, k1, k2, k3, k4 are the coefficients.
The nonlinear regression successfully converged after 5001 iterations, indicating outstanding model performance with the following statistical metrics: root mean square error (RMSE) = 8.0 × 10⁻³, residual sum of squares (RSS) = 2.32 × 10⁻³, Pearson’s correlation coefficient (R) = 0.996, squared correlation coefficient (R2) = 0.992, and coefficient of determination = 0.992. The detailed fitting results presented in Table 6 demonstrate the model’s strong predictive capability and excellent goodness-of-fit.
Table 6.
Results of lockage-condition regression fitting formula coefficients.
And hence, Equation (6) could be expressed as follows:
4.2. Ship Draft Control Optimization
In this section, ship sinkage prediction models upon open shallow water and lockage conditions are established, based on the sinkage source data obtained by previous simulations, and the parameters of ship speed, water depth, ship draft, and bank clearance are included. Furthermore, ship draft control optimization is proposed, concerning the hydrological conditions of the Three Gorges.
The minimum lock sill water depth (hL) is highly correlated to the upper and lower pool levels. In accordance with the water level fluctuation pattern, the annual operation of the Three Gorges Ship Lock is categorized into four distinct periods, the decision flow is illustrated in Figure 14.
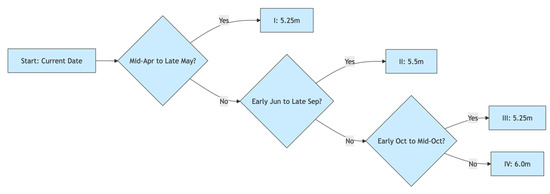
Figure 14.
Decision flow chart for the minimum flock still water depth for different seasons.
Upon the minimum water depth, the satisfied maximum ship drafts are calculated by the obtained sinkage prediction model, and accordingly, the draft control standards for vessels transiting locks are proposed. The draft control standard is directly determined by the ship sinkage and underkeel clearance:
where h indicates the safety lock sill water depth, T the ship draft, σ the ship sinkage, and ΔH the underkeel clearance. For ship safety and maneuverability, ΔH in the present work is set as 0.5 m.
Velocity of the transiting ships is stipulated to be maintained under 1.0 m/s, and for the mooring shift in the chamber, ship speed should not exceed 0.6 m/s. Take the higher speed constraint, 1.0 m/s, as studied ship speed to calculate the satisfied maximum ship sinkage, under different lock sill water depths (5.0 m, 5.25 m, 5.5 m, and 6.0 m). The results are summarized in Table 7.
Table 7.
Results of ship sinkage under different lock sills.
In conclusion, as for the studied typical cargo ship in the Three Gorges Ship Lock, it is safe for the lock transition ship to enter the lock chamber, as the water depth to draft ratio is regulated within 1.2. The results are shown in Table 8.
Table 8.
Draft control standards under different lock sill water depths.
The upper and lower pool levels of the Three Gorges Reservoir are affected by the hydropower peak load regulation, which may lead to an insufficiency in the draft control standards. And hence, from the view of reservoir operation and management, dynamic draft control standards should be set by ship masters and operators as follows:
- (1)
- In period I and III, a minimum lock sill water depth of 5.25 m is guaranteed under all possible upper and lower pool level combinations.
- (2)
- The Yangtze River flood season occurs in period II, as the upper pool level higher than 146 m, the minimum lock sill water depth should be controlled at 5.5 m; as the upper pool level lower than 146 m, or the lower pool level lower than 64 m, the minimum lock sill water depth is lower than 5.5 m, and the allowable ship draft should be constrained to 4.0 m.
- (3)
- In period IV, as the lower pool level is lower than 64 m, the minimum lock sill water depth is lower than 6.0 m, and the allowable ship draft should be optimized from 4.5 m to 4.3 m, or 4.0 m.
4.3. Limitation and Discussion
In this study, we employ a CFD approach to investigate the draught dynamics of a ship entering or exiting a ship lock, with the Three Gorges Ship Lock serving as the prototype system. The selected ship model is representative of typical vessels utilizing this lock, and our numerical simulations intentionally exclude environmental factors such as wind and currents to establish idealized baseline conditions. While this simplification provides fundamental insights into hydrodynamic interactions, we acknowledge that real-world operations—particularly under strong on-beam winds—impose stricter navigational constraints than those modeled here. Nevertheless, our results yield two critical contributions as follows: (1) a comprehensive dataset quantifying keel clearance requirements under controlled conditions, which can directly support the lock administration’s decision-making for safe passage thresholds; and (2) a methodological framework for sinkage prediction that balances computational efficiency with empirical accuracy.
It is essential to emphasize that the derived model coefficients are specifically calibrated for both the studied ship geometry and the Three Gorges lock chamber dimensions. Extrapolation to other lock systems would require re-evaluation of these parameters to account for differences in ship hull forms, lock geometries, and operational protocols. Future work should integrate environmental disturbances (e.g., crosswinds, currents) and transient maneuvering effects to bridge the gap between idealized simulations and real-world operational complexity. Despite these limitations, the present study establishes a validated foundation for optimizing keel clearance management in constrained waterways.
5. Conclusions
To enhance the lock passage capacity at the Three Gorges of the Yangtze River, this study employs numerical simulations to investigate and optimize draft control strategies for typical inland cargo ships. Through systematic analysis of key hydrodynamic parameters—including ship speed, water depth, draft, and bank clearance—we quantify their effects on ship sinkage during lockage operations. The results demonstrate that ship sinkage exhibits (1) a positive correlation with ship speed and draft, and (2) a negative correlation with water depth and bank clearance.
Leveraging these findings, we develop a predictive sinkage model that integrates ship speed and critical waterway parameters to estimate average squat across varying hydrological conditions. This model provides the foundation for scientifically informed draft control standards, offering actionable guidance to both reservoir managers and ship operators to simultaneously improve navigational safety and maximize lock utilization efficiency.
For future research, we identify two priority directions: (1) refinement of hydrodynamic performance models under transient speed conditions, and (2) investigation of ship maneuverability in confined waterways. These efforts will enable further optimization of the sinkage prediction framework for lockage vessels.
Author Contributions
Conceptualization, Y.Z. and Y.D.; methodology, Y.Z. and Y.D.; software, Y.Z. and Y.D.; validation, Y.Z., J.L. and S.Z.; formal analysis, Y.D.; investigation, Y.Z.; resources, Y.Z.; data curation, Y.D. and S.Z.; writing—original draft preparation, Y.Z. and Y.D.; writing—review and editing, J.L. and S.Z.; visualization, Y.D. and S.Z.; supervision, S.Z.; project administration, Y.Z.; funding acquisition, J.L. and S.Z. All authors have read and agreed to the published version of the manuscript.
Funding
This research was funded by the National Key R&D Program of China, grant number 2022YFB4301402; the National Natural Science Foundation of China, grant number 52272425; Independent Innovation Research Fund Program of Wuhan University of Technology, grant number: 104972025RSCbs0187.
Data Availability Statement
The original contributions presented in this study are included in the article. Further inquiries can be directed to the corresponding author.
Conflicts of Interest
The authors declare no conflicts of interest.
References
- Zhao, X.; Lin, Q.; Yu, H. A co-scheduling problem of ship lift and ship lock at the Three Gorges Dam. IEEE Access 2020, 8, 132893–132910. [Google Scholar] [CrossRef]
- Tuck, E.O. Hydrodynamic problems of ships in restricted waters. Annu. Rev. Fluid Mech. 1978, 10, 33–46. [Google Scholar] [CrossRef]
- Wang, X.; Sun, Z. Influencing factors of ship draught control standard based on prototype test of ship lift. J. Waterw. Harb. 2020, 41, 578–584. [Google Scholar]
- Tan, Z.; Zhang, Q.; Liu, Z. Study on vessel draft in Three Gorges Lock. Navig. China 2017, 40, 69–72. [Google Scholar]
- Serban, P.S.; Panaitescu, V.N. Comparison between formulas of maximum ship squat. Sci. Bull. Nav. Acad. 2016, 19, 105–111. [Google Scholar] [CrossRef]
- Pilot, C. Ship Squat; An Analysis of Two Approximation Formulas Using the Physics of Hydrodynamic Flow. In Proceedings of the 8th IAMU Conference 2007, Odessa, Ukraine, 17–19 September 2007; Available online: https://www.researchgate.net/publication/325261187_Ship_Squat_An_Analysis_of_Two_Approximation_Formulas_Using_the_Physics_of_Hydrodynamic_Flow_published_under_Pilot_C_2007_Ship_Squat_An_Analysis_of_Two_Approximation_Formulas_Using_the_Physics_of_Hydro (accessed on 12 January 2025).
- Almström, B.; Larson, M. Measurements and analysis of primary ship waves in the Stockholm Archipelago, Sweden. J. Mar. Sci. Eng. 2020, 8, 743. [Google Scholar] [CrossRef]
- Verwilligen, J.; Eloot, K.; Mansuy, M.; Vantorre, M. Full-scale measurements of vertical motions on ultra large container vessels in Scheldt estuary. Ocean. Eng. 2019, 188, 106264. [Google Scholar] [CrossRef]
- Delefortrie, G.; Sotelo, M.; Boucetta, D. Practical squat assessment for a ship manoeuvring in muddy environments. Appl. Ocean. Res. 2022, 123, 103181. [Google Scholar] [CrossRef]
- Ma, X.; Yu, Y.; Xi, F. Numerical calculation of ship squat in shallow water. J. Dalian Marit. Univ. 2021, 47, 20–25. [Google Scholar]
- Li, L.; Liu, D.; Yin, J.; Dai, R. Determination on safety water depth of VLCC open waters route from Laotieshan to Changxing Island. J. Shanghai Marit. Univ. 2016, 37, 1–6. [Google Scholar]
- Wu, W.; Liu, Z.; Liu, J.; Li, H. Calculation and analysis of sinkage on 400,000t ore carrier in restricted waterways. J. Wuhan Univ. Technol. (Transp. Sci. Eng.) 2020, 44, 722–727. [Google Scholar]
- Jachowski, J. Assessment of ship squat in shallow water using CFD. Arch. Civ. Mech. Eng. 2008, 8, 27–36. [Google Scholar] [CrossRef]
- Yuan, S. Numerical Prediction of Motion and Hydrodynamic Forces for A Ship Advancing in Regular Head Waves in Shallow Water. Ph.D. Thesis, Shanghai Jiaotong University, Shanghai, China, 2020. [Google Scholar]
- Miao, J.; Wu, J.; Li, X.; Wang, Y. Study on navigation subsidence of inland river ships in restricted channel. China Sci. 2021, 16, 902–905. [Google Scholar]
- Elsherbiny, K. Experimental and Numerical Analysis of the Squat and Resistance of Ships Advancing Through the New Suez Canal. Ph.D. Thesis, University of Strathclyde, Glasgow, UK, 2020. [Google Scholar]
- Kaidi, S.; Lefrançois, E.; Smaoui, H. Numerical modelling of the muddy layer effect on ship’s resistance and squat. Ocean. Eng. 2020, 199, 106939. [Google Scholar] [CrossRef]
- Debaillon, P. Numerical Investigation to Predict Ship Squat. J. Ship Res. 2010, 54, 133–140. [Google Scholar] [CrossRef]
- Flow-3D User Manual, (v 10.1); Flow Sciences: Leland, NC, USA, 2012.
- US Navy Combatant, DTMB 5415. Available online: http://www.simman2008.dk/5415/combatant.html (accessed on 12 January 2025).
- ITTC-Recommended Procedures and Guidelines; ITTC Quality System Manual-Recommended Procedures and Guidelines–Sloshing Model Tank; International Towing Tank Conference: Zürich, Switzerland, 2017.
Disclaimer/Publisher’s Note: The statements, opinions and data contained in all publications are solely those of the individual author(s) and contributor(s) and not of MDPI and/or the editor(s). MDPI and/or the editor(s) disclaim responsibility for any injury to people or property resulting from any ideas, methods, instructions or products referred to in the content. |
© 2025 by the authors. Licensee MDPI, Basel, Switzerland. This article is an open access article distributed under the terms and conditions of the Creative Commons Attribution (CC BY) license (https://creativecommons.org/licenses/by/4.0/).