


Floating Solar Energy Systems: A Review of Economic Feasibility and Cross-Sector Integration with Marine Renewable Energy, Aquaculture and Hydrogen


Abstract
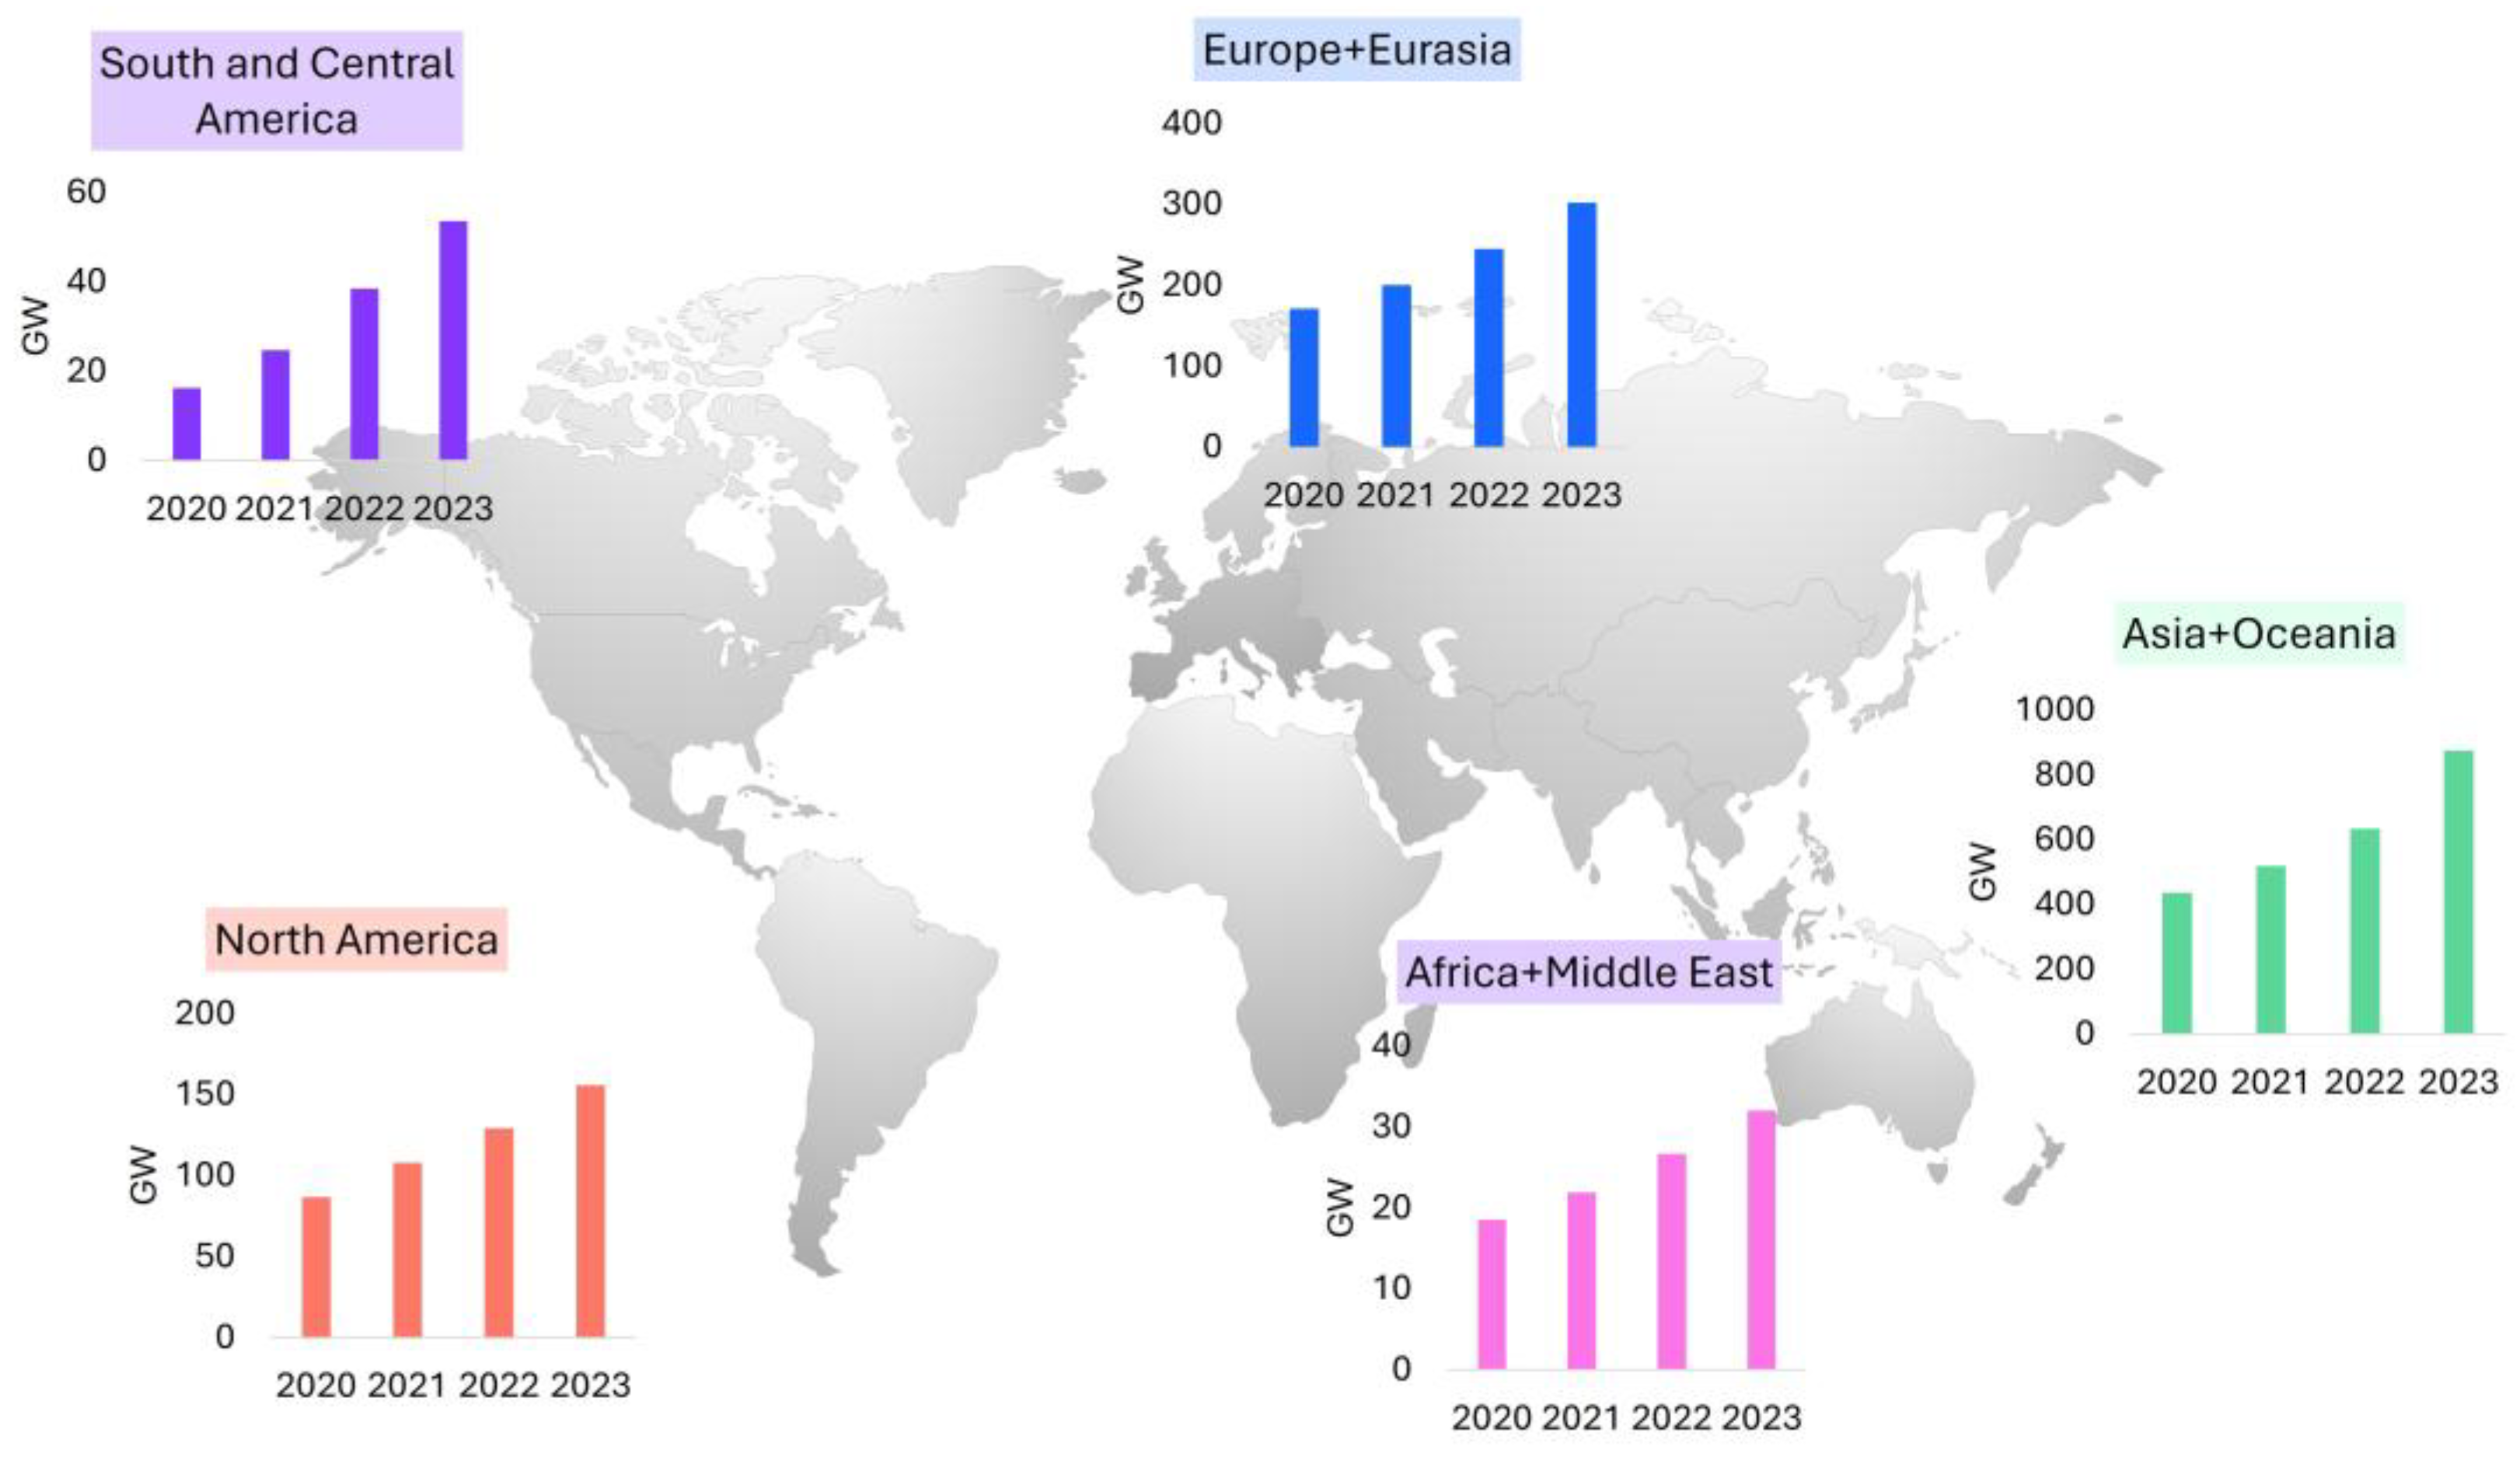
1. Introduction
1.1. State of the Art
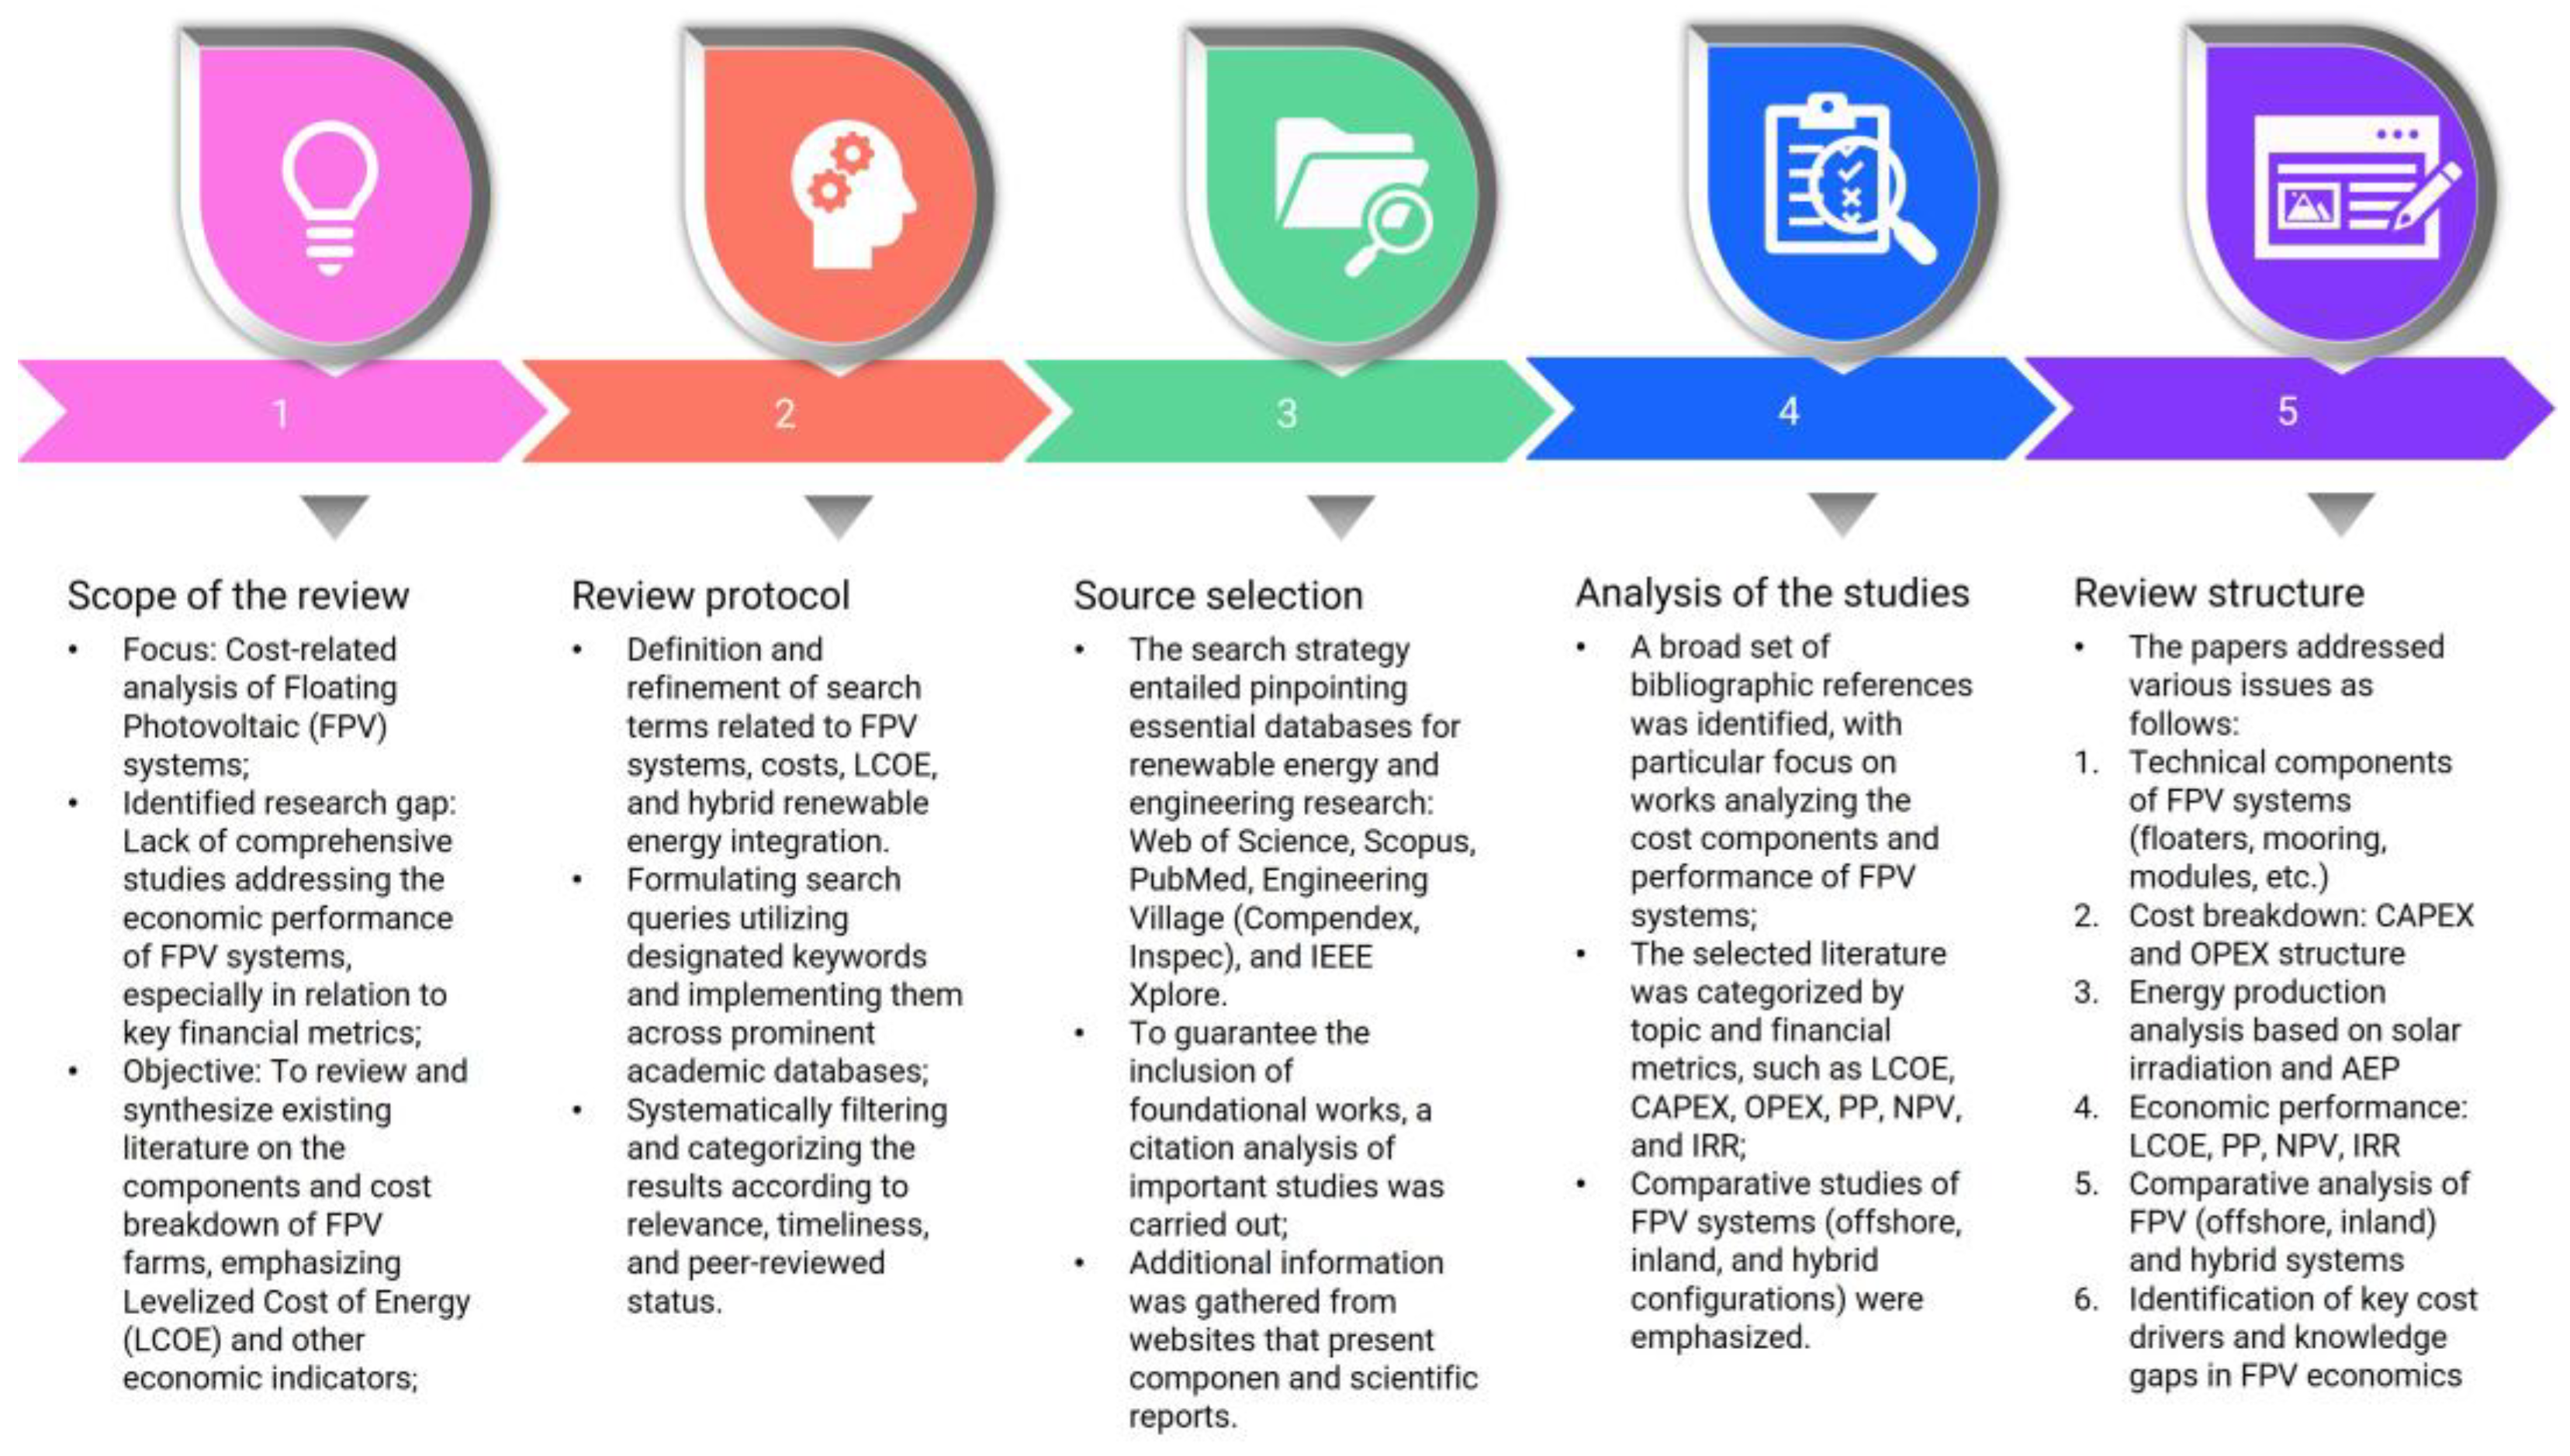
1.2. The Scope, Objectives, and Structure of the Review
1.3. Search Strategy
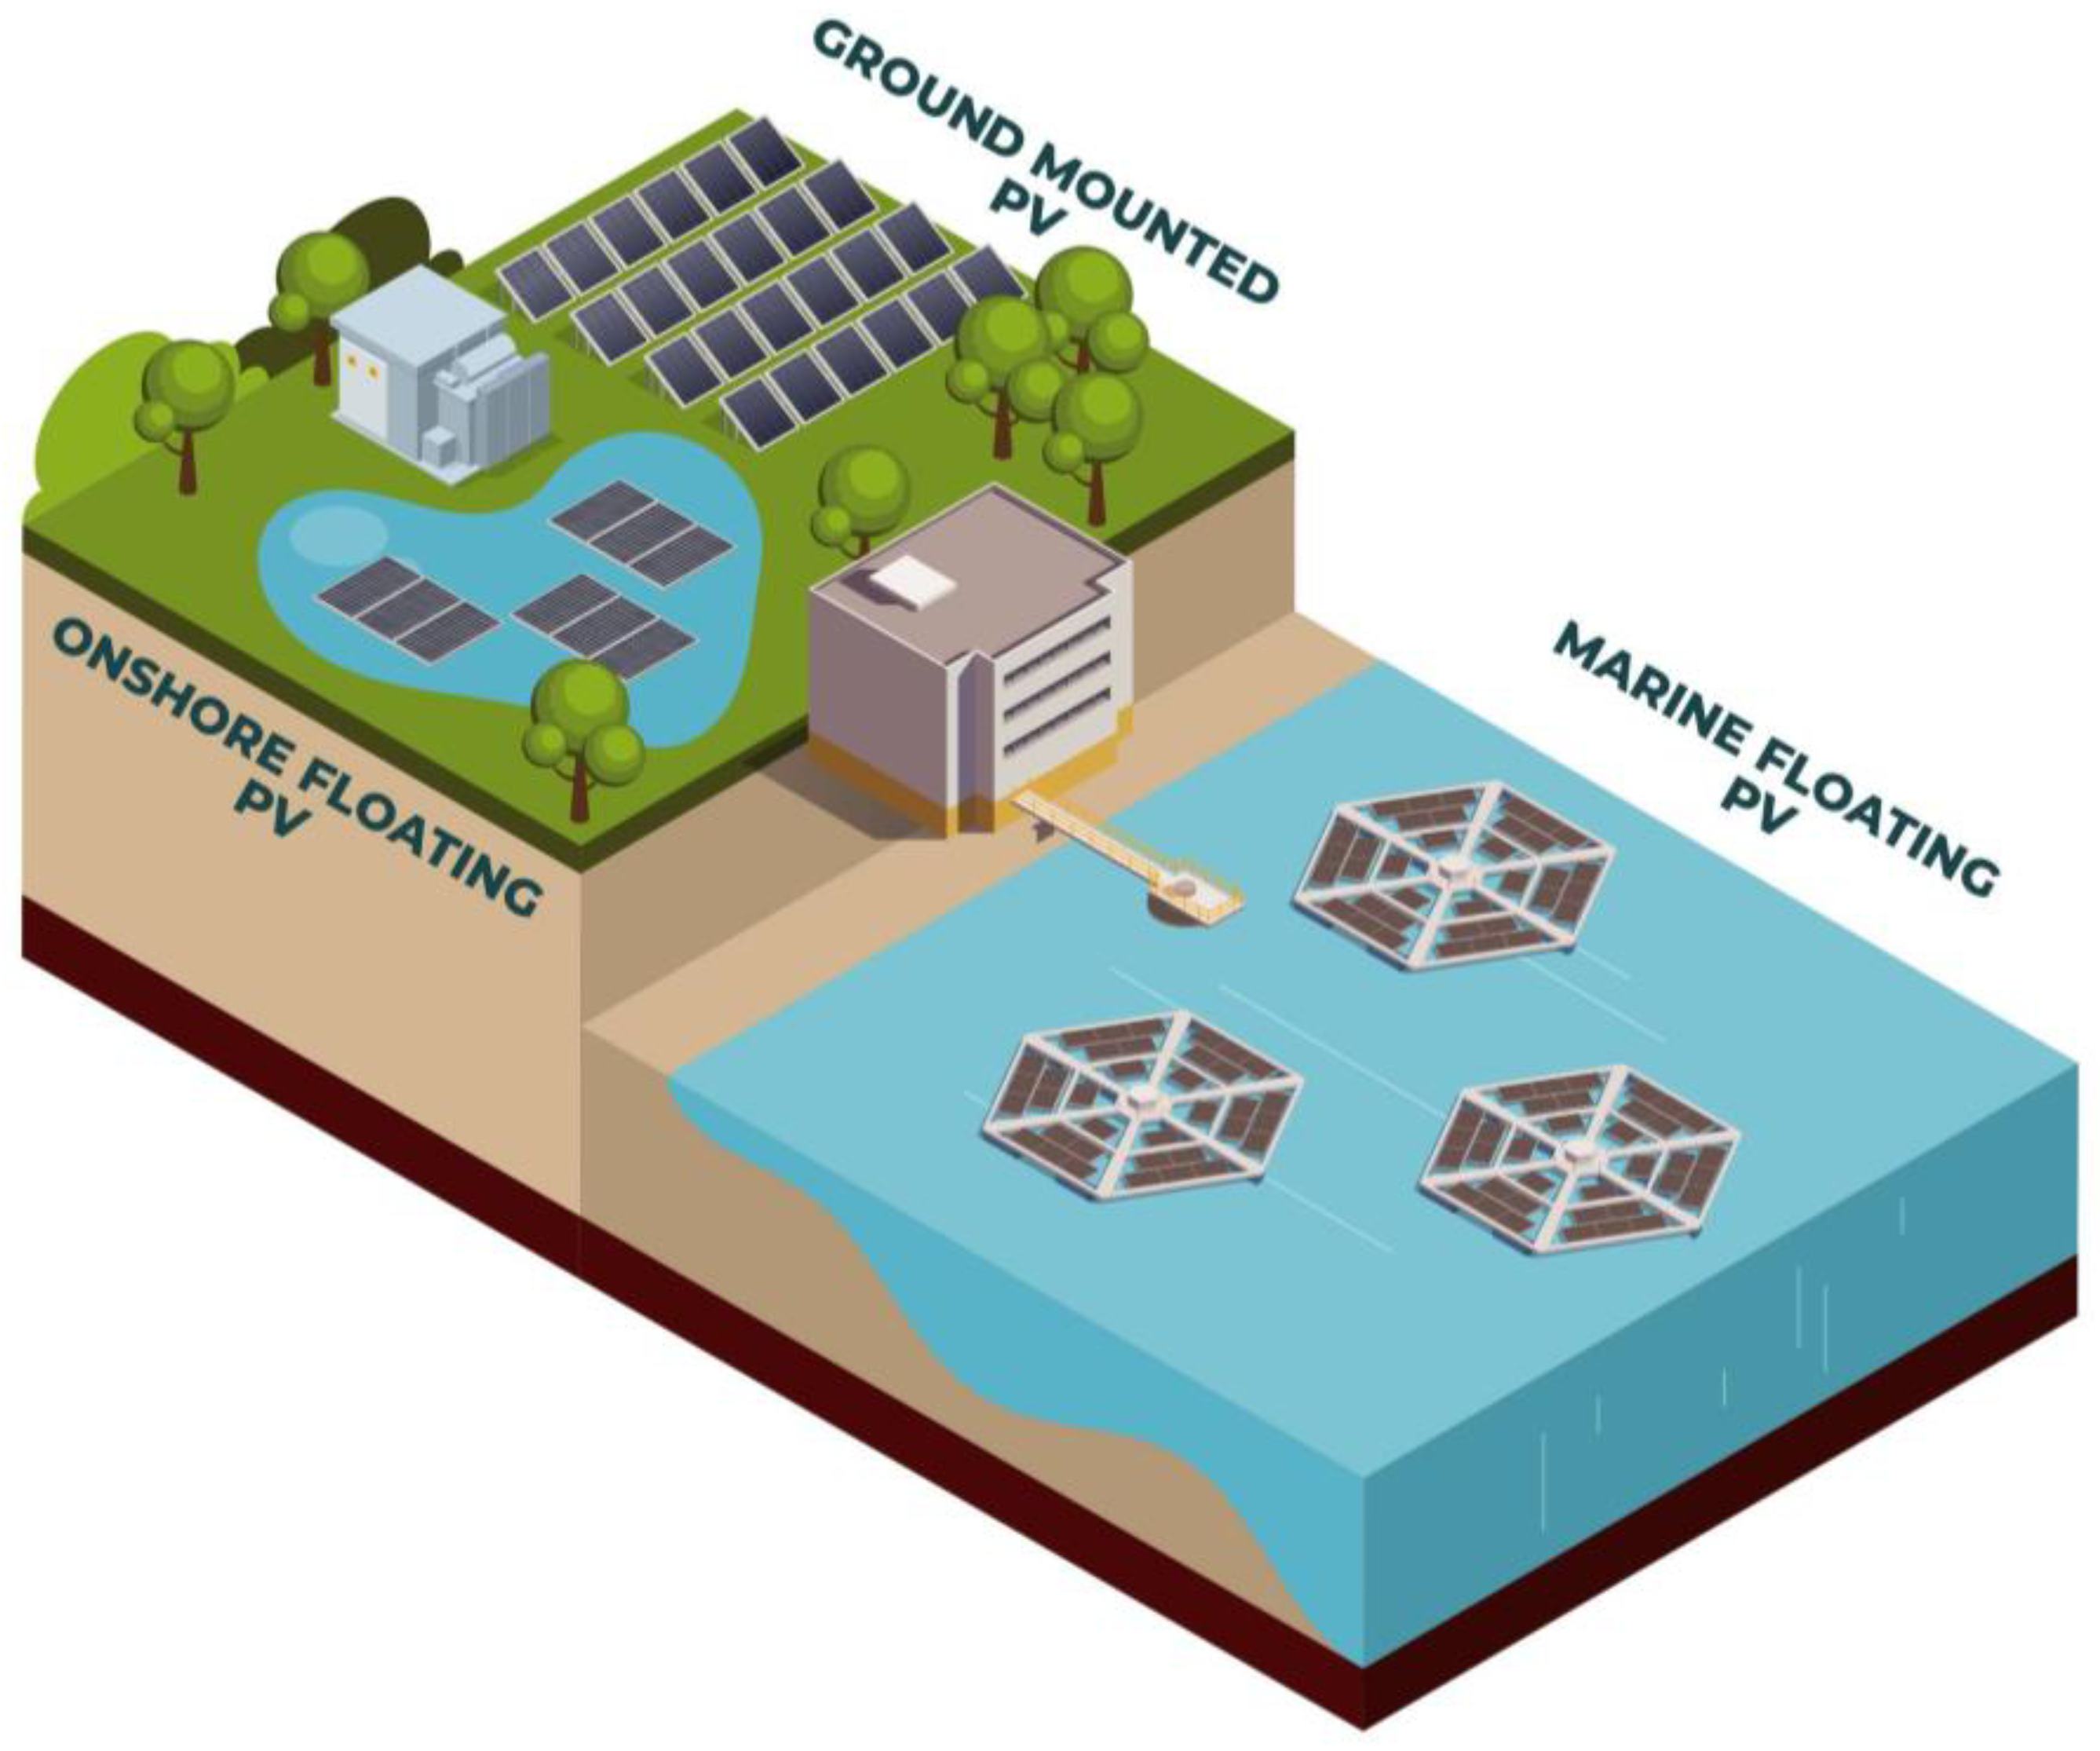
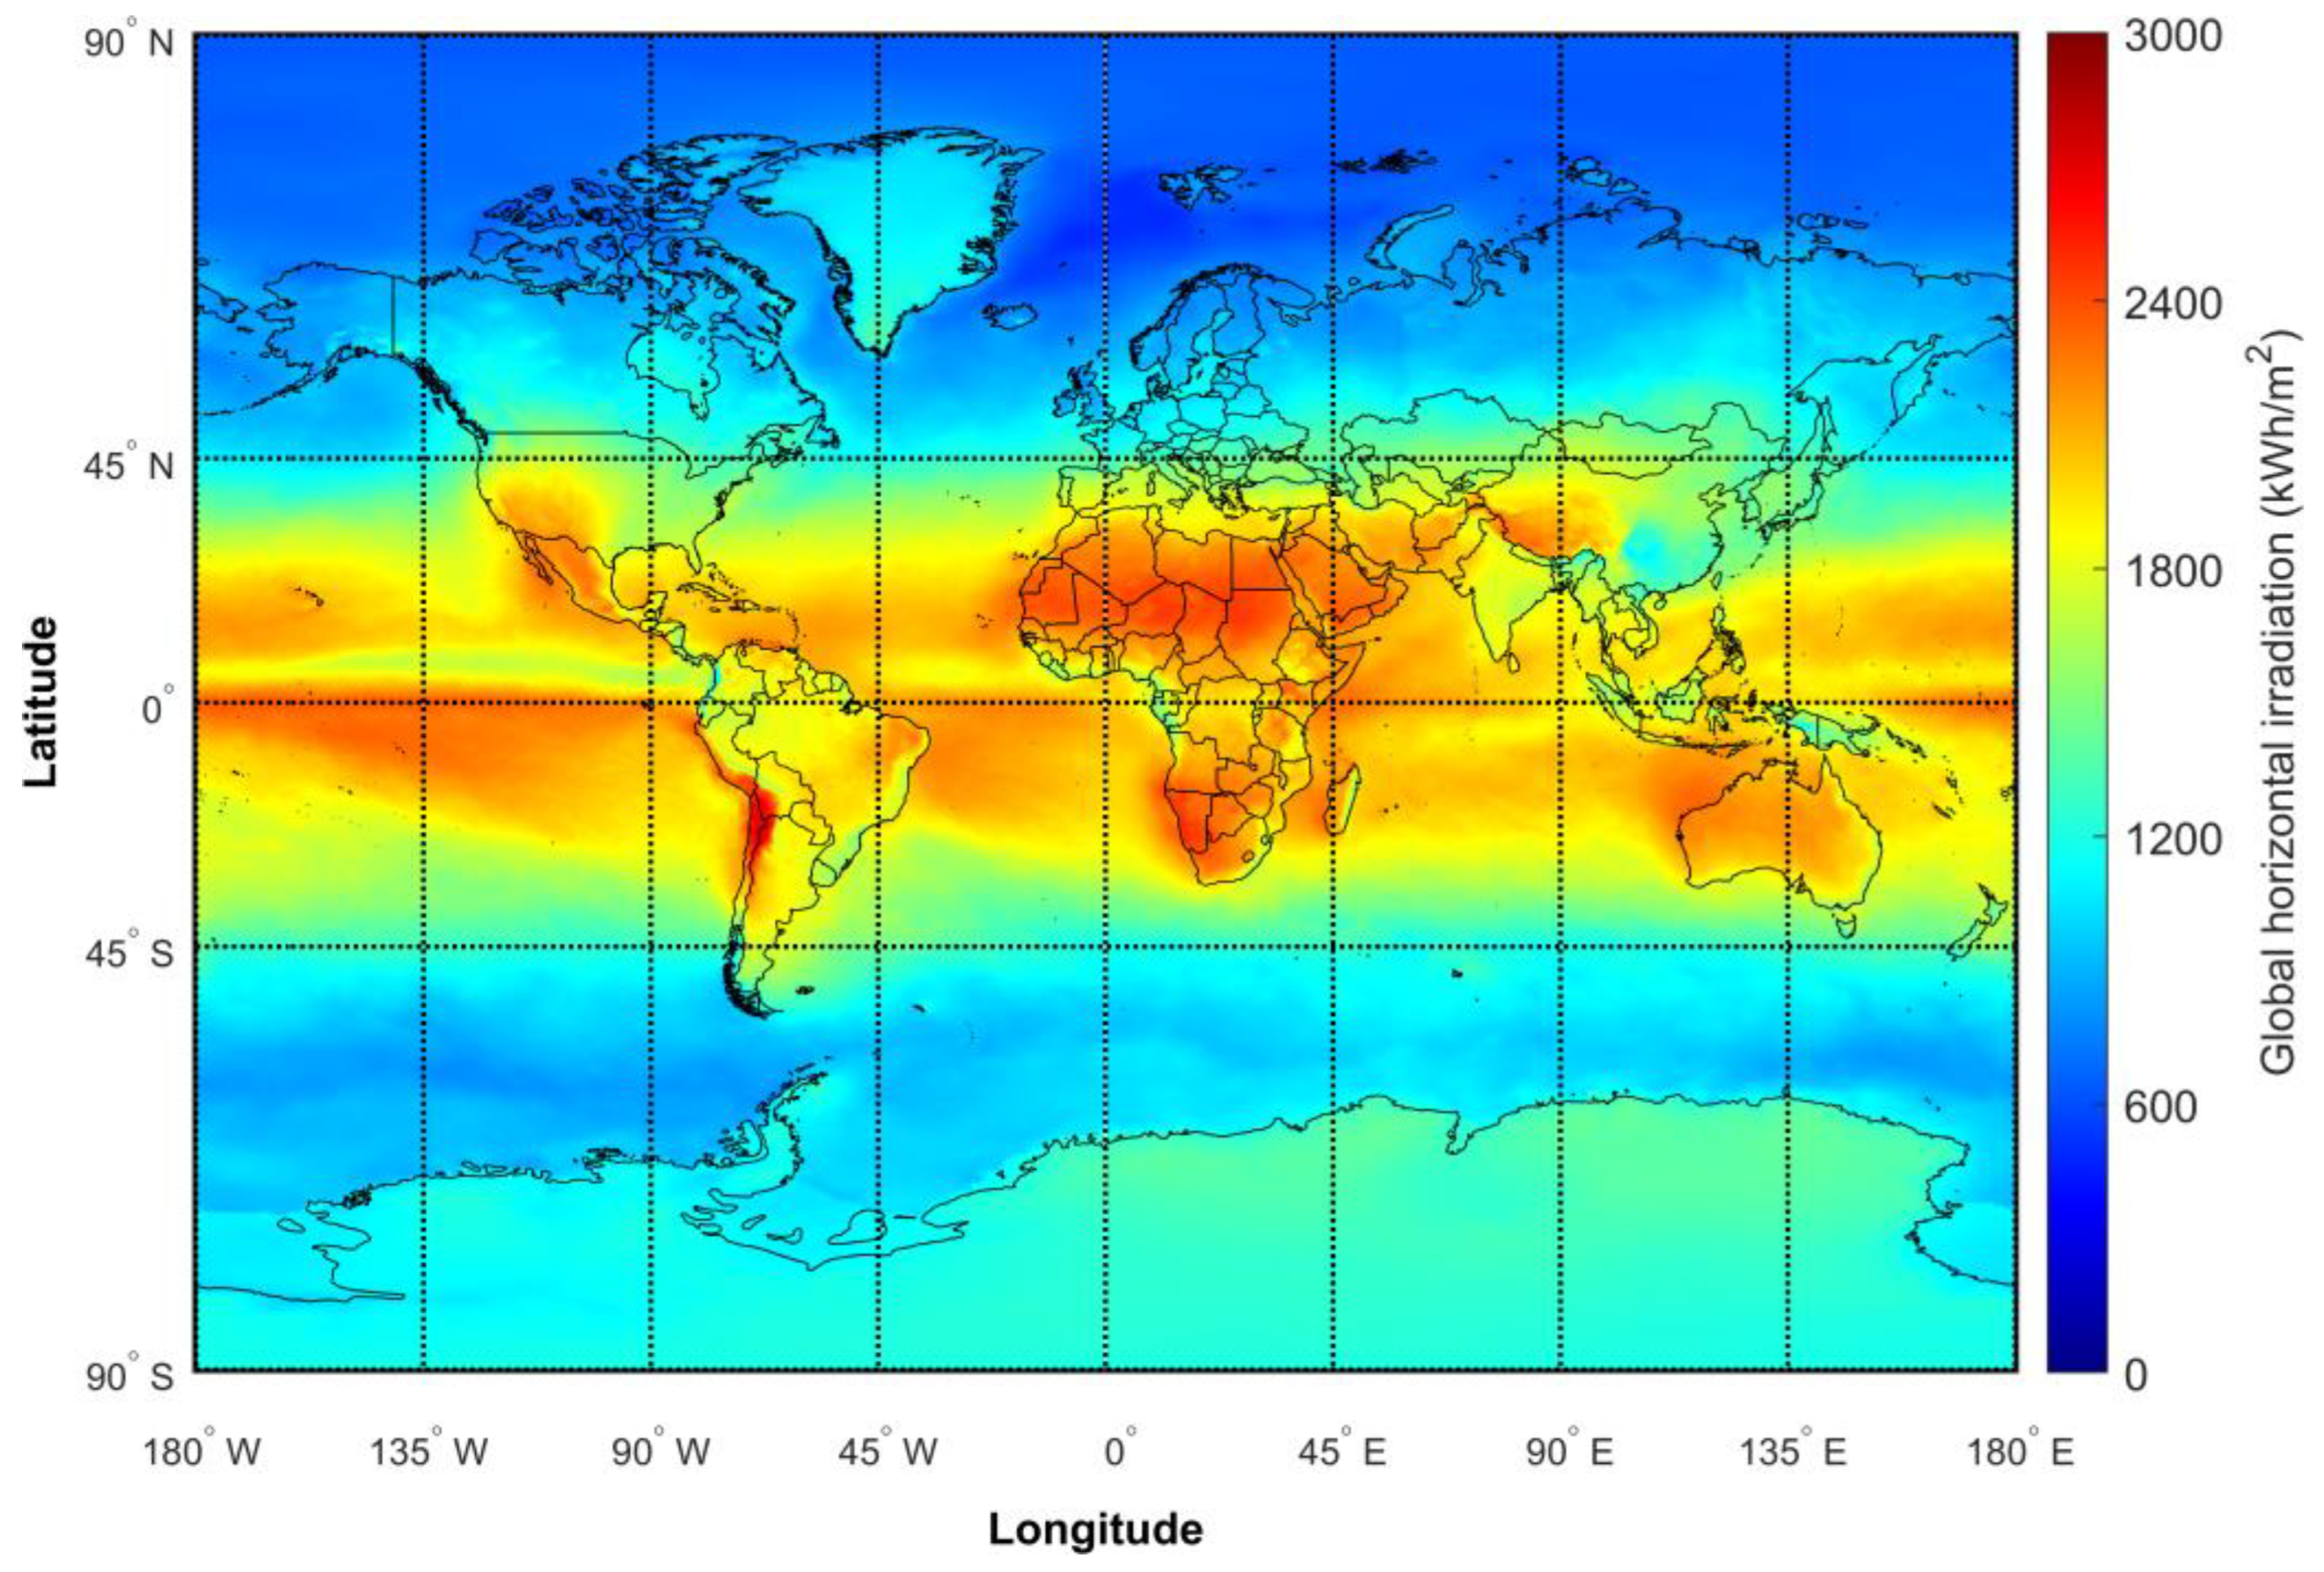
2. Solar Energy Resources and Their Potential Applications
3. Components
3.1. Solar Modules
3.2. Floating Structures
3.3. Anchoring and Mooring System
3.4. Inverters
3.5. Grid Connection and Storage
4. Economic Indicators for Solar or Hybrid Energy Projects
4.1. LCOE for Onshore and Offshore FPV Systems

| Title of Study and Year | LCOE from Study | LCOE | Location | Capacity | Type of Structure | Ref. |
|---|---|---|---|---|---|---|
| Advancing offshore solar energy generation: The HelioSea concept (2024) | 160–270 EUR/MWh | 163–276 EUR/MWh | Port of Vigo, Spain | 75 kW | Tension leg platform made of steel | [109] |
| Mapping of the levelised cost of energy from floating solar PV in coastal waters of the European Atlantic, North Sea and Baltic Sea (2024) | 250–1700 EUR/MWh | 255–1737 EUR/MWh | European Atlantic, North Sea and Baltic Sea | 6.762 MW | Tension leg platform made of steel | [120] |
| 180–1200 EUR/MWh | 184–1226 EUR/MWh | Pontoon-type floating structures | ||||
| Optimization and techno-economic assessment of 50 MW floating solar power plant on Hakaluki marsh land in Bangladesh (2023) | 0.051 USD/kWh | 47 EUR/MWh | Hakaluki Marshland–Bangladesh | 50 MW | Pontoon-type floating structures | [110] |
| Feasibility of floating solar photovoltaic systems (FSPVs) development in Nigeria: an economic cost appraisal case study (2023) | 0.9 USD/kWh | 827 EUR/MWh | Ikang River, Nigeria | 1.161 MW | Pontoon or independent floats | [123] |
| Floating solar power plant for sustainable development: A techno-economic analysis (2019) | 0.026 USD/kWh | 28.47 EUR/MWh | Neel-Nirjan Dam of Bakreswar Thermal Power Plant, India | 10 MW | Foundation for PV module mounting with underwater lines | [180] |
| Assessment of the potential of different floating solar technologies–Overview and analysis of different case studies (2020) | 96.2 EUR/MWh | 118.16 EUR/MWh | Barrow Gurney, U.K. | 319 MW | Individual modular HDPE floaters | [102] |
| 90.6 EUR/MWh | 111.28 EUR/MWh | 1 MW | Floating perimeter platform with interior web of stainless-steel cables | |||
| 53.7 EUR/MWh | 65.96 EUR/MWh | Almeria, Spain | 319 MW | Individual modular HDPE floaters | ||
| 50.3 EUR/MWh | 61.78 EUR/MWh | 1 MW | Floating perimeter platform with interior web of stainless-steel cables | |||
| Economic comparison of floating photovoltaic systems with tracking systems and active cooling in a Mediterranean water basin (2023) | 0.056–0.064 USD/kWh | 51.45–58.81 EUR/MWh | Anapo, Italy | 18 MW | Pontoon-type floating structures | [181] |
4.2. Hybrid FPV LCOE
| Title of Study and Year | LCOE from Study | LCOE | Location | Capacity | Utilization of Marine Space | Hybrid Systems | Ref. |
|---|---|---|---|---|---|---|---|
| Optimization and assessment of floating and floating-tracking PV systems integrated in on- and off-grid hybrid energy systems (2019) | 0.35–1.1 USD/kWh | 383–1205 EUR/MWh | Nakhon Si Thammarat, Thailand | – | 3600 m2 | Solar and aquaculture | [119] |
| Design and analysis of a hybrid power system for an offshore aquaculture site in Newfoundland, Canada (2024) | 0.46–0.51 USD/kWh | 411–455 EUR/MWh | Red Island, Placentia Bay, North of the Atlantic Ocean | 366 kW | 1077 PV–1.95 m2 area each | Solar and aquaculture | [183] |
| Design and performance analysis of a standalone floating photovoltaic/battery energy-powered paddlewheel aerator (2023) | 0.15–0.28 USD/kWh | 138.74–257.28 EUR/MWh | Rayong, Thailand | 450 W | 1 PV–2.17 m2 area each | Solar and aquaculture | [184] |
| Optimal techno-economic sizing of a standalone floating photovoltaic/battery energy storage system to power an aquaculture aeration and monitoring system (2022) | 0.16–2.41 USD/kWh | 153.07–2306 EUR/MWh | Rayong, Thailand | 450 W | 1 PV–2.17 m2 area each | Solar and aquaculture | [185] |
| Techno-Economic Feasibility Analysis of a Stand-Alone Photovoltaic System for Combined Aquaponics on Drylands (2020) | 0.438 USD/kWh | 473.83 EUR/MWh | La Paz, Mexico | 12.5 kW | 47 PV–1.55 m2 area each | Solar and aquaculture | [186] |
| A Techno-Economic Feasibility Study of Integrating Offshore Floating Photovoltaic Solar Technology within an Offshore Wind Park (2021) | 10–50 EUR/MWh no subsidies | 12–60 EUR/MWh | North Sea | 0.1–1.8 GW | PV 1.6 m2 area each—different scenarios | Solar and wind | [187] |
| 3–23 EUR/MWh SDE | 3.6–27.45 EUR/MWh | ||||||
| 3–12 EUR/MWh doubled SDE | 3.6–14.32 EUR/MWh | ||||||
| Offshore and Onshore Renewable Energy System Modelling to Meet the Energy Demand of Megacity Istanbul (2024) | 0.0105 USD/kWh | 9.4 EUR/MWh | Istanbul, both onshore and offshore | 690 MW | – | Solar and wind | [188] |
| 0.015 USD/kWh | 13.4 EUR/MWh | 54.2 MW | |||||
| Floating body motion coupling study and economic evaluation of different floating photovoltaic arrangement schemes under hybrid solar-wind power generation (2024) | 0.48–0.54 CNY/kWh | 63.5–71.5 EUR/MWh | Bohai Sea | – | 77.04 m2 25.68 m2 25.6 m2 | Solar and wind | [16] |
| Assessment of floating solar PV (FSPV) potential and water conservation: Case study on Rajghat Dam in Uttar Pradesh, India (2022) | 2.61 INR/kWh | 32.79 EUR/MWh | Rajghat Dam in Uttar Pradesh, India | 6513 MW | Coverage of 25% (6352 ha) of which 3450 ha is PV power | Solar and hydroelectric | [189] |
| Energy economics and environmental assessment of hybrid hydel-floating solar photovoltaic systems for cost-effective low-carbon clean energy generation (2023) | 0.0323 USD/kWh FPV | 29.68 EUR/MWh | Maithon Dam, India | 96 MW | 1.14% dam area covered with PV technology (0.42 km2) | Solar and hydroelectric | [190] |
| 0.0435 USD/kWh hybrid | 40 EUR/MWh | ||||||
| Sustainable and cost-effective hybrid energy solution for arid regions: Floating solar photovoltaic with integrated pumped storage and conventional hydropower (2023) | 190.97–188.41 USD/MWh | 175.48–173.12 EUR/MWh | Kunhar River, Pakistan | 6.04–30.2 MW | 66,940 m2–334,700 m2 (10–50%) | Solar and hydroelectric | [191] |
| Assessment of the potential of different floating solar technologies–Overview and analysis of different case studies (2020) | 63.7 EUR/MWh | 78.24 EUR/MWh | Balbina Dam, Brazil | 1 MW | – | Solar and hydroelectric | [102] |
| 67.9 EUR/MWh | 83.4 EUR/MWh | 319 MW | |||||
| Feasibility study of on/off grid large-scale PV/WT/WEC hybrid energy system in coastal cities: A case-based research (2020) | 0.093–0.139 USD/kWh on-grid | 100.6–150.37 EUR/MWh | Caspian Sea Coast | 20 MW | PV 1.63 m2 area each—different scenarios | Solar, wind, and waves | [192] |
| 0.136–0.182 USD/kWh off-grid | 147.13–196.89 EUR/MWh | Persian-Gulf Coast | |||||
| 20-Design and performance analysis of off-grid hybrid renewable energy systems (2022) | 0.2587 USD/kWh 0.3296 USD/kWh 0.2662 USD/kWh 0.1294 USD/kWh | 247.49 EUR/MWh 315.33 EUR/MWh 254.67 EUR/MWh 123.79 EUR/MWh | River Oshin, Nigeria | 101.5 kW 92.5 kW 150 kW 129 kW | – | Solar, wind, and hydroelectric | [193] |
- Farms in shallow inland reservoirs may have simpler mooring and anchorage systems compared to offshore installations exposed to stronger currents and deeper waters.
- Farms near the shore can use shorter and less expensive export cables, while those further offshore require substantial investments in transmission infrastructure.
- Projects in calm, controlled water bodies such as lakes or dams may not necessitate advanced structural reinforcements or high-capacity anchors, reducing overall costs.
- The scale of the farm also dictates the choice of materials and systems, with larger installations often benefiting from economies of scale but incurring higher initial investments in grid connectivity and permitting.
4.3. Financial Viability Metrics for FPV Systems
4.4. The Impact of FPV Systems on the LCOH
5. Environmental and Social Factors with Economic Impact on FPV Projects
6. Conclusions
Author Contributions
Funding
Data Availability Statement
Conflicts of Interest
References
- Sahu, A.; Yadav, N.; Sudhakar, K. Floating photovoltaic power plant: A review. Renew. Sustain. Energy Rev. 2016, 66, 815–824. [Google Scholar] [CrossRef]
- Dzamesi, S.K.A.; Ahiataku-Togobo, W.; Yakubu, S.; Acheampong, P.; Kwarteng, M.; Samikannu, R.; Azeave, E. Comparative performance evaluation of ground-mounted and floating solar PV systems. Energy Sustain. Dev. 2024, 80, 101421. [Google Scholar] [CrossRef]
- Patil Desai Sujay, S.; Wagh, M.; Shinde, N. A review on floating solar photovoltaic power plants. Int. J. Sci. Eng. Res. 2017, 8, 789–794. [Google Scholar]
- de Souza Nascimento, M.M.; Shadman, M.; Silva, C.; de Freitas Assad, L.P.; Estefen, S.F.; Landau, L. Offshore wind and solar complementarity in Brazil: A theoretical and technical potential assessment. Energy Convers. Manag. 2022, 270, 116194. [Google Scholar] [CrossRef]
- Madhubabu, A.; Rao, G.V.S.K. Review of Technology Involved in Floating Solar PV System. In Proceedings of the 2021 6th International Conference on Communication and Electronics Systems (ICCES), Coimbatore, India, 8–10 July 2021; pp. 376–378. [Google Scholar]
- Forester, E.; Levin, M.O.; Thorne, J.H.; Armstrong, A.; Pasquale, G.; Vincenza Di Blasi, M.L.; Scott, T.A.; Hernandez, R.R. Siting considerations for floating solar photovoltaic energy: A systematic review. Renew. Sustain. Energy Rev. 2025, 211, 115360. [Google Scholar] [CrossRef]
- Friel, D.; Karimirad, M.; Whittaker, T.; Doran, W.; Howlin, E. A Review of Floating Photovoltaic Design Concepts and Installed Variations. In Proceedings of the 4th International Conference on Offshore Renewable Energy CORE 2019, Glasgow, UK, 30 August 2019. [Google Scholar]
- Benjamins, S.; Williamson, B.; Billing, S.-L.; Yuan, Z.; Collu, M.; Fox, C.; Hobbs, L.; Masden, E.A.; Cottier-Cook, E.J.; Wilson, B. Potential environmental impacts of floating solar photovoltaic systems. Renew. Sustain. Energy Rev. 2024, 199, 114463. [Google Scholar] [CrossRef]
- Oliveira-Pinto, S.; Stokkermans, J. Marine floating solar plants: An overview of potential, challenges and feasibility. Proc. Inst. Civ. Eng. Marit. Eng. 2020, 173, 120–135. [Google Scholar] [CrossRef]
- Ikhennicheu, M.; Danglade, B.; Pascal, R.; Arramounet, V.; Trébaol, Q.; Gorintin, F. Analytical method for loads determination on floating solar farms in three typical environments. Sol. Energy 2021, 219, 34–41. [Google Scholar] [CrossRef]
- Hooper, T.; Armstrong, A.; Vlaswinkel, B. Environmental impacts and benefits of marine floating solar. Sol. Energy 2021, 219, 11–14. [Google Scholar] [CrossRef]
- Essak, L.; Ghosh, A. Floating photovoltaics: A review. Clean. Technol. 2022, 4, 752–769. [Google Scholar] [CrossRef]
- Freepik | Create Great Designs, Faster. Available online: https://www.freepik.com (accessed on 6 July 2024).
- Renewable Capacity Statistics 2024. Available online: https://www.irena.org/Publications/2024/Mar/Renewable-capacity-statistics-2024 (accessed on 16 February 2025).
- Manolache, A.I.; Andrei, G. A Comprehensive Review of Multi-Use Platforms for Renewable Energy and Aquaculture Integration. Energies 2024, 17, 19. [Google Scholar] [CrossRef]
- Lin, F.; Li, N. Floating body motion coupling study and economic evaluation of different floating photovoltaic arrangement schemes under hybrid solar-wind power generation. J. Phys. Conf. Ser. 2024, 2865, 012028. [Google Scholar] [CrossRef]
- Debnath, K.; Hsieh, C.-C.; Huang, C.-Y.; Barman, J.; Kuo, C.-F.J. Experimental investigation and economic evaluation of wind impacts on the solar panel array of a floating photovoltaic (FPV) system across different turbulence intensities. Energy Nexus 2025, 17, 100380. [Google Scholar] [CrossRef]
- Elminshawy, N.A.S.; Osama, A.; Gagliano, A.; Oterkus, E.; Tina, G.M. A technical and economic evaluation of floating photovoltaic systems in the context of the water-energy nexus. Energy 2024, 303, 131904. [Google Scholar] [CrossRef]
- Zhang, Z.; Chai, W.; Li, C.B.; Chen, M. Investigation of the effects of different array forms and float shapes on the hydrodynamic characteristics of floating photovoltaic systems under nearshore infragravity waves. Ocean Eng. 2025, 326, 120862. [Google Scholar] [CrossRef]
- Imthiyas, A.; Prakash, S.; Vijay, N.; Alwin Abraham, A.; Ganesh Kumar, B. Increasing the efficiency of solar panel by solar tracking system. IOP Conf. Ser. Mater. Sci. Eng. 2020, 993, 012124. [Google Scholar] [CrossRef]
- Salunkhe, D.S.S.; Mulani, D.A.O. Solar Mount Design Using High-Density Polyethylene. Nat. Camp. 2024, 28, 1483–1493. [Google Scholar]
- Intwala, M.H.; Ghosh, A. Investigation of thermo-electric performance of bifacial and monofacial floating photovoltaics (FPV) system in temperate climate (UK). Sol. Energy 2025, 288, 113245. [Google Scholar] [CrossRef]
- Sathya, R.A.; Ponraj, C. Non-fluorinated, anti-reflective, self-cleaning and durable silane based superhydrophobic coating for floating solar cells. Mater. Chem. Phys. 2025, 341, 130880. [Google Scholar] [CrossRef]
- Xiong, Y.; Liu, H.; Xu, J.; Chen, H. Mechanical properties of offshore floating photovoltaic structural coating/carbon steel system in a marine environment. Ocean. Eng. 2025, 323, 120585. [Google Scholar] [CrossRef]
- Nazir, G.; Rehman, A.; Hussain, S.; Aftab, S.; Patil, S.A.; Aslam, M.; Abdel Hafez, A.A.; Heo, K. Bifacial perovskite thin film solar cells: Pioneering the next frontier in solar energy. Nano Energy 2025, 134, 110523. [Google Scholar] [CrossRef]
- Tina, G.M.; Osama, A.; Mannino, G.; Gagliano, A.; Cucuzza, A.V.; Bizzarri, F. Thermal comparison of floating bifacial and monofacial photovoltaic modules considering two laying configurations. Appl. Energy 2025, 389, 125732. [Google Scholar] [CrossRef]
- Araimi, M.A.; Mandhari, M.A.; Ghosh, A. Comparative analysis of bifacial and monofacial FPV system in the UK. Sol. Compass 2025, 13, 100106. [Google Scholar] [CrossRef]
- Mazur, M.M.; Alberti, E.L.; Portella, K.F.; Bragança, M.D.G.P.; Mazur, V.T.; Pianaro, S.A. Enhanced self-cleaning efficiency of photovoltaic solar panels using Ti|TiOx|TiO2 nanofilms from pulsed direct current magnetron sputtering plasma. Thin Solid. Film. 2025, 815, 140641. [Google Scholar] [CrossRef]
- Sutanto, B.; Indartono, Y.S.; Wijayanta, A.T.; Iacovides, H. Enhancing the performance of floating photovoltaic system by using thermosiphon cooling method: Numerical and experimental analyses. Int. J. Therm. Sci. 2022, 180, 107727. [Google Scholar] [CrossRef]
- Trapani, K.; Millar, D.L. The thin film flexible floating PV (T3F-PV) array: The concept and development of the prototype. Renew. Energy 2014, 71, 43–50. [Google Scholar] [CrossRef]
- Ravichandran, N.; Ravichandran, N.; Panneerselvam, B. Comparative assessment of offshore floating photovoltaic systems using thin film modules for Maldives islands. Sustain. Energy Technol. Assess. 2022, 53, 102490. [Google Scholar] [CrossRef]
- Solomin, E.; Sirotkin, E.; Cuce, E.; Selvanathan, S.P.; Kumarasamy, S. Hybrid Floating Solar Plant Designs: A Review. Energies 2021, 14, 2751. [Google Scholar] [CrossRef]
- Rehman, S.; Menesy, A.S.; Zayed, M.E.; Zaery, M.; Al-Shaikhi, A.; Mohandes, M.A.; Irshad, K.; Kassas, M.; Abido, M.A. Synergistic sizing and energy management strategy of combined offshore wind with solar floating PV system for green hydrogen and electricity co-production using multi-objective dung beetle optimization. Results Eng. 2025, 25, 104399. [Google Scholar] [CrossRef]
- Irshad, A.S.; Ahmad Ludin, G.; Ludin, S.; Elkholy, M.H.; Elias, S.; Senjyu, T. Integration and performance analysis of optimal large-scale hybrid PV and pump hydro storage system based upon floating PV for practical application. Energy Convers. Manag. X 2024, 22, 100599. [Google Scholar] [CrossRef]
- Bamoshmoosh, A.; Catania, M.; Dipierro, V.; Ficili, M.; Fusco, A.; Gioffrè, D.; Parolin, F.; Pilotti, L.; Zelaschi, A.; Vincenti, F. Techno-economic optimization of pumped hydro storage plants integrated with floating photovoltaic. Appl. Energy 2025, 382, 125268. [Google Scholar] [CrossRef]
- Goh, H.H.; Liang, Q.; Xie, H.; Liang, X.; Zhang, D.; Dai, W.; Kurniawan, T.A.; Wong, S.Y.; Goh, K.C.; Teo, K.T.K. Maximizing eco-energetic and economic synergies: Floating photovoltaic engaged pumped-hydro energy storage for water scarcity alleviation, carbon emission reduction, and cost efficiency. Process Saf. Environ. Prot. 2025, 197, 107082. [Google Scholar] [CrossRef]
- Bi, C.; Law, A.W.-K. Co-locating offshore wind and floating solar farms—Effect of high wind and wave conditions on solar power performance. Energy 2023, 266, 126437. [Google Scholar] [CrossRef]
- Tay, Z.Y. Performance of integrated FB and WEC for offshore floating solar photovoltaic farm considering the effect of hydroelasticity. Ocean. Eng. 2024, 312, 119165. [Google Scholar] [CrossRef]
- Temiz, M.; Javani, N. Design and analysis of a combined floating photovoltaic system for electricity and hydrogen production. Int. J. Hydrogen Energy 2020, 45, 3457–3469. [Google Scholar] [CrossRef]
- Chowdhury, G.; Haggag, M.; Poortmans, J. How cool is floating PV? A state-of-the-art review of floating PV’s potential gain and computational fluid dynamics modeling to find its root cause. EPJ Photovolt. 2023, 14, 24. [Google Scholar] [CrossRef]
- Nisar, H.; Kashif Janjua, A.; Hafeez, H.; shakir, S.; Shahzad, N.; Waqas, A. Thermal and electrical performance of solar floating PV system compared to on-ground PV system-an experimental investigation. Sol. Energy 2022, 241, 231–247. [Google Scholar] [CrossRef]
- Rahaman, M.A.; dos Santos, F.R.; Centenaro, S.H.; Fekih, A.; Wiecheteck, G.; Chambers, T.L. Sustainability assessment of floating photovoltaic (FPV) system: A multidimensional comprehensive analysis across the water-energy nexus. J. Clean. Prod. 2025, 506, 145468. [Google Scholar] [CrossRef]
- Saitov, K.; Jiang, Z. Advancing offshore solar energy generation: Numerical modelling and calibration of a floating solar array against model tests. Sol. Energy 2025, 288, 113225. [Google Scholar] [CrossRef]
- Cáceres González, R.; Sarmiento-Laurel, C.; Alcayaga, H.; Díaz, A.J.; Pizarro, A.; Crespo Fuentes, J.; Moya Caro, A.; Vásquez Páez, C.; Bustos Olavarría, F.; Boscolo, R.; et al. Exploring climate-driven performance of floating photovoltaic systems: Energy production enhancement and evaporation reduction. Appl. Energy 2025, 386, 125556. [Google Scholar] [CrossRef]
- Lee, J.-H.; Paik, K.-J.; Lee, S.-H.; Hwangbo, J.; Ha, T.-H. Experimental and Numerical Study on the Characteristics of Motion and Load for a Floating Solar Power Farm under Regular Waves. J. Mar. Sci. Eng. 2022, 10, 565. [Google Scholar] [CrossRef]
- Delacroix, S.; Bourdier, S.; Soulard, T.; Elzaabalawy, H.; Vasilenko, P. Experimental Modelling of a Floating Solar Power Plant Array under Wave Forcing. Energies 2023, 16, 5198. [Google Scholar] [CrossRef]
- Lodhi, M.K.; Tan, Y.; Suprijanto, A.; Naeem, S.; Alage, I.L. Rooftop and floating PV potential for sustainable energy in Pakistan: A national-scale assessment. Energy Sustain. Dev. 2025, 87, 101748. [Google Scholar] [CrossRef]
- Rosenlieb, E.; Rivers, M.; Levine, A. Floating photovoltaic technical potential: A novel geospatial approach on federally controlled reservoirs in the United States. Sol. Energy 2025, 287, 113177. [Google Scholar] [CrossRef]
- Ji, C.; Hao, Y.; Xu, S. Experimental and numerical study on the hydrodynamic responses of a novel offshore floating photovoltaic system. Ocean. Eng. 2025, 315, 119797. [Google Scholar] [CrossRef]
- Wang, B.; Lian, J.; Gao, X.; Liu, L.; Yao, Y.; Li, Y.; Meng, H. Coupled dynamic analysis of polyester flexible connector for a novel lattice-type floating photovoltaic array. Ocean. Eng. 2025, 320, 120354. [Google Scholar] [CrossRef]
- Ajmal, A.M.; Yang, Y.; Zhu, Y. Degradation rate analysis of offshore PV module applications considering climatic stresses and salinity effects. Sol. Energy 2025, 295, 113522. [Google Scholar] [CrossRef]
- Zhang, C.; Dai, J.; Ang, K.K.; Lim, H.V. Development of compliant modular floating photovoltaic farm for coastal conditions. Renew. Sustain. Energy Rev. 2024, 190, 114084. [Google Scholar] [CrossRef]
- Dörenkämper, M.; Wahed, A.; Kumar, A.; de Jong, M.; Kroon, J.; Reindl, T. The cooling effect of floating PV in two different climate zones: A comparison of field test data from the Netherlands and Singapore. Sol. Energy 2021, 219, 15–23. [Google Scholar] [CrossRef]
- Bossi, S.; Blasi, L.; Cupertino, G.; dell’Erba, R.; Cipollini, A.; De Vito, S.; Santoro, M.; Di Francia, G.; Tina, G.M. Floating Photovoltaic Plant Monitoring: A Review of Requirements and Feasible Technologies. Sustainability 2024, 16, 8367. [Google Scholar] [CrossRef]
- Khalifeh Soltani, S.R.; Mostafaeipour, A.; Mishra, P.; Alidoost, S.; Jahangiri, M.; Abrisham Kar, M. Green hydrogen production and prediction using floating photovoltaic panels on wastewater ponds. Renew. Energy 2025, 243, 122554. [Google Scholar] [CrossRef]
- Khalifeh Soltani, S.R.; Mostafaeipour, A.; Almutairi, K.; Hosseini Dehshiri, S.J.; Hosseini Dehshiri, S.S.; Techato, K. Predicting effect of floating photovoltaic power plant on water loss through surface evaporation for wastewater pond using artificial intelligence: A case study. Sustain. Energy Technol. Assess. 2022, 50, 101849. [Google Scholar] [CrossRef]
- Cromratie Clemons, S.K.; Salloum, C.R.; Herdegen, K.G.; Kamens, R.M.; Gheewala, S.H. Life cycle assessment of a floating photovoltaic system and feasibility for application in Thailand. Renew. Energy 2021, 168, 448–462. [Google Scholar] [CrossRef]
- Ali, F.; Etemad-Shahidi, A.; Stewart, R.A.; Sanjari, M.J.; Hayward, J.A.; Nicholson, R.C. Co-located offshore wind and floating solar farms: A systematic quantitative literature review of site selection criteria. Renew. Energy Focus. 2024, 50, 100611. [Google Scholar] [CrossRef]
- Nobre, R.; Boulêtreau, S.; Colas, F.; Azemar, F.; Tudesque, L.; Parthuisot, N.; Favriou, P.; Cucherousset, J. Potential ecological impacts of floating photovoltaics on lake biodiversity and ecosystem functioning. Renew. Sustain. Energy Rev. 2023, 188, 113852. [Google Scholar] [CrossRef]
- Melek, A.B.; Gökmener, S.; Haspolat, E.; Çiçek, D.D.; Deveci, M.; Oğuz, E.; Khorasanchi, M. Fuzzy Einstein-based decision-making model for the evaluation of site selection criteria of floating photovoltaic system. Ocean. Eng. 2024, 301, 117521. [Google Scholar] [CrossRef]
- Pouran, H.M.; Padilha Campos Lopes, M.; Nogueira, T.; Alves Castelo Branco, D.; Sheng, Y. Environmental and technical impacts of floating photovoltaic plants as an emerging clean energy technology. iScience 2022, 25, 105253. [Google Scholar] [CrossRef]
- Ilgen, K.; Schindler, D.; Wieland, S.; Lange, J. The impact of floating photovoltaic power plants on lake water temperature and stratification. Sci. Rep. 2023, 13, 7932. [Google Scholar] [CrossRef]
- Gadzanku, S.; Mirletz, H.; Lee, N.; Daw, J.; Warren, A. Benefits and Critical Knowledge Gaps in Determining the Role of Floating Photovoltaics in the Energy-Water-Food Nexus. Sustainability 2021, 13, 4317. [Google Scholar] [CrossRef]
- Vidović, V.; Krajačić, G.; Matak, N.; Stunjek, G.; Mimica, M. Review of the potentials for implementation of floating solar panels on lakes and water reservoirs. Renew. Sustain. Energy Rev. 2023, 178, 113237. [Google Scholar] [CrossRef]
- Wei, Y.; Ou, B.; Wang, J.; Yang, L.; Luo, Z.; Jain, S.; Hetharia, W.; Riyadi, S.; Utama, I.; Huang, L. Simulation of a floating solar farm in waves with a novel sun-tracking system. IOP Conf. Ser. Mater. Sci. Eng. 2023, 1288, 012041. [Google Scholar] [CrossRef]
- Bax, V.; van de Lageweg, W.I.; Hoosemans, R.; van den Berg, B. Floating photovoltaic pilot project at the Oostvoornse lake: Assessment of the water quality effects of three different system designs. Energy Rep. 2023, 9, 1415–1425. [Google Scholar] [CrossRef]
- Prinsloo, F.C.; Schmitz, P.; Lombard, A. System dynamics characterisation and synthesis of floating photovoltaics in terms of energy, environmental and economic parameters with WELF nexus sustainability features. Sustain. Energy Technol. Assess. 2023, 55, 102901. [Google Scholar] [CrossRef]
- Divya, A.; Adish, T.; Kaustubh, P.; Zade, P.S. Review on recycling of solar modules/panels. Sol. Energy Mater. Sol. Cells 2023, 253, 112151. [Google Scholar] [CrossRef]
- Guven, D. Assessing the environmental and economic viability of floating PV-powered green hydrogen: A case study on inland ferry operations in Türkiye. Appl. Energy 2025, 377, 124768. [Google Scholar] [CrossRef]
- Akomea-Ampeh, M.; Atekwana, E.A.; Steele, E.P.; Cagle, A.E.; Armstrong, A.; Thackeray, S.J.; Sadro, S.; Ololade, O.O.; Fasipe, O.A.; Hernandez, R.R. Metal contaminant risk at active floating photovoltaic sites and future research roadmap. J. Environ. Manag. 2025, 383, 125216. [Google Scholar] [CrossRef] [PubMed]
- Frehner, A.; Stucki, M.; Itten, R. Are alpine floatovoltaics the way forward? Life-cycle environmental impacts and energy payback time of the worlds’ first high-altitude floating solar power plant. Sustain. Energy Technol. Assess. 2024, 68, 103880. [Google Scholar] [CrossRef]
- Martinez, A.; Iglesias, G. Floating solar photovoltaics in the Mediterranean Sea: Mapping and sensitivity analysis of the levelised cost of energy. J. Clean. Prod. 2024, 473, 143534. [Google Scholar] [CrossRef]
- Wang, G.; Wang, X.; Chen, T. Mapping the potential: A GIS-based approach to assessing floating solar resources for rural electrification in Cambodia. Energy Sustain. Dev. 2025, 87, 101724. [Google Scholar] [CrossRef]
- Bru, J.; Seland, T.S.; Dai, J.; Jiang, Z. Life cycle cost analysis of an offshore floating photovoltaic concept in the North Sea. Renew. Energy 2025, 249, 122981. [Google Scholar] [CrossRef]
- He, Z.; Xu, W.; Sun, Y.; Zhang, X. A GIS-based techno-economic comparative assessment of offshore fixed and floating photovoltaic systems: A case study of Hainan. Appl. Energy 2025, 391, 125854. [Google Scholar] [CrossRef]
- Gagliardi, G.G.; Cosentini, C.; Agati, G.; Borello, D.; Venturini, P. Green hydrogen production via floating photovoltaic systems on irrigation reservoirs: An Italian case study. Renew. Energy 2025, 247, 123040. [Google Scholar] [CrossRef]
- Islam, M.I.; Al Mansur, A.; Jadin, M.S.; Saaduzzaman, D.M.; Naiem-Ur-Rahman, M. Potential data for feasibility assessment and deployment of a 6.7 MW floating solar PV plant in Hatirjheel Lake, Dhaka, Bangladesh. Data Brief. 2024, 55, 110586. [Google Scholar] [CrossRef] [PubMed]
- Djalab, A.; Djalab, Z.; El Hammoumi, A.; Marco TINA, G.; Motahhir, S.; Laouid, A.A. A comprehensive Review of Floating Photovoltaic Systems: Tech Advances, Marine Environmental Influences on Offshore PV Systems, and Economic Feasibility Analysis. Sol. Energy 2024, 277, 112711. [Google Scholar] [CrossRef]
- Micheli, L.; Sepúlveda-Vélez, F.A.; Talavera, D.L. Impact of variable economic conditions on the cost of energy and the economic viability of floating photovoltaics. Heliyon 2024, 10, 12. [Google Scholar] [CrossRef]
- Goswami, A.; Aizpurua, J.I. Reliability-aware techno-economic assessment of floating solar power systems. Sustain. Energy Grids Netw. 2024, 40, 101536. [Google Scholar] [CrossRef]
- Micheli, L.; Talavera, D.L. Economic feasibility of floating photovoltaic power plants: Profitability and competitiveness. Renew. Energy 2023, 211, 607–616. [Google Scholar] [CrossRef]
- Dellosa, J.T.; Palconit, E.V.; Enano, N.H. Risk Assessment and Policy Recommendations for a Floating Solar Photovoltaic (FSPV) System. IEEE Access 2024, 12, 30452–30471. [Google Scholar] [CrossRef]
- Hayibo, K.S.; Antonini, G.; Rahman, M.M.; Pearce, J.M. Experimental integration of a foam-based floating photovoltaic (floatovoltaic) system with an anion exchange membrane electrolyzer for 5 kW-Scale green hydrogen production. Int. J. Hydrogen Energy 2025, 138, 260–272. [Google Scholar] [CrossRef]
- Garrod, A.; Neda Hussain, S.; Ghosh, A.; Nahata, S.; Wynne, C.; Paver, S. An assessment of floating photovoltaic systems and energy storage methods: A comprehensive review. Results Eng. 2024, 21, 101940. [Google Scholar] [CrossRef]
- Zeng, F.; Bi, C.; Sree, D.; Huang, G.; Zhang, N.; Law, A.W.-K. An Adaptive Barrier-Mooring System for Coastal Floating Solar Farms. Appl. Energy 2023, 348, 121618. [Google Scholar] [CrossRef]
- Liu, Y.; Wang, B.; Lian, J.; Gao, X.; Yao, Y.; Li, H. Ice load characteristics analysis and anti-icing design of a novel floating photovoltaic structure. Sol. Energy 2025, 289, 113333. [Google Scholar] [CrossRef]
- Where Sun Meets Water: Floating Solar Market Report. Available online: https://www.worldbank.org/en/topic/energy/publication/where-sun-meets-water (accessed on 16 January 2025).
- International Energy Agency Renewables 2024–Analysis and Forecasts to 2030. Available online: https://www.iea.org/reports/renewables-2024 (accessed on 24 January 2025).
- Lehner, B.; ReidyLiermann, C.; Revenga, C.; Vorosmarty, C.; Fekete, B.; Crouzet, P.; Doll, P.; Endejan, M.; Frenken, K.; Magome, J. Global Reservoir and Dam Database, Version 1 (GRanDv1): Reservoirs, Revision 01. Socioeconomic Data and Applications Center 2011. Available online: https://data.nasa.gov/dataset/global-reservoir-and-dam-database-version-1-grandv1-reservoirs-revision-01 (accessed on 20 July 2025).
- Global Solar Atlas. Available online: https://globalsolaratlas.info/map (accessed on 6 July 2025).
- Ghosh, A. A comprehensive review of water based PV: Flotavoltaics, under water, offshore & canal top. Ocean. Eng. 2023, 281, 115044. [Google Scholar] [CrossRef]
- Kumar, M.; Niyaz, H.M.; Gupta, R. Challenges and opportunities towards the development of floating photovoltaic systems. Sol. Energy Mater. Sol. Cells 2021, 233, 111408. [Google Scholar] [CrossRef]
- Kumar, M.; Kumar, A. Experimental validation of performance and degradation study of canal-top photovoltaic system. Appl. Energy 2019, 243, 102–118. [Google Scholar] [CrossRef]
- Silalahi, D.F.; Blakers, A. Global Atlas of Marine Floating Solar PV Potential. Solar 2023, 3, 416–433. [Google Scholar] [CrossRef]
- Dahunsi, A.M.; Foli, B.A.K. Assessment of past and future potential of ocean wave power in the Gulf of Guinea. Int. J. Sustain. Eng. 2023, 16, 302–323. [Google Scholar] [CrossRef]
- Ohunakin, O.S.; Matthew, O.J.; Adaramola, M.S.; Atiba, O.E.; Adelekan, D.S.; Aluko, O.O.; Henry, E.U.; Ezekiel, V.U. Techno-economic assessment of offshore wind energy potential at selected sites in the Gulf of Guinea. Energy Convers. Manag. 2023, 288, 117110. [Google Scholar] [CrossRef]
- Ardiansyah, H.; Ekadewi, P. Indonesia Post-Pandemic Outlook: Strategy Towards Net-Zero Emissions by 2060 from the Renewables and Carbon-Neutral Energy Perspectives; Penerbit BRIN: Jakarta, Indonesia, 2022; ISBN 9786237425878. [Google Scholar]
- Taye, B.Z.; Nebey, A.H.; Workineh, T.G. Design of floating solar PV system for typical household on Debre Mariam Island. Cogent Eng. 2020, 7, 1829275. [Google Scholar] [CrossRef]
- Getie, E.M.; Jember, Y.B. Potential Assessment and Performance Evaluation of a Floating Solar Photovoltaic on the Great Ethiopian Renaissance Dam. Int. J. Photoenergy 2022, 2022, 6964984. [Google Scholar] [CrossRef]
- Lumpote, C.; Mwanza, M. Assessment of Technical Potential of Floating Solar Photovoltaic System for Electricity Generation in Zambia. Int. J. Res. Innov. Appl. Sci. 2023, VIII, 10–22. [Google Scholar] [CrossRef]
- Ates, A.M.; Yilmaz, O.S.; Gulgen, F. Using remote sensing to calculate floating photovoltaic technical potential of a dam’s surface. Sustain. Energy Technol. Assess. 2020, 41, 100799. [Google Scholar] [CrossRef]
- Oliveira-Pinto, S.; Stokkermans, J. Assessment of the potential of different floating solar technologies—Overview and analysis of different case studies. Energy Convers. Manag. 2020, 211, 112747. [Google Scholar] [CrossRef]
- Solanki, C.; Nagababu, G.; Kachhwaha, S.S. Assessment of offshore solar energy along the coast of India. Energy Procedia 2017, 138, 530–535. [Google Scholar] [CrossRef]
- Wen, Y.; Lin, P. Offshore solar photovoltaic potential in the seas around China. Appl. Energy 2024, 376, 124279. [Google Scholar] [CrossRef]
- Zereshkian, S.; Mansoury, D. A study on the feasibility of using solar radiation energy and ocean thermal energy conversion to supply electricity for offshore oil and gas fields in the Caspian Sea. Renew. Energy 2021, 163, 66–77. [Google Scholar] [CrossRef]
- Manolache, A.I.; Andrei, G.; Rusu, L. An Evaluation of the Efficiency of the Floating Solar Panels in the Western Black Sea and the Razim-Sinoe Lagunar System. J. Mar. Sci. Eng. 2023, 11, 203. [Google Scholar] [CrossRef]
- Oliveira-Pinto, S.; Rosa-Santos, P.; Taveira-Pinto, F. Assessment of the potential of combining wave and solar energy resources to power supply worldwide offshore oil and gas platforms. Energy Convers. Manag. 2020, 223, 113299. [Google Scholar] [CrossRef]
- Golroodbari, S.Z.; Ayyad, A.W.A.; van Sark, W. Offshore floating photovoltaics system assessment in worldwide perspective. Prog. Photovolt. Res. Appl. 2023, 31, 1061–1077. [Google Scholar] [CrossRef]
- López, M.; Claus, R.; Soto, F.; Hernández-Garrastacho, Z.A.; Cebada-Relea, A.; Simancas, O. Advancing offshore solar energy generation: The HelioSea concept. Appl. Energy 2024, 359, 122710. [Google Scholar] [CrossRef]
- Kowsar, A.; Hassan, M.; Rana, M.T.; Haque, N.; Faruque, M.H.; Ahsan, S.; Alam, F. Optimization and techno-economic assessment of 50 MW floating solar power plant on Hakaluki marsh land in Bangladesh. Renew. Energy 2023, 216, 119077. [Google Scholar] [CrossRef]
- Myhr, A.; Bjerkseter, C.; Ågotnes, A.; Nygaard, T.A. Levelised cost of energy for offshore floating wind turbines in a life cycle perspective. Renew. Energy 2014, 66, 714–728. [Google Scholar] [CrossRef]
- JA Solar 565W Mono MBB PERC Half-Cell Silver Rigid Solar Panel. Available online: https://batterygroup.co.uk/solar/solar-panels/rigid-solar-panels/14962/ja-solar-565w-mono-mbb-perc-half-cell-silver-rigid-solar-panel-jam72s-30-565-lr (accessed on 29 November 2024).
- Longi Hi-Mo 5m Lr5-72hph-550m 550W 550 Watt Solar Panel. Available online: https://nuukopower.en.made-in-china.com/product/eQHpYCgAJdkx/China-Longi-Hi-Mo-5m-Lr5-72hph-550m-550W-550-Watt-Solar-Panel.html (accessed on 13 April 2025).
- Jinko Solar 60cells 300W PV Standard Monocrystallinesolar Panel System. Available online: https://jingsunenergy.en.made-in-china.com/product/qwstFPauYQRE/China-Jinko-Solar-60cells-300W-PV-Standard-Monocrystallinesolar-Panel-System.html (accessed on 15 April 2025).
- Huasun Hjt Bifacial Solar Panel 700W 710W 720W 730W N Type Solar Panel 210mm Double PV Module. Available online: https://sunpro-energy.en.made-in-china.com/product/IATrYLDVVUhe/China-Huasun-Hjt-Bifacial-Solar-Panel-700W-710W-720W-730W-N-Type-Solar-Panel-210mm-Double-PV-Module.html (accessed on 29 November 2024).
- Ja Solar Bifacial Panel 630w 24v Mono Perc Half-cell Pv Panels 620w Eu Lager 615w 610w 605w. Available online: https://www.alibaba.com/product-detail/jam72d42-lb-Solarmodul-Ja-Solar-Bifacial_1600887090035.html (accessed on 29 November 2024).
- Bifacial JA Solar—JAM54D40 440/LB. Available online: https://www.secondsol.com/en/anzeige/39502//ja-solar/jam54d40-440lb-black-frame (accessed on 29 November 2024).
- Bahrami, A.; Okoye, C.O.; Atikol, U. Technical and economic assessment of fixed, single and dual-axis tracking PV panels in low latitude countries. Renew. Energy 2017, 113, 563–579. [Google Scholar] [CrossRef]
- Campana, P.E.; Wästhage, L.; Nookuea, W.; Tan, Y.; Yan, J. Optimization and assessment of floating and floating-tracking PV systems integrated in on- and off-grid hybrid energy systems. Sol. Energy 2019, 177, 782–795. [Google Scholar] [CrossRef]
- Martinez, A.; Iglesias, G. Mapping of the levelised cost of energy from floating solar PV in coastal waters of the European Atlantic, North Sea and Baltic Sea. Sol. Energy 2024, 279, 112809. [Google Scholar] [CrossRef]
- Cavazzi, S.; Dutton, A.G. An Offshore Wind Energy Geographic Information System (OWE-GIS) for assessment of the UK’s offshore wind energy potential. Renew. Energy 2016, 87, 212–228. [Google Scholar] [CrossRef]
- Johnston, B.; Foley, A.; Doran, J.; Littler, T. Levelised cost of energy, A challenge for offshore wind. Renew. Energy 2020, 160, 876–885. [Google Scholar] [CrossRef]
- Effiom, S.O. Feasibility of floating solar photovoltaic systems (FSPVs) development in Nigeria: An economic cost appraisal case study. Appl. Eng. Technol. 2023, 2, 60–74. [Google Scholar] [CrossRef]
- Mavraki, N.; Bos, O.G.; Vlaswinkel, B.M.; Roos, P.; de Groot, W.; van der Weide, B.; Bittner, O.; Coolen, J.W.P. Fouling community composition on a pilot floating solar-energy installation in the coastal Dutch North Sea. Front. Mar. Sci. 2023, 10, 1223766. [Google Scholar] [CrossRef]
- Ramírez, A.Z.; Muñoz, C.B. Albedo Effect and Energy Efficiency of Cities. In Sustainable Development-Energy, Engineering and Technologies-Manufacturing and Environment; IntechOpen: London, UK, 2012; ISBN 953-51-0165-X. [Google Scholar]
- Stephens, G.L.; O’Brien, D.; Webster, P.J.; Pilewski, P.; Kato, S.; Li, J. The albedo of Earth. Rev. Geophys. 2015, 53, 141–163. [Google Scholar] [CrossRef]
- Liu, H.; Krishna, V.; Lun Leung, J.; Reindl, T.; Zhao, L. Field experience and performance analysis of floating PV technologies in the tropics. Prog. Photovolt. Res. Appl. 2018, 26, 957–967. [Google Scholar] [CrossRef]
- Li, P.; Gao, X.; Li, Z.; Zhou, X. Physical analysis of the environmental impacts of fishery complementary photovoltaic power plant. Environ. Sci. Pollut. Res. 2022, 29, 46108–46117. [Google Scholar] [CrossRef]
- Cazzaniga, R.; Cicu, M.; Rosa-Clot, M.; Rosa-Clot, P.; Tina, G.M.; Ventura, C. Floating photovoltaic plants: Performance analysis and design solutions. Renew. Sustain. Energy Rev. 2018, 81, 1730–1741. [Google Scholar] [CrossRef]
- Patel, S.S.; Rix, A.J. Water surface albedo modelling for floating PV plants. Europe 2019, 19, 915–931. [Google Scholar]
- Cosgun, A.E.; Demir, H. Investigating the Effect of Albedo in Simulation-Based Floating Photovoltaic System: 1 MW Bifacial Floating Photovoltaic System Design. Energies 2024, 17, 959. [Google Scholar] [CrossRef]
- Muehleisen, W.; Loeschnig, J.; Feichtner, M.; Burgers, A.R.; Bende, E.E.; Zamini, S.; Yerasimou, Y.; Kosel, J.; Hirschl, C.; Georghiou, G.E. Energy yield measurement of an elevated PV system on a white flat roof and a performance comparison of monofacial and bifacial modules. Renew. Energy 2021, 170, 613–619. [Google Scholar] [CrossRef]
- Pandian, G.R.; Balachandran, G.B.; David, P.W.; K, S. Performance analysis of floating bifacial stand-alone photovoltaic module in tropical freshwater systems of Southern Asia: An experimental study. Sci. Rep. 2024, 14, 20352. [Google Scholar] [CrossRef]
- Sinha, A.; Sulas-Kern, D.; Owen-Bellini, M.; Spinella, L.; Uličná, S.; Ovaitt, S.; Johnston, S.; Schelhas, L. Glass/Glass Photovoltaic Module Reliability and Degradation: A Review. J. Phys. Appl. Phys. 2021, 54, 41. [Google Scholar] [CrossRef]
- Kopecek, R.; Libal, J. Bifacial Photovoltaics 2021: Status, Opportunities and Challenges. Energies 2021, 14, 2076. [Google Scholar] [CrossRef]
- Ma, C.; Wu, R.; Liu, Z.; Li, X. Performance assessment of different photovoltaic module technologies in floating photovoltaic power plants under waters environment. Renew. Energy 2024, 222, 119890. [Google Scholar] [CrossRef]
- Claus, R.; López, M. Key issues in the design of floating photovoltaic structures for the marine environment. Renew. Sustain. Energy Rev. 2022, 164, 112502. [Google Scholar] [CrossRef]
- Cazzaniga, R. Chapter 4—Floating PV Structures. In Floating PV Plants; Rosa-Clot, M., Marco Tina, G., Eds.; Academic Press: Amsterdam, The Netherlands, 2020; pp. 33–45. ISBN 978-0-12-817061-8. [Google Scholar]
- Ghigo, A.; Faraggiana, E.; Sirigu, M.; Mattiazzo, G.; Bracco, G. Design and Analysis of a Floating Photovoltaic System for Offshore Installation: The Case Study of Lampedusa. Energies 2022, 15, 8804. [Google Scholar] [CrossRef]
- Lee, Y.-G.; Joo, H.-J.; Yoon, S.-J. Design and installation of floating type photovoltaic energy generation system using FRP members. Sol. Energy 2014, 108, 13–27. [Google Scholar] [CrossRef]
- Suh, J.; Jang, Y.; Choi, Y. Comparison of Electric Power Output Observed and Estimated from Floating Photovoltaic Systems: A Case Study on the Hapcheon Dam, Korea. Sustainability 2020, 12, 276. [Google Scholar] [CrossRef]
- Kim, S.-H.; Yoon, S.-J.; Choi, W. Design and Construction of 1 MW Class Floating PV Generation Structural System Using FRP Members. Energies 2017, 10, 1142. [Google Scholar] [CrossRef]
- Rosa-Clot, M.; Tina, G.M. Floating PV Plants; Elsevier: Amsterdam, The Netherlands, 2020; ISBN 978-0-12-817061-8. [Google Scholar]
- Islam, M.I.; Maruf, M.H.; Al Mansur, A.; Ashique, R.H.; Asif ul Haq, M.; Shihavuddin, A.; Jadin, M.S. Feasibility analysis of floating photovoltaic power plant in Bangladesh: A case study in Hatirjheel Lake, Dhaka. Sustain. Energy Technol. Assess. 2023, 55, 102994. [Google Scholar] [CrossRef]
- Islam, M.I.; Jadin, M.S.; Mansur, A.A.; Kamari, N.A.M.; Jamal, T.; Hossain Lipu, M.S.; Azlan, M.N.M.; Sarker, M.R.; Shihavuddin, A.S.M. Techno-Economic and Carbon Emission Assessment of a Large-Scale Floating Solar PV System for Sustainable Energy Generation in Support of Malaysia’s Renewable Energy Roadmap. Energies 2023, 16, 4034. [Google Scholar] [CrossRef]
- Yousuf, E.H.; Khokhar, M.; Zahid, M.; Kim, J.; Kim, Y.; Cho, E.; Cho, Y.; Yi, J. A Review on Floating Photovoltaic Technology (FPVT). Curr. Photovolt. Res. 2020, 8, 67–78. [Google Scholar] [CrossRef]
- Kenning, T. NLC India to Develop 5MW Floating PV Plant in Andaman and Nicobar Islands. Available online: https://www.pv-tech.org/nlc-india-to-develop-5mw-floating-pv-plant-in-andaman-and-nicobar-islands/ (accessed on 27 February 2025).
- Monborren, L. Ciel & Terre’s Technical Achievement in China: CECEP 70 MWp Floating PV Complex. Available online: https://ciel-et-terre.net/ciel-terres-technical-achievement-in-china-cecep-70-mwp-floating-pv-complex/ (accessed on 27 February 2025).
- Misra, D. Floating Photovoltaic Plant in India: Current Status and Future Prospect. In Proceedings of the International Conference on Thermal Engineering and Management Advances, Paramaribo, Suriname, 5 April 2021; pp. 219–232, ISBN 9789811623462. [Google Scholar]
- Keating, C. BayWa r.e. Starts Building 27.4MWp Floating PV Plant on Dutch Lake. Available online: https://www.pv-tech.org/baywa-r-e-starts-construction-of-27-4mwp-plant-on-dutch-sandpit-lake/ (accessed on 1 March 2025).
- Huang, L.; Elzaabalawy, H.; Sarhaan, M.; Sherif, A.; Ding, H.; Ou, B.; Yang, D.; Cerik, B.C. Developing reliable floating solar systems on seas: A review. Ocean. Eng. 2025, 322, 120525. [Google Scholar] [CrossRef]
- Acharya, M.; Devraj, S. Floating Solar Photovoltaic (FSPV): A Third Pillar to Solar PV Sector; The Energy and Resources Institute (TERI): New Delhi, India, 2019. [Google Scholar]
- Kassem, Y.; Gökçekuş, H.; Gökçekuş, R. Towards Sustainable Energy Solutions: Evaluating the Impact of Floating PV Systems in Reducing Water Evaporation and Enhancing Energy Production in Northern Cyprus. Energies 2024, 17, 5300. [Google Scholar] [CrossRef]
- Clot, M.R.; Clot, P.R.; Carrara, S. Apparatus and Method for Generating Electricity Using Photovoltaic Panels. Available online: https://patents.google.com/patent/US20110168235A1/en (accessed on 1 March 2025).
- Lee, T.D.; Ebong, A.U. A review of thin film solar cell technologies and challenges. Renew. Sustain. Energy Rev. 2017, 70, 1286–1297. [Google Scholar] [CrossRef]
- Trapani, K.; Redón Santafé, M. A review of floating photovoltaic installations: 2007–2013. Prog. Photovolt. Res. Appl. 2015, 23, 524–532. [Google Scholar] [CrossRef]
- Shi, W.; Yan, C.; Ren, Z.; Yuan, Z.; Liu, Y.; Zheng, S.; Li, X.; Han, X. Review on the development of marine floating photovoltaic systems. Ocean. Eng. 2023, 286, 115560. [Google Scholar] [CrossRef]
- Vo, T.T.E.; Ko, H.; Huh, J.; Park, N. Overview of Possibilities of Solar Floating Photovoltaic Systems in the Offshore Industry. Energies 2021, 14, 6988. [Google Scholar] [CrossRef]
- Kanotra, R.; Shankar, R. Floating Solar Photovoltaic Mooring System Design and Analysis. In Proceedings of the OCEANS 2022, Chennai, 21–24 February 2022; pp. 1–9. [Google Scholar]
- Desiderati, J.; Vidal, F.J.; Biroli, M.V.; Wang, S.; Soares, C.G.; Baderiya, N.; Otto, W. Mooring design and analysis for a floating solar system. In Innovations in Renewable Energies Offshore; CRC Press: Boca Raton, FL, USA, 2024; ISBN 978-1-00-355885-9. [Google Scholar]
- Yang, R.-Y.; Yu, S.-H. A Study on a Floating Solar Energy System Applied in an Intertidal Zone. Energies 2021, 14, 7789. [Google Scholar] [CrossRef]
- Wu, S.; Jiang, N.; Zhang, S.; Zhang, P.; Zhao, P.; Liu, Y.; Wang, Y. Discussion on the development of offshore floating photovoltaic plants, emphasizing marine environmental protection. Front. Mar. Sci. 2024, 11, 1336783. [Google Scholar] [CrossRef]
- Fernández-Ruano, S.; Guanche, R.; Redón-Santafé, M.; Pons-Puig, E. On the Importance of Floating Solar Power Plant Mechanics Over Mooring System Design 2025. SSRN 2025. [Google Scholar] [CrossRef]
- Du, J.; Zhang, D.; Zhang, Y.; Xu, K.; Chang, A.; Zhao, S. Design and comparative analysis of alternative mooring systems for offshore floating photovoltaics arrays in ultra-shallow water with significant tidal range. Ocean. Eng. 2024, 302, 117649. [Google Scholar] [CrossRef]
- Whittaker, T.; Folley, M.; Hancock, J. Chapter 5—Environmental Loads, Motions, and Mooring Systems. In Floating PV Plants; Rosa-Clot, M., Marco Tina, G., Eds.; Academic Press: Amsterdam, The Netherlands, 2020; pp. 47–66. ISBN 978-0-12-817061-8. [Google Scholar]
- Houwing, M.; Wiggelinkhuizen, E. Multi Criteria Analysis for the electrical integration of floating offshore solar parks with offshore wind parks. TNO 2021, R10444. Available online: https://repository.tno.nl/SingleDoc?find=UID%209cfcbcef-13a2-4f65-b038-7054b1f64ca8 (accessed on 29 November 2024).
- Nguyen, N.-H.; Le, B.-C.; Nguyen, L.-N.; Bui, T.-T. Technical Analysis of the Large Capacity Grid-Connected Floating Photovoltaic System on the Hydropower Reservoir. Energies 2023, 16, 3780. [Google Scholar] [CrossRef]
- Bullich-Massagué, E.; Cifuentes-García, F.-J.; Glenny-Crende, I.; Cheah-Mañé, M.; Aragüés-Peñalba, M.; Díaz-González, F.; Gomis-Bellmunt, O. A review of energy storage technologies for large scale photovoltaic power plants. Appl. Energy 2020, 274, 115213. [Google Scholar] [CrossRef]
- Aneke, M.; Wang, M. Energy storage technologies and real life applications—A state of the art review. Appl. Energy 2016, 179, 350–377. [Google Scholar] [CrossRef]
- Semeskandeh, S.; Hojjat, M.; Hosseini Abardeh, M. Techno–economic–environmental comparison of floating photovoltaic plant with conventional solar photovoltaic plant in northern Iran. Clean. Energy 2022, 6, 353–361. [Google Scholar] [CrossRef]
- Hafeez, H.; Janjua, A.; Nisar, H.; Shakir, S.; Shahzad, N.; Waqas, A. Techno-economic perspective of a floating solar PV deployment over urban lakes: A case study of NUST lake Islamabad. Sol. Energy 2022, 231, 355–364. [Google Scholar] [CrossRef]
- Nagababu, G.; Bhatt, T.N.; Patil, P.; Puppala, H. Technical and economic analysis of floating solar photovoltaic systems in coastal regions of India: A case study of Gujarat and Tamil Nadu. J. Therm. Anal. Calorim. 2024, 149, 6897–6904. [Google Scholar] [CrossRef]
- Rosa-Clot, M.; Tina, G.M. Chapter 10—Levelized Cost of Energy (LCOE) Analysis. In Floating PV Plants; Rosa-Clot, M., Marco Tina, G., Eds.; Academic Press: Amsterdam, The Netherlands, 2020; pp. 119–127. ISBN 978-0-12-817061-8. [Google Scholar]
- Astariz, S.; Iglesias, G. Wave energy vs. other energy sources: A reassessment of the economics. Int. J. Green Energy 2016, 13, 747–755. [Google Scholar] [CrossRef]
- Astariz, S.; Vazquez, A.; Iglesias, G. Evaluation and comparison of the levelized cost of tidal, wave, and offshore wind energy. J. Renew. Sustain. Energy 2015, 7, 053112. [Google Scholar] [CrossRef]
- Zulfiqar, A.A.; Qureshi, T. Financial Model of Levelized Cost of Electricity (LCOE) for Bioenergy Resources in Pakistan. J. Eng. Res. 2022. [Google Scholar] [CrossRef]
- Wang, X.; Yousuf, E.H.; Chu, M.; Polgampola, C.; Mohammed, S.; Khokhar, M.; Park, S.; Yi, J. High-Efficiency Power Generation for Floating Photovoltaic Systems: Economic Viability and Simulation Analysis. Phys. Status Solidi A 2025, 222, 10. [Google Scholar] [CrossRef]
- Na, S.; Jang, W.; Lee, Y. Economic Feasibility and Strategic Planning for Floating Solar Power Plants in Korea: A Real Options Approach. Sustainability 2025, 17, 137. [Google Scholar] [CrossRef]
- Renewable Power Generation Costs in 2023. Available online: https://www.irena.org/Publications/2024/Sep/Renewable-Power-Generation-Costs-in-2023 (accessed on 16 February 2025).
- Goswami, A.; Sadhu, P.; Goswami, U.; Sadhu, P.K. Floating solar power plant for sustainable development: A techno-economic analysis. Environ. Prog. Sustain. Energy 2019, 38, e13268. [Google Scholar] [CrossRef]
- Tina, G.M.; Bontempo Scavo, F.; Micheli, L.; Rosa-Clot, M. Economic comparison of floating photovoltaic systems with tracking systems and active cooling in a Mediterranean water basin. Energy Sustain. Dev. 2023, 76, 101283. [Google Scholar] [CrossRef]
- Ingo, T.I.; Gyoh, L.; Sheng, Y.; Kaymak, M.K.; Şahin, A.D.; Pouran, H.M. Accelerating the Low-Carbon Energy Transition in Sub-Saharan Africa through Floating Photovoltaic Solar Farms. Atmosphere 2024, 15, 653. [Google Scholar] [CrossRef]
- Asgher, M.N. Design and Analysis of a Hybrid Power System for an Offshore Aquaculture Site in Newfoundland, Canada. Ph.D. Thesis, Memorial University of Newfoundland, St. John’s, NL, Canada, 2024. [Google Scholar]
- Jamroen, C.; Kotchprapa, P.; Chotchuang, S.; Phoket, R.; Vongkoon, P. Design and performance analysis of a standalone floating photovoltaic/battery energy-powered paddlewheel aerator. Energy Rep. 2023, 9, 539–548. [Google Scholar] [CrossRef]
- Jamroen, C. Optimal techno-economic sizing of a standalone floating photovoltaic/battery energy storage system to power an aquaculture aeration and monitoring system. Sustain. Energy Technol. Assess. 2022, 50, 101862. [Google Scholar] [CrossRef]
- Baiyin, B.; Tagawa, K.; Gutierrez, J. Techno-Economic Feasibility Analysis of a Stand-Alone Photovoltaic System for Combined Aquaponics on Drylands. Sustainability 2020, 12, 9556. [Google Scholar] [CrossRef]
- Golroodbari, S.Z.M.; Vaartjes, D.F.; Meit, J.B.L.; van Hoeken, A.P.; Eberveld, M.; Jonker, H.; van Sark, W.G.J.H.M. Pooling the cable: A techno-economic feasibility study of integrating offshore floating photovoltaic solar technology within an offshore wind park. Sol. Energy 2021, 219, 65–74. [Google Scholar] [CrossRef]
- İpekli, Z.; Keskin, S.; Genç, M.S.; Genç, G. Offshore and onshore renewable energy system modelling to meet the energy demand of megacity Istanbul. Process Saf. Environ. Prot. 2024, 190, 34–45. [Google Scholar] [CrossRef]
- Agrawal, K.K.; Jha, S.K.; Mittal, R.K.; Vashishtha, S. Assessment of floating solar PV (FSPV) potential and water conservation: Case study on Rajghat Dam in Uttar Pradesh, India. Energy Sustain. Dev. 2022, 66, 287–295. [Google Scholar] [CrossRef]
- Singh, N.K.; Goswami, A.; Sadhu, P.K. Energy economics and environmental assessment of hybrid hydel-floating solar photovoltaic systems for cost-effective low-carbon clean energy generation. Clean. Technol. Environ. Policy 2023, 25, 1339–1360. [Google Scholar] [CrossRef]
- Nasir, J.; Javed, A.; Ali, M.; Ullah, K.; Kazmi, S.A.A. Sustainable and cost-effective hybrid energy solution for arid regions: Floating solar photovoltaic with integrated pumped storage and conventional hydropower. J. Energy Storage 2023, 74, 109417. [Google Scholar] [CrossRef]
- Jahangir, M.H.; Fakouriyan, S.; Vaziri Rad, M.A.; Dehghan, H. Feasibility study of on/off grid large-scale PV/WT/WEC hybrid energy system in coastal cities: A case-based research. Renew. Energy 2020, 162, 2075–2095. [Google Scholar] [CrossRef]
- Akorede, M.F. 2—Design and performance analysis of off-grid hybrid renewable energy systems. In Hybrid Technologies for Power Generation; Lo Faro, M., Barbera, O., Giacoppo, G., Eds.; Hybrid Energy Systems; Academic Press: Amsterdam, The Netherlands, 2022; pp. 35–68. ISBN 978-0-12-823793-9. [Google Scholar]
- Dellosa, J.T. Simulation and Economic Modelling of a Floating Solar Photovoltaic (FSPV) System using PVSyst. J. Electr. Syst. 2024, 20, 758–777. [Google Scholar] [CrossRef]
- Faruqui, M.F.I.; Jawad, A.; Masood, N.-A. Techno-economic assessment of power generation potential from floating solar photovoltaic systems in Bangladesh. Heliyon 2023, 9, e16785. [Google Scholar] [CrossRef] [PubMed]
- Nguyen, N.-H.; Le, B.-C.; Bui, T.-T. Benefit Analysis of Grid-Connected Floating Photovoltaic System on the Hydropower Reservoir. Appl. Sci. 2023, 13, 2948. [Google Scholar] [CrossRef]
- Sukarso, A.P.; Kim, K.N. Cooling Effect on the Floating Solar PV: Performance and Economic Analysis on the Case of West Java Province in Indonesia. Energies 2020, 13, 2126. [Google Scholar] [CrossRef]
- Filgueira-Vizoso, A.; Cordal-Iglesias, D.; Fernández-Blanco, C.; Fernández-Mira, D.; García-Diez, A.I.; Castro-Santos, L. Economic feasibility of floating offshore solar farms. The case of study of the Levantine-Balearic region of Spain. Energy 2025, 324, 136025. [Google Scholar] [CrossRef]
- Dizier, A. Techno-Economic Analysis of Floating PV Solar Power Plants Using Active Cooling Technique: A Case Study for Taiwan. Master’s Thesis, KTH School of Industrial Engineering and Management, Stockholm, Sweden, 2018. [Google Scholar]
- Muthia, R.; Pramudya, A.S.P.; Maulana, M.R.; Purwanto, W.W. Techno–economic analysis of green hydrogen production by a floating solar photovoltaic system for industrial decarbonization. Clean. Energy 2024, 8, 1–14. [Google Scholar] [CrossRef]
- Lim, L.K.; Ho, W.S.; Hashim, H.; Zubir, M.A.; Muis, Z.A.; Chee, W.C.; Muda, N.; Elias, M.A.; Jais, R.M. Cost optimization of green hydrogen production from floating solar photovoltaic system. Renew. Energy 2025, 245, 122808. [Google Scholar] [CrossRef]
- Al Saadi, K.; Ghosh, A. Investigating the integration of floating photovoltaics (FPV) technology with hydrogen (H2) energy for electricity production for domestic application in Oman. Int. J. Hydrogen Energy 2024, 80, 1151–1163. [Google Scholar] [CrossRef]
- Selj, J.; Wieland, S.; Tsanakas, I.; van Sark, W.; Roosloot, N.; Otnes, G.; Nysted, V.S.; de Jong, M.; Kroon, J.; Micheli, L. Floating Photovoltaic PowerPlants: A Review of Energy Yield, Reliability, and Maintenance. 2025. Available online: https://iea-pvps.org/key-topics/t13-floating-pv-plants-review-2025/ (accessed on 6 July 2025).

| Category | Subcategory | References |
|---|---|---|
| Design and engineering | Solar farm layout optimization, tilt angle, tracking systems | [16,17,18,19,20] |
| Advanced materials (perovskite, bifacial modules, coating) | [21,22,23,24,25,26,27,28,29,30,31] | |
| Hybrid systems | [32,33,34,35,36,37,38,39] | |
| Floating PV vs. ground-mounted PV systems | [2,18,40,41,42,43,44] | |
| Modeling and performance | Energy yield simulations, shading, temperature, degradation analysis, system response modeling | [2,19,22,25,26,27,37,38,41,42,43,45,46,47,48,49,50,51,52,53] |
| Machine learning for production forecasting | [54,55,56] | |
| Environmental impact | Land use vs. biodiversity trade-offs | [6,67] |
| Recycling methods (silicon, rare metals) | [68] | |
| Lifecycle assessment (LCO2) of manufacturing/recycling | [23,51,57,69,70,71] | |
| Ecosystem interaction and site environmental constraints | [8,24,44,57,58,59,60,61,62,63,64,65,66,70] | |
| Economic consideration | LCOE/LCOH reduction | [17,33,35,42,57,69,72,73,74,75,76,77,78,79,80,81] |
| ROI and regulatory framework analysis for regional markets | [67,82] | |
| Site selection | Solar irradiance mapping | [48,58,60,73,77] |
| Grid accessibility and terrain analysis | [6,58] | |
| Socio-political factors (permits, community acceptance) | [6,58] | |
| Emerging Technologies | Green hydrogen integration and energy storage methods | [33,39,55,76,83,84] |
| Climate resilience (storm/dust adaptation) | [74,85,86] |
| Component/Service | Cost According to Study | Notes | Ref. and Year | |
|---|---|---|---|---|
| Structure Made of Galvanized Steel | Mast 3.5–5 EUR/kg | Mast 3.52–5.03 EUR/kg | For substructure that can accommodate 138 modules, price is estimated at EUR 56,000–80,000 | [109]–(2024) |
| Pontoons 3–4 EUR/kg | Pontoons 3.02–4.03 EUR/kg | For substructure that can accommodate 138 modules, price is estimated at EUR 29,100–38,800 | ||
| Structure Made of HDPE | Support for PV module 63 EUR/PV module | Support for the PV module 64.37 EUR/PV module | – | [110]–(2023) |
| Floater 52 EUR/PV module | Floater 53.49 EUR/PV module | – | ||
| Mooring Line | 14.3–64.35 EUR/m | 14.40–64.79 EUR/m | With breaking load of 715 kN | [109,111] (2024), (2014) |
| Anchor | 36–52 EUR/t | 36.24–52.35 EUR/t | – | [109]–(2024) |
| Monofacial Solar Module | 85.41 EUR/piece | 0.174 EUR/Wp | Capacity–565 W | [112] |
| 0.155 USD/Wp | 0.13 EUR/Wp | Capacity–550 W | [113] | |
| 0.21 USD/Wp | 0.185 EUR/Wp | Capacity–300 W | [114] | |
| Bifacial Solar Module | 0.13 USD/Wp | 0.11 EUR/Wp | Capacity–700 W | [115] |
| 0.21 USD/Wp | 0.185 EUR/Wp | Capacity–630 W | [116] | |
| 0.148 EUR/Wp | 0.148 EUR/Wp | Capacity–440 W | [117] | |
| Horizontal Single-Axis Tracking System | 135–700 USD/kWp | 154.26–799.88 EUR/kWp | – | [118]–(2017) |
| Vertical Single-Axis Tracking System | 350–930 USD/kWp | 399.94–1062.70 EUR/kWp | – | [118]–(2017) |
| Dual-Axis Tracking System | 600–1900 USD/kWp | 685.61–2171.11 EUR/kWp | – | [118]–(2017) |
| Floating Single-Axis Tracking System | 2410 USD/kWp | 2640.37 EUR/kWp | – | [119]–(2019) |
| Inter-Array Cable | 360,000 EUR/km | 362,435 EUR/km | – | [120]–(2024) |
| Export Cable | 2180 EUR/MW/km | 2194.75 EUR/MW/km | – | [120,121] (2024), (2016) |
| Onshore Substation | 157,360 EUR/MW | 158,424 EUR/MW | – | [120]–(2024) |
| Inverter | 0.1 USD/Wp | 0.11 EUR/Wp | – | [110]–(2020) |
| 33,137 USD/unit | 0.133 EUR/Wp | – | [110]–(2023) | |
| Transformer | 150,000 USD/unit | 48,519.87 EUR/MVA | – | [110]–(2023) |
| Development and Consent | 245,000 EUR/MW | 300,918 EUR/MW | Derived from actual data from offshore wind fields | [122]–(2020) |
| $1,239,411.59/project | 973,730 EUR/MW | – | [123]–(2023) | |
| Installation | 2–12 million EUR/MW | 2–12.08 million EUR/MW | Distance from shore from 0 to 100 km | [120]–(2024) |
| 1,204,107.26 USD/project | 945,993.92 EUR/MW | – | [123]–(2023) | |
| Operating Expenditure | 0.01–0.0148 million EUR/MW/year | 0.01–0.0149 million EUR/MW/year | Depending on distance from shore from 0 to 100 km | [120]–(2024) |
| Title of Study and Year | LCOH from Study | LCOH | Location | FPV Capacity | Ref. |
|---|---|---|---|---|---|
| Green Hydrogen Production via Floating Photovoltaic Systems on Irrigation Reservoirs: An Italian Case Study (2025) | 13.18–20.79 EUR/kg | 13.18–20.79 EUR/kg | Pappadai reservoir | 32.7–163.5 MWp | [76] |
| Cost Optimization of Green Hydrogen Production from Floating Solar Photovoltaic System (2025) | 4.389–4.73 USD/kg | 3.84–4.14 EUR/kg | Tasik Kenyir reservoir | 2108–2350 MWp | [201] |
| Investigating the Integration of Floating Photovoltaics (FPV) Technology with Hydrogen (H2) Energy for Electricity Production for Domestic Application in Oman (2024) | 29.7 USD/kg | 26.79 EUR/kg | Wadi Dayqah dam | 26.57 MWp | [202] |
| Synergistic Sizing and Energy Management Strategy of Combined Offshore Wind with Solar Floating PV System for Green Hydrogen and Electricity Co-Production Using Multi-Objective Dung Beetle Optimization (2025) | 1.205 USD/kg | 1.06 EUR/kg | South of the Red Sea | 180 kWp | [33] |
| Techno–Economic Analysis of Green Hydrogen Production by a Floating Solar Photovoltaic System for Industrial Decarbonization (2024) | 20.37–26.95 USD/kg | 18.33–24.25 EUR/kg | Jatiluhur reservoir | 518.4 MWp | [200] |
Disclaimer/Publisher’s Note: The statements, opinions and data contained in all publications are solely those of the individual author(s) and contributor(s) and not of MDPI and/or the editor(s). MDPI and/or the editor(s) disclaim responsibility for any injury to people or property resulting from any ideas, methods, instructions or products referred to in the content. |
© 2025 by the authors. Licensee MDPI, Basel, Switzerland. This article is an open access article distributed under the terms and conditions of the Creative Commons Attribution (CC BY) license (https://creativecommons.org/licenses/by/4.0/).
Share and Cite
Manolache, M.; Manolache, A.I.; Andrei, G. Floating Solar Energy Systems: A Review of Economic Feasibility and Cross-Sector Integration with Marine Renewable Energy, Aquaculture and Hydrogen. J. Mar. Sci. Eng. 2025, 13, 1404. https://doi.org/10.3390/jmse13081404
Manolache M, Manolache AI, Andrei G. Floating Solar Energy Systems: A Review of Economic Feasibility and Cross-Sector Integration with Marine Renewable Energy, Aquaculture and Hydrogen. Journal of Marine Science and Engineering. 2025; 13(8):1404. https://doi.org/10.3390/jmse13081404
Chicago/Turabian StyleManolache, Marius, Alexandra Ionelia Manolache, and Gabriel Andrei. 2025. "Floating Solar Energy Systems: A Review of Economic Feasibility and Cross-Sector Integration with Marine Renewable Energy, Aquaculture and Hydrogen" Journal of Marine Science and Engineering 13, no. 8: 1404. https://doi.org/10.3390/jmse13081404
APA StyleManolache, M., Manolache, A. I., & Andrei, G. (2025). Floating Solar Energy Systems: A Review of Economic Feasibility and Cross-Sector Integration with Marine Renewable Energy, Aquaculture and Hydrogen. Journal of Marine Science and Engineering, 13(8), 1404. https://doi.org/10.3390/jmse13081404