Article

Sound Production Characteristics of the Chorus Produced by Small Yellow Croaker (Larimichthys polyactis) in Coastal Cage Aquaculture

1
Sea Power Reinforcement·Security Research Department, Korea Institute of Ocean Science & Technology (KIOST), Busan 49111, Republic of Korea
2
Tongyeong Maritime Test and Evaluation Station, Korea Institute of Ocean Science & Technology (KIOST), Tongyeong 53087, Republic of Korea
*
Author to whom correspondence should be addressed.
J. Mar. Sci. Eng. 2025, 13(7), 1380; https://doi.org/10.3390/jmse13071380
Submission received: 9 June 2025 / Revised: 7 July 2025 / Accepted: 18 July 2025 / Published: 21 July 2025
(This article belongs to the Special Issue Advanced Research in Marine Environmental and Fisheries Acoustics)

Abstract

Recent advances in passive acoustic monitoring (PAM) have markedly improved the ability to study marine soundscapes by enabling long-term, non-invasive monitoring of biological sounds across large spatial and temporal scales. Among aquatic organisms, fish are primary contributors to biophony, producing sounds associated with feeding, reproduction, and social behavior. However, the majority of previous research has focused on individual vocalizations, with limited attention to collective acoustic phenomena such as fish choruses. This study quantitatively analyzes choruses produced by the small yellow croaker (Larimichthys polyactis), an ecologically and commercially important species in the Northwest Pacific Ocean. Using power spectral density (PSD) analysis, we examined long-term underwater recordings from a sea cage containing approximately 2000 adult small yellow croakers. The choruses were centered around ~600 Hz and exhibited sound pressure levels 15–20 dB higher at night than during the day. These findings highlight the ecological relevance of fish choruses and support their potential use as indicators of biological activity. This study lays the foundation for incorporating fish choruses into soundscape-based PAM frameworks to enhance biodiversity and habitat monitoring.

1. Introduction

Recent advances in passive acoustic monitoring (PAM) technologies have brought a transformative shift in the study of ocean soundscapes [1,2,3]. Advancements in high-capacity data storage and the adoption of cloud-based data management systems have enabled researchers to manage large-scale acoustic datasets more efficiently [1,3,4,5]. In parallel, improvements in signal processing and machine learning techniques have facilitated the automatic detection and classification of marine biological sounds [6,7,8,9,10]. The emergence of affordable hydrophones and compact PAM devices has markedly reduced the cost of long-term monitoring, facilitating sustained deployments across diverse marine environments [2]. These technological innovations have improved the accessibility of the ocean soundscape research and expanded its applications to a broad range of biological domains, including biodiversity assessment, ecosystem dynamics, ecological processes, and habitat health monitoring [1,11,12,13,14,15,16].
A wide array of marine organisms—from cetaceans to small invertebrates—produce sounds in the ocean [17]. Several species, including marine mammals and fishes, depend on acoustic cues for navigation, habitat selection, predator and prey detection, and social communication [16,18,19,20,21,22,23]. These sounds reflect a variety of physiological and behavioral processes that are critical for survival. Amidst the ongoing decline in global biodiversity and the increasing alteration of underwater ocean soundscapes by anthropogenic activities, there is a growing need to document, quantify, and interpret biological sound sources [3]. Understanding biological sounds is not limited to simple recording; it plays a vital role in conservation biology, ecosystem health assessment, and the evaluation of human impacts on the marine environment [3,16].
Fishes, in particular, represent a taxonomic group with extensive acoustic diversity. Over 800 species across dozens of families and orders are now known to produce sounds [1,17,24]. Fish are among the most widespread sources of biological sound in the marine environment, often producing sounds associated with key behaviors such as foraging, territorial defense, and reproduction [17]. Given their distribution, behavioral relevance, and ecological importance, fish vocalizations warrant prioritized attention in ocean soundscape research [1].
This study focuses on the small yellow croaker (Larimichthys polyactis), a species of ecological and commercial importance in the Northwest Pacific Ocean [25,26,27]. The species primarily inhabits coastal waters, typically at depths shallower than 90 m and within a temperature range of 7–25 °C [28]. Its spawning season extends from March to June, with major spawning grounds located in the Yellow Sea and the East China Sea [29,30]. The small yellow croaker is known to form large schools and is notably distinguished for emitting broadband pulsed calls during the spawning period [31].
The aim of this study was to develop a representative acoustic database for the small yellow croaker by analyzing fish choruses rather than individual calls, which accurately reflect the collective vocal behavior of the species. To characterize these choruses, we used power spectral density (PSD) analysis, a widely applied method for examining how acoustic energy is distributed across frequencies. PSD is particularly effective in identifying species-specific acoustic patterns and capturing both temporal and spectral trends in long-term recordings [32,33,34]. The aim of this approach is to reduce the complexity of extended acoustic datasets and provide a quantitative analysis of fish chorus activity.
The quantitative characterization of such choruses provides essential information on biophony—the biological component of ocean soundscapes—and provides a foundation for incorporating fish-generated sounds into broader ecological monitoring frameworks. These insights can ultimately support the development of passive acoustic indicators for species presence, reproductive timing, and habitat use, thereby enhancing the utility of soundscape-based approaches in marine biodiversity assessment and ecosystem management [35]. Furthermore, the characterization of fish choruses, particularly those associated with reproductive behavior, holds potential value for sustainable fisheries management. By identifying the timing and location of spawning activity, such acoustic data can contribute to the development of spatially and temporally informed management strategies, including seasonal closures and the protection of spawning habitats [35,36].

2. Materials and Methods

2.1. Measurement of Biological Fish Sound

The sounds of the small yellow croaker were recorded and analyzed by the Maritime Test and Evaluation Station at the Korea Institute of Ocean Science and Technology (KIOST). Approximately 2000 adult small yellow croakers, each measuring 25 to 30 cm in total length, were held in a sea cage where they swam freely and produced biological sounds. The aquaculture sea cage measured 12 m (length) × 6 m (width) × 6 m (depth), and the water depth at the installation site was 20 m. An underwater self-recording hydrophone (SM3M, Wildlife Acoustics, Inc., Maynard, MA, USA) was deployed to continuously record acoustic data over a 1-month period, from 26 April to 25 May 2024. The hydrophone was positioned at approximately 3 m depth in the center of the sea cage. The receiving voltage sensitivity (RVS) of the hydrophone was set to −164.6 dB V/µPa, with a gain of 0 dB and a sampling frequency of 48 kHz. The small yellow croaker sounds were stored as digital files (*.wav) every 10 min.

2.2. Analysis of Acoustic Data

The audio .WAV files containing fish sounds were analyzed using MATLAB (R2023a, Mathworks, Natick, MA, USA). To quantify the chorus generated by the fish, the PSD analysis was performed using the Welch method [37]. For the entire dataset, the PSD was calculated using 1-s segments with a Hamming window and 50% overlap. The resulting PSDs were then averaged by intensity to represent the PSD over a 1 min interval. Due to the high level of spectral roughness observed in the 1-min averaged PSD results, a moving average filter was applied to smooth the PSD curve. The smoothed PSD was then used to extract acoustic parameters, including peak frequency, 3 dB bandwidth, total bandwidth, minimum and maximum frequencies, and sound pressure level (SPL). The peak frequency was defined as the frequency with the highest energy in the PSD. The 3 dB bandwidths represent the frequency ranges where the energy level decreases by 3 dB relative to the peak frequency. The maximum and minimum frequencies correspond to the upper and lower limits of the 5-dB bandwidth, respectively. The SPL can be calculated by summing the PSD over all frequency bins and converting it to decibels.

3. Results

The acoustic signals produced by the small yellow croaker are structurally characterized by one or more short pulses occurring at regular intervals, forming continuous pulse trains that combine to constitute a single sound (Figure 1A). This vocal pattern is typical of croaker species, where individual signals appear as pulses with consistent amplitude and spacing over time. However, under the field conditions of this study, where numerous individuals were densely aggregated within the same water column, individual signals were rarely detected. Instead, the majority of the received sounds appeared as choruses, composed of overlapping emissions from multiple individuals. In moderate-intensity choruses (Figure 1B), mixed signals from several individuals generated a relatively diffuse spectral structure spanning the 0.2–1.2 kHz range, with intermittent concentrations of energy observed during specific time intervals. When an extremely large number of individuals vocalized simultaneously, individual signals became indistinguishable, leading to a marked increase in the overall SPL (Figure 1C). Spectrograms in Figure 1A–C were generated for illustrative purposes using PSD analysis with a 0.01 s Hamming window and 50% overlap. This approach differs from the PSD-based analysis of the full dataset, which used 1 s segments.
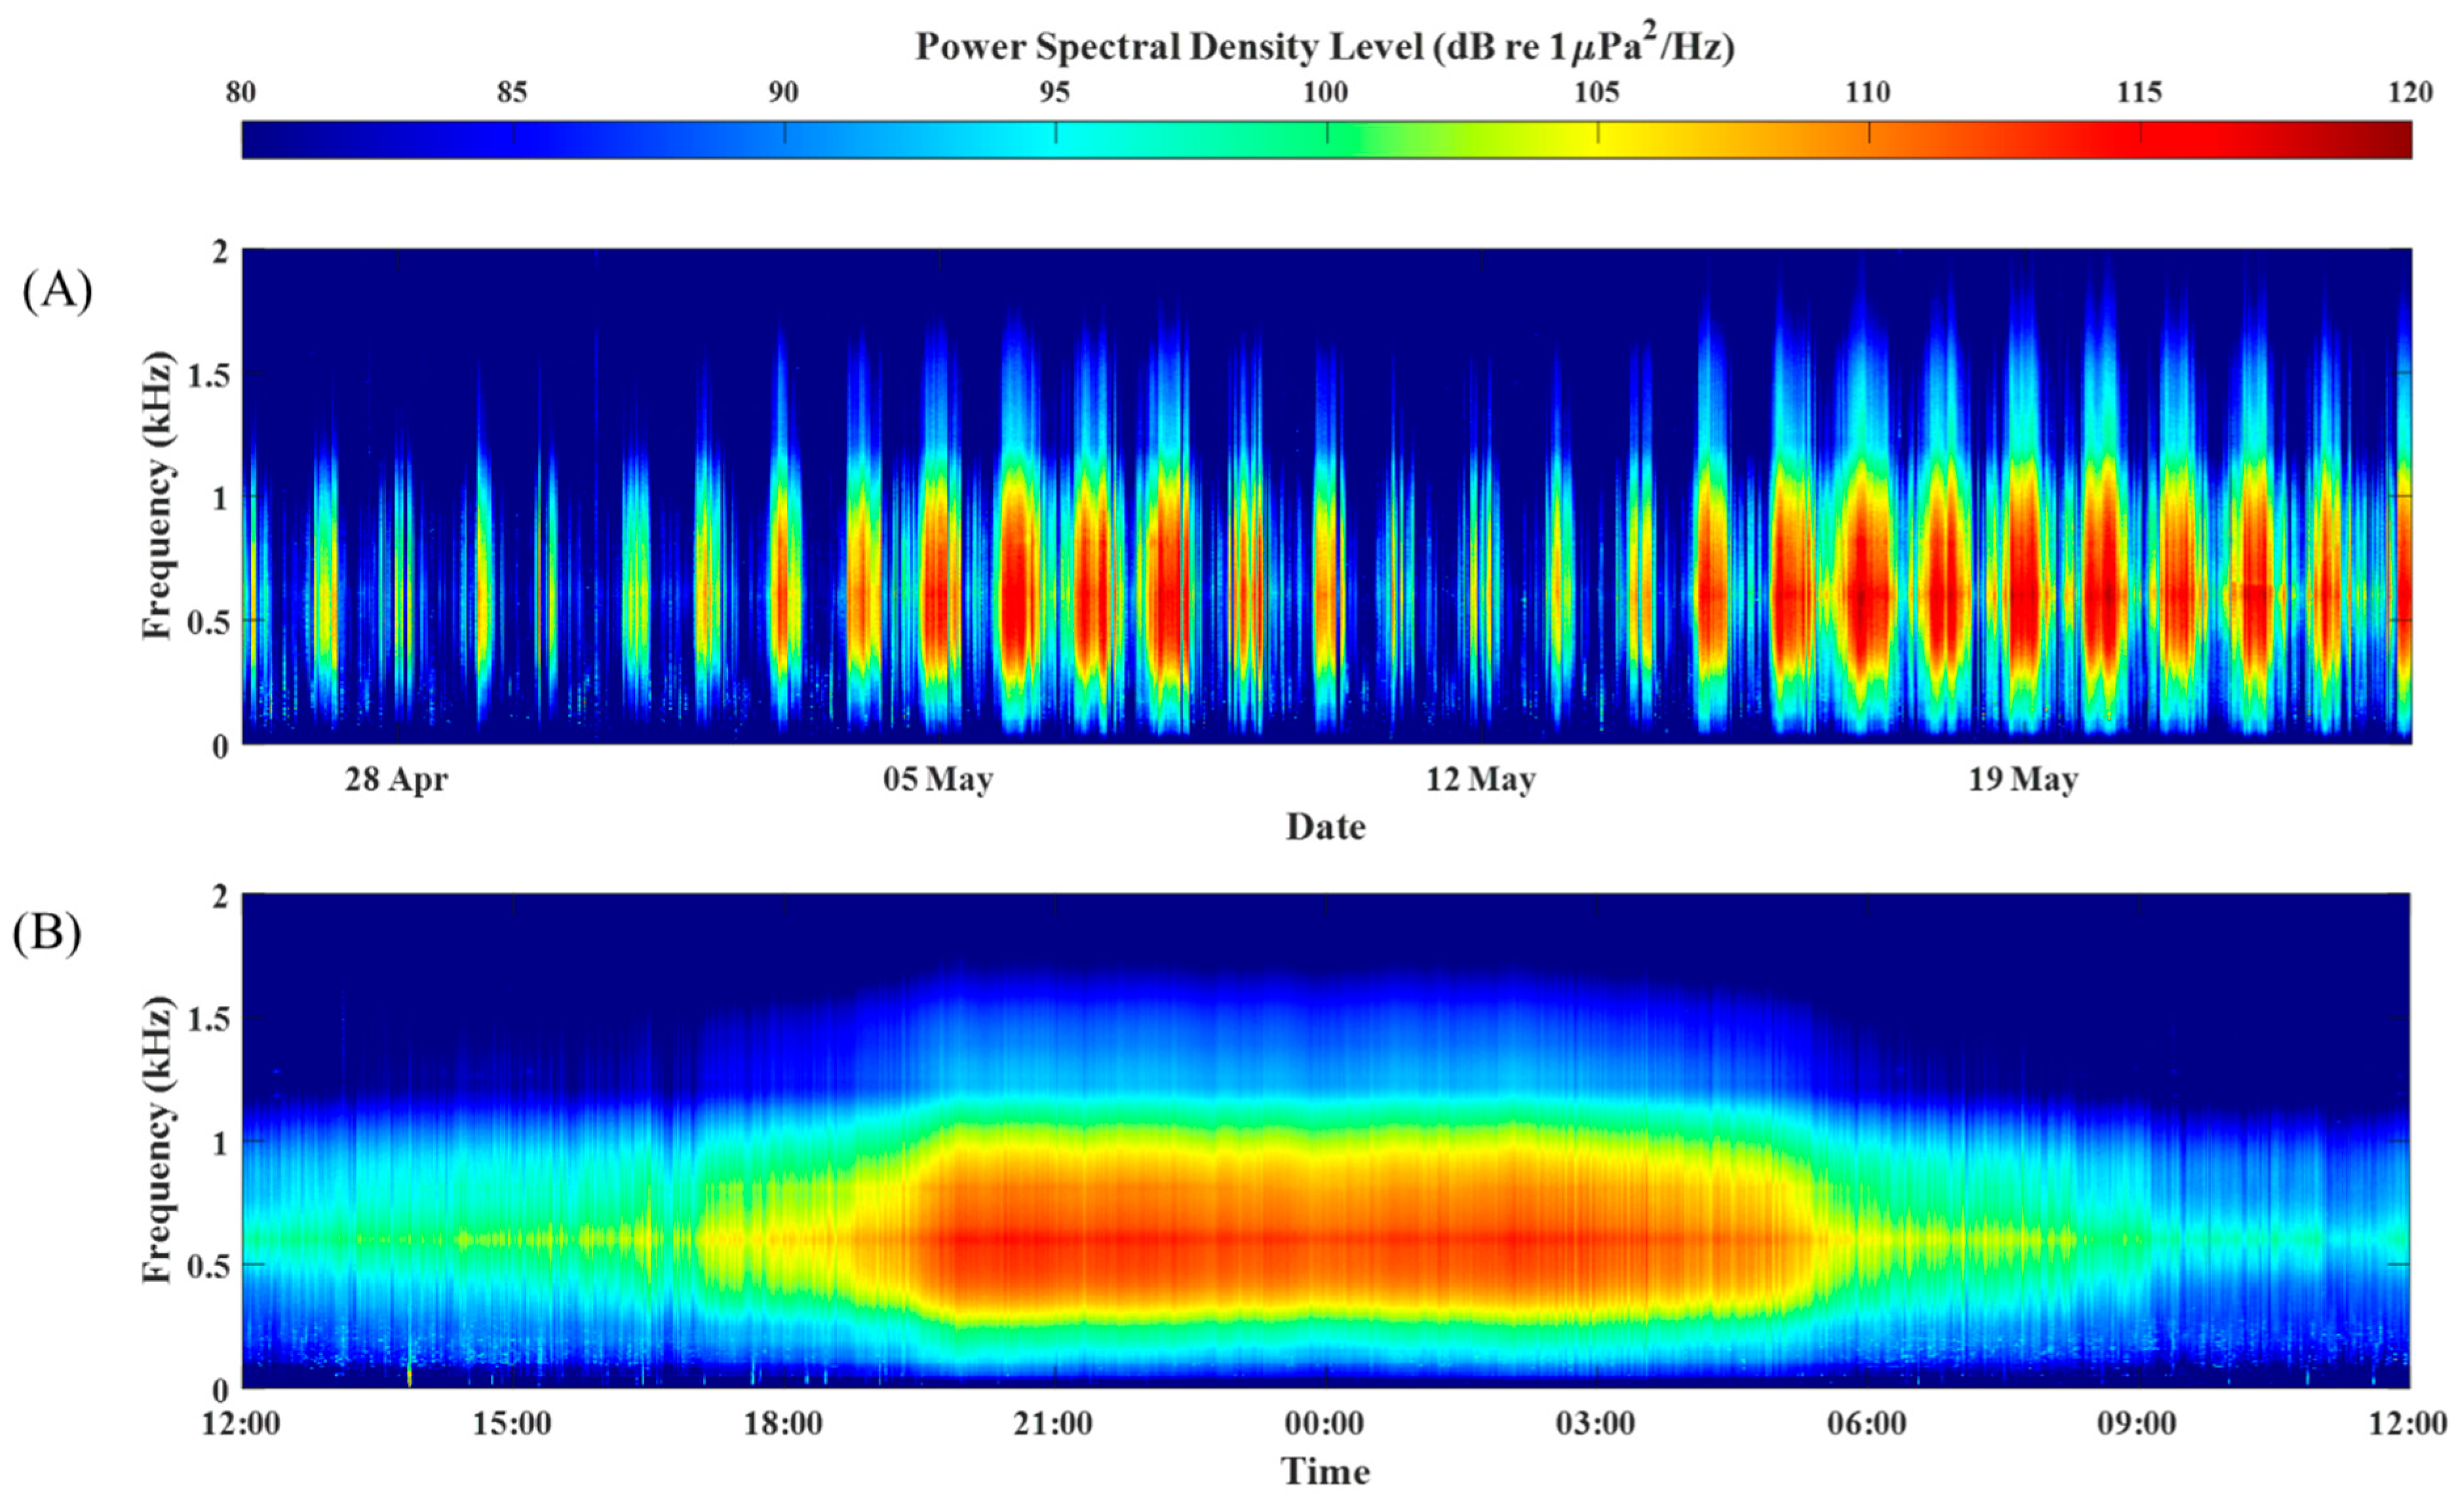
Throughout the recording period, the frequency and temporal characteristics of biological sounds, particularly fish choruses, detected in the underwater acoustic environment were visualized using spectrograms (Figure 2). High-energy signals within the 300–1000 Hz range, characteristic of fish vocalizations, were observed daily, displaying a clear and recurring pattern predominantly concentrated during nighttime hours (Figure 2A). To quantitatively assess the periodicity and intensity of this pattern, the data were divided into 24 h windows aligned to local noon (12:00), and the PSD was averaged for each hourly segment to generate a daily mean spectrogram (Figure 2B). The results confirmed that intense biological acoustic activity peaked around midnight, particularly from sunset to sunrise.
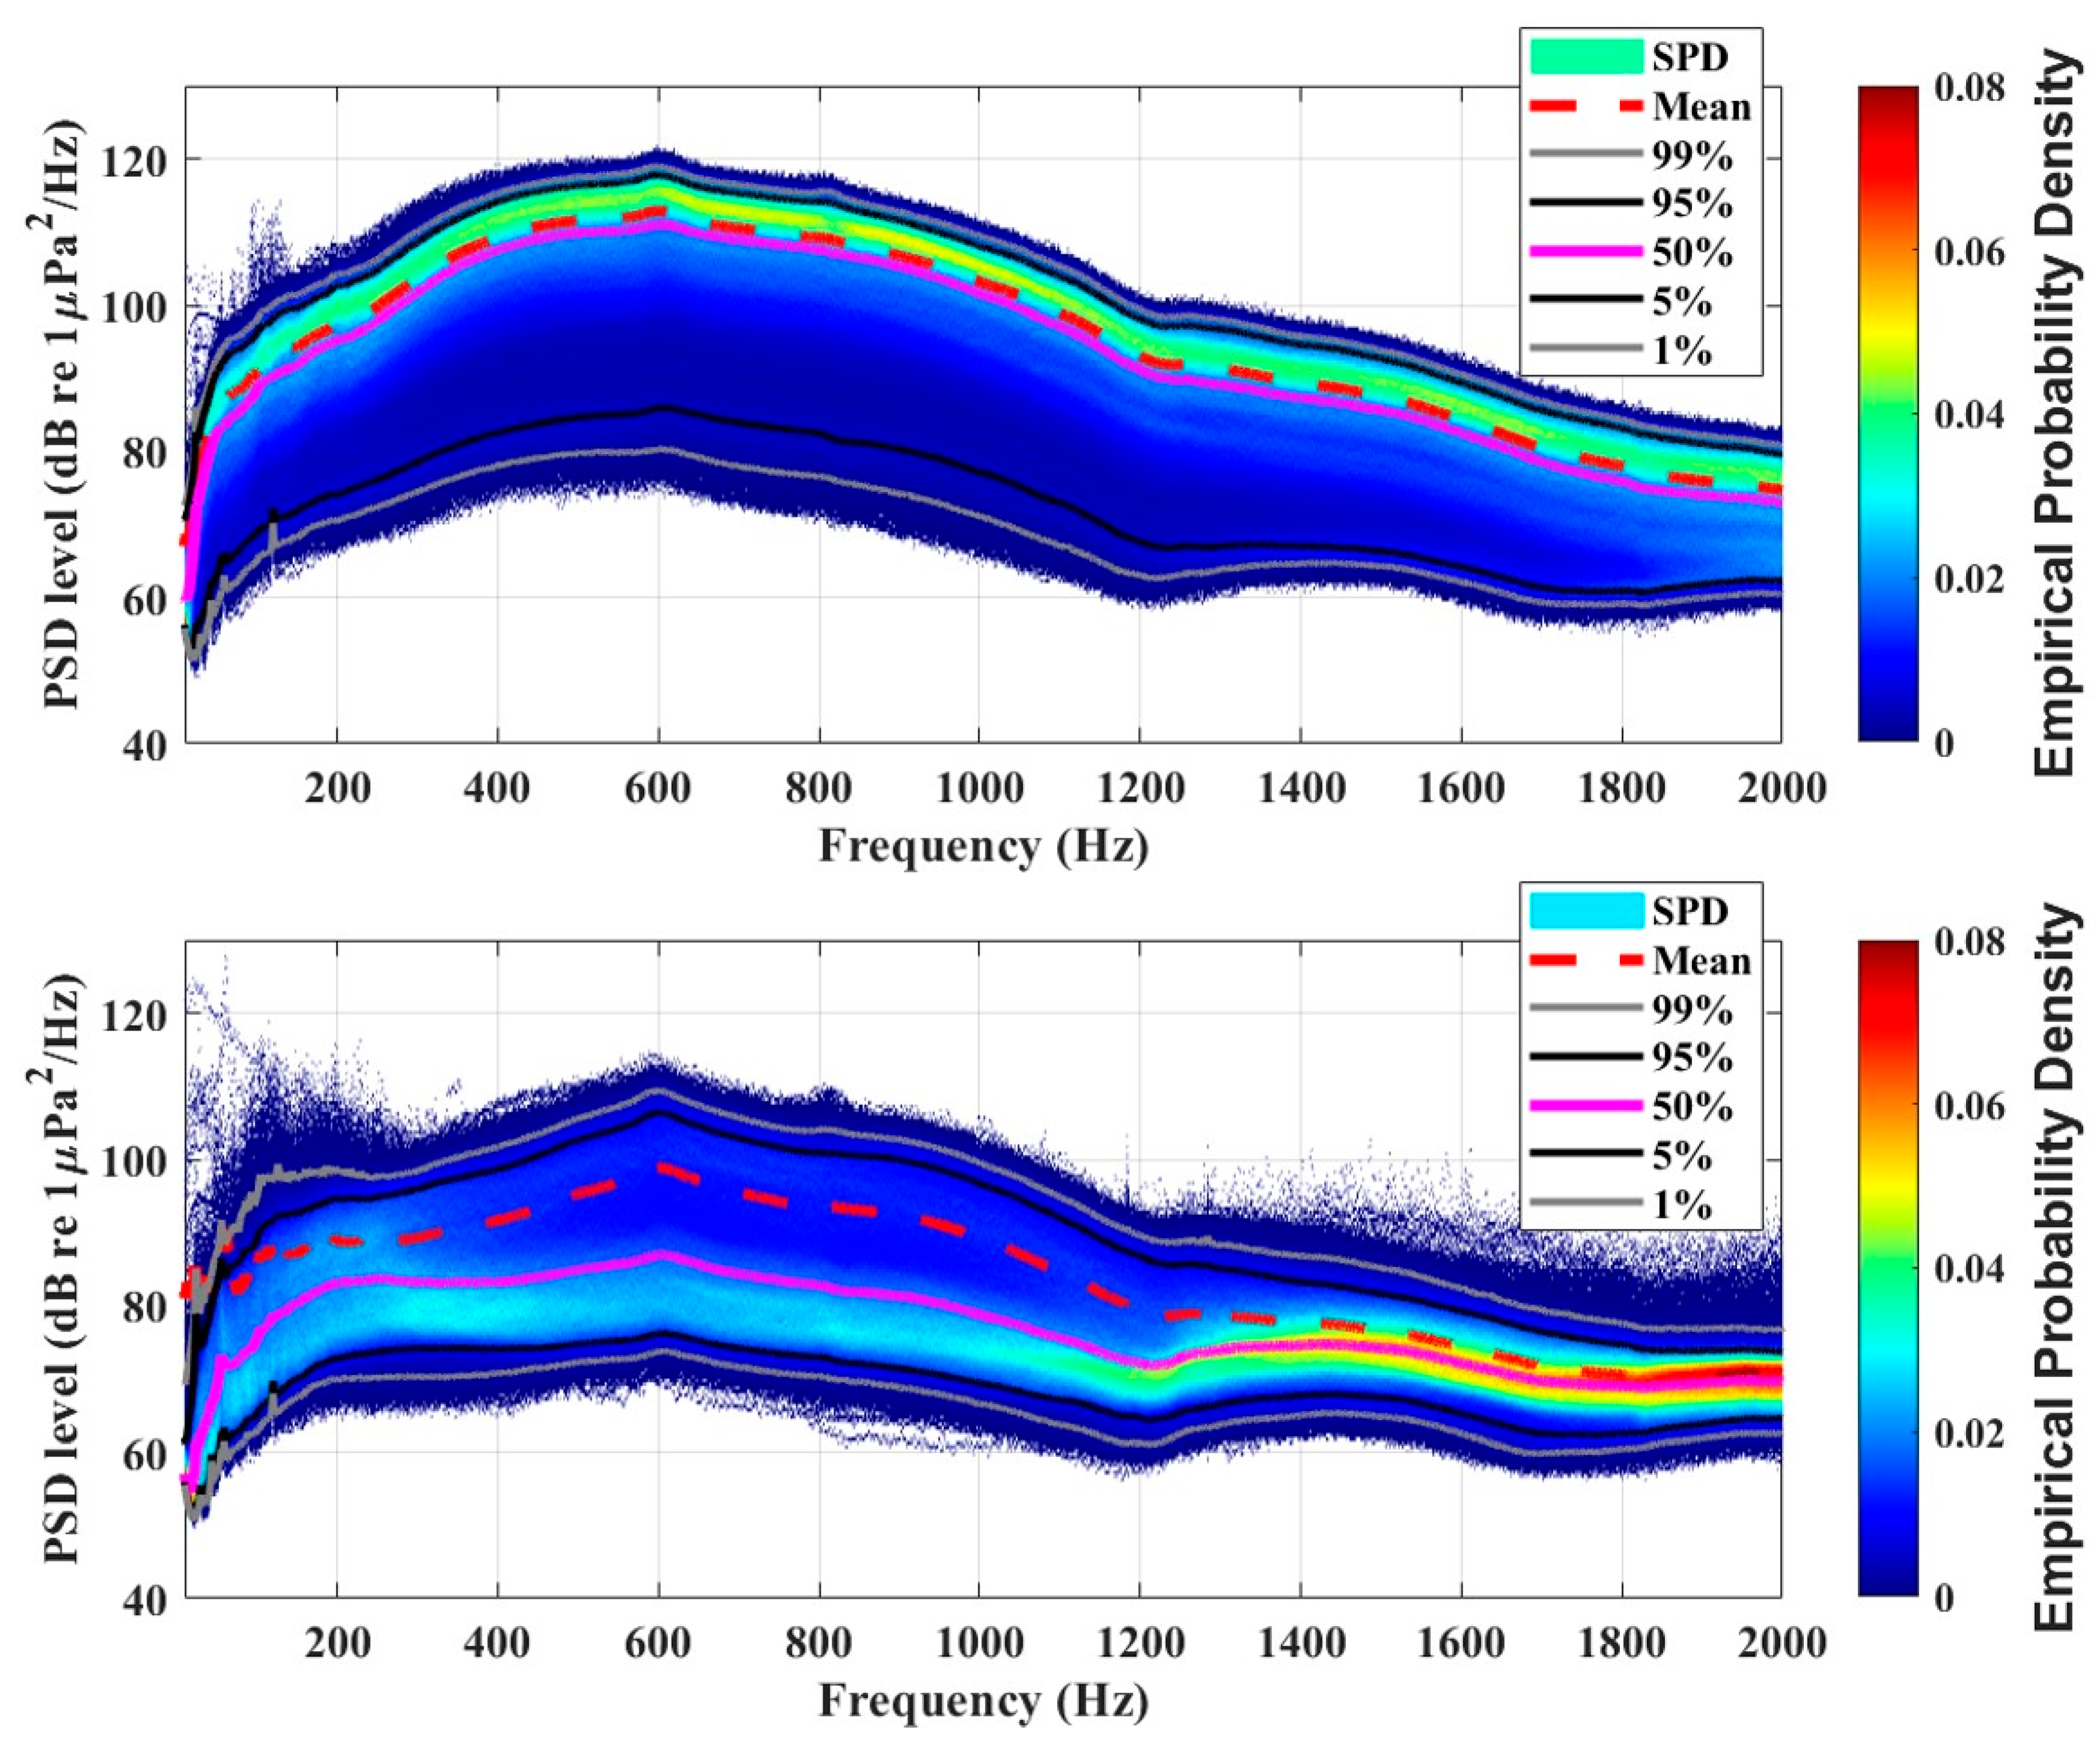
To more clearly identify the differences in the acoustic environment between daytime and nighttime, probability density-based distributions of PSD were analyzed for two 6 h periods: daytime (centered on noon, ±3 h) and nighttime (centered on midnight, ±3 h) (Figure 3). The results revealed a broad range of high-energy PSD values within the 300–1000 Hz frequency band, with both mean and median PSD levels significantly higher during nighttime across all frequencies. Notably, within the 500–700 Hz range, the average nighttime PSD was consistently 10–15 dB higher than the daytime levels. In contrast, daytime PSD distributions in this frequency band exhibited lower central tendencies and upper percentiles, along with a markedly reduced occurrence of high-energy components.
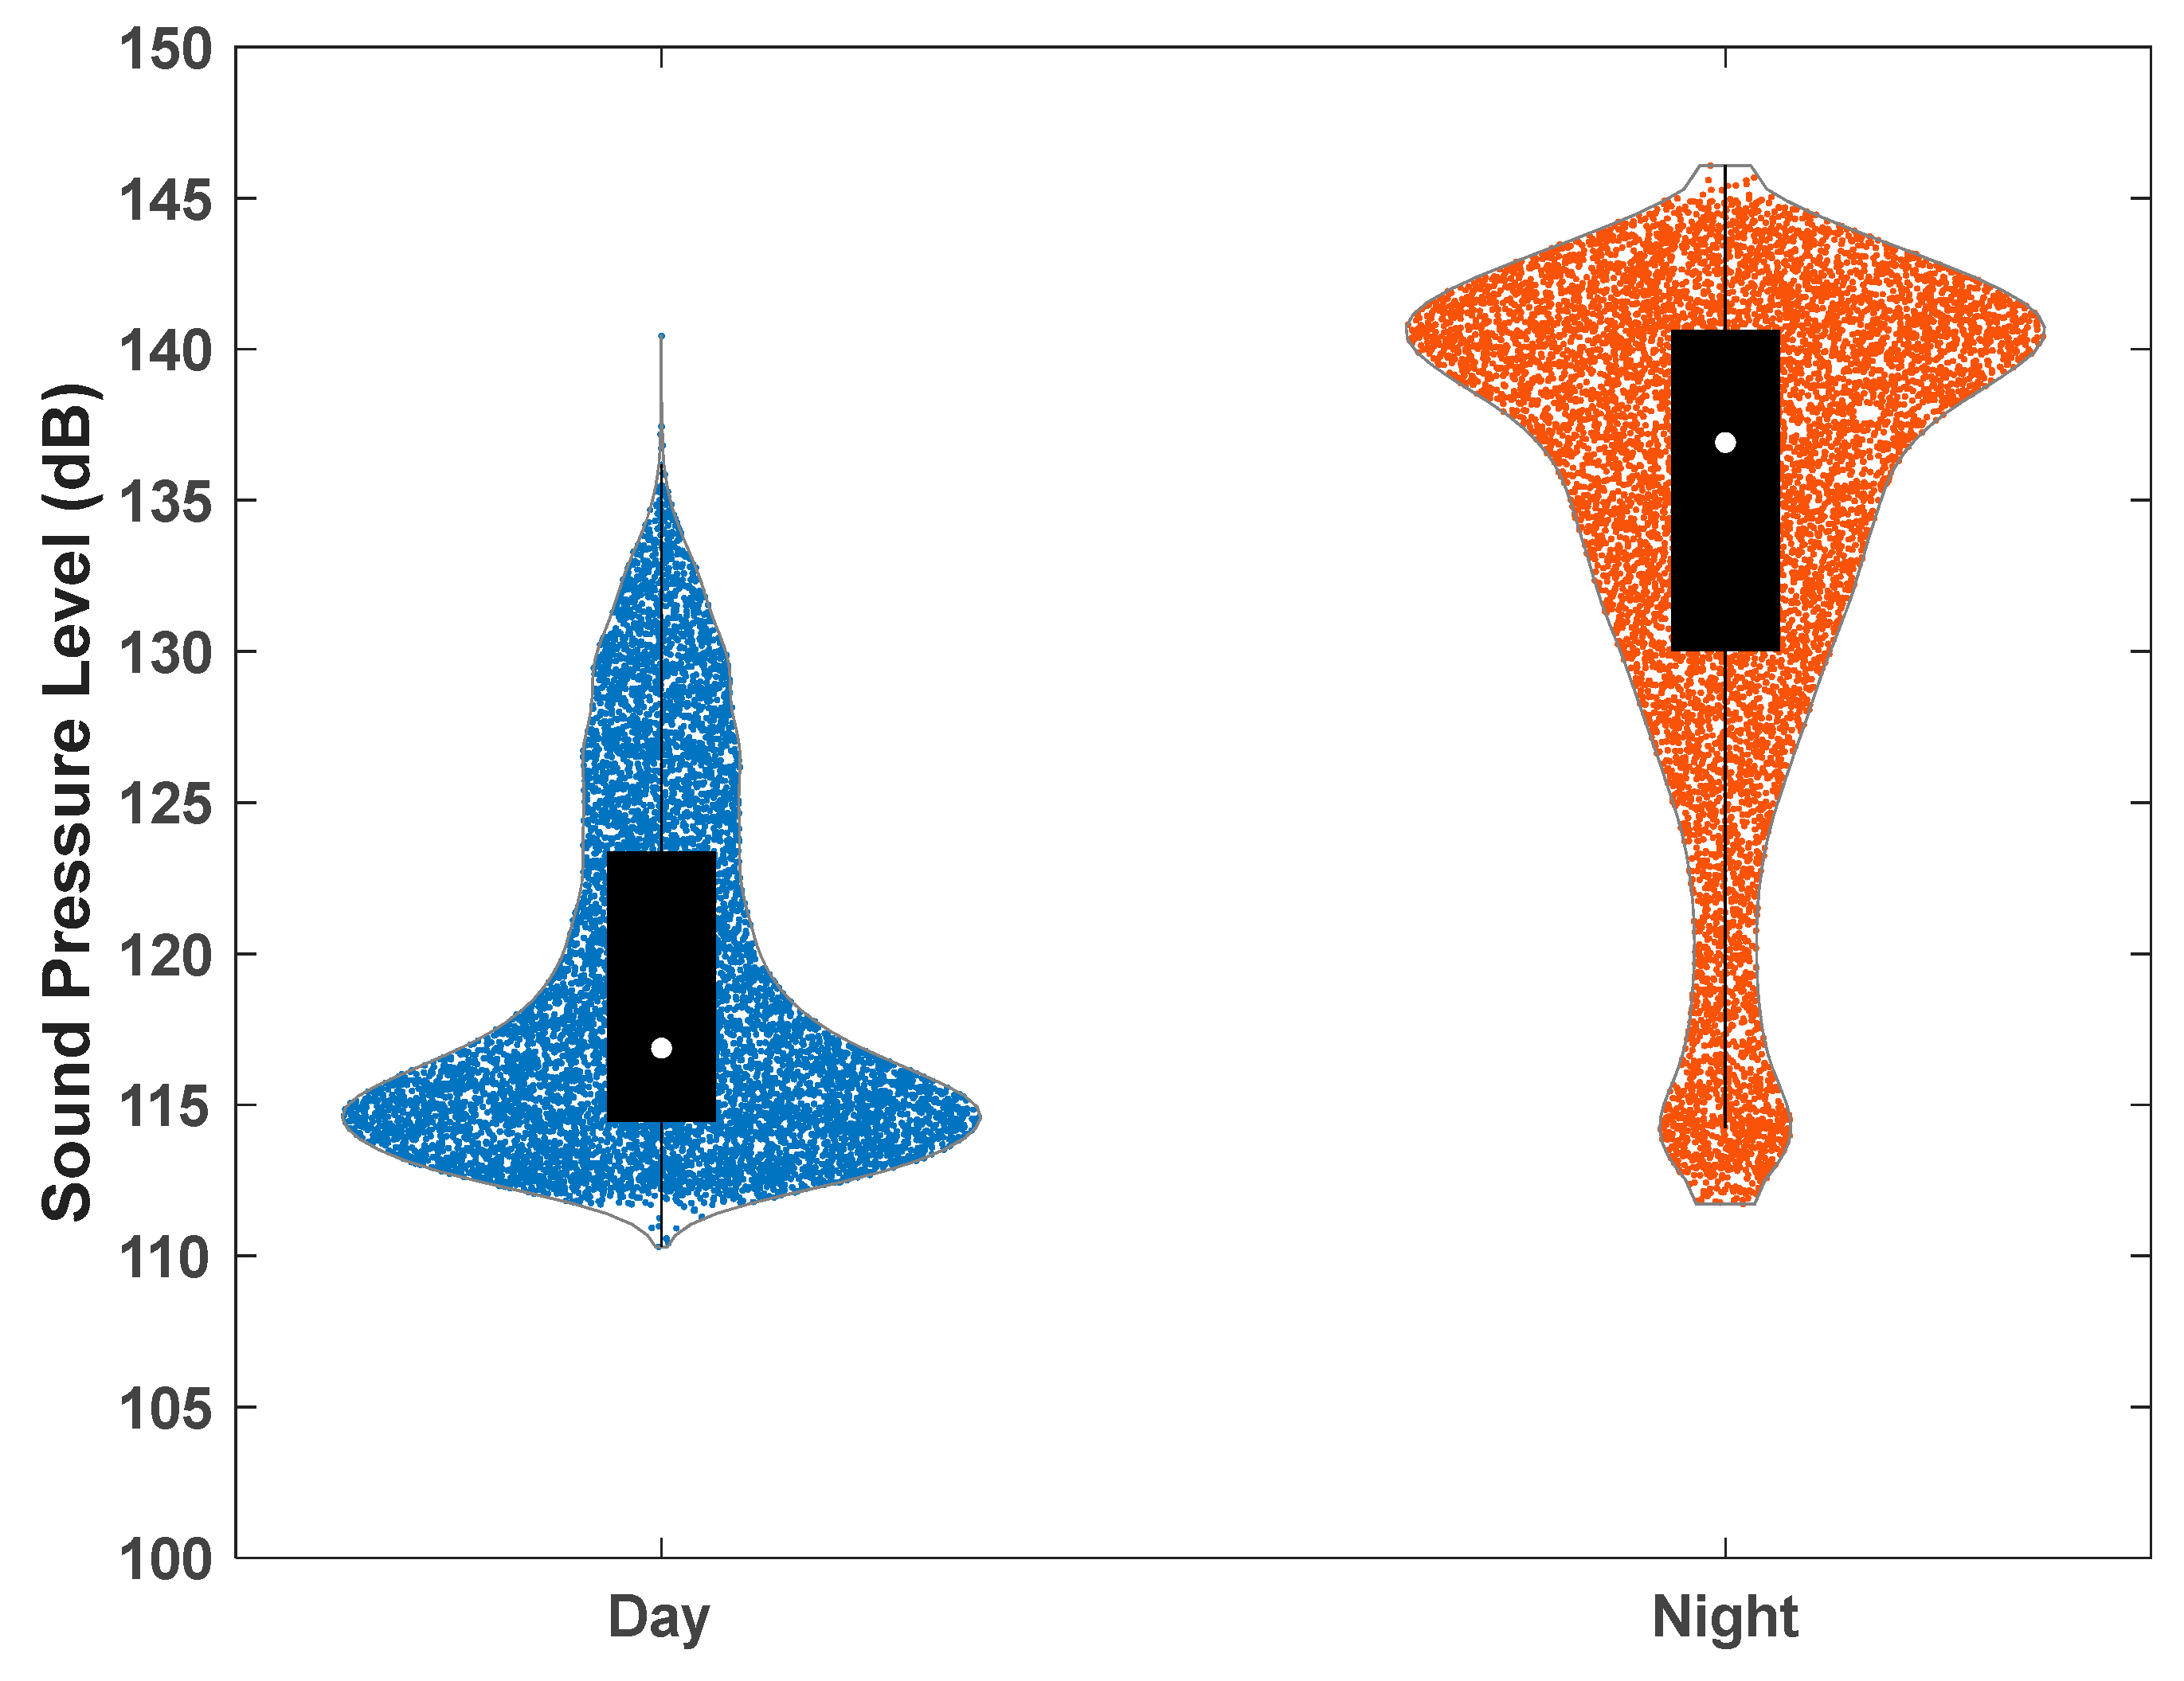
Figure 4 presents a comparison of the SPL distributions between day and night periods using violin plots. Each plot simultaneously visualizes the distribution shape, density, median, and mean values, facilitating intuitive assessment of the acoustic characteristics for each period. During the daytime, the SPL distribution was concentrated in the lower sound pressure range, exhibiting a relatively narrow spread and fewer high-energy sound events. The mean SPL during the day was 119.1 dB, with a median of 116.9 dB. In contrast, the nighttime distribution shifted toward higher SPL values, with a wider spread and frequent occurrences of elevated sound levels. The mean and median SPL values were 134.2 dB and 136.9 dB, respectively, both significantly higher than the daytime values. These differences in distribution suggest that biological acoustic activity is more intense at night, providing quantitative evidence of structural changes in the underwater acoustic environment across diel cycles.
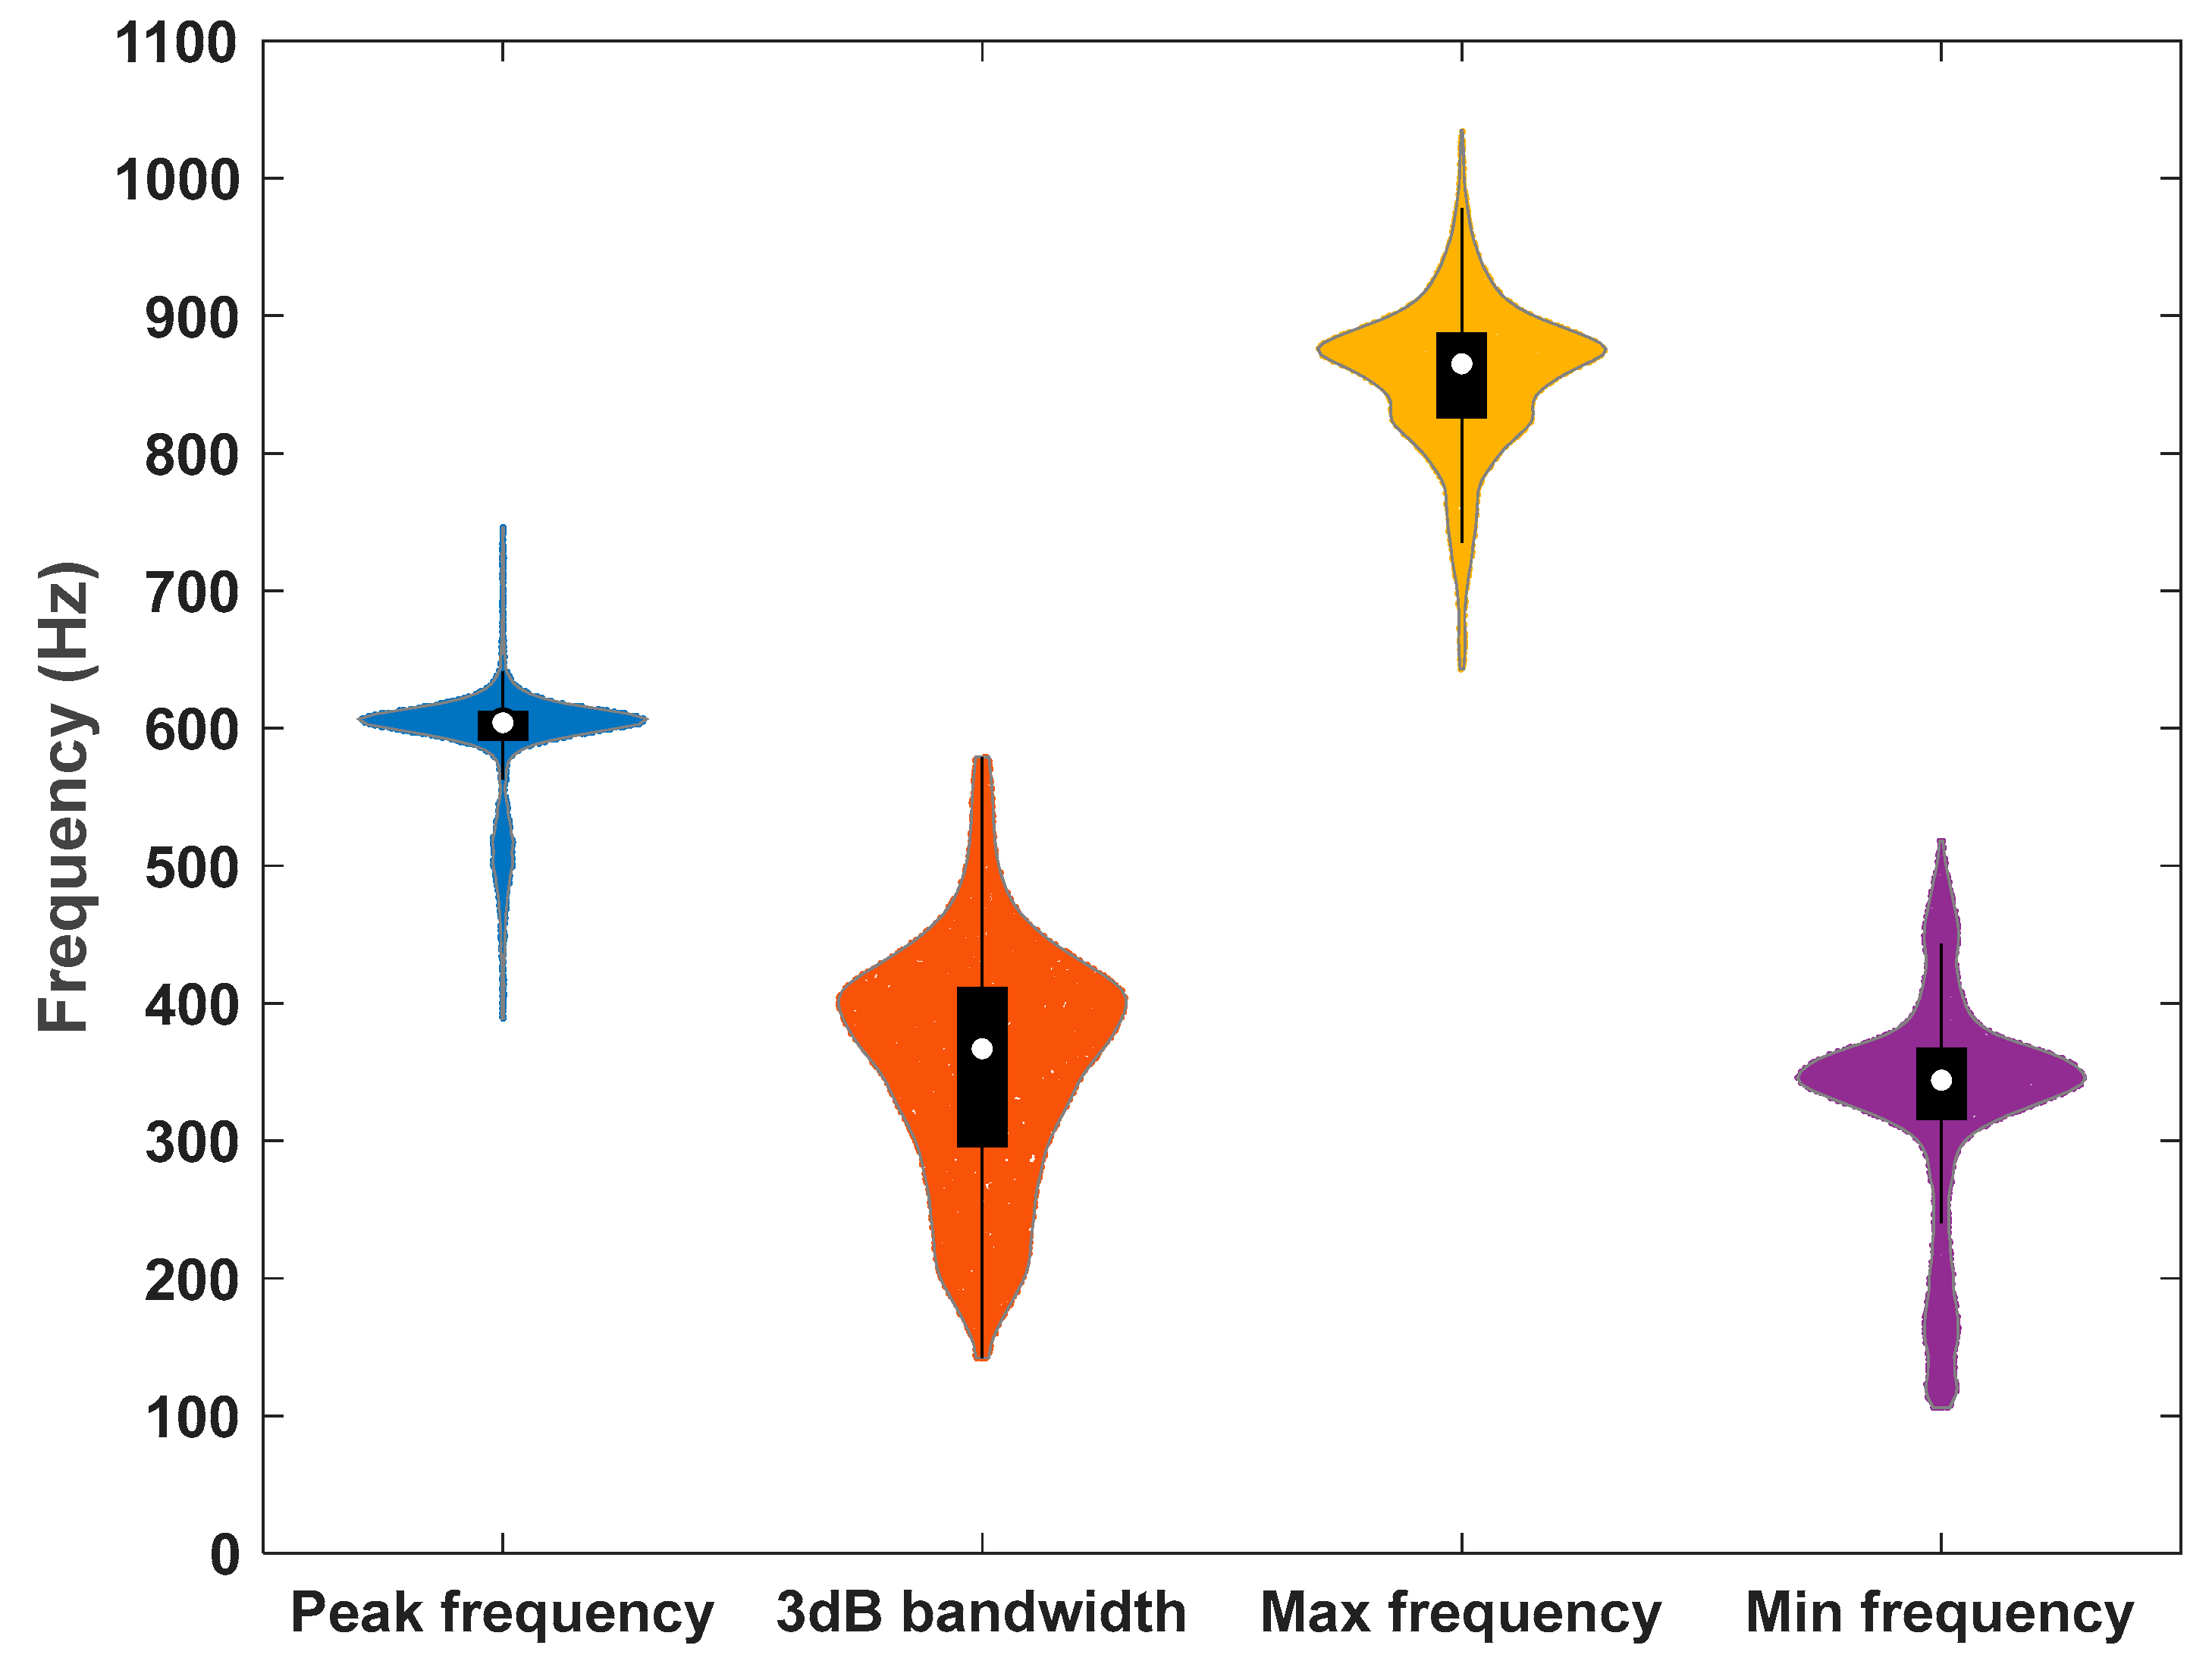
To investigate the acoustic characteristics of the choruses produced by the small yellow croaker, we analyzed the PSD signals recorded during the period between sunset and sunrise (Figure 5). Although exact times varied slightly by date, sunset generally occurred around 19:30 and sunrise near 05:30. For all dates, data within this time window were used for analysis. The dataset included tonal noise components likely caused by vessel activity, which introduced distortions in the overall distribution. To minimize the impact of these outliers and more accurately characterize the distribution, only data within the 95% confidence interval were included in the analysis.
The peak frequency was tightly clustered around 600 Hz, showing a narrow and symmetrical distribution. The median peak frequency was 604 Hz, with a modal value of 605.8 Hz. The 3 dB bandwidth displayed a broader distribution, ranging approximately from 300 to 400 Hz. The distribution was asymmetric, with a long tail extending toward lower frequencies. The median 3 dB bandwidth was 367 Hz, and the mode was 401.0 Hz. The maximum frequency predominantly ranged between 800 and 900 Hz, with a median value of 865 Hz and a mode of 875.1 Hz. Similarly, the minimum frequency clustered between 300 and 400 Hz, with a median of 344 Hz and a mode of 345.7 Hz.

4. Discussion

In this study, a distinct diel variation was observed in the acoustic signals produced by the small yellow croaker. Based on a comprehensive analysis of spectrograms, frequency-specific PSD distributions, and SPL violin plots, acoustic energy levels were consistently higher during nighttime. High-energy acoustic signals were especially concentrated within the 300–1000 Hz range. The SPL distribution showed both broad dispersion and dense high-energy bands, with mean and median values significantly higher at night than during the day. These findings are consistent with previous ecological studies reporting increased nocturnal vocal activity in many fish species [16,38,39], and strongly suggest that the elevated nighttime acoustic energy in the study area was primarily driven by group vocalizations of the small yellow croaker.
Fish belonging to the family Sciaenidae generally exhibit clear temporal periodicity in vocal behavior, with interspecific variation in both timing and duration of sound production. The focal species of this study, the small yellow croaker, exhibited continuous vocal activity throughout the night, beginning shortly after sunset and continuing until just before sunrise. In contrast, the Brown croaker (Miichthys miiuy) has been reported to vocalize primarily between 16:30 and 20:30 under controlled tank conditions [40]. The large yellow croaker (Larimichthys crocea) typically produces sounds from the afternoon until just before midnight [41]. The Whitemouth croaker (Micropogonias furnieri) shows two distinct peaks in vocal activity during the spawning season: one between 07:00–10:00 in the morning and another between 17:00–23:00 in the evening [42].
The concentration of high-energy acoustic signals during nighttime may serve as an important indicator of circadian rhythmicity of biological activity, offering valuable insights into the behavioral ecology of gregariously vocalizing species such as the small yellow croaker. This nocturnally biased acoustic activity temporally coincides with the species’ spawning period [43]. Given the known spawning period of the small yellow croaker reported in previous studies [29,30], these signals are presumed to be related to spawning activity. However, the observations in this study were conducted in a sea cage containing a high density of captive individuals, which may have influenced the vocal behavior due to confinement-related factors.
In this study, consistent nocturnal vocalizations were observed; however, the magnitude and energy levels of the acoustic signals showed marked variability across different days (Figure 6). To investigate this, SPL was calculated at 1 h intervals between 21:00 and 03:00, and the mean and standard deviation were computed directly in the decibel domain for each 6 h period. Overall, nighttime SPL showed pronounced day-to-day fluctuations, with differences of up to 18 dB between nights, and no consistent trend. Intra-day variability also reached up to 4 dB in standard deviation. Although nighttime is widely recognized as the primary window for fish chorusing, these results quantitatively demonstrate that acoustic energy levels vary substantially from night to night, indicating that nocturnal acoustic output is not constant. Similar day-to-day variability has been reported in previous studies, where the intensity and timing of fish choruses varied in response to environmental factors such as lunar phase, water temperature, and tidal cycle [38,40,43,44,45,46,47,48,49]. These findings suggest that fish acoustic activity is regulated both by biological rhythms and complex environmental drivers. Nevertheless, owing to the limited availability of concurrent environmental data in the present study, the identification of specific correlating factors with statistical certainty was not feasible. Further investigations are warranted to elucidate the underlying environmental mechanisms influencing such acoustic variability.
These findings highlight the importance of quantifying fish choruses both as behavioral phenomena and ecologically significant acoustic events that influence the structure of the ocean soundscape. This study offers vital baseline data by recording and analyzing the spectral and temporal characteristics of choruses produced by the small yellow croaker, facilitating the interpretation of biophonic components in the coastal ocean soundscapes. Given their intensity, consistency, and ecological relevance, fish choruses have the potential to serve as natural indicators of reproductive activity, habitat use, and population-level dynamics. Integrating these biologically derived acoustic patterns into long-term PAM frameworks has the potential to improve the sensitivity of soundscape-based monitoring tools for assessing ecosystem changes, particularly in response to environmental variability and anthropogenic stressors. Continued refinement of chorus-based metrics and their correlation with environmental factors will be essential for advancing the use of passive acoustics in marine ecological research and management.

Author Contributions

Conceptualization, Y.G.Y., H.K., S.C. and S.K.; data curation, Y.-H.J. and D.K.; formal analysis, Y.G.Y. and H.K.; investigation, S.C., S.K. and D.K.; methodology, S.C. and S.K.; project administration, S.C. and D.K.; software, Y.G.Y. and H.K.; writing—original draft preparation, Y.G.Y. and H.K. All authors have read and agreed to the published version of the manuscript.

Funding

This work was supported by Korea Research Institute for defense Technology planning and advancement (KRIT) grant funded by the Korea government (DAPA—Defense Acquisition Program Administration) in 2022 (no. KRIT-CT-22-056, Acoustic sensor detection technology based on marine biological sounds Research Laboratory).

Institutional Review Board Statement

This study was approved by the Institutional Animal Care and Use Committee at Korea Institute of Ocean Science and Technology (KIOST) (approval code: #2023-05).

Data Availability Statement

The data presented in this study are available upon request from the corresponding author. The data are not publicly available, because the data form part of an ongoing study.

Acknowledgments

We thank Yong-Joo Park, Yeong-Wook Lee, Il-Hyung Jung, and Seogil Jang (Maritime Test and Evaluation Station of Korea Institute of Ocean Science and Technology) for their assistance in the data acquisition of the brown croaker sounds.

Conflicts of Interest

The authors declare no conflicts of interest.

References

  1. Lindseth, A.V.; Lobel, P.S. Underwater soundscape monitoring and fish bioacoustics: A review. Fishes 2018, 3, 36. [Google Scholar] [CrossRef]
  2. Havlik, M.N.; Predragovic, M.; Duarte, C.M. State of play in marine soundscape assessments. Front. Mar. Sci. 2022, 9, 919418. [Google Scholar] [CrossRef]
  3. Parsons, M.J.; Lin, T.H.; Mooney, T.A.; Erbe, C.; Juanes, F.; Lammers, M.; Di Iorio, L. Sounding the call for a global library of underwater biological sounds. Front. Ecol. Evol. 2022, 10, 810156. [Google Scholar] [CrossRef]
  4. Chapuis, L.; Williams, B.; Gordon, T.A.; Simpson, S.D. Low-cost action cameras offer potential for widespread acoustic monitoring of marine ecosystems. Ecol. Indic. 2021, 129, 107957. [Google Scholar] [CrossRef]
  5. Wall, C.C.; Haver, S.M.; Hatch, L.T.; Miksis-Olds, J.; Bochenek, R.; Dziak, R.P.; Gedamke, J. The next wave of passive acoustic data management: How centralized access can enhance science. Front. Mar. Sci. 2021, 8, 703682. [Google Scholar] [CrossRef]
  6. Bermant, P.C.; Bronstein, M.M.; Wood, R.J.; Gero, S.; Gruber, D.F. Deep machine learning techniques for the detection and classification of sperm whale bioacoustics. Sci. Rep. 2019, 9, 12588. [Google Scholar] [CrossRef] [PubMed]
  7. Shiu, Y.; Palmer, K.J.; Roch, M.A.; Fleishman, E.; Liu, X.; Nosal, E.-M.; Helble, T.; Cholewiak, D.; Gillespie, D.; Klinck, H. Deep neural networks for automated detection of marine mammal species. Sci. Rep. 2020, 10, 607. [Google Scholar] [CrossRef] [PubMed]
  8. Thomas, M.; Martin, B.; Kowarski, K.; Gaudet, B.; Matwin, S. Marine mammal species classification using convolutional neural networks and a novel acoustic representation. arXiv 2019, arXiv:1907.13188. [Google Scholar]
  9. Roch, M.A.; Soldevilla, M.S.; Hoenigman, R.; Wiggins, S.M.; Hildebrand, J.A. Comparison of machine learning techniques for the classification of echolocation clicks from three species of odontocetes. Can. Acoust. 2008, 36, 41–47. [Google Scholar]
  10. Usman, A.M.; Ogundile, O.O.; Versfeld, D.J. Review of automatic detection and classification techniques for cetacean vocalization. IEEE Access 2020, 8, 105181–105206. [Google Scholar] [CrossRef]
  11. Staaterman, E.; Rice, A.N.; Mann, D.A.; Paris, C.B. Soundscapes from a tropical Eastern Pacific reef and a Caribbean Sea reef. Coral Reefs 2013, 32, 553–557. [Google Scholar] [CrossRef]
  12. Lillis, A.; Eggleston, D.; Bohnenstiehl, D. Estuarine soundscapes: Distinct acoustic characteristics of oyster reefs compared to soft-bottom habitats. Mar. Ecol. Prog. Ser. 2014, 505, 1–17. [Google Scholar] [CrossRef]
  13. Harris, S.; Shears, N.; Radford, C. Ecoacoustic indices as proxies for biodiversity on temperate reefs. Methods Ecol. Evol. 2016, 7, 713–724. [Google Scholar] [CrossRef]
  14. Bolgan, M.; Amorim, M.C.P.; Fonseca, P.J.; Di Iorio, L.; Parmentier, E. Acoustic complexity of vocal fish communities: A field and controlled validation. Sci. Rep. 2018, 8, 10559. [Google Scholar] [CrossRef] [PubMed]
  15. Miksis-Olds, J.L.; Martin, B.; Tyack, P.L. Exploring the ocean through soundscapes. Acoust. Today 2018, 14, 26–34. [Google Scholar]
  16. Carriço, R.; Silva, M.A.; Vieira, M.; Afonso, P.; Menezes, G.M.; Fonseca, P.J.; Amorim, M.C.P. The use of soundscapes to monitor fish communities: Meaningful graphical representations differ with acoustic environment. Acoustics 2020, 2, 382–398. [Google Scholar] [CrossRef]
  17. La Manna, G.; Picciulin, M.; Crobu, A.; Perretti, F.; Ronchetti, F.; Manghi, M.; Ceccherelli, G. Marine soundscape and fish biophony of a Mediterranean marine protected area. PeerJ 2021, 9, e12551. [Google Scholar] [CrossRef] [PubMed]
  18. Popper, A.N.; Fay, R.R.; Platt, C.; Sand, O. Sound detection mechanisms and capabilities of teleost fishes. In Sensory Processing in Aquatic Environments; Collin, S.P., Marshall, N.J., Eds.; Springer: New York, NY, USA, 2003; pp. 1–53. [Google Scholar]
  19. Cato, D.H.; Noad, M.J.; McCauley, R.D. Passive acoustics as a key to the study of marine animals. In Sounds in the Sea: From Ocean Acoustics to Acoustical Oceanography; Medwin, H., Ed.; Cambridge University Press: Cambridge, UK, 2005; pp. 411–429. [Google Scholar]
  20. McWilliam, J.; Hawkins, A. A comparison of inshore marine soundscapes. J. Exp. Mar. Biol. Ecol. 2013, 446, 166–176. [Google Scholar] [CrossRef]
  21. Kaatz, I.M. Multiple sound producing mechanisms in teleost fishes and hypotheses regarding their behavioural significance. Bioacoustics 2002, 12, 230–233. [Google Scholar] [CrossRef]
  22. Vermeij, M.J.A.; Marhaver, K.L.; Huijbers, C.M.; Nagelkerken, I.; Simpson, S.D. Coral larvae move toward reef sounds. PLoS ONE 2010, 5, e10660. [Google Scholar] [CrossRef] [PubMed]
  23. Chapuis, L.; Bshary, R. Signalling by the cleaner shrimp Periclimenes longicarpus. Anim. Behav. 2010, 79, 645–647. [Google Scholar] [CrossRef]
  24. Rountree, R.A.; Gilmore, G.A.; Goudey, C.A.; Hawkins, A.D.; Luczkovich, J.J.; Mann, D.A. Listening to fish: Applications of passive acoustics to fisheries science. Fisheries 2006, 31, 433–446. [Google Scholar] [CrossRef]
  25. Jin, X.S.; Zhao, X.Y.; Meng, T.X.; Cui, Y. The Biological Resources and Their Habitat Environment in the Bohai and Yellow Sea; Science Press: Beijing, China, 2005; p. 405. [Google Scholar]
  26. Li, Z.; Shan, X.; Jin, X.; Dai, F. Long-term variations in body length and age at maturity of the small yellow croaker (Larimichthys polyactis Bleeker, 1877) in the Bohai Sea and the Yellow Sea, China. Fish. Res. 2011, 110, 67–74. [Google Scholar] [CrossRef]
  27. Lin, L.S.; Liu, Z.L.; Jiang, Y.Z.; Huang, W.; Gao, T.X. Current status of small yellow croaker resources in the southern Yellow Sea and the East China Sea. Chin. J. Oceanol. Limnol. 2011, 29, 547–555. [Google Scholar] [CrossRef]
  28. Song, X.; Hu, F.; Xu, M.; Zhang, Y.; Jin, Y.; Gao, X.; Liu, Z.; Ling, J.; Li, S.; Cheng, J. Spatiotemporal distribution and dispersal pattern of early life stages of the small yellow croaker (Larimichthys polyactis) in the southern Yellow Sea. Diversity 2024, 16, 521. [Google Scholar] [CrossRef]
  29. Han, Q.; Shan, X.; Jin, X.; Gorfine, H.; Chen, Y.; Su, C. Changes in distribution patterns for Larimichthys polyactis in response to multiple pressures in the Bohai Sea over the past four decades. Front. Mar. Sci. 2022, 9, 941045. [Google Scholar] [CrossRef]
  30. Liu, Z.; Jin, Y.; Yang, L.; Yuan, X.; Yan, L.; Zhang, Y.; Zhang, H.; Xu, M.; Song, X.; Tang, J.; et al. Improving prediction for potential spawning areas from a two-step perspective: A comparison of multi-model approaches for sparse egg distribution. J. Sea Res. 2024, 197, 102460. [Google Scholar] [CrossRef]
  31. Li, H.; Song, Z.; Hui, J.; Su, Y.; Fu, W.; Zhang, S.; Yan, L.; Yan, K.; Huang, H.; Zhang, Y. Vocalization behavior of Chinese Bahaba (Bahaba taipingensis) during the reproduction season. J. Mar. Sci. Eng. 2023, 11, 712. [Google Scholar] [CrossRef]
  32. Merchant, N.D.; Fristrup, K.M.; Johnson, M.P.; Tyack, P.L.; Witt, M.J.; Blondel, P.; Parks, S.E. Measuring acoustic habitats. Methods Ecol. Evol. 2015, 6, 257–265. [Google Scholar] [CrossRef] [PubMed]
  33. Wilford, D.C.; Miksis-Olds, J.L.; Martin, S.B.; Howard, D.R.; Lowell, K.; Lyons, A.P.; Smith, M.J. Quantitative soundscape analysis to understand multidimensional features. Front. Mar. Sci. 2021, 8, 672336. [Google Scholar] [CrossRef]
  34. Helberg, G.A.; Anichini, M.; Kolarevic, J.; Sæther, B.S.; Noble, C. Soundscape characteristics of RAS tanks holding Atlantic salmon (Salmo salar) during feeding and feed withdrawal. Aquaculture 2024, 593, 741325. [Google Scholar] [CrossRef]
  35. Hawkins, L.A.; Parsons, M.J.G.; McCauley, R.D.; Parnum, I.M.; Erbe, C. Passive acoustic monitoring of fish choruses: A review to inform the development of a monitoring and management tool. Rev. Fish. Biol. Fish. 2025, 35, 847–874. [Google Scholar] [CrossRef]
  36. Stratoudakis, Y.; Vieira, M.; Marques, J.P.; Amorim, M.C.P.; Fonseca, P.J.; Quintella, B.R. Long-term passive acoustic monitoring to support adaptive management in a sciaenid fishery (Tagus Estuary, Portugal). Rev. Fish. Biol. Fish. 2024, 34, 491–510. [Google Scholar] [CrossRef]
  37. Welch, P.D. The use of fast Fourier transform for the estimation of power spectra: A method based on time averaging over short, modified periodograms. IEEE Trans. Audio Electroacoust. 1967, 15, 70–73. [Google Scholar] [CrossRef]
  38. McCauley, R. Fish choruses from the Kimberley, seasonal and lunar links as determined by long term sea noise monitoring. In Proceedings of the Acoustics 2012, Fremantle, Australia, 21–23 November 2012. [Google Scholar]
  39. McCauley, R.D.; Cato, D.H. Patterns of fish calling in a nearshore environment in the Great Barrier Reef. Philos. Trans. R. Soc. Lond. B Biol. Sci. 2000, 355, 1289–1293. [Google Scholar] [CrossRef] [PubMed]
  40. Kim, H.; Yoon, Y.G.; Cho, S.; Kim, S.; Kim, M.; Kang, D. Acoustic characteristics of spawning biological sounds of brown croaker (Miichthys miiuy). Fishes 2024, 9, 251. [Google Scholar] [CrossRef]
  41. Zhou, Y.L.; Xu, X.M.; Zhang, X.H.; Huang, L.F.; Xiao, F.G.; He, Y.W. Vocalization behavior differs across reproductive stages in cultured large yellow croaker Larimichthys crocea (Perciformes: Sciaenidae). Aquaculture 2022, 556, 738267. [Google Scholar] [CrossRef]
  42. Tellechea, J.S.; Bouvier, D.; Norbis, W. Spawning sounds in whitemouth croaker (Sciaenidae): Seasonal and daily cycles. Bioacoustics 2011, 20, 159–168. [Google Scholar] [CrossRef]
  43. McWilliam, J.N.; McCauley, R.D.; Erbe, C.; Parsons, M.J. Patterns of biophonic periodicity on coral reefs in the Great Barrier Reef. Sci. Rep. 2017, 7, 17459. [Google Scholar] [CrossRef] [PubMed]
  44. Parsons, M.J.G. An Investigation into Active and Passive Acoustic Techniques to Study Aggregating Fish Species. Ph.D. Thesis, Curtin University, Perth, Australia, 2009. [Google Scholar]
  45. Locascio, J.V.; Mann, D.A. Diel and seasonal timing of sound production by black drum (Pogonias cromis). Fish. Bull. 2011, 109, 327–338. [Google Scholar]
  46. Parsons, M.J.G.; Salgado-Kent, C.P.; Marley, S.A.; Gavrilov, A.N.; McCauley, R.D. Characterizing diversity and variation in fish choruses in Darwin Harbour. ICES J. Mar. Sci. 2016, 73, 2058–2074. [Google Scholar] [CrossRef]
  47. Siddagangaiah, S.; Chen, C.-F.; Hu, W.-C.; Danovaro, R.; Pieretti, N. Silent winters and rock-and-roll summers: The long-term effects of changing oceans on marine fish vocalization. Ecol. Indic. 2021, 125, 107456. [Google Scholar] [CrossRef]
  48. Hawkins, L.A.; Erbe, C.; Becker, A.; Browne, C.E.; McCordic, J.; McWiliam, J.; McCauley, R.D. The Australian fish chorus catalogue (2005–2023). Front. Remote Sens. 2024, 5, 1473168. [Google Scholar] [CrossRef]
  49. Monczak, A.; Mueller, C.; Miller, M.E.; Ji, Y.; Borgianini, S.A.; Montie, E.W. Sound patterns of snapping shrimp, fish, and dolphins in an estuarine soundscape of the southeastern USA. Mar. Ecol. Prog. Ser. 2019, 609, 49–68. [Google Scholar] [CrossRef]
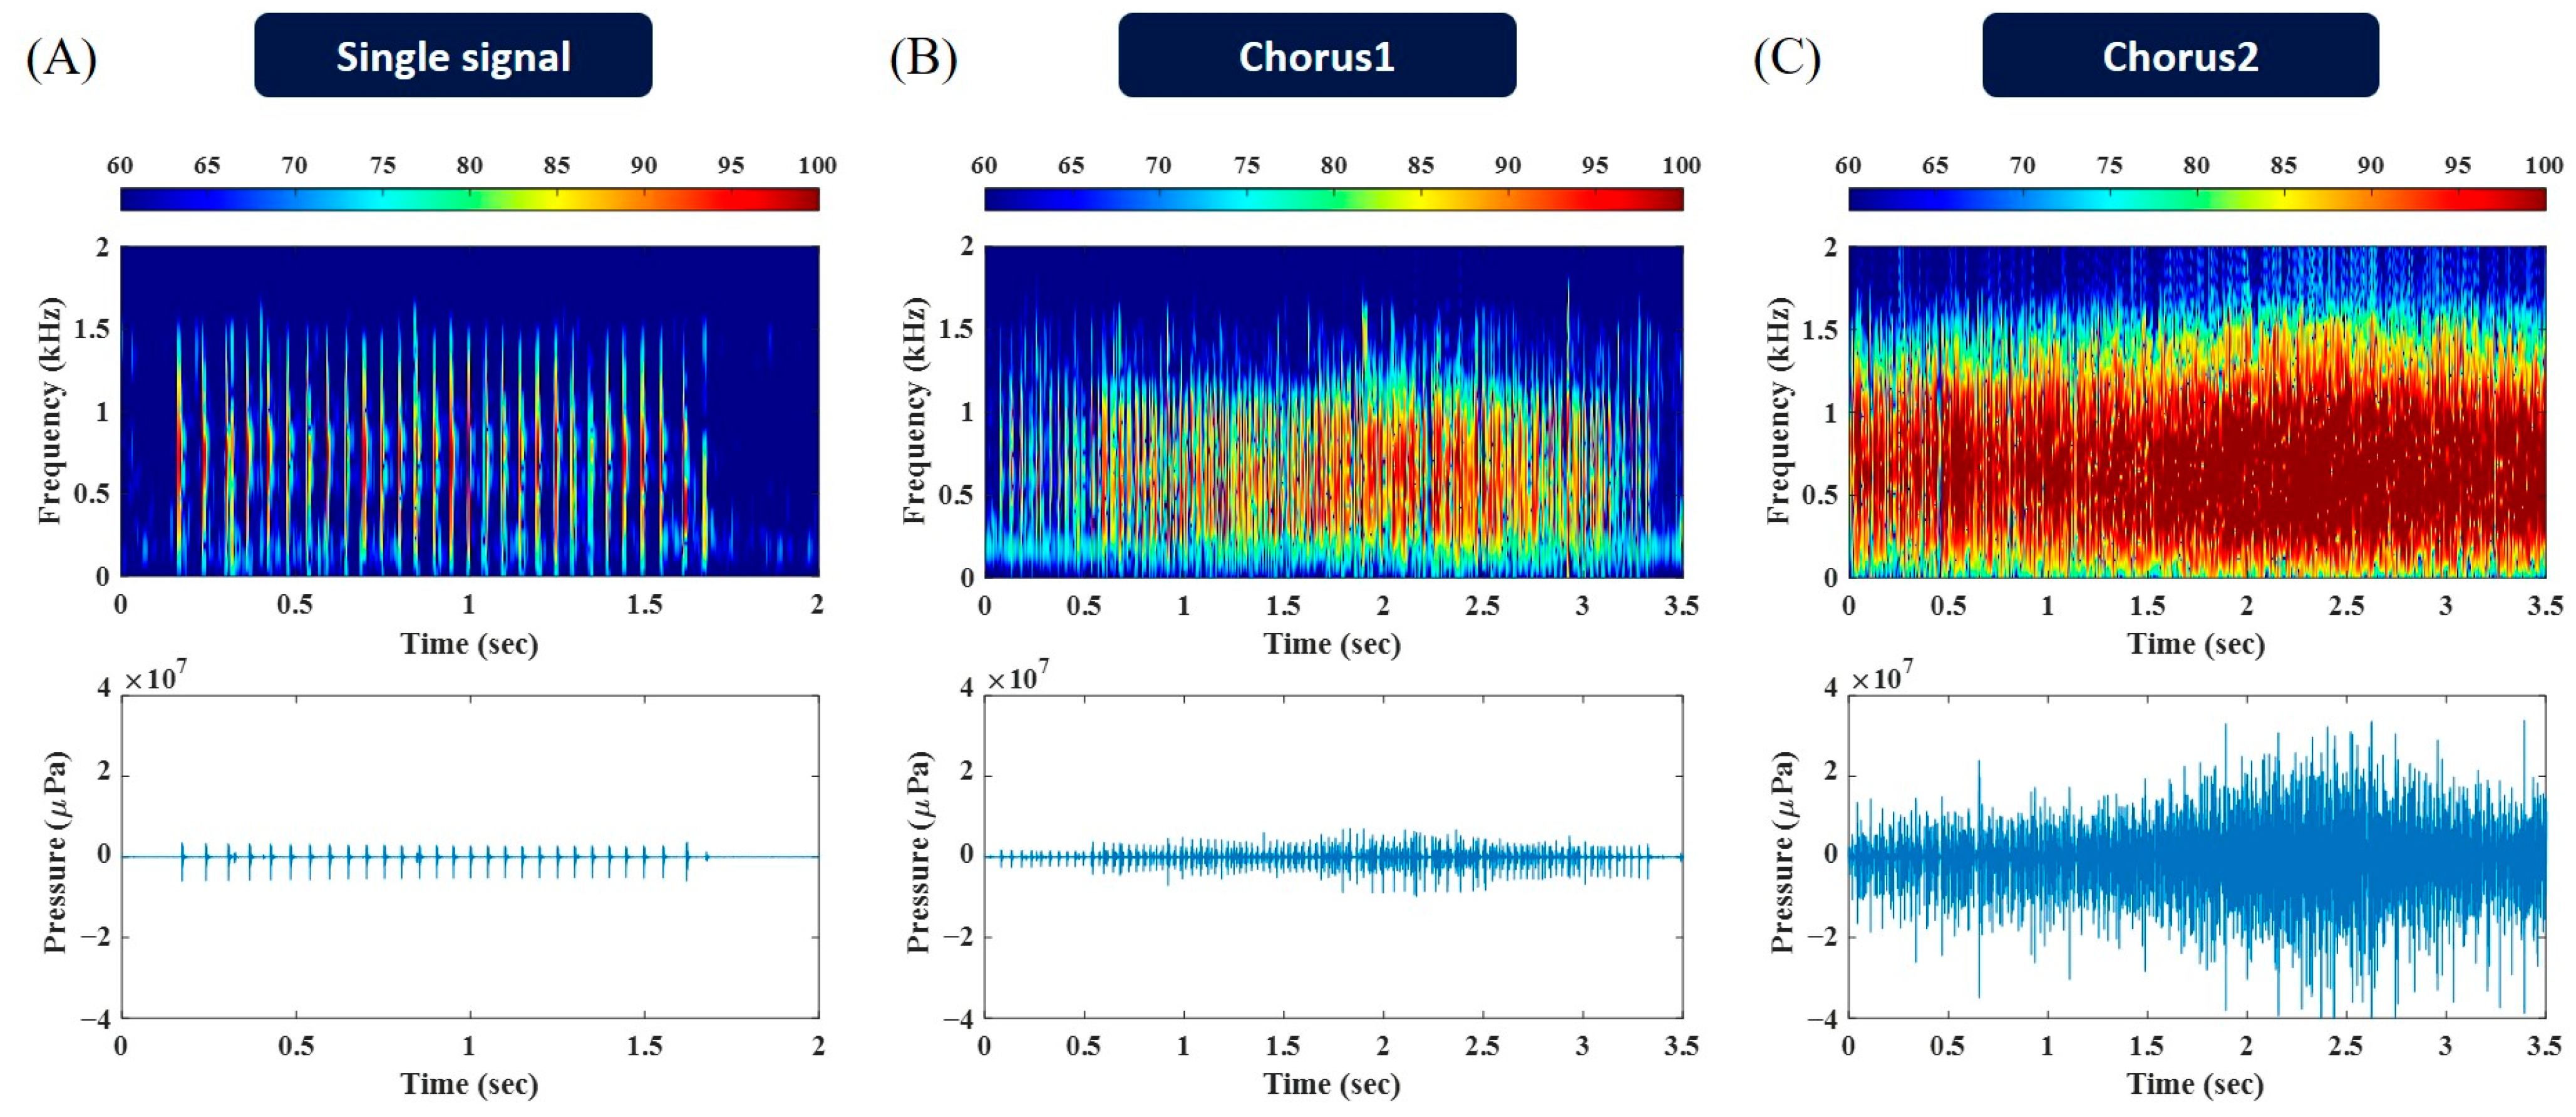
Figure 1. Representative examples of acoustic signals produced by the small yellow croaker, visualized using spectrograms (top row) and corresponding waveform plots (bottom row). (A) A single signal emitted by an individual fish. (B) A moderate-intensity chorus (Chorus1), composed of overlapping calls from multiple individuals. (C) A high-intensity chorus (Chorus2) is generated by a large aggregation of fish.
Jmse 13 01380 g001
Figure 2. Spectrograms showing temporal patterns of biological sounds. (A) Daily spectrogram over the entire recording period and (B) daily mean spectrogram computed by averaging power spectral density (PSD) over 24 h windows centered on local noon (12:00).
Jmse 13 01380 g002
Figure 3. Empirical probability density distributions of power spectral density (PSD) levels during (top) nighttime (00:00 ± 3 h) and (bottom) daytime (12:00 ± 3 h) periods.
Jmse 13 01380 g003
Figure 4. The violin plot of the sound pressure level during the daytime and nighttime.
Jmse 13 01380 g004
Figure 5. Violin plots showing the distribution of key frequency parameters extracted from choruses produced by the small yellow croaker during nighttime (sunset to sunrise). The plots represent: peak frequency, 3 dB bandwidth, maximum, and minimum frequencies.
Jmse 13 01380 g005
Figure 6. Daily variation in the nighttime sound pressure levels (SPLs) measured from 21:00 to 03:00.
Jmse 13 01380 g006
Disclaimer/Publisher’s Note: The statements, opinions and data contained in all publications are solely those of the individual author(s) and contributor(s) and not of MDPI and/or the editor(s). MDPI and/or the editor(s) disclaim responsibility for any injury to people or property resulting from any ideas, methods, instructions or products referred to in the content.