Abstract
To tackle the problem of existing underwater vehicle covert path planning methods ignoring ambient noise fields, an automated path planning method based on a statistically characterized environmental noise field is proposed. The method involves constructing a background noise spectrum level model using Automatic Identification System (AIS) data and wind speed data. Then, a Range-Dependent Acoustic Model (RAM) is integrated to generate a statistically significant 10th percentile noise field. The result is subsequently incorporated into the sonar equation to develop a noise-considerate concealment effectiveness model, which serves as input for a noise-considerate A* path planning algorithm. Comparative analyses of path planning results demonstrate that, within the studied maritime domain, the noise-prioritized path exhibits a statistically significant reduction in the median detection range by approximately 17%, a 50% reduction in the minimum detection range, and a 20% reduction in the maximum detection range, relative to alternative paths planned with a fixed noise level assumption.
1. Introduction
When underwater vehicles embark on missions, it is imperative to thoroughly consider the threats posed by sonar detection to ensure their stealth. Current dominant passive sonar operates within a frequency range of 0.1~1.5 kHz, while active sonar functions in the range of 1.5~3.5 kHz [1]. Ambient noise, which falls within the operational frequency band of detection sonars, can severely degrade the signal-to-noise ratio [2], representing a primary factor limiting the performance of both active and passive sonars [3,4,5]. Current research indicates that ambient noise is primarily composed of shipping and wind-generated noise. Shipping noise, primarily composed of mid–low frequency sounds, possesses a high source level and can propagate over considerable distances [6], thus dominating the underwater noise spectrum [7]. In contrast, wind-generated noise is characterized by higher frequencies [8], with sources originating primarily from a small sea surface area directly above the reception point [9]. With the increase in human activities in the ocean, the level of marine ambient noise, especially shipping noise, is rising. Moreover, the significant variability in ship distribution complicates the statistical analysis and practical application of shipping noise data. Modeling complex ambient noise and using this to plan routes is vital to enhance the navigational stealth of underwater vehicles [10].
Shipping noise, a key anthropogenic marine noise source, has led to the development of various estimation models, including the notable RANDI [11]. However, its applicability to modern research is limited due to its reliance on data collected during World War II under shallow water conditions [7,12]. Due to discrepancies between the RANDI and WH02 models [13], MacGillivray and de Jong [12] proposed an updated reference spectrum model utilizing the measured sound source levels in the ECHO dataset. Prediction errors between the model’s source level spectrum and measurements can reach standard deviations of up to 6 dB. Sakai, et al. [7] deployed hydrophones near shipping lanes to collect real-world ship noise data. Through curve fitting, they developed a relationship between ships’ broadband noise source levels and their attributes, such as length, speed, and draft. For wind-generated noise, empirical formulas based on wind speed have also been well developed. For instance, Carey and Evans [14] considered frequency, wind speed, and depth as independent variables in their study of wind-generated noise. Based on this, they provided a widely applicable formula for wind-generated noise spectrum levels. Hildebrand, et al. [15] combined a large underwater noise dataset with a global wind model to separate wind-related and anthropogenic noise. They subsequently developed an empirical model relating underwater noise to local wind conditions. Predicting the levels and distribution of noise to a certain extent is necessary to assess the impact of such noise on stealth and to enhance the utilization of environmental noise for covert operations. Sertlek, et al. [16] and Aulanier, et al. [17] have developed large-scale shipping noise model maps for multiple regions. Wang, et al. [18] developed a global distant shipping noise forecasting system, yielding the horizontally directional noise distribution at the receiving point by aggregating noise from multiple sectors. Employing quantile methods, Farcas, et al. [19] assessed overall shipping and wind-generated noise levels in parts of the Atlantic Ocean and confirmed their results through comparison with measured data. However, these achievements are limited to noise distribution mapping or noise pollution control, with little exploration of their application to the acoustic stealth of underwater vehicles.
Current research on the acoustic stealth of underwater vehicle path planning primarily relies on detection probability models constructed based on oceanic sound speed environments. Shan [20] incorporated a threat cost, based on the hydrological environment, into the cost function and employed an ant colony algorithm with an improved update mechanism for planning concealed routes. However, the method for constructing the threat cost from the hydrological environment was not explicitly defined. Fu, et al. [21] developed a heuristic function for a stealth algorithm using sound speed and its gradient, yet this approach fails to account for the specific influence of sound speed gradients on sonar detection capabilities. Qin, et al. [22] utilized a three-dimensional temperature and salinity field combined with the Bellhop-3D model to calculate detection probabilities, which were then used as inputs for planning stealthy paths. The simulation results presented by Mishra, et al. [23] indicate that environmental noise fluctuations, driven by variations in wave height and wind speed, influence the probability of target detection, with targets being harder to detect in inclement weather. A limitation of their work is that it provides decision support only from the perspective of the searcher.
The aforementioned studies have heightened the demands on path planning algorithms. Progress has been made in multi-objective planning using improved A*, ant colony optimization, and genetic algorithms [24,25,26,27,28]. Despite this, research on the application of ocean environmental noise to concealed route planning remains relatively scarce. While most studies acknowledge the significant role of environmental noise in path stealthiness [29], the absence of a modeling method that integrates noise into stealth considerations hinders its practical application in conjunction with path planning algorithms. To address this issue, this paper proposes an automatic underwater stealth route planning method that takes into account the noisy environment. This method calculates the distribution of environmental noise fields, including wind-generated noise and ship noise, and evaluates the effectiveness of stealth by combining the sonar equation. By applying this method, the probability of detection by passive sonar to the vessel is reduced through the noise masking effect, thereby enhancing the vessel’s navigation stealthiness.
2. Data and Methods
2.1. Ship Position and Marine Environmental Data
To model the ship noise field, information on the distribution of ship positions in the sea area is required. This study utilizes ship information data provided by the Automatic Identification System (AIS) for the sea area in August 2019. The total number of ships during this period is distributed as shown in Figure 1. After excluding berthed ships with a speed of less than 2 knots or data with abnormal motion exceeding 29 knots, the ship positions are statistically analyzed at one-hour intervals, each forming one time frame, resulting in a total of 744 time frames.
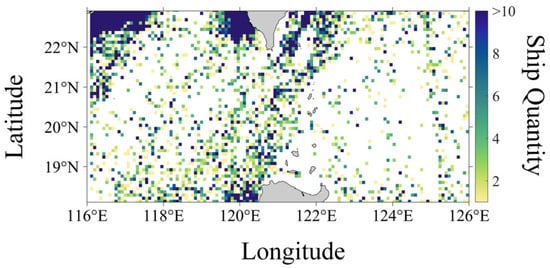
Figure 1.
Ship quantity distribution map for August 2019.
The wind-generated noise source level model requires wind speed data as input. This study utilizes the hourly sea surface wind speed data for August 2019 from the ERA5 global climate reanalysis dataset, provided by the European Centre for Medium-Range Weather Forecasts (ECMWF), with a resolution of 0.125° (See Figure 2). The monthly average temperature and salinity data required for the acoustic propagation model are also provided by the ECMWF, with a resolution of 0.083°. Bathymetric data are sourced from ETOPO 2022, a global bathymetry and topography dataset with an enhanced resolution of 15 arc-seconds. This global dataset integrates topographic, bathymetric, and coastline data from regional and global datasets, offering a comprehensive, high-resolution description of Earth’s surface geophysical features. This dataset serves as the seabed topography input for the underwater acoustic propagation model.
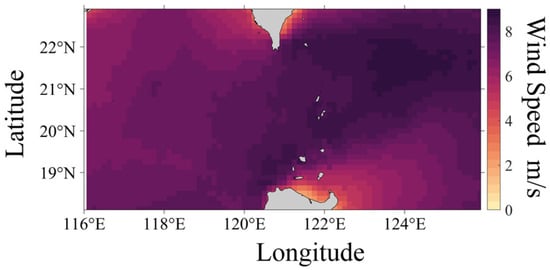
Figure 2.
Average wind speed distribution map for August 2019.
The sound propagation model necessitates sound speed data as input. This study calculates the sound speed profile using the ocean temperature and salinity data for August from the WOA23 (World Ocean Atlas 2023). This dataset, released by the National Oceanographic Data Center’s Ocean Climate Laboratory of the National Oceanic and Atmospheric Administration (NOAA), provides long-term mean values of temperature, salinity, and other data, with a resolution of 1/4°.
2.2. Sound Propagation Model
Acoustic propagation loss is a crucial parameter for evaluating the transmission of sound energy underwater. Given that the noise generated by surface vessels and underwater vehicles is characterized by lower frequency bands, this study employs the RAM parabolic equation model for investigation. The source frequency is set to 200 Hz, and inputs include sound speed profiles, seabed topography, seabed sound speed, bottom sediment density, and absorption coefficients, enabling the calculation of transmission loss (TL) under various marine environments. Due to the vast number of vessels, it is impractical to directly calculate TL for each individual vessel as a sound source. To enhance computational efficiency, the study area is first divided into a regularized grid with a resolution of 0.083°. TL is then calculated for each grid point, covering a range of 0 to 50 km, and the results are stored. Subsequently, different vessel positions are mapped to their corresponding grid points, and the precomputed TL values are retrieved for analysis.
2.3. Noise Level Spectral Models
2.3.1. Ship Noise Source Level Model
Sakai, et al. [7] established a relationship between ship noise source level and ship attributes through the parameter C:
where , , and represent the ratios of ship length, ship speed, and draft to their respective reference values, while , , , and are parameters obtained through regression analysis. Using the parameters provided by Sakai, et al. [7], the C value for a cargo ship traveling at 12 knots is approximately 190 dB. However, this formula only describes the broadband noise level of ships, not the spectral level. Therefore, based on the characteristics of the continuous spectrum of ship noise, this study employs a simplified approach to model the spectral level of the noise source [30,31]:
Here, represents the critical frequency which is typically set at 200 Hz. can be determined based on parameter C according to Sakai, et al. [7]:
Combining Equations (2) and (3), we obtain the noise source spectral level formula for the 100–500 Hz band, enabling the modeling of radiated noise spectra for various ships. The case of a ship traveling at 12 knots is shown in Figure 3 as an example.
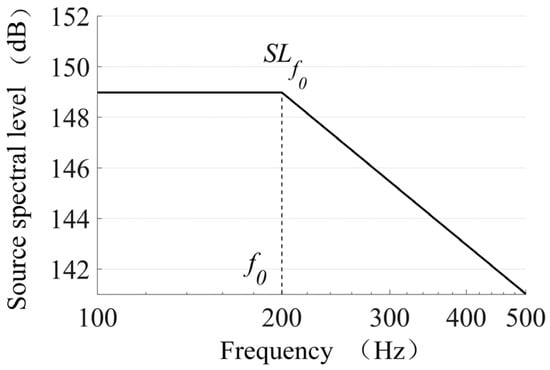
Figure 3.
Ship noise spectrum level.
2.3.2. Wind-Induced Noise Source Level Model
Based on the research by Reeder, et al. [32], an empirical formula is employed to estimate wind-induced noise:
Among these, the coefficients and are frequency-dependent, as shown in Table 1; represents the wind-induced noise frequency, which is set as 100~1500 Hz in this study. The noise spectrum levels generated by different wind speeds are illustrated in Figure 4.

Table 1.
Corresponding values of parameters
and for different frequency bands.
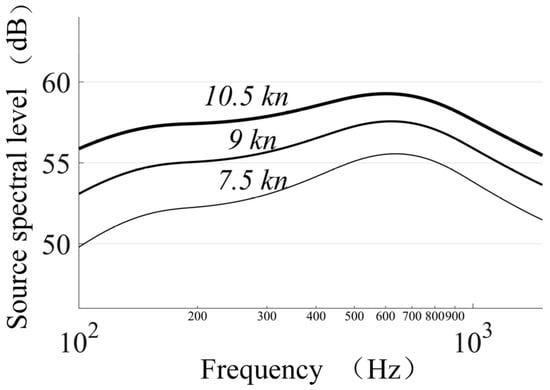
Figure 4.
Wind-induced noise spectrum level at 500 Hz.
2.3.3. Noise Field Model
By combining noise source models with sound propagation models and noise superposition formulas, it is possible to model the noise field. The total noise level is determined by the superposition of individual noise contributions from each source at that point. Accordingly, the noise spectrum level generated by N ships is calculated as follows:
The spectral level of the wind-generated noise field can be directly represented by the noise source level as follows:
For passive sonar operating in the frequency band of 0.1 to 1.5 kHz, the total noise level is typically used to quantify the noise field. The formula for calculating the total noise level from the noise spectral level is as follows:
The noise conditions over 744 hourly frames within a one-month period for the sea area in question were statistically analyzed in this study. In actual situations, real-time acquisition of ship positions is quite challenging. Therefore, the use of ambient noise from ships should be based on the statistical distribution of the noise field. Quantiles are chosen as the statistical indicator for the noise level field. Compared to the mean, quantiles can prevent the statistical results from being skewed by unrepresentative high values; for instance, the median (50th quantile) reflects the general level of noise data [19,33]. Farcas, et al. [19] conducted a study aimed at revealing the statistical distribution characteristics of wind-generated and vessel noise in a specific maritime area. Quantile statistical analysis was performed on annual noise frames collected at 10-min intervals, and the findings were validated using data from four monitoring stations. The results indicated that within the frequency range of 125 Hz to 5 kHz, the median accuracy of the model’s predictions (within a ±3 dB observation range) was 93%, while the 10th percentile accuracy was 78%. The sea area investigated in this study shares similarities with that examined by Farcas, et al. [19], as it also encompasses busy shipping lanes and open sea areas with sparse vessel distribution, and similarly employs noise frames collected at equal time intervals for statistical analysis. Therefore, the research method of Farcas, et al. [19] has been adopted. To ensure both predictive accuracy and a conservative estimation, the 10th percentile noise field has been employed to delineate the comprehensive distribution characteristics of the noise field within the study area. Specifically, at each grid point, the noise level has a 10% probability of being below the respective 10th percentile value.
2.4. Route Planning Algorithm Considering Ambient Noise
This paper employs the A* algorithm for underwater vehicle path planning. The A* algorithm [27] is a deterministic search algorithm that integrates Dijkstra’s algorithm and breadth-first search, using a cost function to find the path with the minimum cost:
G represents the cost of moving from the starting point to the endpoint.
H is the estimated cost of moving from the current position to the endpoint.
represents the total cost. The A* algorithm finds the shortest path by searching for the path with the minimum total cost. It is widely used and easy to combine with other constraints for improvement [34]. For example, if a concealment constraint CE is added, the cost function can be changed to the following:
The model for the concealment constraint CE needs to be constructed by combining the results of the preliminary noise field distribution with the sonar equation:
In the equation, SE represents the signal excess; SPL is the self-noise of the vehicle, which is set at a constant value of 130 dB in this paper; NL is the ocean ambient noise level, DI is the directivity index of the receiving array, taken as 25 dB, and DT is the detection threshold, taken as 5 dB. Among these, the transmission loss TPL refers to the attenuation of the underwater vehicle noise, which is related to factors such as the hydrological environment, propagation distance, and sonar depth. This paper also uses the RAM model to calculate TPL. The SE obtained from Equation (13) can be used to calculate the sonar detection probability:
At an SE of zero, the detection probability is 50%. The variance of the signal excess distribution, represented by σ, is set to 8 [35]. We can use the detection performance of sonar at a distance x0 to represent the threat level of an underwater vehicle at that point:
The variables and concepts are defined as follows:
d: The deployment depth of the passive sonar, which is taken as 30 m, 50 m, 70 m, 90 m, and 110 m [22,36].
: The probability distribution of the deployment depth, which is assumed to be uniform.
x0: The distance at which the target is located, which is taken as 10 km.
Following the aforementioned procedures, the cost function for covert path planning considering environmental noise can be expressed as follows:
3. Experimental Results and Analysis
3.1. Results of Noise Field Modeling
In this study, the 10th percentile ambient noise field within the research sea area was constructed using AIS data, wind field information, and noise source models, as illustrated in Figure 5. It can be observed that the high-noise areas in the strait channels and along the coastal waters correspond to regions with dense ship activity (Figure 1). And the distribution of low noise level regions is primarily associated with low wind speed fields in the coastal waters and the southeastern direction of the strait channel (Figure 2).
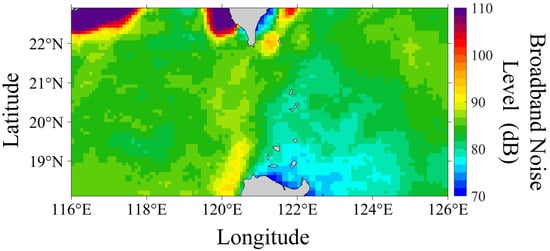
Figure 5.
Distribution of 10th percentile noise field during August.
Farcas, et al. [19] reported that the excess noise from ships relative to wind-generated noise was in the range of 0~40 dB in the northeastern Atlantic in 2017. In Figure 5, the coastal waters exhibit a high density of ships, with a noise excess of approximately 35 dB; in the strait channel waters, the density of ship activity is slightly reduced, with a noise excess of approximately 20 dB, which is generally consistent with the aforementioned research. In summary, the noise field modeled using the 10th percentile method aligns with the distribution of dense ship activity and the average sound speed field in the research sea area during August, effectively reflecting the actual noise distribution.
3.2. Concealment Effectiveness Model
Firstly, the 10th percentile noise field was adopted as the noise background in conjunction with Equation (16) to construct a concealment effectiveness model with a grid resolution of 0.08° for the study area, as illustrated in Figure 6a. To better compare the superiority of the path planning method considering ambient noise fields, a fixed 85 dB noise level was used to calculate CE, as shown in Figure 6b, following the method of Qin, et al. [22]. The differences between the two are mainly concentrated in the sea area of 119.5°~123° E. Among them, boxes 1 to 3 are sea areas with relatively dense ship traffic. Stronger background noise reduces the probability of sonar detection, resulting in the appearance of higher CE values in Figure 6a. In contrast, the fourth area has less ship activity, with wind-generated noise being the main contributor to the background noise, resulting in relatively weaker noise levels, which leads to the appearance of lower CE values in Figure 6a.
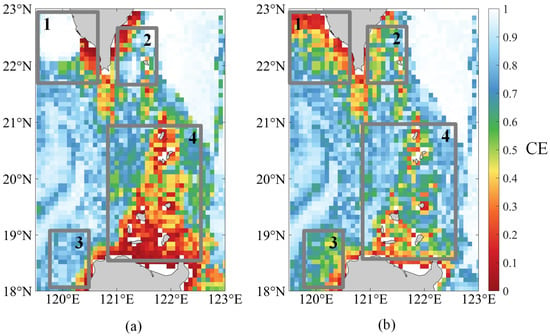
Figure 6.
The modeling results of concealment effectiveness utilizing (a) the 10th percentile noise and (b) fixed 85 dB noise level.
3.3. Comparison of Path Planning Results
An underwater vehicle is required to traverse from the western side to the eastern side of a strait, with the capability to navigate through any available waterway. Utilizing a consistent parameter k (k = 10), path planning was conducted using different models of stealth effectiveness, with the results illustrated in Figure 7.
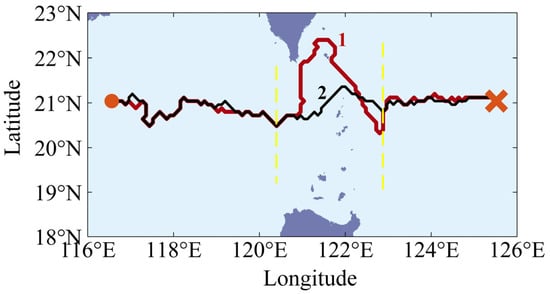
Figure 7.
Path planning results.
Path 1 represents the planning outcome that takes into account the ambient noise field, selecting the northern channel characterized by a higher noise level. Conversely, Path 2 represents the outcome based on a fixed noise level. The computational time for both approaches was comparable, approximately 60 s, when executed on a computer equipped with an Intel Core i5 processor.
Subsequently, a Monte Carlo simulation comprising 400 iterations was employed to validate the superiority of Path 1 in terms of stealth. The vehicle navigates according to Paths 1 and 2, with each iteration maintaining a fixed route but varying the departure times across 400 distinct hourly intervals from 00:00 on 1st August to 16:00 on 25th August. This aims to simulate realistic environmental noise fields, considering the varying noise backgrounds (distributions of shipping and wind speeds) encountered at different departure times. And in each iteration, statistics of the noise levels and sonar detection distances at various points along the path were recorded.
The key distinctions of the two routes are concentrated within the strait’s sea area between longitudes 120.5° and 122.5° E. Statistics were compiled for the median, minimum, and maximum average noise levels of the path segments within this range, as well as the corresponding median, maximum, and minimum average detection distances calculated at which SE = 0 in Equation (13). The statistical results are presented in Table 2.

Table 2.
Average exposure rate for simulation experiment paths.
The comparative results reveal that route planning predicated on statistically significant environmental noise levels generally elevates the background noise levels of the paths. Concurrently, the statistical results for the detection distances of Path 1 are consistently lower than those of Path 2.
The maximum average noise level corresponds to the minimum detection distance, delineating the upper threshold of path concealment. Path 1 exhibits a 50% reduction in the minimum detection distance relative to Path 2.
The median average noise level corresponds to the median detection distance, indicative of the average level of path concealment. Path 1 demonstrates a 17% reduction in the median detection distance compared to Path 2.
The minimum average noise level corresponds to the maximum detection distance, establishing the lower threshold of path concealment. Path 1 shows a 20% reduction in the maximum detection distance compared to Path 2.
In summary, the noise-prioritized path, predicated on the statistical distribution of the ambient noise field—specifically utilizing the 10th percentile noise level as a proxy—selectively navigates through regions characterized by elevated noise levels. This approach, emphasizing ambient noise field, has been empirically validated to enhance both the mean and upper bounds of stealth capability while maintaining the minimum stealth threshold. The experimental findings demonstrate that, within the delineated maritime domain, the noise-prioritized path exhibits a statistically significant reduction in the median detection range by approximately 17%, a 50% reduction in the minimum detection range, and a 20% reduction in the maximum detection range, relative to alternative paths.
4. Conclusions
This paper presents an automated path planning method for underwater vehicles predicated on a statistically characterized ambient noise field. Initially, a background noise spectrum level model is constructed by assimilating Automatic Identification System (AIS) data and wind speed data. This model is subsequently integrated with the acoustic model (RAM) to generate a statistically significant 10th percentile noise field, effectively characterizing the ambient noise field. This noise field is then employed as the input for the sonar detection equation, facilitating the development of a concealment effectiveness (CE) model. This CE model serves as the input for an optimized A* path planning algorithm, which generates covert navigation path.
The experimental results demonstrate that, within the studied maritime domain, the noise-prioritized path exhibits a statistically significant reduction in the median detection range by approximately 17%, a 50% reduction in the minimum detection range, and a 20% reduction in the maximum detection range, relative to alternative paths planned with a fixed noise level assumption. These findings corroborate the efficacy of the statistically significant noise field model in guiding path planning for underwater vehicles. This methodology is also extensible to other noise-affected underwater vehicle missions, such as hydrographic surveys employing echo sounding techniques. Further development is warranted to explore broader applications.
The spatial and temporal variability of underwater acoustic noise plays a pivotal role in shaping the acoustic camouflage efficacy of maritime platforms. Conventional models, which often assume homogenous noise fields, do not adequately capture this variability, thus underestimating the concealment potential in high-traffic maritime regions and overestimating it in low sea state conditions. This investigation employs advanced statistical methodologies to model the environmental noise distribution by incorporating historical data on vessel traffic density and wind-induced sea state conditions. The resultant probabilistic noise map, characterized by percentiles, facilitates a more nuanced understanding of the acoustic environment. By integrating these probabilistic noise predictions into adaptive path planning algorithms, this study seeks to enhance the acoustic stealth capabilities of maritime vessels, thereby minimizing their detectability probability in a dynamically varying acoustic landscape. The proposed approach leverages the inherent inhomogeneity of the underwater soundscape, as quantified by the statistical descriptors of the noise field, to optimize route selection for reduced acoustic signature exposure.
Despite the advancements achieved in this study, several limitations persist. Firstly, the challenging acquisition of empirical noise data necessitates further validation of the current noise level predictions. Secondly, while a concealment effectiveness model was developed based on statistical noise, the verification of enhanced path concealment under actual conditions remains confined to simulation environments. Future research endeavors should concentrate on the following areas: first, the integration of real-time noise data to augment the model’s accuracy and reliability; second, the refinement of the adjustment strategy for the adaptive stealth weight (k) to achieve better adaptation to complex environments; third, the execution of validation exercises in real-world scenarios to ensure the practical applicability of the research findings.
Author Contributions
Conceptualization, L.Z. and Y.W.; methodology, G.Z.; software, X.M. and C.K.; validation, X.M. and S.W.; formal analysis, G.Z. and Y.Z.; writing—original draft preparation, G.Z.; writing—review and editing, Z.D. and L.Z. All authors have read and agreed to the published version of the manuscript.
Funding
This research was funded by National Natural Science Foundation of China grant number 62371464.
Data Availability Statement
The wind data presented in the study are openly available in ECMWF at https://doi.org/10.48670/moi-00185.
Acknowledgments
This study acknowledges the provision of ship position data by the Automatic Identification System. The contributions of these organizations have been instrumental in supporting the research objectives and analysis presented herein.
Conflicts of Interest
The authors declare no conflict of interest.
References
- Du, Z.; Chen, G.; Wang, D. Foreign sonar technology development research summary. Ship Sci. Technol. 2019, 41, 145–151. (In Chinese) [Google Scholar]
- Guo, Z.; Hong, M.; Zhang, Y.; Shi, J.; Zhang, Y.; Wang, H.; Qian, L. Research on underwater unmanned platform route planning based on marine environment constraints. J. Phys. Conf. Ser. 2024, 2718, 012038. [Google Scholar] [CrossRef]
- Liu, X.; Cui, N.; Liu, X.; Fan, Y. Research Progress of Underwater Detection Based on Ocean Ambient Noise. Res. Prog. Underw. Detect. Based Ocean Ambient Noise 2022, 5. (In Chinese) [Google Scholar] [CrossRef]
- Liu, Z.; Sun, C.; Zhou, S.; Du, X.; Sun, D. Weak echo signal enhancement detection of underwater targetsbased on stochastic resonance. J. Harbin Eng. Univ. 2024, 45, 2014–2024. (In Chinese) [Google Scholar]
- Yang, Q.; Ynag, K.; Ma, Y. Statistical characteristic analysis of ambient noise in deep seaof southern South China Sea. J. Harbin Eng. Univ. 2020, 41, 1419–1428. (In Chinese) [Google Scholar]
- Hildebrand, J.A. Anthropogenic and natural sources of ambient noise in the ocean. Mar. Ecol. Prog. Ser. 2009, 395, 5–20. [Google Scholar] [CrossRef]
- Sakai, M.; Haga, R.; Tsuchiya, T.; Akamatsu, T.; Umeda, N. Statistical analysis of measured underwater radiated noise from merchant ships using ship operational and design parameters. J. Acoust. Soc. Am. 2023, 154, 1095–1105. [Google Scholar] [CrossRef]
- Rong, Z.; Hu, C.; Zhao, M. An algorithm for calculating the contribution of ship noise to offshore ambient noise. Tech. Acoust. 2020, 39, 559–566. (In Chinese) [Google Scholar] [CrossRef]
- Liu, Y.; Qin, J.; Li, Z.; Wu, S.; Wang, M.; Guo, Y. Impact of continental-slope bottom on ambient noise in the South China Sea. Acta Acust. 2024, 49, 803–813. (In Chinese) [Google Scholar]
- Guo, X.; Li, F.; Tie, G.; Ma, L. Overview of ocean ambient noise and application prospects. Physics 2014, 43, 723–731. (In Chinese) [Google Scholar]
- Pflug, L.A.; Bradley, M.; Walrod, M.H. Research Ambient Noise DIrectionality (RANDI) 3.1 Physics Description; Naval Research Laboratory Report; Stennis Space Center: Hancock County, MS, USA, 1997. [Google Scholar]
- MacGillivray, A.; de Jong, C. A Reference Spectrum Model for Estimating Source Levels of Marine Shipping Based on Automated Identification System Data. J. Mar. Sci. Eng. 2021, 9, 369. [Google Scholar] [CrossRef]
- Wales, S.C.; Heitmeyer, R.M. An ensemble source spectra model for merchant ship-radiated noise. J. Acoust. Soc. Am. 2002, 111, 1211–1231. [Google Scholar] [CrossRef] [PubMed]
- Carey, W.M.; Evans, R.B. Ocean Ambient Noise: Measurement and Theory; Springer Science & Business Media: Berlin/Heidelberg, Germany, 2011. [Google Scholar]
- Hildebrand, J.A.; Frasier, K.E.; Baumann-Pickering, S.; Wiggins, S.M. An empirical model for wind-generated ocean noise. J. Acoust. Soc. Am. 2021, 149, 4516–4533. [Google Scholar] [CrossRef] [PubMed]
- Sertlek, H.Ö.; Slabbekoorn, H.; ten Cate, C.; Ainslie, M.A. Source specific sound mapping: Spatial, temporal and spectral distribution of sound in the Dutch North Sea. Environ. Pollut. 2019, 247, 1143–1157. [Google Scholar] [CrossRef] [PubMed]
- Aulanier, F.; Simard, Y.; Roy, N.; Gervaise, C.; Bandet, M. Effects of shipping on marine acoustic habitats in Canadian Arctic estimated via probabilistic modeling and mapping. Mar. Pollut. Bull. 2017, 125, 115–131. [Google Scholar] [CrossRef]
- Wang, C.; Zhang, L.; Sun, X. The shipping ambient sea noise predicting system based on AIS. Tech. Acoust. 2016, 35, 115–117. (In Chinese) [Google Scholar]
- Farcas, A.; Powell, C.F.; Brookes, K.L.; Merchant, N.D. Validated shipping noise maps of the Northeast Atlantic. Sci. Total Environ. 2020, 735, 139509. [Google Scholar] [CrossRef]
- Shan, Y. Study on Submarine Path Planning Based on Modified Ant Colony Optimization Algorithm. In Proceedings of the 2018 IEEE International Conference on Mechatronics and Automation (ICMA), Changchun, China, 5–8 August 2018; pp. 288–292. [Google Scholar]
- Fu, J.; Teng, L.; Bao, L.; Zhiwen, N.; Chang, Y. Three-Dimensional Underwater Path Planning of Submarine Considering the Real Marine Environment. IEEE Access 2022, 10, 37016–37029. [Google Scholar] [CrossRef]
- Qin, F.; Zhao, Z.; Yu, Z. Simulation of Submarine’s Acoustic Concealment Effectiveness in Heterogeneous Temperature Salt Feild. Simul. Submar. Acoust. Concealment Eff. Heterog. Temp. Salt Field 2020, 35, 62–67. (In Chinese) [Google Scholar]
- Mishra, M.; An, W.; Sidoti, D.; Han, X.; Ayala, D.F.M.; Hansen, J.A.; Pattipati, K.R.; Kleinman, D.L. Context-Aware Decision Support for Anti-Submarine Warfare Mission Planning Within a Dynamic Environment. IEEE Trans. Syst. Man Cybern. Syst. 2020, 50, 318–335. [Google Scholar] [CrossRef]
- Ru, J.; Yu, H.; Liu, H.; Liu, J.; Zhang, X.; Xu, H. A Bounded Near-Bottom Cruise Trajectory Planning Algorithm for Underwater Vehicles. J. Mar. Sci. Eng. 2023, 11, 7. [Google Scholar] [CrossRef]
- Yu, L.; Wei, Z.; Wang, Z.; Hu, Y.; Wang, H. Path optimization of AUV based on smooth-RRT algorithm. In Proceedings of the 2017 IEEE International Conference on Mechatronics and Automation (ICMA), Takamatsu, Japan, 6–9 August 2017; pp. 1498–1502. [Google Scholar]
- Sang, H.; You, Y.; Sun, X.; Zhou, Y.; Liu, F. The hybrid path planning algorithm based on improved A* and artificial potential field for unmanned surface vehicle formations. Ocean Eng. 2021, 223, 108709. [Google Scholar] [CrossRef]
- Yonetani, R.; Taniai, T.; Barekatain, M.; Nishimura, M.; Kanezaki, A. Path Planning using Neural A* Search. In Proceedings of the 38th International Conference on Machine Learning 2021, Proceedings of Machine Learning Research, Virtual, 18–24 July 2021; pp. 12029–12039. [Google Scholar]
- Ma, Y.N.; Gong, Y.J.; Xiao, C.F.; Gao, Y.; Zhang, J. Path Planning for Autonomous Underwater Vehicles: An Ant Colony Algorithm Incorporating Alarm Pheromone. IEEE Trans. Veh. Technol. 2019, 68, 141–154. [Google Scholar] [CrossRef]
- Yong-qi, G.; Peng, W.; Wei-qiang, M. Research on Penetration Path Planning Method on Near Sea Bottom Based on the Sonar Detection Blind Zone. J. Phys. Conf. Ser. 2021, 1871, 012087. [Google Scholar] [CrossRef]
- Liu, Q.; Yu, Y.; Yang, X. Principle and Application of Dynamic Efficiency Calculation for Sonar Systems (Chinese); Science Press: Beijing, China, 2023. [Google Scholar]
- Traverso, F.; Gaggero, T.; Tani, G.; Rizzuto, E.; Trucco, A.; Viviani, M. Parametric analysis of ship noise spectra. IEEE J. Oceanic Eng. 2016, 42, 424–438. [Google Scholar] [CrossRef]
- Reeder, D.B.; Sheffield, E.S.; Mach, S.M. Wind-generated ambient noise in a topographically isolated basin: A pre-industrial era proxya). J. Acoust. Soc. Am. 2011, 129, 64–73. [Google Scholar] [CrossRef] [PubMed]
- Merchant, N.D.; Brookes, K.L.; Faulkner, R.C.; Bicknell, A.W.J.; Godley, B.J.; Witt, M.J. Underwater noise levels in UK waters. Sci. Rep. 2016, 6, 36942. [Google Scholar] [CrossRef] [PubMed]
- Yang, C.; Pan, J.; Wei, K.; Lu, M.; Jia, S. A Novel Unmanned Surface Vehicle Path-Planning Algorithm Based on A* and Artificial Potential Field in Ocean Currents. J. Mar. Sci. Eng. 2024, 12, 285. [Google Scholar] [CrossRef]
- Ferla, C.; Porter, M.B. Receiver depth selection for passive sonar systems. IEEE J. Ocean. Eng. 1991, 16, 267–278. [Google Scholar] [CrossRef]
- Wen, L.; Shu, H.; Hui, L. Research on submarine concealment effectiveness modeling and fast calculation. Ship Sci. Technol. 2023, 45, 39–46. [Google Scholar]
Disclaimer/Publisher’s Note: The statements, opinions and data contained in all publications are solely those of the individual author(s) and contributor(s) and not of MDPI and/or the editor(s). MDPI and/or the editor(s) disclaim responsibility for any injury to people or property resulting from any ideas, methods, instructions or products referred to in the content. |
© 2025 by the authors. Licensee MDPI, Basel, Switzerland. This article is an open access article distributed under the terms and conditions of the Creative Commons Attribution (CC BY) license (https://creativecommons.org/licenses/by/4.0/).