Abstract
This study investigates the effects of key geometric parameters on the hydrodynamic and cavitation characteristics of two-element hydrofoil systems for fully submerged unmanned hydrofoil craft, aiming to solve their active stabilization problems. Using STARCCM+ software, the RANS method, and the SST k-ω turbulence model, the research analyzes the impacts of flap deflection angle (α), main wing-to-flap chord ratio (c1/c2), and spacing (g). Results show that when the spacing is fixed, increasing the chord ratio reduces the lift and drag coefficients. When the chord ratio is fixed, increasing the spacing causes the lift and drag coefficients to first rise and then fall. With increasing flap deflection angle (α), cavitation intensifies, but it can be suppressed by increasing the chord ratio, reaching a minimum at g = 2.4%c1. The optimal configuration is c1/c2 = 1.5 and g = 2.4%c1, which can balance the lift–drag performance and anti-cavitation capability. This study provides a scientific basis for solving the active stabilization problems of fully submerged unmanned hydrofoil craft and insights for enhancing their seakeeping performance.
1. Introduction
As societal demands for environmental protection continue to rise, the more energy-efficient fully submerged hydrofoil craft has emerged as a prominent research focus. A key advantage of this technology is that as velocity increases, the substantial lift generated by the underwater hydrofoils can elevate the hull entirely above the water surface, enabling efficient navigation. This reduces hydrodynamic resistance—particularly the wave-making resistance—resulting in significant energy savings and improved speed performance. Despite their superior performance, fully submerged hydrofoil craft lack active anti-rolling capabilities and struggle to maintain navigation stability under complex sea conditions. Thus, developing a control system that is capable of actively adjusting attitude and enhancing stability is crucial. The two-element hydrofoil system (main wing + flap) is ideal for active anti-rolling control. Its core principle is that real-time adjustment of the flap deflection angle allows flexible and precise control over the magnitude and distribution of lift generated by the hydrofoil system. This active controllability enables effective adaptation to varying operating conditions and wave interference, compensates for changes in hull attitude, and endows fully submerged hydrofoil craft with the much-needed active stability.
Chen L [1] investigated the impact of flap rotation axes on the hydrodynamic performance of rigid wing sails for vessels, with relevant experimental data collected. Lawrence J [2] developed an analytical method for infinite Froude numbers to assess two-element hydrofoil performance. Guang S and Yong W [3] proposed an oscillating hydrofoil model with trailing-edge flaps to enhance energy extraction efficiency. Zhe S [4] used CFD to study a three-bladed cycloidal propeller with trailing-edge flaps. Yuchen [5] used parametric methods and neural networks to analyze tandem NACA 0012 hydrofoils via a 2D viscous model (STAR-CCM+). Jialun L [6] examined the two-dimensional foil configurations with varying profiles and spacing. Ke-wei Song et al. [7] numerically analyzed stern flaps’ influence on vessel resistance and propulsion. Suastika [8] used CFD to study how stern hydrofoil installation height (with fixed fore foil height) affects hydrofoil craft lift/drag. Oller S.A. et al. [9] evaluated the Selig S1223 high-lift airfoil as a hydrofoil via CFD, analyzing lift, drag, and flow fields to inform profile selection. Anil Yildirim et al. [10] used RANS to study T-shaped hydrofoil performance. Liuhua Liang et al. [11] modeled a wave-piercing catamaran’s motion under varied sea conditions via CFD. Amin [12] experimentally optimized the hydrodynamic performance of catamarans using hydrofoil elements. Ji Bin [13] aimed to explore hydrofoil cavitation characteristics to inform system design. Stutz B [14,15] used probe measurements for pressure and velocity. Kawanami et al. [16] observed cloud cavitation via high-speed imaging and measured hydrofoil surface pressure. Dan [17] studied the ventilated cavitation over a NACA0015 hydrofoil by numerical methods. Ji [18,19] simulated twisted hydrofoil suction-side cavitation. Amin Najaf [20] conducted preliminary experiments on NACA-16, Eppler-874, and Gottingen-11K hydrofoil performance. Romani [21] presented the uncertainty quantification and sensitivity analysis of the standard k-ɛ turbulence model applied to the numerical prediction of the non-cavitating and cavitating flow around a 2D NACA66MOD hydrofoil. Biswas [22] demonstrated the hydrodynamic performance of a modified NACA 4412 hydrofoil and compared it with the base NACA 4412 hydrofoil in the presence of cavitation. Wei [23] investigated changes in the hydrodynamics of hydrofoils under the action of the near-free-surface effect. Perić [24] studied the challenges in simulating cavitating flows, specifically the flows around propellers and rudders.
Extant research on hydrofoils focuses on performance differences arising from hydrofoil shape modifications, the impact of varying navigation conditions on hydrodynamic performance, and similar topics. However, there is a paucity of research on two-element hydrofoils: the relationship between the hydrofoil chord ratio and its hydrodynamic performance remains unclear; the influence of cavitation (a phenomenon induced by two-element hydrofoil motion) on hydrodynamic performance has yet to be clarified; and the combined effect of varying main wing-flap spacing and other navigation conditions on such performance requires further investigation. Furthermore, in practical engineering applications, a hydrofoil’s hydrodynamic performance and control strategies vary with its chord ratio and flap deflection angle.
To improve understanding of the hydrodynamic characteristics of two-element hydrofoils under diverse chord ratios, spacings, and flap deflection angles, and to identify how varying conditions affect cavitation, comprehensive experimental data collection has been conducted. This work provides a foundation for subsequent active stability control methods. This paper presents a comprehensive study of hydrodynamic performance under varying chord ratios, spacings, and flap deflection angles. It also offers a detailed analysis of cavitation phenomena for a specific hydrofoil under different conditions. Additionally, it employs parametric modeling to optimize the hydrofoil’s hydrodynamic characteristics.
2. Numerical Modeling and Validation
2.1. Numerical Methods
In this paper, we perform a simulation of a hydrofoil using the commercial software STARCCM+(Version 2306). The simulation employs the SST k-ω model, a turbulence model derived from the Reynolds-averaged Navier–Stokes (RANS) equations. The mass and momentum conservation equations can be expressed as follows:
Mass conservation:
where is the density, v is the velocity of the continuum.
Conservation of momentum:
where f is the combined force of various volumetric forces acting on a unit volume of the continuum, and τ is the Stress tensor.
Transport equation of SST K-Omega model:
where k represents the turbulent kinetic energy, ω, which reflects the dissipation rate of turbulent energy. is the turbulent dynamic viscosity. U is the mean velocity, μ is the dynamic viscosity, , are model coefficients, and are result terms, is the free shear correction factor, and is the eddy extension correction factor. and are user-specified source terms. and are ambient turbulence values that prevent turbulence from decaying. is the turbulent energy dissipation rate coefficient in the k-ω model.
The cavitation model, which describes the mass transfer rate between the vapor and liquid phases in the flow field, is a key model for simulating the cavitation process. This study uses the Schnerr–Sauer model, which has the advantage that the source term expression does not contain empirical constants and has high universality. In this model, the mass source terms represent the evaporation rate and the condensation rate .
where is the vapor phase density, is the liquid phase density, is the volume fraction of the vapor phase in the unit cell, is the saturated vapor pressure at the local temperature, and is the gas core radius. The expression is as follows:
In the formula, is a constant, which is set to based on experience.
2.2. Two-Element Wing Geometry Parameters and Boundary Conditions
The two-element hydrofoil system designed in this study, along with the fully submerged hydrofoil craft it is applied to, is shown in Figure 1a. This subfigure depicts a hydrofoil craft with three two-element hydrofoil systems mounted on its bottom, adopting a canard layout. The frame above the hull is designed as an adjustable structure, enabling fore–aft and vertical adjustment of the hydrofoil system. The working principle is as follows: when the fully submerged hydrofoil craft sails at high speed, water flows over the surface of the two-element hydrofoil. Strong lift generated by the two-element hydrofoil system lifts the hull completely out of the water, thereby reducing hydrodynamic resistance (particularly wave-making resistance) and enabling energy efficiency and speed enhancement. (b) This subfigure illustrates the two-element hydrofoil system, which comprises a main wing and a flap, with c1 denoting the main wing chord length, c2 the flap chord length, g the spacing between the main wing and flap, and α the flap deflection angle. Specific structural parameters are provided in Table 1.
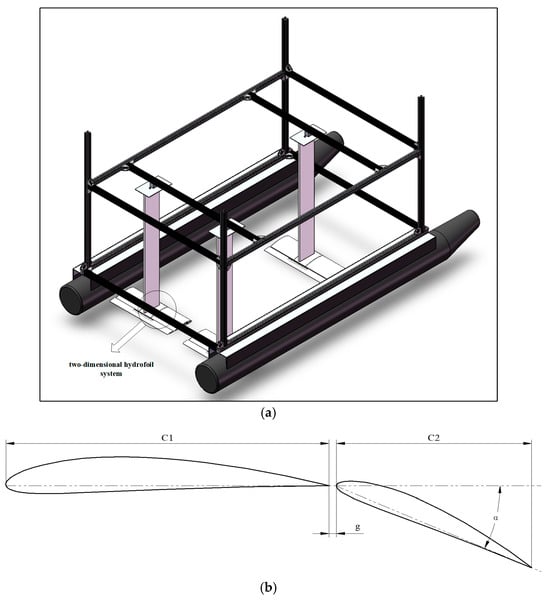
Figure 1.
Model display: (a) Fully submersible hydrofoil craft. (b) two-element hydrofoil system.

Table 1.
Key geometric parameters.
The two-element hydrofoil configuration comprises a main wing (chord length denoted as c1) and a flap (chord length denoted as c2), with the design ensuring that the main wing’s chord length (c1) remains constant. Given the favorable lift-to-drag ratio of NACA series airfoils at low Reynolds numbers, both the fore and aft hydrofoils adopt the NACA 4412 profile. Let α represent the flap deflection angle of the secondary (aft) hydrofoil, and g denote the spacing between the fore and aft hydrofoils. Three spacing scenarios are considered: g = 1.2%c1, g = 2.4%c1, and g = 3.6%c1. The computational domain, as depicted in Figure 2, uses a two-dimensional mesh for simulation; its left boundary serves as the velocity inlet, the right boundary as the pressure outlet, and the upper and lower boundaries act as symmetry planes.
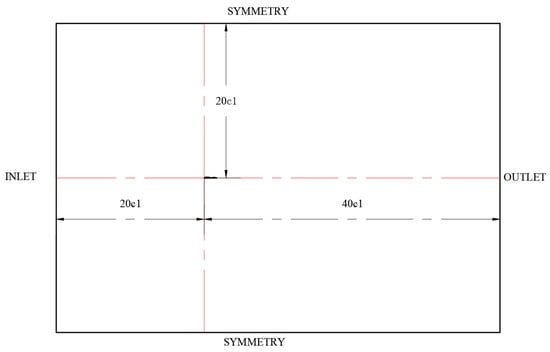
Figure 2.
Computational domain display diagram.
2.3. Model Validation
The numerical simulation was performed using the commercial software STARCCM+, whose turbulence models are mainly categorized into two types: those that solve the Reynolds-averaged Navier–Stokes (RANS) equations, and those that resolve large-scale turbulence and small-scale motions—such as large eddy simulation (LES) and detached eddy simulation (DES). Since this study focuses on two-dimensional fluid dynamics simulations, the RANS equations and corresponding turbulence models were adopted. The commonly used RANS turbulence models in STAR-CCM+ include the k-ω model and the k-ε model. This study employs the SST k-ω model, uses the NACA4412 hydrofoil for model validation, and compares the results with those from the k-ε model, experimental data from Subash Dhakal [25], and data from XFOIL.
As illustrated in Figure 3, the data from each model exhibit reasonable consistency when the angle of attack ranges from 0° to 14°. However, at higher angles of attack, flow separation occurs on the hydrofoil surface, leading to the formation of eddies. This instability results in fluctuations in the lift coefficient. Furthermore, discrepancies in experimental results at larger angles of attack may also stem from differences in measurement techniques and experimental conditions.
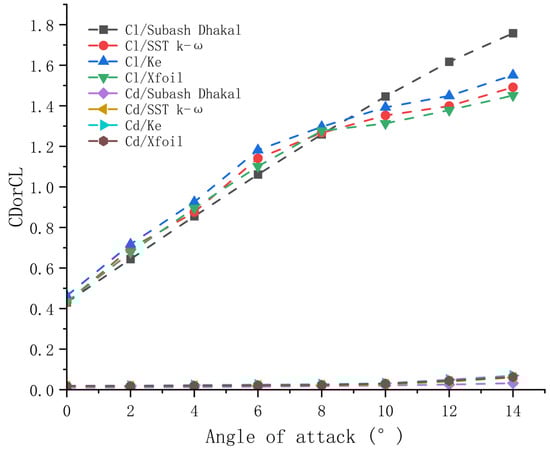
Figure 3.
Model validation diagram.
This numerical simulation was performed using a two-dimensional RANS method. However, considering the impact of three-dimensional effects on specific results—such as the generation of wingtip vortices (which increase drag) or the formation of spanwise-extending vortex structures (which induce hydrofoil yaw moments that affect navigation stability)—this study analyzes changes in the lift and drag coefficients of the two-element hydrofoil under subsequent three-dimensional conditions, with specific results included in the Supplementary Analysis. More detailed content in this regard, however, lies beyond the scope of this study. In summary, analysis of Figure 3 indicates that the SST k-ω model is a more appropriate choice, as it aligns well with the overall trend of numerical results from other models.
2.4. Grid Independence Study
To accurately simulate the lift, drag, lift-to-drag ratio, variations in flap deflection angle, and vortices generated around the hydrofoil model, it is essential to meticulously refine the boundary layer mesh surrounding the hydrofoil. For near-wall fluid dynamics, a prismatic layer mesh is employed, which allows the solver to more precisely compute near-wall forces and predict fluid separation. Per the requirements of the computational model, the y+ value is constrained to y+ ≤ 1. The thickness of the first boundary layer mesh layer can be estimated based on the wall distance:
These can be obtained by the following formula:
Equations (8)–(11) represent the distance from the first boundary layer mesh to the wing surface, represent the fluid velocity at the wall, represent the kinematic viscosity of the water, and represents the density of the water. When the chord ratio is set at 1.5, the flap deflection angle is 25°, and the spacing is 2.4%c1, the maximum value of is determined to be 0.872. Therefore, the thickness of the initial layer of the boundary layer grid around the hydrofoil is approximately equal to the wall distance, which meets the criteria for establishing the selected model. The specific distribution is shown in Figure 4.
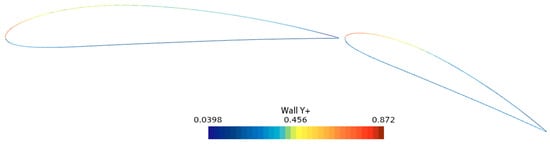
Figure 4.
Display drawing.
To ensure that the number of grid points does not compromise the accuracy of numerical results, this study performed a grid independence analysis. For illustration, a two-element hydrofoil (with a spacing of 2.4%c1 and a chord ratio of 1.5) was used, with four different grid densities adopted corresponding to grid counts of 353,256, 409,166, 515,619, and 633,091. The effect of the number of computational elements on the lift coefficient and drag coefficient was analyzed at flap deflection angles of 25° and 10°, with results presented in Table 2 and Table 3, respectively. Figure 5 more clearly illustrates variations in lift and drag coefficient errors with grid refinement. To accurately simulate the flow around the hydrofoil, the wake region was refined, and a prismatic layer was applied to the hydrofoil surface to better capture fluid separation.
Table 2.
Hydrodynamic performance of a two-element hydrofoil with a chord ratio of c1/c2 = 1.5, a spacing of g = 2.4%c1, and a flap deflection angle of 25° and 10° under different cells.
Table 3.
CL error and CD error of a two-element hydrofoil with a chord ratio of c1/c2 = 1.5, a spacing of g = 2.4%c1, and a flap deflection angle of 25° and 10° under different grids.
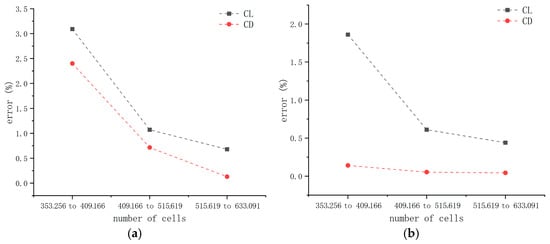
Figure 5.
Grid independence verification: (a) Verification of the grid independence of a two-element hydrofoil with c1/c2 = 1.5, spacing g = 2.4%c1, and a flap deflection angle of 25°. (b) Verification of grid independence of a two-element hydrofoil with c1/c2 = 1.5, spacing g = 2.4%c1, and a flap deflection angle of 10°.
An examination of Table 2 and Table 3 and Figure 5 shows that, at a flap deflection angle of 25°, refining the grid from 353,256 to 409,166 cells results in a lift coefficient change of 0.09304 (with an error of 3.09%) and a drag coefficient change of 0.007239 (with an error of 2.4%). Further refining the grid from 409,166 to 515,619 cells at the same angle yields a lift coefficient change of 0.03276 (error: 1.07%) and a drag coefficient change of 0.002204 (error: 0.715%). Finally, refining from 515,619 to 633,091 cells at 25° results in a lift coefficient change of 0.02133 (error: 0.68%) and a drag coefficient change of 0.000404 (error: 0.13%).
At a flap deflection angle of 10°, refining the grid from 353,256 to 409,166 cells leads to a lift coefficient change of 0.018011 (error: 1.86%) and a drag coefficient change of 0.000151 (error: 0.14%). Further refinement from 409,166 to 515,619 cells at this angle results in a lift coefficient change of 0.005761 (error: 0.61%) and a drag coefficient change of 0.000055 (error: 0.052%). Finally, refining from 515,619 to 633,091 cells at 10° yields a lift coefficient change of 0.004231 (error: 0.44%) and a drag coefficient change of 0.000044 (error: 0.042%).
To optimize computational resources, a grid with 515,619 cells was selected for subsequent calculations, with the grid structure illustrated in Figure 6.
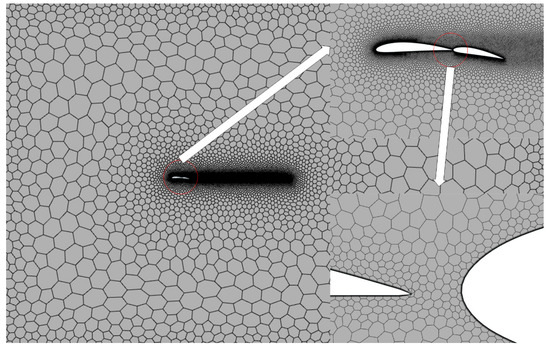
Figure 6.
Schematic representation of grid partitioning.
3. Comparison and Analysis
3.1. Flow Field Characteristics Around Hydrofoil in Water Separation Process
At a flap deflection angle of 32.5°, flow separation occurs around the hydrofoil, resulting in an unstable flow field. To elucidate this phenomenon, a two-element hydrofoil with a chord length ratio of c1/c2 = 2.7 was selected for analysis, and an implicit unsteady method was employed for numerical resolution. The simulated lift coefficient is presented in Figure 7. As illustrated in this figure, the lift coefficient exhibits a regular temporal variation. This variation is primarily attributed to flow separation occurring on the surface of the two-element hydrofoil.
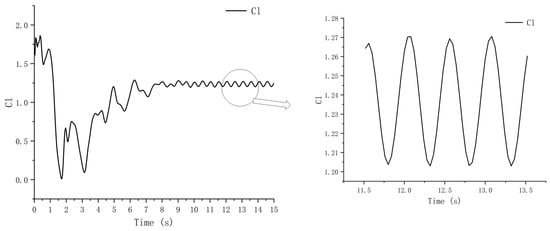
Figure 7.
Flow separation diagram.
3.2. Effects of Flap Deflection Angle, Chord Ratio, and Wing Spacing on Hydrodynamic Characteristics of Two-Element Hydrofoils
To investigate the influence of key variables such as chord ratio, hydrofoil spacing, and flap deflection angle on the hydrodynamic performance of the double-section hydrofoil, numerical simulation experiments were conducted in this study at a fixed speed of 8.4 m/s. Specifically, eight different flap deflection angles were adopted: 32.5°, 30°, 27.5°, 25°, 20°, 15°, 10°, and 5°; and three hydrofoil gap combinations were used: g = 1.2%c1, g = 2.4%c1, and g = 3.6%c1. The chord ratios of the six groups of hydrofoils increased in increments of 0.5, ranging from 1.5 to 3. The simulation results obtained from the numerical simulations are presented in Figure 8, Figure 9, Figure 10 and Figure 11.
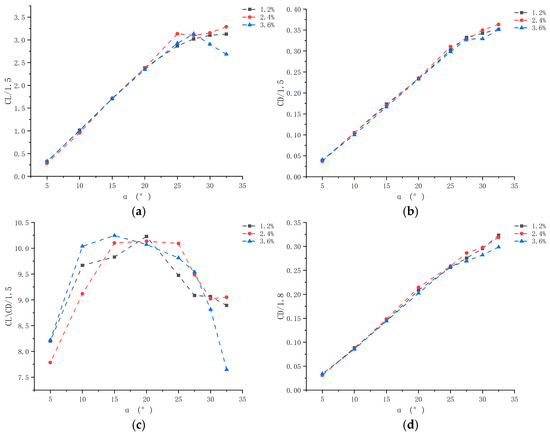
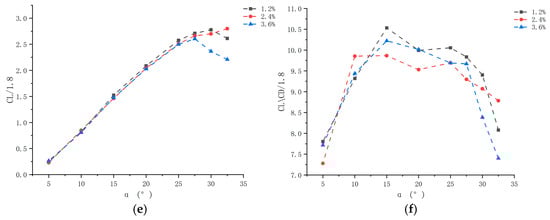
Figure 8.
Spacings diagram: (a) Lift coefficient of a two-element hydrofoil with a chord ratio of c1/c2 = 1.5 at different spacings. (b) Drag coefficient of a two-element hydrofoil with a chord ratio of c1/c2 = 1.5 at different spacings. (c) Lift-to-drag ratio of a two-element hydrofoil with a chord ratio of c1/c2 = 1.5 at different spacings. (d) Drag coefficient of a two-element hydrofoil with a chord ratio of c1/c2 = 1.8 at different spacings. (e) Lift coefficient of a two-element hydrofoil with a chord ratio of c1/c2 = 1.8 at different spacings. (f) Lift-to-drag ratio of a two-element hydrofoil with a chord ratio of c1/c2 = 1.8 at different spacings.
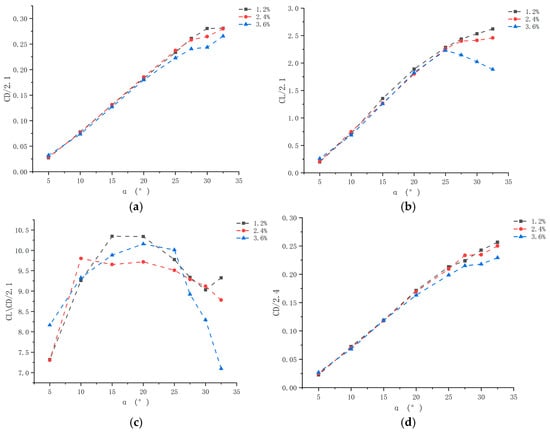
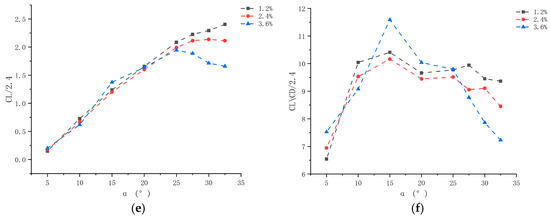
Figure 9.
Spacings diagram: (a) Drag coefficient of a two-element hydrofoil with a chord ratio of c1/c2 = 2.1 at different spacings. (b) Lift coefficient of a two-element hydrofoil with a chord ratio of c1/c2 = 2.1 at different spacings. (c) Lift-to-drag ratio of a two-element hydrofoil with a chord ratio of c1/c2 = 2.1 at different spacings. (d) Drag coefficient of a two-element hydrofoil with a chord ratio of c1/c2 = 2.4 at different spacings. (e) Lift coefficient of a two-element hydrofoil with a chord ratio of c1/c2 = 2.4 at different spacings. (f) Lift-to-drag ratio of a two-element hydrofoil with a chord ratio of c1/c2 = 2.4 at different spacings.
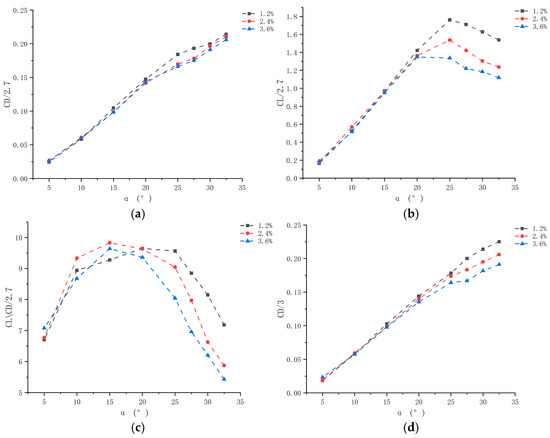
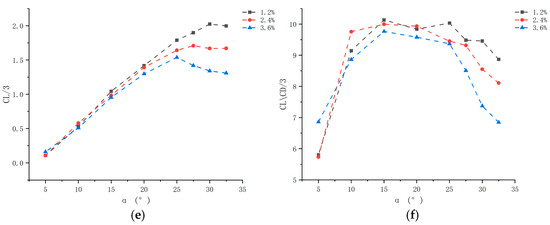
Figure 10.
Spacing diagram: (a) Drag coefficient of a two-element hydrofoil with a chord ratio of c1/c2 = 2.7 at different spacings. (b) Lift coefficient of a two-element hydrofoil with a chord ratio of c1/c2 = 2.7 at different spacings. (c) Lift-to-drag ratio of a two-element hydrofoil with a chord ratio of c1/c2 = 2.7 at different spacings. (d) Drag coefficient of a two-element hydrofoil with a chord ratio of c1/c2 = 3 at different spacings. (e) Lift coefficient of a two-element hydrofoil with a chord ratio of c1/c2 = 3 at different spacings. (f) Lift-to-drag ratio of a two-element hydrofoil with a chord ratio of c1/c2 = 3 at different spacings.
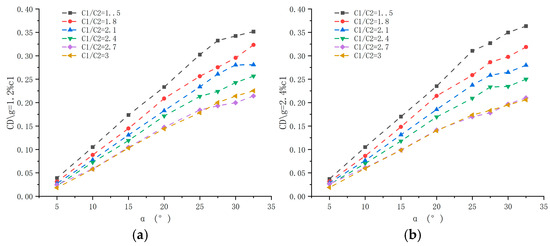
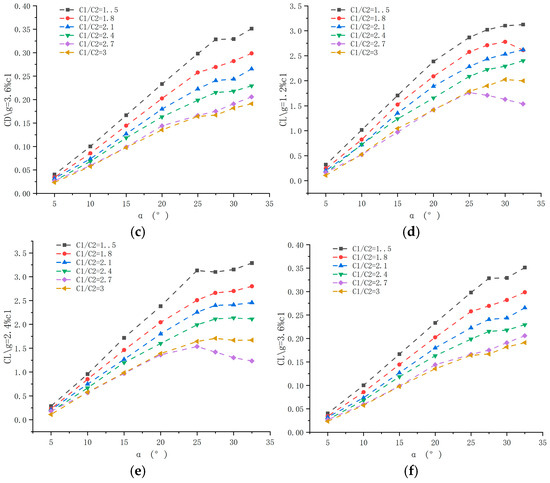
Figure 11.
Chord length ratio analysis diagram: (a) Drag coefficient of two-element hydrofoil with spacing g = 1.2%c1 at different chord length ratios. (b) Drag coefficient of two-element hydrofoil with spacing g = 2.4%c1 at different chord length ratios. (c) Drag coefficient of two-element hydrofoil with spacing g = 3.6%c1 at different chord length ratios. (d) Lift coefficient of a two-element hydrofoil with a spacing of g = 1.2%c1 at different chord length ratios. (e) Lift coefficient of a two-element hydrofoil with a spacing of g = 2.4%c1 at different chord length ratios. (f) Lift coefficient of a two-element hydrofoil with a spacing of g = 3.6%c1 at different chord length ratios.
3.2.1. Analysis of Flap Deflection Angle
Analysis of flap deflection angles reveals that the hydrodynamic performance of two-element hydrofoils with different chord ratios varies significantly (Figure 8, Figure 9 and Figure 10). At a specified spacing, as the flap deflection angle increases from 5° to 32.5°, the lift, drag, and lift-to-drag ratio undergo significant changes. The lift coefficients of the three hydrofoils exhibit a trend of either first increasing, then decreasing, or continuously increasing. Hydrofoils with a chord ratio of 1.5 and spacings of 1.2%c1 and 2.4%c1 attain lift peaks at 25°. This phenomenon stems from the Bernoulli effect and boundary layer separation: increasing the deflection angle raises the flow velocity on the hydrofoil’s upper surface and reduces pressure, creating a pressure difference that enhances lift. However, when the angle exceeds 25°, the adverse pressure gradient intensifies boundary layer separation, inducing stall and causing lift attenuation.
The drag coefficient increases with the deflection angle, a trend driven by pressure difference drag and frictional resistance: a larger deflection angle enlarges the windward projected area, increasing the normal component of fluid impact and thus pressure difference drag. Simultaneously, the boundary layer transitions to turbulence, and the friction coefficient increases nonlinearly with the Reynolds number, further elevating drag. The lift-to-drag ratio first increases, then decreases, exhibiting a bimodal pattern with peaks at 15° or 20°. These peaks correspond to the optimal energy conversion points: before the peak, the increase in lift outpaces that of drag (primarily frictional drag); after the peak, separated flow causes a sudden drop in lift and a surge in pressure difference drag, with energy dissipated in trailing vortices, thereby reducing efficiency.
Changes in cross-sectional area affect lift-to-drag characteristics via momentum theory: lift correlates positively with cross-sectional area and the sine of the flap deflection angle, while drag increases slowly with flap deflection. When the deflection angle exceeds 25°, the slowdown in lift growth, combined with the surge in drag induced by separated flow, dominates the decline in the lift-to-drag ratio. Ultimately, speed, chord ratio, and spacing collectively determine the dynamic trend of the lift-to-drag ratio as the flap deflection angle varies.
3.2.2. Analysis of Spacing
As shown in Figure 8, Figure 9 and Figure 10, the lift and drag coefficients of the two-element hydrofoil exhibit a trend of first increasing and then decreasing as the spacing between its elements increases from 1.2%c1 to 3.6%c1. The underlying principle for this phenomenon involves the interaction between gap jets and boundary layer separation.
A narrow spacing of 1.2%c1 induces jet formation, causing a sharp increase in flow velocity. This, in turn, enhances the pressure difference on the upper surface of the flap, thereby boosting lift. However, at spacings exceeding 2.4%c1, the jet weakens, leading the separation point to shift rearward. This results in a surge in pressure drag, consequently reducing lift. Changes in spacing also enhance flow over the flap, inducing vortex formation. At a spacing of 1.2%c1, the jet merges with the mainstream to form a strong shear layer, causing vortex intensity to first increase and then decrease. At 3.6%c1, the jet velocity decreases, weakening the vortex—this explains why the hydrofoil’s coefficients (lift and drag) first rise and then fall.
Regarding the lift-to-drag ratio, the hydrofoil with a spacing of 3.6%c1 performs the poorest. This is because weakened flow field coupling makes the boundary layer prone to separation, limiting lift gain while causing a sharp increase in drag. In contrast, hydrofoils with spacings of 1.2%c1 and 2.4%c1 achieve peak lift-to-drag ratios at specific deflection angles, as the main wing wake delays separation of the flap’s boundary layer. When the chord ratio is 1.5, spacings of 1.2%c1 and 2.4%c1 yield optimal performance: the former relies on enhanced jet-induced lift, while the latter depends on optimized drag control via separation point regulation. Both approaches can maintain high energy conversion efficiency over a wide range of deflection angles.
3.2.3. Analysis of Chord Ratio
Analysis of chord ratio: as shown in Figure 11, under different spacing conditions, the lift and drag coefficients of two-element hydrofoils with different chord ratios vary as the flap deflection angle increases. The variation in lift coefficient is essentially dominated by flow field coupling effects: when the chord ratio increases to 1.5, the relative size of the flap decreases, and the main wing wake covers a larger area of the flap’s leading edge, forming a “wake energy injection effect.” High-energy vortex clusters shed from the main wing’s trailing edge act directly on the flap’s upper surface, enhancing the kinetic energy of its boundary layer, delaying boundary layer separation, and causing the lift coefficient to increase as the chord ratio rises.
When the chord ratio exceeds 1.5, however, the flap becomes too small, sharply reducing its effective lift-generating area. Despite sufficient energy in the main wing wake, the flap cannot generate an adequate pressure difference, and lift gain is attenuated due to geometric effects. The lift coefficient increases with the chord ratio, peaking at a chord ratio of 1.5 under spacings of 1.2%c1 and 2.4%c1; furthermore, the lift coefficient continues to rise as the flap deflection angle increases. In terms of the drag coefficient, it also shows an upward trend as the chord ratio increases. This is because when the chord ratio exceeds 1.5, the flap is too small, weakening its interaction with the main wing wake. The wake vortex area generated solely by the main wing expands, and pressure drag surges due to intensified separated flow.
Analyzing the underlying reasons for these changes reveals that as the chord ratio increases, the flap size decreases while the main wing size remains unchanged. Thus, for the double-wing configuration during navigation, their total cross-sectional area gradually decreases, but the geometric effect of cross-sectional area competes with the flow field separation effect: when the chord ratio is ≤1.5, the energy injection effect of the main wing wake on the flap dominates, causing both lift and drag to increase simultaneously; when the chord ratio is >1.5, the geometric effect of reduced flap cross-sectional area dominates, leading to simultaneous decreases in lift and drag, and consequently, in their respective coefficients.
Notably, as the flap deflection angle increases, hydrofoils with different chord ratios exhibit distinct stall characteristics. From the perspective of boundary layer theory, hydrofoils with a relatively small chord ratio (e.g., 2.7, i.e., main wing/flap = 1.5, where the flap is larger) are prone to “trailing edge separation” at high flap deflection angles. This is because the flap has a larger relative chord length, its boundary layer is fully developed, and the stall process is relatively gradual. In contrast, hydrofoils with a relatively large chord ratio (e.g., 3.0, where the flap is smaller) are more susceptible to “leading edge separation” at high flap deflection angles due to the thin boundary layer on the flap. This advances the stall critical point and results in more severe lift decay. These differences lead to distinct trends in lift and drag coefficients at larger flap deflection angles.
In conclusion, with regard to practical applications, the two types of two-element configurations that exhibit the best performance are those with a chord length ratio of 1.5 and a spacing g = 1.2%c1, as well as those with a chord length ratio of 1.5 and a spacing g = 2.4%c1. The optimal flap deflection angle for sailing in these cases is determined to be 25°.
3.3. Analysis of Hydrodynamic Performance of Two-Element Hydrofoils with Chord Ratio of 1.5 and Study on the Influence of Multiple Conditions on Cavitation Phenomenon
The preceding analysis indicates that, among the designed two-element hydrofoils, the hydrodynamic characteristics of those with a chord ratio of 1.5 and spacings of g = 1.2%c1 and g = 2.4%c1 are optimal. To further investigate their performance, a detailed analysis is conducted. The experimental data for these two types of hydrofoils are summarized in Figure 12 and Table 4.
Figure 12.
Chord length ratio 1.5 result.
Table 4.
The chord ratio c1/c2 = 1.5, hydrodynamic performance at different spacings and different flap deflection angles.
3.3.1. Analysis of Flap Deflection Angle
As the deflection angle increases from 5° to 32.5°, the performance of the two-element hydrofoils with a chord ratio of 1.5 and spacings of 1.2%c1 and 2.4%c1 is as follows: First, the drag coefficient increases synergistically due to pressure difference drag and frictional resistance. Second, the increased deflection angle enlarges the windward area, leading to a rise in pressure difference drag. Third, the transition of the boundary layer to turbulence causes frictional resistance to increase nonlinearly. The lift-to-drag ratio reaches its maximum at 20°, which corresponds to the critical point of energy conversion. Before 20°, the increase in lift exceeds that of drag; after 20°, flow separation results in a precipitous drop in lift and a concomitant surge in drag.
For the hydrofoil with a spacing of 1.2%c1, the lift coefficient first increases and then continues to rise. This is because the narrow spacing generates a jet that accelerates fluid on the upper surface, delaying boundary layer separation. In contrast, the lift of the hydrofoil with a spacing of 2.4%c1 peaks at 25° before decaying—this is caused by jet weakening, which triggers boundary layer separation. Subsequently, the separation point shifts rearward, leading to a renewed rise in lift. Stall is more pronounced for the 2.4%c1 spacing: the large velocity gradient on the flap’s upper surface, combined with an adverse pressure gradient, induces separation. For the 1.2%c1 spacing, lift is suppressed at small deflection angles due to the incomplete establishment of the jet effect. In terms of drag, the jet in the 1.2%c1 spacing suppresses boundary layer thickening, resulting in lower drag compared to the 2.4%c1 spacing. Both hydrofoils achieve peak lift-to-drag ratios at 25°: the 1.2%c1 spacing relies on jet-induced lift enhancement, while the 2.4%c1 spacing depends on optimized separation control to reduce drag, thus striking the optimal balance between lift and drag.
3.3.2. Analysis of Spacing
Spacing analysis: As shown in Figure 12 and Table 4, when the chord ratio is 1.5, the lift and drag coefficients of the hydrofoil first increase and then decrease as the spacing between the main wing and the flap increases from 1.2%c1 to 3.6%c1. The fundamental mechanism behind this phenomenon involves the coupling of gap jets and boundary layer separation. In aerodynamic terms, the spacing between the main wing and the flap—expressed as a percentage of the main wing chord length (c1)—plays a pivotal role in forming a robust jet. At a spacing of 1.2%c1, the jet induces a significant lift surge, a phenomenon rooted in the Bernoulli effect. However, this lift increase is accompanied by higher drag due to the development of a jet shear layer. Conversely, at a spacing of 3.6%c1, the jet weakens, causing the separation point to shift rearward. This shifts the dominance to pressure difference drag, leading to a decline in lift.
The lift-to-drag ratio exhibits distinct trends before and after 20° deflection. Prior to 20°, the ratio first decreases and then increases with larger spacing: Jets at small spacings have inadequate energy matching, so increasing spacing optimizes wake energy injection, making lift gains outpace drag increases. After 20°, separated flow at large spacings intensifies; vortex dissipation exceeds lift gains, causing the lift-to-drag ratio to first increase and then decrease with larger spacing. This behavior stems from the effect of spacing on vortex intensity. At 1.2%c1, the jet merges with the mainstream to form a high-frequency Karman vortex street, with vortex intensity first increasing (peaking at 2.4%c1) and then decreasing as spacing changes. Beyond this optimal spacing, vortex dissipation becomes the primary factor reducing the lift-to-drag ratio.
In essence, this phenomenon reflects a dynamic balance between vortex intensity and flow field energy conversion across different spacings: before 20°, spacing optimizes vortex behavior to enhance lift; after 20°, the expansion of trailing vortices causes a drag surge, resulting in the bidirectional variation in the lift-to-drag ratio.
In order to analyze the influence of different conditions (flap deflection angle, spacing, chord length ratio) on the cavitation phenomenon on the surface of the two-element hydrofoil, the numerical results are summarized in Figure 13, Figure 14, Figure 15, Figure 16, Figure 17 and Figure 18, and the specific analysis is as follows.
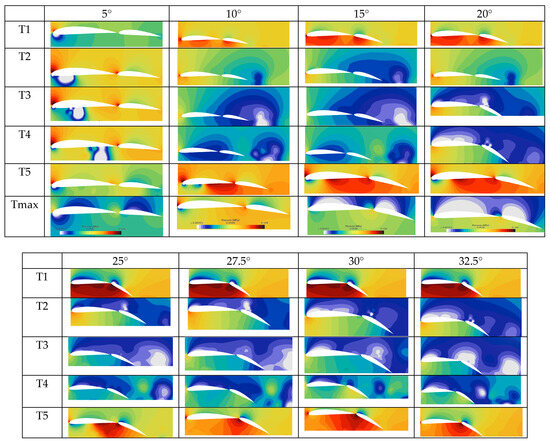
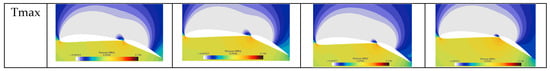
Figure 13.
Pressure cloud diagram of the two-element hydrofoil with g = 2.4%c1 as the flap deflection angle changes (T1 to T5 are five time points in a motion cycle during early motion, and Tmax is the time point after the motion stabilizes).
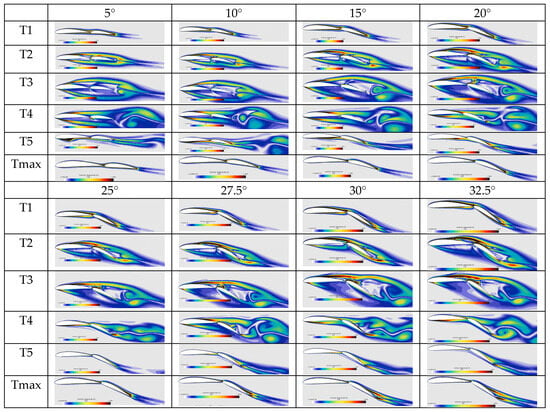
Figure 14.
Cloud diagram of vorticity of the two-element hydrofoil with g = 2.4%c1 as the flap deflection angle changes (T1 to T5 are five time points in a motion cycle during early motion, and Tmax is the time point after the motion stabilizes).
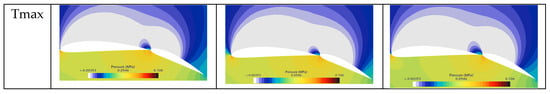
Figure 15.
Pressure cloud diagram of a two-element hydrofoil with a chord ratio of c1/c2 = 1.5 as the spacing g changes (T1 to T5 are five time points in a motion cycle during early motion, and Tmax is the time point after the motion stabilizes).
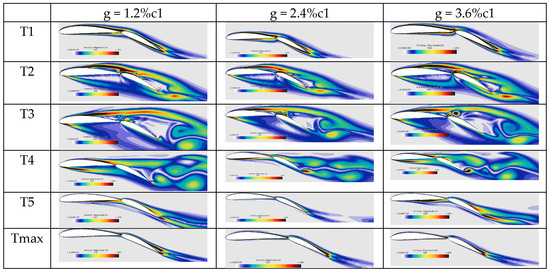
Figure 16.
Cloud diagram of vorticity of a two-element hydrofoil with a chord ratio of c1/c2 = 1.5 as the spacing g changes (T1 to T5 are five time points in a motion cycle during early motion, and Tmax is the time point after the motion stabilizes).
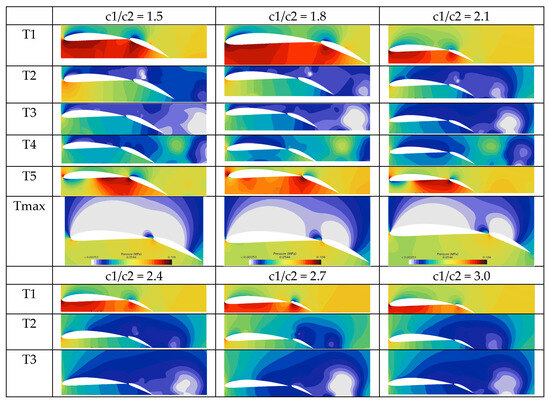
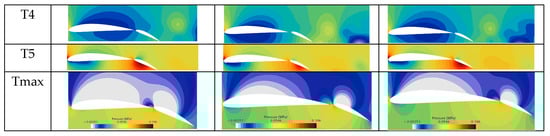
Figure 17.
Pressure cloud diagram of the two-element hydrofoil with g = 2.4%c1 as the chord length ratio c1/c2 changes (T1 to T5 are five time points in a motion cycle during early motion, and Tmax is the time point after the motion stabilizes).
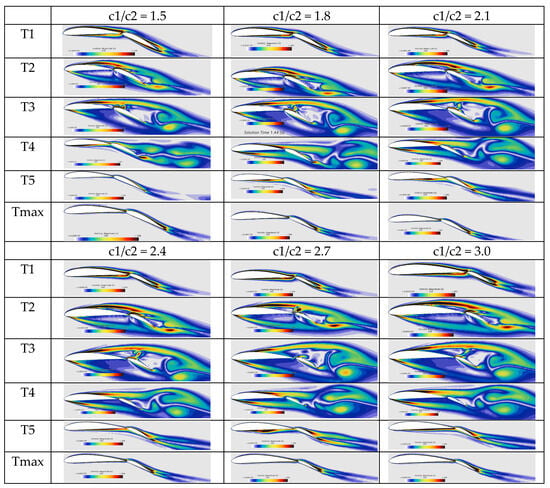
Figure 18.
Vorticity cloud diagram of the two-element hydrofoil with g = 2.4%c1 as the chord length ratio c1/c2 changes (T1 to T5 are five time points in a motion cycle during early motion, and Tmax is the time point after the motion stabilizes).
3.3.3. Analysis of Cavitation Phenomenon with Variable Flap Deflection Angle
Figure 13 shows the pressure contour of the two-element hydrofoil as the flap deflection angle changes (T1–T5 correspond to five time points in the initial motion cycle, and Tmax is the time point after motion stabilization). The minimum pressure value in the contour is set to the saturated vapor pressure of the experimental environment, so cavitation (a physical phenomenon in which the liquid vaporizes to form bubbles due to the local pressure dropping to the saturated vapor pressure of the liquid at that temperature) occurs in the blank areas of the image (where pressure is lower than this set minimum). Focusing on the two-element hydrofoil with a flap deflection angle of 30°, analysis of this image group reveals that during the initial movement stage, cavitation on the hydrofoil surface evolves from cavity cavitation to sheet cavitation and then to cloud cavitation, accompanied by the generation and collapse of bubbles.
This phenomenon essentially arises from the coupling of the Bernoulli effect (a basic principle in fluid mechanics, which describes the relationship between fluid flow rate and pressure: in a steady flow, where viscosity losses are ignored, the higher the flow rate of the fluid on the same streamline, the lower its static pressure; conversely, the lower the flow rate, the higher the static pressure) and the cavitation threshold: at a 30° deflection angle, the increased flap deflection angle causes a surge in flow velocity on the upper surface of the hydrofoil, lowering pressure below the saturated vapor pressure and triggering cavitation.
In the initial stage, the flow velocity gradient is small, forming leading-edge-attached cavity cavitation; subsequent flow velocity fluctuations cause the cavitation bubbles to collapse, transitioning to sheet and cloud cavitation. When bubbles collapse in the downstream high-pressure region, local shock waves are generated, exacerbating erosion of the hydrofoil surface. Additionally, comparative analysis of multiple image groups reveals that as the flap deflection angle increases, cavitation on the lower surface of the two-element hydrofoil gradually dissipates, while cavitation on the upper surface intensifies. The fundamental reason is that increasing the flap deflection angle reduces flow velocity on the lower surface (suppressing cavitation) while increasing flow velocity on the upper surface—when the upper surface pressure drops below the critical cavitation threshold, cavitation occurs.
Analysis of Figure 14 reveals that when the two-element hydrofoil moves with a flap deflection angle of 30°, significant vorticity is observed on the upper and lower surfaces of the hydrofoil at the onset of motion (T1–T5). As motion progresses, the vorticity dissipates downstream of the hydrofoil, forming a vortex structure. Additionally, comparative analysis of multiple image groups shows that as the flap deflection angle increases, vorticity intensifies—this trend holds both in the initial stage (T1 to T5) and after motion stabilization (Tmax). The underlying reason is that increasing the flap deflection angle enlarges the contact area with the water flow. Furthermore, a positive feedback mechanism exists between vorticity and cavitation: low pressure in the vortex core induces local cavitation, and the generation and collapse of cavitation bubbles alter the vortex’s viscous properties, further enhancing vorticity. At a 30° deflection angle, the velocity difference between the upper and lower surfaces of the hydrofoil peaks, inducing strong spanwise vorticity. The resulting low-pressure region triggers cavitation clouds, forming a vortex-induced cavitation phenomenon.
3.3.4. Analysis of Variable Spacing Cavitation Phenomenon
Analysis of Figure 15 reveals that increased spacing is associated with reduced cavitation, a trend observed both in the initial motion stage (T1 to T5) and after motion stabilization (Tmax). The underlying reason is that as spacing increases, the jet (a common flow form in fluid mechanics, which refers to the concentrated flow formed in the surrounding fluid after the fluid is ejected from a specific outlet at a high speed) formed in the gap during hydrofoil motion intensifies, thereby mitigating cavitation. This phenomenon can be attributed to the strong shearing effect of the jet: it disrupts the formation of cavitation bubbles and inhibits the development of the cavitation layer, resulting in a “jet-induced cavitation suppression effect.”
Analysis of Figure 16 reveals that, whether in the initial motion stage (T1 to T5) or after motion stabilization (Tmax), vorticity first increases and then decreases as spacing increases. Notably, there are distinct differences in vorticity characteristics among different hydrofoils: the two-element hydrofoil with g = 2.4%c1 exhibits less pronounced vorticity compared to the other two configurations. This phenomenon arises from two competing mechanisms. On one hand, increasing spacing enhances the jet formed in the gap during hydrofoil motion, which mitigates cavitation and reduces vorticity. On the other hand, changes in spacing alter the position where water flow acts on the wing surface, potentially increasing vorticity. The key reason is that at a spacing of 2.4%c1, the jet’s shear effect most strongly disrupts the main wing’s trailing vortex. This is because local high pressure generated by the collapse of cavitation bubbles inhibits the development of the vortex core. Conversely, when spacing exceeds 2.4%c1, the jet effect weakens, flow field separation between the main wing and flap intensifies, the trailing vortex area expands, and vorticity increases with further spacing. This forms a “jet–vortex competition effect.”
3.3.5. Analysis of Cavitation Phenomenon with Variable Chord Length Ratio
As shown in Figure 17, cavitation decreases as the chord ratio increases, a trend observed both in the initial motion stage (T1 to T5) and after motion stabilization (Tmax). The underlying reason is that as the chord ratio increases, the flap size decreases while the main wing chord length remains constant. Consequently, the area interacting with the water flow diminishes, leading to a reduced velocity gradient on the upper surface, increased pressure, and a higher cavitation number. It has been shown that an increase in the chord ratio reduces disturbance to the mainstream, lowers surface velocity, delays the deflection angle at which cavitation initiates, reduces the area of the cavitation region, and exhibits geometric cavitation suppression characteristics.
As shown in Figure 18, an increase in the chord ratio is associated with a decrease in vorticity, both in the initial motion stage (T1 to T5) and after motion stabilization (Tmax). The underlying principle behind this phenomenon is that, assuming the main wing’s chord length remains constant, an increase in the chord ratio reduces the flap size. This, in turn, decreases the area of interaction between the flap and the water flow, thins the boundary layer, lowers the velocity gradient, and weakens the intensity of vorticity generation sources. Furthermore, when the chord ratio is large, energy injection from the main wing wake to the flap is diminished, vortex structures remain underdeveloped, and a “regional vorticity attenuation effect” is formed.
4. Conclusions
This study numerically explores the hydrodynamic performance of NACA 4412 two-element hydrofoils, focusing on how flap deflection angle, chord ratio, and spacing influence lift, drag, and lift-to-drag ratio. As the flap deflection angle increases from 5° to 32.5°, lift coefficients for different configurations either rise, then fall, or increase gradually, with the highest lift occurring at approximately 25° for hydrofoils with a chord ratio of 1.5 and spacings of 1.2%c1 and 2.4%c1. Drag coefficients consistently increase with larger flap deflection angles, while lift-to-drag ratios peak at 15° or 20° depending on the setup—for instance, at 15° for chord ratio 1.5 with 3.6%c1 spacing, and 20° for chord ratio 2.7 with 1.2%c1 spacing. Additionally, lift coefficients peak at a chord ratio of 1.5, and both lift and drag first increase then decrease with larger spacing, highlighting the critical role of these variables in performance.
Beyond basic aerodynamic parameters, cavitation and vorticity are also strongly affected by these variables. Larger flap deflection angles (e.g., 30–32.5°) intensify cavitation and vorticity attributed to steeper velocity gradients on the upper surface. Spacing plays a balancing role: wider gaps weaken cavitation via jet shear effects but can increase vorticity when exceeding 2.4%c1, with the minimum vorticity occurring precisely at 2.4%c1. Meanwhile, higher chord ratios (≥1.5) reduce both cavitation and vorticity by shrinking the flap’s water interaction area and lowering velocity gradients, further linking structural parameters to flow field stability.
Building on these findings, practical design recommendations for fully submerged unmanned hydrofoils emerge. For maximum lift and lift-to-drag ratio, the optimal parameters are a chord ratio of 1.5, spacing of 2.4%c1, and flap deflection angle of 25°. To suppress cavitation, prioritize a chord ratio ≥1.5, spacing of 2.4%c1, and deflection angle ≤20°; for minimal vorticity, 2.4%c1 spacing and a chord ratio ≥1.5 are key. These thresholds provide clear, actionable guidance for balancing performance, efficiency, and flow stability.
These insights directly address the core challenge of stabilizing unmanned hydrofoils, enabling enhanced lift stability in complex flows, reduced cavitation-induced vibration, and improved energy efficiency at the 25° optimal operating point. Future research should extend these lab-scale findings to full-scale vessels, investigating how hydrofoil configurations influence overall vessel dynamics to bridge theoretical results with real-world engineering applications.
Supplementary Materials
The following supporting information can be downloaded at: https://www.mdpi.com/article/10.3390/jmse13071378/s1.
Author Contributions
M.Y.: Conceptualization, Investigation, Methodology, Software, Validation, Data curation, Writing—original draft, Writing—review & editing, Visualization. H.L.: Investigation, Resources, Supervision, Project administration, Funding acquisition. Y.Z.: editing, Methodology. Q.T.: editing, Methodology. S.Y.: Conceptualization. Z.W.: Conceptualization. W.M.: Investigation, Methodology, Software, Supervision, Writing—review & editing. All authors have read and agreed to the published version of the manuscript.
Funding
This research was funded by the project ZR2024MD066, supported by the Shandong Provincial Natural Science Foundation.
Data Availability Statement
The original contributions presented in this study are included in the article. Further inquiries can be directed to the corresponding author.
Acknowledgments
We thank the members of the marine robot group of Shandong University of Science and Technology for their contribution to the research on this vessel.
Conflicts of Interest
The authors declare no conflicts of interest.
References
- Chen, L.; Hongming, W.; Peiting, S. Numerical Investigation of a Two-Element Wingsail for Ship Auxiliary Propulsion. Mar. Sci. Eng. 2020, 8, 333. [Google Scholar]
- Lawrence, J. Hydrodynamics of transom-stern flaps for planing boats. Ocean Eng. 2020, 216, 10785. [Google Scholar] [CrossRef]
- Guang, S.; Yong, W. Hydrodynamic and energy extraction properties of oscillating hydrofoils with a trailing edge flap. Appl. Ocean Res. 2021, 110, 102530. [Google Scholar] [CrossRef]
- Zhe, S.; Heng, L. Study on hydrodynamic performance of cycloidal propeller with flap at the trailing edge. Ocean Eng. 2021, 237, 109657. [Google Scholar] [CrossRef]
- Yuchen, S.; Juan, J. Numerical Simulation and Hydrodynamic Performance Predicting of 2 Two-Dimensional Hydrofoils in Tandem Configuration. Mar. Sci. Eng. 2021, 9, 462. [Google Scholar]
- Jialun, L.; Robert, H. Hydrodynamic characteristics of multiple-rudder configurations. Ships Offshore Struct. 2017, 12, 818–836. [Google Scholar]
- Song, K.; Guo, C. Numerical analysis of the effects of stern flaps on ship resistance and propulsion performance. Ocean Eng. 2019, 193, 106621. [Google Scholar] [CrossRef]
- Suastika, K.; Apriansyah. Effects of stern-foil submerged elevation on the lift and drag of a hydrofoil craft. IOP Conf. Ser. Earth Environ. 2018, 135, 012003. [Google Scholar] [CrossRef]
- Oller, S.A.; Nallim, L. Usability of the Selig S1223 Profile Airfoil as a High Lift Hydrofoil for Hydrokinetic Application. J. Appl. Fluid Mech. 2016, 9, 537–542. [Google Scholar] [CrossRef]
- Yingqian, L.; Anil, Y. RANS-based optimization of a T-shaped hydrofoil considering junction design. Ocean Eng. 2022, 262, 112051. [Google Scholar]
- Liang, L.; Yuan, J. Simulation of wave piercing Catamaran based on T-shaped hydrofoil model optimization. J. Univ. Sci. Technol. China 2018, 46, 7–12. [Google Scholar]
- Amin, N.; Taghi, A. Experimental optimization of hydrodynamic performance of catamarans using hydrofoil element. Proc. Inst. Mech. Eng. Part M J. Eng. Marit. Environ. 2018, 233, 2. [Google Scholar]
- Ji, B.; Cheng, H. Research progress and prospects of unsteady characteristics of cavitation hydrodynamics. Adv. Mech. 2019, 49, 428–479. [Google Scholar]
- Stutz, B.; Reboud, J.L. Experiments on unsteady cavitation. Exp. Fluids 1997, 22, 191–198. [Google Scholar] [CrossRef]
- Stutz, B.; Reboud, J.L. Measurements within unsteady cavitation. Exp. Fluids 2000, 29, 545–552. [Google Scholar] [CrossRef]
- Kawanami, Y.; Kato, H. Mechanism and Control of Cloud Cavitation. J. Fluids Eng. 1997, 119, 788–794. [Google Scholar] [CrossRef]
- Dandan, Y.; An, Y. Numerical analyses of ventilated cavitation over a 2-D NACA0015 hydrofoil using two turbulence modeling methods. J. Hydrodyn. 2018, 30, 345–356. [Google Scholar] [CrossRef]
- Ji, B.; Luo, X. Numerical simulation of three dimensional cavitation shedding dynamics with special emphasis on cavitation–vortex interaction. Ocean Eng. 2014, 87, 64–77. [Google Scholar] [CrossRef]
- Ji, B.; Luo, X. Three-dimensional large eddy simulation and vorticity analysis of unsteady cavitating flow around a twisted hydrofoil. J. Hydrodyn. 2013, 25, 510–519. [Google Scholar] [CrossRef]
- Amin, N.; Hashem, N. Performance prediction of hydrofoil- supported catamarans using experiment and ANNs. Appl. Ocean Res. 2018, 75, 66–84. [Google Scholar] [CrossRef]
- Romani, S.; Morgut, M. Uncertainty quantification and global sensitivity analysis of turbulence model closure coefficients for sheet cavity flow around a hydrofoil. Brodogradnja 2025, 76, 76105. [Google Scholar] [CrossRef]
- Biswas, S.; Harish, R. Effect of unsteady cavitation on hydrodynamic performance of NACA 4412 Hydrofoil with novel triangular slot. Heliyon 2025, 11, e42266. [Google Scholar] [CrossRef]
- Wei, Y.; Zhang, J. Numerical study of the influence of hydrofoil hydrodynamic performance considering near-free surface. Brodogradnja 2025, 76, 76108. [Google Scholar] [CrossRef]
- Perić, M. Prediction of cavitation on ships. Brodogradnja 2022, 73, 39–58. [Google Scholar] [CrossRef]
- Subash, D.; Kaushal, R. Computational Analysis of the Aerodynamic Performance of NACA 4412 and NACA 23012 Airfoils. J. Eng. Technol. 2023, 10, 13140. [Google Scholar]
Disclaimer/Publisher’s Note: The statements, opinions and data contained in all publications are solely those of the individual author(s) and contributor(s) and not of MDPI and/or the editor(s). MDPI and/or the editor(s) disclaim responsibility for any injury to people or property resulting from any ideas, methods, instructions or products referred to in the content. |
© 2025 by the authors. Licensee MDPI, Basel, Switzerland. This article is an open access article distributed under the terms and conditions of the Creative Commons Attribution (CC BY) license (https://creativecommons.org/licenses/by/4.0/).