1. Introduction
Bolted flange joints are widely used in structural and mechanical systems, playing a crucial role in ensuring stability, load transfer, and overall system reliability. These joints are particularly essential in applications where large forces, vibrations, and dynamic loads are present, such as in offshore wind turbines, pressure vessels, heavy machinery, and structural frameworks. The integrity of these bolted joints is significantly influenced by multiple factors, including bolt preload, material properties, joint geometry, and external loading conditions. Among these, the bolt grade is a fundamental parameter that determines the mechanical performance, strength, and failure resistance of the joint.
L-type flange joints are commonly used in offshore wind turbine support structures and other large-scale applications where high-strength connections are required [
1,
2]. The primary function of these joints is to ensure effective load transmission between connected components while maintaining structural integrity [
3,
4] under varying environmental and operational conditions. The selection of an appropriate bolt grade is critical in achieving an optimal balance between strength, flexibility, and fatigue resistance. Higher-grade bolts typically exhibit greater tensile and shear strengths, but their interaction with the flange material and overall joint behavior must be thoroughly evaluated to ensure reliability.
In engineering design, predicting the structural behavior of bolted joints under real-world loading conditions can be challenging due to the complex interactions between different components. Traditional analytical methods provide an initial estimation of joint performance but often fail to capture nonlinear [
5,
6] effects such as contact stress distribution, localized deformations, and plasticity effects. To address these challenges, finite element analysis (FEA) has become a widely accepted approach for evaluating bolted flange joints. FEA enables engineers to analyze stress distribution, deformation behavior, and failure mechanisms of bolted joints with high accuracy [
7,
8]. By incorporating detailed material models and contact interactions, FEA allows for a comprehensive assessment of how different bolt grades influence joint performance under static and dynamic loading conditions.
This study aims to investigate the effect of different bolt grades on the structural integrity of L-type flange joints using finite element simulations [
9,
10]. Various bolt material grades will be analyzed to determine their impact on stress distribution, joint stiffness, and failure modes. Additionally, the study will explore how bolt preload [
11,
12], contact interactions, and external loads [
13,
14] contribute to overall joint behavior. The results obtained from this research will provide valuable insights into optimal bolt selection, helping engineers improve the reliability and efficiency of bolted flange connections in offshore wind turbine structures and other high-load applications [
15,
16].
By understanding the role of bolt grade in joint performance, this study will contribute to the development of more robust design guidelines, ensuring safer and more durable structural connections. The findings will be particularly useful for engineers working in renewable energy, offshore engineering, and structural mechanics, where bolted joints must withstand harsh environmental conditions and high mechanical stresses [
17,
18].
1.1. Scope of the Study
The scope of this study focuses on the understanding and enhancement of L-type flange joints’ performance through detailed structural analysis. This research focuses on the study of the influence of material and operational parameters, primarily bolt grades and bolt pretension, on flange joint behavior.
Using finite element analysis, the study evaluates the performance parameters such as stress concentration, deformation patterns, and force–displacement relationships. The study analyzes how these parameters affect the strength, reliability, and safety margins of the joint and, ultimately, derive actionable insights for optimizing flange joint designs in industrial applications.
The findings of this research are expected to guide the selection of materials and configurations that will lead to the development of flange joints that are more efficient but resilient to operational challenges.
1.2. Motivation and Objectives
The major driving force behind the need for this research is an increasing demand for high-performance mechanical joints, in general, as applied in critical systems. Several industries relying on flange connections face material fatigue, non-uniform loading, and potential joint failure due to these challenges. Challenges occur because such systematic evaluations are necessary to ensure reliable and safe operation under varying loads.
Progress in simulation technologies like finite element analysis also generates another motivation: to simulate the complex behaviors of joints without spending excessively on costly experimental setups. It is possible to use these tools to explore different configurations and scenarios efficiently, with results that are more than one and optimized.
This paper presents several novel contributions:
First, it focuses specifically on static tensile loading conditions, unlike most existing studies that prioritize fatigue or dynamic behavior.
Second, it provides a comparative finite element analysis (FEA) of Grade 10.9 and Grade 12.9 bolts within an industrial-scale L-type flange joint, quantifying differences in stress, strain, and deformation under identical loading scenarios.
Third, it validates FEA results against standard analytical models (e.g., Petersen, Schmidt, and Neuper), providing a rare insight into the limits of classical approaches for high-strength bolt behavior under static axial loading.
Finally, the study proposes optimized bolt pretension and material recommendations based on joint stiffness, ductility, and safety margins, offering actionable guidance for designers of offshore wind turbine support structures.
These innovations support the development of more reliable, cost-effective, and structurally sound flange joint assemblies in high-load, safety-critical applications.
3. Methodology and Variables
3.1. Simulation Approach and Tools
Finite element method (FEM) was applied to structural analysis of L-type flange joints with different bolt grades and levels of pretension. The simulation was performed under the ANSYS platform, which is a strong structural analysis tool. The simulation considered bolts, flanges, and pretension forces, with geometrical and material properties accurately defined to simulate actual conditions.
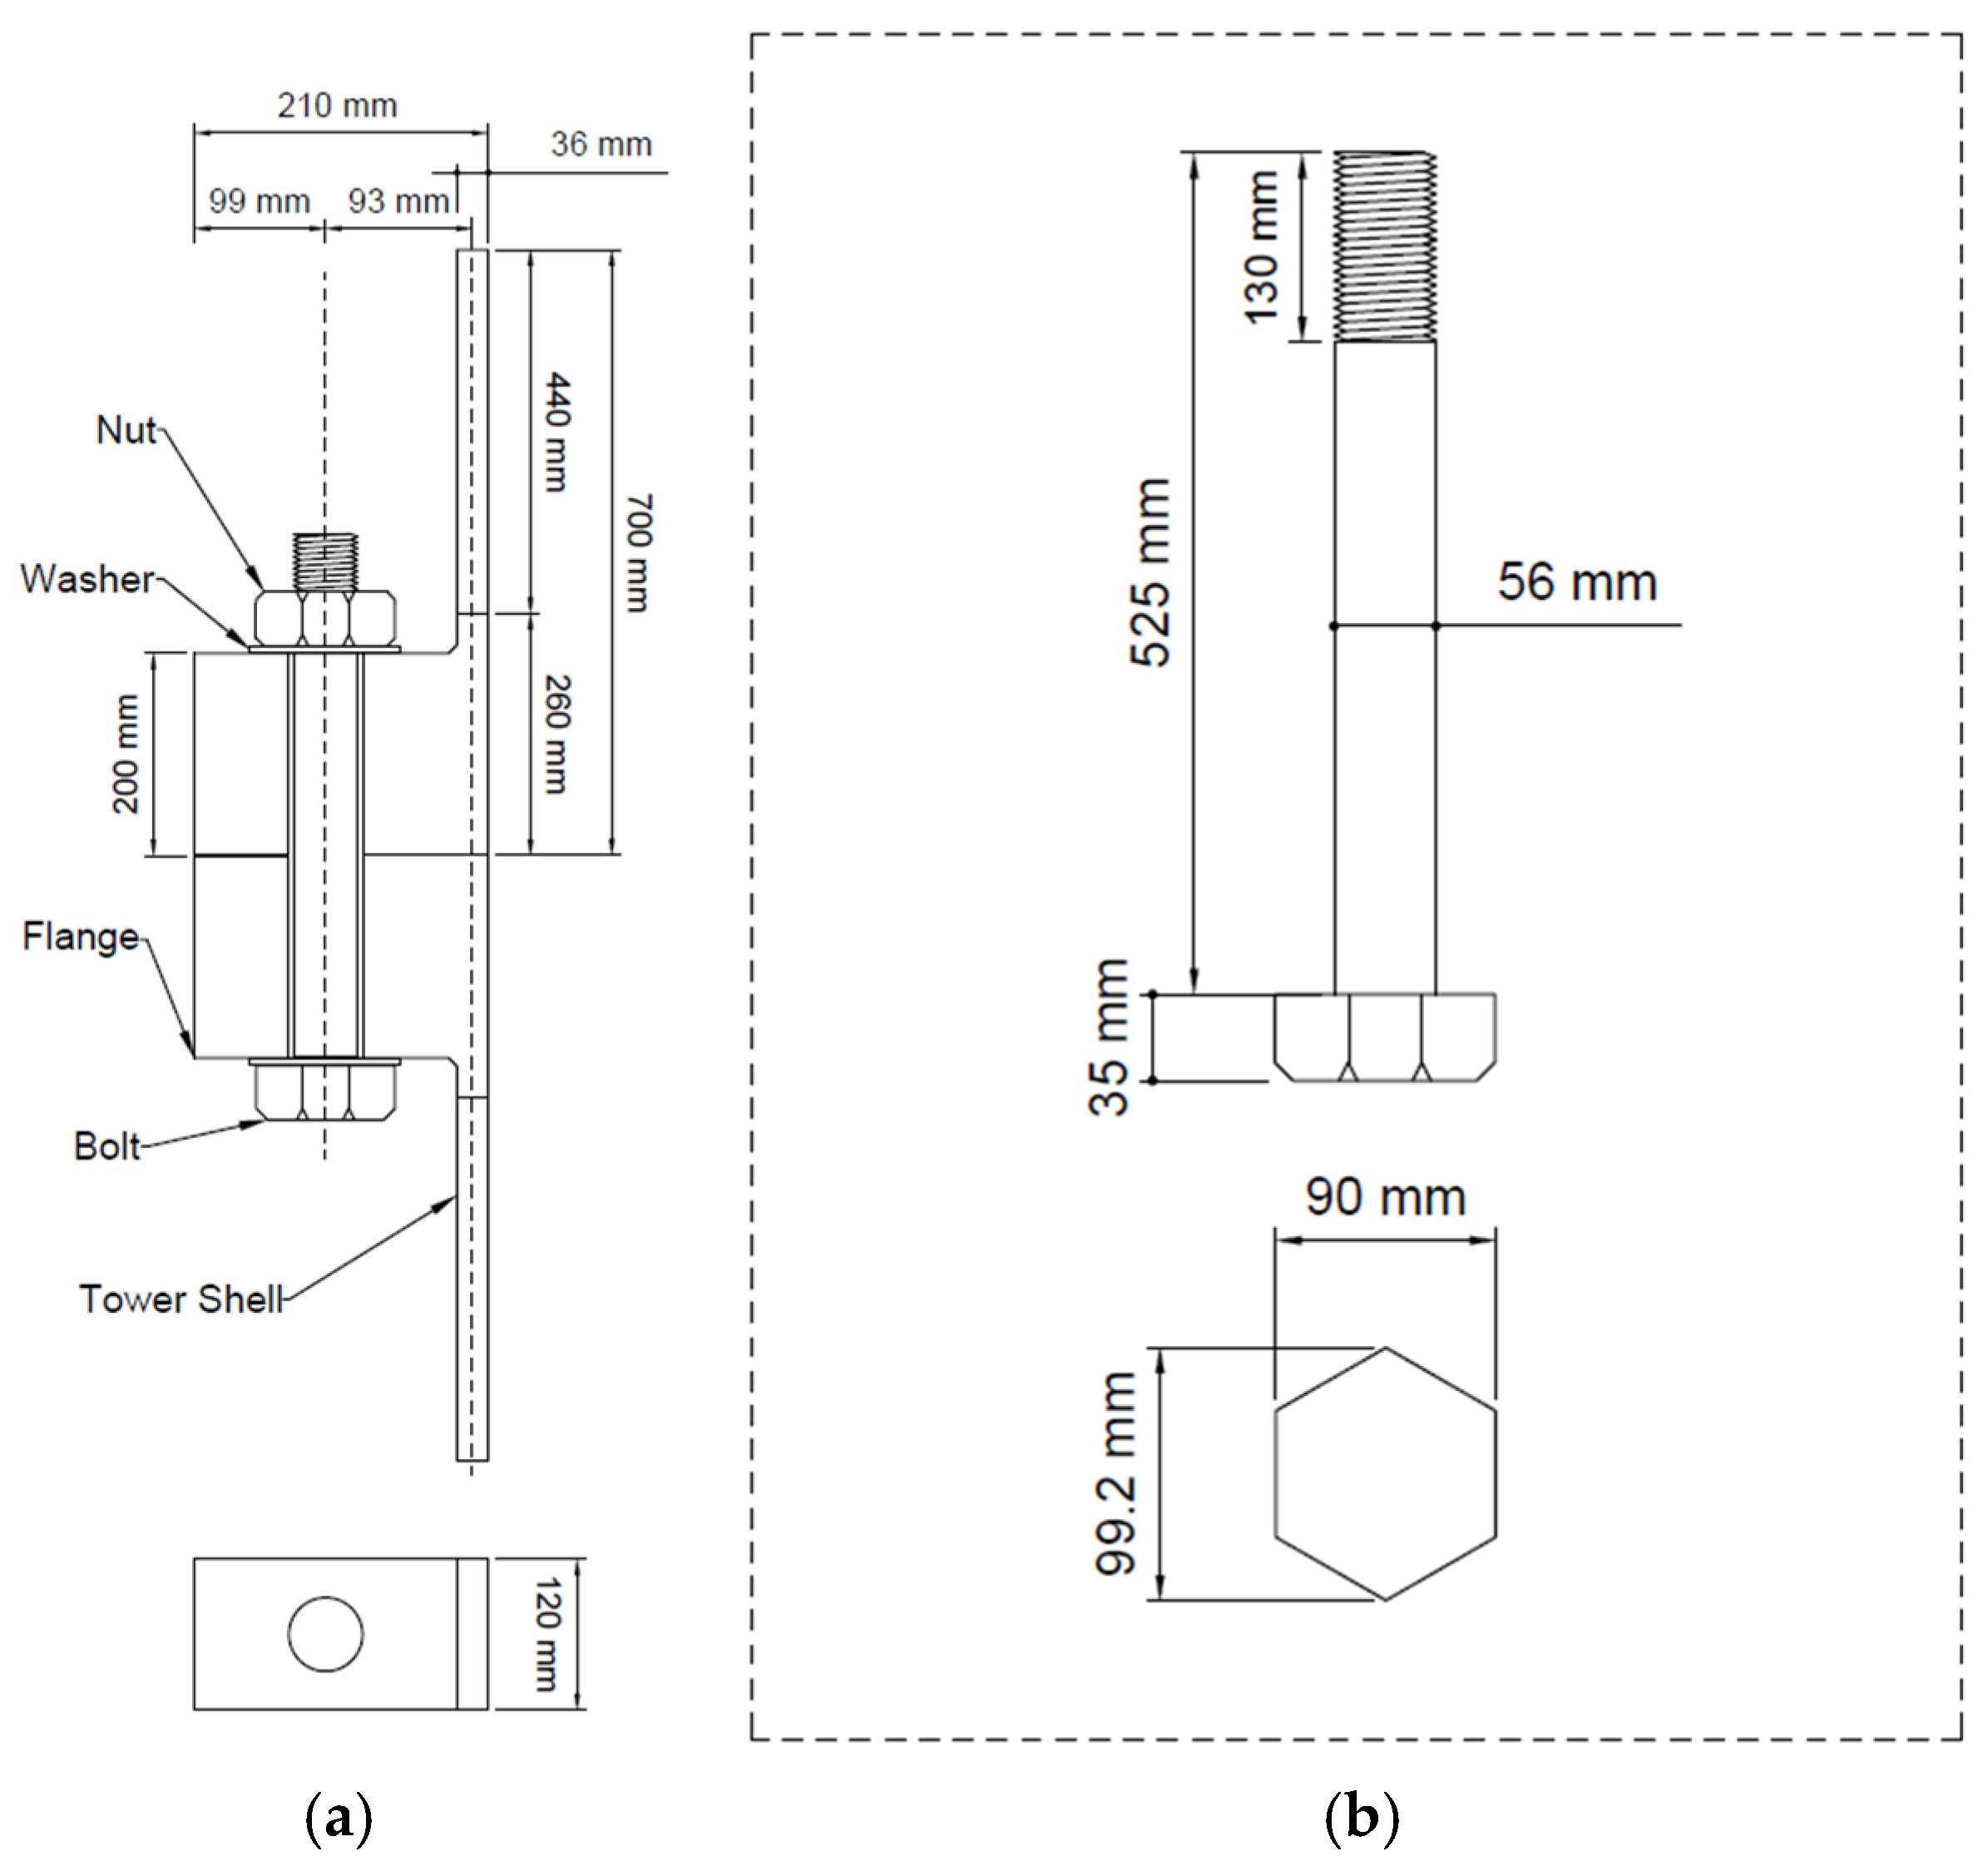
3.2. Three-Dimensional Model
The modeling began with the development of a detailed 3D CAD representation of the L-type flange joint, incorporating standard dimensions for both bolts and flange components as per industry specifications. Threaded fasteners were used to model the bolts, capturing their realistic engagement and interaction with the flange surfaces. Particular attention was given to accurately defining the contact interfaces between the nut, bolt head, and flange surfaces to ensure accurate simulation of load transmission paths and stress concentrations. The flanges were assumed to be rigidly fixed at one end to replicate anchoring conditions, while mechanical loads, including axial force and bending moment, were applied to the free end to emulate operational scenarios such as those encountered in offshore wind turbine support structures. Material properties for each component were assigned based on commonly used structural steel grades, and appropriate boundary conditions and contact definitions were introduced to reflect the nonlinear contact behavior and potential separation or sliding. This comprehensive modeling approach aimed to capture the mechanical response of the joint under realistic service conditions, enabling accurate stress, strain, and deformation analysis in subsequent finite element simulations, as shown in
Figure 1.
A high-strength M56 bolt was used in the model, in line with IEC 61400-6 [
30] recommendations for offshore wind turbine flange joints. The threaded length was set to 130 mm, with a pitch of 5.5 mm and a standard 60° thread angle, following the coarse metric thread geometry defined for M56 fasteners.
3.3. Mesh Generation
A regular mesh was used on the model to improve computational efficiency while preserving accuracy in sensitive areas. Hex elements are employed wherever possible to optimize numerical stability and solution accuracy. Fine mesh refinement was used in the following areas:
Bolt threads: To capture localized stress variations and deformation effects.
Flange contact surfaces: To resolve stress concentration zones accurately.
Bolt–nut interface: To enhance the accuracy of contact interactions.
To find a balance between accuracy and computational cost, a mesh convergence study was performed. The ultimate mesh density was chosen as a compromise between solution accuracy and computational efficiency, as shown in
Figure 2.
A mesh sensitivity analysis was also conducted, and the results are illustrated in graph. This analysis indicated that with a 10 mm mesh size, the model is well converged. Therefore, to achieve an optimal balance between accuracy and computational efficiency, a mesh size of 10 mm was chosen Also secondary elements are being used in it.
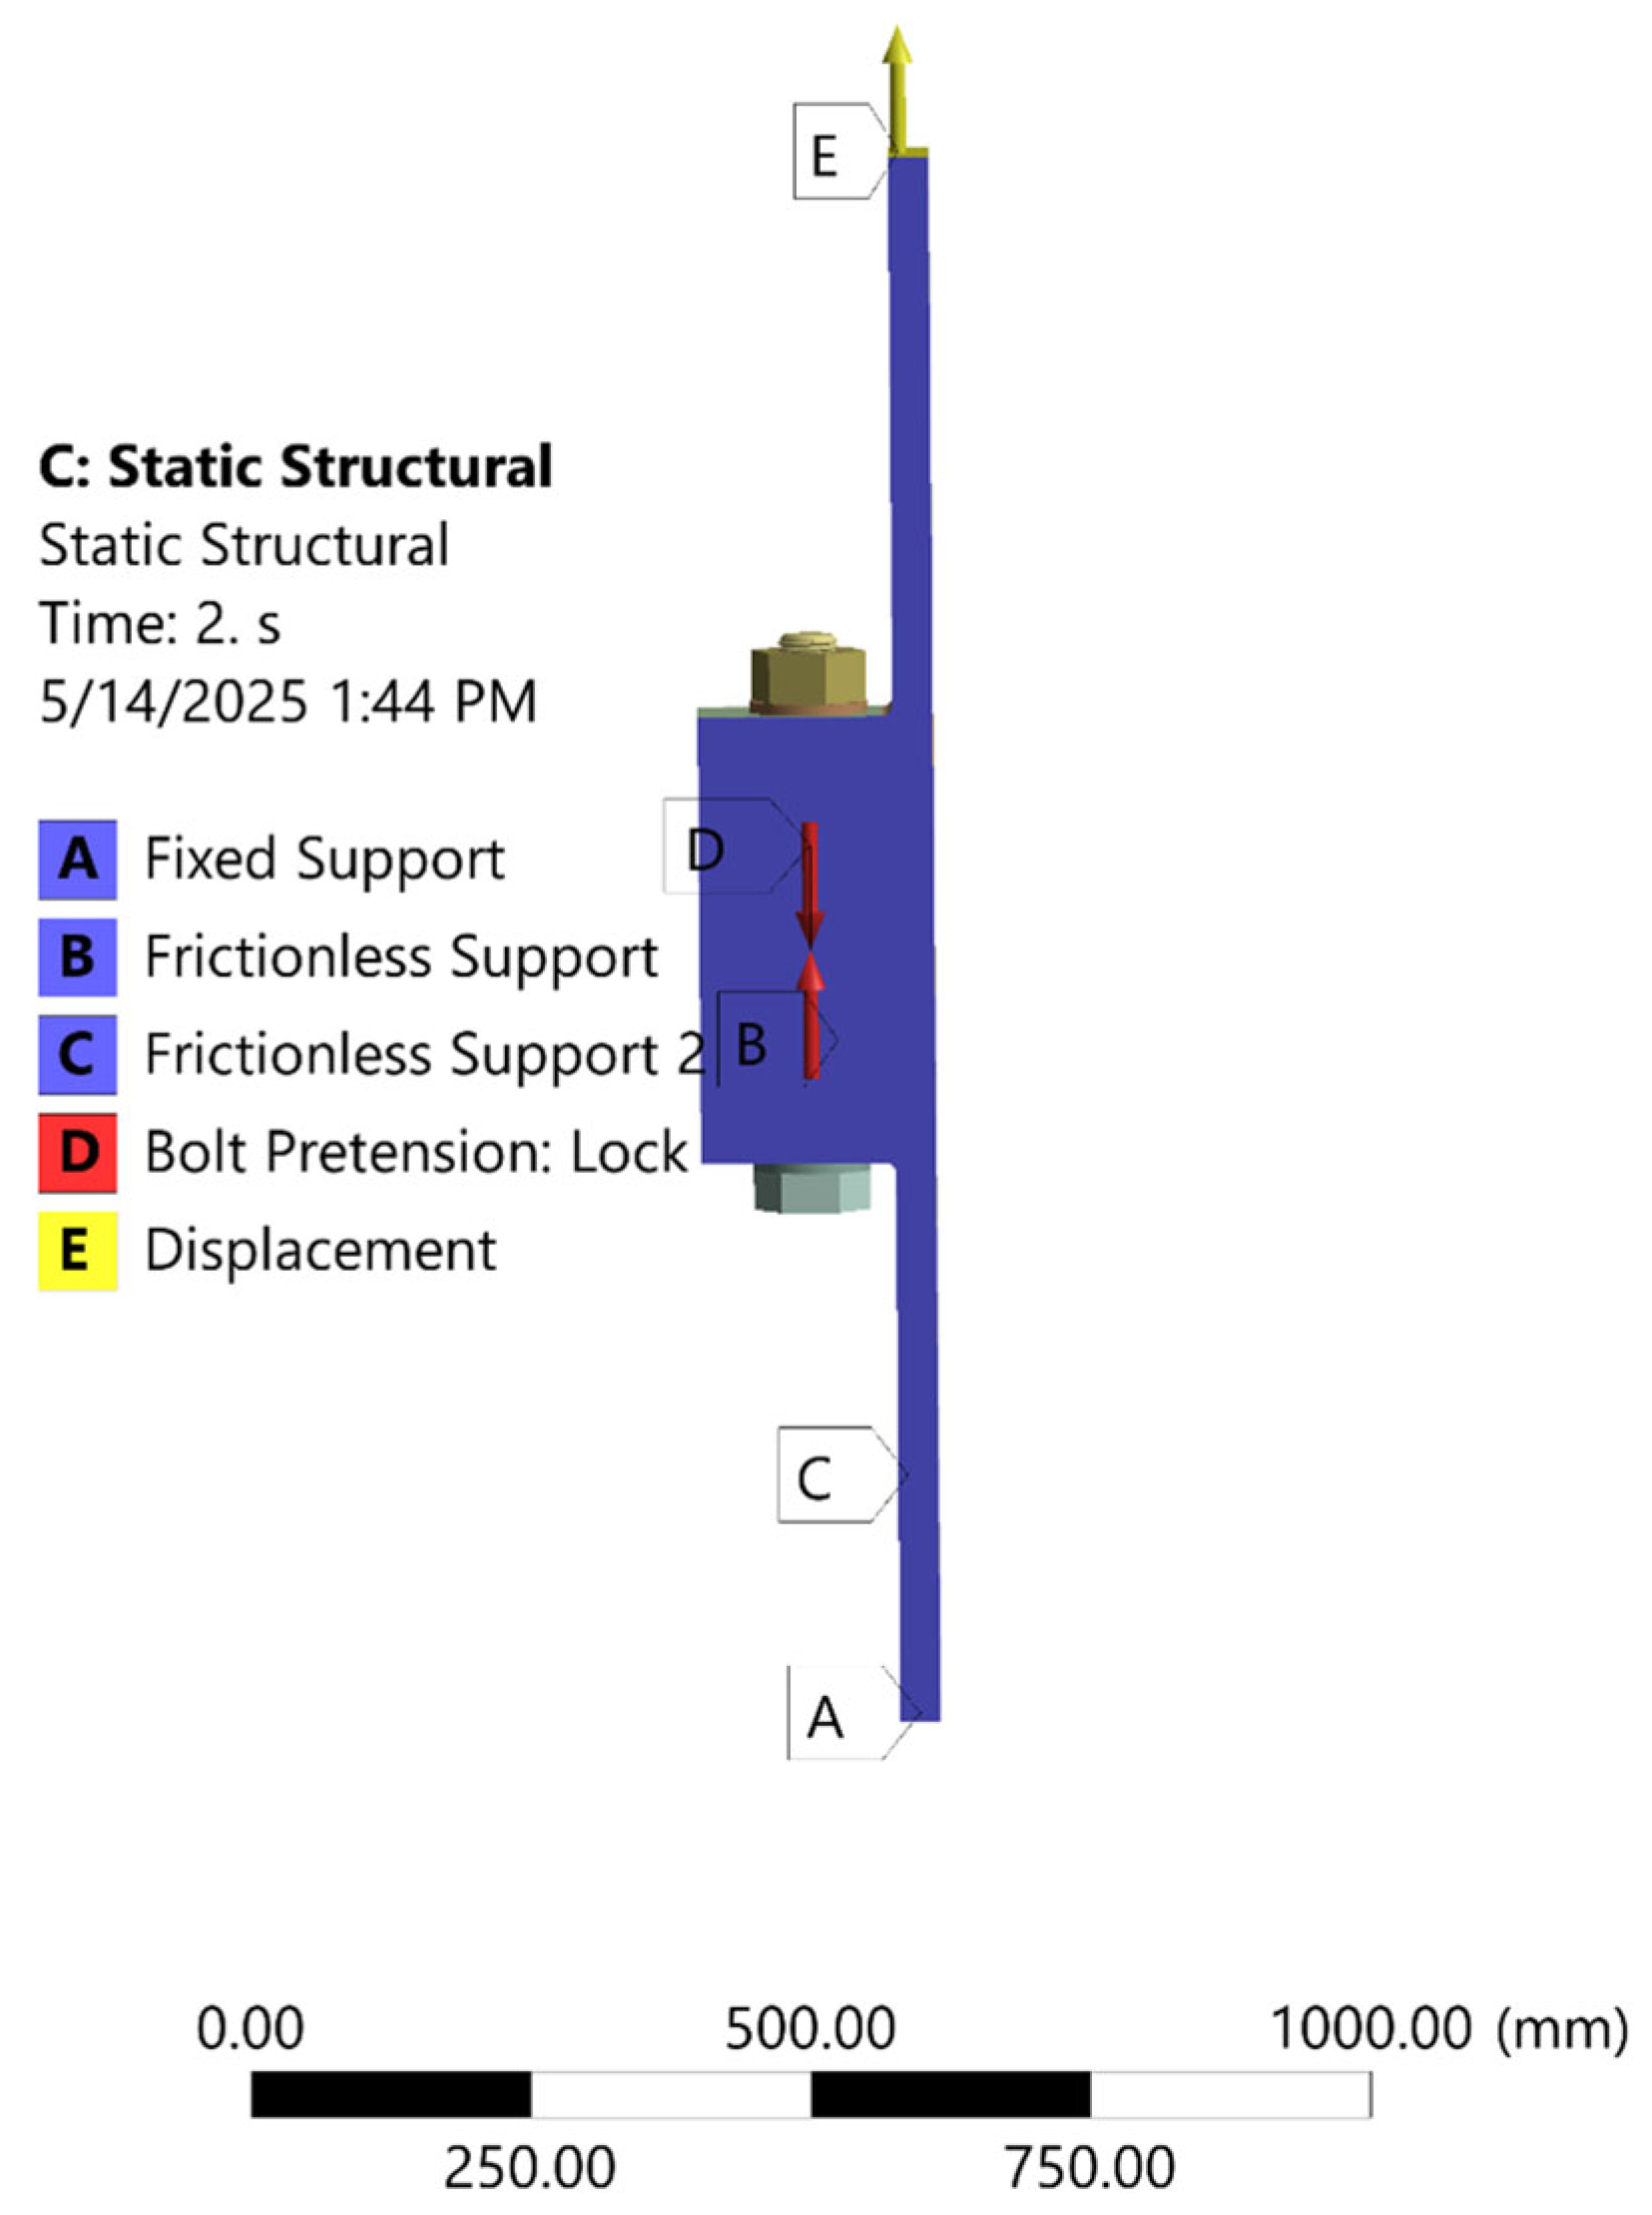
3.4. Boundary Conditions
To simulate realistic loading conditions, the following boundary conditions were applied:
Fixed Support: One flange end was fully constrained to represent its attachment to a rigid structure.
Pretension Force: The initial displacement method was employed to simulate bolt tightening, applying bolt pretension.
External Load: A tensile load was incrementally applied at the opposite flange end to evaluate the load transfer efficiency and deformation characteristics of the joint.
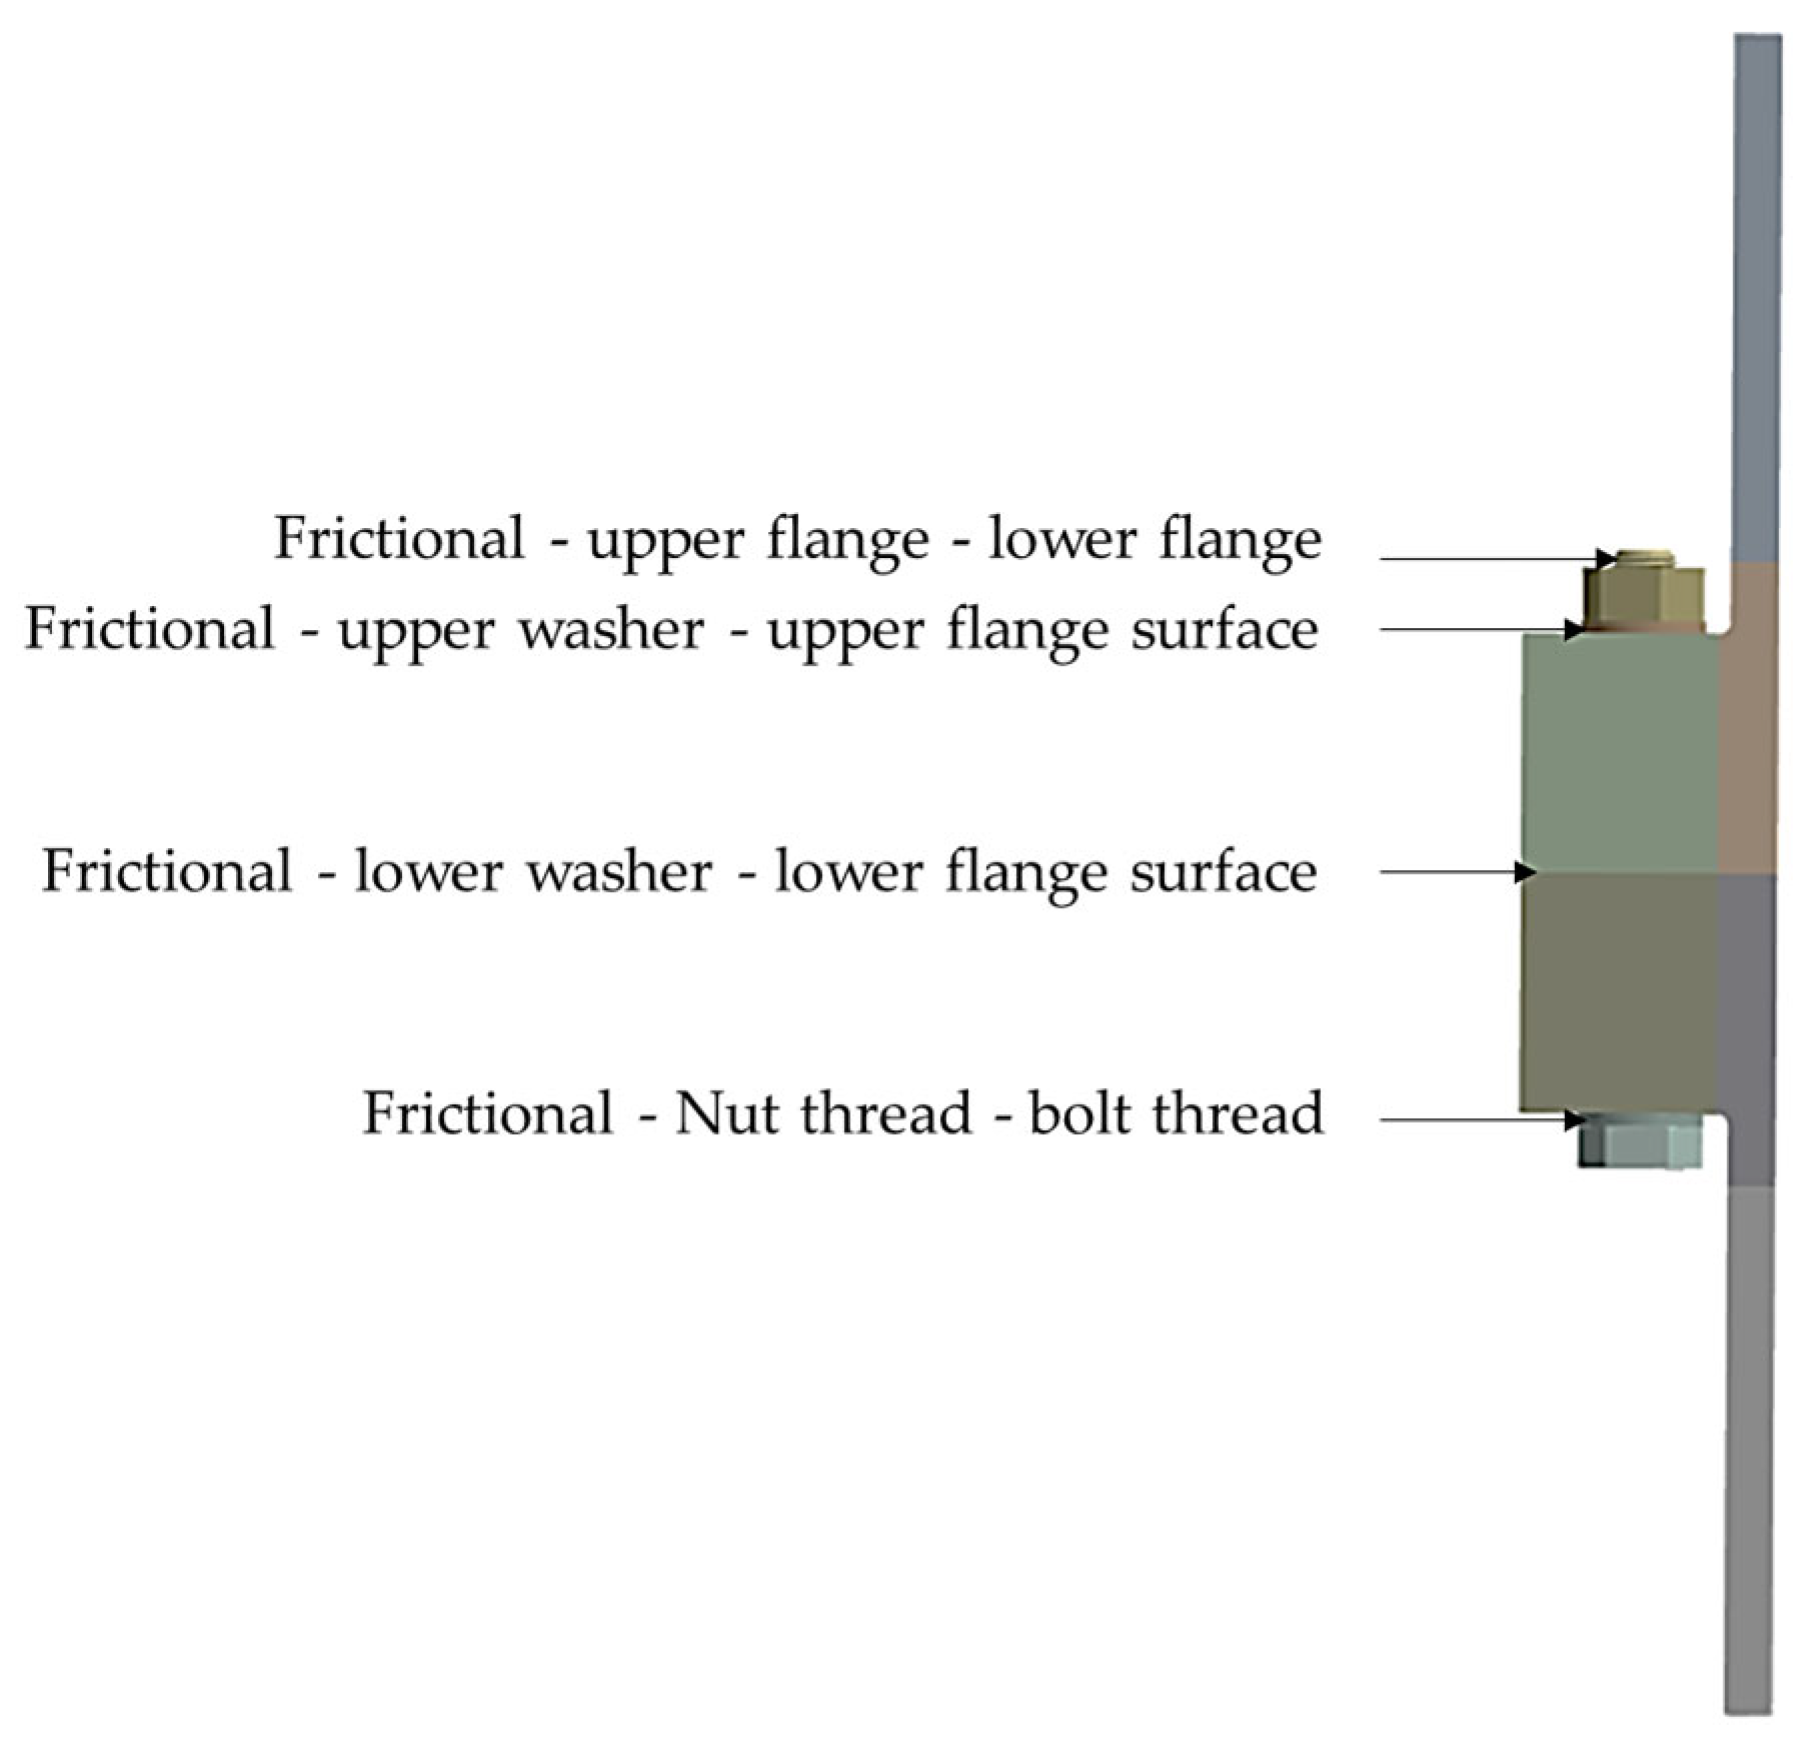
Frictional Connections: Frictional connections are employed between the flanges, bolt thread and washer, and flange surface and nut as shown in
Figure 3.
A friction coefficient of μ = 0.2 was applied at all contact interfaces (bolt threads, nut-bearing surface, washer–flange, and flange–flange) to represent typical dry steel-on-steel contact conditions. This value aligns with Eurocode 3 recommendations and prior simulation-based studies [
29].
3.5. Specimen Design
The flange joint was modeled in the context of a 5 MW capacity turbine system to mimic large-scale industrial conditions. The flange size, bolt position, and material of the flange and bolts met industry requirements for the turbine assembly. The flanges were of high-strength alloy steel, with a yield strength of 355 MPa, and the bolts were of grades 10.9 and 12.9, as in Table 2. According to the provisions of Eurocode [
29], the pre-tension force for high-strength bolts is determined based on the bolt’s thread geometry and material properties [
40]. The pre-load force is typically estimated to be around 64% of the bolt’s ultimate tensile resistance. The pre-tension force can be calculated using the following equation:
Fi is the required pre-tension force;
fy,b is the yield strength of the bolt material (1080 N/mm2 for Grade 10.9 and 1341 N/mm2 for Grade 12.9);
As is the stress area of the bolt (taken as 1970.4 mm2);
γ
m7 is the partial safety factor, typically 1.10 as recommended by Eurocode [
29].
Based on this formulation, the calculated pre-tension force for a Grade 10.9 bolt is 1249 kN, and for a Grade 12.9 bolt, it is 1500 kN. The test configurations and material properties are described in the following
Table 1,
Table 2,
Table 3,
Table 4 and
Table 5.
Table 1.
Simulation test configurations.
Table 1.
Simulation test configurations.
| Test ID | Bolt Grade | Bolt Pretension (kN) | Displacement Control (mm) | Description |
|---|
| 1 | 10.9 | 620 | - | Initial pretension for 10.9 |
| 2 | 10.9 | 1240 | 16.5 | Final pretension for 10.9 |
| 3 | 12.9 | 780 | - | Initial pretension for 12.9 |
| 4 | 12.9 | 1500 | 16.5 | Final pretension for 12.9 |
Table 2.
Mechanical properties of grade 10.9 bolt.
Table 2.
Mechanical properties of grade 10.9 bolt.
| Property | Value |
|---|
| Tensile Strength (N/mm2) | 1192 |
| Yield Strength (0.2% offset) (N/mm2) | 1080 |
| Elongation (%) | 14 |
| Reduction in Area (%) | 54 |
Table 3.
Mechanical properties of grade 12.9 bolt.
Table 3.
Mechanical properties of grade 12.9 bolt.
| Property | Value |
|---|
| Tensile Strength (N/mm2) | 1422 |
| Yield Strength (0.2% offset) (N/mm2) | 1341 |
| Elongation (%) | 11 |
| Reduction in Area (%) | 49 |
Table 4.
Mechanical properties of flange and tower shell.
Table 4.
Mechanical properties of flange and tower shell.
| Property | Flange | Tower Shell |
|---|
| Tensile Strength (N/mm2) | 545 | 548 |
| Yield Strength (0.2% offset) (N/mm2) | 384 | 394 |
| Elongation (%) | 30.3 | 32 |
| Reduction in Area (%) | 70 | 70.7 |
Table 5.
Maximum stresses and strains observed.
Table 5.
Maximum stresses and strains observed.
| Bolt Grade | Bolt Pretension (%) | Maximum Strain (µε) |
|---|
| 10.9 | 50 | 1430 |
| 10.9 | 100 | 3192 |
| 12.9 | 50 | 2369 |
| 12.9 | 100 | 4763 |
4. Results and Discussions
4.1. Structural Performance Analysis
4.1.1. Stress and Deformation Analysis Under Varying Bolt Grades
The structural performance of the L-type flange joint was analyzed based on the stress distribution and deformation patterns under different bolt grades and bolt pretension (
Figure 4). Stress concentration was found mainly at the contact interfaces between the bolts and flanges. The FEA indicated that Grade 10.9 bolts had lower stress concentrations than Grade 12.9 bolts at the same bolt pretension. However, the increased yield strength of Grade 12.9 bolts allowed them to sustain higher loads before failure.
4.1.2. Impact of Bolt Pretension on Bolt
Joint stiffness and strength curves for various configurations are obtained from the force–displacement curves. In the results, higher bolt pretensions were observed to increase the rigidity of the joint while reducing micro-movements at the bolt–flange interface, but this could increase the potential for localized stress concentrations, particularly for Grade 12.9 bolts (
Figure 5).
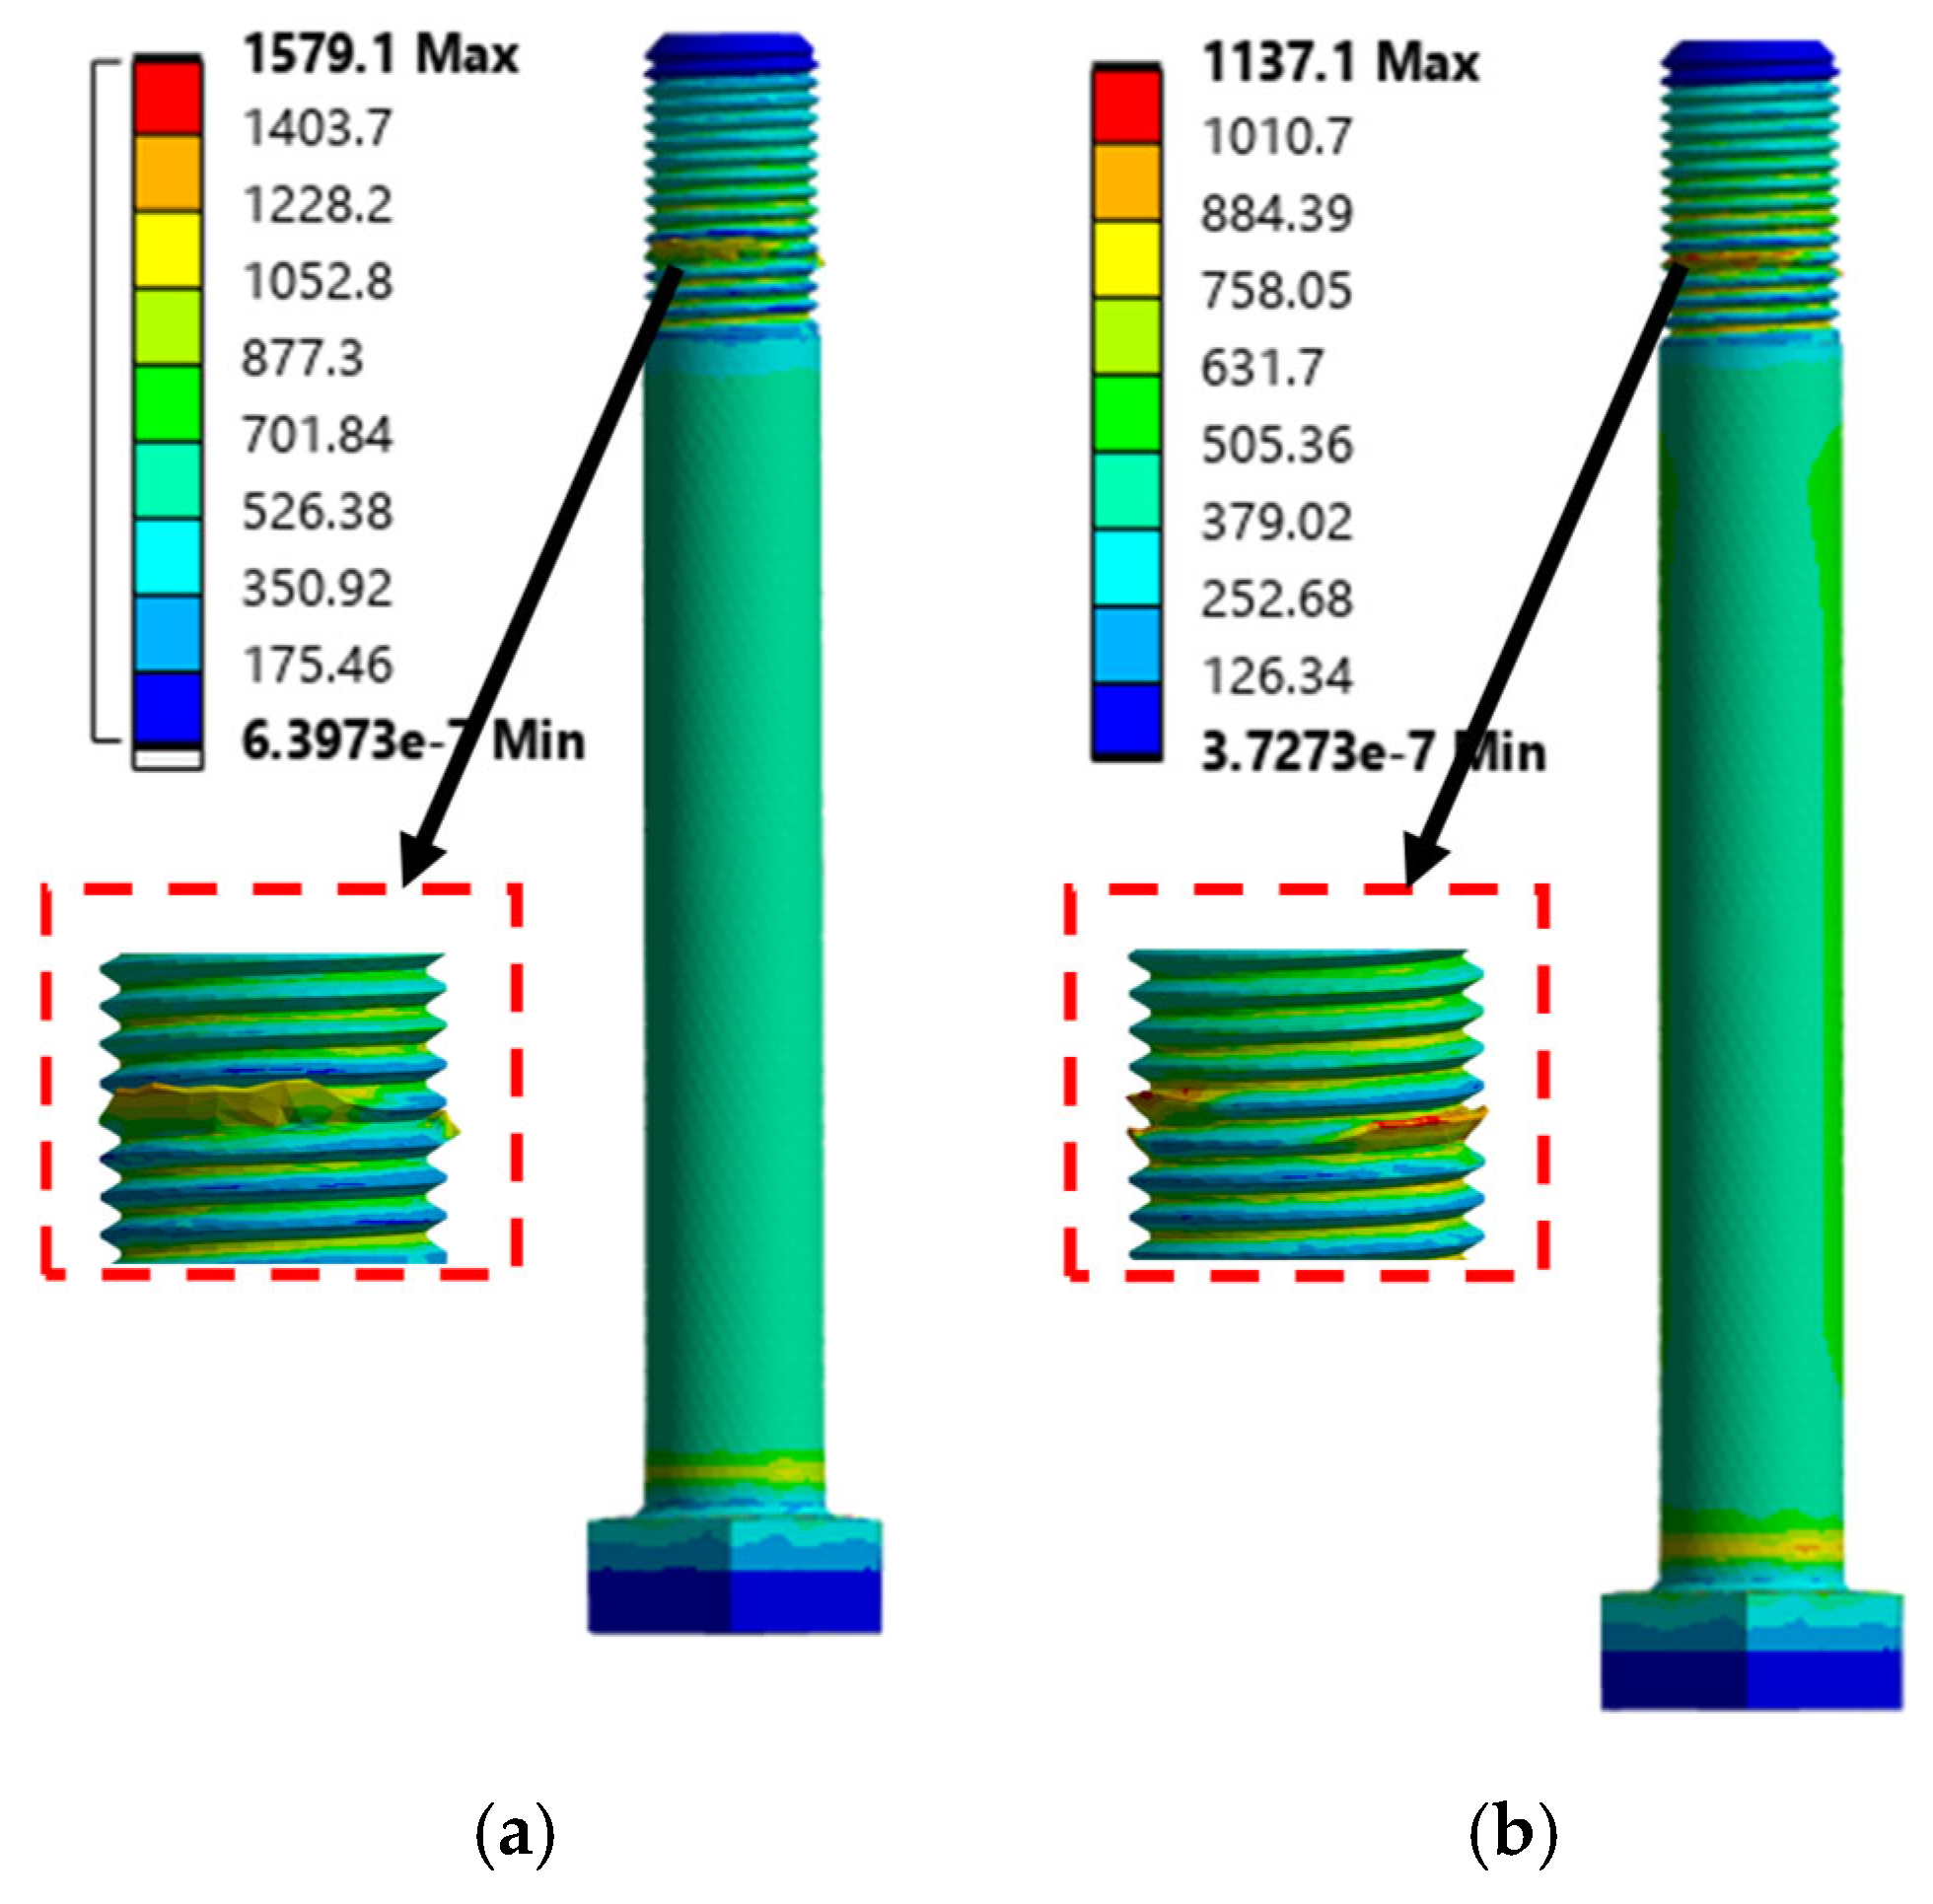
For Grade 10.9 bolts, the maximum force that was held at 50% pretension was 830 kN, whereas at 100% pretension, the maximum force was increased to 1137.1 kN. Grade 12.9 bolts showed better performance, where the maximum forces were 1250.1 kN and 1579.1 kN at 50% and 100% pretension, respectively.
Figure 4 shows the stress distribution, and it is good for estimating the early behavior of the specimen.
Figure 4.
Figures represent the boundary conditions.
Figure 4.
Figures represent the boundary conditions.
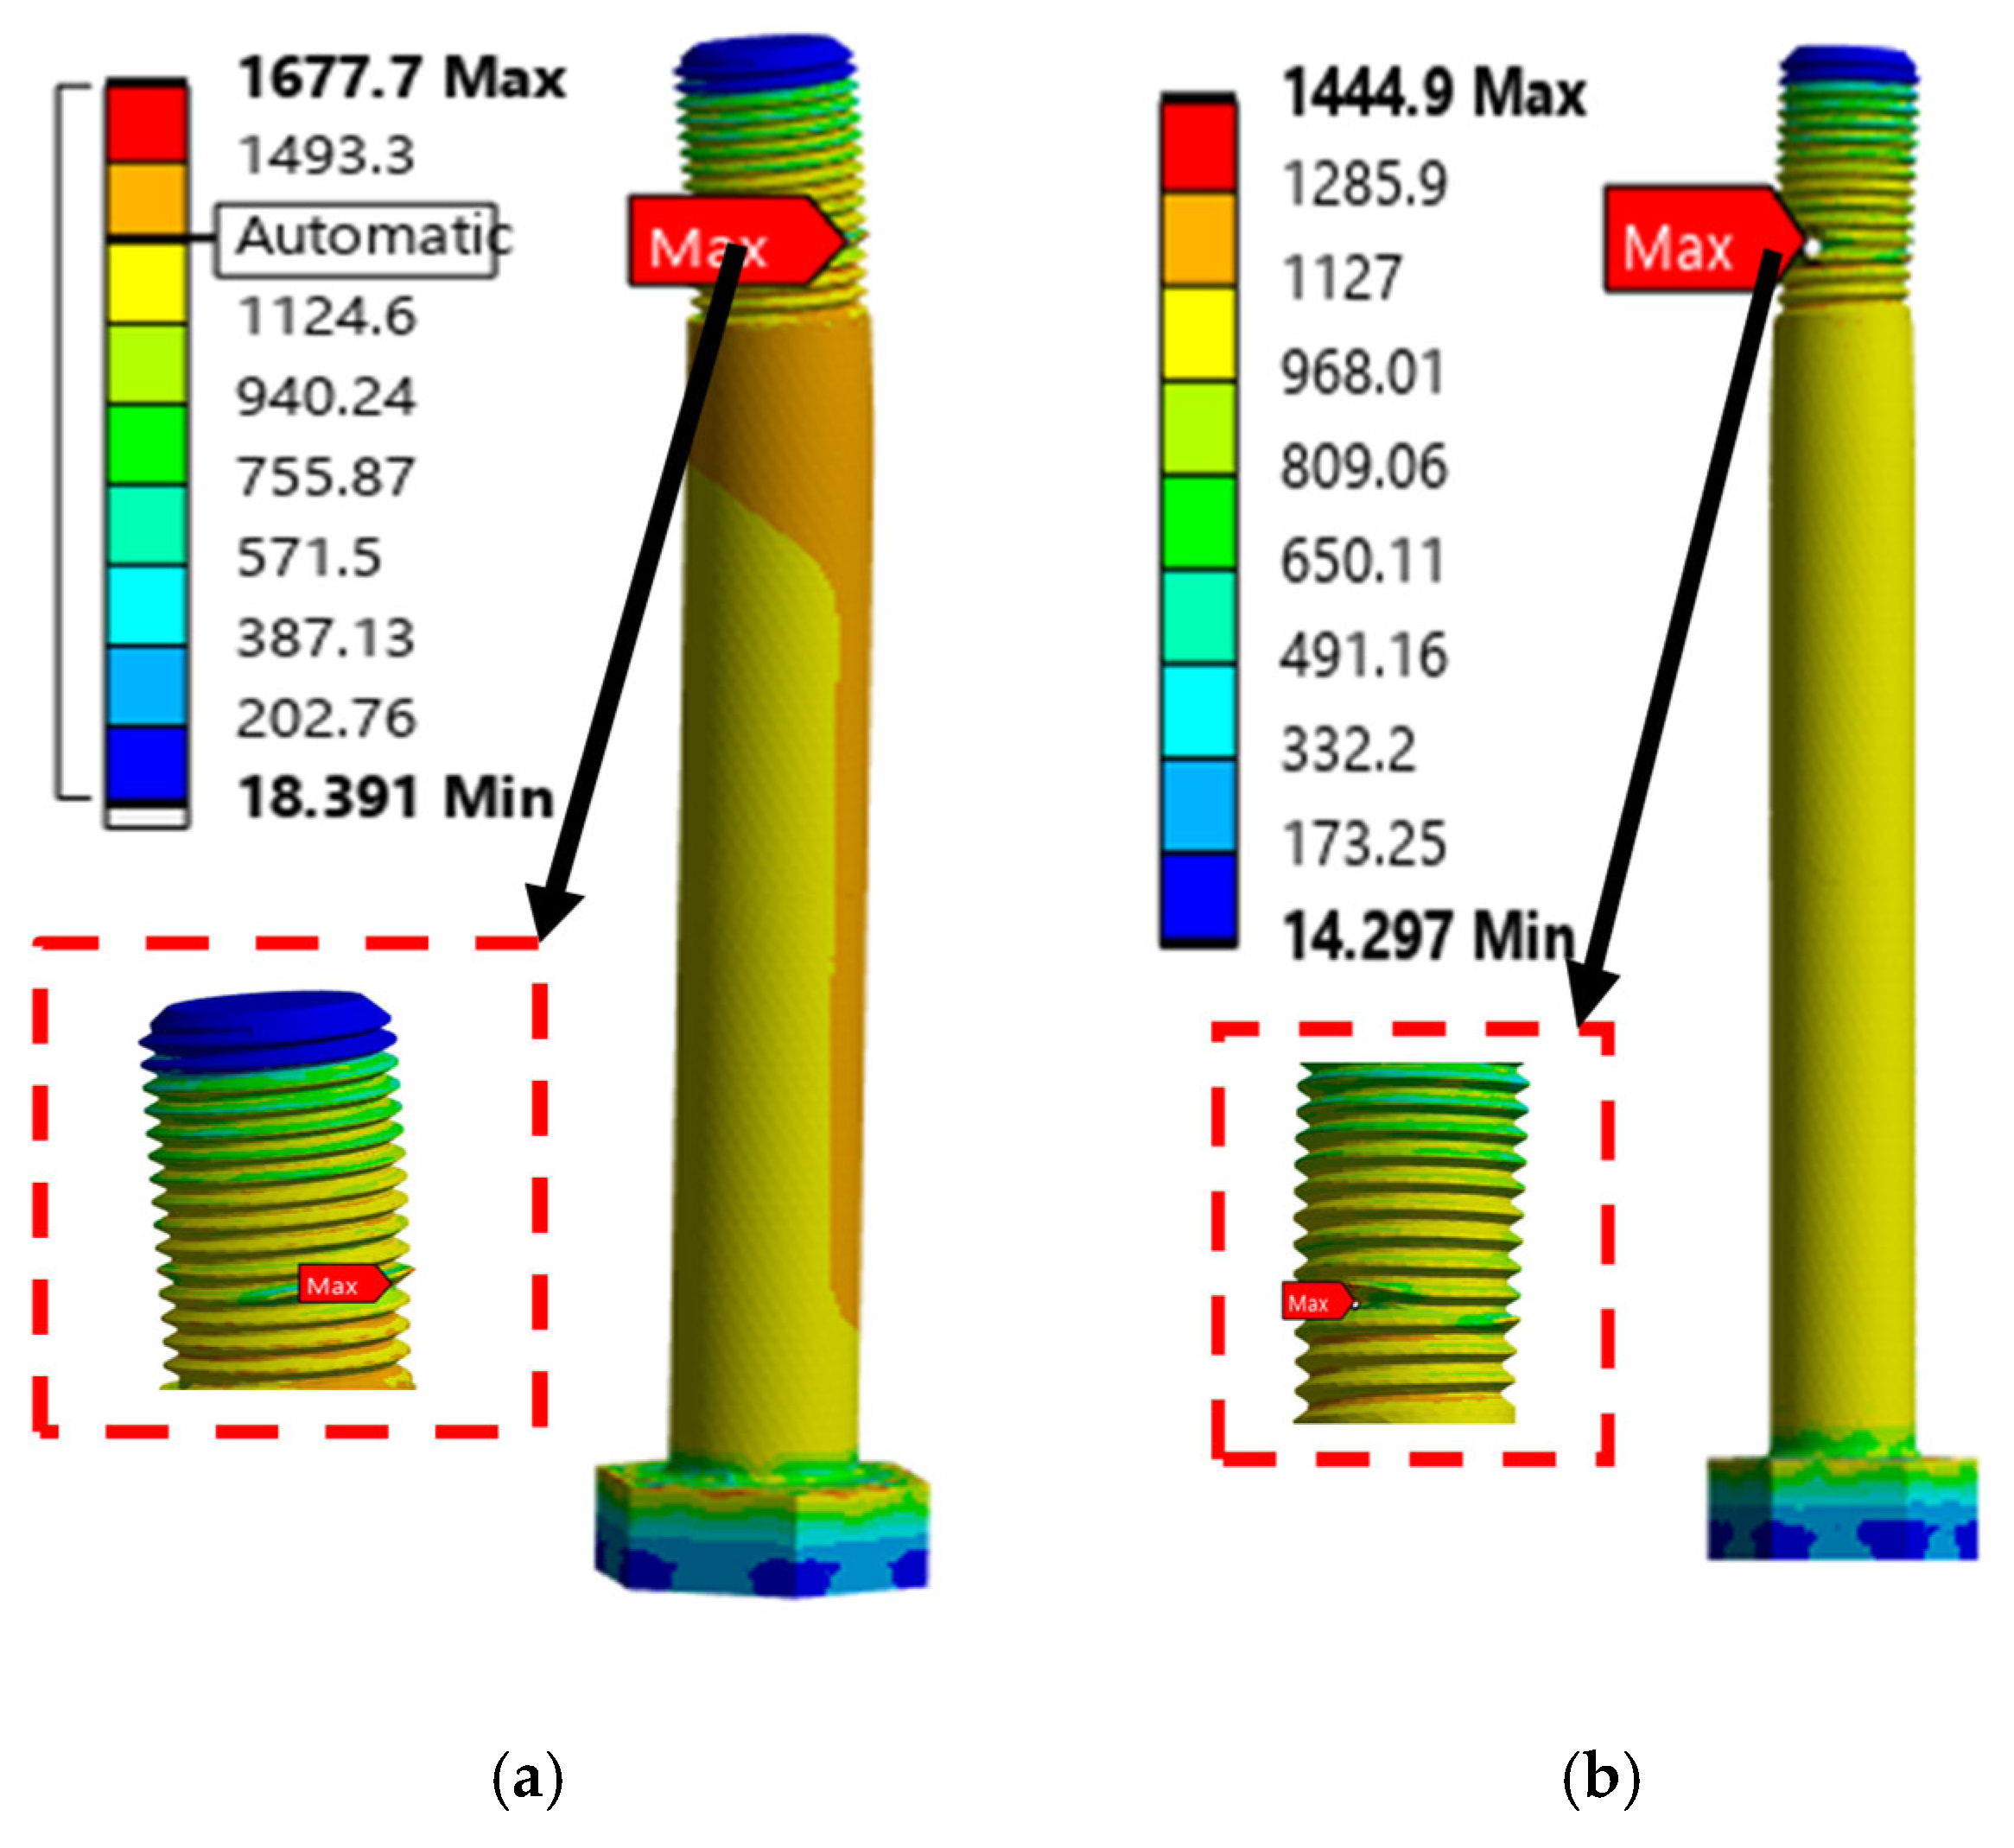
Figure 5.
The stress contours on bolt after bolt pretension application: (a) Grade 12.9 bolt, (b) Grade 10.9 bolt.
Figure 5.
The stress contours on bolt after bolt pretension application: (a) Grade 12.9 bolt, (b) Grade 10.9 bolt.
4.1.3. Comparative Analysis of Failure Modes
Failure modes included bolt thread failure, flange yielding, and bolt head fracture. For Grade 10.9 bolts, the failure happened in the thread part of the bolt at higher loads. At the same time, Grade 12.9 bolts experienced thread failure and flange deformation at higher bolt pretension because of their higher strength but lower ductility.
4.1.4. Insights on Performance and Reliability
The bolt grade and bolt pretension are found to considerably affect the L-type flange joints’ structural performance. Estimations based on the pretension results are as follows:
Grade 12.9 bolts provide higher loads but are likely to suffer localized thread failures at elevated pretension.
Increased pretension increases joint stiffness but also increases stress concentration around the bolt threads and, hence, requires careful optimization.
Grade 10.9 bolts exhibit better ductility, making them less prone to catastrophic failure under extreme conditions.
These observations, therefore, help in the basis of selecting appropriate bolt grades and bolt pretension based on a specific application to ensure optimal performance and safety margins in flange joint assemblies.
4.2. Force–Displacement Curves for Each Bolt Grade: Simulation Results
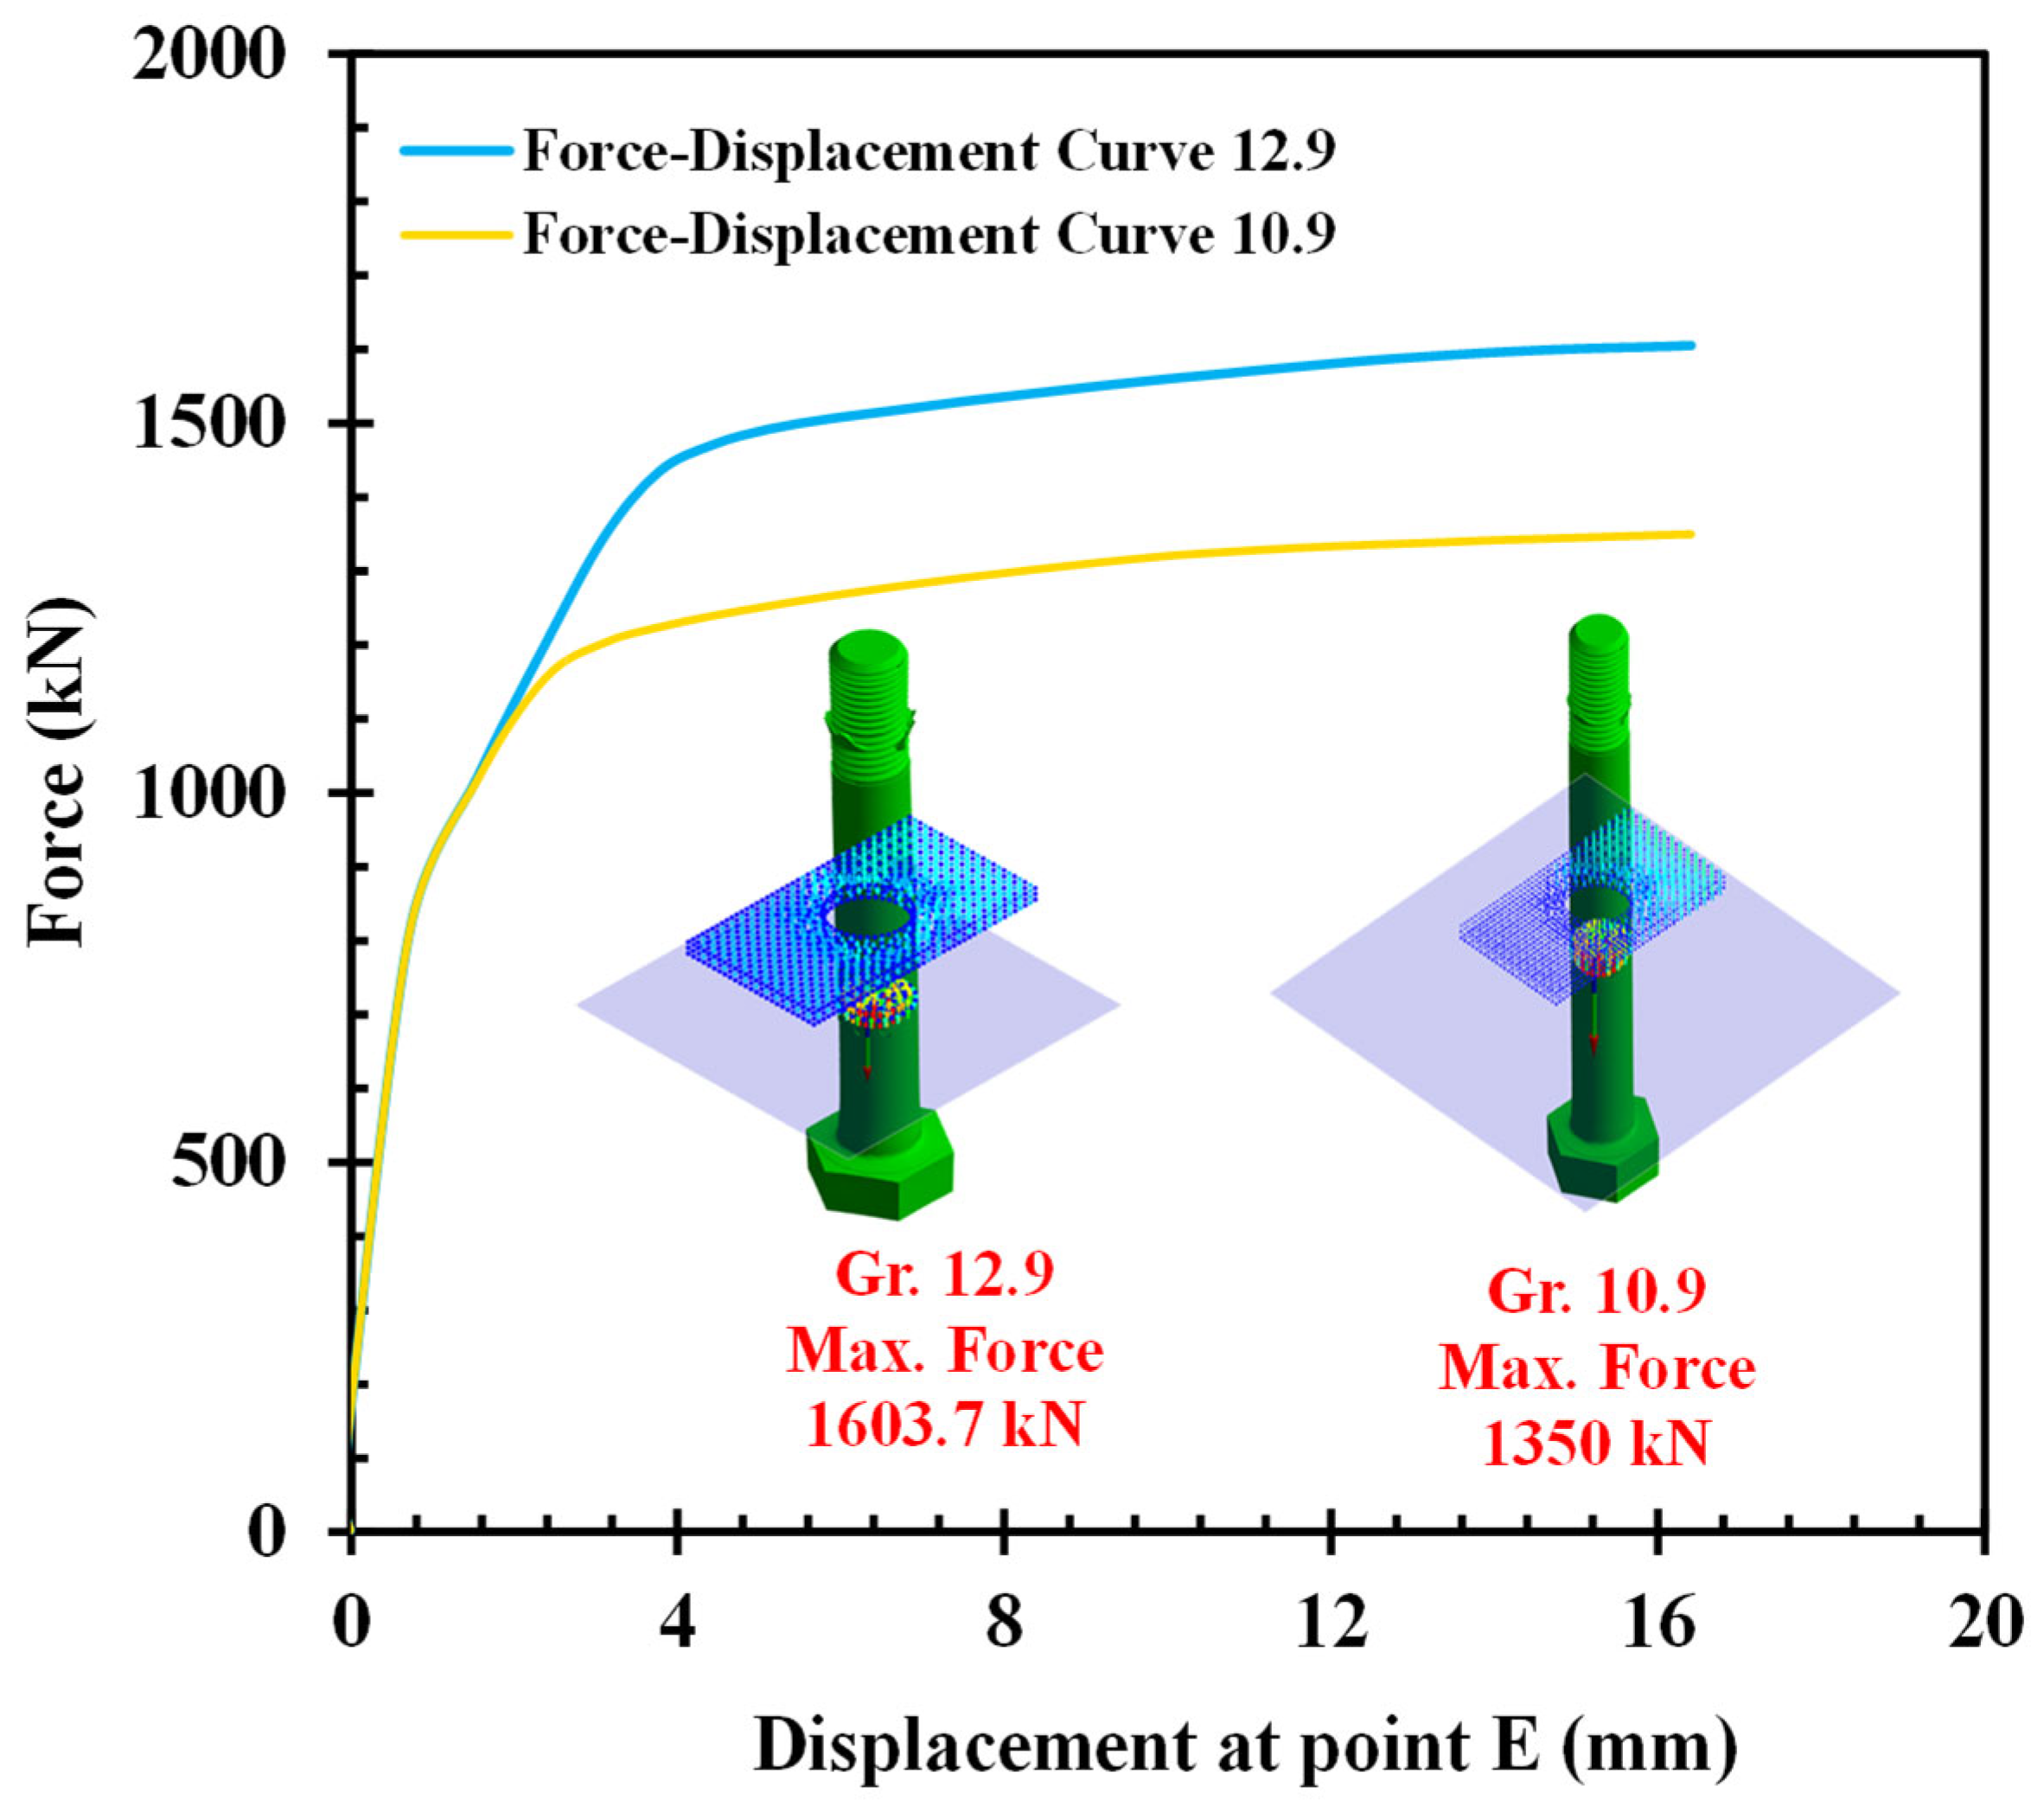
Finite element analysis (FEA) was employed to simulate the force–displacement behavior of Grade 10.9 and Grade 12.9 bolts to gain an insight into their mechanical response with varying levels of pretension. The numerical analyses revealed information regarding stress distribution, load-carrying capacity, and deformation patterns so that the two bolt grades could be compared.
In the case of the Grade 10.9 bolt, the simulations attained a maximum force of 1350 kN at 16.3 mm of displacement. The force–displacement curve had a progressive and steady rise in load, demonstrating the ductility of the material. The curve during the transition from the elastic to the plastic zone was smooth, which meant Grade 10.9 bolts demonstrate extensive plastic deformation prior to failure. Stress distribution maps produced from the simulations indicated evenly distributed stress around the bolt shaft with localized stress concentrations in the vicinity of the threads, which were the critical points of failure. This follows the fact that the integrity of the bolt is highly dependent on the local stress buildup at the threads, as shown in
Figure 6.
For Grade 12.9 bolt, the simulations provided a maximum force of 1600 kN at a displacement of 16.3 mm. The slope of the force–displacement curve was steeper in the elastic region, which indicates greater stiffness and resistance to deformation than for Grade 10.9 bolts. The transition to the plastic region was also shorter and more abrupt, meaning lower ductility. Stress maps indicated greater stress concentrations around the bolt head and threads, which indicates that Grade 12.9 bolts are more prone to localized failures, even though they have greater load-carrying capacity. The force–displacement behavior is shown in
Figure 6The comparison of numerical values shows that although Grade 12.9 bolts have better strength and stiffness, they also have greater stress concentrations and reduced ductility and are, therefore, more susceptible to localized failure under severe loading conditions. On the other hand, Grade 10.9 bolts have better ductile failure modes and more evenly distributed stresses and a larger tolerance for deformation. This indicates that Grade 12.9 bolts are better used for heavy-load applications, while Grade 10.9 bolts can be preferred for those involving predictability and progressive failure. The FEA results capture a full understanding of the mechanical response of the two bolt grades, which is useful for their selection and application in structural assemblies.
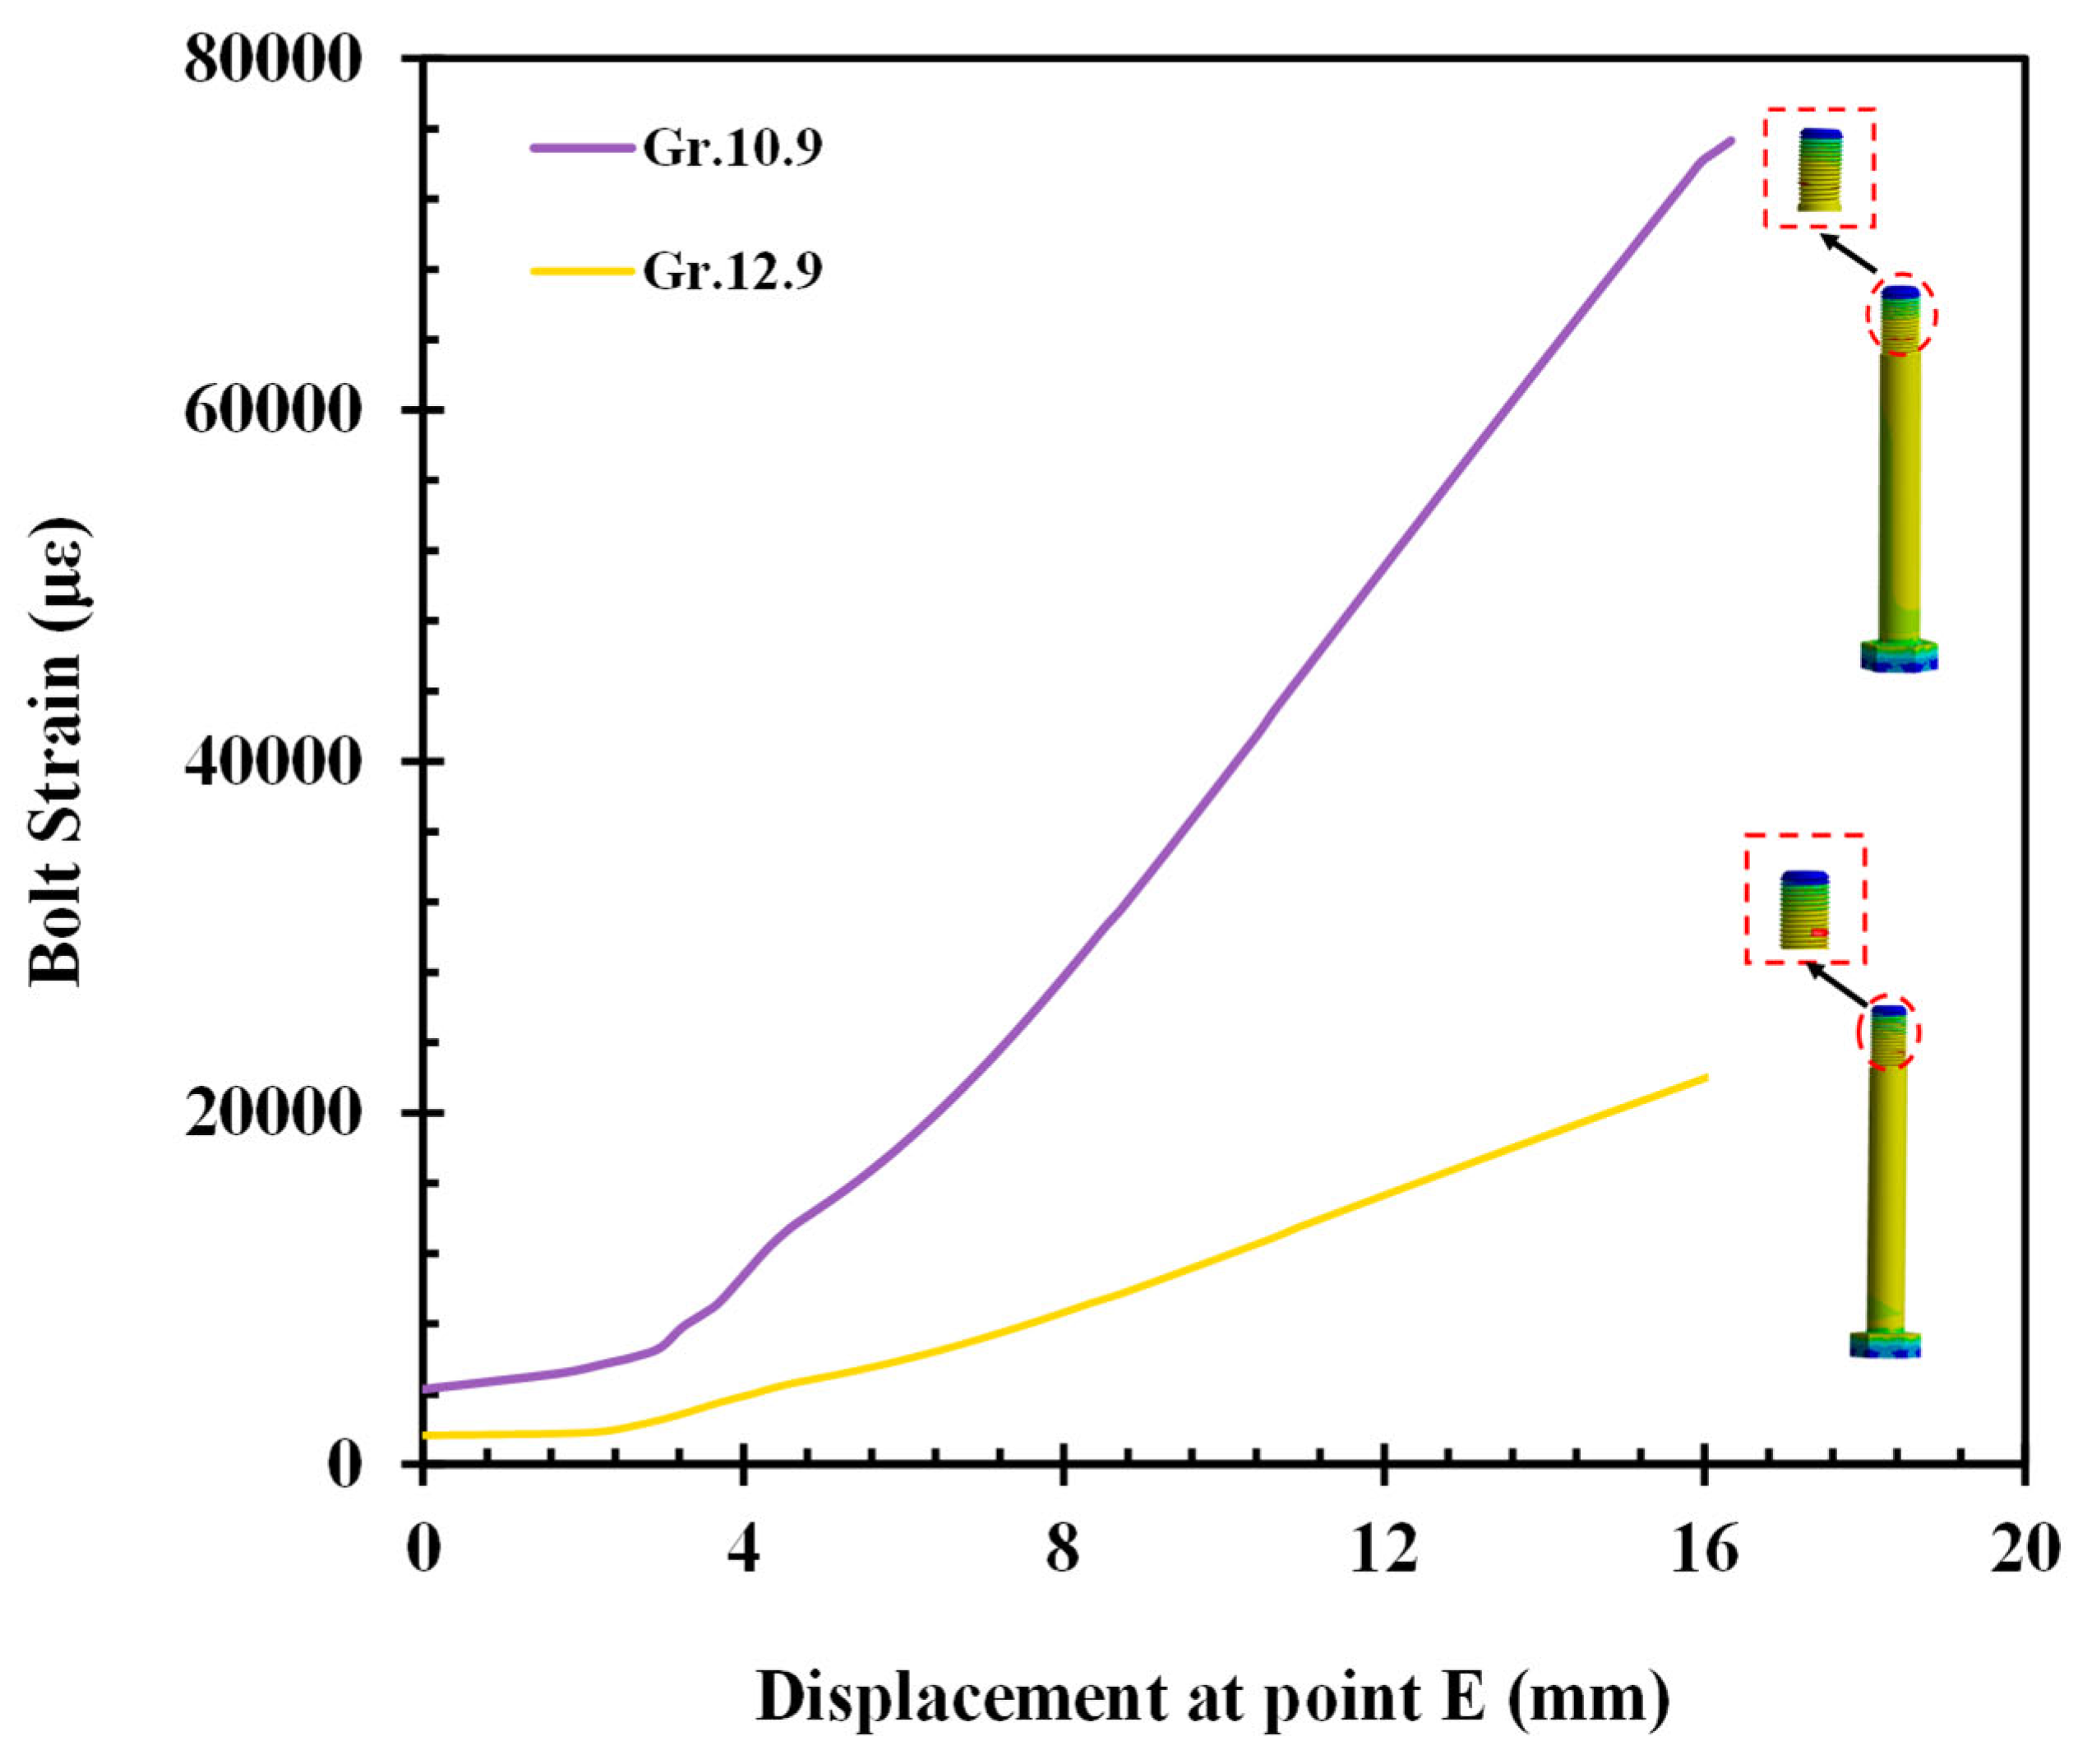
4.3. Bolt Strain Behavior Under Axial Tensile Loading
Numerical simulations yielded critical information regarding Grade 10.9 and Grade 12.9 bolts’ strain–displacement characteristics, differentiating the competing mechanical properties between the two bolts’ grades. The finite element analysis (FEA) maps of strain verified that stress as well as deformation patterns are rather different for both grades, distinguishing them for specialized uses as shown in
Figure 7.
For Grade 10.9 bolts, the simulations measured a maximum strain of 75,320 µε, mainly around the bolt threads, where maximum stress levels were found. Strain distribution along the bolt shaft was almost even, with smooth and gradual loading under the applied load. This ductile deformation pattern facilitates stress redistribution along the length of the bolt, postponing localized failures and providing a more predictable response at high loads. The capacity of Grade 10.9 bolts to undergo extensive plastic deformation prior to failure renders them perfectly suitable for use in situations where deformation tolerance, energy absorption, and failure predictability are essential.
For Grade 12.9 bolts, on the other hand, the highest recorded strain in simulations was 24,734 µε, with maximum strain concentrations found close to the bolt head and threads. The strain–displacement curve had a steeper slope closer to the threads, which reflects higher stiffness and lower ductility than for Grade 10.9 bolts. The limited strain capacity of Grade 12.9 bolts indicates greater susceptibility to localized failure, particularly in zones of high concentration of stress. Although Grade 12.9 bolts can withstand greater loads, they have the absence of notable plastic deformation; thus, their capacity for absorbing and distributing stress evenly is minimized. Consequently, these bolts are prone to sudden failure when under high stress, particularly in areas near the thread and bolt head illustrated in
Figure 8.
The different deformation behavior of Grade 10.9 versus Grade 12.9 bolts serves to illustrate the compromise between ductility and strength. Whereas the superior load-carrying capability of Grade 12.9 bolts is gained through greater stiffness and lower plasticity, the design engineer must take special care to avoid localized concentrations of stress, which can result in early failure. Grade 10.9 bolts, conversely, offer a more ductile behavior, permitting larger deformation before failure and, hence, are suitable for applications where gradual failure evolution and energy absorption are critical. The numerical simulations establish that material choice needs to be optimized in accordance with the structural requirements of a particular structural application to achieve a balance of strength, durability, and failure prognostics.
The reduced maximum strain observed in Grade 12.9 bolts is primarily due to their higher tensile and yield strength, but lower ductility compared to Grade 10.9 bolts. As a higher-strength material, Grade 12.9 exhibits greater stiffness, meaning it resists deformation more effectively under applied loads. However, this also limits its ability to undergo plastic deformation, resulting in lower strain accumulation before failure. In contrast, Grade 10.9 bolts, with relatively lower strength but higher elongation capacity, absorb more strain and exhibit more gradual failure, a typical trade-off between strength and ductility in high-strength steels.
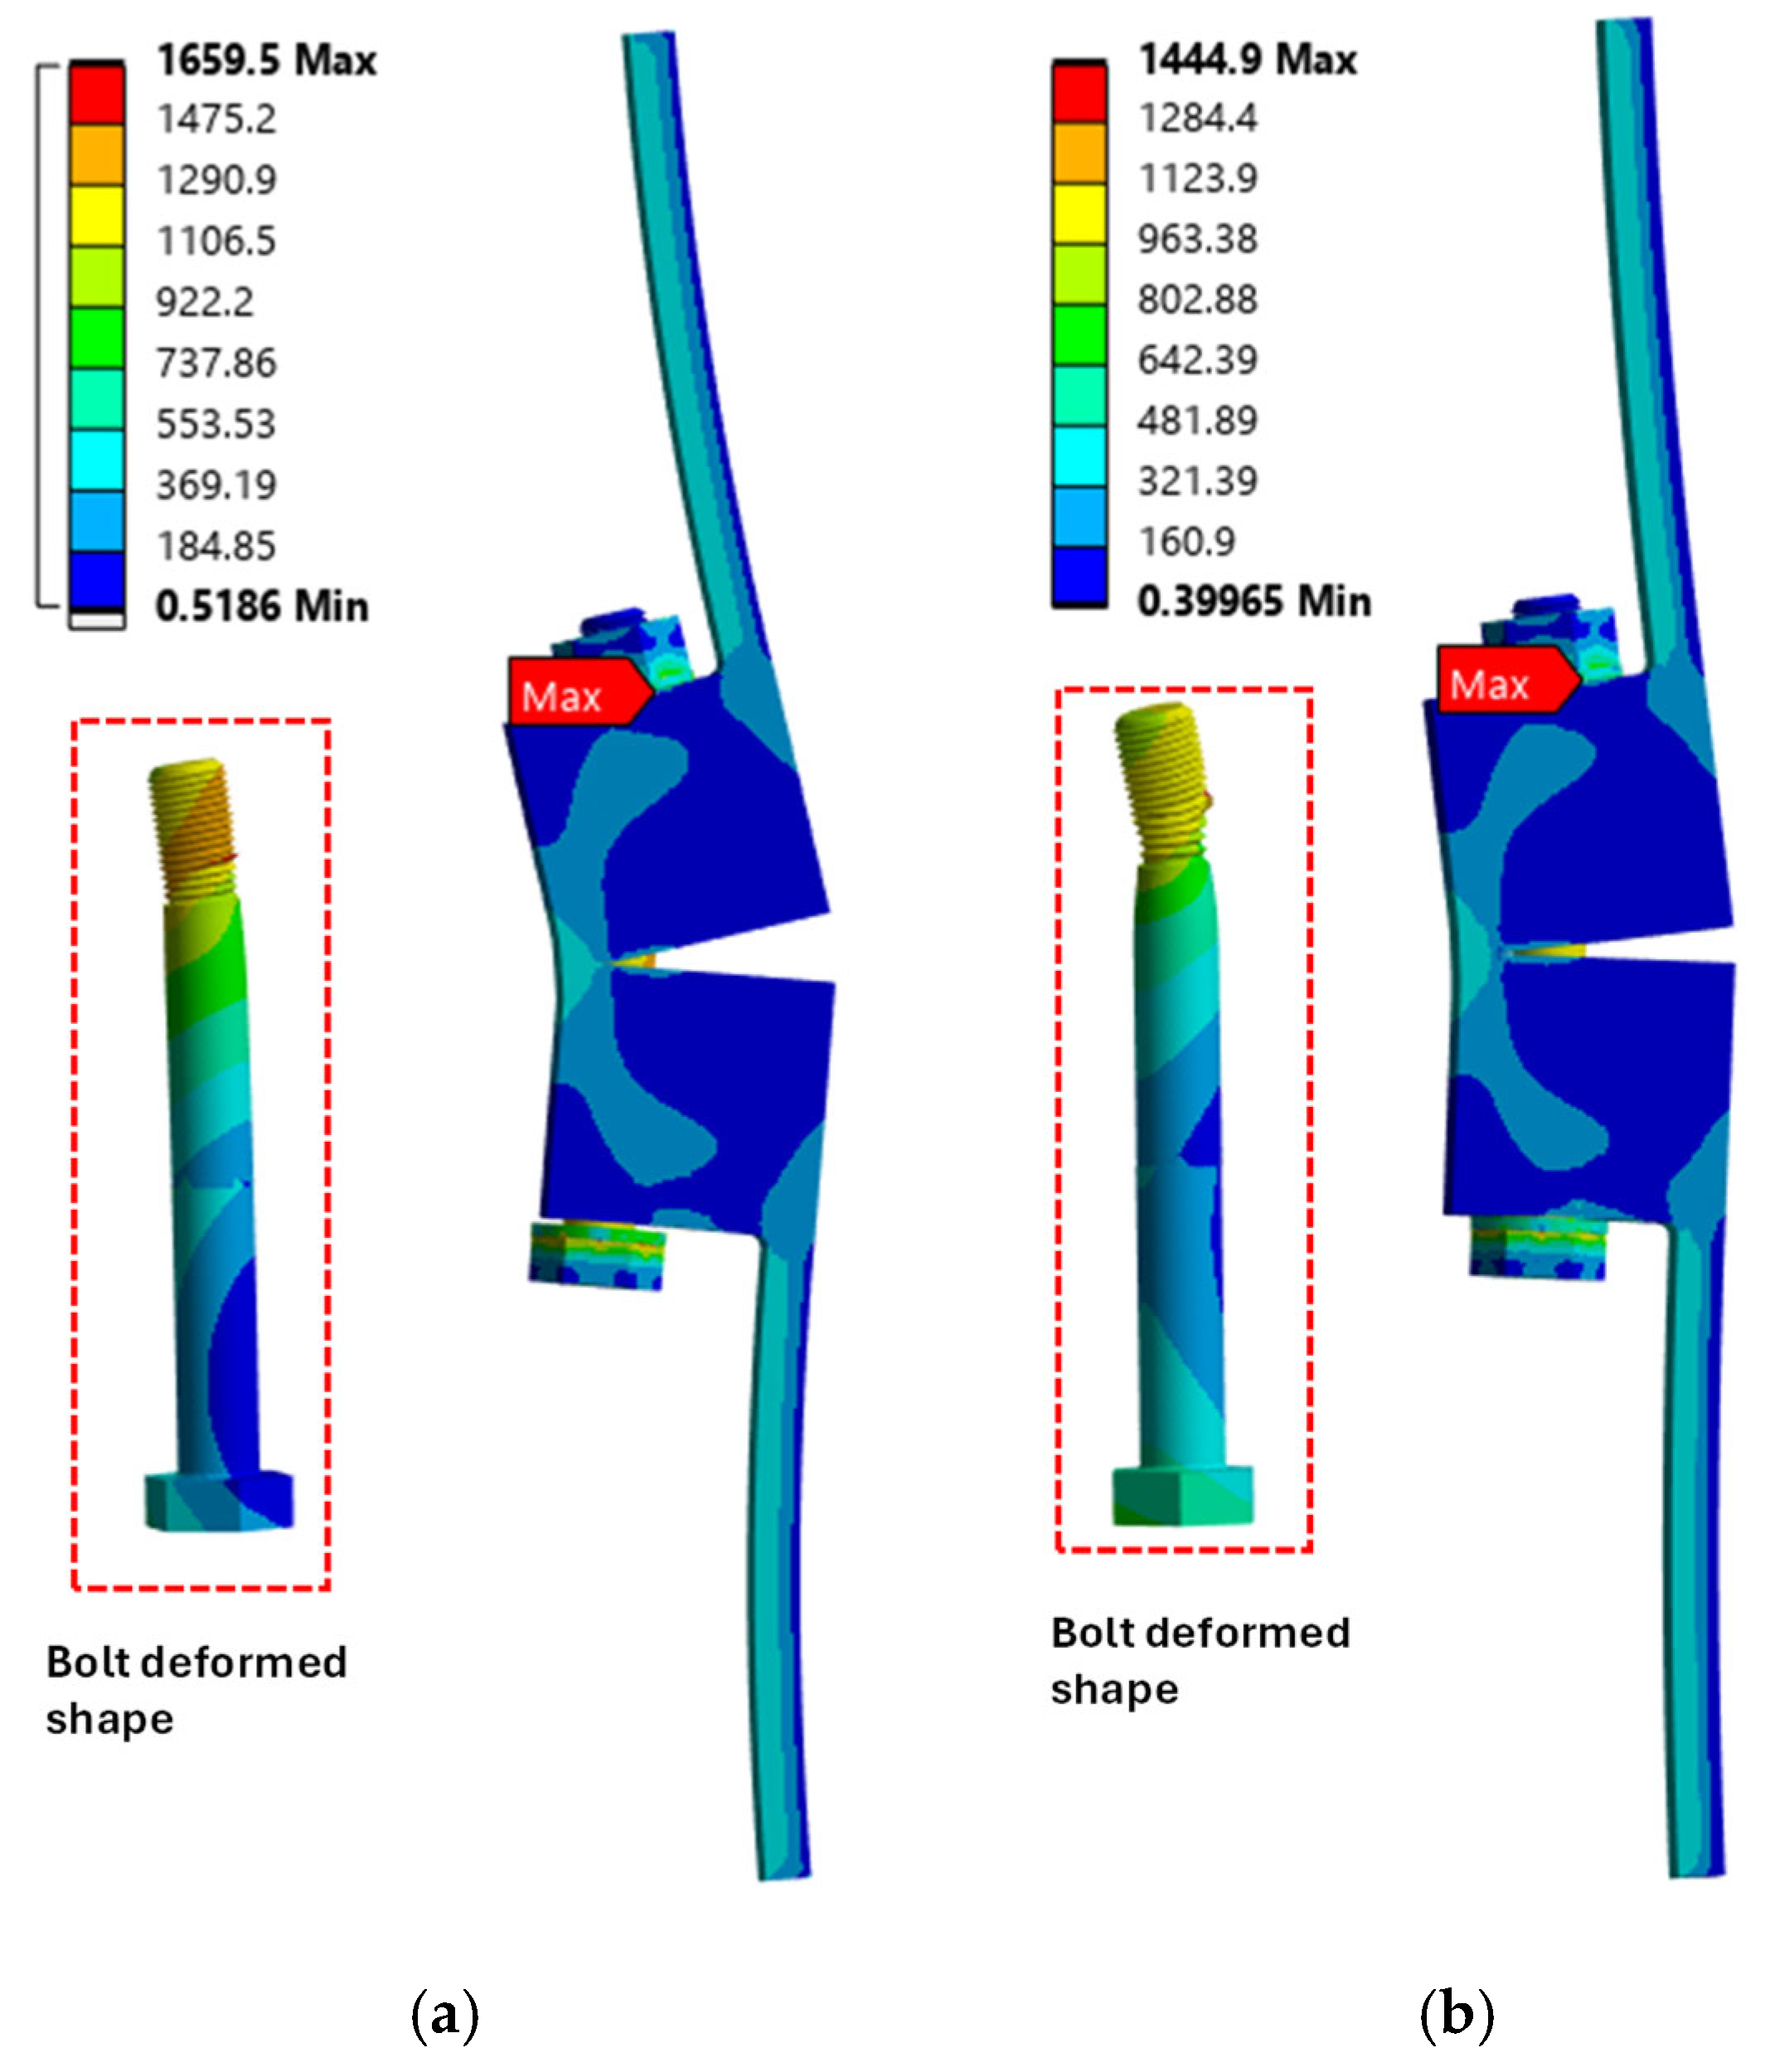
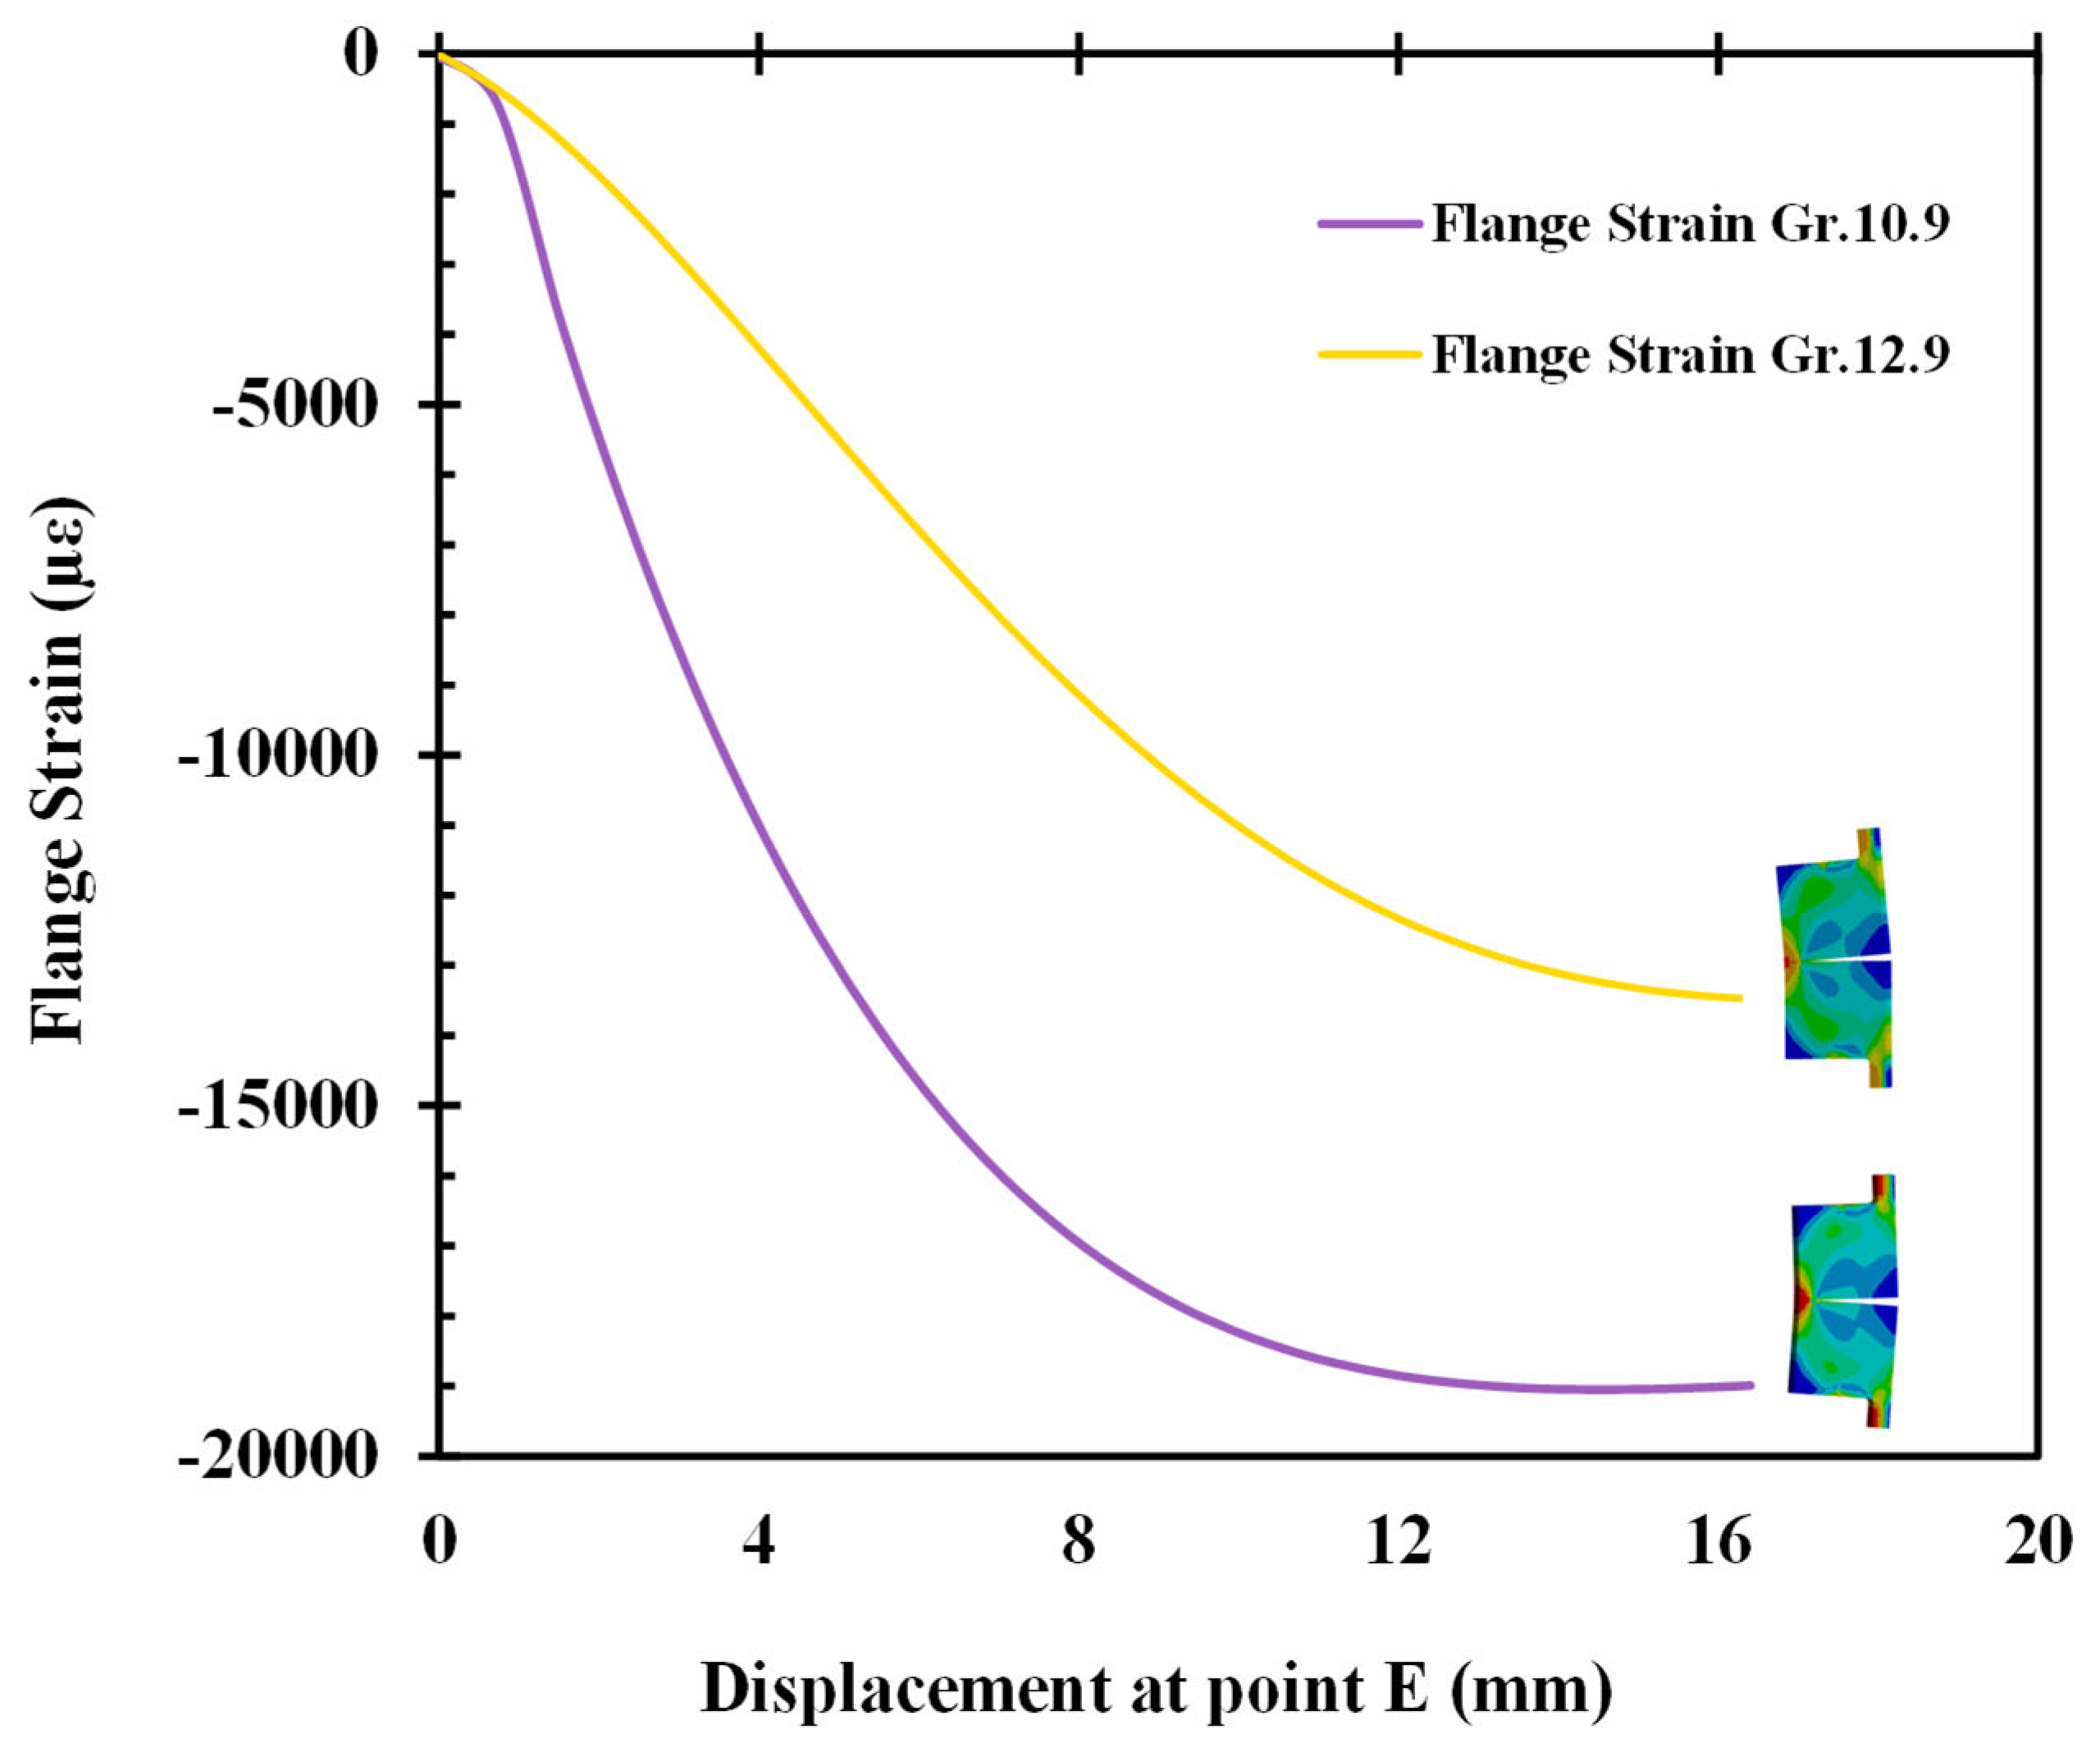
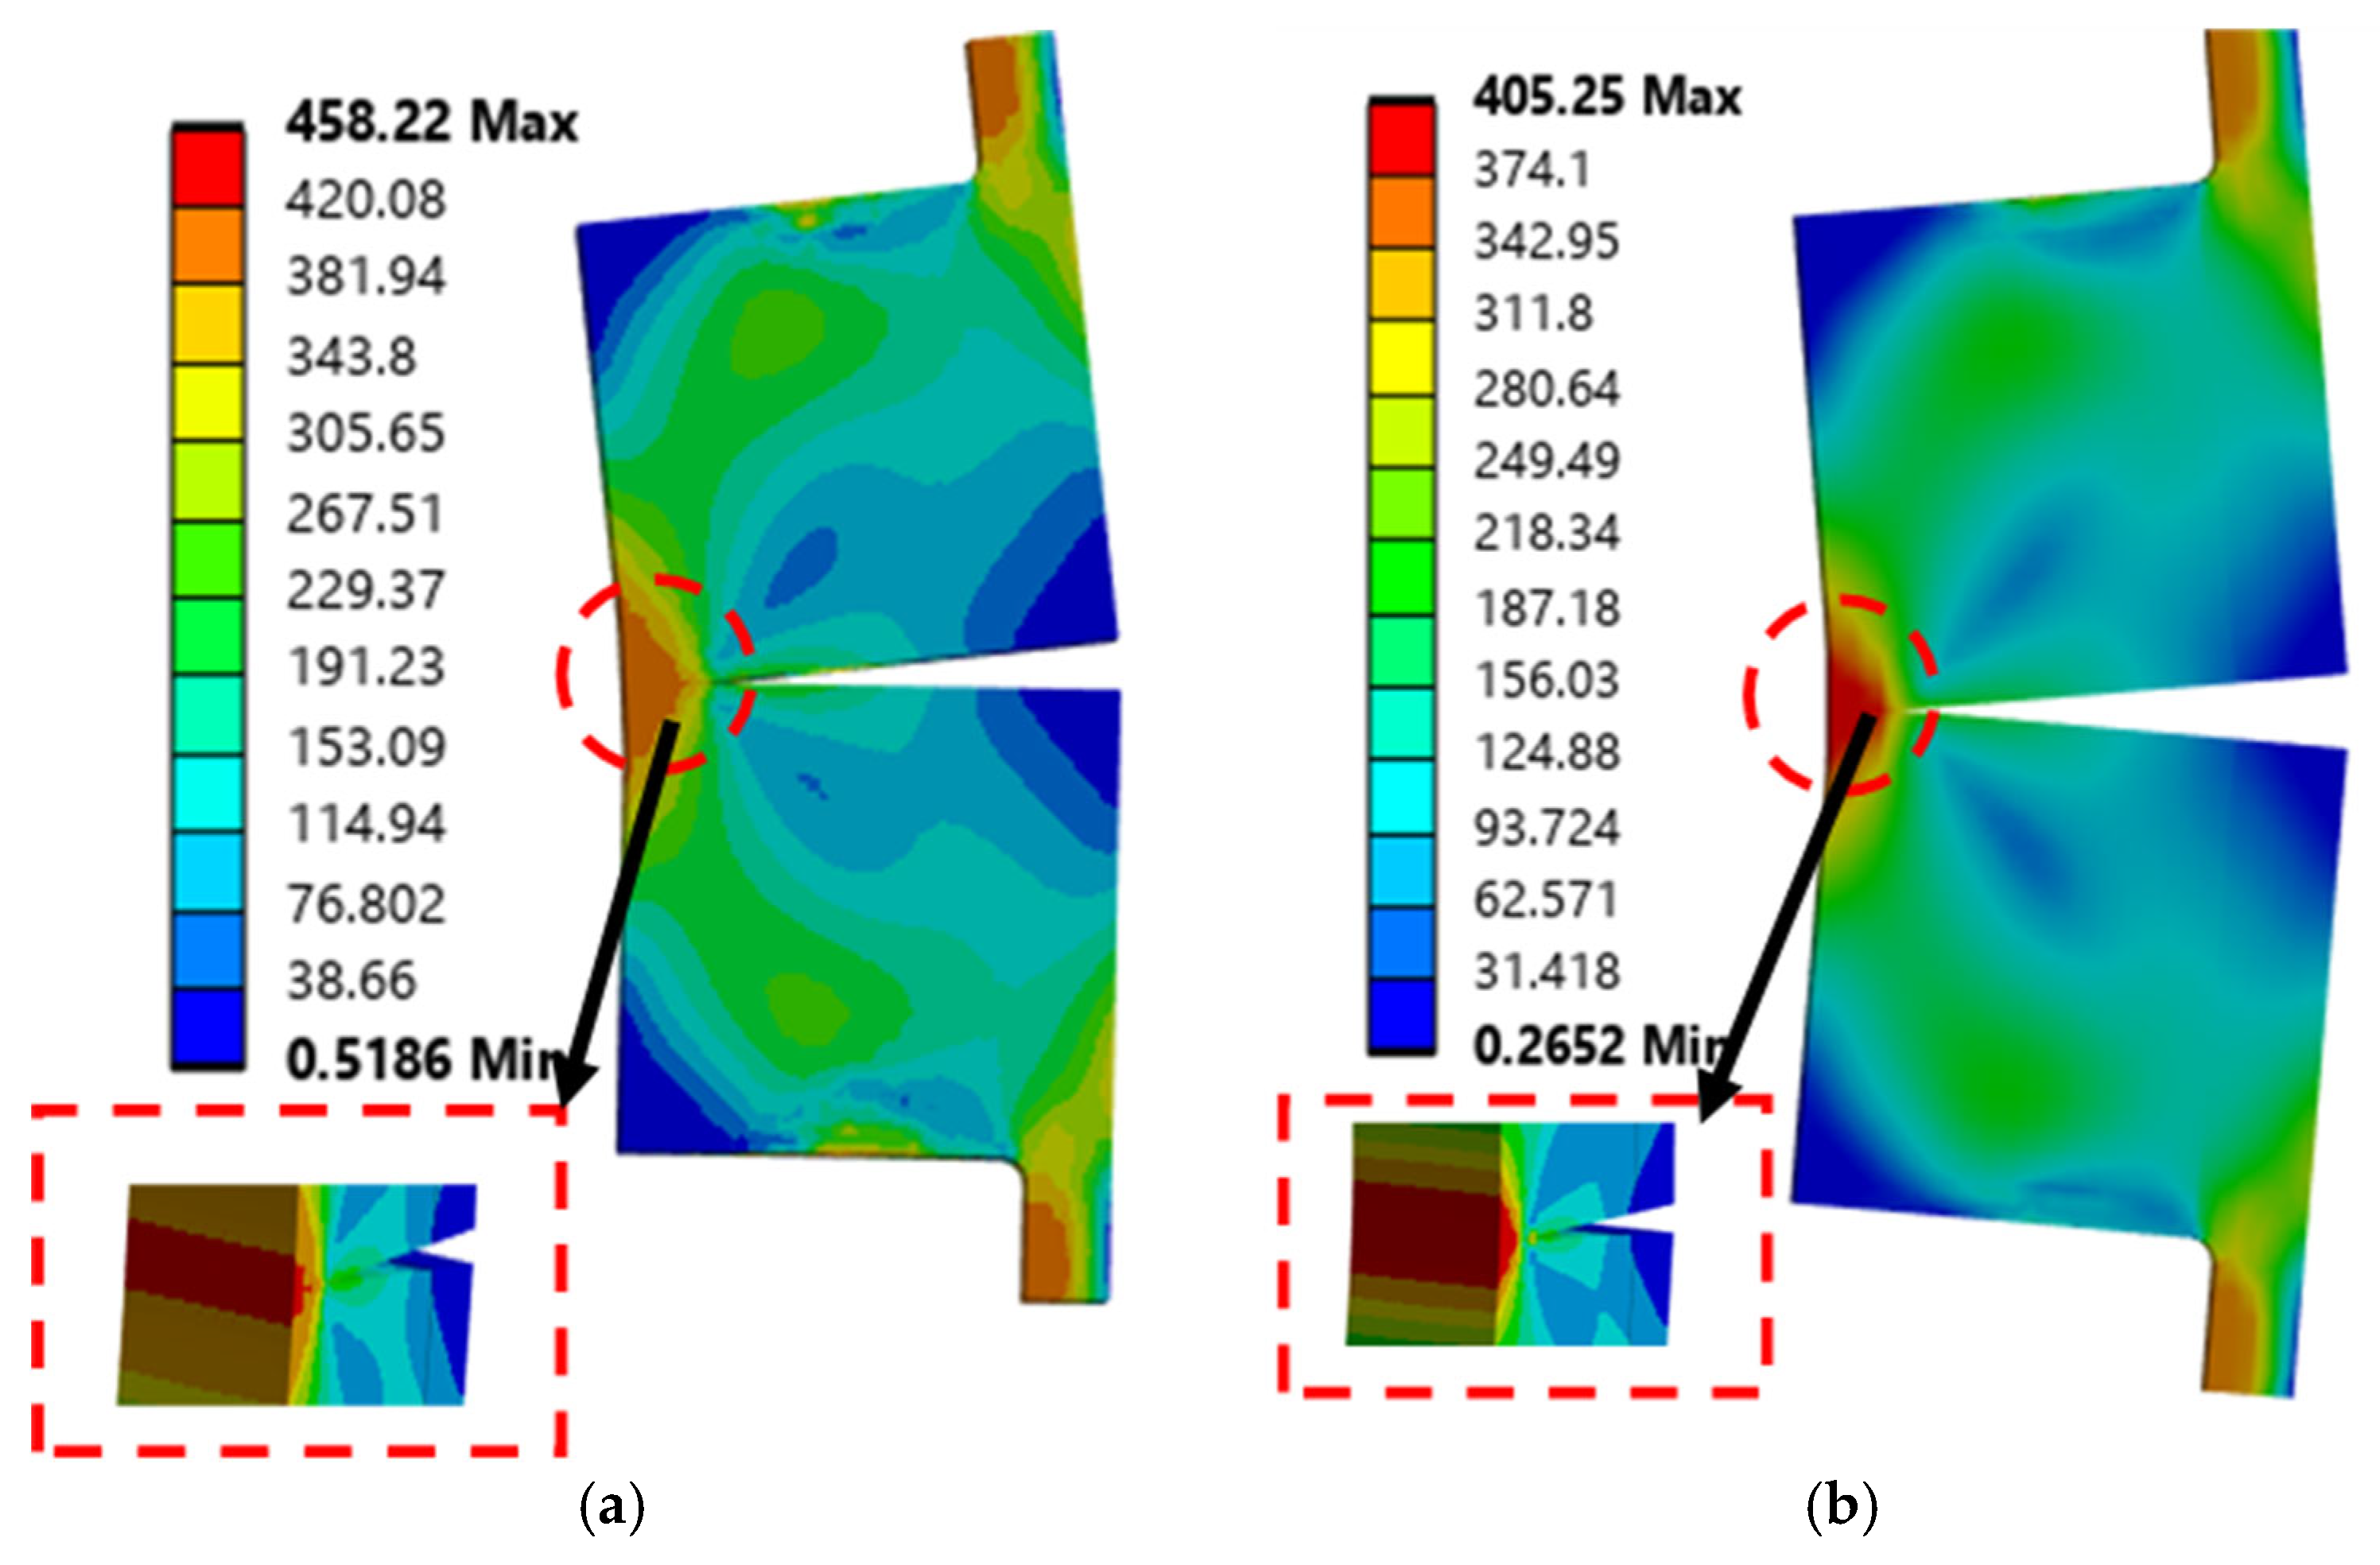
4.4. Flange Strain Behavior
Finite element analysis was employed to examine the strain response of the flange material for various bolt grades and levels of pretension. The simulations yielded useful information regarding stress distribution, localized strain patterns, and interaction between the bolts and the flange, providing a more refined understanding of how flange deformation is affected by bolt stiffness and applied loading conditions as shown in
Figure 9.
For Grade 10.9 bolts, the highest flange strain simulated was −18,450 µε, concentrated mostly around the bolt holes, where stress build-up was greatest. The FEA-generated stress maps indicated an even distribution of strain over the flange surface, with strain increasing gradually around the bolt holes. This behavior is testament to the ability of the flange material’s ductility to ensure predictable and smooth deformation and minimize the risks of unexpected local failure. Grade 10.9 bolts, together with a ductile flange material, facilitate optimal stress distribution to allow gradual deformation and enhanced load-sharing through the joint assembly.
Conversely, for Grade 12.9 bolts, the simulated maximum flange strain was −13,241 µε, much less than the Grade 10.9 bolts. The increased stiffness of Grade 12.9 bolts resulted in more stress transferred to the flange, causing higher localized stress concentrations close to the bolt holes. The FEA stress maps identified flange deformation to be more concentrated, with greater strain accumulation on the bolt–hole interface, which implies that Grade 12.9 bolts produce a stiffer joint connection. Although this improves load-bearing capacity, it also creates issues regarding possible fatigue and long-term damage in stress concentration areas as shown in
Figure 10.
The comparison of the two bolt grades in simulations verifies that although Grade 12.9 bolts offer greater strength and resistance to deformation, they also increase localized stress in the flange material, which makes them more prone to fatigue-related failures with prolonged use. Grade 10.9 bolts, on the other hand, enable improved stress redistribution, leading to more even deformation of the flange and minimizing the likelihood of premature cracking or localized failure.
These results emphasize the need to maximize bolt stiffness in terms of flange material properties. Also, both specimens, before achieving yield strain, must be compressed. The application of Grade 12.9 bolts necessitates proper consideration of flange geometry and material choice to provide compatibility and reduce stress concentrations around bolt holes. Grade 10.9 bolts provide a better interaction with the flange, rendering them preferable for applications necessitating predictable and gradual deformation over a range of load conditions. The numerical models prove that ensuring a perfect equilibrium between bolt stiffness and flange ductility is imperative in order to design efficient high-performance bolted joints and ensure structural dependability and lifespan in demanding applications in engineering.
4.5. Tower Shell Strain Behavior
Finite element analysis (FEA) was conducted to evaluate how different bolt grades influence the strain and yielding behavior of the tower shell under axial loading. The results revealed that bolt stiffness significantly affects load transfer characteristics and the onset of plastic deformation within the shell structure.
When Grade 12.9 bolts were used, the tower shell exhibited earlier yielding under axial displacement, with elastic deformation initially. The same is the case with the Grade 10.9 bolt; both bolts show similar behavior initially. In comparison, the configuration with Grade 10.9 bolts delayed yielding, representing an increase in allowable displacement before plastic strain occurred. This indicates that the higher stiffness of Grade 12.9 bolts accelerates the concentration of stress into localized regions of the shell, promoting earlier material failure despite enhanced load-carrying capacity. Grade 12.9 exhibits maximum strain (1876με) while that of Grade 10.9 is (1051 με).
Figure 11a shows that both specimen tower shells exhibit tension behavior on the inside. As the curve shows in terms of strain magnitudes, the use of Grade 10.9 bolts led to higher peak strain values in some regions of the shell compared to Grade 12.9 bolts. This behavior stems from the rigid load path enforced by the stiffer bolts, which reduces the shell’s ability to redistribute stress, and lower-grade bolts are more ductile, thereby intensifying local deformation. The Grade 12.9 exhibits maximum strain (880 με) while that of Grade 10.9 is (1576 με).
Figure 11b shows the effect on the tower shell outside, which experiences compressive behavior. The tower shell outside region undergoes alternating stress cycles of tension, compression, and tension under axial loading. Grade 10.9 and Grade 12.9 experience a different kind of behavior at the outside shell. As the displacement increases, the shell-flange interface causes the induction of compressive forces. This suggests that the increased confinement and rigidity offered by the stiffer bolts also enhance local stability and delay yielding in areas where compressive or bending effects dominate. The Grade 12.9 exhibits maximum strain (1690 με) while that of Grade 10.9 is (1120 με).
Overall, the FEA highlights a trade-off between bolt stiffness and shell ductility. Grade 12.9 bolts improve structural stiffness and load transfer efficiency but lead to sharper stress gradients and earlier yielding. In contrast, Grade 10.9 bolts allow for more distributed deformation, promoting a more ductile and energy-absorbing response. These findings are critical for optimizing joint performance in tower shell structures where both strength and fatigue life must be balanced.
4.6. Z-Fs (External Load vs. Bolt Force) Relationship
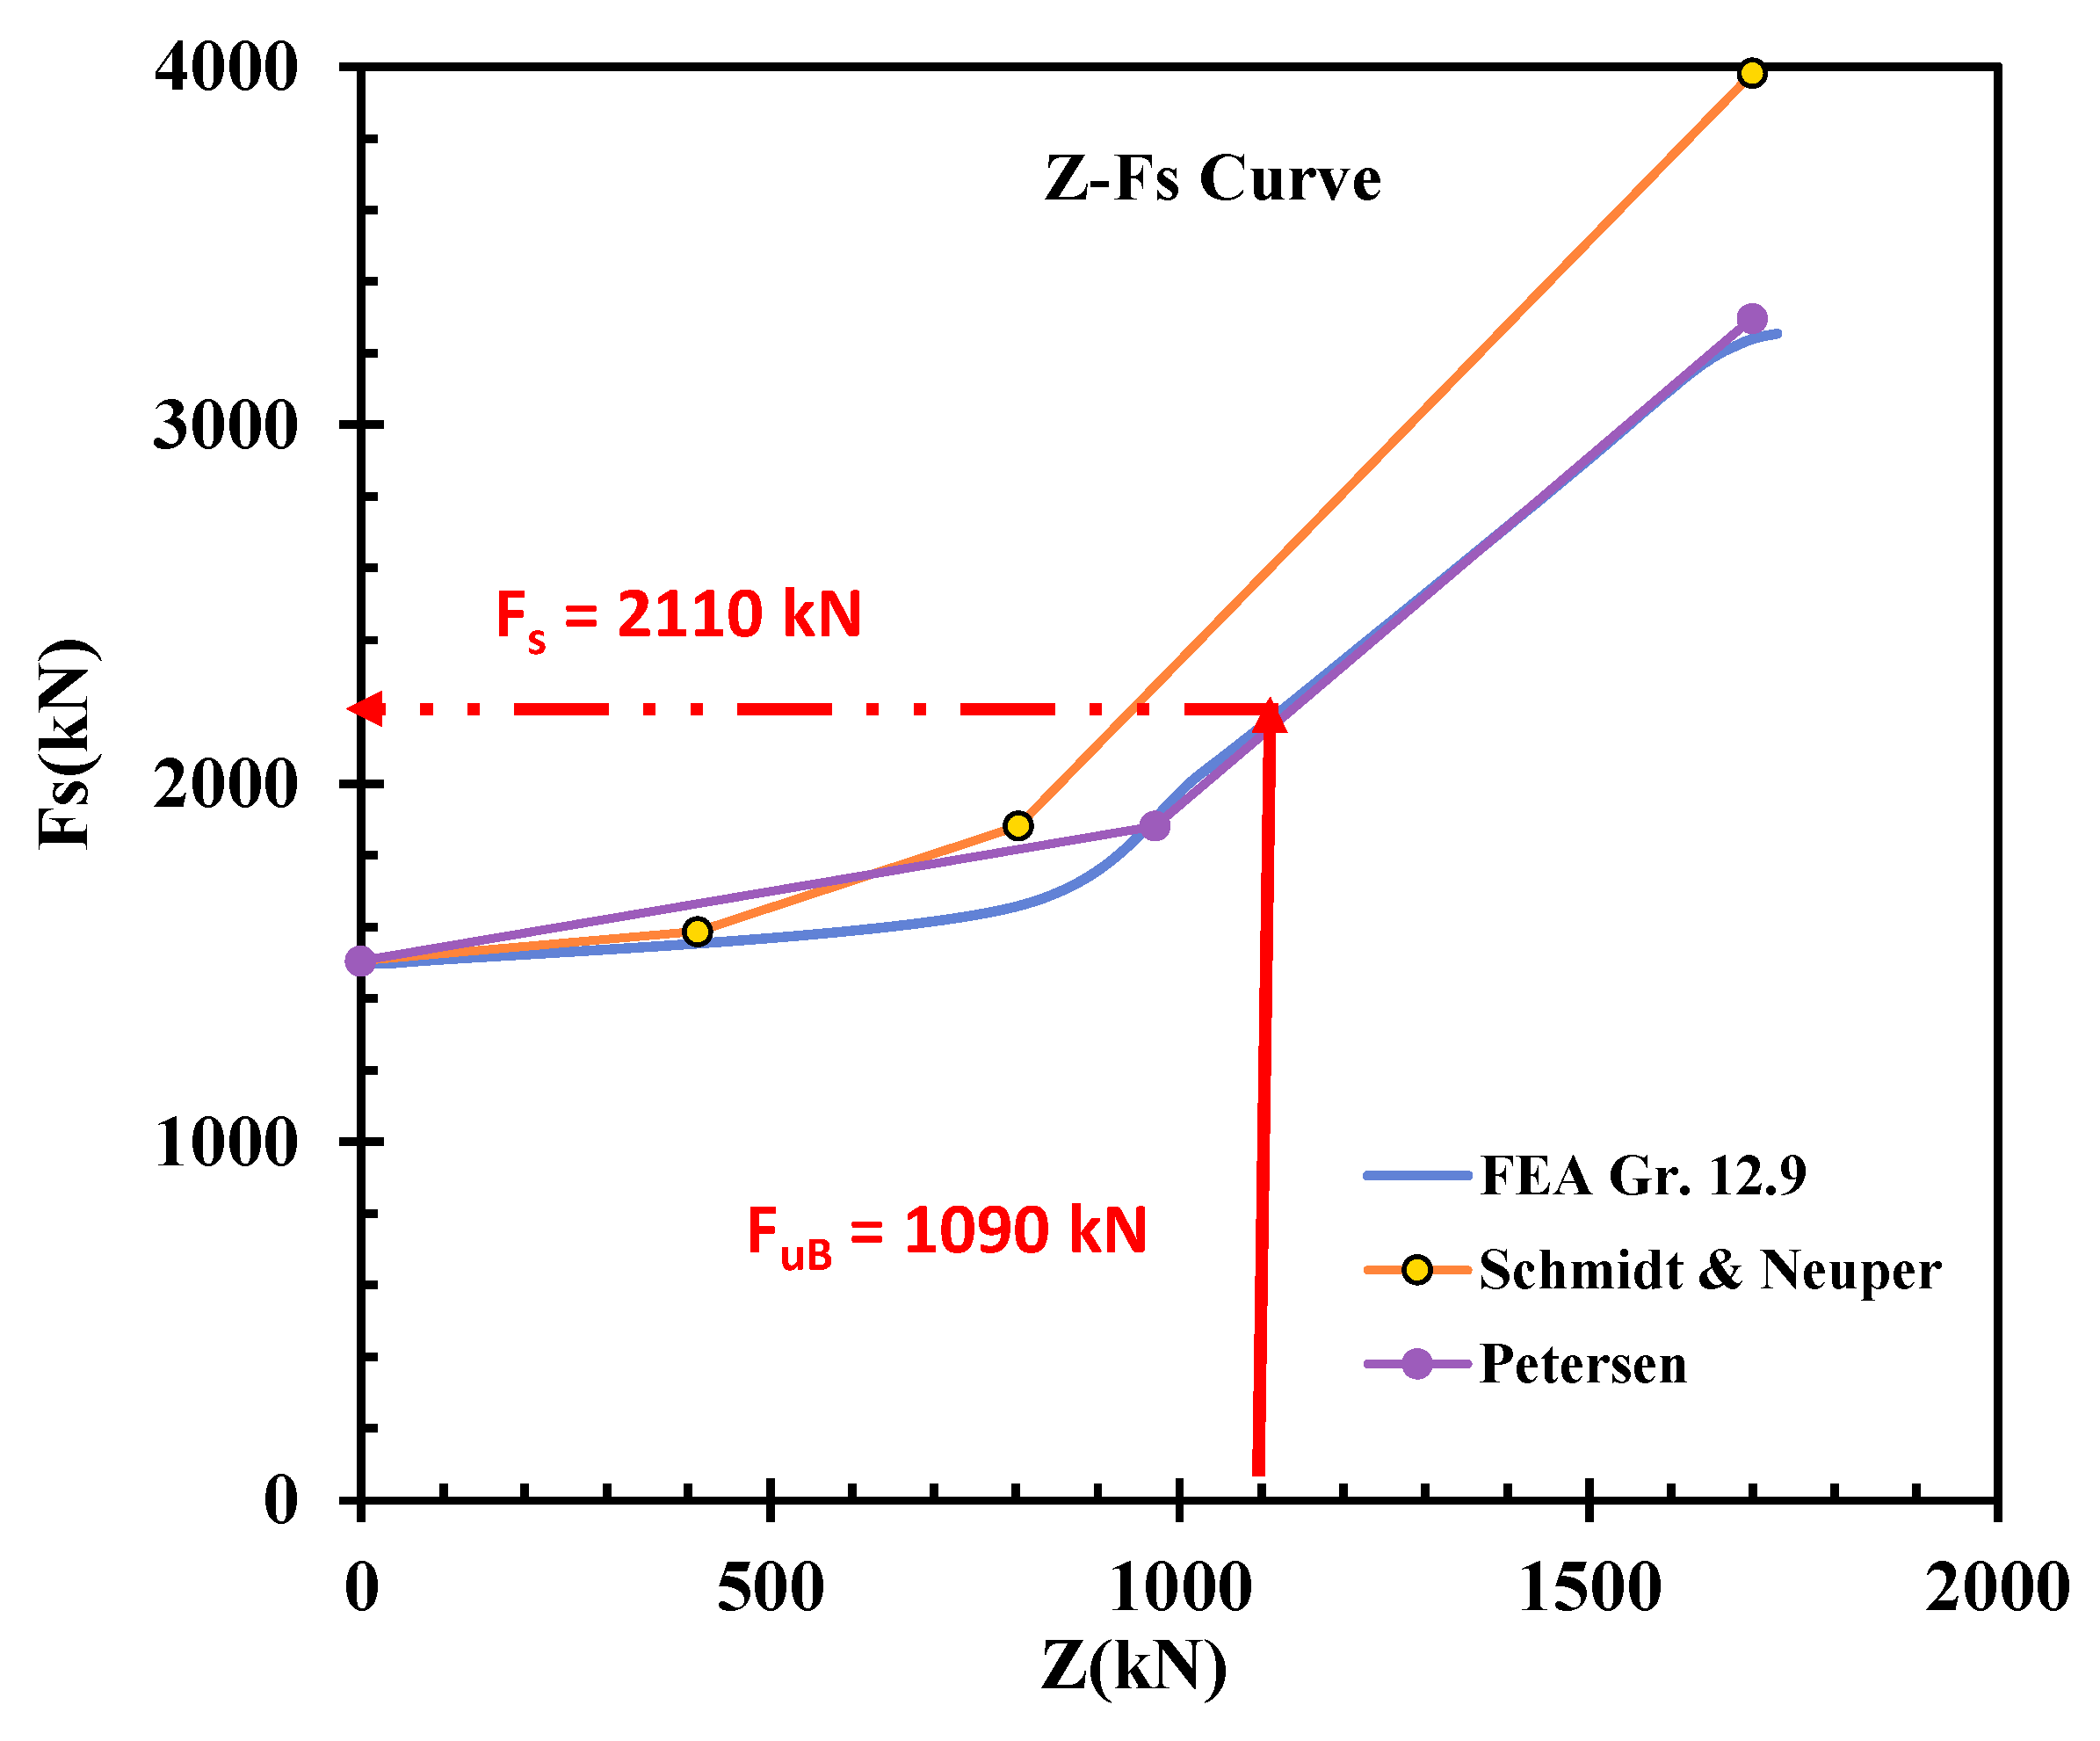
4.6.1. Z-Fs Curve Grade 12.9 Bolt
To further validate the numerical findings, the Grade 12.9 bolts’ Z-F
s relationship was compared with two well-known analytical models from standard IEC, the Petersen model and the Schmidt and Neuper model [
30]. The Z-F
s relationship defines how the internal bolt force (F
s) reacts to an external tensile load (Z), giving useful information on the joint’s load transfer efficiency. This comparison aids in the evaluation of the validity of finite element analysis (FEA) results and the accuracy of classical analytical models in the prediction of high-strength bolted joint behavior. As calculated, we know the preload force is 1500 kN and the design allowable tensile value F
u,B (1090 kN), so the bolt internal load F
s is approximately 2110 kN. F
u,B value was calculated from IEC-61400-6 (2020), providing the ultimate limit tension resistance force for failure mode B [
30].
Figure 12 shows the comparison of FEA results and the Schmidt and Neuper. Schmidt and Neuper, assuming a linear elastic response, predict a linear increase in F
s with Z throughout the initial loading stage. But deviations of Schmidt and Neuper from FEA are observed for high load levels when the results by FEA yield a lightly nonlinear response because of deformations concentrated around the threads and redistributions in stresses around them. That implies that while the Z-F
s correlation calculated by the Schmidt and Neuper model may approximate reasonably at the early stages, i.e., less external loading levels, at higher external loads on the high-strength bolt, the complex characteristics cannot be reproduced.
The comparison between the Petersen model and FEA results is also plotted in
Figure 12. This model adopts a more accurate approach, accounting for bolt elongation and joint compliance. Therefore, the Petersen model shows better correspondence with the FEA results within a broader range of applied loads. The Z-F
s curves by both techniques closely match each other, with minimal differences noted in the vicinity of ultimate load conditions. Such differences occur because of localized stress concentrations and plastic deformations, which are identified by FEA but have not been well replicated in the analytical model.
The comparison between these models establishes that although analytical approaches provide useful approximations of the Z-Fs relationship, they suffer from intrinsic limitations in accounting for localized stress variation, plastic deformation, and nonlinear effects in actual bolted joints. The FEA results better agree with theoretical expectations, affirming the accuracy and reliability of the numerical method in predicting the structural response of high-strength bolts subjected to different loads.
This discussion underlines the necessity of applying finite element simulations in conjunction with analytical models to establish an in-depth understanding of bolt load transfer mechanisms. Though simple analytical models can lead to rapid estimates, in-depth numerical simulations are necessary to predict joint behavior correctly in various bolt pretension and loading conditions.
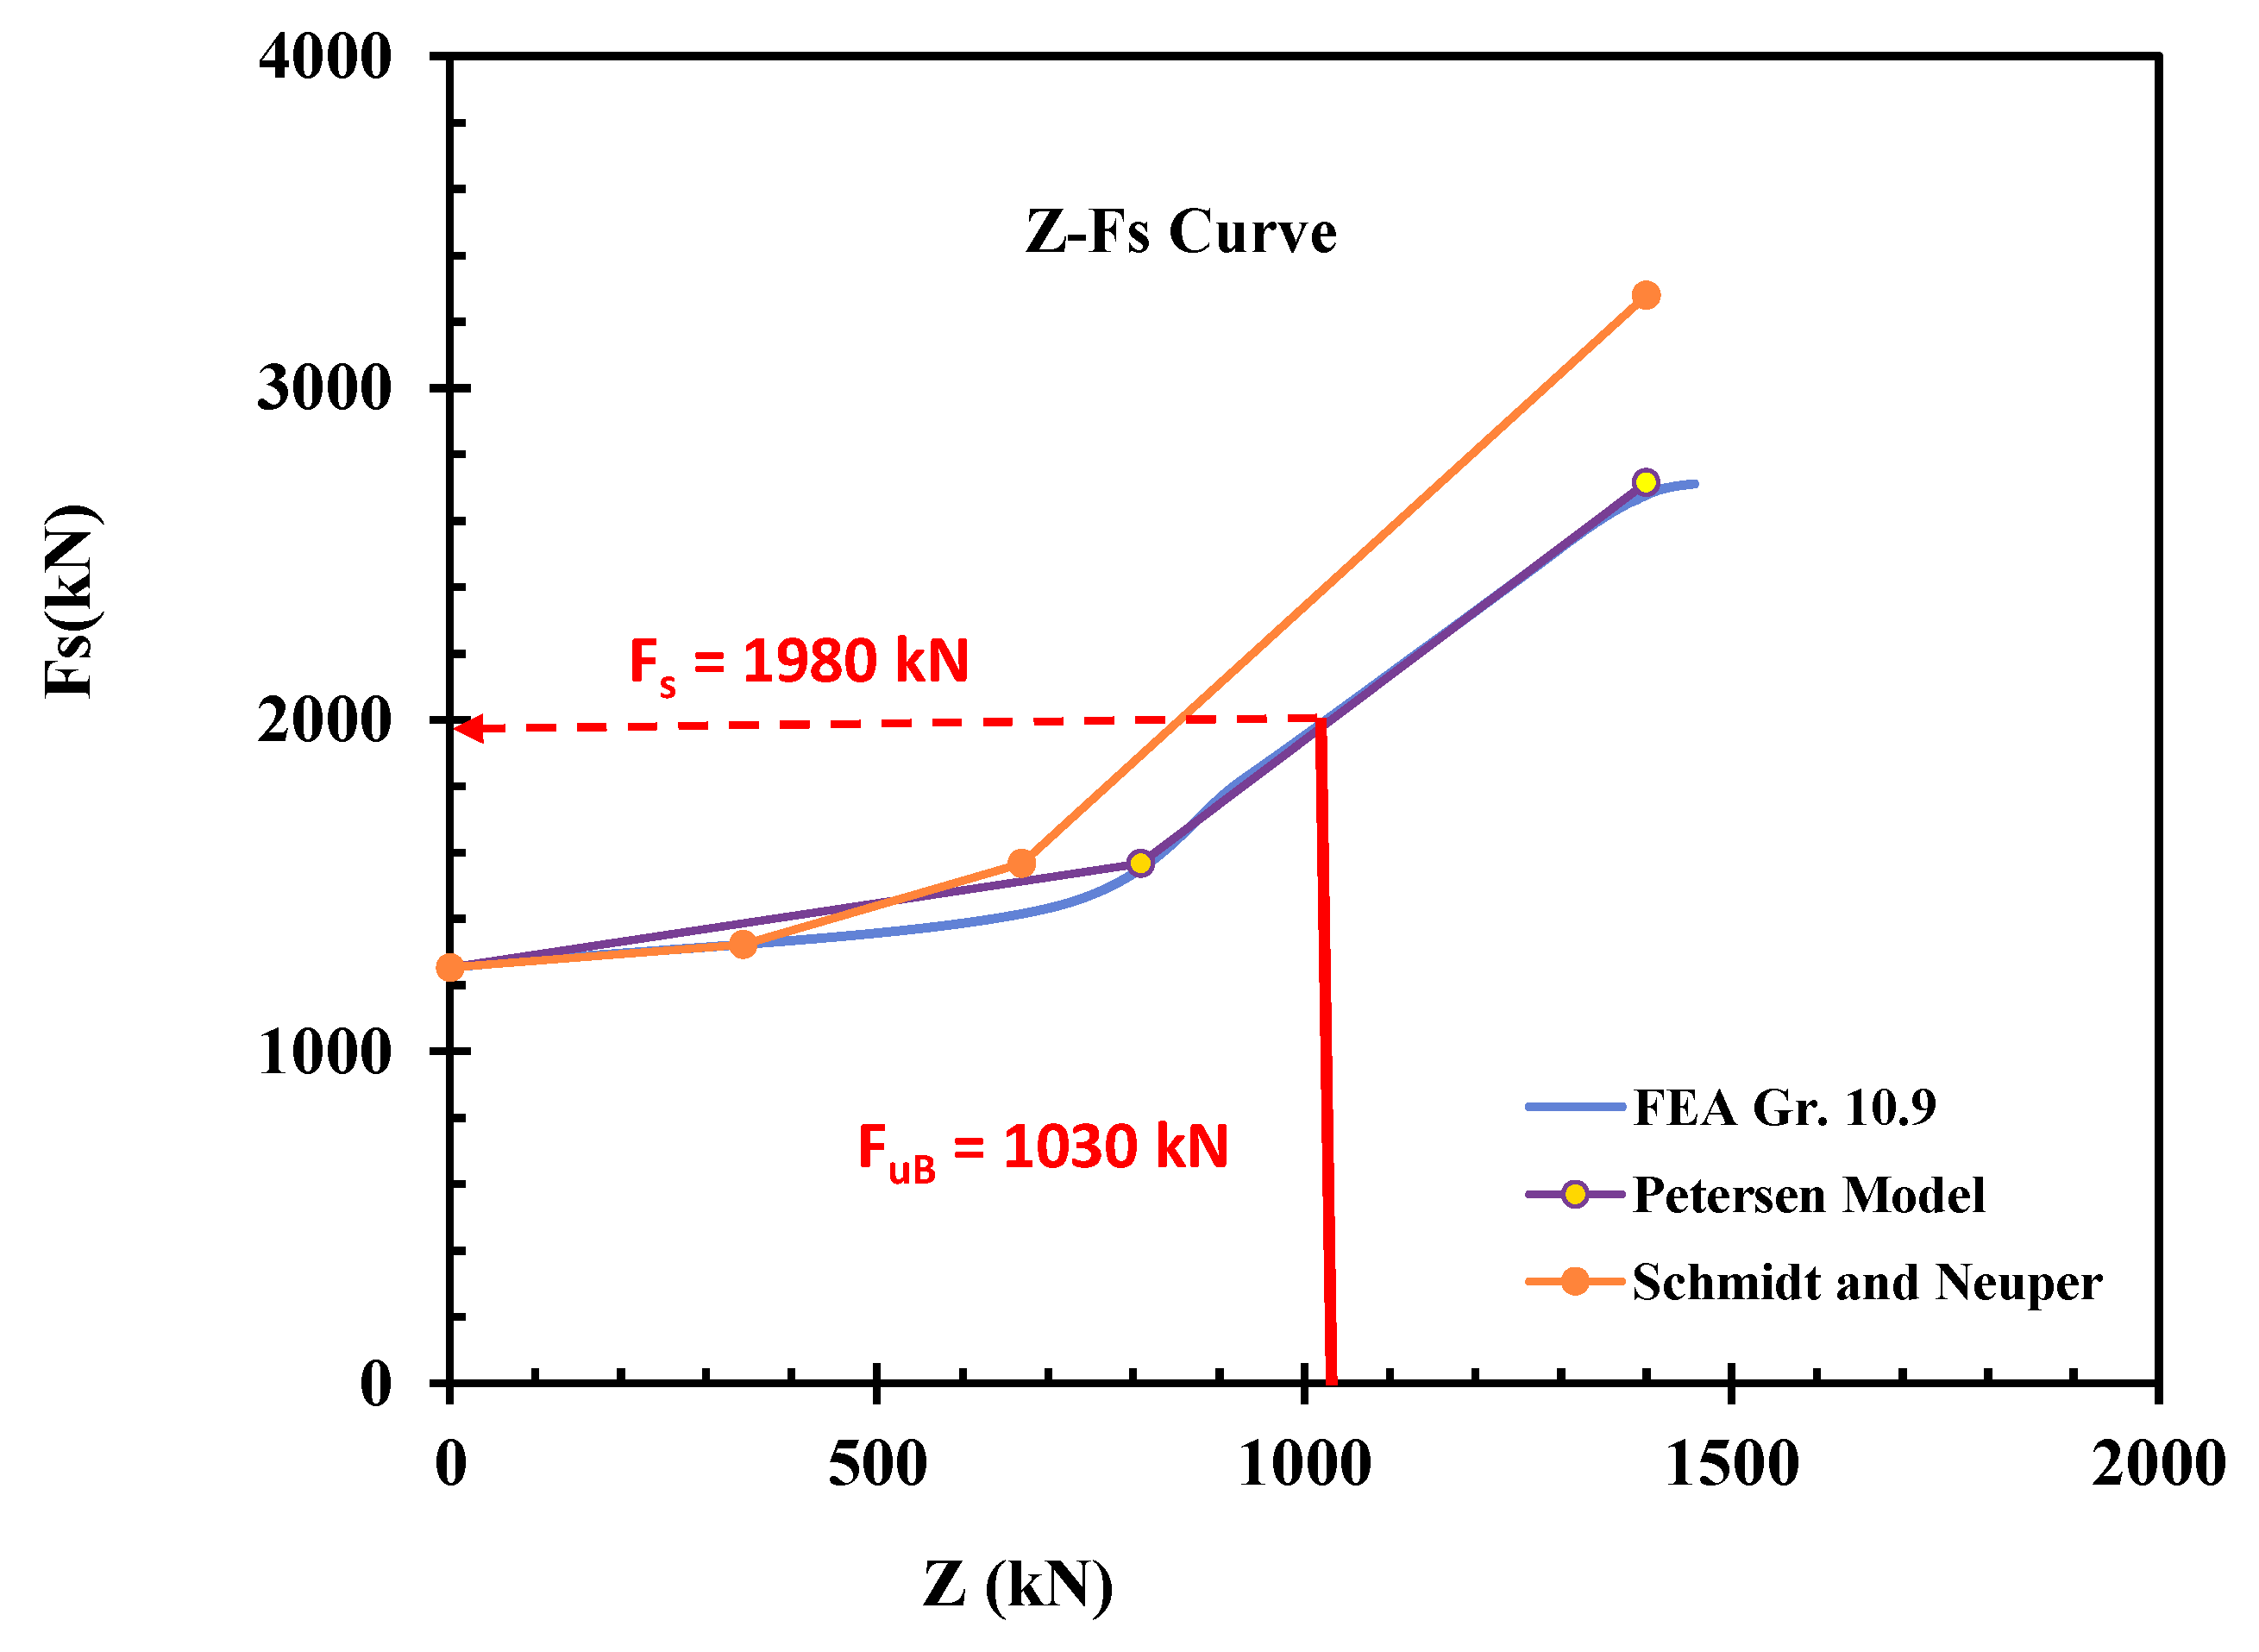
4.6.2. Z-Fs Curve Grade 10.9 Bolt
To assess the validity of the numerical simulations, the Z-Fs relationship for Grade 10.9 bolts was compared against two popular analytical models: the Petersen model and the Schmidt and Neuper model. The Z-Fs relationship explains how the internal bolt force (Fs) changes with an externally applied tensile load (Z) and gives information about load transfer efficiency and bolt response under various loading conditions. Through FEA, as we know, the preload force is 1240 kN and the design allowable tensile value Fu,B (=1030 kN), so the bolt internal load Fs is approximately 1980 kN
Figure 13 shows the correlation between FEA predictions and the Schmidt and Neuper model. The Petersen model, under the linear elastic response assumption, gives a practically linear variation in internal bolt load (F
s) with increasing external load (Z). This is a valid assumption for low to moderate loads under which the Schmidt and Neuper, and FEA results coincide with each other. Yet, if the applied load gets close to the ultimate capacity of the bolt, the variations between the two curves are noticeable. The result of FEA shows slight nonlinearity at the Z-F
s curve owing to localized plastic deformations as well as the redistribution of stress at the near bolt threads areas, which cannot be quantified by the Schmidt and Neuper model. This implies that although the Schmidt and Neuper model gives a good first-order approximation, it does not completely represent the intricate stress–strain interactions that evolve at elevated loads in high-strength bolts.
In
Figure 13, the comparison is shown between the results of the FEA and the Petersen model. As opposed to the Petersen model, the Petersen model includes joint flexibility, bolt elongation, and localized deformations, so it is a more advanced method for predicting the Z-F
s relationship. Consequently, the FEA and Petersen model ‘s Z-F
s curves are in close agreement throughout the whole loading range with minimal divergences at high loads. These small differences are brought about by material nonlinearity and stress redistribution, which are well represented in FEA but only approximated in the analytical model. Despite these small differences, the Petersen model is found to be more accurate in simulating load transfer characteristics for Grade 10.9 bolts than the Petersen model as shown in
Figure 14.
The comparative study emphasizes the advantages and disadvantages of analytical models in simulating bolt load transfer behavior. Although the Schmidt and Neuper model provides a quick and easy approximation, it cannot accommodate localized plasticity and nonlinear effects. The Petersen model, with its more sophisticated approach, shows better correlation with FEA results and is, thus, a more accurate analytical tool for calculating the Z-Fs relationship in bolted joints.
In general, the analysis highlights the need to incorporate finite element simulations with analytical models to build a solid understanding of bolt behavior. Whereas analytical models serve as useful estimating tools, FEA is vital for predicting bolted joint performance in real applications under different loading and pretension conditions.
A comparison of the Z-Fs curves reveals that the FEA results and Petersen model show very close agreement, particularly across low to high external load ranges, with deviations generally within 2–4%. This indicates that the Petersen model effectively captures the joint compliance and bolt elongation behavior under static axial tension, making it a suitable analytical method for approximating bolt load transfer in high-strength connections. In contrast, the Schmidt and Neuper model shows noticeable deviation from the FEA curve, particularly at higher external loads. This difference arises because the Schmidt and Neuper formulation accounts for idealized linear elastic behavior and includes broader assumptions regarding the stiffness distribution across bolt and flange interfaces. While it is useful for preliminary analysis, it does not fully capture the nonlinear effects and localized deformations observed in FEA results, especially near the yield limit of the bolts. Hence, although all three approaches follow the same trend initially, only the FEA and Petersen model maintain accuracy at elevated loads where geometric and material nonlinearity become dominant
5. Conclusions
This study comprehensively investigated the structural performance of L-type flange joints using Grade 10.9 and Grade 12.9 bolts, with numerical simulations to analyze force–displacement behavior, strain distribution, and Z-Fs relationships. The results provided valuable insights into the mechanical characteristics of these bolts and their interactions with flange joint components under varying bolt pretension.
The results showed that there was a major distinction between the two grades of bolt. The grade 10.9 bolts had a ductile failure mode that was characterized by linear distribution of stress and strain with gradual load transfer and predictable deformation. This ductility allowed for the energy absorption of bolts during joint deformation. These are highly effective in application areas where deformation tolerance and failure predictability are critical. The Z-Fs analysis and the measurements of the strains ensured their extensibility and elasticity under changing loading conditions.
In contrast, Grade 12.9 bolts showed higher load-carrying capacity and stiffness, with higher peak forces in simulations. However, the increased stiffness led to localized stress concentrations near the threads and bolt head, causing abrupt failures and reduced ductility. These characteristics make Grade 12.9 bolts suitable for high-load applications but require careful pretension control and consideration of flange material properties to avoid localized failures. It can be deduced that the finite element analysis approach utilized in the study is accurate and reliable because of the good agreement between the simulation. Simulations reproduced what was theoretically observed, such as force–displacement curves, strain patterns, and Z-Fs relationships, providing a more robust framework for future design and analysis of bolted L-type flange joint assemblies.
Based on the findings, specific pretension control ranges are recommended to ensure joint reliability while minimizing the risk of material fatigue or brittle failure:
For Grade 10.9 bolts, bolt pretension in the range of 60–100% of the recommended design preload (1240 kN) provides sufficient ductility and deformation tolerance for static load conditions.
For Grade 12.9 bolts, a more conservative pretension range of 50–85% of the full preload (1500 kN) is advised to avoid localized stress concentrations and thread failure due to reduced ductility.
These ranges ensure that the joint benefits from increased stiffness without compromising the long-term integrity of the bolt or flange.
Regarding marine environment adaptability, high-strength bolts used in offshore wind turbines must account for corrosive salt spray, temperature-induced stress fluctuations, and humidity-driven material degradation. While Grade 12.9 bolts offer superior strength, their higher carbon content and reduced ductility can make them more vulnerable to stress corrosion cracking and hydrogen embrittlement. It is recommended to use protective coatings.


