Article

Probabilistic Prediction of Spudcan Bearing Capacity in Stiff-over-Soft Clay Based on Bayes’ Theorem

1
College of Ocean Science and Engineering, Shanghai Maritime University, Shanghai 201306, China
2
Zhejiang Huichuan Water Conservancy Engineering Technology Co., Ltd., Hangzhou 310020, China
3
Shanghai Jian Qiao University, Shanghai 201306, China
*
Author to whom correspondence should be addressed.
J. Mar. Sci. Eng. 2025, 13(7), 1344; https://doi.org/10.3390/jmse13071344
Submission received: 17 June 2025 / Revised: 9 July 2025 / Accepted: 11 July 2025 / Published: 14 July 2025
(This article belongs to the Section Ocean Engineering)

Abstract

During offshore operations of jack-up platforms, the spudcan may experience sudden punch-through failure when penetrating from an overlying stiff clay layer into the underlying soft clay, posing significant risks to platform safety. Conventional punch-through prediction methods, which rely on predetermined soil parameters, exhibit limited accuracy as they fail to account for uncertainties in seabed stratigraphy and soil properties. To address this limitation, based on a database of centrifuge model tests, a probabilistic prediction framework for the peak resistance and corresponding depth is developed by integrating empirical prediction formulas based on Bayes’ theorem. The proposed Bayesian methodology effectively refines prediction accuracy by quantifying uncertainties in soil parameters, spudcan geometry, and computational models. Specifically, it establishes prior probability distributions of peak resistance and depth through Monte Carlo simulations, then updates these distributions in real time using field monitoring data during spudcan penetration. The results demonstrate that both the recommended method specified in ISO 19905-1 and an existing deterministic model tend to yield conservative estimates. This approach can significantly improve the predicted accuracy of the peak resistance compared with deterministic methods. Additionally, it shows that the most probable failure zone converges toward the actual punch-through point as more monitoring data is incorporated. The enhanced prediction capability provides critical decision support for mitigating punch-through potential during offshore jack-up operations, thereby advancing the safety and reliability of marine engineering practices.

1. Introduction

Jack-up drilling platforms have been widely utilized in the oil and gas industry due to their advantages of low cost, high mobility, reusability, and strong adaptability to harsh marine environments. In layered stiff-over-soft clay stratum, the penetration resistance of spudcans may decrease rapidly at a certain depth due to the influence of the underlying soft layer. At this critical stage, the preload cannot be immediately removed, leading to a scenario where the applied load exceeds the foundation’s ultimate bearing capacity. It results in rapid spudcan penetration through the stiff layer into the soft layer, a phenomenon termed punch-through failure [1]. Such incidents can cause leg buckling, platform tilting, or even catastrophic platform capsizing, as evidenced by historical accidents.
Currently, both the ISO standard and SNAME Recommended Practice recommend empirical methods for predicting the penetration resistance in stiff-over-soft clay [2,3]. However, traditional deterministic methods often fail to account for the inherent uncertainties in soil properties, spatial variability, and model limitations, leading to discrepancies between the predicted and observed penetration behaviors [4,5]. To address this limitation, extensive research has been conducted. Hossain and Randolph (2010) conducted centrifuge tests and LDFE analyses on spudcan penetration in stiff-over-soft clays, proposing a design method for predicting punch-through resistance profiles [6,7]. Tjahyono (2011) also conducted an experimental and numerical study on spudcan penetration in stiff clay overlying soft clay [8]. However, their model assumed non-softening plasticity for clay, leading to overestimated resistance profiles. Zheng et al. (2016, 2018) advanced this further by incorporating strain softening and rate dependency into LDFE parametric studies, developing a design method (noted as the “Zheng method” in this paper) to predict peak resistance and its corresponding depth [9,10]. Li et al. (2024) conducted numerical simulations of spudcan penetration in stiff-over-soft clay using the Eulerian–Lagrangian method, and proposed a method accounting for vertical soil plug movement [11]. They further demonstrated that shear plane inclination varies with soil parameters, and proposed a formula integrating the inclination angle into a modified bearing capacity equation, achieving <5% error in centrifuge validations [12].
Recent advances have focused on integrating probabilistic frameworks to address the uncertainties in offshore geotechnical engineering, particularly for punch-through risks in layered seabeds. The models developed in Uzielli et al. (2017), Li et al. (2018), and Wang et al. (2023) treated the uncertainties in soil parameters as probabilistic distributions, and developed Bayesian models coupled with Monte Carlo simulations to refine prior estimates of peak resistance and its corresponding depth [13,14,15]. By integrating monitored data, they enabled the continuous updating of posterior probabilities. Yang et al. (2020) demonstrated that Bayesian updating reduced prediction errors by 10–30% in sand-over-clay scenarios by assimilating early-stage penetration data [16]. Yang et al. (2023) further developed this approach, establishing a Bayesian framework employing a Metropolis algorithm-based MCMC simulation to statistically quantify seabed characteristics (e.g., sand thickness, friction angle, and clay undrained shear strength profile) directly from monitored spudcan load–penetration data. Validation against centrifuge tests and field installations demonstrated consistent parameter identification with reduced uncertainty [17]. Some other probabilistic assessments employ model factors to quantify uncertainties in deterministic equations. Yang et al. (2017) specifically addressed the probabilistic prediction of punch-through distance in sand-over-clay, characterizing uncertainties in soil parameters using experimental and numerical databases and propagating them through deterministic models via Monte Carlo simulation to estimate its possible range and distribution, with validation against centrifuge tests [18]. Jiang et al. (2020) introduced a parameter estimation technique (PET) that optimizes soil strength parameters using measured resistances, attributing discrepancies to uncertainties in the undrained shear strength of clay and the effective friction angle of sand [19]. Similarly, Zheng et al. (2021) modified stress-dependent models by incorporating depth factors and soil plug effects, achieving improved agreement with centrifuge test data [20]. Yang et al. (2024) expanded this approach by integrating Kalman filtering and segmented adaptive linearization, enabling dynamic updates of the peak resistance and depth across multi-layered soils [21]. Random Finite Element Methods (RFEM) have been applied to simulate spatially variable soil properties [22,23]. Fallah et al. (2015) used Latin Hypercube Sampling (LHS) with Coupled Eulerian–Lagrangian (CEL) finite element analysis to predict spudcan penetration depth distributions, showing that uncertainties in the undrained shear strength profiles significantly affect penetration variability [22].
Although there have been probabilistic methods taking into account the randomness of soil parameters, the probabilistic prediction of spudcan penetration resistance in stiff-over-soft clay is still limited. Additionally, the effects of monitoring data on real-time updating accuracy are lacking in previous studies. Based on centrifuge test data, this study proposes a probabilistic prediction method for the spudcan penetration resistance in stiff-over-soft clay based on Bayes’ theorem. The effects of the determined method choice and the monitoring points are also investigated.

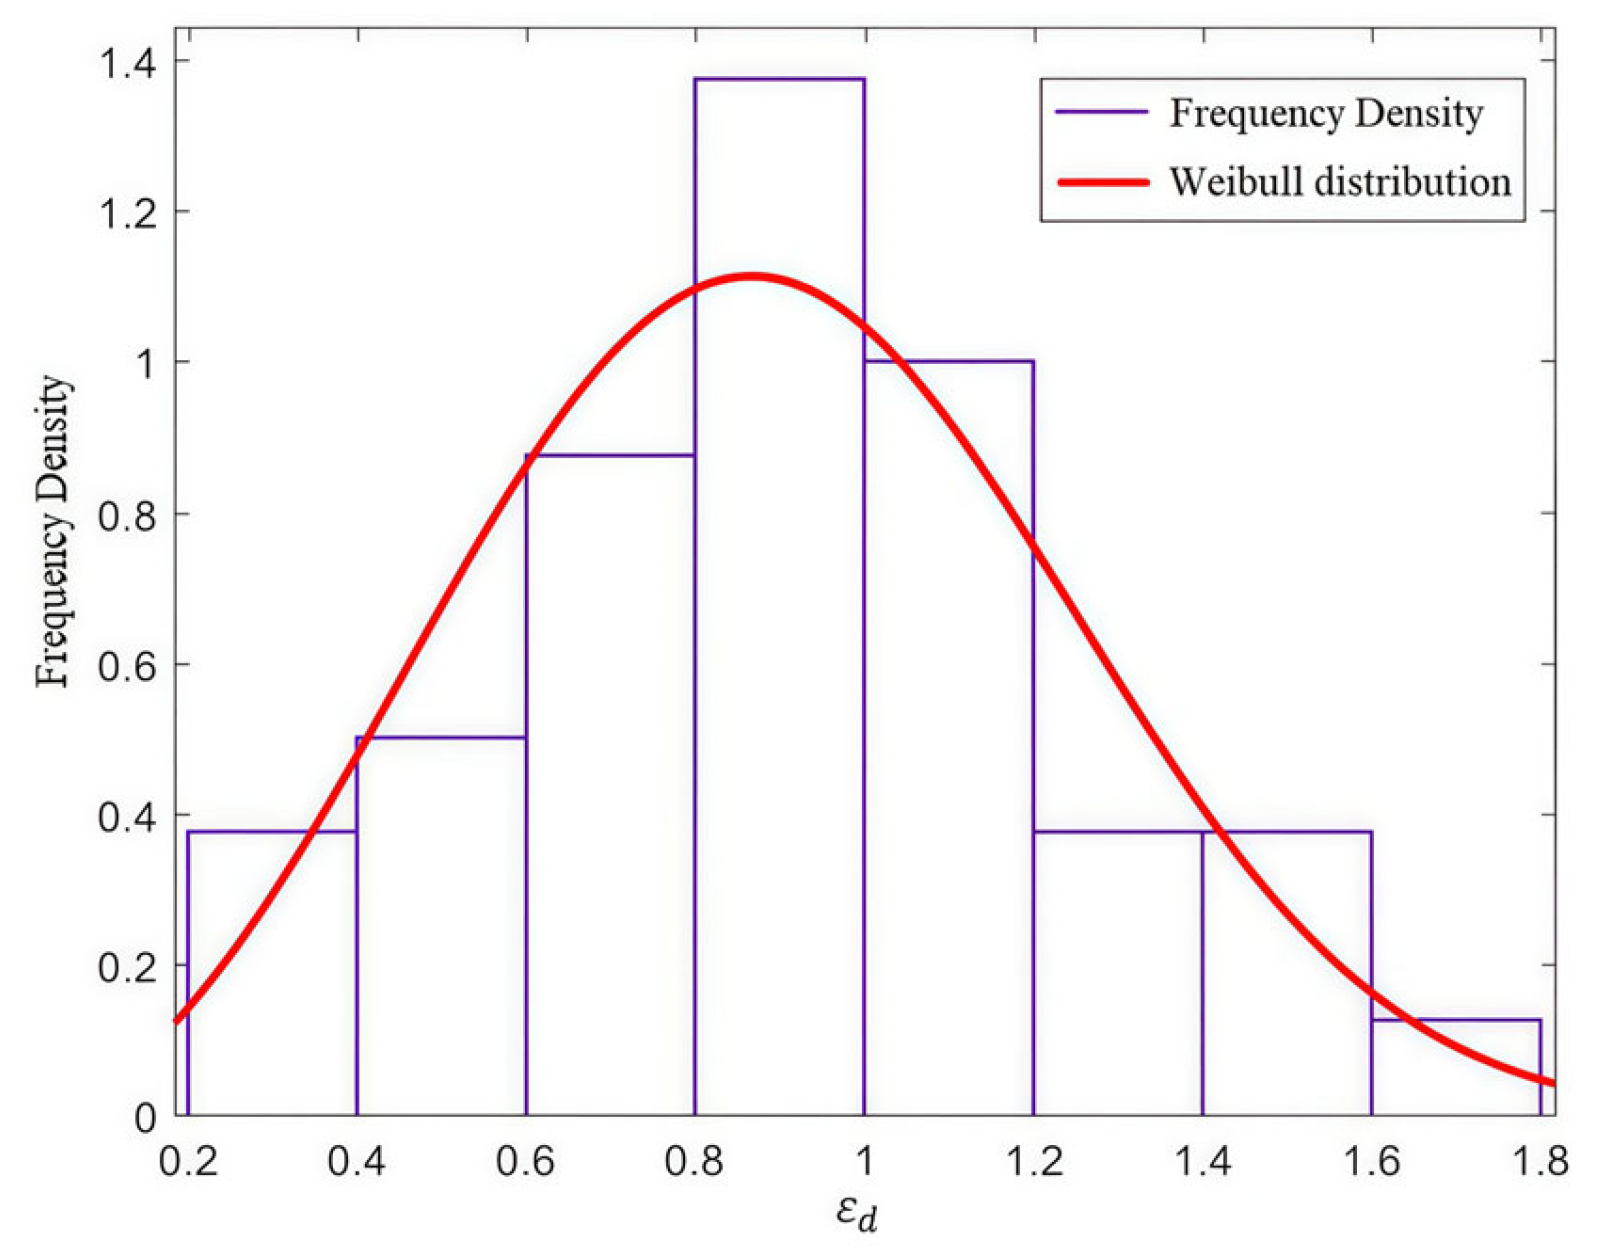
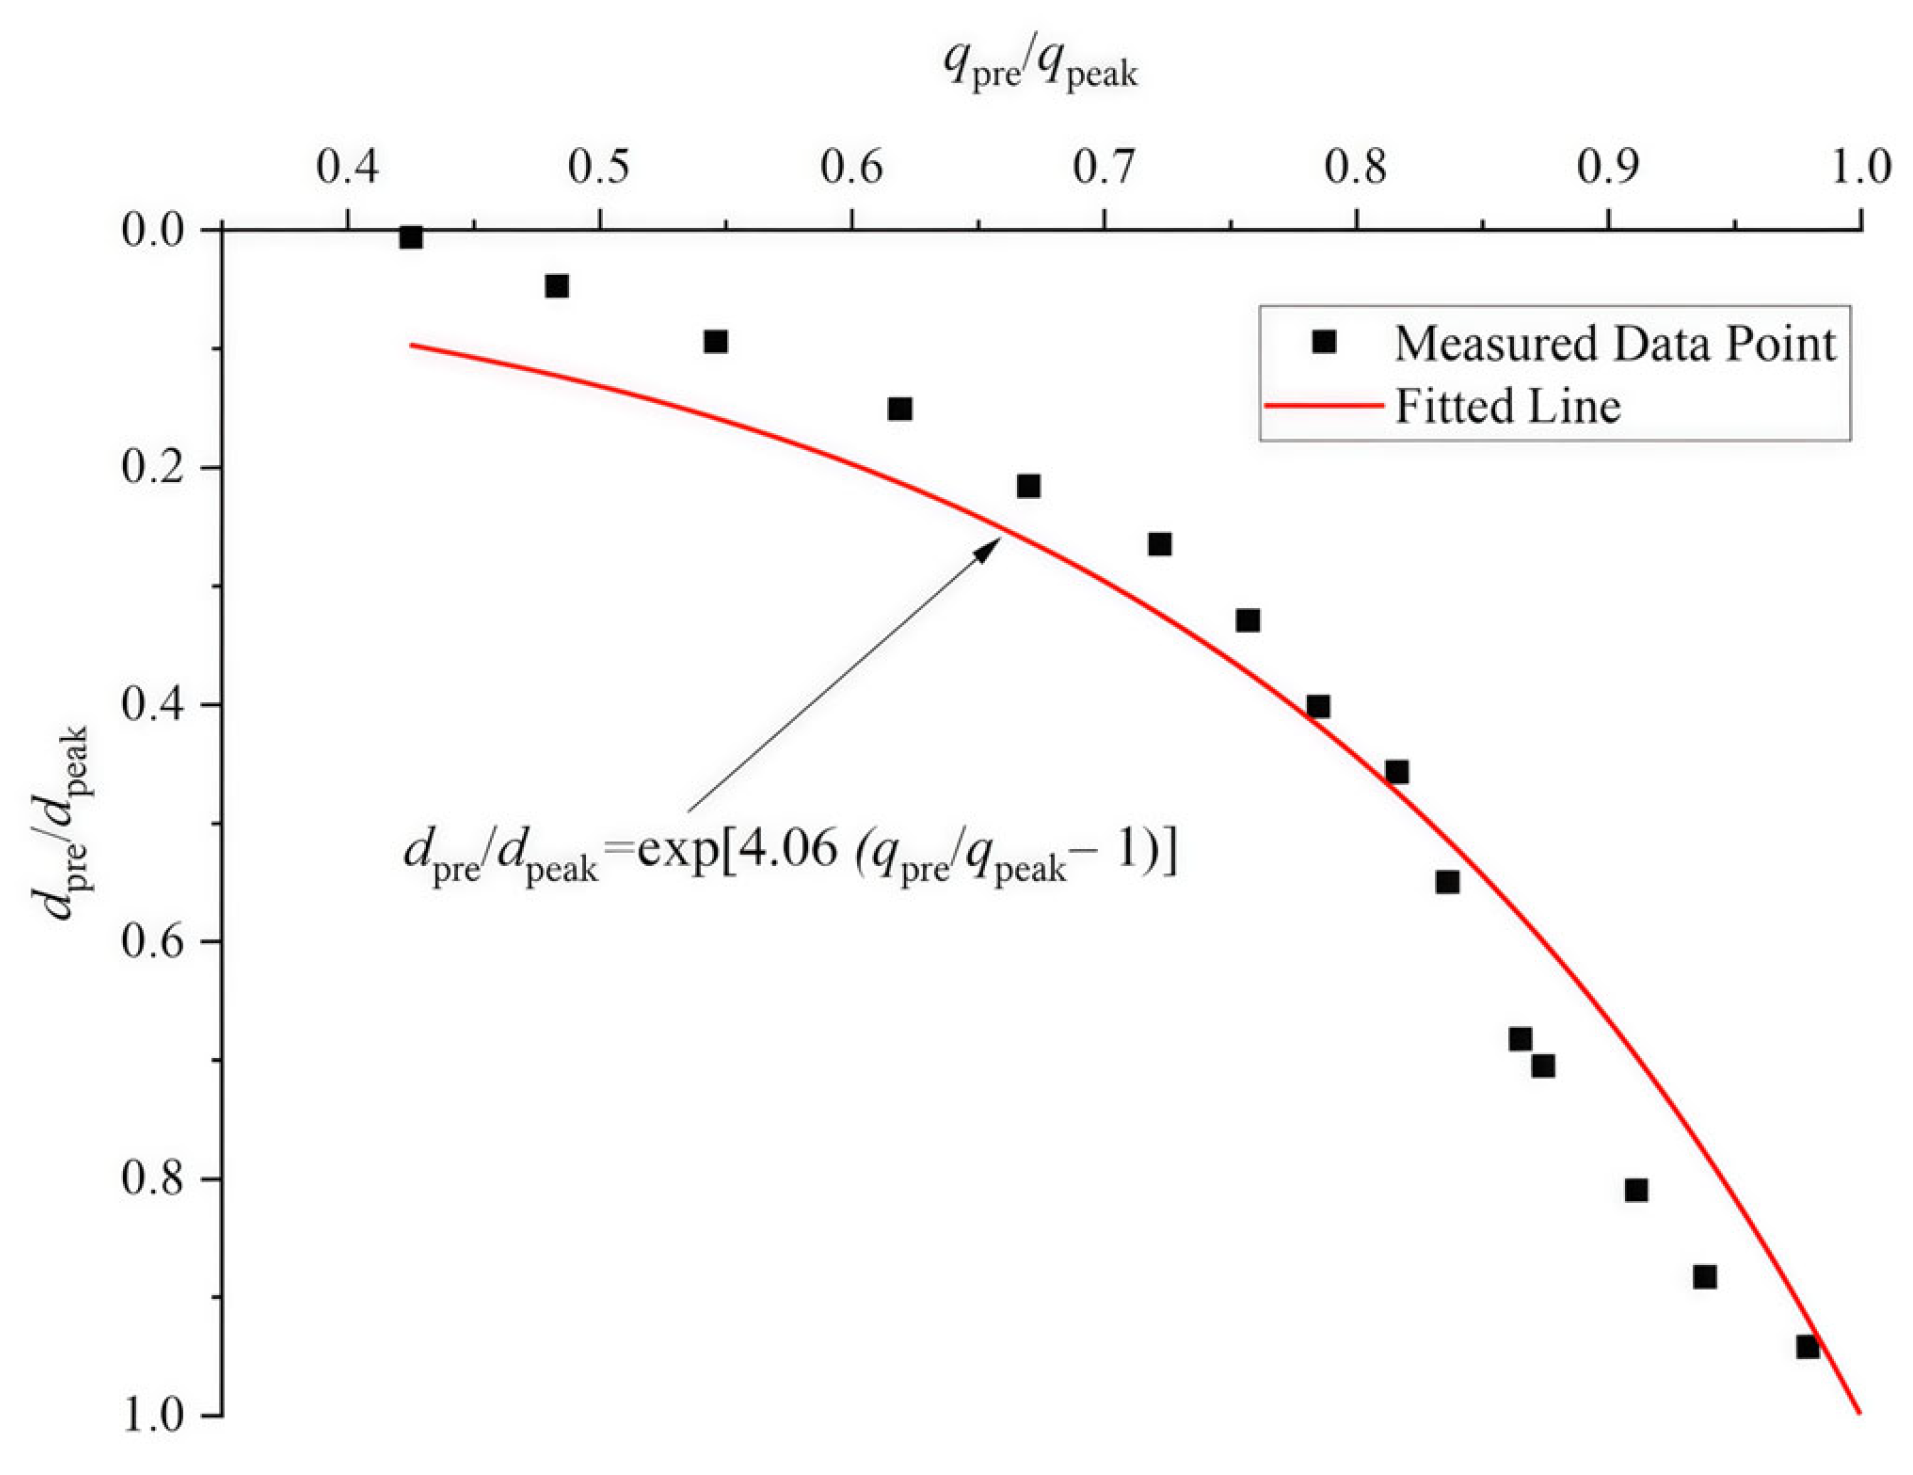
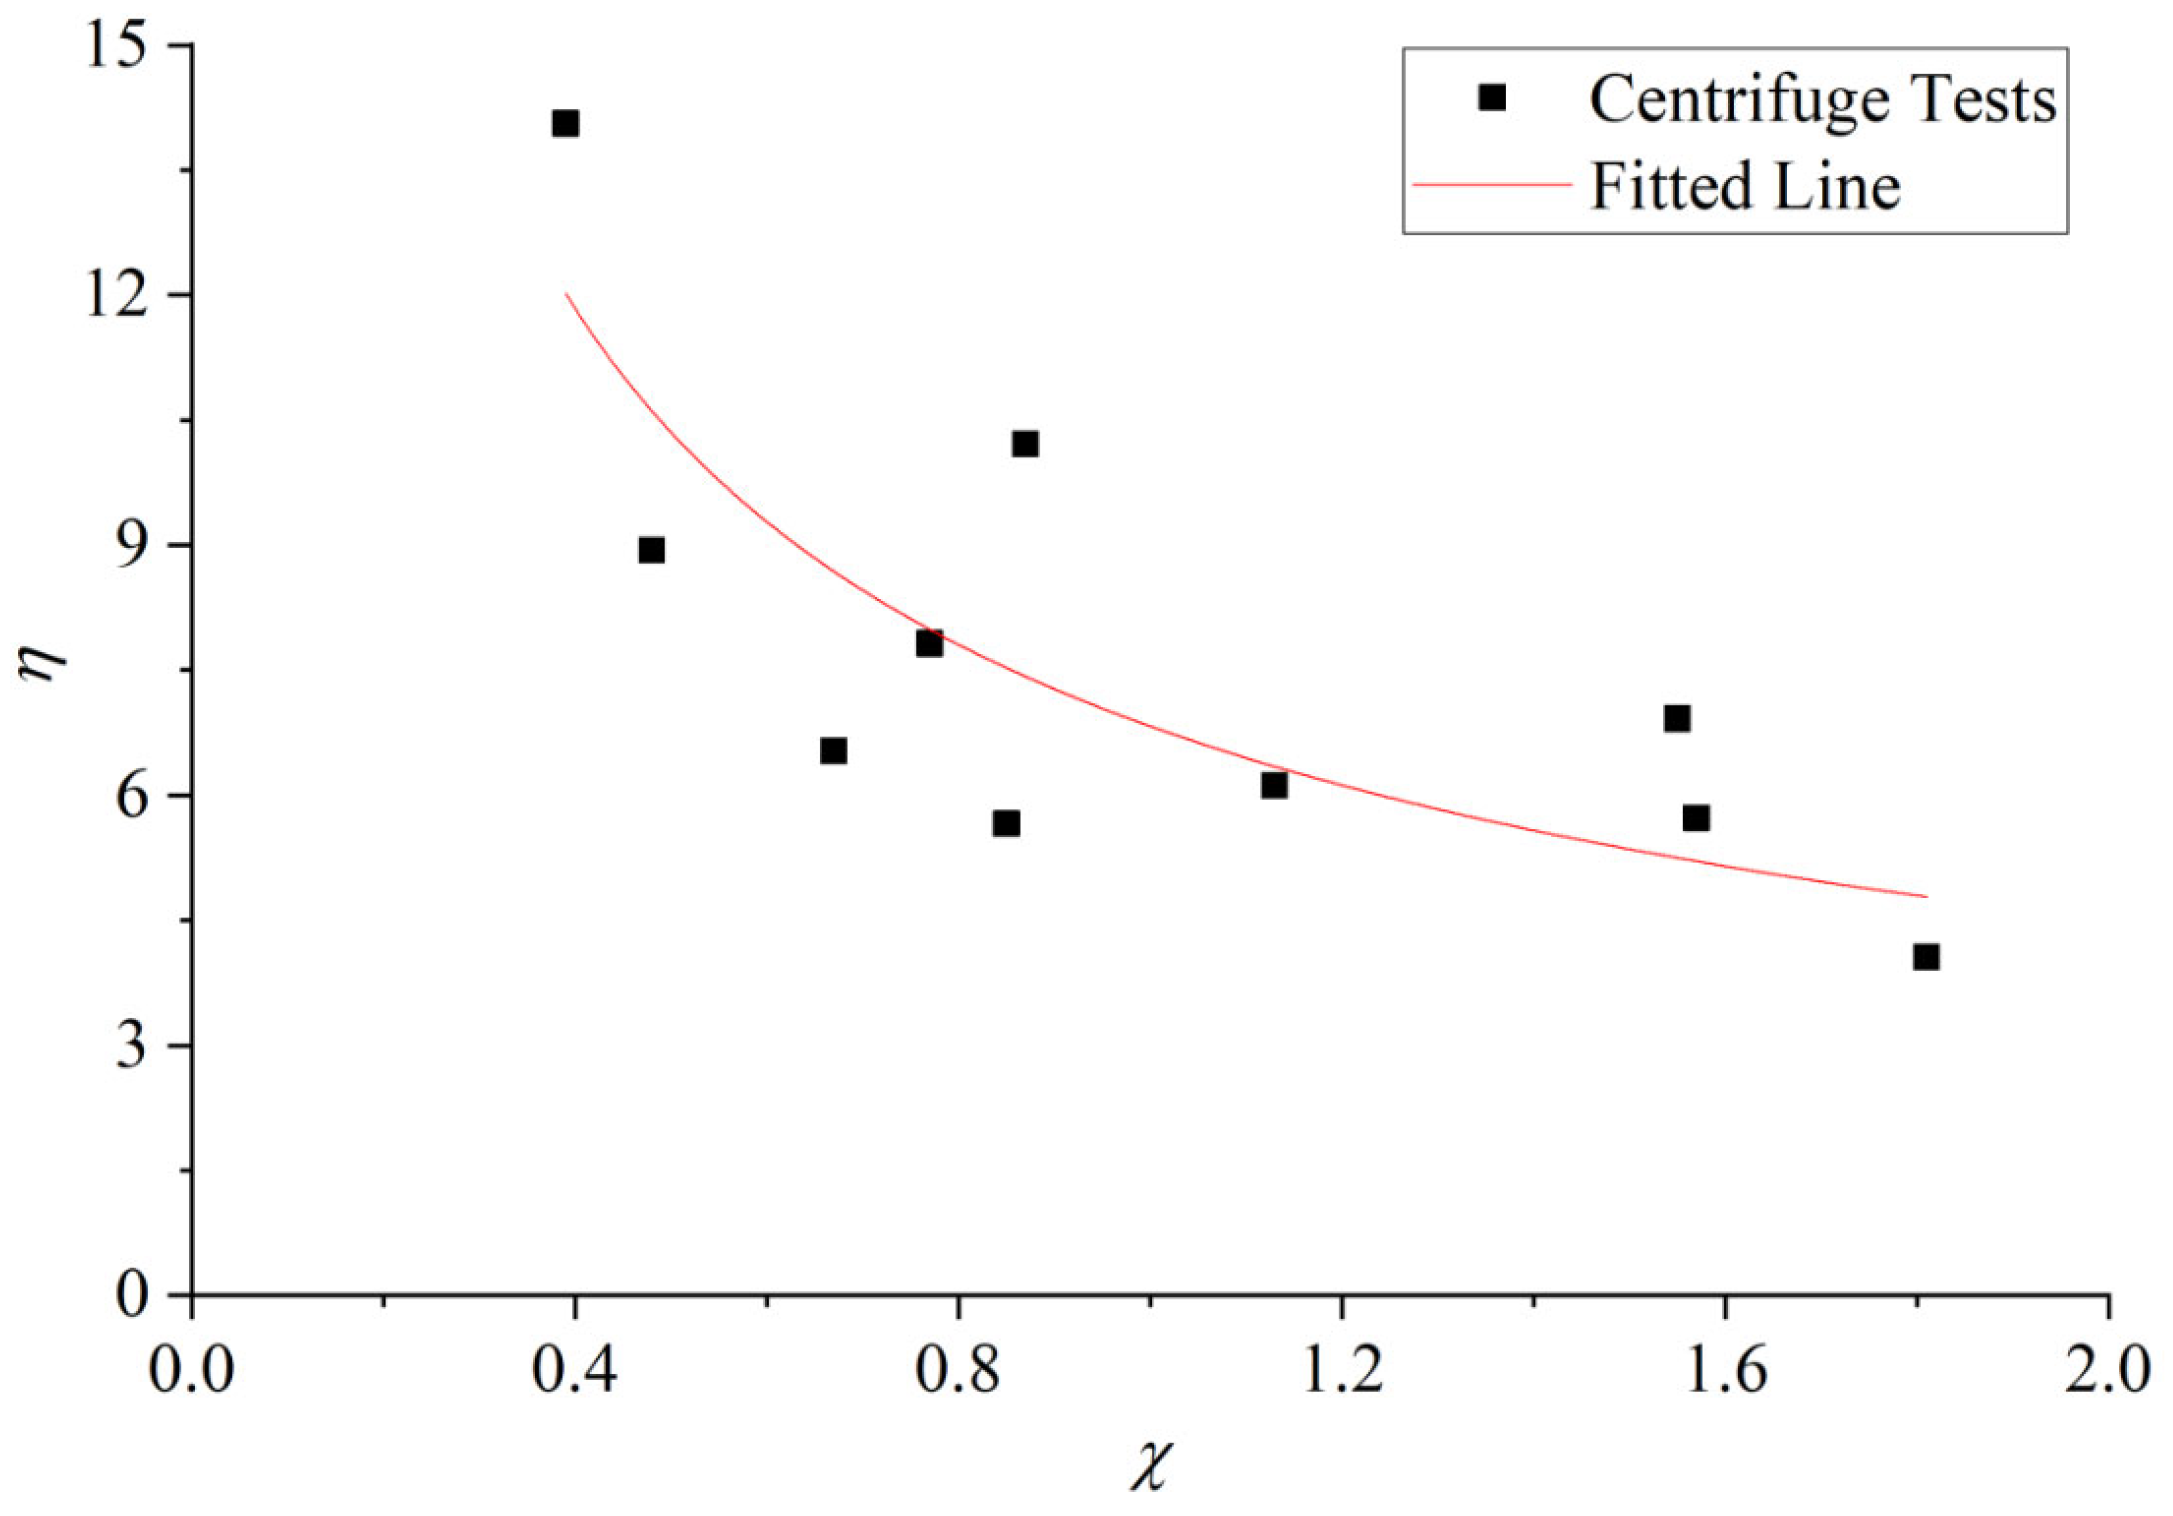
2. Uncertainties of Empirical Prediction

This study utilizes data from 40 centrifuge tests to predict the peak resistance q p e a k and its corresponding depth d p e a k using two empirical formulas. To quantify prediction uncertainties, uncertainty factors ε q and ε d are defined. MATLAB (R2022a)—based fitting revealed that these factors follow Weibull distributions, which then served to quantify model uncertainty. A Bayesian predictive model was subsequently developed. First, leveraging the fitted Weibull distributions, a large number of ε q and ε d samples were generated. Prior probability distributions were constructed using interval discretization and joint probability calculations. Second, the load–displacement model was fitted to the experimental data, incorporating a dimensionless parameter χ representing soil properties. The parameters of χ were determined using Generalized Least Squares (GLS) regression. Given the model bias coefficient’s normal distribution characteristics, a Monte Carlo simulation was used to generate predicted depths d p r e d . Likelihood probabilities were calculated based on defined deviation criteria. Finally, applying Bayes’ theorem, the prior probabilities and likelihood probabilities were fused to obtain the updated posterior probability distribution. This model enables continuous iterative updating as new monitoring data becomes available. The analytical process of the probabilistic prediction model is shown in Figure 1.
The prediction of peak resistance q p e a k for spudcan penetration in stiff-over-soft strata adopts two empirical methods: the ISO-recommended method [2] and the Zheng method [9]. The corresponding peak resistance depth d p e a k (i.e., the penetration depth corresponding to the maximum cross-section of the spudcan) is calculated using the Zheng method. The peak resistance prediction formula of the ISO method is given in Equation (1), while the peak resistance formula and penetration depth formula of the Zheng method are detailed in Equations (2) and (3), respectively.
q p e a k = 3 H B   S u , t + N c s c 1 + 0.2 D + H B S u , b + p 0 ,
q p e a k S u b s = 6.35 + 5 S u , s S u , t 1 H B 0.75 1 + k D S u , s 0.5 0.77 ,
d p e a k D = 1.3 S u , b S u , t 1.5 H B 1 + k B S u , b 0.5 ,
where N c is the bearing capacity coefficient, specified as 5.14 in the ISO standard; S u , b is the undrained shear strength of the underlying soft clay; S u , t is the undrained shear strength of the overlying stiff clay; D is the penetration depth of the spudcan below sea floor; H is the thickness of the stiff layer; B is the effective spudcan diameter; s s is the shape coefficient; p 0 is the overburden effective pressure; and k is the undrained shear strength gradient in the soft clay layer.
Based on 40 sets of centrifuge model test [7,8], the test data are extracted, and the values are calculated with the two empirical methods. The results are summarized in Table 1. Statistical analysis was conducted to quantify the deviations between the predicted and experimental results. The deviation histograms are illustrated in Figure 2 and Figure 3. To characterize the uncertainties in the predictions, two model uncertainty factors, e.g., ε q for the peak resistance and ε d for the punch-through depth, are introduced. These factors are defined as follows:
q p e a k , m e a = q p e a k , c a l · ε q ,
d p e a k , m e a = d p e a k , c a l · ε d ,
where q p e a k , m e a and d p e a k , m e a are the experimentally measured peak resistance and punch-through depth in centrifuge tests; and q p e a k , c a l and d p e a k , c a l are the predicted values using Equations (1)–(3), respectively.
As illustrated in Figure 2, the deviation histograms between the predicted and experimental values of peak resistance and punch-through depth approximate a normal distribution. Based on the MATLAB (R2022a)—based probability distribution and function fitting analyses, the Weibull distribution, a flexible distribution resembling the normal distribution, is adopted to characterize the uncertainty factors ε q and ε d . The probability density function (PDF) of the Weibull distribution is expressed as follows:
f x a , b = b a x a b 1 e x p x a b ,
where x is the random variable ( ε q and ε d in this case), a is the scale parameter, and b is the shape parameter. For both the ISO-recommended method and Zheng method, the best values of a and b are fitted and listed in Table 2.

3. Bayesian Prediction of Peak Resistance

The Bayesian theorem can predict the probability of coming events based on observed data. For the prediction of peak spudcan penetration resistance, the probability of peak resistance could be predicted based on the monitored penetration resistance before it reaches the peak resistance. In the context of this study, the Bayesian formula is described as follows:
P q p i , d p j q m o n , d m o n = P q p i , d p j   P q m o n , d m o n q p i , d p j i . j P q p i , d p j P q m o n , d m o n q p i , d p j ,
where q p i is the i-th potential peak resistance; d p j is the j-th potential penetration depth; q m o n and d m o n are the penetration resistance and depth monitored during spudcan penetration; and P q p i , d p j , P q m o n , d m o n q p i , d p j , and P q p i , d p j q m o n , d m o n are the prior probability, the likelihood probability, and the posterior probability. The prior probability represents the probability of spudcan foundation punch-through failure occurring at ( q p i , d p j ). The likelihood probability indicates the probability of ( q m o n , d m o n ) observed under the condition of punch-through failure at ( q p i , d p j ). The posterior probability represents the probability of punch-through failure at ( q p i , d p j ) given the monitored data ( q m o n , d m o n ) during spudcan penetration.

3.1. Prior Probability

The prior probability predicts potential spudcan punch-through. Given that the uncertainty parameters of peak resistance and punch-through depth follow a Weibull distribution, Np random numbers of ε q and ε d are first generated. Substituting them into Equations (4) and (5) yields Np predicted peak resistances q p e a k , r a n d and corresponding punch-through depths d p e a k , r a n d . Then they are equally divided into M intervals. For each interval, the rightmost endpoint is selected as the representative value, i.e., potential peak resistance q p i and penetration depth d p j . By calculating the frequency of representative data points within each interval, the marginal probability estimates P q p i and P d p j are obtained. The prior probability of punch-through failure at q p i , d p j is the joint probability of P q p i and P d p j .
P q p i , d p j = P q p i · P d p j ,

3.2. Likelihood Probability

As per Equation (7), the likelihood probability P q m o n , d m o n q p i , d p j evaluates the consistency between the predicted penetration values and the observed penetration depths during installation, assuming punch-through failure occurs at d p j . This requires probabilistic modeling of the load–displacement behavior during spudcan penetration.
In this study, the load–displacement behavior is modeled using experimental data curves. Based on 40 centrifuge model test results, the pre-peak resistance and penetration depth are normalized by their respective peak values. After analyzing the characteristics of the pre-peak penetration–resistance profile, a single-parameter formula, Equation (9), is proposed to describe the profile. The parameter η is a function of the dimensionless parameter χ which takes into account the undrained shear strength of the stiff and soft layer, the thickness of the stiff layer, and the spudcan diameter.
d p r e d p e a k = e x p η · q p r e q p e a k 1 ,
where d p r e is the pre-peak penetration depth corresponding to pre-peak penetration resistance q p r e ; η is the load–displacement model factor.
For each centrifuge test case, the normalized pre-peak penetration–resistance curve is fitted using the Generalized Least Squares regression to the parameter η , as shown in Figure 4. The distribution of the 40 η are shown in Figure 5. The load–displacement model factor η can be expressed as a function of the soil parameters in Equation (10). The soil parameters are non-dimensionalized as a single parameter χ . With the Generalized Least Squares (GLS) regression based on 40 sets of η and χ , the best fitted values of parameters α and β in Equation (10) are 6.83 and 0.6 , respectively.
η = α · χ β ,   χ = S u b s S u t t D 1 + k D S u b s ,
To describe the randomness of the parameter η , a deviation coefficient ε b is introduced, as in Equation (11). Based on the fitting result, the deviation coefficient ε b obeys a normal distribution with a mean of 0 and variance of 2.65.
η = 6.83 χ 0.6 + ε b
To calculate the likelihood probability, e.g., the probability of [ q mon , d mon ] for a given [ q pi , d pj ], a random set of possible penetration depths d p r e d is generated with the Monte Carlo method, given the monitored resistance q m o n . The generation process is divided into three steps. First, a random set of ε b is generated based on its Weibull distribution function. Then the corresponding set of η is calculated with Equation (11). Finally, the corresponding set of d p r e d is calculated with Equation (9). For each d p r e d , the judgment criteria for hitting the target is that the deviation between d p r e d and d m o n are not larger than Δ d m a x , as formulated in Equation (12). As in Equation (13), Δ d m a x could be expressed as a function of the coefficient of variation C O V d m , which represents the uncertainty range of the monitored penetration depth. A reference value C O V d m   = 0.15 is adopted in the present study, corresponding to a “low to intermediate” uncertainty level [13].
d p r e d d m o n Δ d m a x
Δ d m a x = 3 · d m o n C O V d m
For a given [ q pi , d pj ], Nn possible penetration depths d p r e d are generated for each monitoring point. With Nm monitoring points, the possible penetration depths form an Nm × Nn matrix [ d p r e d ]. The likelihood probability is calculated as the ratio of cases satisfying Equations (12) and (13) among the total Nm × Nn possible cases.

3.3. Posterior Probability

Based on Equation (7), combining the prior probability and the likelihood probability introduced above, the posterior probability P q p i , d p j | q m o n , d m o n is computed. As the spudcan penetrates deeper into stiff–soft strata, the likelihood probability is continuously updated with new monitoring data, and then the posterior probability is updated.

4. Results and Discussion

4.1. Effect of the Empirical Formula Choice

The proposed Bayesian prediction method predicts the probability of peak resistance by combining the “established knowledge” and the monitored data. The so-called “established knowledge” refers to the empirical formulas proposed based on theoretical and experimental studies. To understand the effect of different empirical formulas on the prediction accuracy of the Bayesian method, the centrifuge model test case labeled as E1UU-II-T5 in ref. [6] is taken as an example. The peak resistance of the test case is 141.93 kPa and the corresponding depth is 2.09 m. Regarding the test case, the following analysis is conducted.

4.1.1. Prediction from Empirical Formulas

The ISO-recommended method and Zheng method were used to predict the peak resistance, and Equation (3) was employed to predict the punch-through depth. The results are shown in Table 3. It can be observed that the calculated peak resistance and punch-through failure depths deviate significantly from the experimental values, with large discrepancies between the two methods.

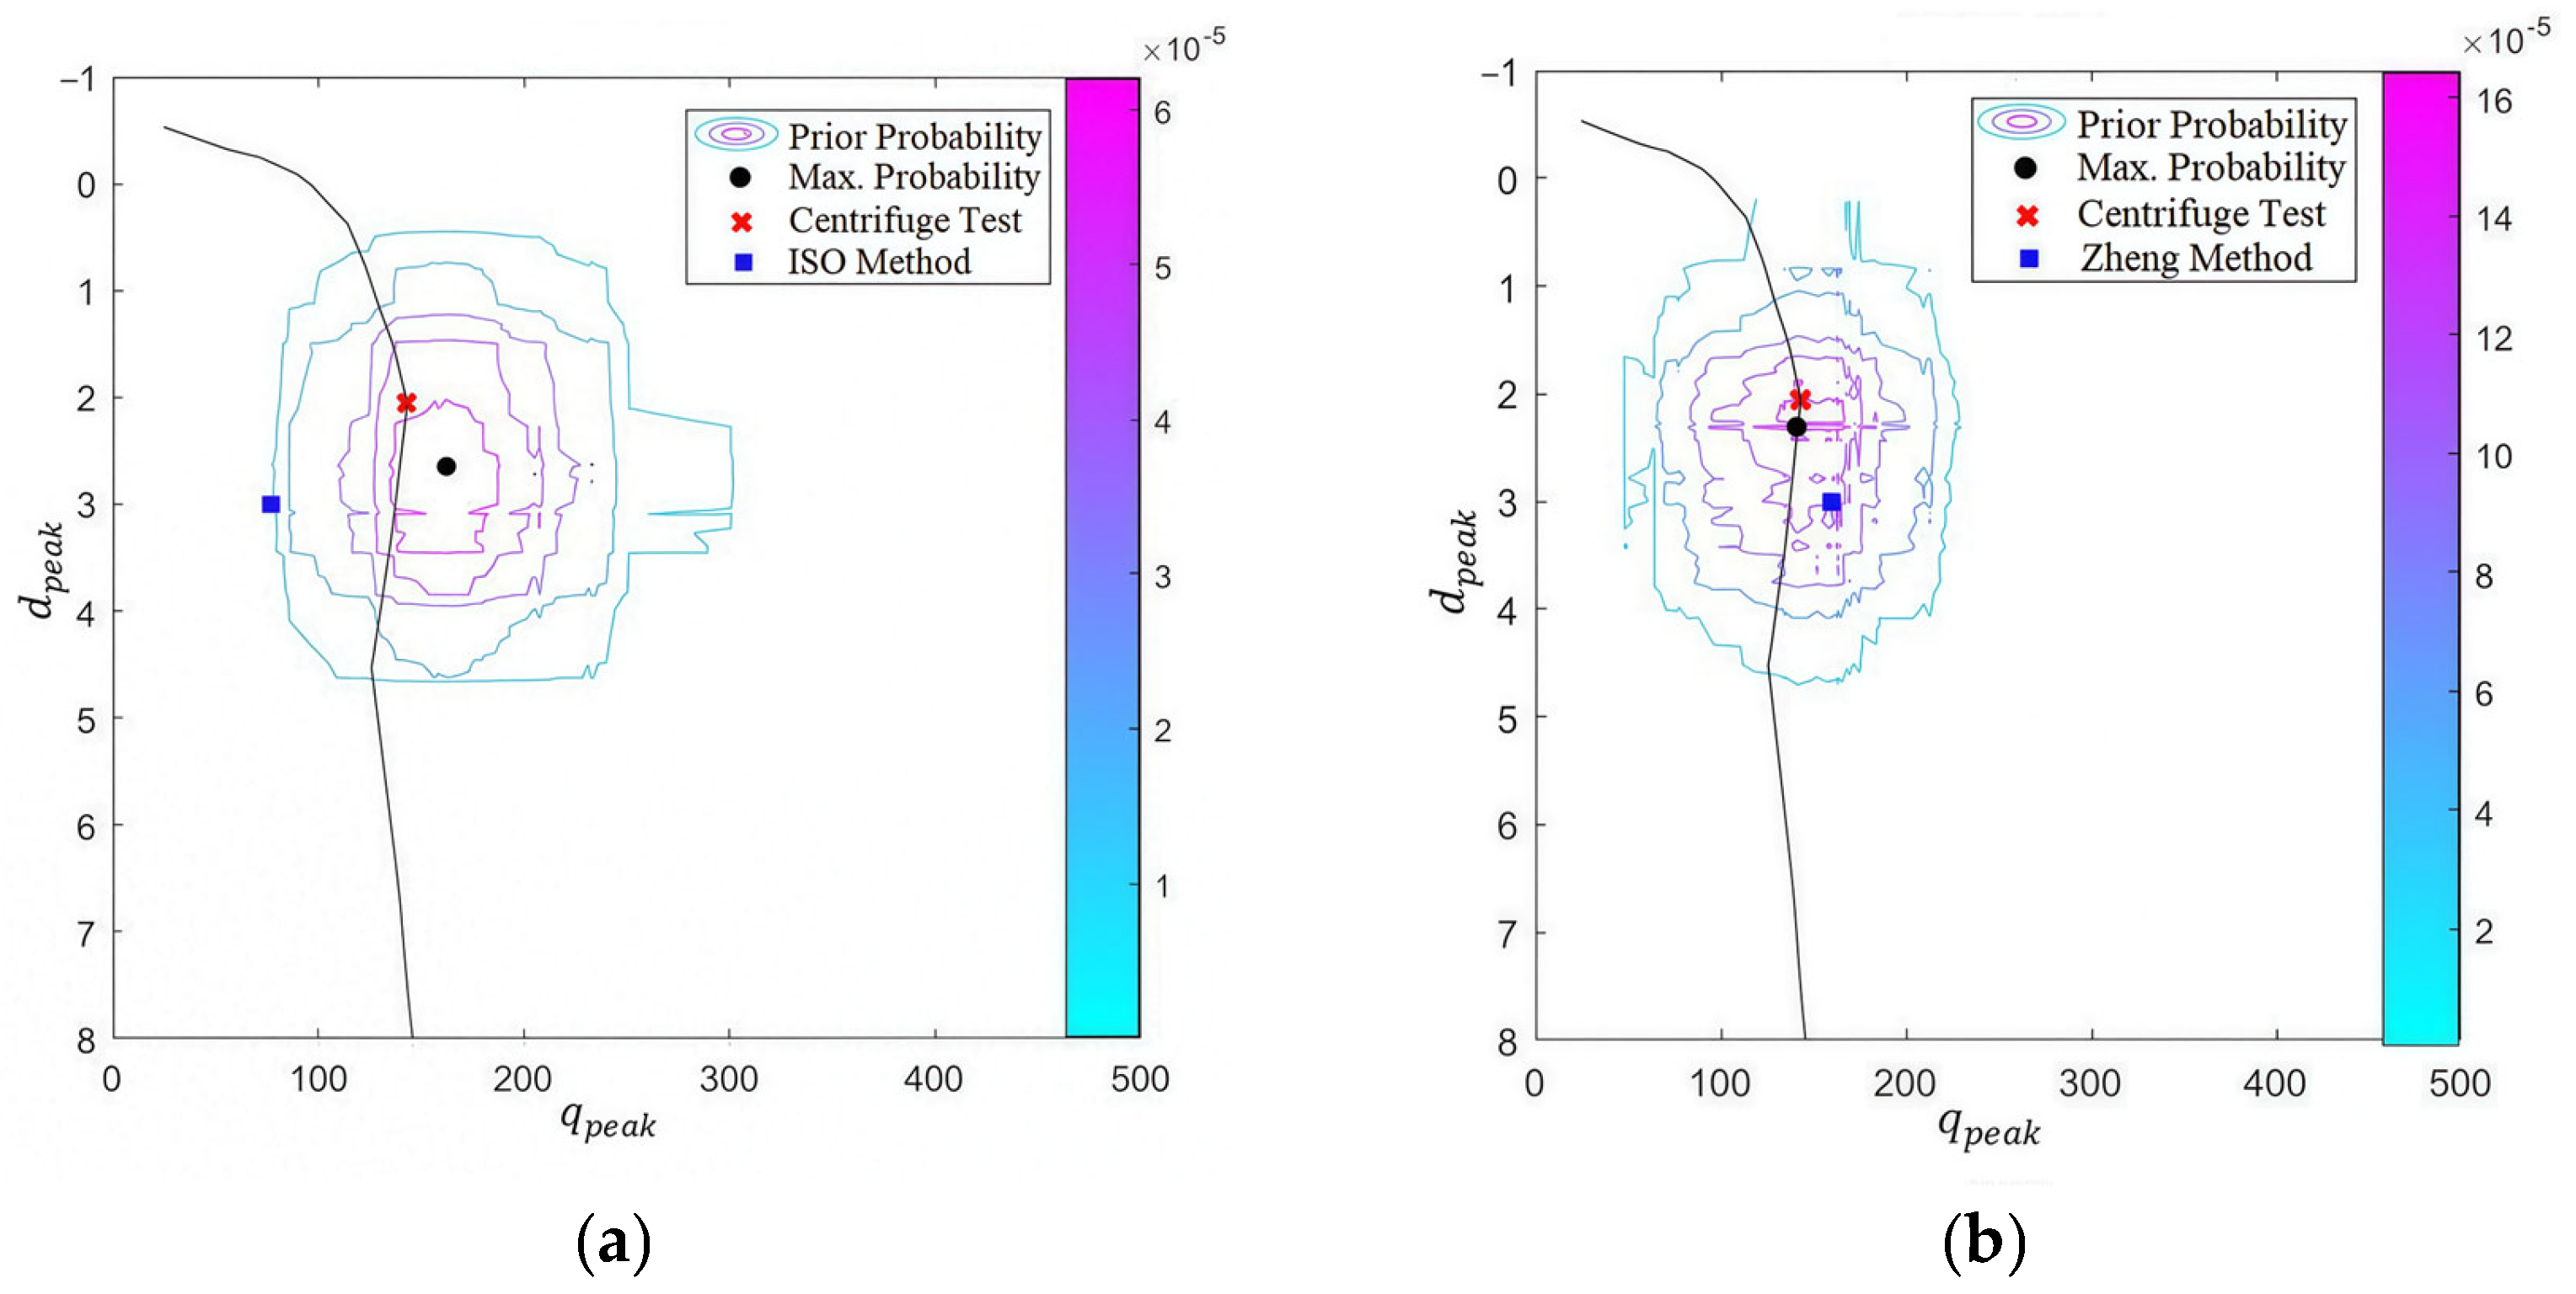
4.1.2. Prior Probability Analysis

The prior probabilities of the Bayesian prediction based on different empirical methods are calculated. Based on the probability distribution of the uncertainty factors, 2 million random numbers conforming to the Weibull distribution are generated and substituted into Equations (4) and (5) to obtain potential peak resistance and punch-through depth values. These values are evenly divided into 500 groups, with the right boundary of each group representing the group’s potential peak resistance and punch-through depth. The frequency of each group is taken as its marginal probability. Using Equation (9), the prior probabilities are calculated. As shown in Figure 6, a prior probability contour is plotted by connecting points with equal prior probability values, using peak resistance as the x-axis and punch-through depth as the y-axis.
In Figure 6, red “×” indicates the actual punch-through failure point, while blue square “■” represents the predicted points calculated using the ISO method and Zheng method before spudcan installation (values from Table 2). The predicted values from the empirical formulas deviate from the centrifuge test. Based on both empirical methods, the points with the largest prior probability also show significant discrepancies from the centrifuge test result.

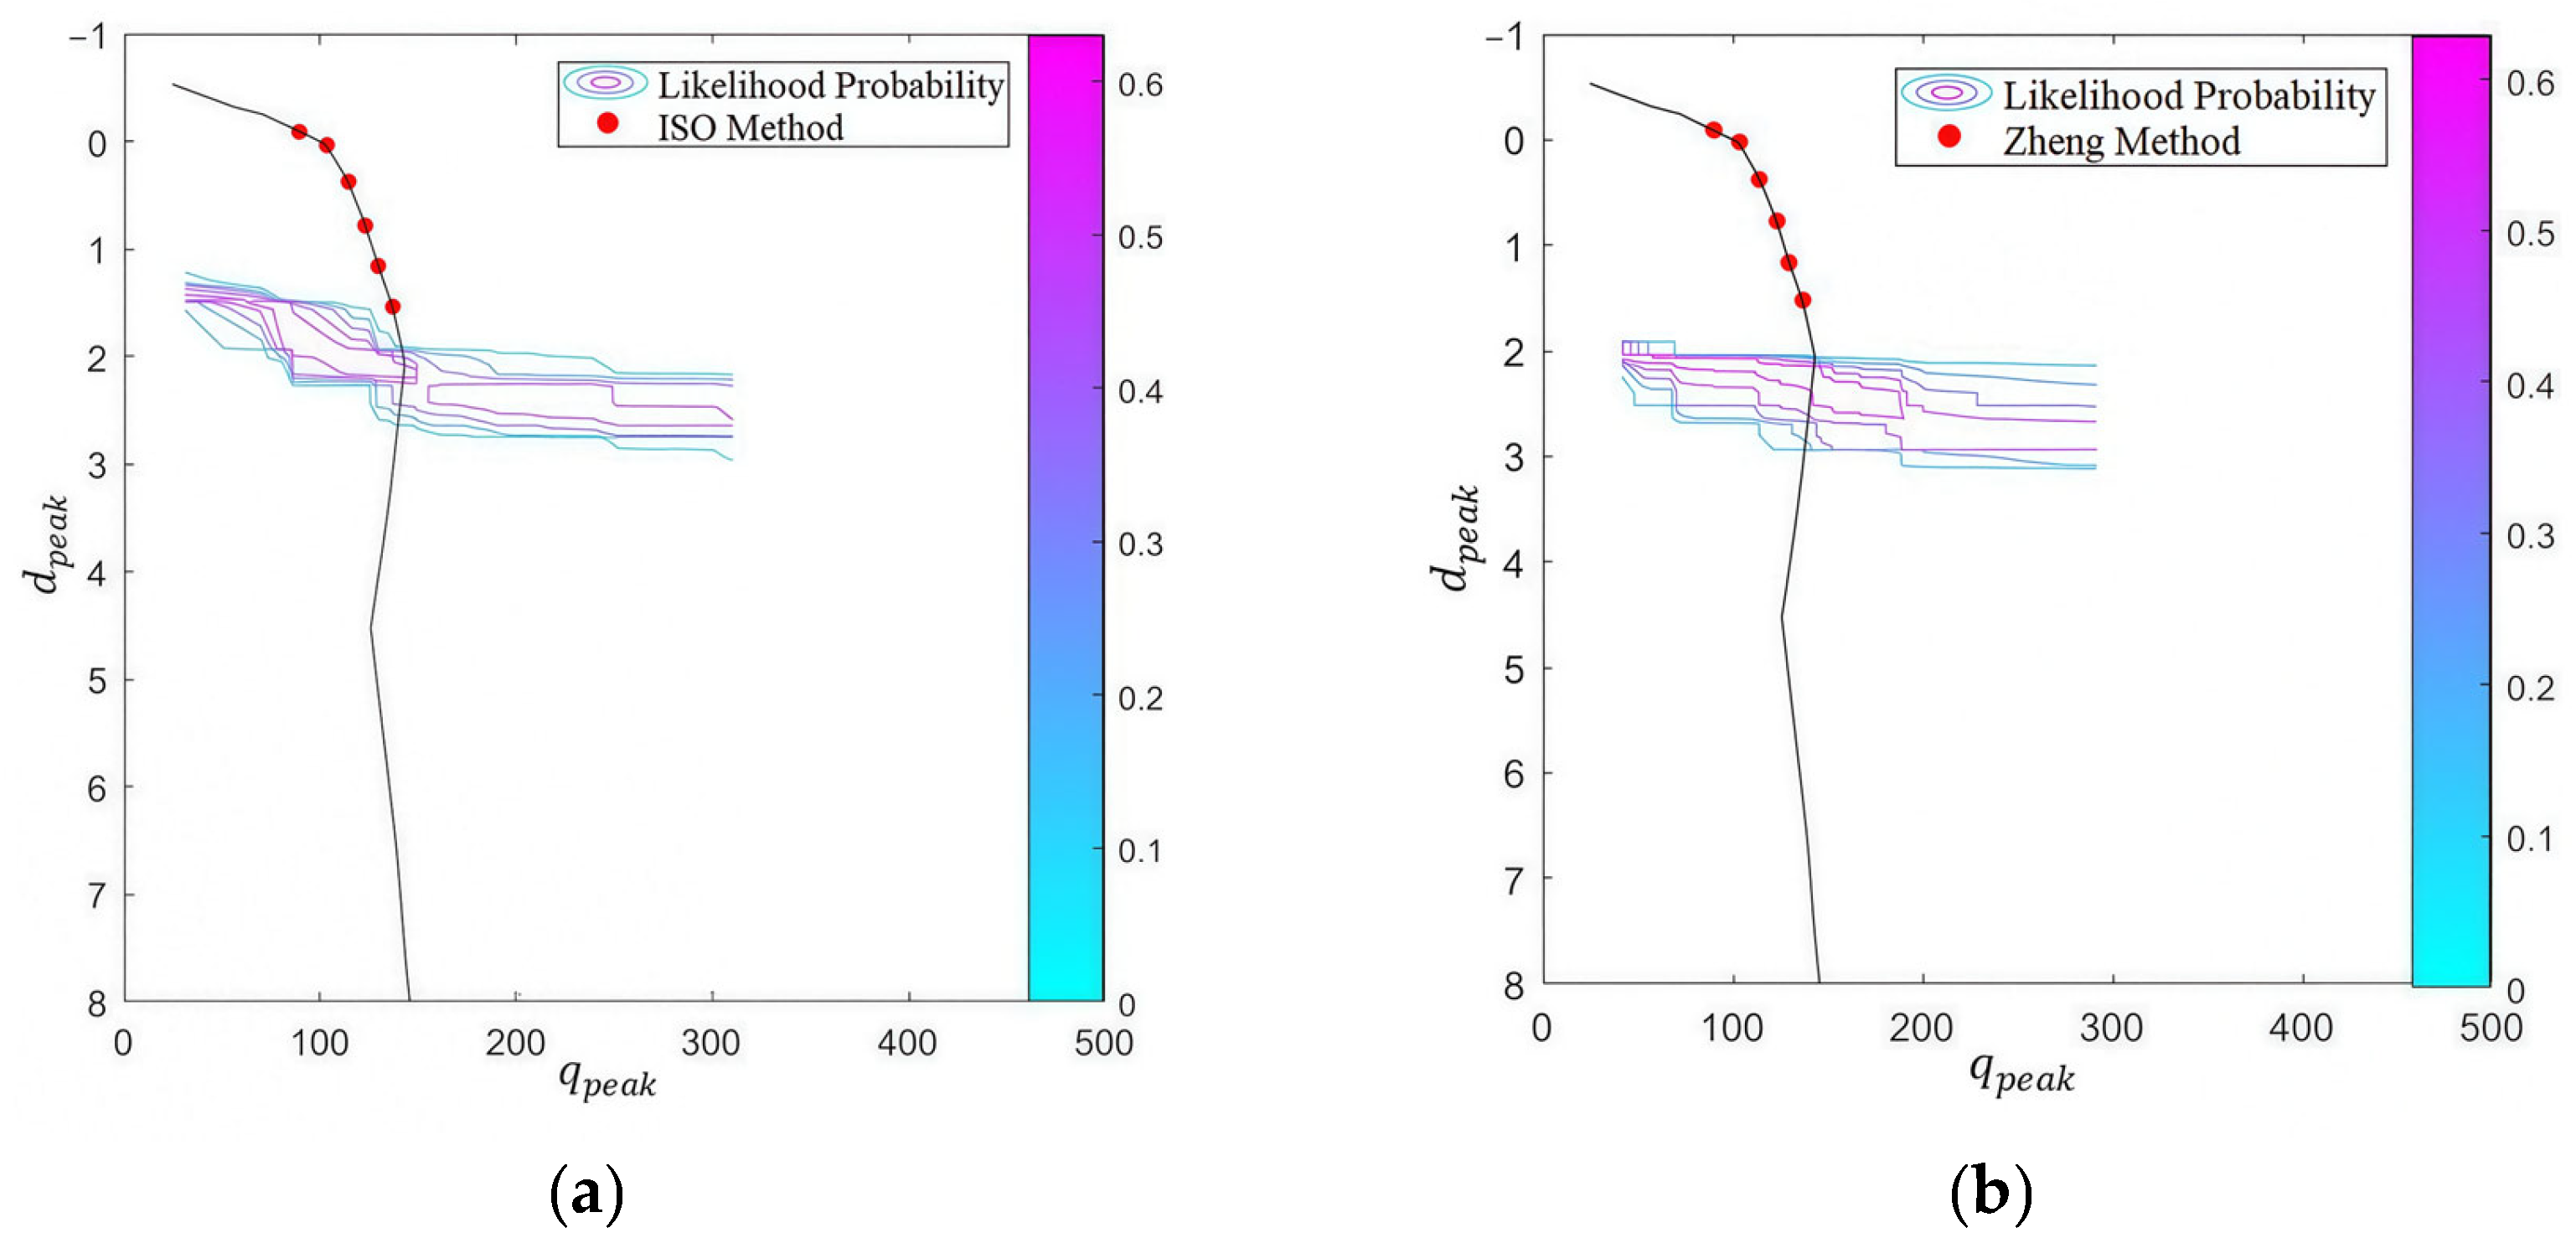
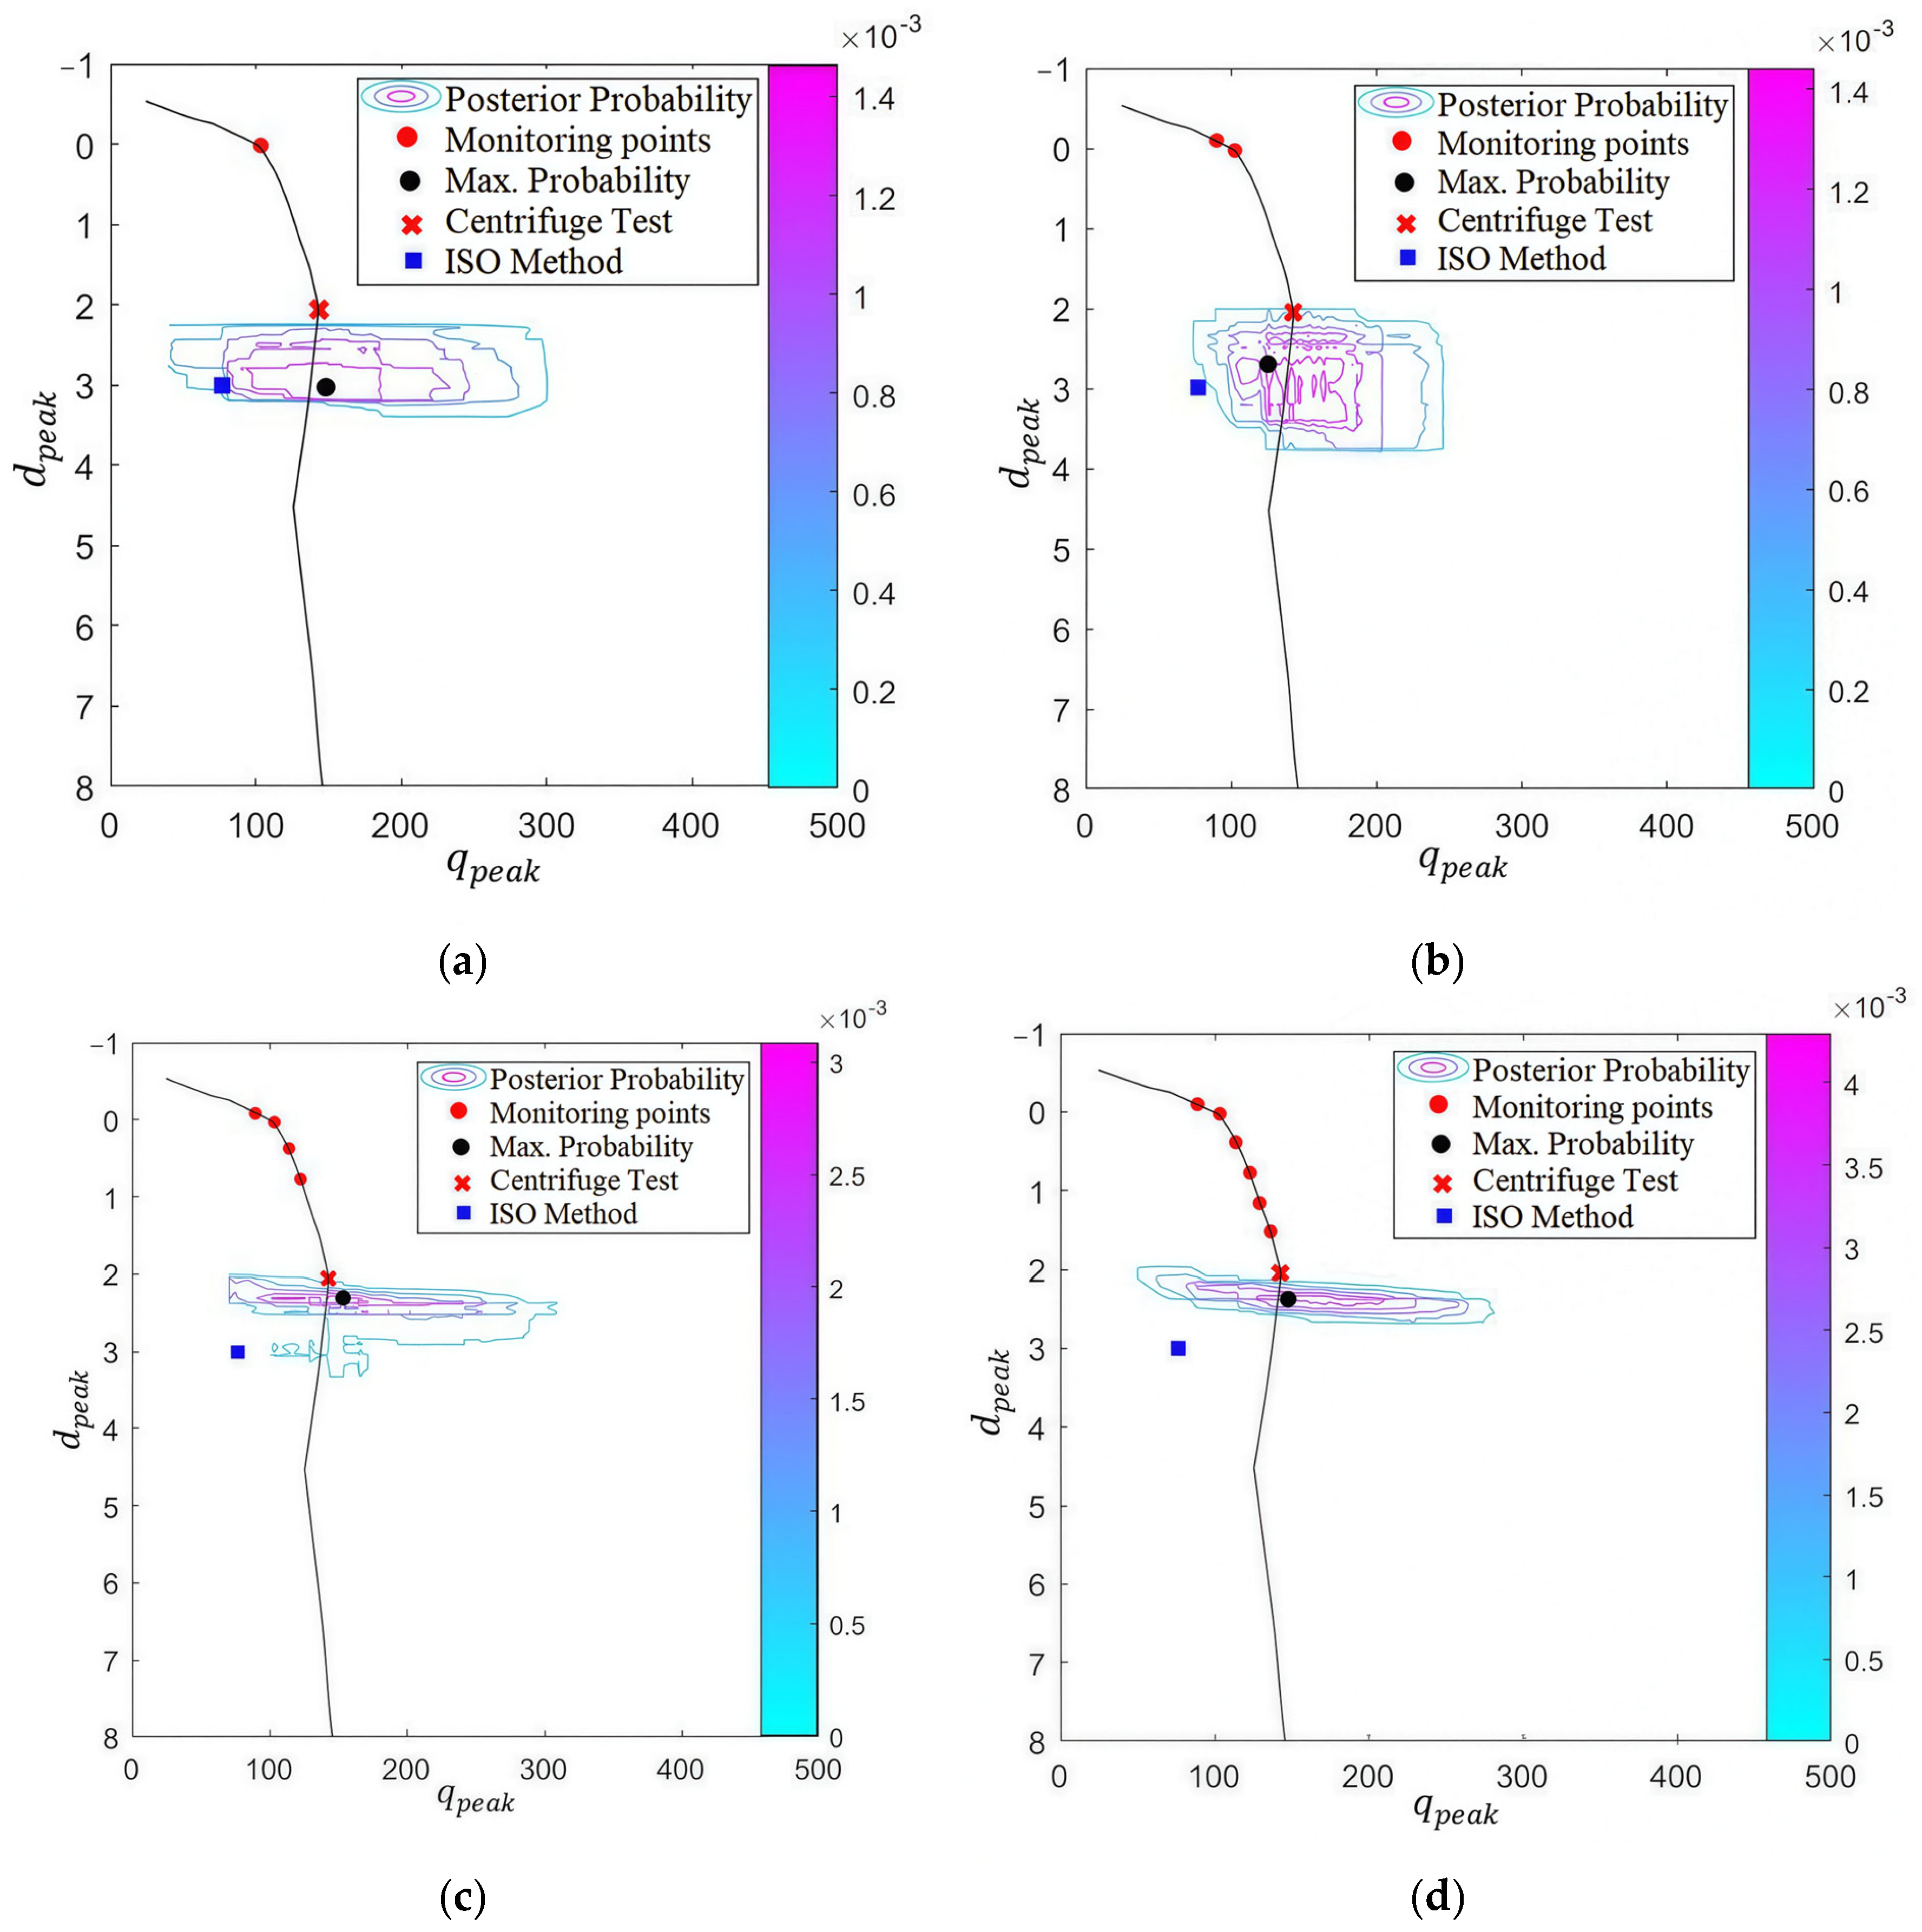
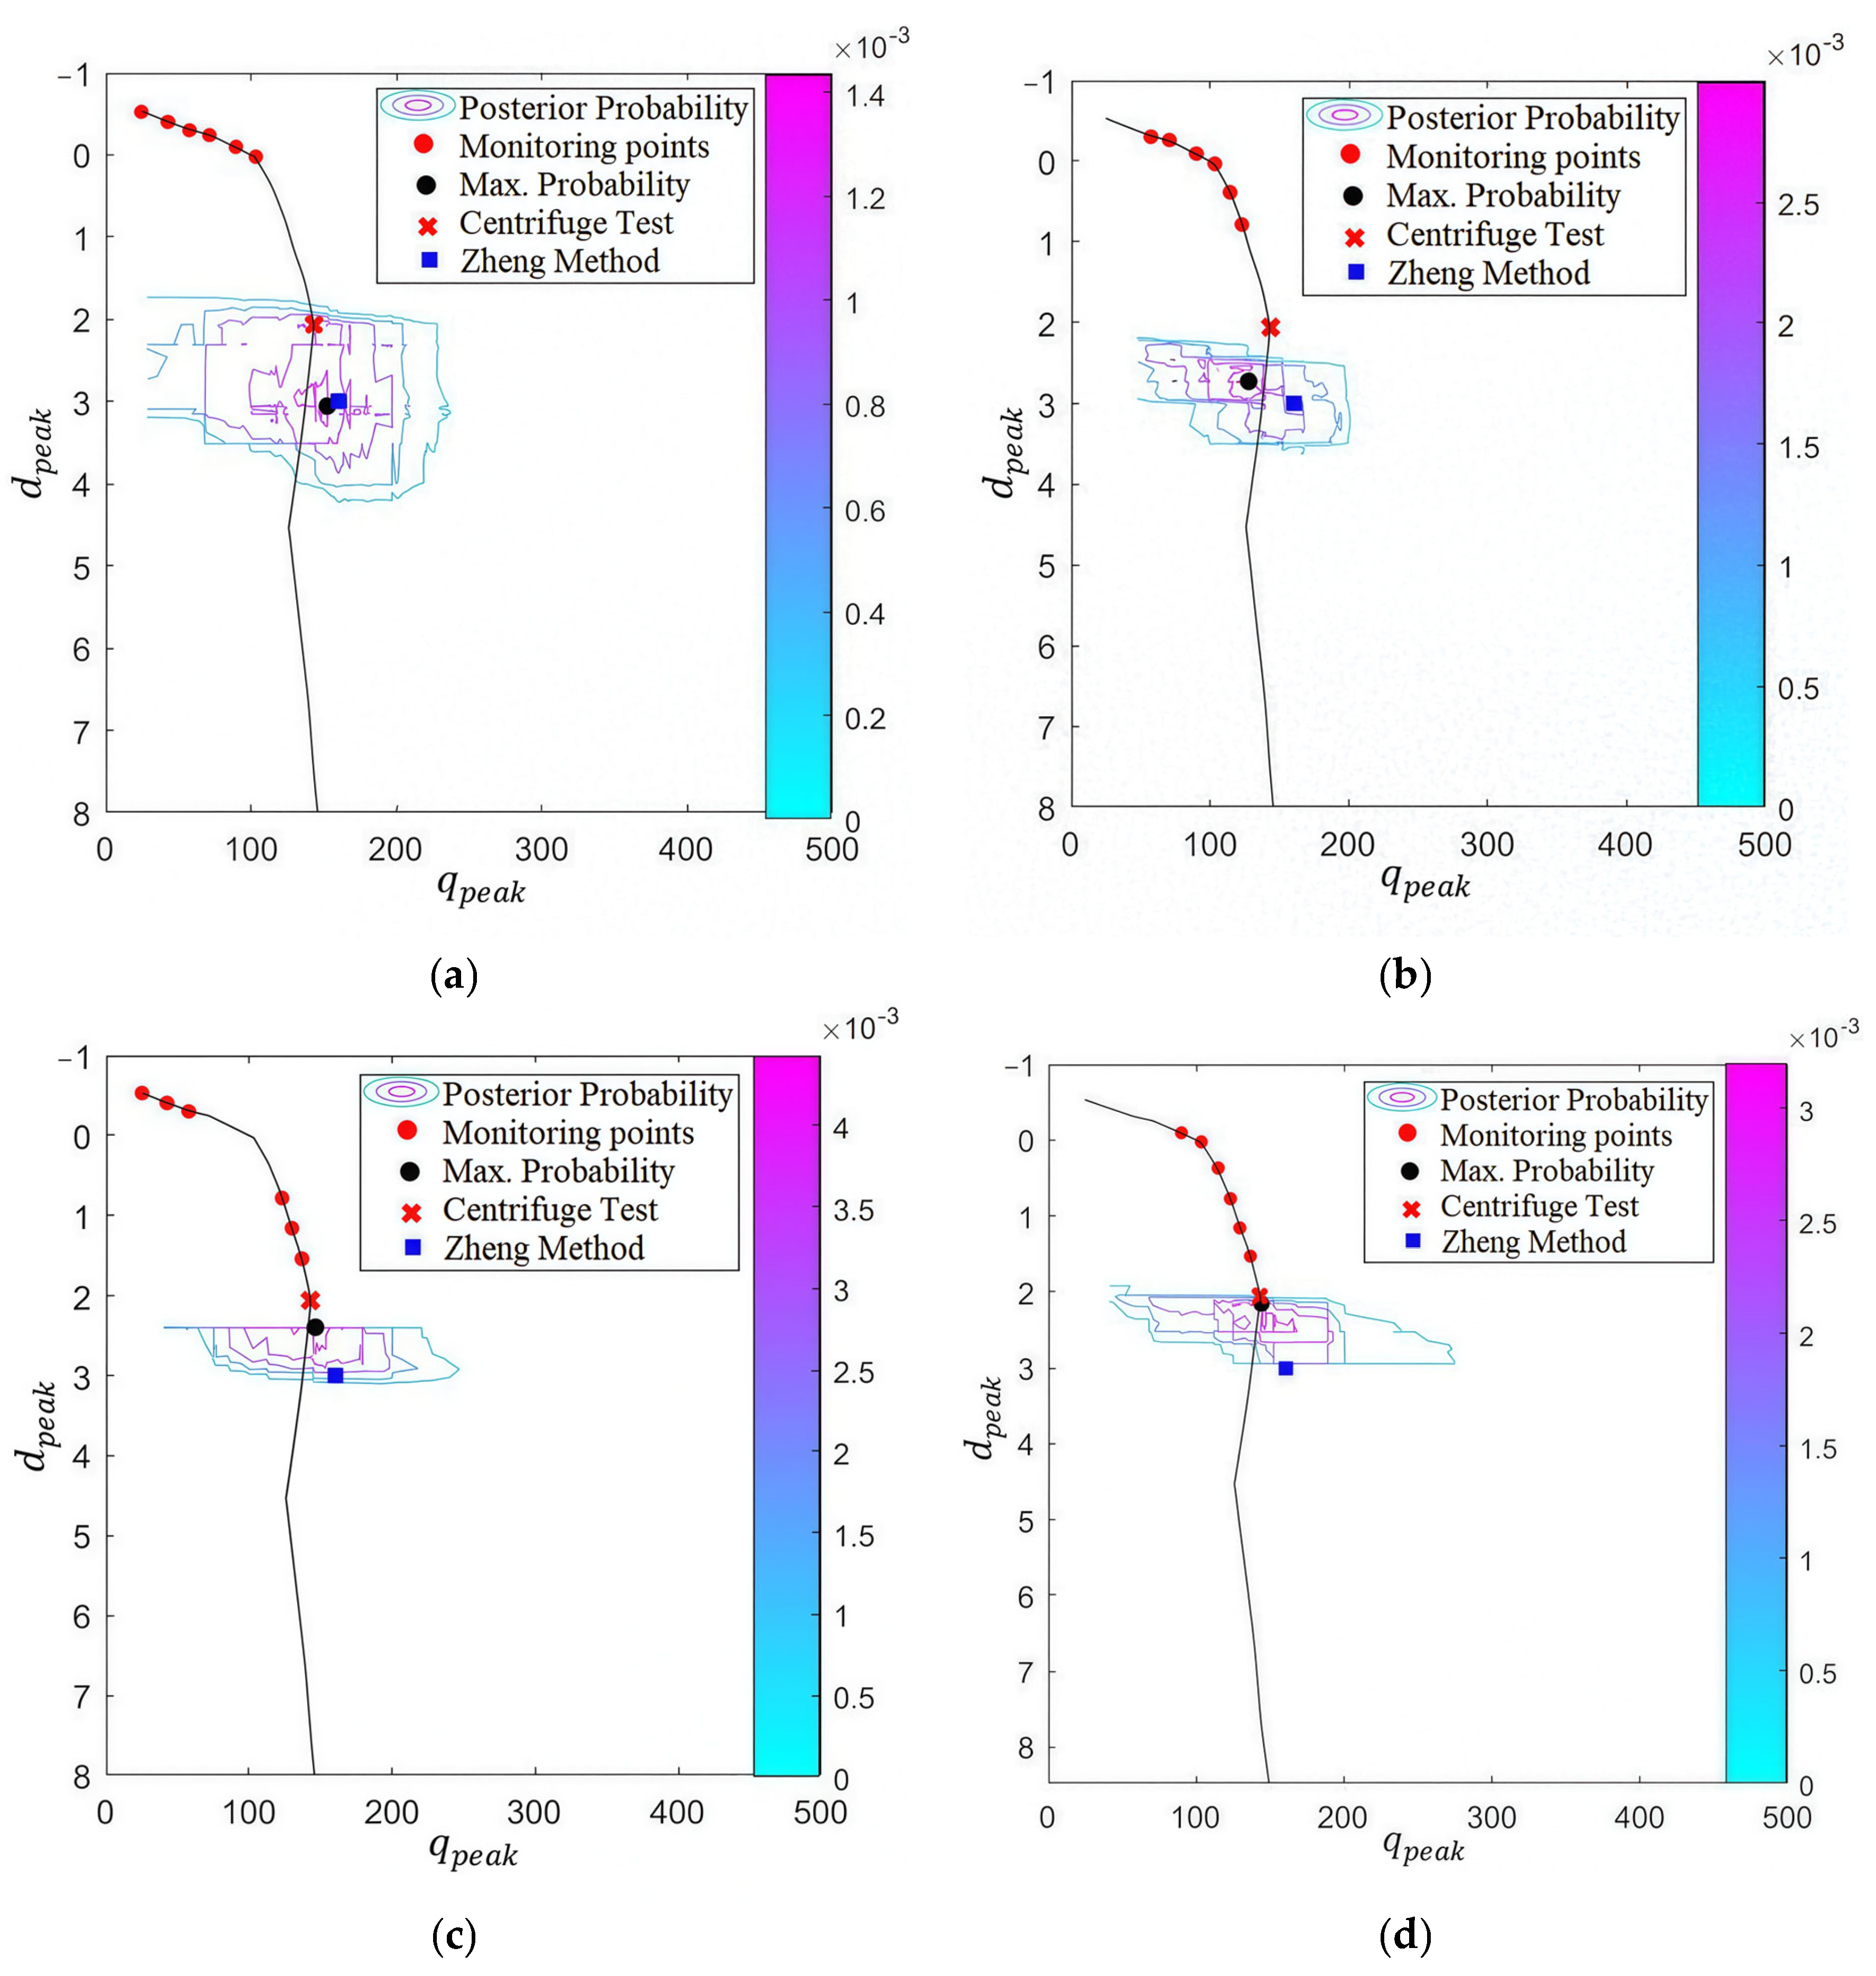
4.1.3. Likelihood and Posterior Probability Analysis

From the penetration profile of the centrifuge test case, six points prior to the peak resistance are selected as the monitoring points. For each of the 500 sets of possible peak resistance and depth, the monitoring points are used to calculate the likelihood probability based on Equations (10)–(14). At each monitoring point, the Monte Carlo method is used to calculate the probability of each monitoring point, given the peak resistance and depth. A likelihood probability contour was generated by connecting possible peak points with equal likelihood probability, as shown in Figure 7.
Combining the prior probability and the likelihood probability, the posterior probabilities were computed using Equation (8) and visualized in a posterior probability contour, as shown in Figure 8. In Figure 8, the red dot “●” represents the monitoring points during penetration. The colored solid lines are contour lines connecting points with identical probability for the peak resistance. The black dot “●” marks the most probable peak resistance point predicted by the Bayesian method. The red cross “×” depicts the actual peak resistance point, which is extracted from the centrifuge test profile.
Figure 8 demonstrates that traditional deterministic predictions (marked as blue square “□”) remain fixed regardless of monitoring data, showing large deviations from the actual punch-through point (extracted from the centrifuge test profile). The Bayesian predictions using the ISO and Zheng methods yield peak resistances of 154.55 kPa and 145.12 kPa, respectively, showing minimal discrepancies from the centrifuge test results and outperforming traditional methods. It proves that the Bayesian method significantly improves prediction accuracy with monitoring updates. It also confirms that Bayesian probability predictions are not sensitive to the empirical method adopted and are more accurate than conventional approaches. Although the two empirical methods give quite different predictions for the test case, the formulas both take into account the undrained shear strength ratio between the two layers, and also the thickness of the stiff layer. The two parameters are the most sensitive ones to the prediction of the peak resistance [24]. The empirical models in this probabilistic framework provide qualitative rather than quantitative guidance. Therefore, empirical methods taking into account the most sensitive parameters are supposed to be effective in the present probability method.

4.2. Effect of the Monitored Point Number

To study the real-time prediction of the Bayesian probability methods, further research is conducted from two aspects: the number and positions of monitoring points. The effectiveness of the Bayesian probabilistic prediction method under different numbers of monitoring points (one, two, four, and six points) is studied. Posterior probability contours based on the ISO method with different numbers of monitoring points are plotted in Figure 9.
Figure 9 shows that fewer shallow monitoring points lead to broader prediction ranges. As the number of monitoring points increases, the prediction range gradually narrows, and the point with the greatest probability become closer to the actual peak resistance point. It demonstrates that the number of monitoring points significantly affects the accuracy of peak resistance and depth predictions. During offshore spudcan penetration, the peak resistance prediction should be updated with more monitoring data to improve the accuracy.

4.3. Effect of the Monitored Point Position

Regarding the six monitoring points, subsequently placed at different positions to the tested profile, the posterior probability obtained based on the Zheng method is calculated to further study the effect of the monitoring point position. As shown in Figure 10, the monitoring points are placed progressively closer to the peak resistance point in sub-figures (a) to (d). The discrepancies between the predicted peak resistances and the centrifuge test are also shown in Figure 10. It is shown that the closer the monitoring points are to the actual punch-through location, the more accurately the probabilistic predictions align with the actual centrifuge test.
For spudcan penetration problems, very limited data is available from both laboratory and engineering sites, which is insufficient to support ML or AI training. The proposed method combines empirical formulations with a probabilistic approach, effectively integrating physical mechanisms with data-driven methodologies. This integration demonstrates that incorporating physical models can significantly reduce the data requirements for data-driven methods.
In situ testing plays a crucial role in geotechnical applications. Eslami et al. (2017) compared CPT-based methods with conventional approaches using 24 pile load tests. Their study demonstrated that in situ testing, particularly CPT, is vital for accurately assessing pile toe stability and resistance distribution in geotechnical engineering, as it captures non-linear, depth-dependent behavior overlooked by critical depth theories [25]. However, in situ testing data remains scarce in practical engineering due to economic constraints. Although the current methodology does not explicitly account for certain sources of variability encountered in situ, such as the OCR (Over Consolidation Ratio), the uncertainties associated with missing data are likely reflected in the bias of monitored peak resistance from the predicted value with deterministic methods. It is believed that the proposed probabilistic model could cover those uncertainties if more realistic data is incorporated.

5. Conclusions

This study introduces a Bayesian probabilistic framework to enhance the prediction of spudcan peak resistance and punch-through depth in stiff-over-soft clay, addressing critical safety risks during offshore jack-up platform operations. By integrating empirical formulas with Monte Carlo simulations and Bayesian updating, the proposed framework quantifies these uncertainties through prior probability distributions and refines predictions in real-time using penetration monitoring data. The following conclusions are drawn:
(1)
The Bayesian approach significantly improves prediction accuracy compared with deterministic methods. The integration of monitoring data progressively narrows the uncertainty bounds, enabling the most probable failure zone to converge toward the actual punch-through point. This dynamic updating mechanism mitigates the limitations of static empirical models, which lack adaptability to site-specific conditions.
(2)
Although the selection of empirical formulas directly influences the prior distributions, it has a limited influence on the posterior probability. This is because the formulas all take into account the undrained shear strength ratio between the two layers and the thickness of the stiff layer, which are the two most sensitive parameters to the prediction of the peak resistance.
(3)
Increasing the number of monitored penetration points and the proximity of monitored points to the peak resistance point enhances the probabilistic prediction accuracy, whereas distant points provide limited diagnostic value.
By systematically accounting for parameter variability and assimilating real-world data, the framework bridges the gap between theoretical models and field observations, ultimately reducing the risks of catastrophic failures in complex layered seabeds. Future work could extend this approach to multi-layered soil stratum and incorporate additional sources of uncertainty, such as spatial heterogeneity and time-dependent soil behavior. It should be noted that field observations may exhibit extreme data sparsity, which could lead to the failure of the proposed method. To handle the extreme data sparsity, new methods such as augmented intelligence forecasting should be adopted [26,27].

Author Contributions

Conceptualization, P.G.; methodology, Z.S. and P.G.; software, Y.G.; validation, Z.S. and Y.G.; formal analysis, J.B.; investigation, Y.G.; writing—original draft preparation, Z.S. and Y.G.; writing—review and editing, P.G.; visualization, Q.G.; supervision, P.G.; project administration, P.G.; funding acquisition, P.G. All authors have read and agreed to the published version of the manuscript.

Funding

This research was funded by the Natural Science Foundation of China, grant number 51709164.

Data Availability Statement

The data presented in this study are available on request from the corresponding author.

Conflicts of Interest

Author Yanling Gao was employed by the company Zhejiang Huichuan Water Conservancy Engineering Technology Co., Ltd. The remaining authors declare that the research was conducted in the absence of any commercial or financial relationships that could be construed as a potential conflict of interest.

References

  1. Hu, P.; Xiao, Z.; Leo, C. Advances in the prediction of spudcan punch-through in double-layered soils. Mar. Struct. 2021, 79, 103038. [Google Scholar] [CrossRef]
  2. ISO 19905-1:2016; Iso Petroleum and Natural Gas Industries—Site-Specific Assessment of Mobile Offshore Units–Part 1: Jack-Ups. ISO: Geneva, Switzerland, 2016.
  3. SNAMET. T&R Bulletin, 5-05 A: Guidelines for Site Specific Assessment of Mobile Jack-Up Units. 2008. Available online: https://sname.org/node/1810 (accessed on 15 May 2025).
  4. Van Dijk, B.; Yetginer, A.G. Findings of the Issmge Jack-Up Leg Penetration Prediction Event. In Proceedings of the 3rd International Symposium on Frontiers in Offshore Geotechnics, Oslo, Norway, 10–12 June 2015; pp. 1267–1274. [Google Scholar]
  5. Rohani, M.J.; Sha’Ari, F.A.; Rahman, A.A.; Wan Ismail, W.M.; Chan, N.; Tho, K.K. Improving Jack-Up Rig Spudcan Penetration Predictions in Malaysian Waters. In Proceedings of the Offshore Technology Conference Asia, Kuala Lumpur, Malaysia, 22–25 March 2016; pp. 2183–2190. [Google Scholar]
  6. Hossain, M.S.; Randolph, M.F. Deep-penetrating spudcan foundations on layered clays: Centrifuge tests. Géotechnique 2010, 60, 157–170. [Google Scholar] [CrossRef]
  7. Hossain, M.S.; Randolph, M.F. Deep-penetrating spudcan foundations on layered clays: Numerical analysis. Géotechnique 2010, 60, 171–184. [Google Scholar] [CrossRef]
  8. Tjahyono, S. Experimental and Numerical Modelling of Spudcan Penetration in Stiff Clay Overlying Soft Clay. Ph.D. Thesis, University of Western Australia, Perth, Australia, 2011. [Google Scholar]
  9. Zheng, J.; Hossain, M.S.; Wang, D. Prediction of spudcan penetration resistance profile in stiff-over-soft clays. Can. Geotech. J. 2016, 53, 1978–1990. [Google Scholar] [CrossRef]
  10. Zheng, J.; Hossain, M.S.; Wang, D. Estimating spudcan penetration resistance in stiff-soft-stiff clay. J. Geotech. Geoenviron. 2018, 144, 04018001. [Google Scholar] [CrossRef]
  11. Li, X.; Meng, X.; Zhang, Q. A new method for predicting the penetration curve of spudcan on stiff-over-soft clay. Ocean Eng. 2024, 310, 118649. [Google Scholar] [CrossRef]
  12. Li, X.; Zhang, A.; Zhang, Q.; Li, D. Predicting the ultimate bearing capacity of spudcan in stiff-over-soft clay based on a failure model varying with soil parameter. Appl. Ocean Res. 2024, 148, 104026. [Google Scholar] [CrossRef]
  13. Uzielli, M.; Cassidy, M.J.; Hossain, M.S. Bayesian prediction of punch-through probability for spudcans in stiff-over-soft clay. In Geotechnical Safety and Reliability; American Society of Civil Engineers: Reston, VA, USA, 2017; pp. 247–265. [Google Scholar]
  14. Li, J.; Hu, P.; Uzielli, M.; Cassidy, M.J. Bayesian prediction of peak resistance of a spudcan penetrating sand-over-clay. Géotechnique 2018, 68, 905–917. [Google Scholar] [CrossRef]
  15. Wang, Y.; Hu, P.; Li, J. Probabilistic prediction of the spudcan extraction from sand-over-clay based on monitored data. Ocean Eng. 2023, 281, 114787. [Google Scholar] [CrossRef]
  16. Yang, F. A Novel Approach for Probabilistic Prediction of Offshore Jack-Up Installation. Ph.D. Thesis, The University of Western Australia, Perth, Australia, 2020. [Google Scholar]
  17. Yang, F.; Li, J.; Cassidy, M.J. Probabilistic site characterisation using monitored spudcan installation data. Géotechnique 2023, 73, 353–373. [Google Scholar] [CrossRef]
  18. Yang, F.; Li, J.; Cassidy, M.J. Probabilistic punch-through distance for a spudcan penetrating sand-over-clay. Geo-Risk 2017, 2017, 569–577. [Google Scholar]
  19. Jiang, J.; Wang, D.; Zhang, S. Improved prediction of spudcan penetration resistance by an observation-optimized model. J. Geotech. Geoenviron. 2020, 146, 06020014. [Google Scholar] [CrossRef]
  20. Zheng, J.; Zhang, S.; Wang, D.; Jiang, J. Optimization for the assessment of spudcan peak resistance in clay–sand–clay deposits. J. Mar. Sci. Eng. 2021, 9, 698. [Google Scholar] [CrossRef]
  21. Yang, X.; Wang, D.; Zhang, S. Probabilistic prediction of spudcan peak penetration resistance based on parameter estimation and sectionalized adaptive linear simplification. Ocean Eng. 2024, 298, 117228. [Google Scholar] [CrossRef]
  22. Fallah, S.; Gavin, K.; Moradabadi, E. Estimation of Spudcan Penetration Using a Probabilistic Eulerian finite Element Analysis; CRC Press: Boca Raton, FL, USA, 2015; pp. 1281–1286. [Google Scholar]
  23. Vinay, K.; Avijit, B.; Portelinha, F.; Manish, K.; Guru, D. Influence of variation of soil properties in bearing capacity and settlement analysis of a strip footing using random finite element method. Civ. Eng. Infrastruct. 2024, 57, 383–403. [Google Scholar]
  24. Gao, P.; Liu, Z.; Zeng, J.; Zhan, Y.; Wang, F. A random forest model for the prediction of spudcan penetration in stiff-over-soft clays. Pol. Marit. Res. 2020, 27, 130–138. [Google Scholar] [CrossRef]
  25. Eslami, A.; Valikhah, F.; Veiskarami, M. Cpt-based investigation for pile toe and shaft resistances distribution. Geotech. Geol. Eng. 2017, 35, 2891–2905. [Google Scholar] [CrossRef]
  26. Ghorbani, J.; Aghdasi, S.; Nazem, M.; McCartney, J.S.; Kodikara, J. Augmented intelligence framework for real-time ground assessment under significant uncertainty. Eng. Comput. 2025, 1–22. [Google Scholar] [CrossRef]
  27. Tordesillas, A.; Zheng, H.; Qian, G.; Bellett, P.; Saunders, P. Augmented intelligence forecasting and what-if-scenario analytics with quantified uncertainty for big real-time slope monitoring data. IEEE Trans. Geosci. Remote Sci. 2024, 62, 5209429. [Google Scholar] [CrossRef]
Figure 1. Application workflow of the probabilistic prediction model for spudcan bearing capacity.
Jmse 13 01344 g001
Figure 2. Frequency histograms of the uncertainty factors of the peak resistance predicted by two models: (a) ISO method; (b) Zheng method.
Jmse 13 01344 g002
Figure 3. Frequency histogram of the uncertainty factors of the peak resistance depth.
Jmse 13 01344 g003
Figure 4. Fitting of the pre-peak resistance profile of spudcan penetration in stiff-over-soft clay.
Jmse 13 01344 g004
Figure 5. Variation in the single parameter η with the dimensionless parameter χ .
Jmse 13 01344 g005
Figure 6. Contour of the prior probability: (a) ISO-recommended method; (b) Zheng method.
Jmse 13 01344 g006
Figure 7. Contour of the likelihood probability: (a) ISO-recommended method; (b) Zheng method.
Jmse 13 01344 g007
Figure 8. Contour of the posterior probability: (a) ISO-recommended method; (b) Zheng method.
Jmse 13 01344 g008
Figure 9. Variation in the posterior probability with monitored point number: (a) 1 point; (b) 2 points; (c) 4 points; (d) 6 points.
Jmse 13 01344 g009
Figure 10. Variation in the posterior probability with monitored point position: (a) position 1; (b) position 2; (c) position 3; (d) position 4.
Jmse 13 01344 g010
Table 1. Extracted and calculated peak resistances of 40 centrifuge test cases.
No.Centrifuge TestEmpirical Methods
Zheng MethodISO MethodZheng Method
q p e a k (kPa) d p e a k (m) q p e a k : kPa q p e a k : kPa d p e a k : m
1118.362.1698.1860.671.76
2115.471.5994.3562.081.81
3143.292.06160.1476.843.00
4136.963.86177.65233.003.82
5191.882.28167.53137.023.76
6173.983.39180.00340.945.37
7165.293.35190.46197.405.47
8185.297.05218.62541.536.03
9128.780.60137.3775.560.75
10138.610.63144.3690.971.26
11179.730.88191.5893.670.90
12185.101.58209.87231.142.15
13252.900.79249.55150.391.39
14253.072.44257.38399.222.88
15321.981.41298.96213.371.69
16272.644.10316.91724.884.74
17108.291.2070.8331.990.99
18101.150.3064.1119.300.32
1958.520.9373.9138.511.16
2049.000.3957.1916.600.29
21164.822.62158.6570.672.56
22227.960.96229.8997.921.11
23147.413.48144.09149.123.57
24229.301.74200.50139.801.09
25205.503.06155.70111.401.85
26119.540.45209.2272.410.30
27166.241.68161.01116.121.66
28167.401.25214.96130.641.08
29128.231.42409.00200.521.29
30182.521.36409.00200.521.29
31193.181.34409.00200.521.29
32234.520.96409.00200.521.29
33273.730.51409.00200.521.29
34335.030.30409.00200.521.29
35109.231.70393.36184.091.11
3681.700.79393.36184.091.11
37144.831.06393.36184.091.11
38180.330.48393.36184.091.11
39281.140.30393.36184.091.11
40332.250.48393.36184.091.11
Table 2. Fitted value of Weibull distribution parameters for the uncertainty factors.
Uncertainty FactorEmpirical Method a b
ε q ISO-recommended method1.58892.3240
Zheng method0.96133.0549
ε d /1.00902.8450
Table 3. Predicted peak resistances and depths using different empirical formulas.
Empirical MethodPeak Resistance/kPaPunch-Through Failure Depth/m
ISO method76.843
Zheng method160.143
Disclaimer/Publisher’s Note: The statements, opinions and data contained in all publications are solely those of the individual author(s) and contributor(s) and not of MDPI and/or the editor(s). MDPI and/or the editor(s) disclaim responsibility for any injury to people or property resulting from any ideas, methods, instructions or products referred to in the content.

