Article

Evaluation of the Effect of Floating Treatment Wetlands Planted with Sesuvium portulacastrum on the Dynamics of Dissolved Inorganic Nitrogen, CO2, and N2O in Grouper Aquaculture Systems

1
Key Laboratory of Cultivation and High-Value Utilization of Marine Organisms in Fujian Province, Fisheries Research Institute of Fujian, Xiamen 361013, China
2
Key Laboratory of Global Change and Marine-Atmospheric Chemistry, The Third Institute of Oceanography, Ministry of Natural Resources, Xiamen 361005, China
*
Authors to whom correspondence should be addressed.
These authors contributed equally to this work.
J. Mar. Sci. Eng. 2025, 13(7), 1342; https://doi.org/10.3390/jmse13071342
Submission received: 22 May 2025 / Revised: 6 July 2025 / Accepted: 9 July 2025 / Published: 14 July 2025
(This article belongs to the Special Issue Coastal Geochemistry: The Processes of Water–Sediment Interaction)

Abstract

Aquaculture expansion to meet global protein demand has intensified concerns over nutrient pollution and greenhouse gas (GHG) emissions. While floating treatment wetlands (FTWs) are proven for water quality improvement, their potential to mitigate GHG emissions in marine aquaculture remains poorly understood. This study quantitatively evaluated the dual capacity of Sesuvium portulacastrum FTWs to (a) regulate dissolved inorganic nitrogen (DIN) and (b) reduce CO2/N2O emissions in grouper aquaculture systems. DIN speciation (NH4+, NO2, NO3) and CO2/N2O fluxes of six controlled ponds (three FTW and three control) were monitored for 44 days. DIN in the FTW group was approximately 90 μmol/L lower than that in the control group, and the water in the plant group was more “oxidative” than that in the control group. The former groups were dominated by NO3, with lower dissolved inorganic carbon (DIC) and N2O concentrations, whereas the latter were dominated by NH4+ during the first 20 days of the experiment and by NO2 at the end of the experiment, with higher DIC and N2O concentrations on average. Higher primary production may be the reason that the DIC concentration was lower in the plant group than in the control group, whereas efficient nitrification and uptake by plants reduced the availability of NH4+ in the plant group, thereby reducing the production of N2O. A comparison of the CO2 and N2O flux potentials in the plant group and control group revealed that, in the presence of FTWs, the CO2 and N2O emissions decreased by 14% and 36%, respectively. This showed that S. portulacastrum FTWs effectively couple DIN removal with GHG mitigation, offering a nature-based solution for sustainable aquaculture. Their low biomass requirement enhances practical scalability.

1. Introduction

The fishing industry is one of the most important industries in satisfying the need for protein among human populations. However, this huge need already outstrips the capacity of marine ecosystem. Under these circumstances, ending of overfishing to protect the marine ecosystem has become a key target of SDG (sustainable development goal) 14: Life below water. To date, aquaculture has been the best way to supplement the need for protein originating from the fishing industry. By 2022, the total weight of aquaculture products had exceeded those of capture fisheries [1], suggesting that aquaculture may greatly relieve the marine ecosystem from the burden of capture fisheries. However, it should be noted that aquaculture can also be a threat to relevant marine environments. Large amounts of aquafeed are added to aquaculture systems, globally contributing about 10.9 Tg carbon and 1.82Tg nitrogen to the environment annually and increasing the carbon and nitrogen burdens of aquatic systems [2,3,4].
As a result, aquaculture systems are becoming important sources of the greenhouse gases CO2 and N2O [5,6]. These two most impactful greenhouse gases, account for approximately 63% and 6%, respectively, of the global greenhouse effect [7]. Although the latter seems to have a minor impact on the climate, one study [8] argued that if N2O emissions are not reduced, the 2 °C target put forward by the Paris Agreement will not be achieved even if CO2 and CH4 emissions are successfully controlled. In the aquaculture system, the CO2 can be produced by the decomposition of organic matter, and the production of N2O is boosted by eutrophication and the corresponding nitrogen cycle in low oxygen concentration environments [9,10,11,12], which is expected to contribute more than 5% of all anthropogenic N2O emissions by 2030. Therefore, without proper measures or techniques to reduce aquaculture greenhouse gas emissions, aquaculture activities could exacerbate global warming in the future.
To date, studies have provided important baselines for further action on this issue [13]. Sophisticated techniques, such as bioremediation [14,15,16,17,18,19] and chemical remediation [20], have been developed for wastewater treatment (including those from aquaculture), nutrient removal, and greenhouse gas reduction. Moreover, studies have shown that integrated multitrophic aquaculture [2] and coculturing of different species [21] can improve water quality and change greenhouse gas emission patterns. Among these technologies, FTW are considered a low-cost, environmental friendly technique for waste water treatment [22]. However, the application of the above techniques in aquaculture ponds and the evaluation of their effects on greenhouse gas reduction in aquaculture systems are less reported. Based on the above studies, we hypothesized that, with presence of FTW, the nitrogen and carbon may be partially removed, which would further reduce the production of greenhouse gases.
To test this hypothesis, an aquaculture experiment was conducted in a grouper aquaculture system, in which S. portulacastrum FTWs were used to purify water masses, and their regulatory effects on greenhouse gas emissions were also evaluated.

2. Materials and Methods

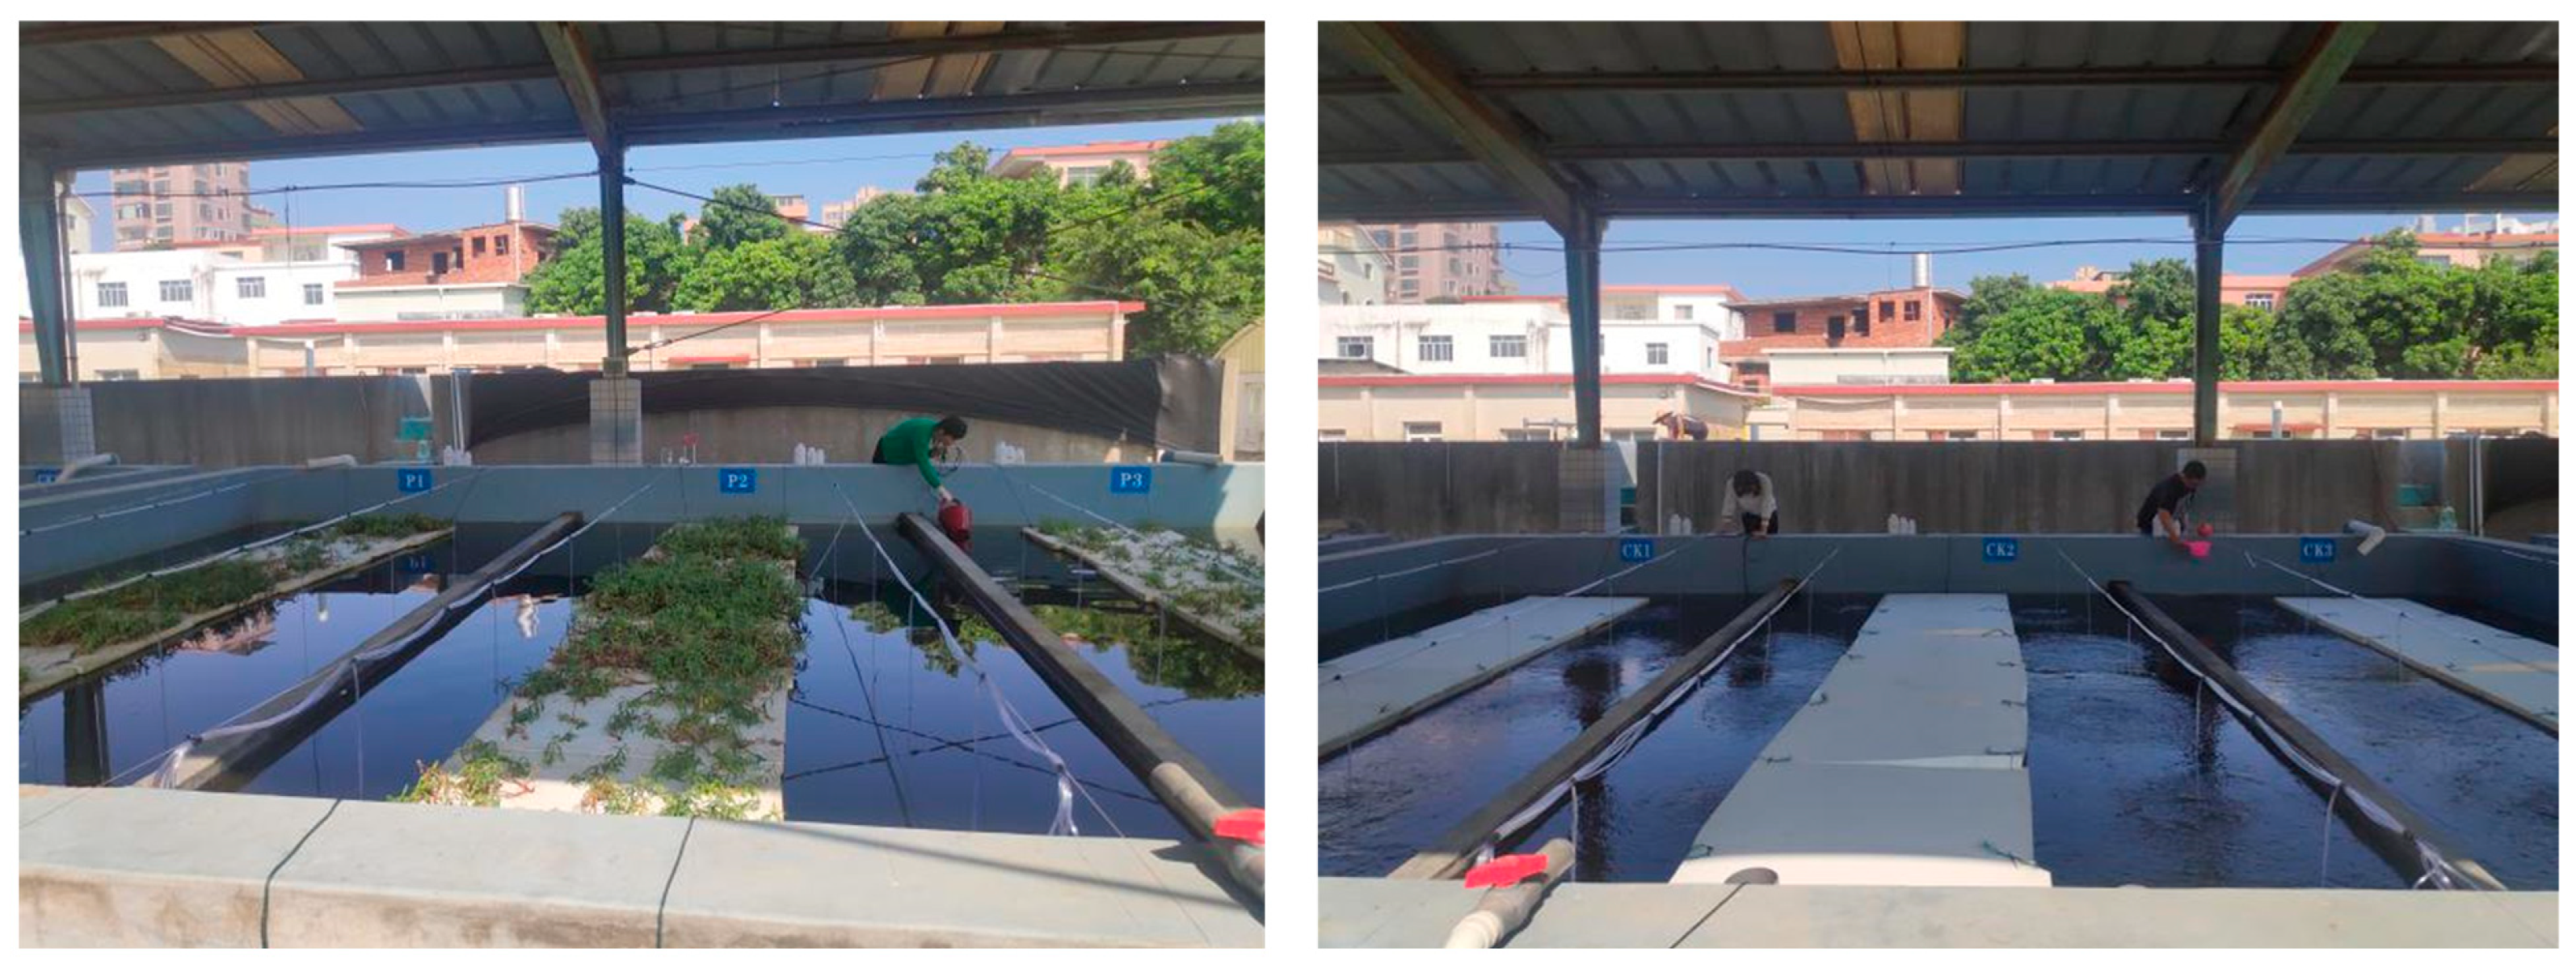
2.1. Experimental Design

The aquaculture experiments were conducted in six ponds (Figure 1) in Dajing Village, Longhai District, Zhangzhou City, Fujian Province, China. These experimental ponds were constructed with cement, and each pond had the same length, width, and depth of 6.5 m, 2.9 m, and 1.2 m, respectively. Seawater was pumped into the experimental ponds from a nearby sea area for grouper aquaculture, the seawater in the pond was aerated throughout the experiment, and no seawater was pumped in or out for exchange throughout the entire experiment. The salinity of the water was ~32.6. In each experimental pond, 100 healthy grouper (Epinephelus moara) were introduced on 1 November 2021. Only active, injury-free fish exhibiting normal feeding behavior were selected. The groupers (initial average weight: 553.7 ± 85.1 g) were stocked at a density of 2.94 kg/m3, which was specifically calculated for the current experimental setup. Three ponds were set up with S. portulacastrum FTWs constructed with polystyrene foam board and S. portulacastrum plants. The average weight of a single plant was 173.4 ± 12.4 g, and the density of the plants was ~25 plants/m2. The other three ponds served as the control group and had the same floating polystyrene foam board with no plants inserted. The aquafeed used for the groupers consisted of commercial compound feed (produced by Nonghao Corporation, Shanghai, China).

2.2. Sampling and Analysis

2.2.1. Sampling Procedure

Water samples were collected between 10 a.m. and 12 a.m. in the morning every four days. A bucket of aquaculture water was collected from a depth of approximately 30 cm and transferred into sample bottles for DIC, N2O, and DIN (including NH4+ and NO2, and NO3) analysis. The DIC and N2O samples were syphoned immediately into 250 mL stopper glass bottles via a silica tube from the water bucket and overflowed to two to three times the sample bottle volume. One hundred microliters of saturated HgCl2 (AR, ≥99.5%, Sinopharm Chemical Reagent Co., Ltd., Shanghai, China), solution was added to the samples to inhibit biological activity. The sample bottle was then sealed with a greased stopper, which was secured with a clip. The DIC and N2O sample bottles were kept at 20 °C in the dark until analysis. The DIN samples were collected in polypropylene bottles after filtration through 0.45 μm mixed cellulose ester (MCE) membranes (MF-Millipore) and frozen at −20 °C until analysis.

2.2.2. Temperature, Salinity, and Dissolved Oxygen Measurements

The temperature, salinity, and dissolved oxygen content of the seawater in the ponds were measured by a multiparameter water analyzer (WTW Multi 3320, Munich, Germany) every four days.

2.2.3. Concentrations of NH4+, NO2, and NO3 in the Water Mass

The samples of NH4+, NO2, and NO3 were thawed at room temperature and analyzed via continuous flow colorimetry (Skalar San++ Classic continuous flow analyzer, Tinstraat 12, 4823 AA Breda, Netherlands), with accuracy and precision values better than 5%. The detection limits for NO2, NO3, and NH4+ were 0.025 μmol/L, 0.05 μmol/L, and 0.08 μmol/L, respectively.

2.2.4. Analysis of Nitrogen Content in Plants

At the beginning and end of each experiment, 10 plants were randomly selected from the FTWs used for the experiment. After being weighed, they were freeze-dried, crushed, and placed in polyethylene plastic bags to be stored in the dark at 4 °C until analysis. The nitrogen content in the processed biological and sediment samples was analyzed via an elemental analyzer (ThermoFisher FLASH2000, Waltham, MA, USA).

2.2.5. DIC and N2O Analysis

DIC was analyzed by a DIC analyzer (Apollo, Model AS-C3, 18 Shea Way, Newark, DE 19713, US). An excess of 6% H3PO4 + 10% NaCl solution was added to a 1.0 mL water sample to convert the DIC in the sample into free CO2. The CO2 gas was then dried and measured by a nondispersive infrared detector. The accuracy and precision of this method are both better than 0.2% [23].
For N2O analysis in the laboratory, subsamples of N2O were prepared by introducing the water sample into a 20 mL headspace vial, and approximately 12 mol of the water sample was replaced with high-purity nitrogen. After equilibrium was reached, the headspace was analyzed via headspace gas chromatography with an electronic capture detector (GC2010, Shimadzu, Kyoto, Japan). Detailed information for this method can be found in [24].

2.2.6. Calculation of Greenhouse Emission Fluxes

The fluxes of CO2 and N2O were determined by daily measurements of temperature and salinity throughout the entire breeding process. The specific calculation formula [25] is as follows:
F = 0.251 <U2> (Sc/660)–0.5 ΔpGHG
where U represents the average wind speed (m/S) and SC represents the dimensionless Schmidt coefficient, which was calculated following methods in Wanninkhof [25]. The term ΔpGHG refers to either ΔpCO2 or ΔpN2O. The GHG flux during the entire incubation process was determined by summing the GHG flux at each individual stage.
Since the wind speed is low in culture ponds, we defined the flux potential by assigning a value of 1 to U in Equation (1). The resulting flux potential of N2O was then calculated as the CO2-equivalent emission rate multiplied by 300, the radiative forcing (reference) of the same unit (mmol m−2 d−1).

3. Results and Discussion

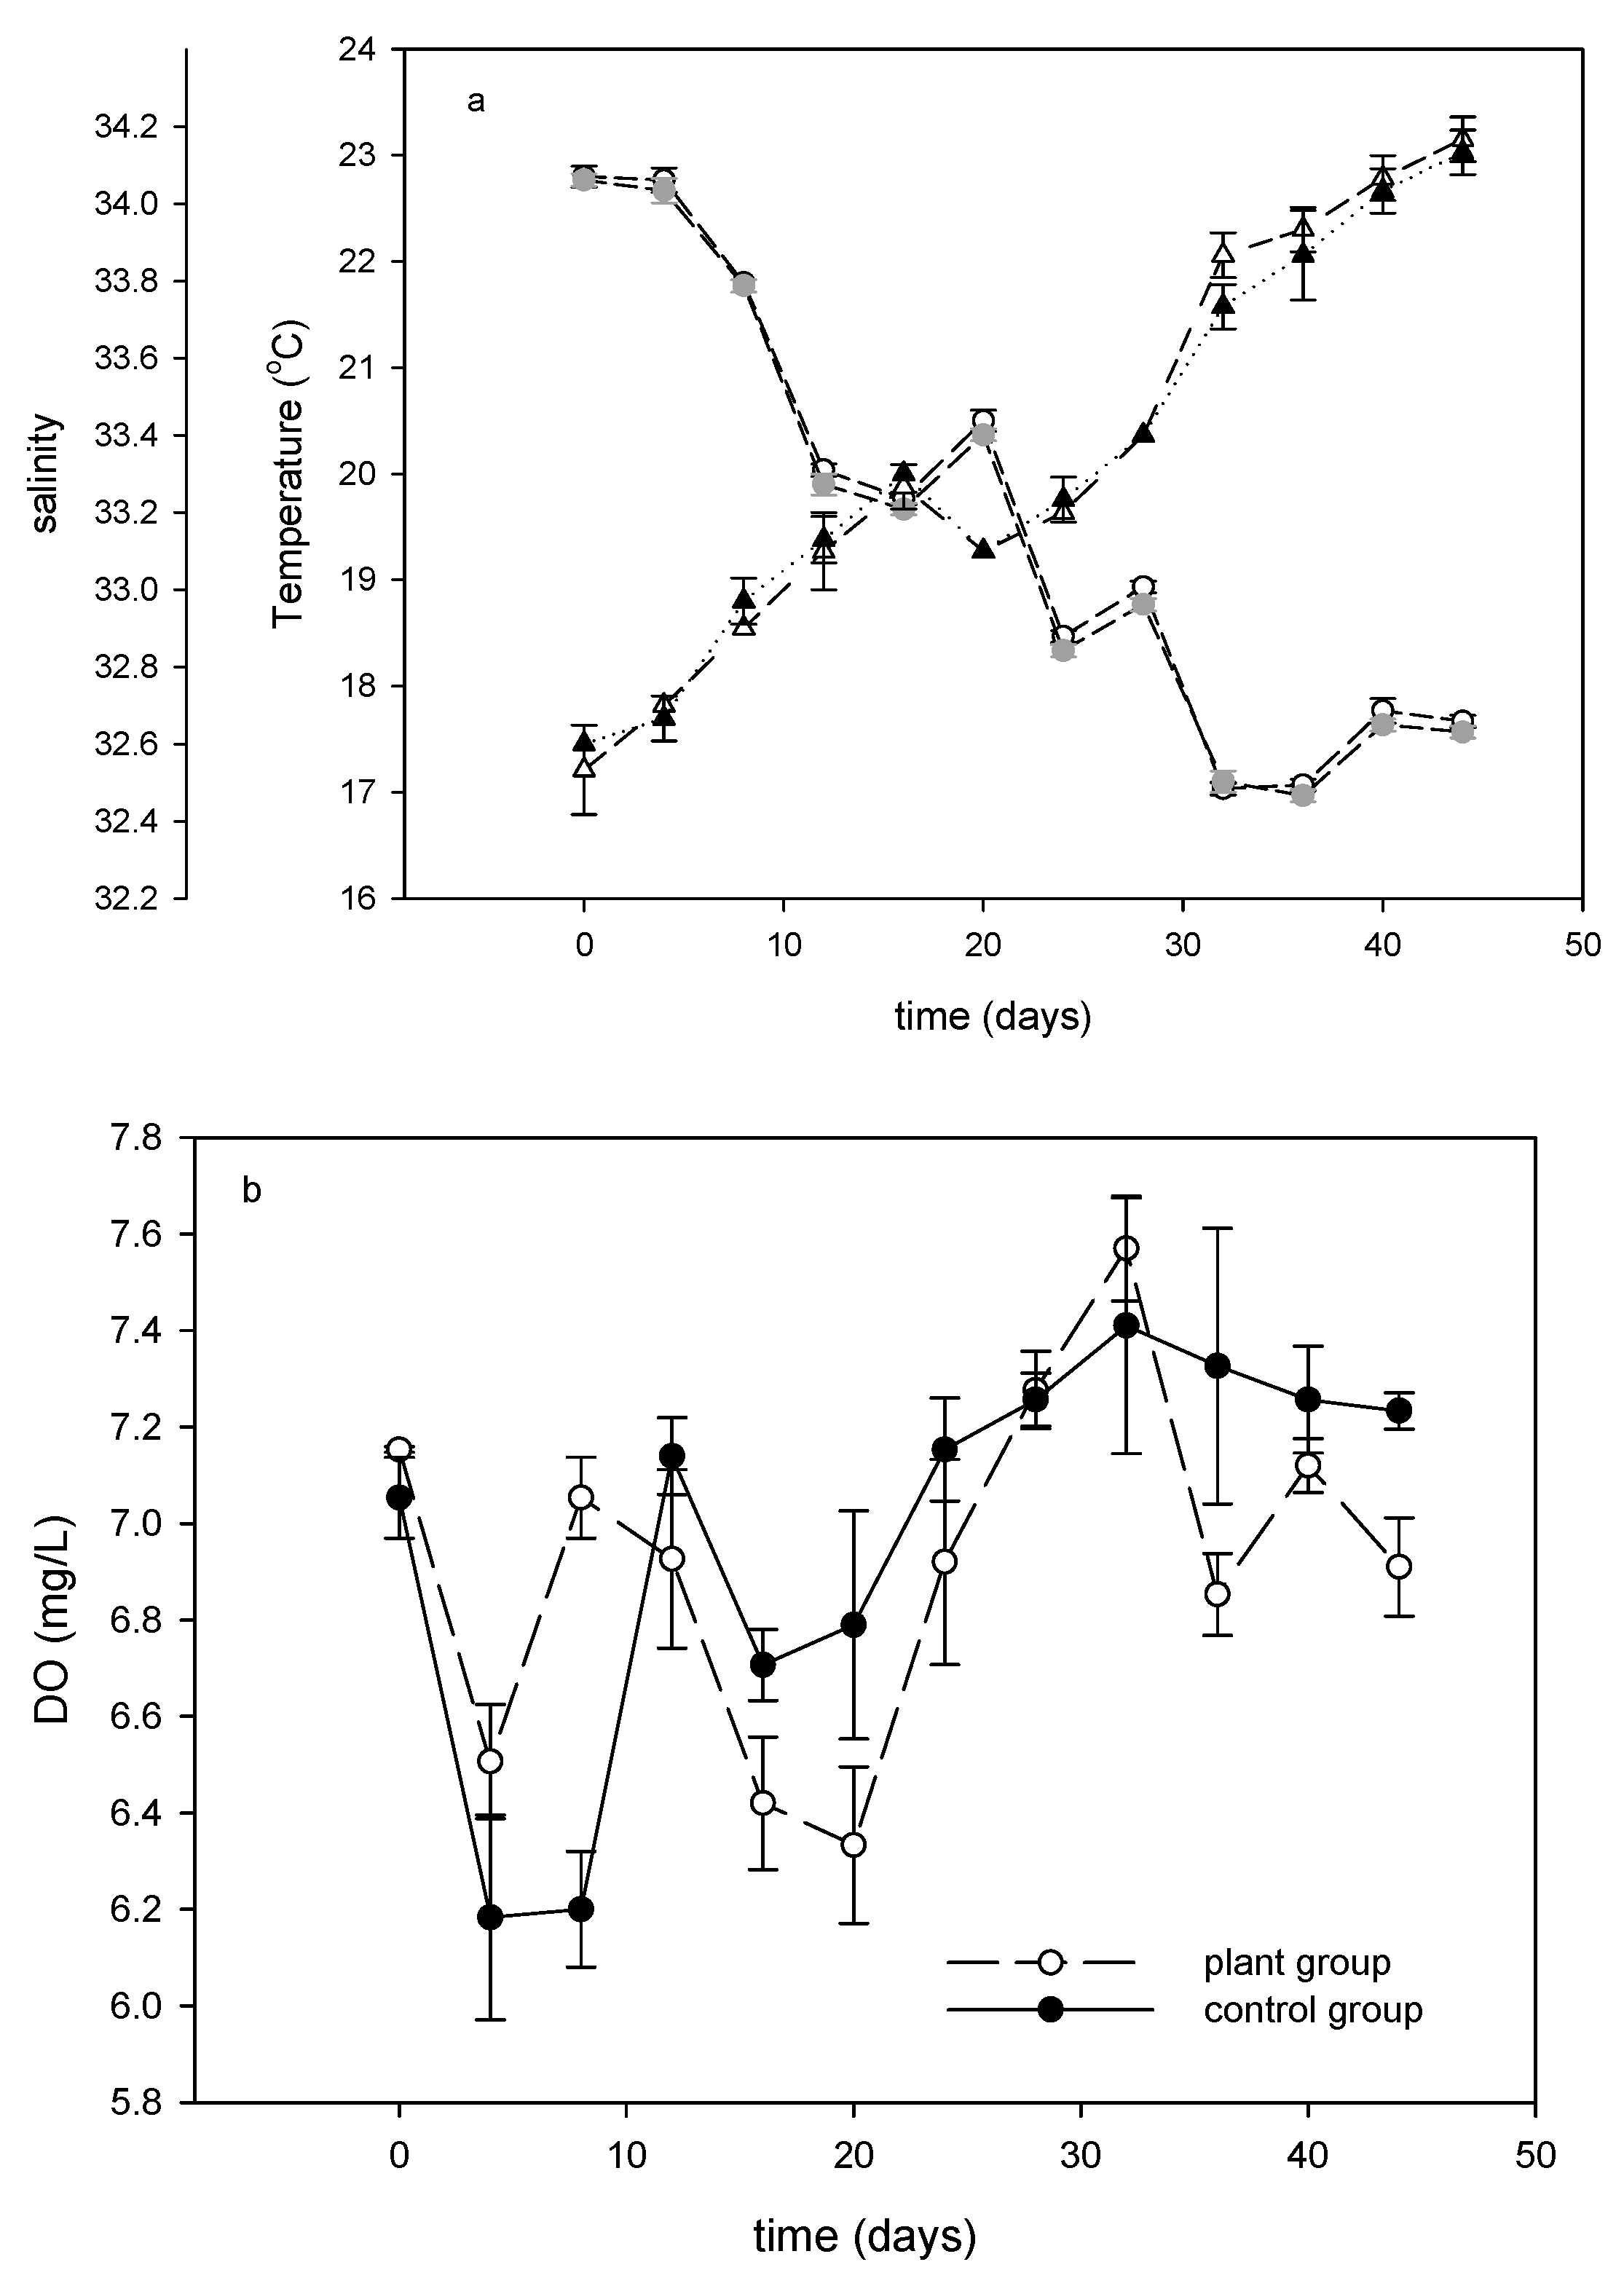
3.1. Temperature, Salinity, and Dissolved Oxygen

The distributions of temperature, salinity, and DO are shown in Figure 2. As shown in Figure 2a, during the 44 days of the experiment, the water temperature in both the plant group and the control group decreased in the same pattern, which resulted from decreasing air temperature, whereas the salinity continued to increase, which was probably due to evaporation over the 44 days. The DO concentrations in both the plant and control groups fluctuated sharply and followed a similar pattern, with minima observed on day 4 and between days 16 and 20 in both groups and another minimum occurring on day 36 in the plant group. However, the DO distribution pattern could provide only limited information since all the ponds were aerated to ensure that the oxygen concentration in the water was not so low that it affected the normal respiration processes of the cultured grouper.

3.2. Effect of Floating Treatment Welands on Dynamics of Dissolve Inorganic Nitrogen

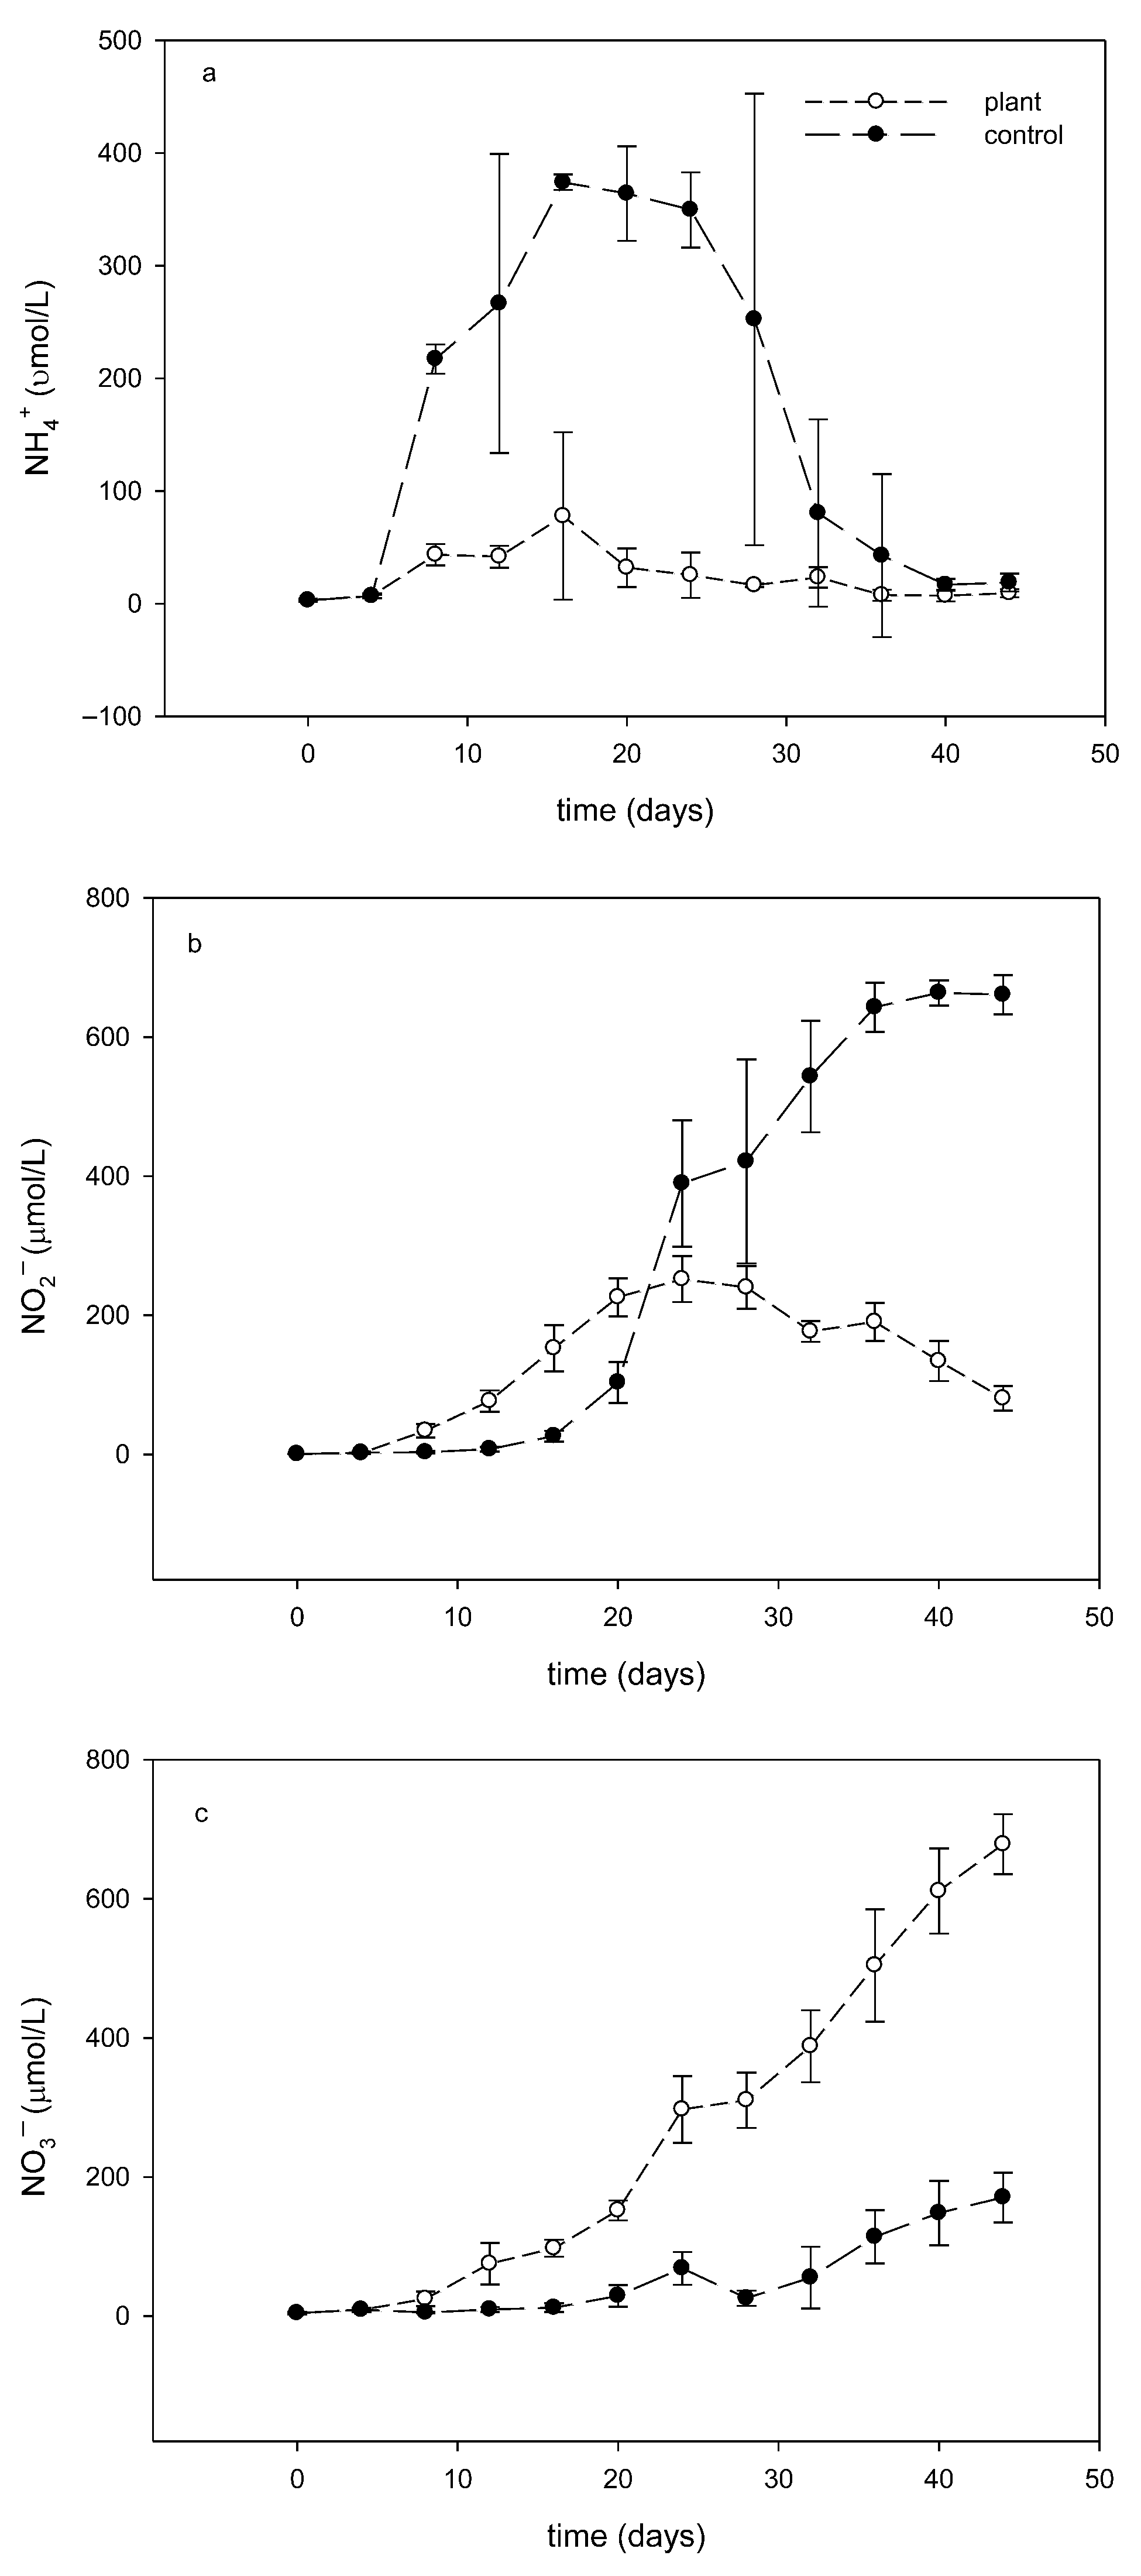
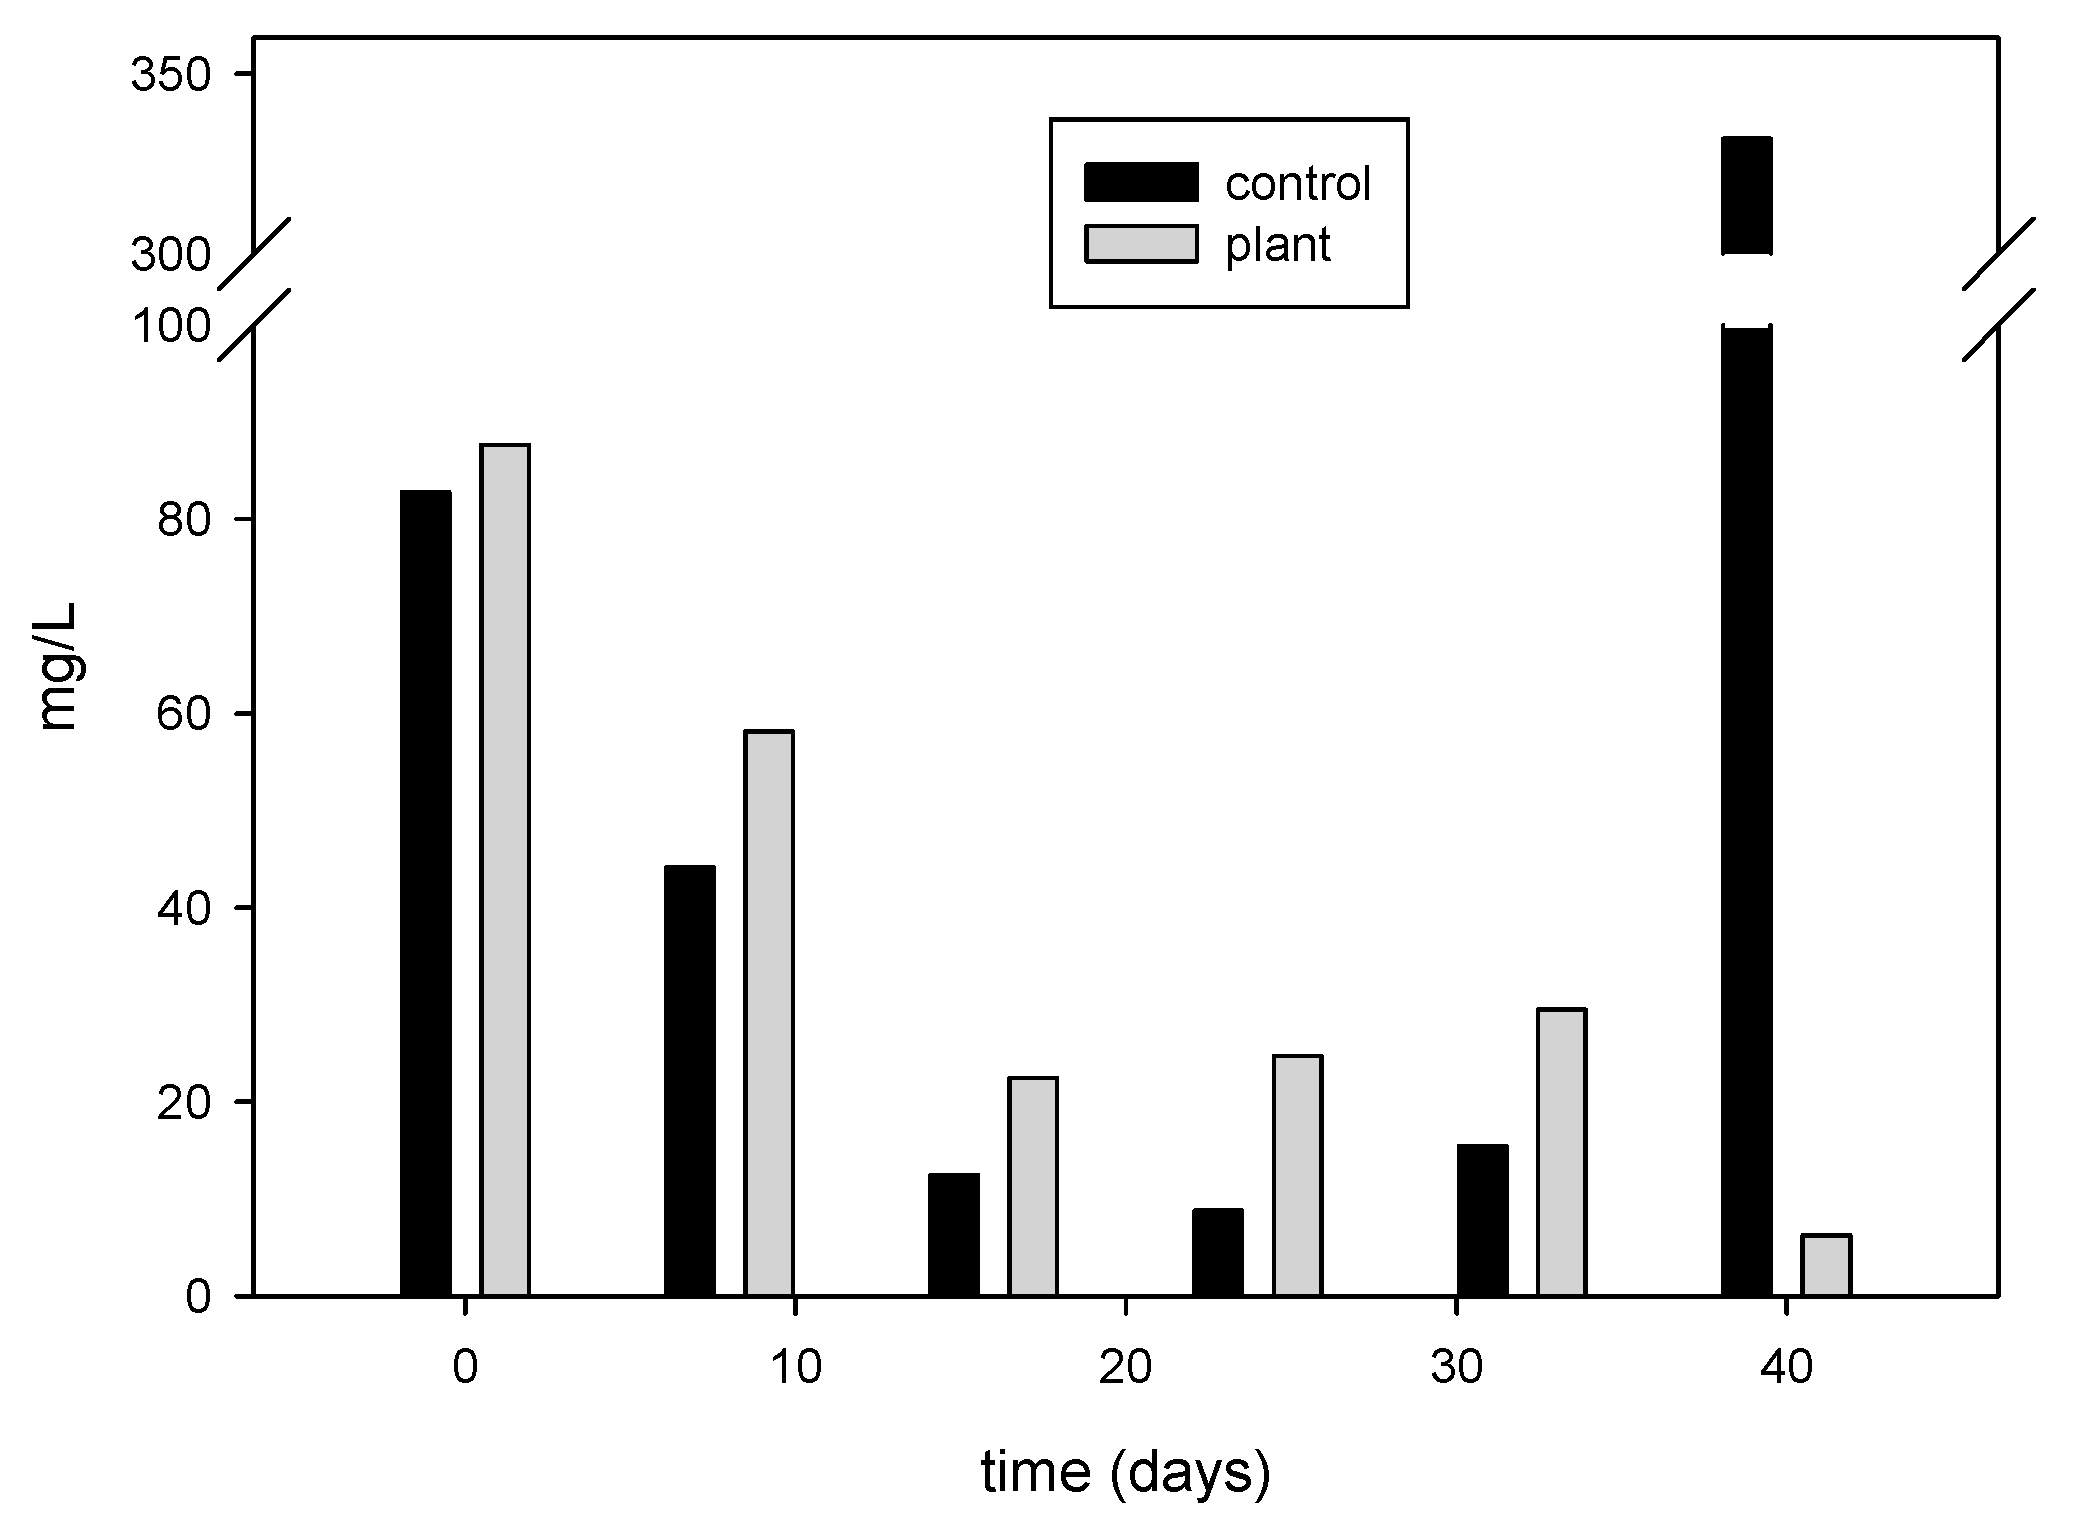
3.2.1. Dissolve Inorganic Nitrogen Variation During the Experiment

The main dissolved inorganic nitrogen species studied were NH4+, NO2, and NO3. The variation in these chemical species over the 44 days is shown in Figure 3a–c. The NH4+ and NO2 concentrations and their variations with time in the plant and control groups differed markedly during the experiment. In the plant group, the NH4+, NO2, and NO3 concentrations increased in a similar manner during the first 16 days. The NH4+ concentration in the plant group reached its maximum value of approximately 78 μmol/L and then decreased and remained at a relatively stable concentration, whereas in the control group, the NH4+ concentration increased sharply to a maximum of 374 μmol/L on day 16, which was approximately five times greater than the maximum NH4+ concentration in the plant group. Figure 3a also shows that, on day 16, NH4+ was dominant among all three inorganic nitrogen species in the control group. After day 16, the NO2 and NO3 concentrations continued to increase, but the NO2 concentration was approximately 50–70 μmol/L higher than that of NO3 on both day 16 and day 20. The NO2 concentration in the plant group reached a maximum and then decreased, whereas in the control group, the NO2 concentration increased, reaching its maximum value at the end of the experiment, when NO2 became the dominant inorganic nitrogen species. The NO3 concentration in the plant group exceeded that of NO2, reaching a value as high as 678 μmol/L, and became the dominant inorganic nitrogen species at the end of the experiment. However, in the control group, the NO3 concentration continued to increase but never exceeded 200 μmol/L.
Notably, the deviations in the NH4+ and NO2 concentrations from pond to pond in the control group were greater than those in the plant group, especially after day 20, suggesting that the chemical environments in the ponds with no FTWs were not as stable as those in the ponds with FTWs.

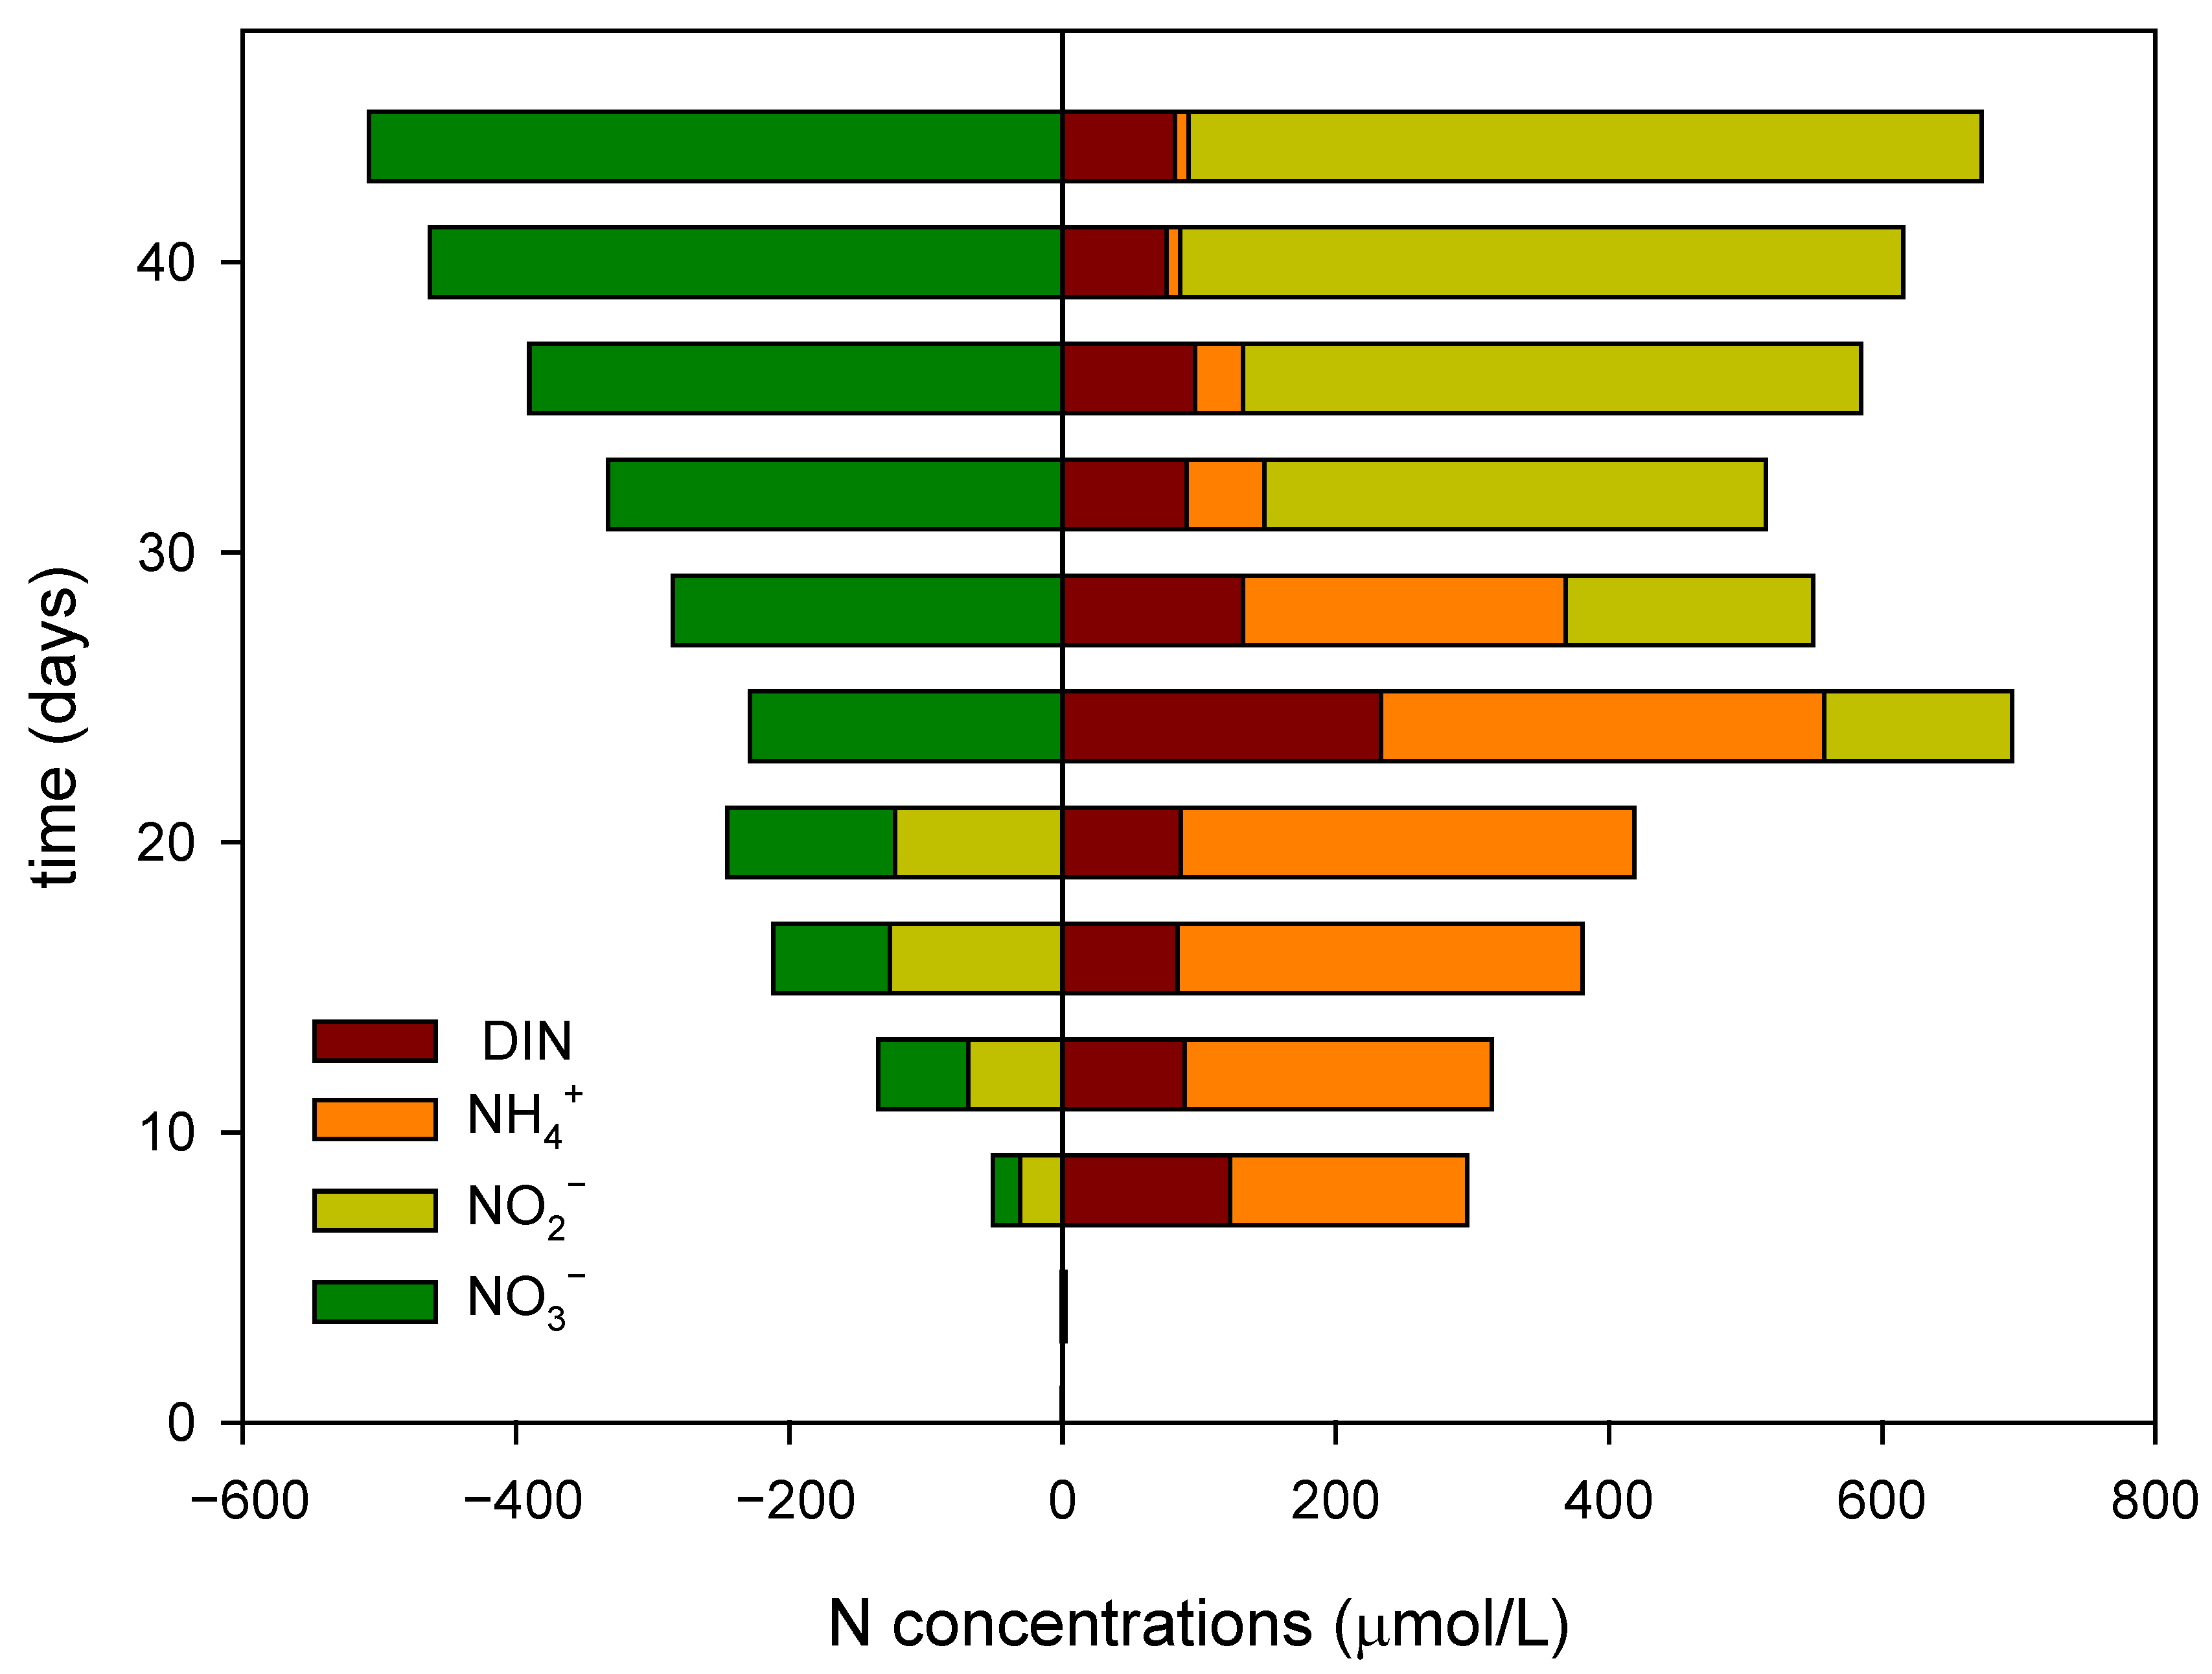
3.2.2. Differences in Dissolved Inorganic Nitrogen Dynamics Between the Plant and Control Groups

To further analyze the differences between the control group and the plant group, the ΔDIN and ΔNH4+, ΔNO2, and ΔNO3 values were calculated by subtracting the respective values of the plant group from those of the control group. The results are shown in Figure 4. Figure 4 shows that a relatively stable difference in DIN existed between the plant group and the control group, with an average value of approximately 90 μmol/L.
Among the inorganic nitrogen species, marked differences were detected. For NH4+, except on day 0 and day 4, the concentration in the control group was greater than that in the plant group throughout the whole experiment, with the largest difference of 332 μmol/L occurring on day 24. For NO2, ΔNO2 was negative and reached a minimum value of approximately −120 μmol/L until day 20 but subsequently became positive and increased to approximately 580 μmol/L at the end of the experiment, whereas ΔNO3 was negative throughout the experiment, indicating that the plant group contained more NO3 throughout the experiment.
Notably, feed was continuously added to both groups, which increased the concentration of DIN as a whole. Therefore, to reveal changes in the concentration of each DIN constituent, the NH4+, NO2, and NO3 contents were divided by the DIN concentration and multiplied by 100 for the plant and control groups. The results are shown in Table 1. The data show that in the first 4 days, the constituents of both groups were similar. After day 8, differences appeared. In the plant group, the NH4+ content decreased at a relatively slow rate, as did the NO3 content, but the NO2 content increased; however, in the control group, the NH4+, NO2, and NO3 contents suddenly changed, and NH4+ became the dominant species in the DIN pool, which lasted until day 20. After day 20, in the plant group, the NO2 content slowly decreased, whereas the NO3 content steadily increased, finally dominating the DIN pool of the plant group. In the control group, the NH4+ content decreased, whereas NO2 became the dominant species, and the NO3 content increased slightly.
From the above observations, the following conclusions can be drawn. (1) A substantial amount of nitrogen was removed from the water mass, which is in agreement with previous studies showing efficient nitrogen removal by FTWs [26], and this method can be used for aquaculture water remediation [27]. To reveal how the nitrogen was consumed and transformed, a simple calculation was performed. Considering the 90 μmol/L DIN concentration difference between the plant and control groups and considering the volume of approximately 22.6 m3 for each pond, the amount of nitrogen removed from the water mass of each pond was approximately 28.5 g. However, when the nitrogen content of plants in a single pond was calculated, the amount of nitrogen assimilated by the plants in each pond was 7.9 g, which was approximately 1/4 of the nitrogen removal in the plant group. This phenomenon is in agreement with that reported by Tang et al. [28]; that is, most nitrogen removal was not due to plant assimilation. However, in this study, pathways other than plant DIN assimilation in the plant group remain unknown. One possible pathway is the consumption of DIC by phytoplankton, since the chlorophyll a concentration in the plant group was greater than that in the control group (10–15 mg/L) (Figure 5). Therefore, do FTWs promote the health of ecosystems such that nutrients are further assimilated? Or are the nutrients consumed by other microorganisms? These questions need to be further addressed. (2) NH4+ in the plant group was consumed faster than that in the control group; therefore, it is tempting to assume that the plants or phytoplankton tended to utilize low-valence NH4+; however, from the markedly greater “oxidative” value in the plant group than in the control group, it can be deduced that greater nitrification occurred in the plant group. The reason for this difference was likely not related to the water mass, since the results of one-way analysis of variance revealed that the DO concentrations in the two groups were not significantly different (p > 0.05). The roots of constructed wetlands are generally anaerobic, but aquatic macrophytes can transport oxygen to this zone and sustain nitrification [17]. Therefore, it could be assumed that ammonia oxidizers were active in the rhizosphere of the plant group [28], resulting in differences in the NH4+, NO2, and NO3 contents between the two groups. However, it should be noted that other mechanisms, such as denitrification and nitrifier denitrification, may also regulate the nitrogen dynamics in the FTW; hence, more work is needed to reveal the above mechanisms in future studies.

3.3. Effect of Floating Treatment Welands on Dynamics of Dissolved Inorganic Carbon and N2O in the Water

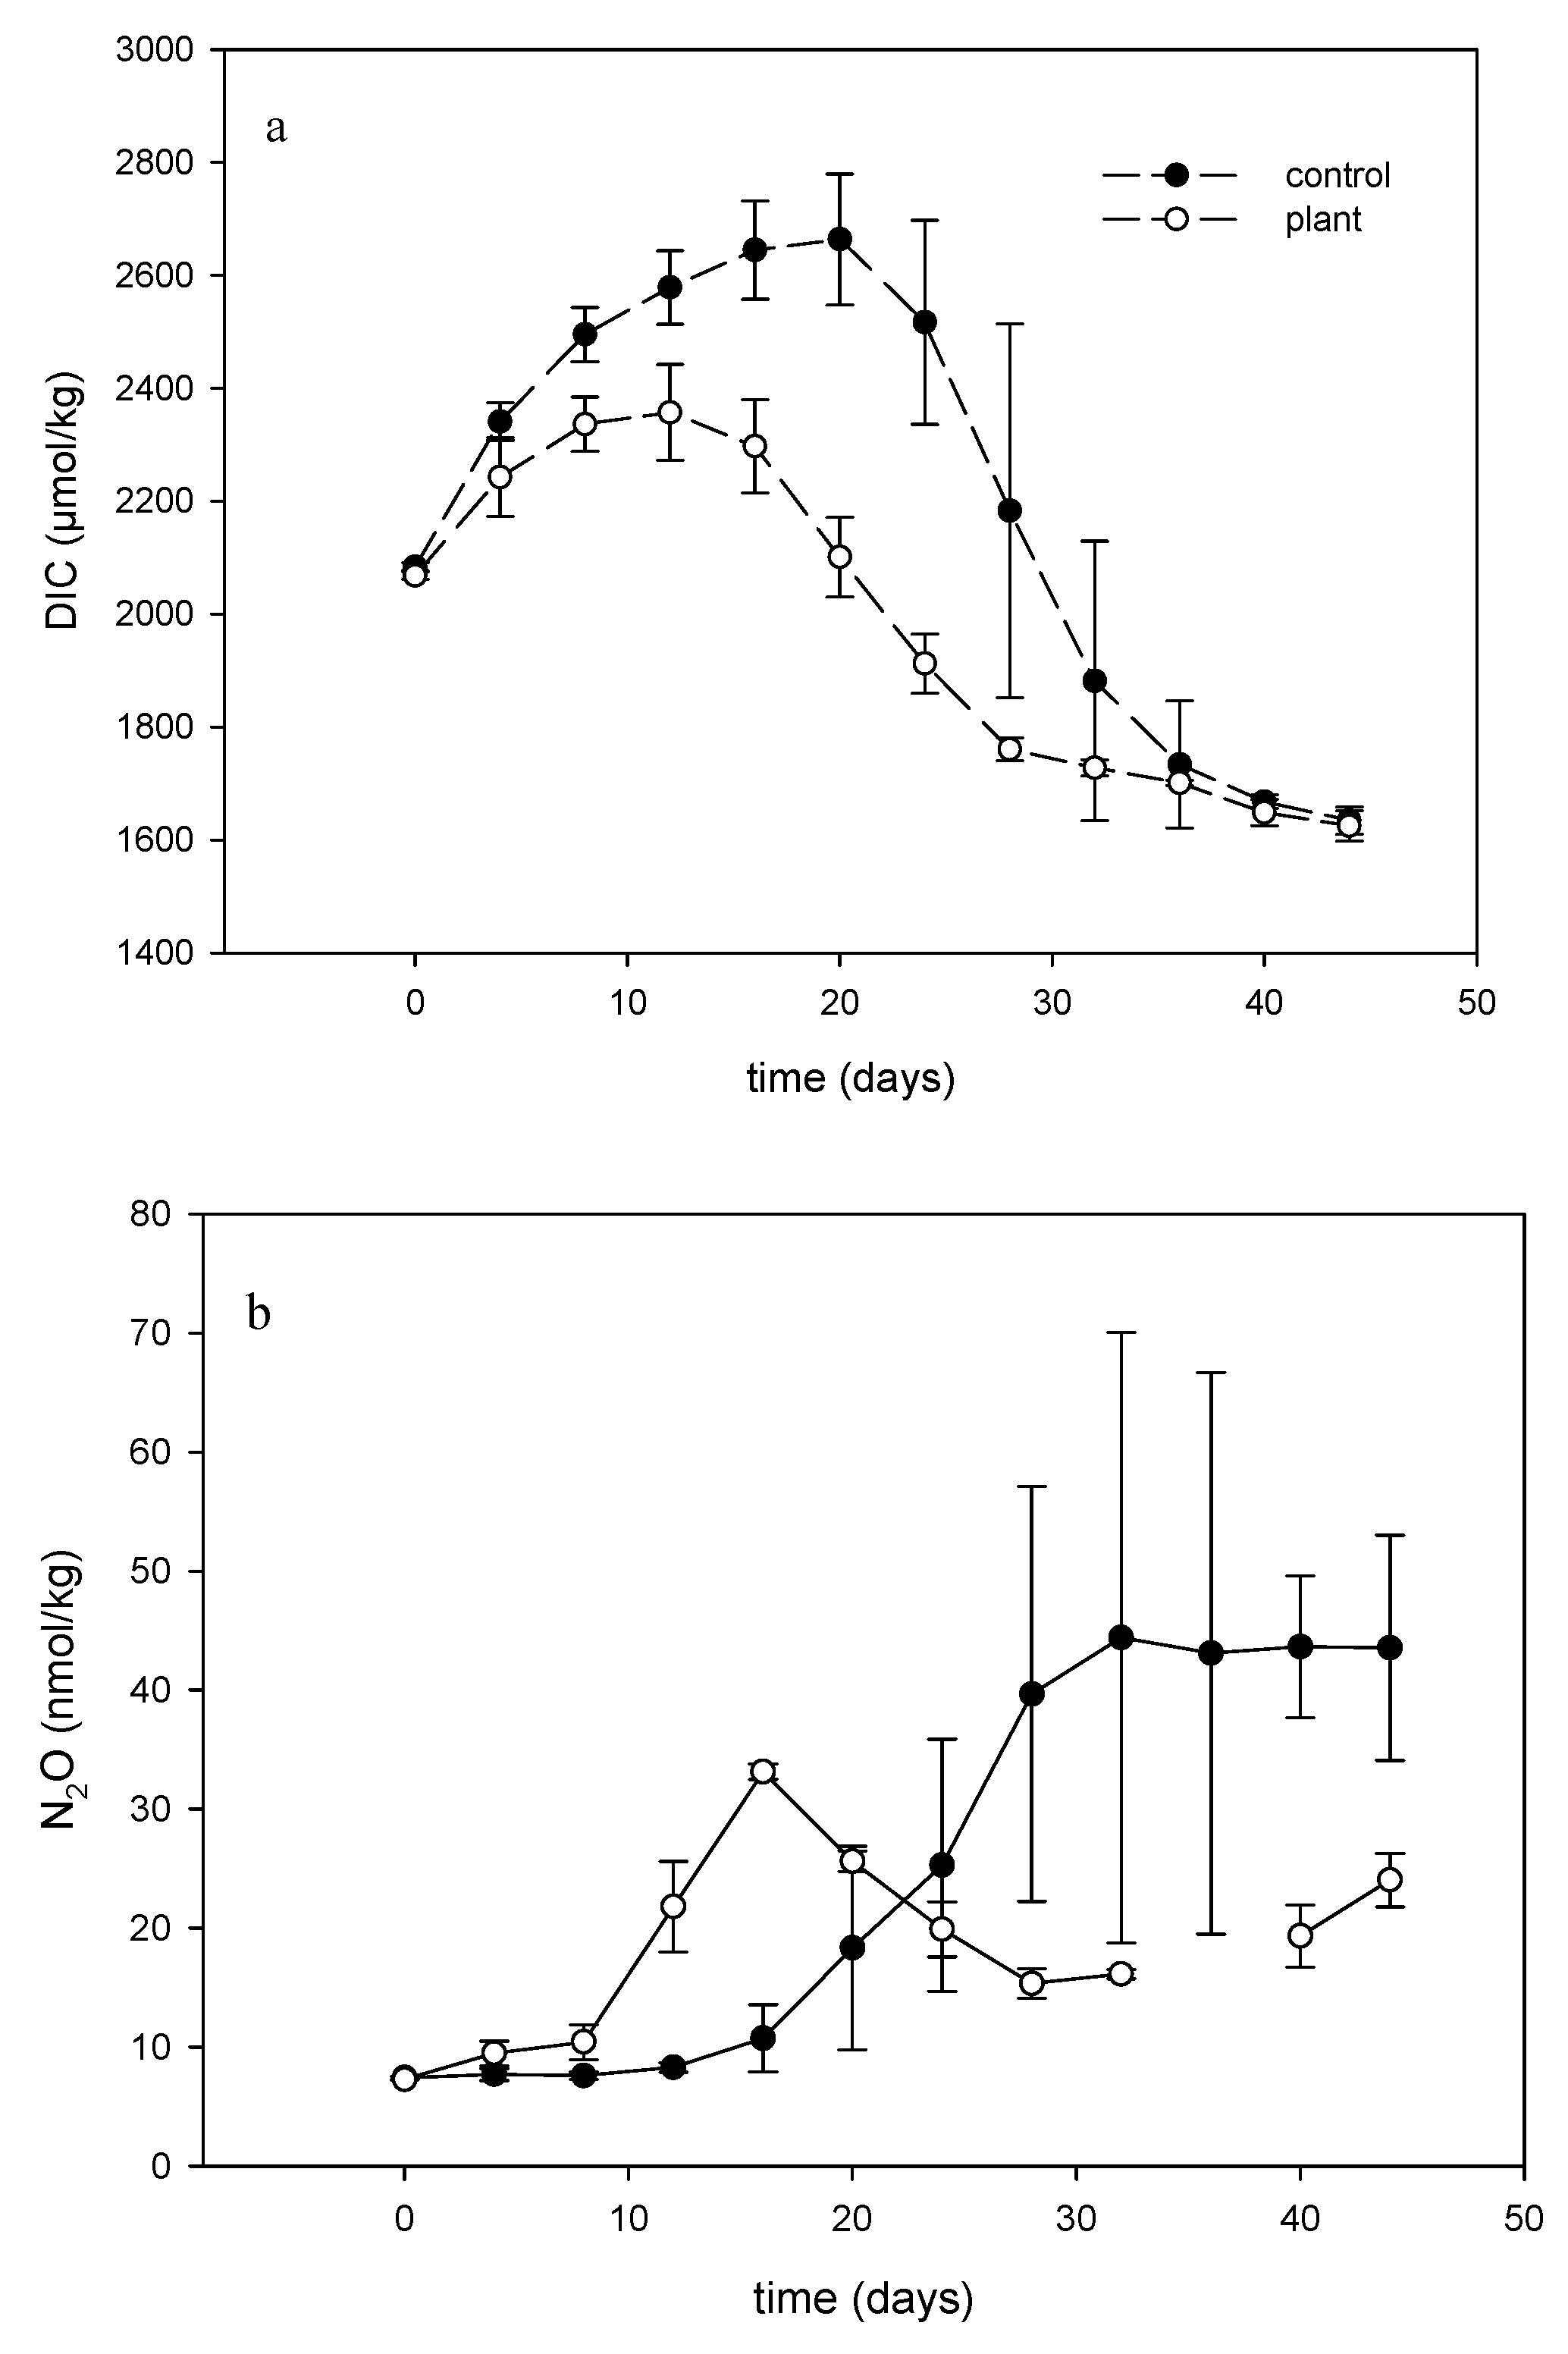
3.3.1. Dissolved Inorganic Carbon and N2O in the Water

DIC and N2O also showed different patterns in the two groups in this study (Figure 6a,b).
Interestingly, the DIC concentrations in the two groups were nearly equal at the beginning and end of the experiments, but the DIC concentrations substantially differed in the intermediate stages of the experiment. In the plant group, the DIC concentration increased to its maximum value of 2357 μmol/kg on day 12 and then decreased until the end of the experiment, whereas in the control group, the DIC concentration continued to increase to a maximum value of 2664 μmol/kg on day 20 before it monotonically decreased.
The N2O concentration in the plant group sharply increased beginning on day 8 and reached a maximum of 33 nmol/kg. The N2O concentration then decreased sharply up to day 28 to a minimum of 15 nmol/kg and then slightly increased to 24 nmol/kg at the end of the experiment, whereas in the control group, the N2O concentration reached the highest value of approximately 44 nmol/kg.
As shown by the NH4+ and NO2 concentration data, the differences in DIC and N2O concentrations among the ponds in the control group were greater than those in the plant group, again indicating the instability of the chemical environment of the ponds without FTWs.

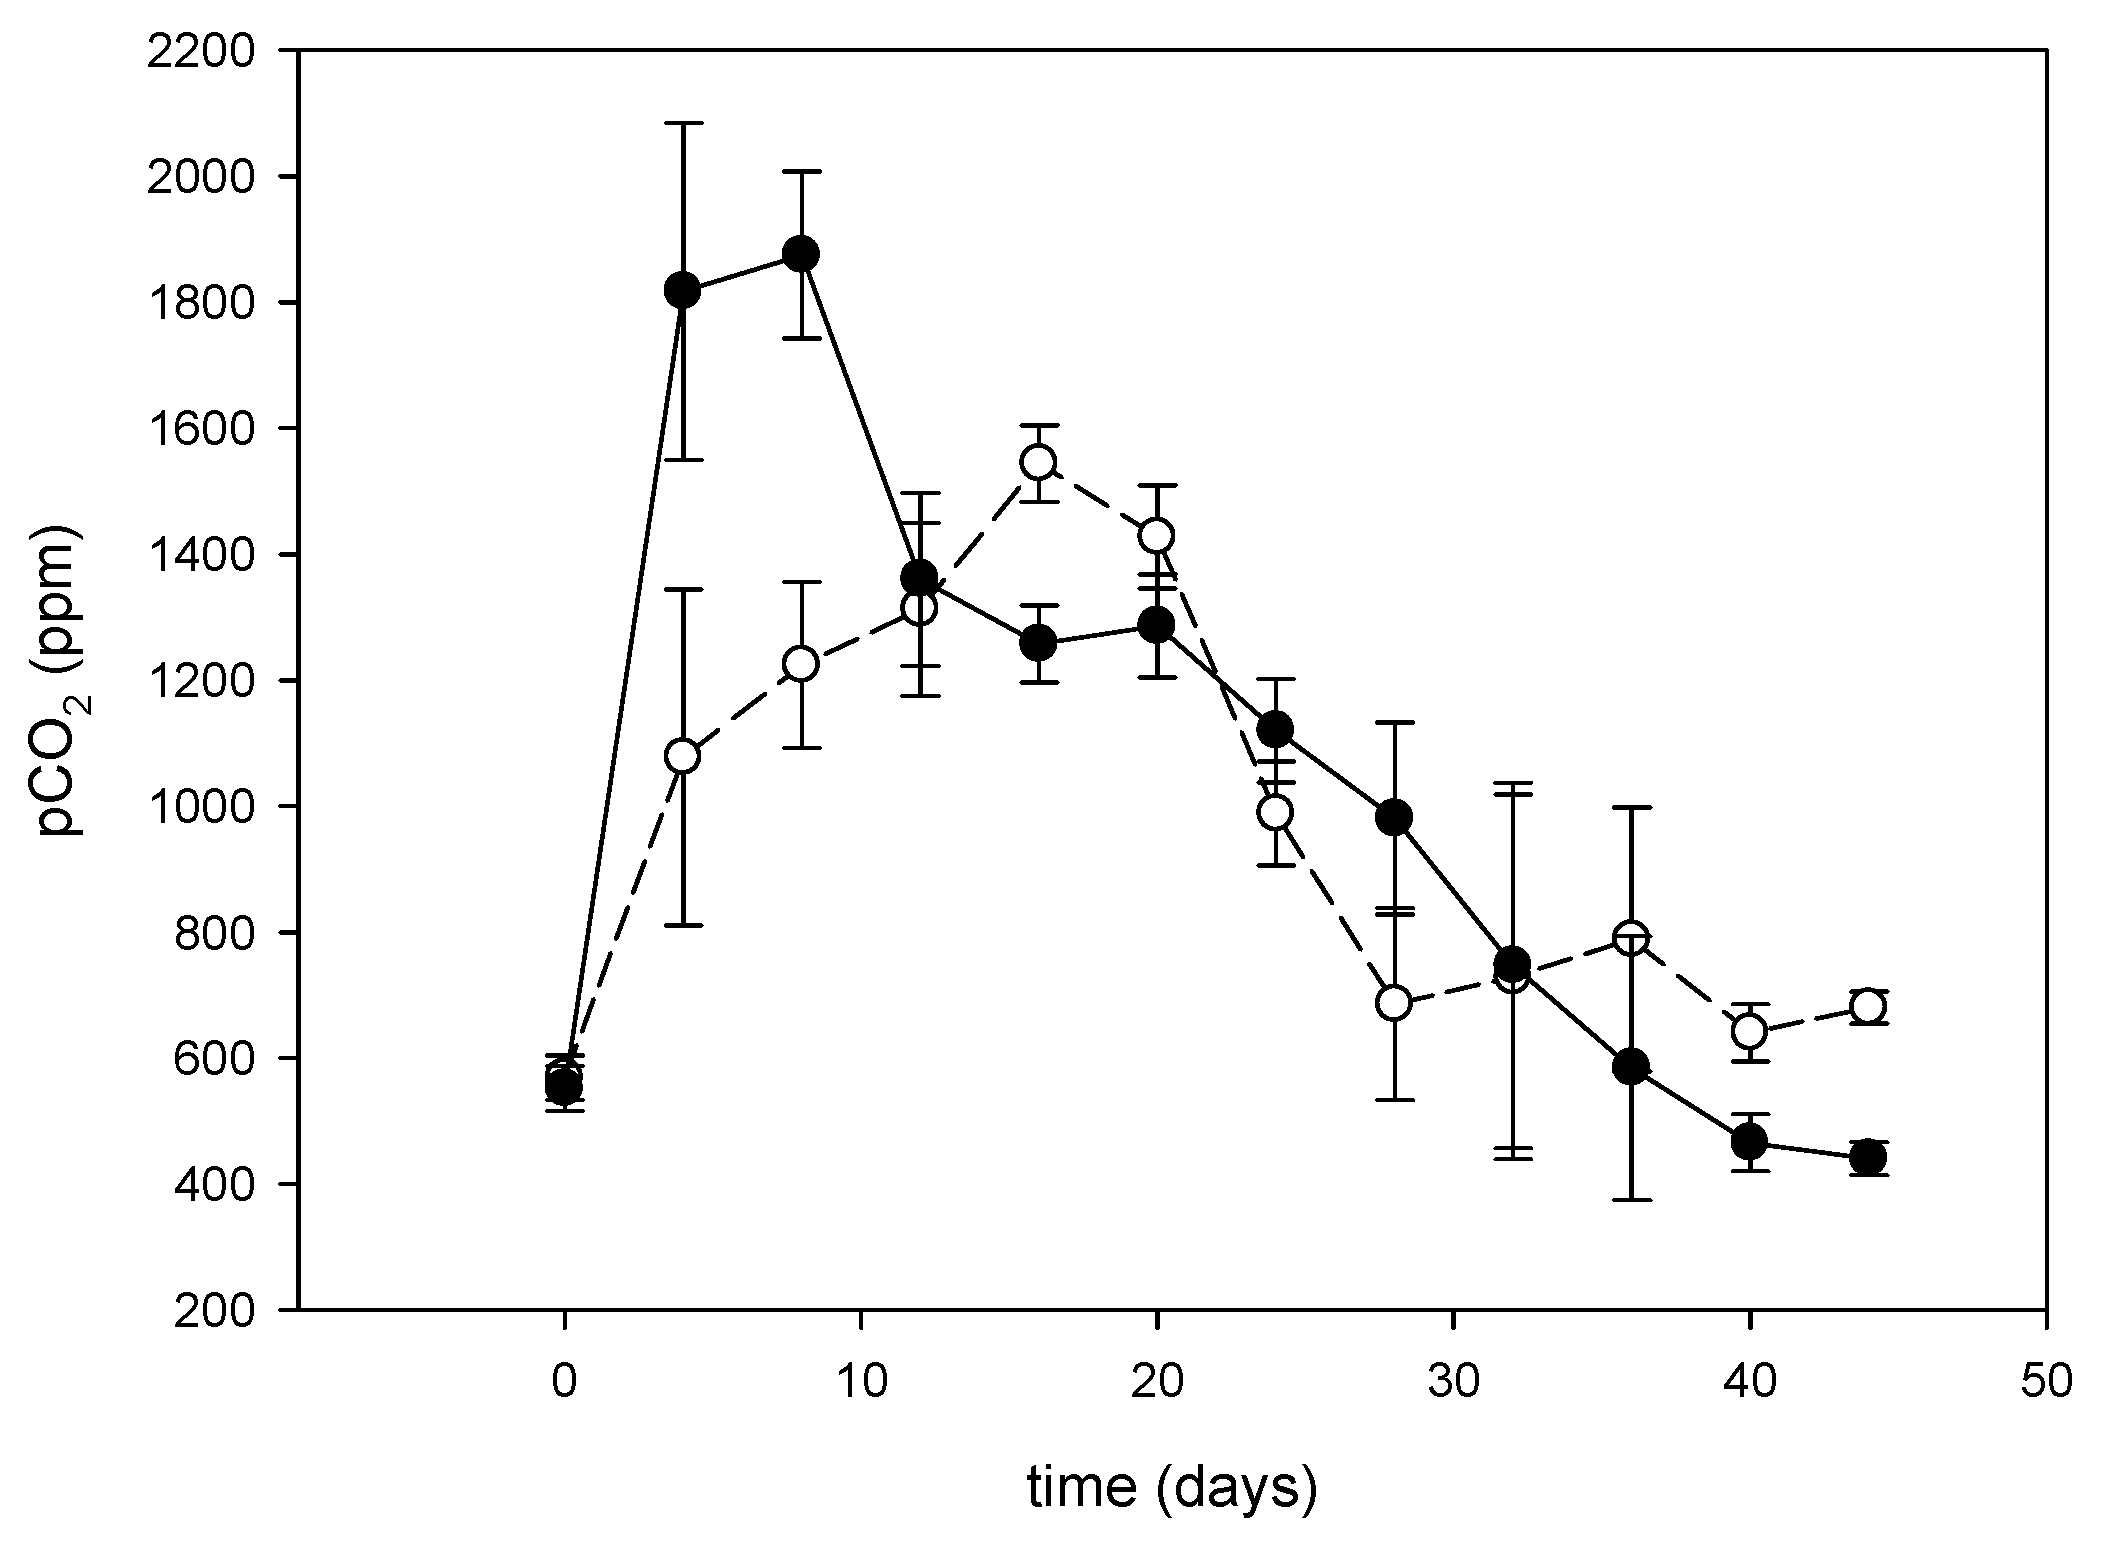
3.3.2. Response of CO2 Dynamics to Dissolved Inorganic Nitrogen Transformation

The DIC concentrations in both the plant group and the control group reached a maximum during the experiment. These maxima seem to correspond to those of NH4+ in the respective groups. To reveal the relationship between NH4+ and DIC, these two parameters in the plant and control groups are plotted in Figure 7. Excluding the data from days 0 and 8 (in the oval in Figure 7), the data were fitted with a linear curve (Figure 7). Interestingly, in both groups, NH4+ and DIC were significantly correlated with each other, but the slopes of the two fitting curves are quite different. It could be deduced from the significant correlation between NH4+ and DIC in both groups that DIC was closely coupled with NH4+. This correlation can be explained by the processes of respiration [29] and excretion in groupers and other consumers or the remineralization of organic matter in the ponds. For all the aquaculture ponds, feed was added to maintain growth. Therefore, the residual feed and feces from the grouper accumulated and then remineralized to DIC and NH4+. There was also a decrease in both DIC and NH4+ after days 20 and 12 in the control and plant groups, respectively. This decrease corresponded with an increase in chlorophyll a in both groups in the latter half of the experiment (Figure 3 and Figure 6), suggesting that DIC and NH4+ may be at least partially consumed to promote primary productivity. Moreover, although the chlorophyll a concentrations in both groups were low (Figure 5), for the five measurements of chlorophyll a, the concentration in the plant group was generally 10–15 mg/L higher than that in the control group except on the first and last days, indicating greater productivity in the plant group than in the control group, which could also partially explain the lower DIC concentration presented in the plant group than in the control group. For the control and plant groups, the DIC/NH4+ ratios were 2.8 ± 0.3 and 11.7 ± 2.5, respectively. A possible explanation is that there was faster consumption of NH4+ and/or oxidation of NH4+ by nitrification in the plant group than in the control group. Hence, due to differences in the productivity, nitrification rate, and NH4+ uptake in the presence of the FTW, the DIC concentrations, as well as the pCO2 values, differed between the two groups, especially during the first 10 days (Figure 8).

3.3.3. Dissolved Inorganic Nitrogen Transformation and N2O Dynamics

Figure 6b shows two notable phenomena: the maximum N2O concentration in the plant group on day 16 was three times greater than that in the control group on the same day, and the highest N2O concentrations over the whole experiment were observed in the control group after day 32, which reached a high-value plateau.
The plant group mentioned above presented “oxidative” characteristics. The variation in the different DIN components in this group suggested that, in addition to the possible uptake of NH4+ by the FTW, nitrification was the main process that transformed NH4+ into NO2 and then into NO3. During nitrification, N2O is a byproduct of NH4+ oxidization to NO2; therefore, the N2O concentration in the plant group was plotted against that of NH4+ (Figure 9A) and NO2 (Figure 9B). A significant positive correlation between N2O and NH4+ was detected when the last two data points were excluded. When N2O was plotted against NO2, a significant correlation could be detected only prior to day 16 (Figure 9B); however, the R2 value of the N2O–NO2 correlation was greater than that of the N2O–NH4+ correlation, indicating a closer connection between the first pair of parameters. Moreover, together with the information provided in Table 1, when the NH4+ concentration sharply decreased, the N2O/NO2 ratio strongly deviated from the linear correlation line. It could be deduced from this pattern that N2O in the plant group was produced by NH4+ oxidation during nitrification; therefore, it was positively correlated with NO2. When NH4+ was consumed and its concentration decreased to a certain level, approximately 20% in this case, the production of N2O slowed. When the rate of N2O escape from water via air–water interface exchange was faster than that of production, the N2O concentration starts to decrease.
For the control group, the large amount of NH4+ and low level of NO3 (Figure 3c) observed indicated that the environment was more “reductive”, and the increase in NO2 around the NH4+mamxium on day 16 indicated a change in the oxidative environment of the system. As shown in Figure 9C, a significant correlation existed between these two parameters after day 16, indicating the transformation of NH4+ to NO2 during nitrification. Moreover, the N2O content increased in a pattern similar to that of NO2. Unsurprisingly, a significant correlation between N2O and NO2 was observed. When the rate of N2O increase slowed, the NH4+ content also decreased to less than 10%.
On the basis of the phenomena observed in the control and plant groups, we propose an explanation for the difference in N2O dynamics between the two groups. Without interference from other factors, NH4+ accumulates quickly in grouper aquaculture ponds and is then transformed into NO2, which dominates the system for some time. During this process, large amounts of N2O are produced; when an FTW is present, NH4+ is consumed and quickly oxidized to NO2 and then NO3, which leaves less NH4+ for N2O production; therefore, there is a reduction in N2O emissions. It can be concluded from the above results that, both in the plant group and the control group, the NH4+ content in the DIN pool may be the key to N2O production; when it is lower than ~20%, the production of N2O slows.

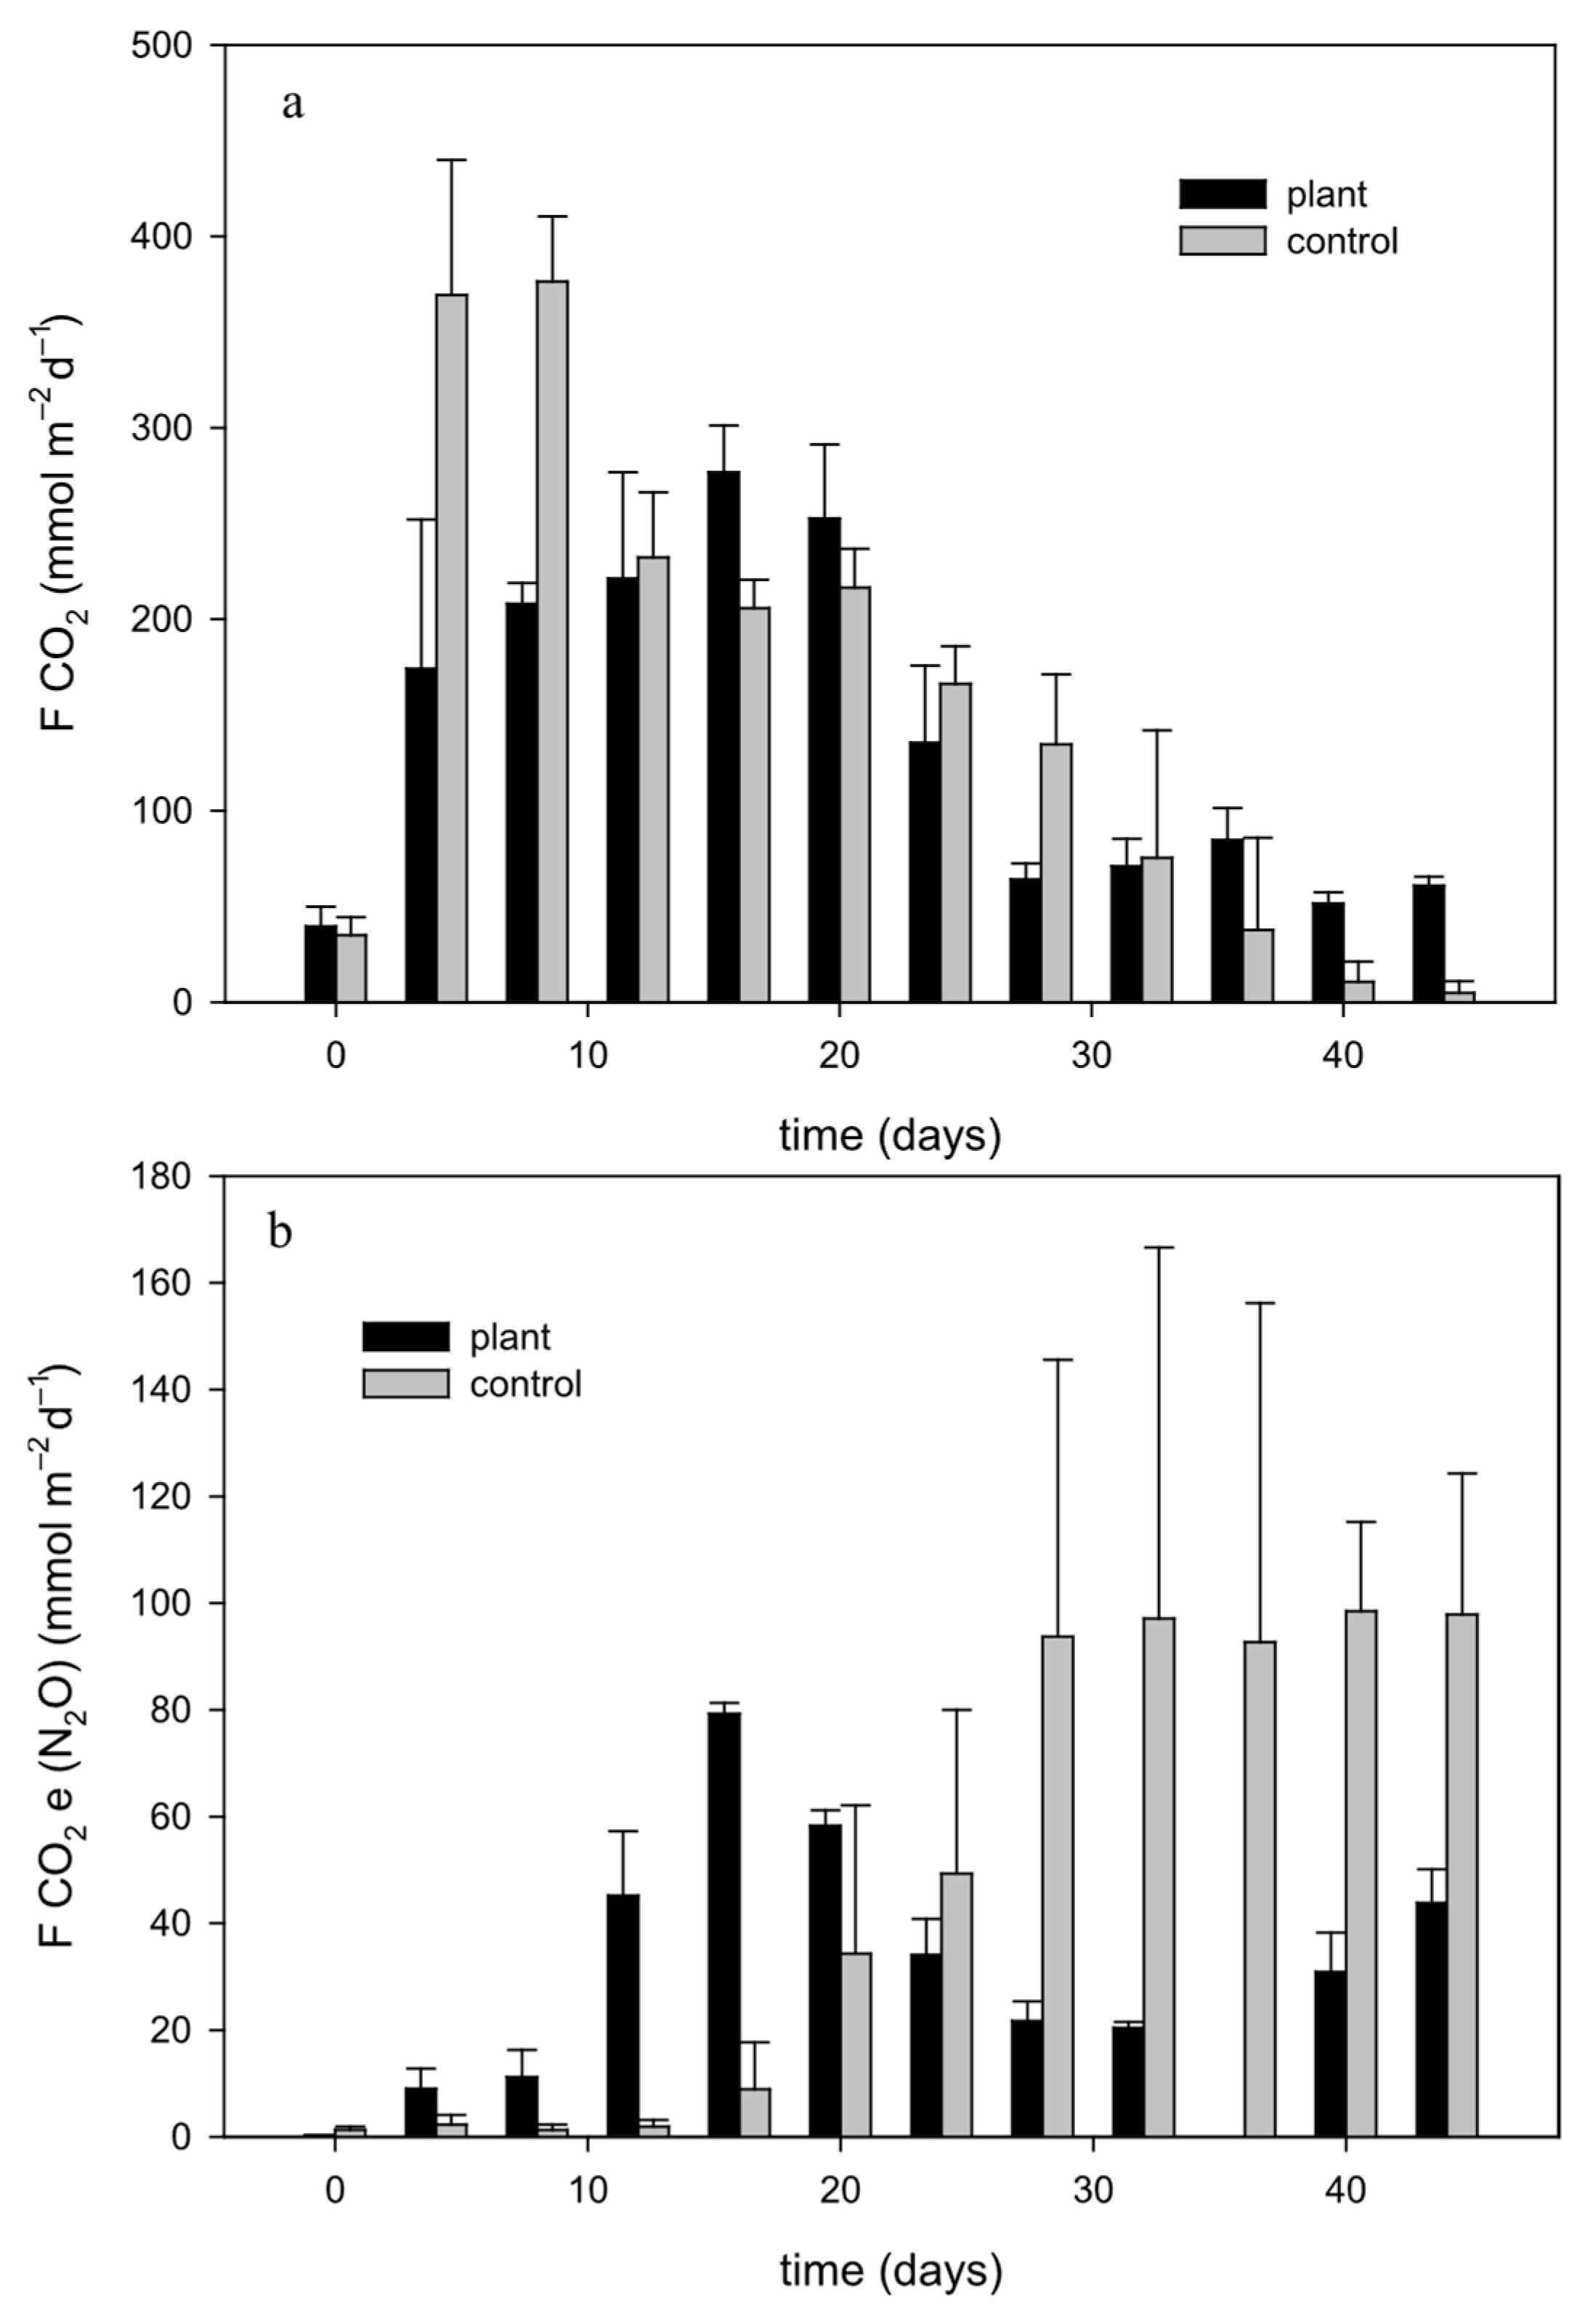
3.4. Effects of FTWs on the Potential Climate Effects of Grouper Culture

The greenhouse gas flux potentials of the plant group and control group were calculated, and the results are shown in Figure 10. Both the CO2 and N2O flux potentials presented patterns similar to those of the pCO2 and N2O concentrations. For the CO2 flux potential, the values on days 4, 8, and 28 were notably greater in the control group than in the plant group. Particularly on days 4 and 8, the FCO2 value in the control group was markedly greater than that in the plant group, which corresponded to that of pCO2, indicating that the greater flux in the control group most likely originated from respiration and remineralization of organic matter and the release of CO2. Once again, the N2O flux potential could be explained by the difference in N2O dynamics between the plant and control groups. To evaluate the overall differences between the plant and control groups, the average flux potentials of both groups were calculated. The FCO2 in the plant group was approximately 14% lower than that in the control group, suggesting that the plant group reduced the emission potential of CO2, whereas the FCO2-e(N2O) in the plant group, quick NH4+ uptake, and nitrification reduced the availability of NH4+ and therefore resulted in approximately 36% lower N2O production and emission. The sum of the CO2 and N2O flux potentials of the plant and control groups were 175.5 mmol m−2 d−1 and 216.0 mmol m−2 d−1, respectively, indicating that even with a relatively low density of S. portulacastrum on the FTW, the CO2 and N2O fluxes, especially those in the latter, were sufficiently reduced, which could be a possible solution for reducing greenhouse emissions from aquaculture systems.

4. Conclusions

A comparison of nitrogen constituents and greenhouse gases (CO2 and N2O) in grouper culture ponds with and without S. portulacastrum FTWs revealed the following information. (1) With respect to the S. portulacastrum density employed in the experiment, the DIN concentration was approximately 90 μmol/L lower in the plant group than in the control group, indicating that the FTW could remove sufficient DIN from the water mass. (2) The FTW, NH4+, and NO2 appeared to be removed or transformed into NO3, which then became dominant in the system; however, the control group system was dominated by NH4+ in the first 20 days, followed by NO2 at the end of the experiment. The plant group system was more “oxidative” than the control group system was, suggesting that a stronger nitrification process may be present in the rhizosphere of plants in the FTW. (3) DIC concentrations in both groups correlated with NH4+, suggesting grouper respiration and remineralization of organic matter, whereas the DIC concentration in the group with the FTW was lower than that in the group without the FTW during the experiment, which may be explained by the increase in primary production in the former system. (4) N2O production was markedly reduced in the group with the FTW, probably due to NH4+ removal by plant uptake or oxidation. When the NH4+ content decreased to less than 20%, N2O production clearly slowed. (5) The CO2 and N2O flux potentials in the group with FTWs were 14% and 36% lower than those in the group without FTWs, respectively, which resulted in a total reduction of approximately 20% in CO2-equivalent greenhouse gas emissions. Considering that a relatively low density of S. portulacastrum was used in this experiment, the greenhouse gas reduction observed was remarkable, suggesting that this technique is a promising measure to remove the nitrogen and carbon pollution, and effectively reduce greenhouse gases in the aquaculture system. Future study could be applied to researching mechanisms to remove these nitrogen and greenhouse gases, further promoting the efficiency of this technique.

Author Contributions

Conceptualization, D.L. and L.Z.; investigation, S.Z., M.W., J.L., Y.L., M.Y. and F.Y.; administration, H.Z.; resources, S.Z. and D.L.; writing—original draft, S.Z., M.W. and L.Z.; writing—review and editing, W.Y. All authors have read and agreed to the published version of the manuscript.

Funding

This work was supported by the Fujian Marine Service and Fishery High-Quality Development Project (FJHY-YYKJ-2024-1-18-1, FJHY-YYKJ-2022-1-1, FJHY-YYKJ-2022-1-2, FJHYF-TH-2023-2) and the Basic Research Projects of Provincial Public Welfare Research Institutes of Fujian Province (2021R1013006, 2021R1013005, 2021R10130013, 2020R1013004).

Data Availability Statement

The raw data supporting the conclusions of this article will be made available by the authors on request.

Conflicts of Interest

The authors declare no conflicts of interest.

References

  1. FAO. In Brief to the State of World Fisheries and Aquaculture 2024. Blue Transformation in Action; Food and Agricultural Organization of the United Nations: Rome, Italy, 2024. [Google Scholar]
  2. Lothmann, R.; Sewilam, H. Potential of innovative marine aquaculture techniques to close nutrient cycles. Rev. Aquac. 2023, 15, 947–964. [Google Scholar] [CrossRef]
  3. Yuan, J.; Xiang, J.; Liu, D.; Kang, H.; He, T.; Kim, S.; Lin, Y.; Freeman, C.; Ding, W. Rapid growth in greenhouse gas emissions from the adoption of industrial-scale aquaculture. Nat. Clim. Change 2019, 9, 318–322. [Google Scholar] [CrossRef]
  4. Zhang, Y.; Tang, K.W.; Yang, P.; Yang, H.; Tong, C.; Song, C.; Tan, L.; Zhao, G.; Zhou, X.; Sun, D. Assessing carbon greenhouse gas emissions from aquaculture in China based on aquaculture system types, species, environmental conditions and management practices. Agric. Ecosyst. Environ. 2022, 338, 108110. [Google Scholar] [CrossRef]
  5. Raymond, P.A.; Hartmann, J.; Lauerwald, R.; Sobek, S.; McDonald, C.; Hoover, M.; Butman, D.; Striegl, R.; Mayorga, E.; Hum-borg, C. Global carbon dioxide emissions from inland waters. Nature 2013, 503, 355–359. [Google Scholar] [CrossRef]
  6. Hu, Z.; Lee, J.W.; Chandran, K.; Kim, S.; Khanal, S.K. Nitrous oxide (N2O) emission from aquaculture: A review. Environ. Sci. Technol. 2012, 46, 6470–6480. [Google Scholar] [CrossRef]
  7. Costa, M.H.; da Cunha, L.C.; Cox, P.M.; Eliseev, A.V.; Hensen, S.; Ishii, M.; Jaccard, S.; Koven, C.; Lohila, A.; Patra, P.K. Global carbon and other biogeochemical cycles and feedbacks. In Climate Change 2021—The Physical Science Basis: Working Group I Contribution to the Sixth Assessment Report of the Intergovernmental Panel on Climate Change; Masson-Delmotte, V., Zhai, P., Pirani, A., Connors, S.L., Péan, C., Berger, S., Caud, N., Chen, Y., Goldfarb, L., Gomis, M.I., et al., Eds.; Cambridge University Press: Cambridge, UK; New York, NY, USA, 2021; pp. 673–816. [Google Scholar]
  8. Tian, H.; Xu, R.; Canadell, J.G.; Thompson, R.L.; Winiwarter, W.; Suntharalingam, P.; Davidson, E.A.; Ciais, P.; Jackson, R.B.; Janssens-Maenhout, G. A comprehensive quantification of global nitrous oxide sources and sinks. Nature 2020, 586, 248–256. [Google Scholar] [CrossRef]
  9. Williams, J.; Crutzen, P. Nitrous oxide from aquaculture. Nat. Geosci. 2010, 3, 143. [Google Scholar] [CrossRef]
  10. Xiao, Q.; Hu, C.; Gu, X.; Zeng, Q.; Liu, Z.; Xiao, W.; Zhang, M.; Hu, Z.; Wang, W.; Luo, J. Aquaculture farm largely increase indirect nitrous oxide emission factors of lake. Agric. Ecosyst. Environ. 2023, 341, 108212. [Google Scholar] [CrossRef]
  11. Yang, P.; Zhao, G.; Tong, C.; Tang, K.W.; Lai, D.Y.; Li, L.; Tang, C. Assessing nutrient budgets and environmental impacts of coastal land-based aquaculture system in southeastern China. Agric. Ecosyst. Environ. 2021, 322, 107662. [Google Scholar] [CrossRef]
  12. Ye, W.; Sun, H.; Li, Y.; Zhang, J.; Zhang, M.; Gao, Z.; Yan, J.; Liu, J.; Wen, J.; Yang, H. Greenhouse gas emissions from fed mollusk mariculture: A case study of a Sinonovacula constricta farming system. Agric. Ecosyst. Environ. 2022, 336, 108029. [Google Scholar] [CrossRef]
  13. Chen, G.; Bai, J.; Bi, C.; Wang, Y.; Cui, B. Global greenhouse gas emissions from aquaculture: A bibliometric analysis. Agric. Ecosyst. Environ. 2023, 348, 108405. [Google Scholar] [CrossRef]
  14. Boxman, S.E.; Nystrom, M.; Ergas, S.J.; Main, K.L.; Trotz, M.A. Evaluation of water treatment capacity, nutrient cycling, and biomass production in a marine aquaponic system. Ecol. Eng. 2018, 120, 299–310. [Google Scholar] [CrossRef]
  15. Chang, Y.; Cui, H.; Huang, M.; He, Y. Artificial floating islands for water quality improvement. Environ. Rev. 2017, 25, 350–357. [Google Scholar] [CrossRef]
  16. Chen, X.; Zhu, H.; Yan, B.; Shutes, B.; Xing, D.; Banuelos, G.; Cheng, R.; Wang, X. Greenhouse gas emissions and wastewater treatment performance by three plant species in subsurface flow constructed wetland mesocosms. Chemosphere 2020, 239, 124795. [Google Scholar] [CrossRef]
  17. Jahangir, M.M.; Richards, K.G.; Healy, M.G.; Gill, L.; Müller, C.; Johnston, P.; Fenton, O. Carbon and nitrogen dynamics and greenhouse gas emissions in constructed wetlands treating wastewater: A review. Hydrol. Earth Syst. Sci. 2016, 20, 109–123. [Google Scholar] [CrossRef]
  18. Nie, X.; Mubashar, M.; Zhang, S.; Qin, Y.; Zhang, X. Current progress, challenges and perspectives in microalgae-based nutrient removal for aquaculture waste: A comprehensive review. J. Clean. Prod. 2020, 277, 124209. [Google Scholar] [CrossRef]
  19. Xie, B.; Wu, J.; Huang, L. Temporal and spatial variations of macrofouling organisms on ecological floating beds in Yundang Lagoon, China. Mar. Pollut. Bull. 2019, 148, 156–167. [Google Scholar] [CrossRef]
  20. Chanda, A.; Das, S.; Bhattacharyya, S.; Das, I.; Giri, S.; Mukhopadhyay, A.; Samanta, S.; Dutta, D.; Akhand, A.; Choudhury, S. CO2 fluxes from aquaculture ponds of a tropical wetland: Potential of multiple lime treatment in reduction of CO2 emission. Sci. Total Environ. 2019, 655, 1321–1333. [Google Scholar] [CrossRef]
  21. Bhattacharyya, P.; Sinhababu, D.P.; Roy, K.S.; Dash, P.K.; Sahu, P.K.; Dandapat, R.; Neogi, S.; Mohanty, S. Effect of fish species on methane and nitrous oxide emission in relation to soil C, N pools and enzymatic activities in rainfed shallow lowland rice-fish farming system. Agric. Ecosyst. Environ. 2013, 176, 53–62. [Google Scholar] [CrossRef]
  22. Liang, Y.; Zhu, H.; Bañuelos, G.; Yan, B.; Shutes, B.; Cheng, X.; Chen, X. Removal of nutrients in saline wastewater using constructed wetlands: Plant species, influent loads and salinity levels as influencing factors. Chemosphere 2017, 187, 52–61. [Google Scholar] [CrossRef]
  23. Dickson, A.G.; Sabine, C.L.; Christian, J.R. Guide to Best Practices for Ocean CO2 Measurements; North Pacific Marine Science Organization: Sidney, BC, Canada, 2007. [Google Scholar]
  24. Zhan, L.Y.; Chen, L.Q.; Zhang, J.X.; Lin, Q. A system for the automated static headspace analysis of dissolved N2O in seawater. Int. J. Environ. Anal. Chem. 2013, 93, 828–842. [Google Scholar] [CrossRef]
  25. Wanninkhof, R. Relationship between wind speed and gas exchange over the ocean revisited. Limnol. Oceanogr. Methods 2014, 12, 351–362. [Google Scholar] [CrossRef]
  26. Ma, X.; Li, X.; Li, J.; Ren, J.; Cheng, X. Iron-carbon could enhance nitrogen removal in Sesuvium portulacastrum constructed wetlands for treating mariculture effluents. Bioresour. Technol. 2021, 325, 124602. [Google Scholar] [CrossRef]
  27. Liu, X.; Pu, X.; Luo, D.; Lu, J.; Liu, Z. Model assessment of nutrient removal via planting Sesuvium portulacastrum in floating beds in eutrophic marine waters: The case of aquaculture areas of Dongshan Bay. Acta Oceanol. Sin. 2019, 38, 91–100. [Google Scholar] [CrossRef]
  28. Tang, S.; Liao, Y.; Xu, Y.; Dang, Z.; Zhu, X.; Ji, G. Microbial coupling mechanisms of nitrogen removal in constructed wetlands: A review. Bioresour. Technol. 2020, 314, 123759. [Google Scholar] [CrossRef]
  29. Flickinger, D.L.; Costa, G.A.; Dantas, D.P.; Proença, D.C.; David, F.S.; Durborow, R.M.; Moraes-Valenti, P.; Valenti, W.C. The budget of carbon in the farming of the Amazon river prawn and tambaqui fish in earthen pond monoculture and integrated multitrophic systems. Aquac. Rep. 2020, 17, 100340. [Google Scholar] [CrossRef]
Figure 1. Plant groups (left) and control groups (right) in the aquaculture ponds during the experiment.
Jmse 13 01342 g001
Figure 2. (a) The temperature and salinity of the plant group and control group during the experiment. The open circles and gray dots represent the water temperatures of the plants and control groups, respectively. The white and black triangles represent the salinities of the plants and control groups, respectively. (b) Dissolved oxygen concentration in the plant group (open circles) and control group (black dots).
Jmse 13 01342 g002
Figure 3. Variations in (a) NH4+, (b) NO2, and (c) NO3 during the experiments. The plant group and control group are shown as open circles and black dots, respectively.
Jmse 13 01342 g003
Figure 4. Differences in the concentrations of DIN and each nitrogen species (Ncontrol-Nplant) in the control group and the plant group.
Jmse 13 01342 g004
Figure 5. Variation in the chlorophyll a concentration in the control group (black bars) and experimental group (gray bars) during the experiment.
Jmse 13 01342 g005
Figure 6. Variations in (a) dissolved inorganic carbon and (b) nitrous oxide in the plant group (open circles) and control group (black dots).
Jmse 13 01342 g006
Figure 7. NH4+ and DIC correlations in the plant group (open circles) and control group (solid dots). The linear lines were fitted for the plant group (dashed line) and the control group, with the first two dots of each group excluded (in ovals). Yp and yc are functions of the fitting lines.
Jmse 13 01342 g007
Figure 8. Variation in pCO2 in the plant group and control group during the experiment.
Jmse 13 01342 g008
Figure 9. (A) Significant correlation between NH4+ and N2O in the plant group. The two dots in ovals represent the last two data points near the end of incubation. (B) NO2 and N2O in the plant group. A significant correlation existed between NO2 and N2O before day 16. The positive correlation between NO2 and N2O was no longer observed after the NH4+ concentration sharply decreased. (C) There was a significant correlation between NO2 and NH4+ from day 16 to the end of the experiment in the control group. (D) There was a significant correlation between NO2 and N2O in the control group.
Jmse 13 01342 g009
Figure 10. Flux potentials of CO2 (a) and N2O (CO2-equivalent emission rate) (b) in the plant (black) and control (gray) groups.
Jmse 13 01342 g010
Table 1. NH4+, NO2, and NO3 percentages in the plant group and control group.
Plant GroupControl Group
DayNH4+/DINNO2/DINNO3/DINNH4+/DINNO2/DINNO3/DIN
040.85.154.139.64.555.8
440.49.650.036.413.650.0
842.733.224.096.51.32.1
1221.639.438.994.12.63.3
1623.846.529.790.86.32.9
207.855.137.173.420.85.8
244.443.851.743.348.28.5
282.942.354.836.160.23.6
324.030.066.011.980.08.1
361.127.171.85.380.414.3
400.917.881.32.080.117.9
441.210.488.42.277.720.1
Disclaimer/Publisher’s Note: The statements, opinions and data contained in all publications are solely those of the individual author(s) and contributor(s) and not of MDPI and/or the editor(s). MDPI and/or the editor(s) disclaim responsibility for any injury to people or property resulting from any ideas, methods, instructions or products referred to in the content.

