1. Introduction
Coastal areas are economically developed and densely populated. Against the backdrop of global climate change, marine disaster events occur frequently, and coastal regions often face more severe challenges. The Intergovernmental Panel on Climate Change (IPCC)’s Special Report on Global Warming of 1.5 °C indicates that continuous warming has amplified the exposure of coastal areas and ecosystems to risks associated with sea-level rise [
1,
2]. Global warming has increased the risk of coastal erosion [
3]. Hard structures such as seawalls, slope protections, and revetments have become the main forms for coastal areas to cope with coastal disaster risks. Hard structures have a certain lifespan limitation, require more post-maintenance costs, and prevent the natural change process of the shoreline [
4]. They have an adverse impact on coastal habitats [
5]. In the long run, this will lead to a weakening of the ecosystem functions in coastal areas, a reduction in sediment supply, and the destruction of biological habitats [
6,
7], which is not conducive to the sustainable social and economic development of coastal regions. With the deepening of the concept of ecological protection, coastal protection has begun to focus on the restoration of coastal ecosystem functions and the maintenance of habitat values [
8]. The protection technologies for shorelines based on natural concepts have developed rapidly, such as coastal ecological restoration, beach nourishment, and living shoreline technologies [
9,
10]. These methods not only maintain the stability of the shoreline but also aim to restore the functions of the coastal ecosystem [
11,
12]. The living shoreline is a high-quality development model for the coast that combines “disaster mitigation and protection capabilities, ecosystem vitality, and economic development vitality”.
The Nature Conservancy first proposed the concept of Nature-based Solution (NbS) at the beginning of this century, calling on the world to adopt sustainable ecological restoration measures to address environmental challenges such as climate change, weakened environmental resilience, and ecosystem decline [
13,
14]. The living shoreline is a shoreline stabilization strategy that coordinates ecological landforms and human development under the framework of the Nature-based Solution. It is an alternative shoreline protection form to the use of hard structures. It mainly uses natural elements (such as wetlands, vegetation, sand, logs, oyster reefs, etc.) or a combination of natural elements and hard revetments. Through reasonable configuration, it maintains the basic functions of the coast while restoring or creating a coastal ecosystem. Currently, the resilience-based disaster prevention system in coastal areas urgently needs to be improved. The implementation of living shoreline technologies in China is not yet mature, lacking a complete management cycle and a systematic monitoring and evaluation system. In foreign regions, especially in North America, there is the richest practice of living shorelines. Some scholars have verified the effectiveness of the transformation of local living shoreline technologies by monitoring and evaluating the shoreline change rate [
8,
15], before and after the implementation of living shoreline technologies and the growth status of coastal vegetation [
16]. These outcomes are closely tied to site-specific hydrodynamic conditions, The unique hydrodynamic environment in the Taiwan Strait due to the enhanced tide-storm surge interaction is a typical example [
17]. Foreign studies have shown that wave and hydrodynamic processes are one of the main controlling factors affecting the performance of living shorelines [
10]. Therefore, different transformation models are applicable to shore segments with different energy levels. At the same time, factors such as fetch, wave amplitude and period, freezing period, tidal range, storm surge, sea-level change, and coastal geomorphic types all need to be considered before the design of living shorelines, and they affect the effectiveness of the implementation of living shoreline technologies [
12]. These studies have carried out systematic and standardized monitoring of living shoreline technologies at the regional scale, which plays a crucial role in the evaluation of the evolution of living shoreline habitats and the assessment of ecosystem service values [
12,
18,
19,
20]. The evaluation of living shorelines inherits the discussion of coastal disasters. Based on the consideration of the vulnerability of the coastal zone system itself and the resilience of the coastal zone to disturbances, it attaches more importance to the quantification of the values of the coastal ecosystem [
21]. The transplantation and application of living shoreline technologies are of great significance for the sustainable development of coastal areas in Fujian Province. This study conducts an evaluation of the suitability of the transplantation of living shoreline technologies in the coastal counties and cities of Fujian Province, which can provide a reference for the coastal development and planning of Fujian Province.
Starting from the purpose of living shoreline transformation, this study specifically considers three aspects: protective safety, ecological resilience, and economic vitality. It extracts a total of 9 indicators, including coastal natural, disaster, and protection attributes, as well as ecological environment and socio-economic attributes, as evaluation factors. The entropy weight method is used to calculate the weights of each indicator, and an evaluation index system for the living shoreline vitality of coastal areas in Fujian Province is constructed. This system evaluates the current situation and development trends of the coastal vitality in the study area, reveals the characteristics and changing laws of coastal vitality under the dual influence of global climate change and human activities, clarifies its occurrence mechanism, and provides a scientific basis for marine ecological protection and restoration.
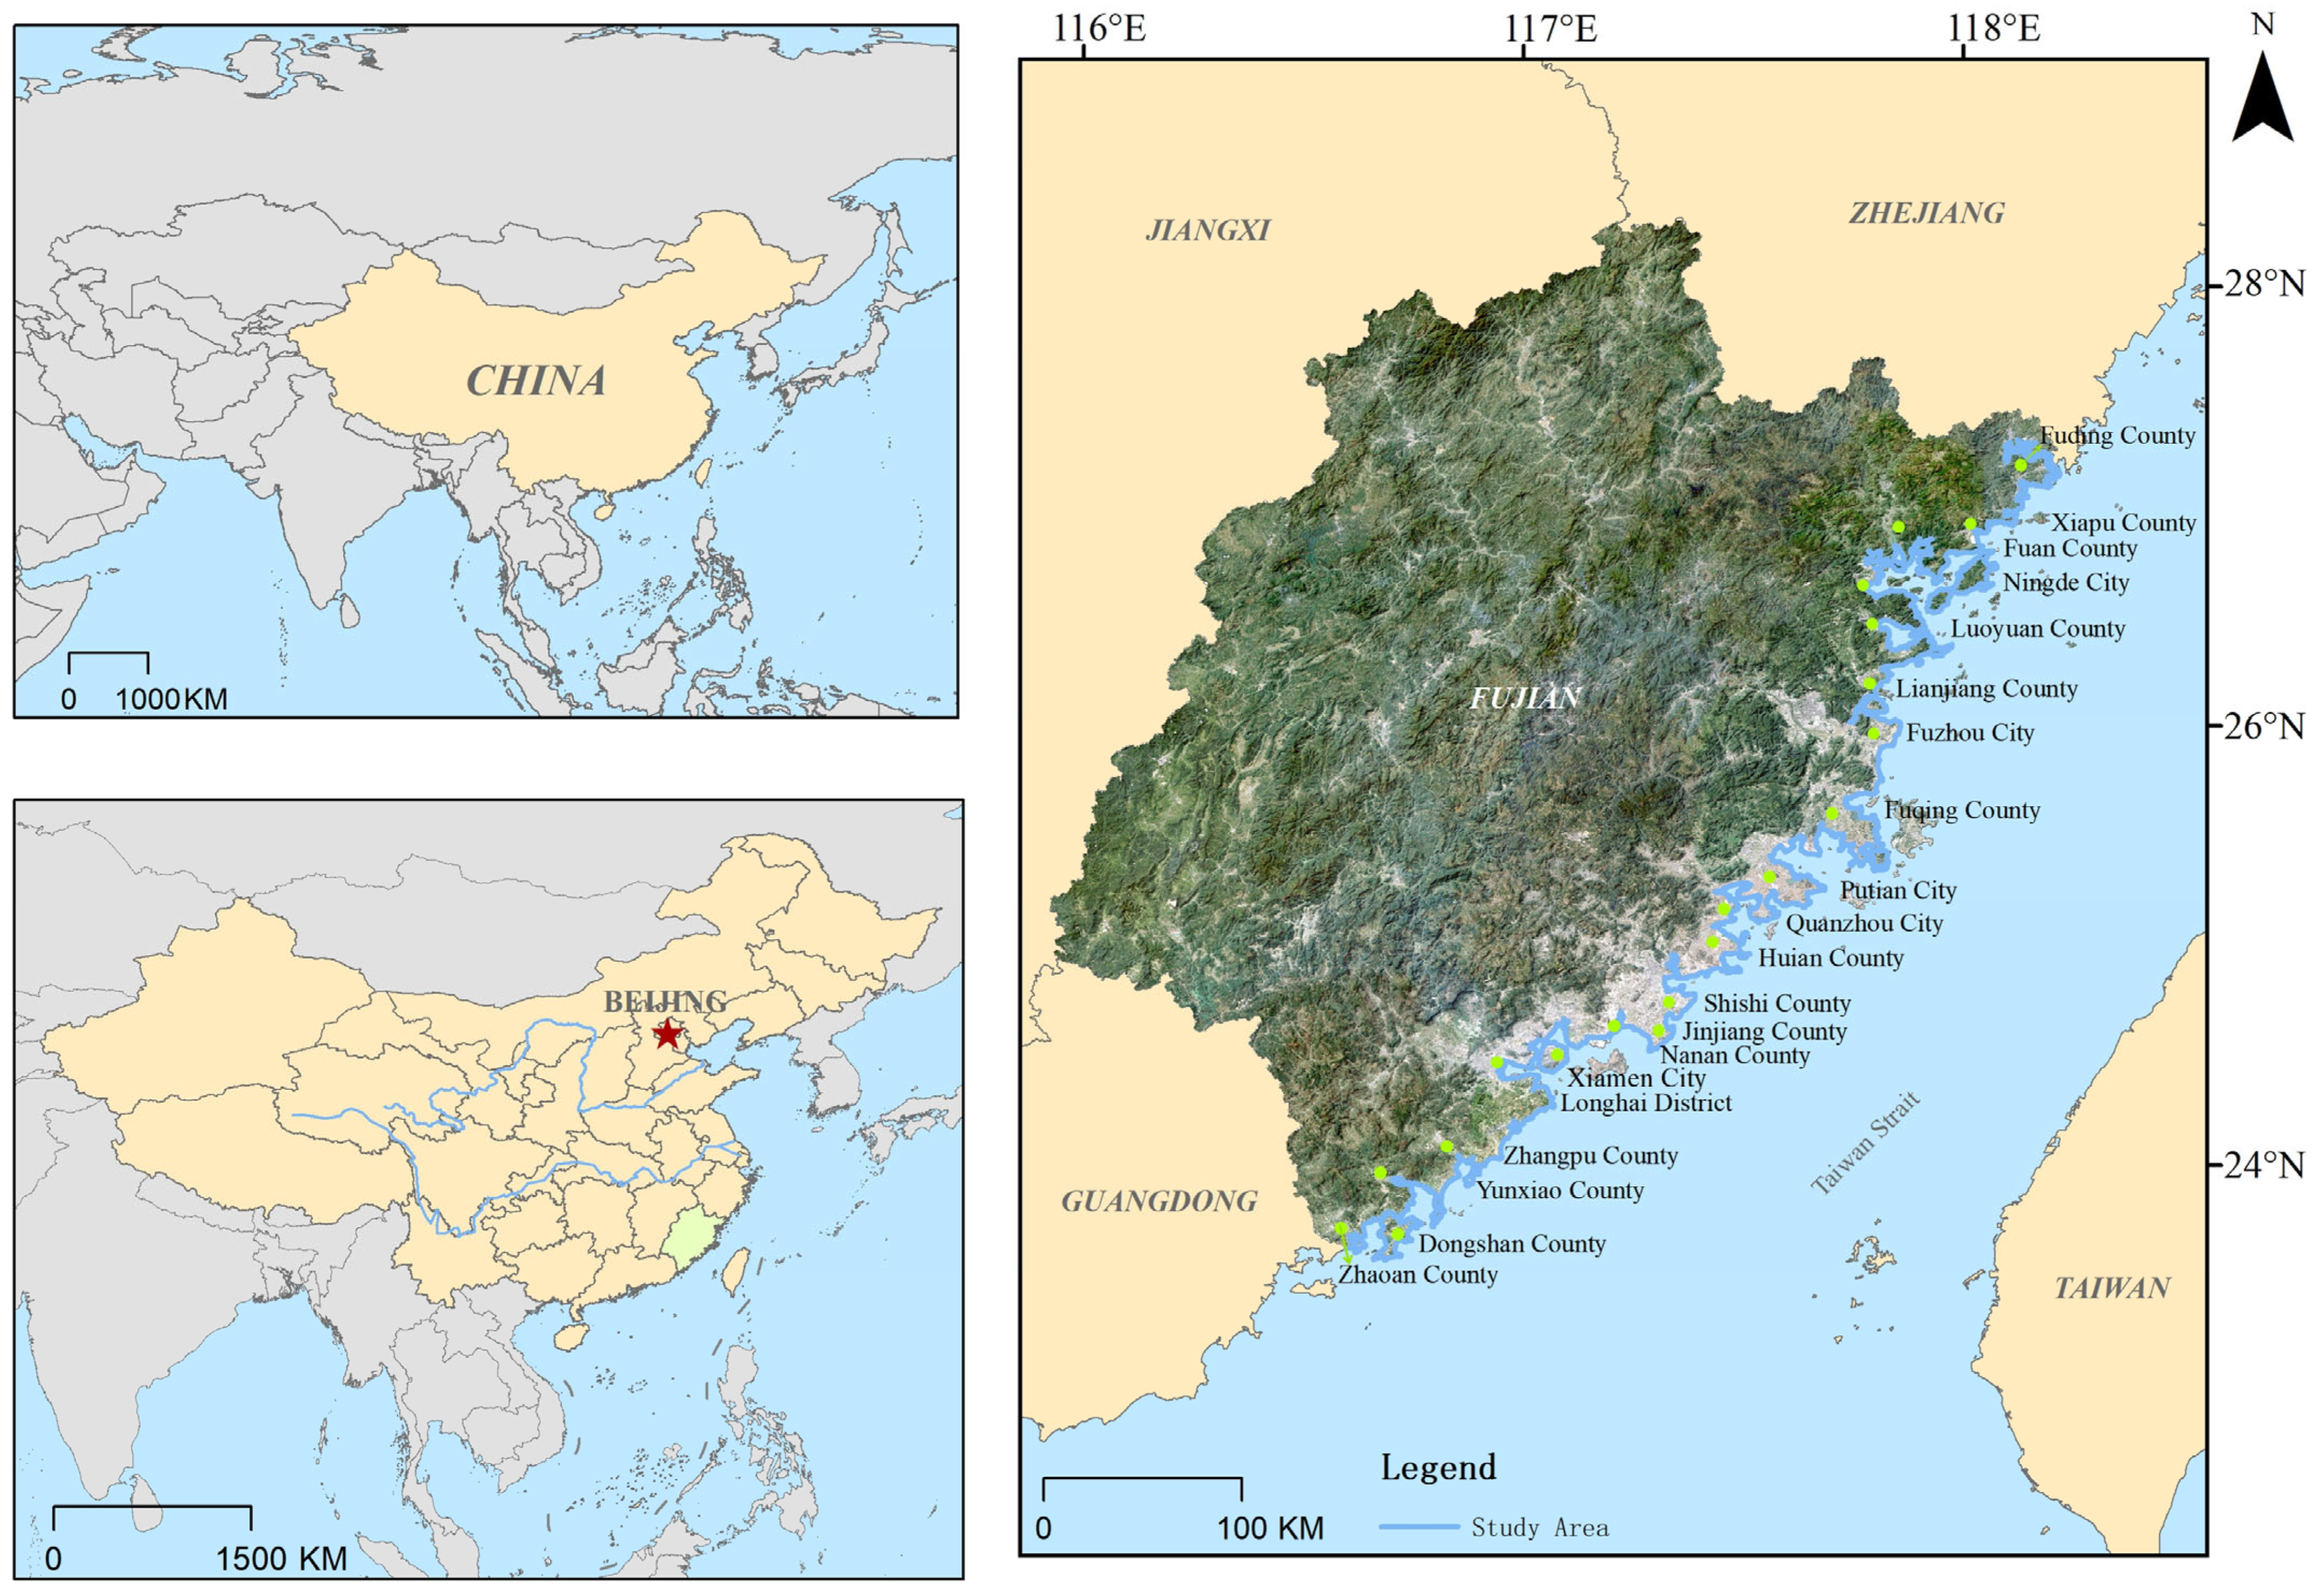
2. Study Area
Fujian Province is located on the west coast of the Pacific Ocean (
Figure 1), on the southeast coast of the Chinese mainland. It borders the Taiwan Strait to the east, Zhejiang Province to the north, and Guangdong Province to the south. The total length of its mainland coastline is 3486.2 km [
21,
22,
23]. Fujian Province has the highest coastline tortuosity rate in the country. The land terrain is mainly mountainous and hilly, and there are various types of coastlines, including artificial, rocky, muddy, sandy, and riverine coastlines. Among them, artificial coastlines account for the highest proportion, with a length of 1764 km, accounting for 50.61%. The second is the rocky coastline, which is 31.52%, with a length of 1099 km. The length of the natural coastline is 1722 km, and the natural coastline retention rate is 50.39% [
24]. The coastline is tortuous, with many bays, peninsulas, and islands, and many deep-water ports. The rich port, tidal flat, and marine biological resources have brought huge development potential to coastal areas of Fujian Province. About one-third of the coastline in the province has been developed and utilized, mainly for fishery, reclamation, transportation, industry and mining, etc. The utilization rate of the coastline on the west side of the Taiwan Strait is the highest, especially in Xiamen, while it is relatively low in eastern Fujian. Coastal areas of Fujian Province are frequently affected by typhoons and storm surges. Coupled with the funnel effect of the Taiwan Strait, the wind speed and sea waves in the area are large, Fujian Province has many types of coastal wetlands, both artificial and natural. Natural wetlands are more distributed in the north than in the south, with the least in Xiamen. In terms of vegetation distribution, there are few native plants and many artificial secondary plants.
Fujian Province is a demonstration zone for integrated coastal zone management (ICM) [
24]. In 2018, Fujian Province promulgated the Regulations on the Protection and Utilization of the Coastal Zone in Fujian Province and took the lead in establishing the joint conference system for integrated coastal zone management led by the marine administrative department [
25]. Fujian Province is at the forefront of coastal zone protection. There are many related evaluation studies on the Fujian coastal zone, and the current evaluation studies focus on the evaluation of erosion, coastal vulnerability and coastal toughness. The erosive shorelines in Fujian Province total 1965.9 km, accounting for 43.1% of the total length. The sandy and silty silt coast in Fujian Province is most prone to coastal erosion [
26]. In spatial distribution, Quaternary “soft rock” strata develop between the Minjiang Estuary and Jiulong River, and coastal erosion is the most serious in the shorelines, and the erosion intensity is relatively small north of the Minjiang estuary [
24]. The coastal vulnerability of Fujian Province is mainly medium-low vulnerability [
27], and the areas with high vulnerability are concentrated in economically developed areas such as Xiamen, Fuzhou and Quanzhou [
28]. In terms of coastal toughness, there is also a high-value zone of coastal toughness in the central part of the region represented by Xiamen [
29].
3. Research Methods
3.1. Index Selection and Data Source
The study area includes 5 prefecture-level cities and 15 county-level cities along the coast of Fujian, with a total of 20 evaluation units. Considering that the influence mechanism of offshore islands is different from that of counties and cities along the coast of Fujian, Pingtan County (island) is excluded in this study.
Assessment of coastal vitality is a comprehensive and complex process. Based on the objectives of constructing a vibrant coastal system, the coastal zone should fulfill three functional indicators: safety protection, ecological maintenance, and economic promotion. Considering the regional characteristics and data availability of the study area, nine specific evaluation factors were selected, including biogenic shoreline length, vegetation coverage rate, and population structure (
Table 1) [
29,
30,
31,
32,
33]. The relevant explanations for
Table 1 are as follows: (+) sign indicates a positive indicator, where a higher value of the evaluation factor corresponds to greater coastal vitality; conversely, a (−) sign denotes a negative indicator. The shoreline armoring length (B3) is treated as dual-coded (both positive and negative) due to its mixed effects: positive economic benefits versus negative ecological impacts (e.g., habitat degradation from hardened shorelines). This yields a total of 9 evaluation indicators. Cyclone Index, where is the number of cyclones affecting the study area, and, S represents the maximum wind speed (m/s) of each cyclone [
30]. Ecological Value = Sbio×rbeach × Abeach [
32], where Sbio the biodiversity value per unit area of the beach ecosystem, which is 10,000 yuan per hectare. rbeach is the biodiversity index of the beach ecosystem, with a reference value of 3.3 in the beach ecosystem, and Abeach is the intertidal area of the beach ecosystem [
34]. The calculation of Abeach incorporates the intertidal zone area derived from LANDSAT imagery with a precision of 30 m. Specifically, it takes into account the beach area where the water depth at low tide is below 6 m. The area of the intertidal zone is calculated based on the length of the beach where the low-tide water depth is less than 6 m. Combined with field measurement experience, it is approximately 2000 m.
The ability of coastal disaster prevention and mitigation is mainly reflected by artificial bank protection in the study area, and the nature of hard bank protection is wave mitigation. At the same time, the biological shoreline in Fujian Province is mainly dominated by mangroves, which is a good natural protective barrier. The two methods of “soft” and “hard” constitute the main means of coastal disaster reduction in the study area. The storm surge index is added to reflect the actual disturbance index of the region and measure the coastal stability of the study area. The ecological environment is an important manifestation of coastal vitality, and vegetation cover and water quality are significant indicators of environmental quality. Wetland, as the main construction means of dynamic coastal transformation, plays an important role in maintaining coastal ecological habitat. In terms of social and economic indicators, population structure is used to measure the level of regional economic development and urbanization and the value of buildings behind the coast is indirectly measured. The ecological value is introduced, and the value of intertidal biodiversity is calculated as a supplement to the economic data, which constitutes the value attribute of the coast in the study area from two aspects: social value and ecological value.
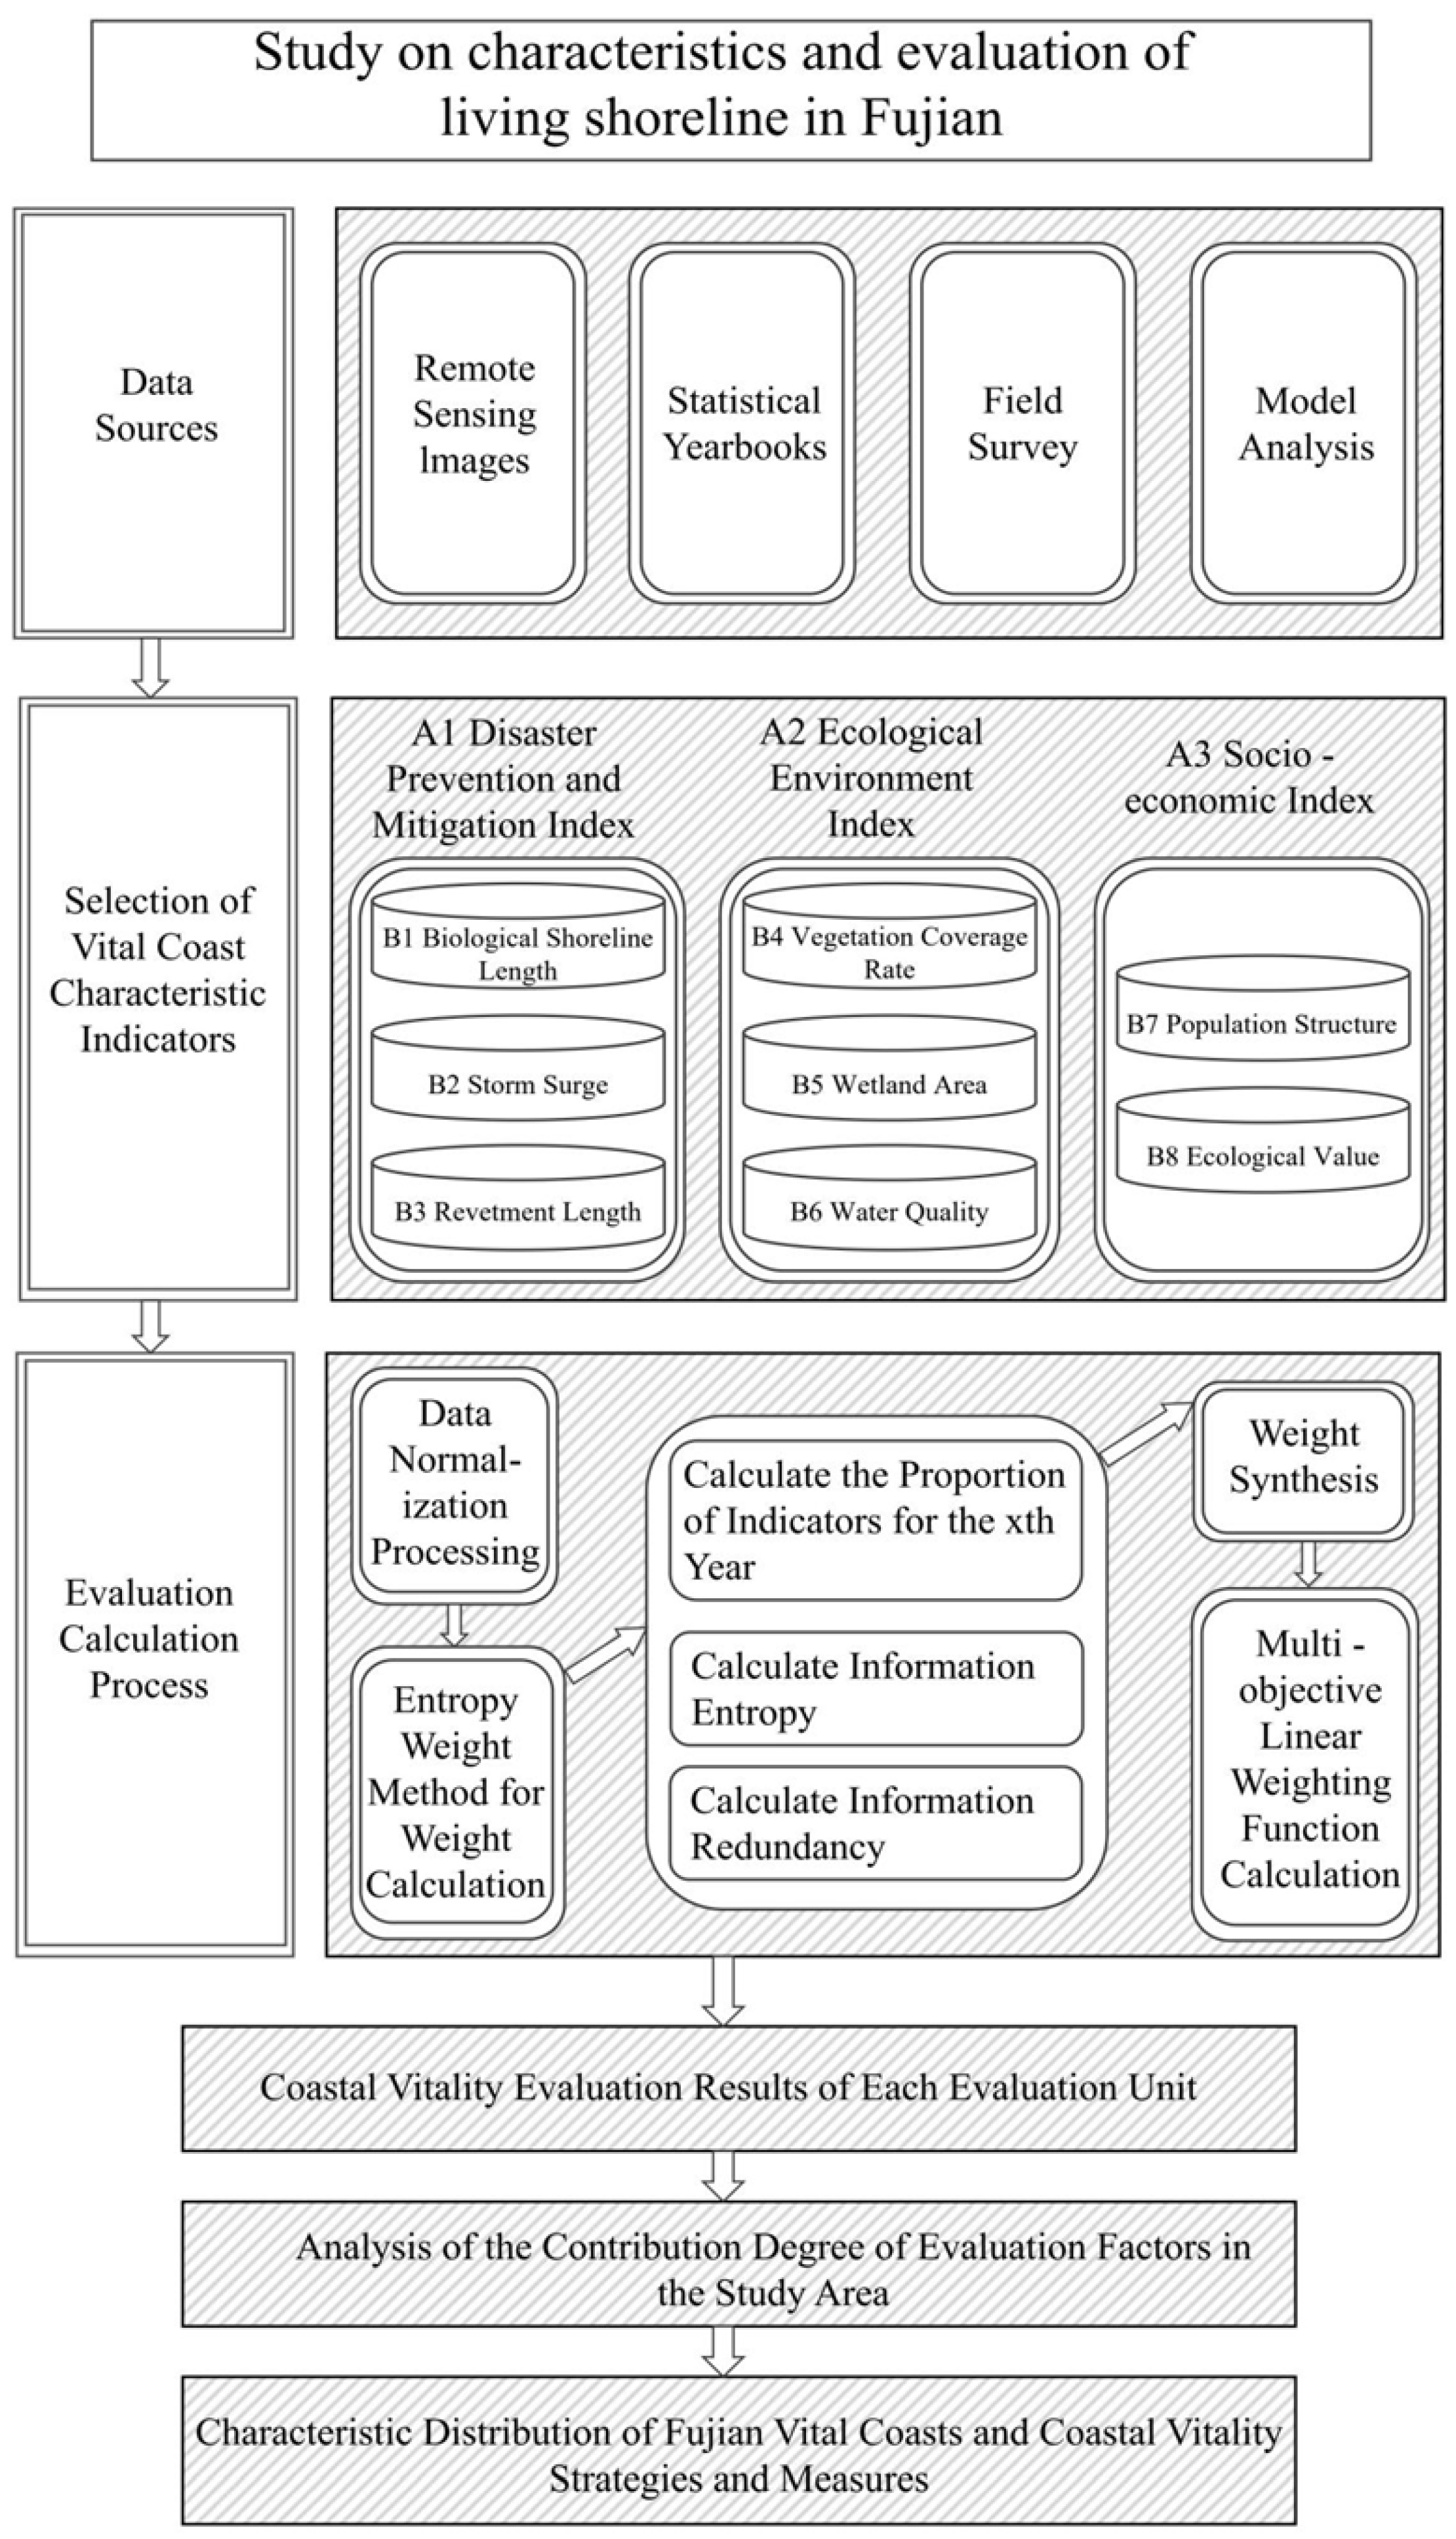
By collecting the data of 20 study areas in 2010 and 2020, the index factors suitable for Fujian Province’s dynamic coast evaluation system were selected. After normalization and standardization, the weights of each evaluation index were determined by the entropy weight method, and the characteristic values of coastal vitality of each evaluation unit were obtained by the multi-objective linear weighting function method. The evaluation results of coastal vitality in the study area were obtained by classifying characteristic values with the natural break point method, analyzing the contribution degree of each evaluation index, analyzing the distribution characteristics and development obstacles of coastal vitality in Fujian province, and obtaining corresponding strategies and measures to improve coastal vitality (
Figure 2).
3.2. Data Standardization Processing
Since the original data are not consistent in dimension, they cannot be directly used for evaluation and analysis. Before evaluation, standardization processing is required to eliminate the problem that different dimensions are not conducive to comparison. In this study, the original data matrix X = (Xij) 20 × 9 formed by 20 evaluation units and 9 evaluation indicators was processed by the linear normalization method, and the standardized matrix Y = (Xij) 20 × 9 was obtained. The standardized data in the study area are shown in
Table 2 and
Table 3.
Forward indicator processing:
Negative indicator processing:
In Formulas (1) and (2), i is the row of the matrix, j is the column of the matrix, xij is the original data matrix, and yij is the normalized matrix after normalization.
3.3. Weight Calculation
As a comprehensive evaluation method, the entropy weight method is a method to determine the objective weight according to the variability of indicators. It can handle the interrelationship between multiple factors, take into account the correlation and interaction between different indicators, avoid the deviation caused by human factors, and the weighted results have higher reliability. The entropy weight method uses the variability of indicators to determine the weight of indicators and introduces the definition of information entropy. If the information entropy of an indicator is smaller, the greater the degree of variation of the index value, the more information it provides, the greater the role it can play in the comprehensive evaluation, and the greater its weight [
35]. The weight value of each index factor in the study area obtained by the entropy weight method is shown in
Table 4.
The entropy weight method is used to calculate the weight value of each index and the entropy value of each evaluation factor:
Based on the obtained entropy, calculate the weight of each factor w
j:
In Equations (3) and (4), n is the number of evaluation indicators, m is the evaluation period, and yij is the standardized matrix.
3.4. Active Coast Grade Evaluation
Based on the index weights determined by the entropy weight method, the multi-objective linear weighted function method is used to calculate the evaluation characteristic values of the active coast in the study area.
In Formula (5), n is the number of indicators, the characteristic value of the active coast of the i th evaluation unit, the weight wj of m evaluation indicators multiplied by the sum of the standardized result yij, and the evaluation range is [0, 1].
By finding the natural turning points and breakpoints in the series, the natural breakpoints method divides the research objects into groups with similar properties and then obtains the best classification. The optimal arrangement of the values in the group is determined by iteratively comparing the sum of squared variances between the mean values of the elements in each component and the observed values [
34], and the formula is shown in Equation (6).
In Equation (6), SDAM is the sum of the squares of error of the mean value of the sample, SDCM is the sum of the squares of error of each class cluster, and the GVF obtained is the goodness of variance fit, and the closer it is to 1, the better the fit.
Based on the evaluation value of the active coast characteristics in the study area and the characteristics of the Fujian coastal area, the active coast characteristic values were divided into 5 grades I–V by the natural breakpoint method. The result interval [0.20–0.30] was grade I, (0.30–0.41] was grade II, and (0.41–0.48] was grade III. (0.48 to 0.56] is grade IV, (0.56 to 0.67) is grade V, and the higher the grade, the stronger the vitality.
3.5. Methodological Limitations
This study established a coastal vitality evaluation index system across three dimensions: disaster prevention and mitigation, ecological environment, and socio-economic development. However, different research areas exhibit variations in socio-economic development levels, cultural-environmental characteristics, and marine environments, necessitating that indicator selection be tailored to the specific regional context. Therefore, when applying this evaluation method in practice, it is essential to fully account for the specific characteristics of the study area and reasonably adjust and optimize the indicators based on local conditions. This approach will thereby more accurately reflect the regional coastal vitality status and management needs. Obtaining sediment data for the Fujian coastal zone, which is influenced by factors such as typhoons and river discharge, relies on long-term, fixed-point real-time monitoring. This approach incurs high labor and financial costs. During the study period, data coverage was incomplete across all areas, and the available sediment-related data were characterized by a small spatial scale. Artificially incorporating these data and attempting to compensate for gaps using simulation methods would compromise assessment accuracy. This study focuses on the Fujian coastal zone as its core research area. The geographical scope is relatively concentrated, spanning approximately 3.5 degrees of latitude within the South subtropical to mid-subtropical monsoon climate zone. Within this region, key climatic change factors—such as annual average temperature and precipitation—exhibit minimal variation. Large-scale, long-term drivers like sea-level rise and extreme precipitation events do not manifest significant spatial differences at the decadal (2010–2020) and provincial scales examined in this study. Consequently, sediment dynamics and climate change indicators were therefore excluded from the assessment framework.
4. Results and Discussion
4.1. Characteristics of Active Coast
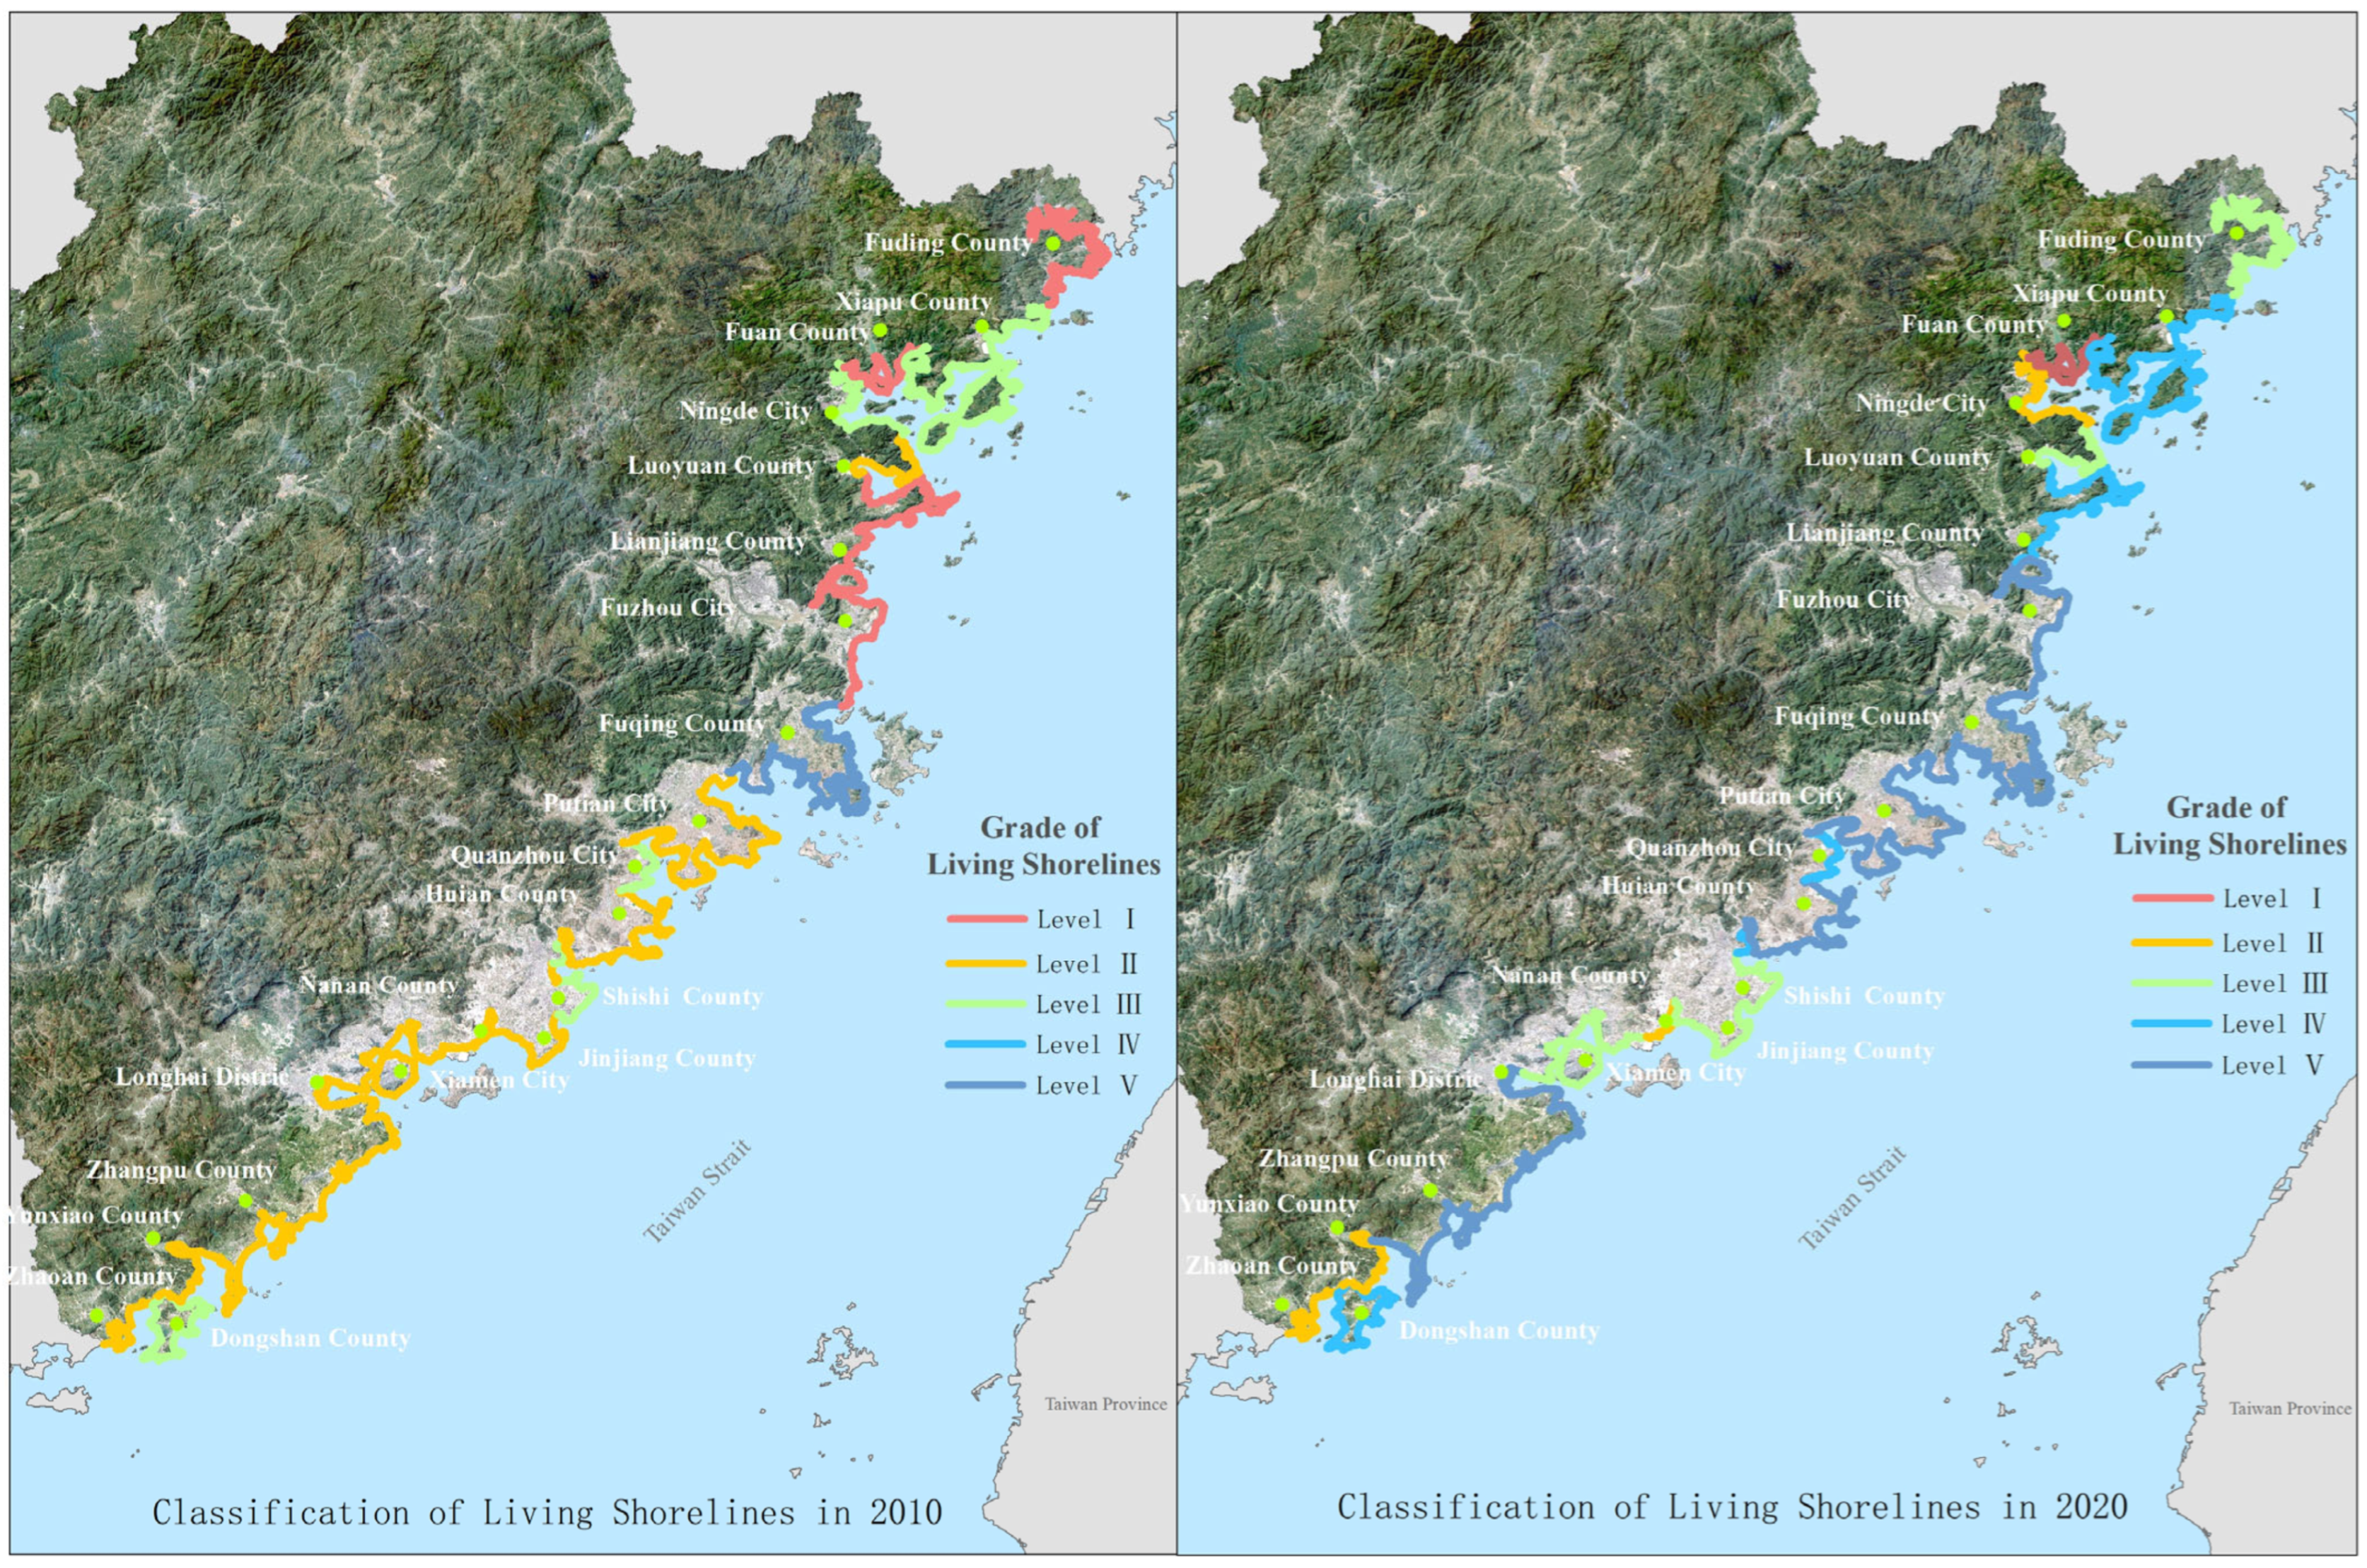
Based on the analysis of the results of the two periods, the characteristic values of coastal vitality in the study area range from 0.20 to 0.66 in 2010 and from 0.25 to 0.67 in 2020 (see
Table 5). As can be seen from
Figure 3, the evaluation results of the central and southern parts of the study area are significantly better than those of the northern parts, and the evaluation results of all evaluation units in 2020 are generally better than those in 2010, reflecting the overall positive trend of regional coastal vitality.
Table 5 shows the evaluation characteristic values and evaluation grades of active coast in each study area of Fujian Province in 2010 and 2020.
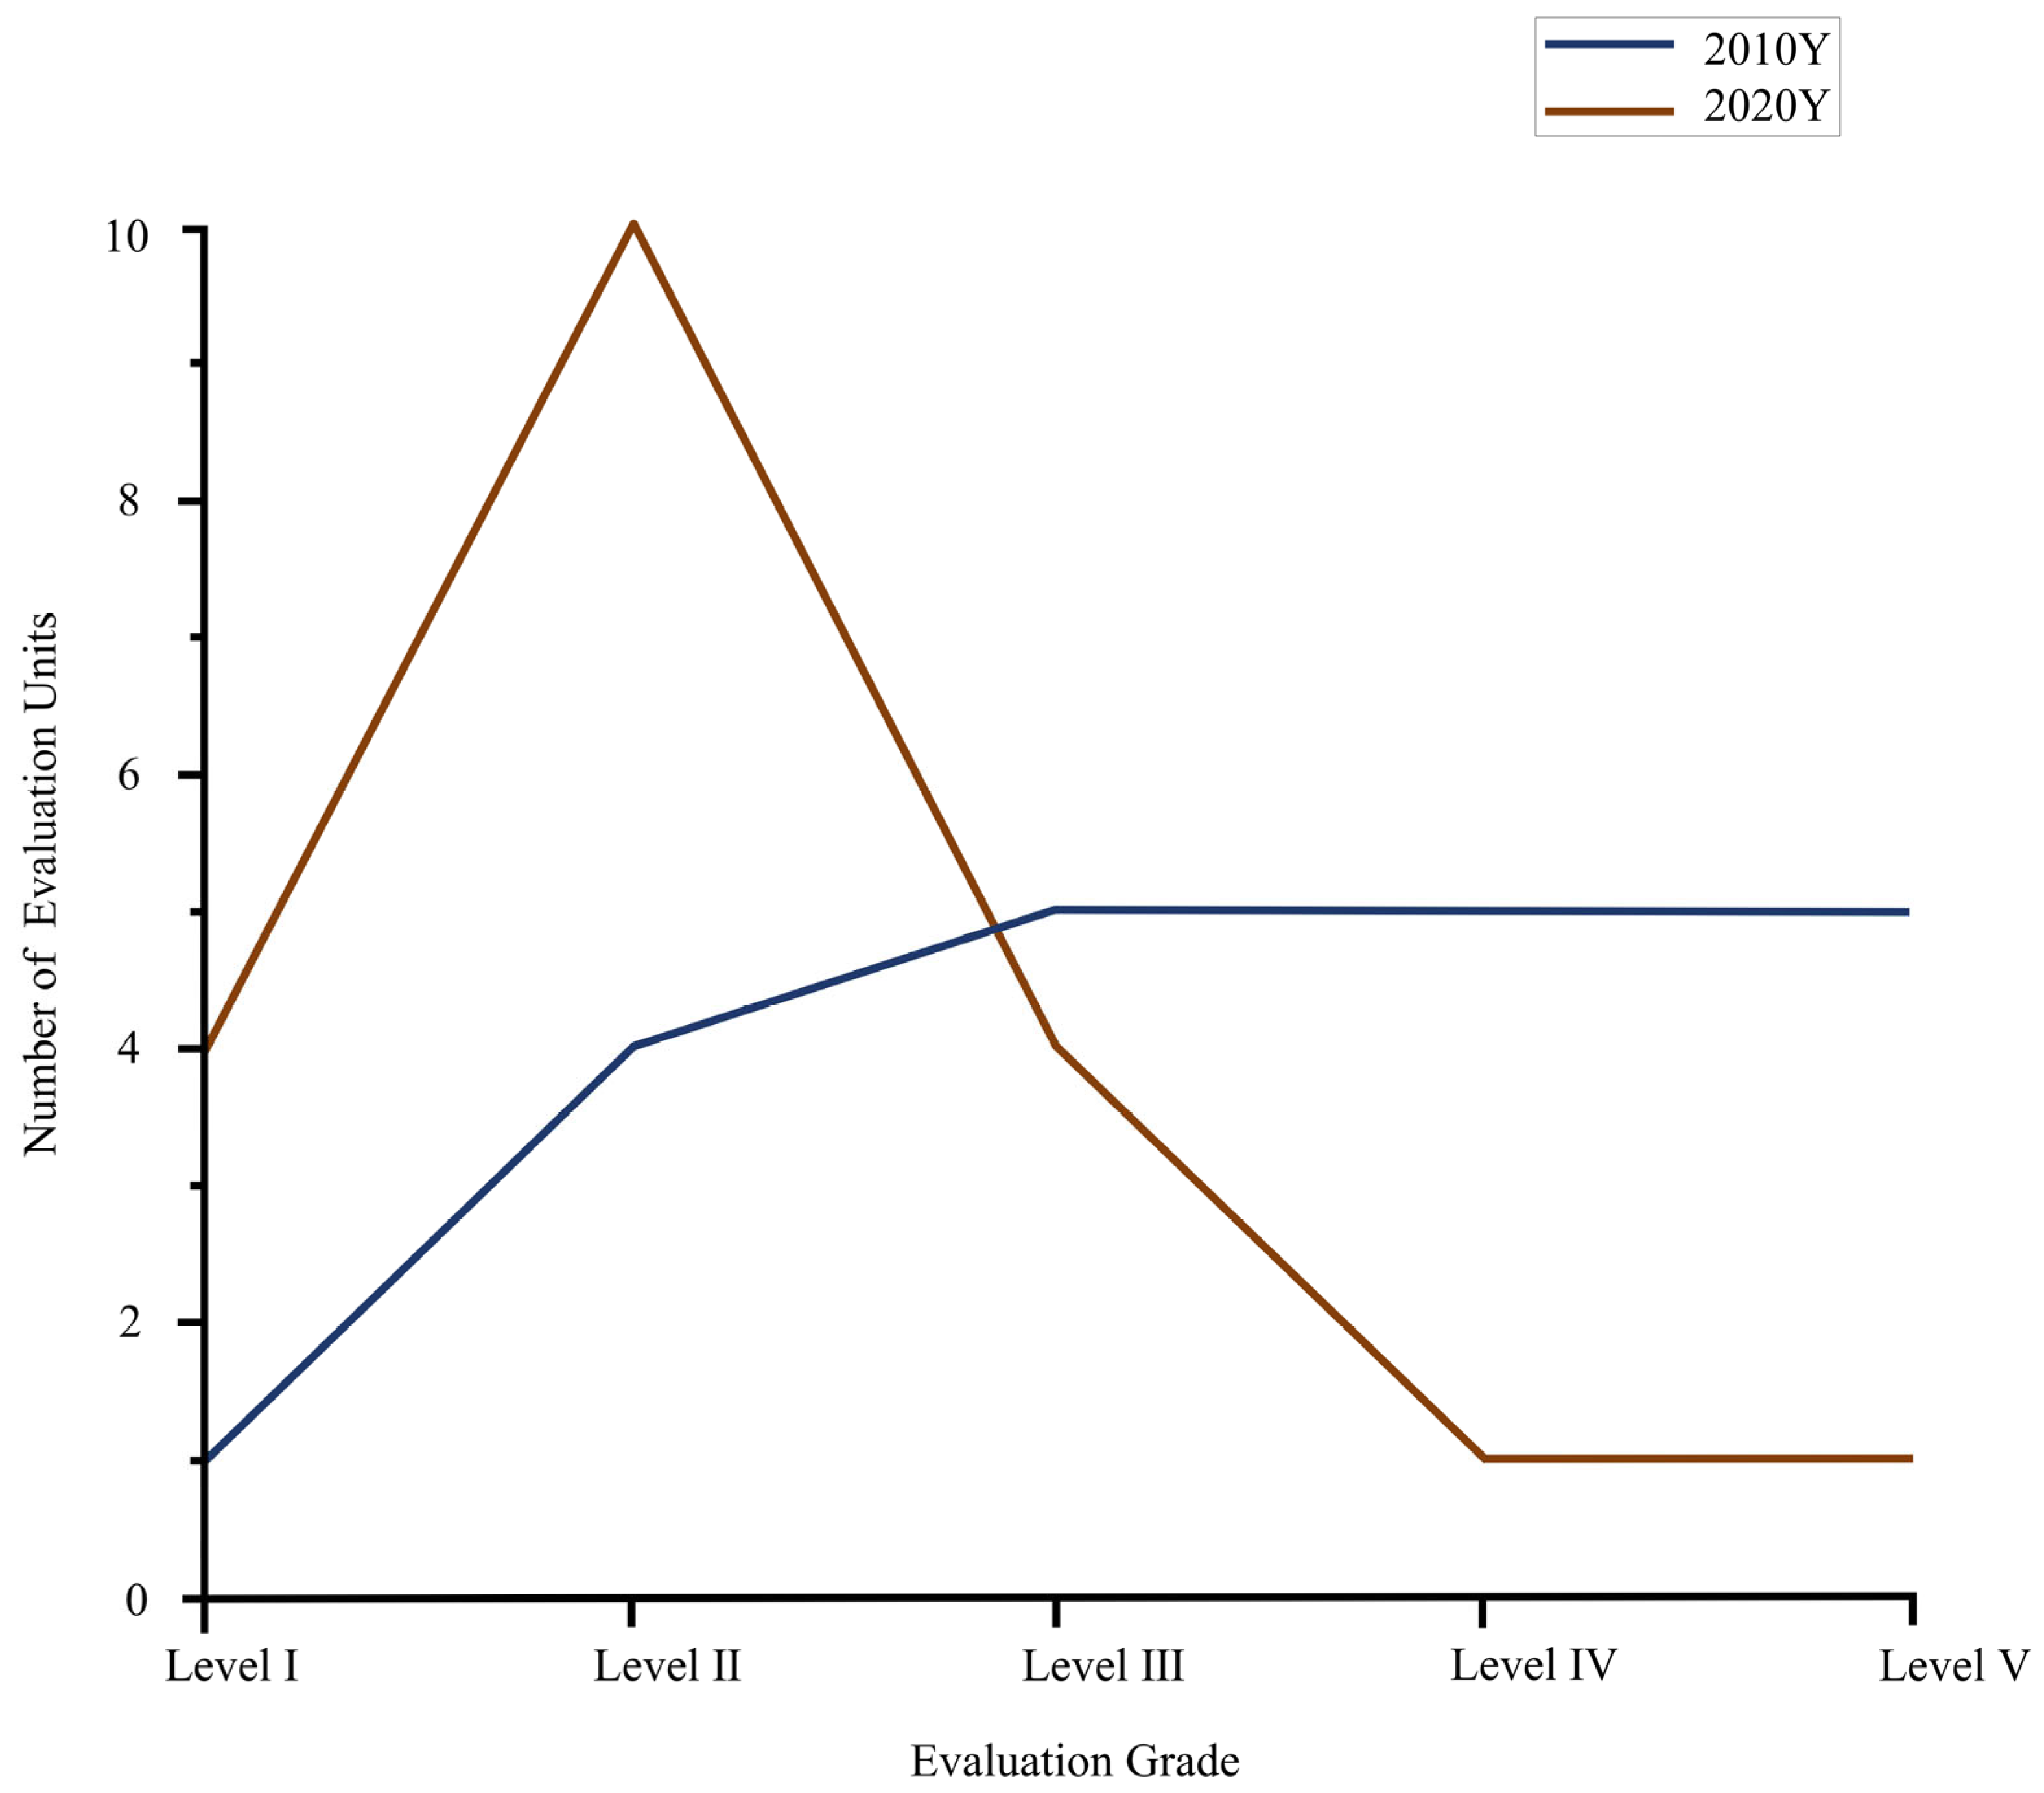
Specifically (
Figure 4), in 2010, the highest value of coastal vitality characteristics in the study area was Fuqing City, with an evaluation value of 0.66, corresponding to grade V, and there was only one evaluation unit of grade V. The lowest evaluation value appeared in Lianjiang County, with an evaluation value of 0.20, and the evaluation results were concentrated in grade I to III, with relatively few evaluation units of grade IV and grade V. The overall coastal activity level is not high in the period, and the evaluation distribution of regional activity is mainly middle and low, and the grade trend line is negative. In 2020, the high-value areas are Fuzhou, Putian City, Hui ‘an County, Longhai City, and Zhangpu County, and the evaluation level is V research area. Compared with 2010, the evaluation units in IV and V are significantly increased, showing an obvious upward linear trend. In terms of the quantity distribution of each evaluation grade, the coastal vitality in 2020 has been significantly improved compared with that in 2010, but the coastal vitality characteristics of counties and cities in Fujian Province are still significantly different.
4.2. Influencing Factors of Dynamic Coast
This study obtains the weight value of each evaluation index based on the entropy weight method. The entropy weight method calculates the information entropy of the evaluation index, that is, the variation degree of each evaluation index, and obtains the information entropy redundancy information of each index through further analysis. Since the information entropy redundancy is positively correlated with the contribution degree of data index, the contribution of each evaluation index can be obtained by using the result of information entropy redundancy.
4.2.1. Overall Analysis of Indicator Contribution Degree
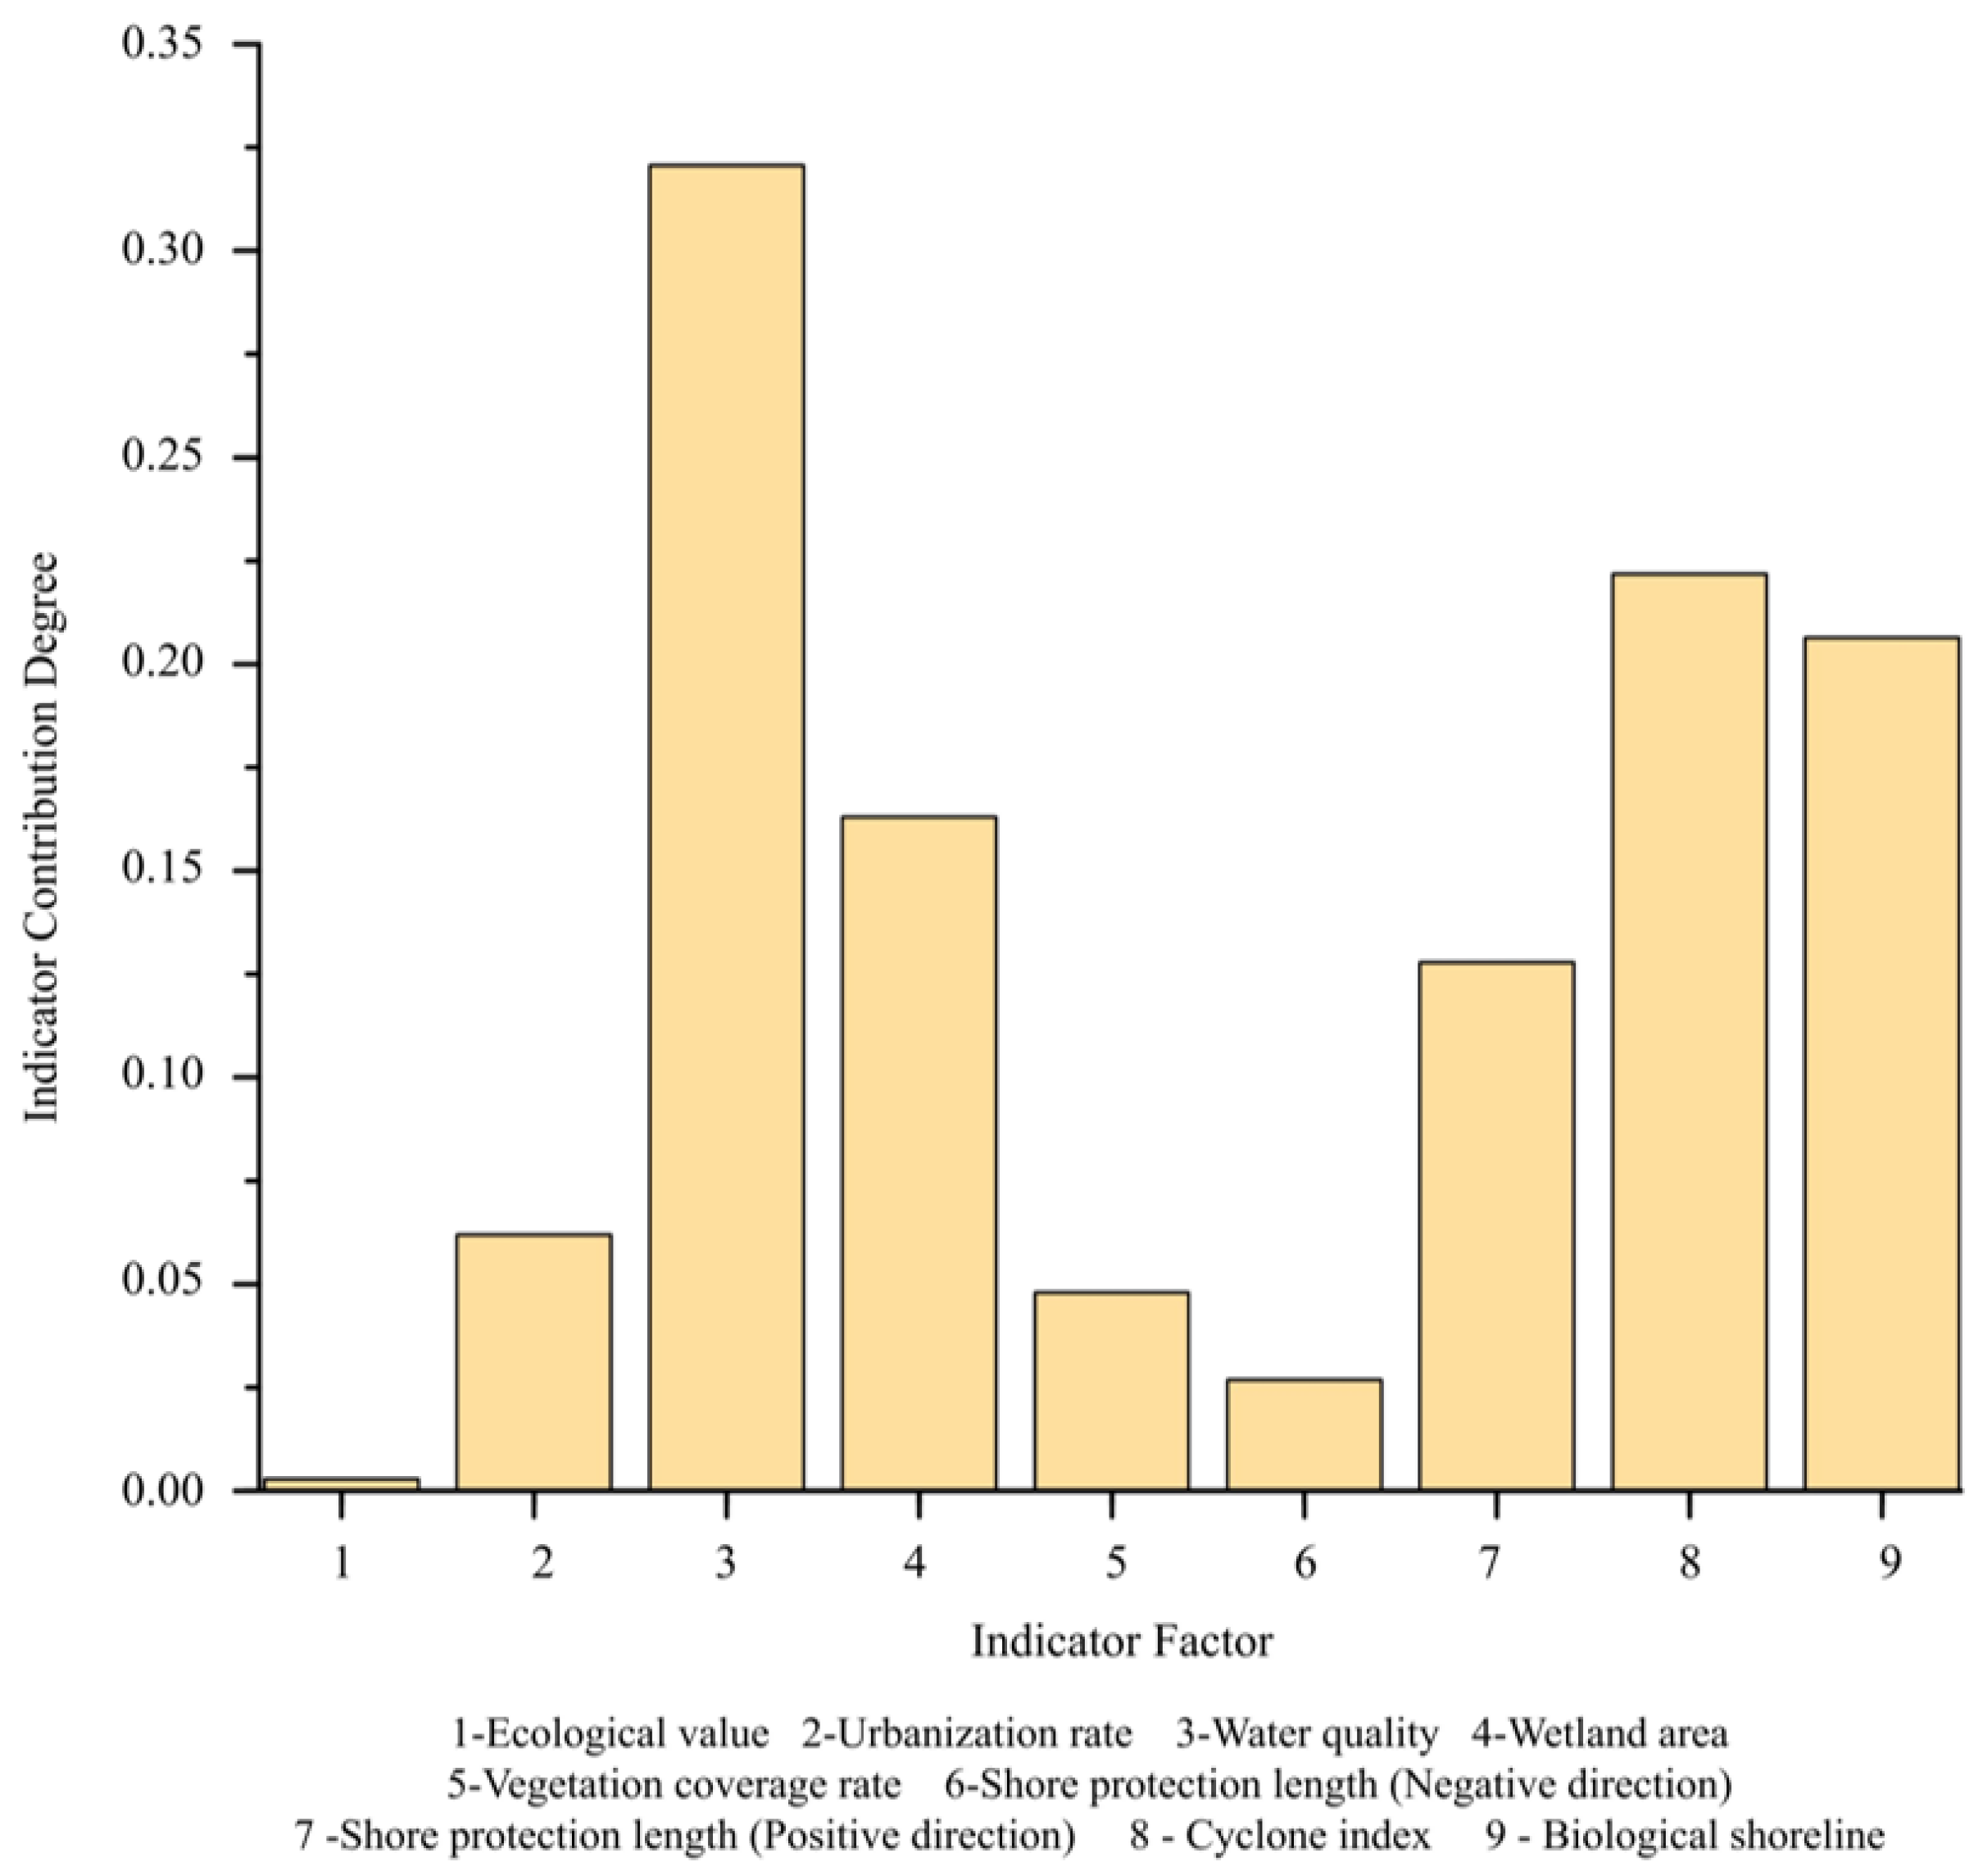
According to the contribution of each index (
Figure 5), in the evaluation of coastal vitality characteristics in this study area, the information entropy redundancy of the water quality index is the highest, which has the most significant impact on the coastal vitality characteristics of the study area. Secondly, the cyclone index, biological shoreline and wetland area also contribute a high impact degree, indicating that the original data of several evaluation indicators are significantly different and contain rich information. The contribution to evaluation is relatively high. The low redundancy of information entropy of ecological value and negative shore protection length indicates that the real value of their data has little difference in this study area and fails to make a high contribution to the evaluation.
Water quality is a significant index factor of environmental quality, which represents water quality and water connectivity. Coastal water quality directly affects coastal vegetation colonization and intertidal biodiversity. Biological shoreline and wetland area represent the basis of coastal ecological vitality. Mangroves and salt marshes can not only reduce waves and weak currents but also provide excellent habitat and feeding ground for fish, birds and intertidal animals, which effectively indicates the status of coastal vitality in the study area. At the same time, Fujian Province is the first-class area of typhoon disaster in China. The economic loss and sudden erosion and damage caused by typhoon on the coast measure the necessary degree of dynamic coast reconstruction. Therefore, water quality, biological shoreline, wetland area and length of bank protection significantly affect coastal vitality in the study area.
4.2.2. Difference of Indicator Contribution Space
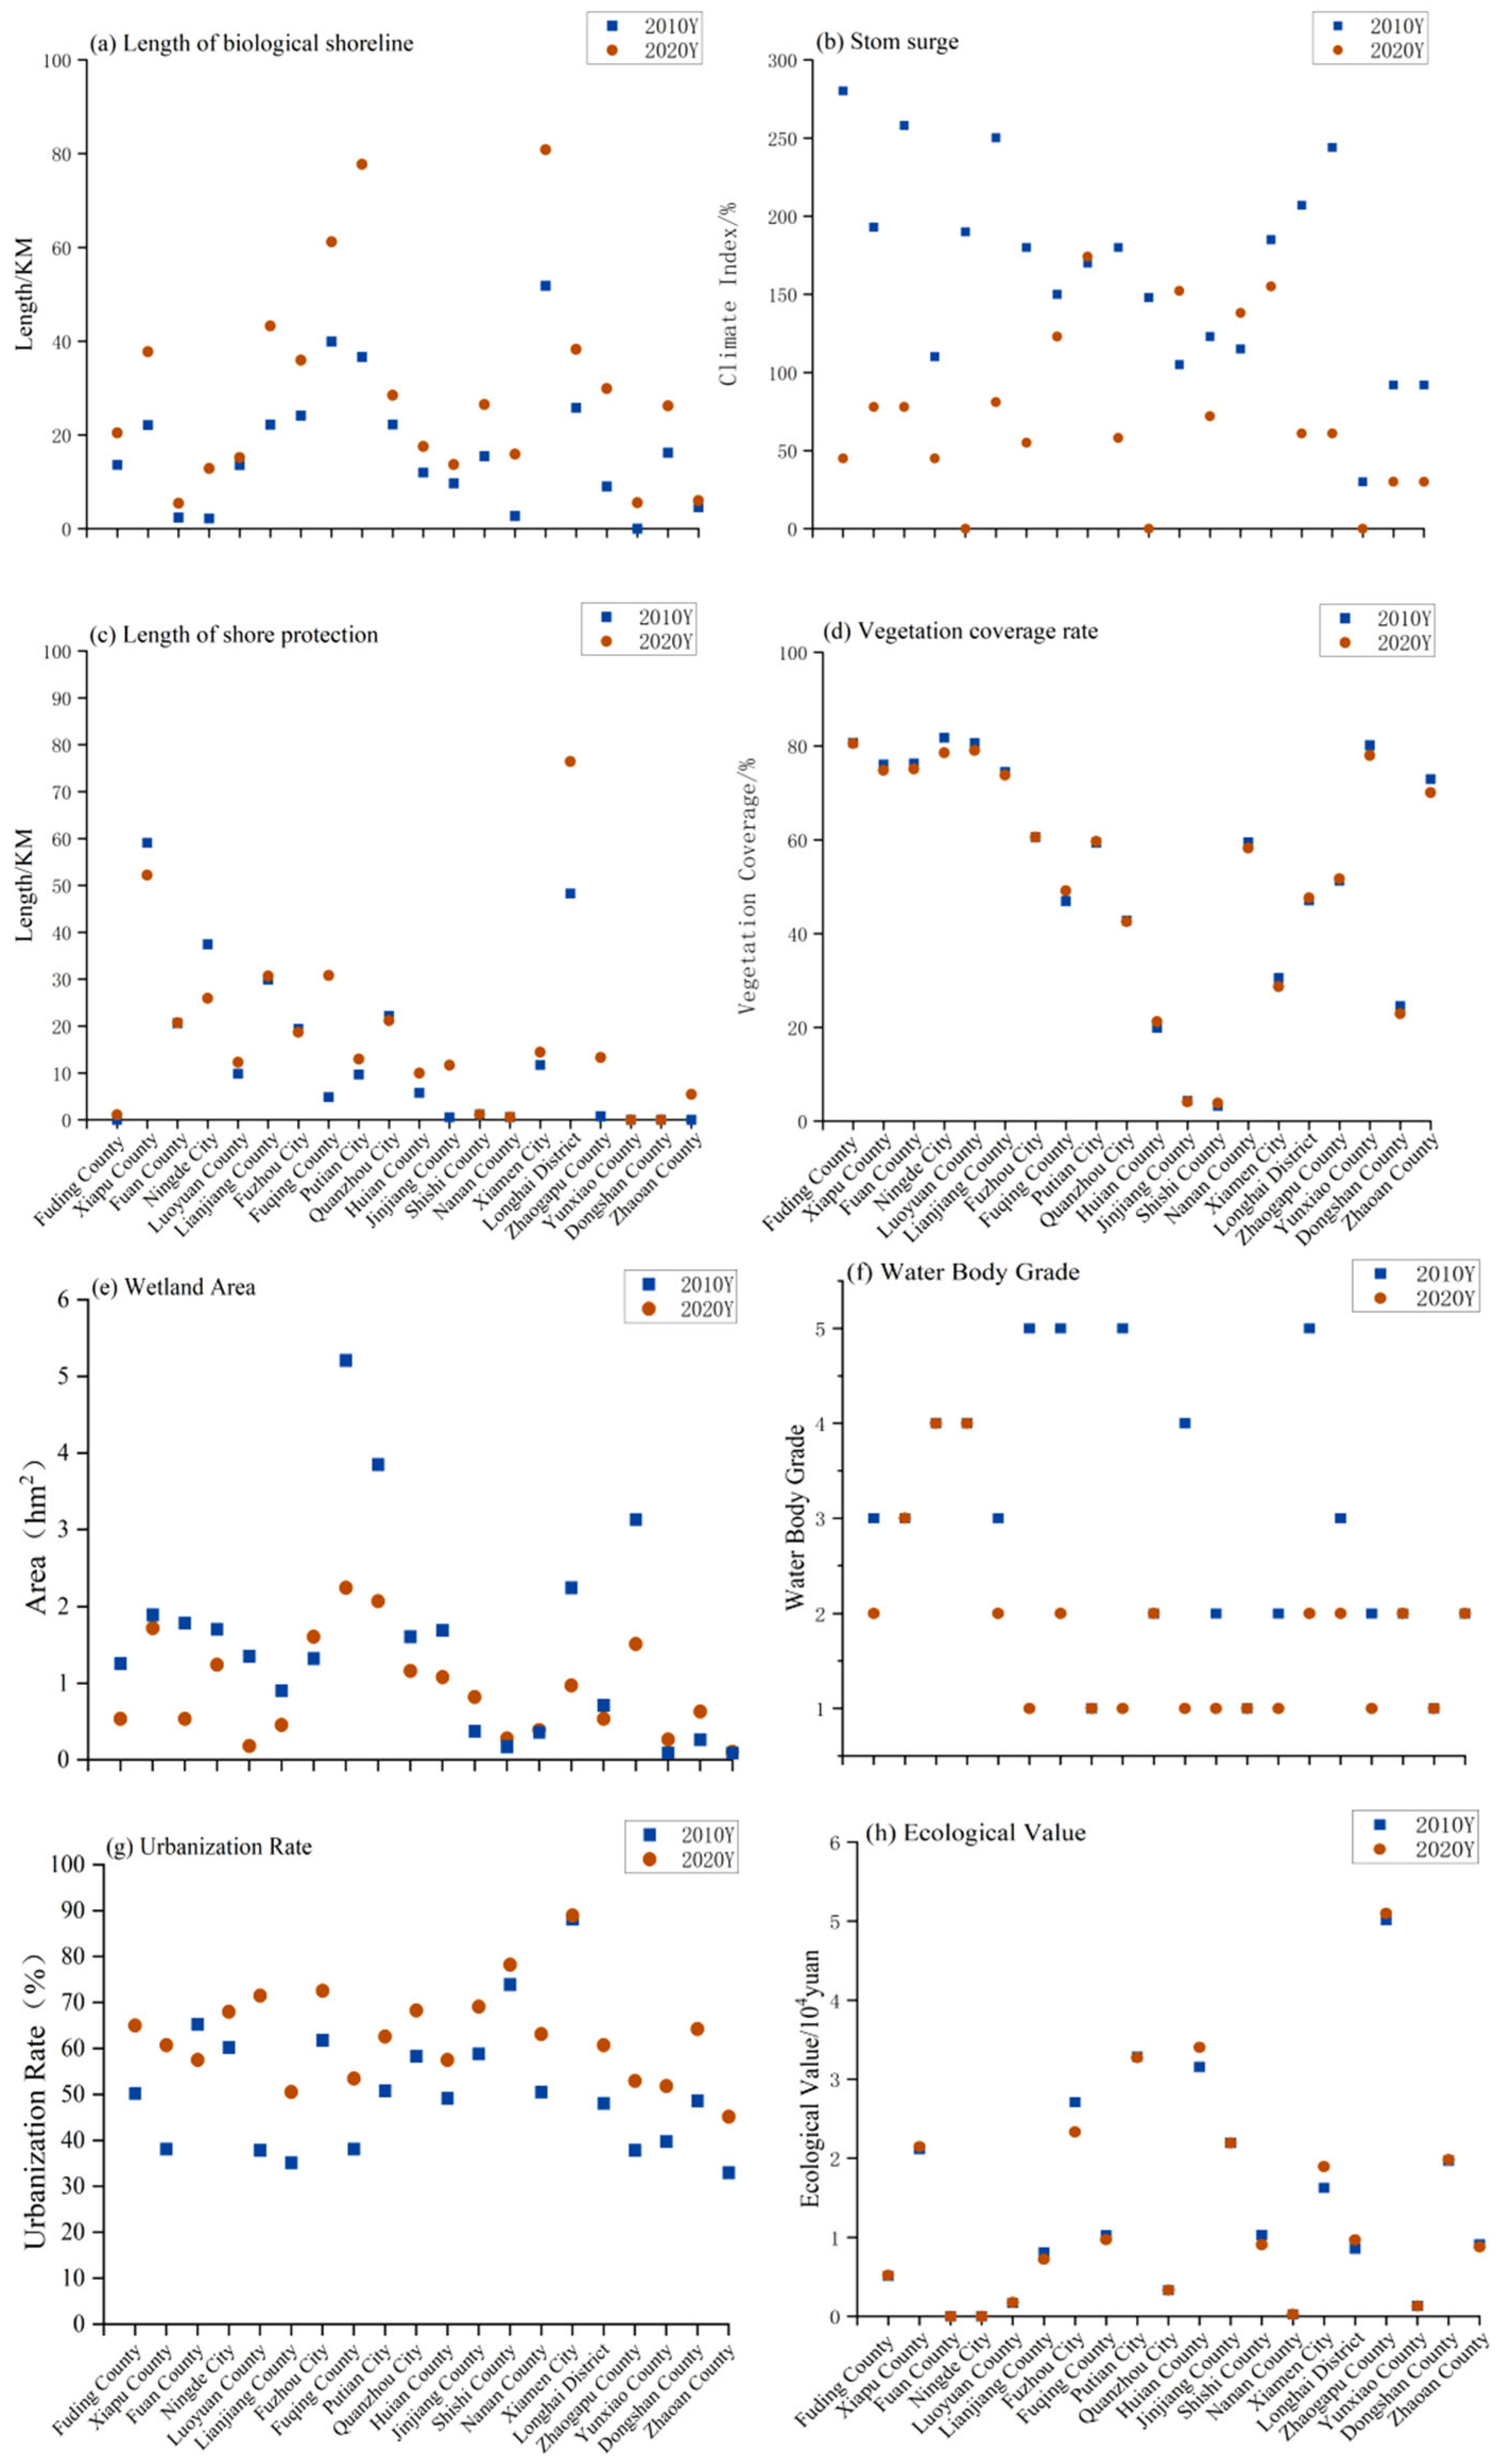
From
Figure 6 and
Figure 7, we can see the contribution degree of indicators and the specific differences of indicators in each research area. Water body quality, cyclone index (storm surge), and other indicators have obvious influence in each evaluation unit and have high contribution degree, among which the water body quality factor has the most obvious influence in the central north and central south of the study area. According to the evaluation results, the contribution of this index to the region with higher coastal vitality level is relatively greater. In this part of the region, the data of water body quality in the two periods have a large change. Compared with 2010 and 2020, there is a relatively obvious improvement, and the corresponding evaluation results have the same trend, reflecting that the improvement of water quality in these areas has brought about the improvement of coastal vitality. The contribution of the cyclone index to the evaluation results of Fuding County and Putian City is relatively high in the central and northern regions. The biological shoreline index has significant influence on Fuding County, Jinjiang County, Zhangpu County and Zhaoan County. Negative revetments length, ecological value and other indicators contributed less to each evaluation object, and there was little difference among different evaluation result units. Given the data characteristics of negative revetments length and ecological value in the study area, the entropy weight method assigns lower weights to relevant indicators due to the combined effect of its objective weighting mechanism and these data features. This purely objective weighting approach, based on data variability, may lead to insufficient assessment of indicators with high practical importance but low data fluctuation. To address this limitation, this study subsequently introduces the Analytic Hierarchy Process (AHP). By constructing pairwise comparison matrices of criterion-level elements through expert subjective judgments, it quantifies subjective weights. The integrated weighting model developed not only objectively preserves data variability characteristics but also incorporates subjective decision-making dimensions such as ecological ethics and regional policies. This effectively mitigates the limitation of the standalone entropy weight method, which exhibits overreliance on data variability at the expense of practical significance in indicator weighting.
The data of various indicators in the study area show differences in three different situations:
(1) The data of storm surge, wetland area and water quality in 2020 show an overall downward trend compared with that of 2010, in which storm surge and water quality are negative indicators, indicating that the study area is relatively less affected by cyclones and the quality of coastal waters has improved. The quality of the coastal waters in Fujian Province is significantly different, and the southern and central areas are obviously better than the northern areas. The northern areas are more distributed with hills and valleys and promontory bay type, and the connectivity of the coastal waters is weaker than that of the southern open coast. During the study period, the water quality of Category II (GB 3097-1997) [
36] and above accounted for 45% in 2010. In 2020, the rate is 85%, showing a trend of improvement, and the improvement of water quality provides a guarantee for the connectivity of coastal waters and biodiversity, thanks to the Blue Bay remediation action in Fujian Province since 2016. During the study period, the cyclone index from 2000 to 2010 was significantly higher than the data from 2010 to 2020. There were obvious uncertainties in this index, and different regions were affected to different degrees, with no obvious regularity. The wetland area in the study area in 2010 was significantly better than that in 2020. Combined with the two-stage changes in the length of bank protection, the study area was still in a relatively high coastal utilization and development intensity in the past ten years. The high-intensity coastal development and construction essentially occupied natural shoreline, including sandy, silty and biological shoreline. It shows that the conflict between coastal economic development and coastal ecological maintenance is more significant.
(2) Compared with 2010, the indicators of bank protection length and urbanization rate in 2020 show an overall upward trend, and the increase of bank protection length and urbanization rate indicates a relatively high economic development trend in the study area during 2010–2020. The construction of port terminals and the development of fishery and aquaculture strongly promote regional economic growth, and the urbanization level of all regions is significantly improved. The population structure has been greatly improved, the overall living standards of residents have been improved, and the material civilization has also increased the demand for ecological civilization construction. On the other hand, the increase of the length of bank protection indicates that the hardening of the shoreline in the study area is severe, and the higher intensity of coastal development and utilization brings a huge burden on the coastal habitat, encroaching on the original coastal ecological habitat.
(3) There was no obvious change trend in the three indicators of biological shoreline length, vegetation coverage, and ecological value in the two periods, but the specific performance of the three indicators was very different among the study areas. The change of biological shoreline in the study area is shown as the decline of Xiapu and Ningde in the north and the rise of Longhai and Zhangpu in the south. In terms of total amount, the northern region is more than the southern region, which is closely related to the economic development intensity of Fujian Province. The higher level of economic development and the intensity of coastal development and utilization in the southern region occupy the biological vegetation forms of the coast to a certain extent. In the northern part of the study area, the vegetation cover is more abundant in the total amount of mountains and hills, which shows the overall advantage of the northern part. In the central and southern sandy shoreline of the study area, the ecological value index corresponds to the ecological value of the intertidal zone, which is more significant on the sandy coast, so the ecological value of the central and southern regions is higher.
Since 2012, with the construction of ecological civilization, ecological protection, restoration, and remediation of Fujian coastal zone have played a positive role [
37]. The Blue Bay remediation action has significantly improved the quality of coastal waters, which has improved the anti-jamming ability against high-intensity human exploitation activities and natural disasters. As well as increased intertidal biodiversity and water connectivity, coastal vitality has been significantly enhanced. At the same time, the urbanization level of coastal areas in Fujian Province continues to improve, still maintain a high intensity of coastal development and utilization, and the artificial shoreline keeps increasing. On the one hand, the economic benefits brought by its ports, wharves and fisheries cannot be ignored; on the other hand, it encroaches on the original natural shoreline and wetland ecosystem, resulting in contradictions and conflicts between economic development and ecological protection. Therefore, reasonable and effective exploitation of shoreline resources and enhancement of coastal vitality are the development direction of current coastal zone space utilization planning. This study designated 2010 and 2020 as comparative temporal nodes to account for the hysteresis effects inherent in coastal ecosystem restoration outcomes. The selection of 2010 establishes a pre-restoration baseline preceding China’s large-scale implementation of coastal rehabilitation projects, while 2020 captures stabilized post-intervention effects. Intermediate years (e.g., 2015) were excluded due to the non-linear cumulative enhancement of coastal protective value, wherein ecosystems undergo structural recovery during the initial 3–5 years post-restoration, resulting in suboptimal protective functionality of critical components such as mangroves. Future research will implement a multi-tiered monitoring framework integrating extended temporal cycles and critical spatial zones: medium-term assessments at 5-year intervals will be deployed in priority restoration areas using UAV technologies to characterize project phasing, while field monitoring at representative restored beaches will acquire fine-scale process parameters including benthic biomass and biotic growth rates. This dual-scale approach concurrently addresses ecological engineering cycles and response hysteresis, thereby generating enhanced scientific precision for coastal management.
4.3. Rejuvenating Coastal Management Measures
The dynamic coastal technology aims to maintain the function of coastal ecosystem while realizing the basic function of coastal structure through natural ecosystem or in combination with traditional hard shore protection. The coastal areas of Fujian Province have improved the quality of the coastal waters in the study area, enhanced the ecological vitality and realized the enhancement of the coastal vitality through the measures of coastal ecological regulation and restoration, blue bay project, mangrove construction, reclamation of moisture and beach conservation. Dynamic coast technology enriches the technical means of coastal ecological restoration, but its technology transplantation should consider the following aspects:
(1) Fujian Province has a large number of wetland resources, with a large total amount of natural wetlands, many types and relatively complete types [
22], and the development of dynamic coastal technology to make good use of wetland ecosystems. Wetland is one of the important carriers for the development of dynamic coastal technology, which can be combined and configured with local dominant species based on the good wetland foundation and the actual situation of the region. Ecological protection projects such as planting shelterbelts, repairing coastal beaches and mangroves are combined with the wetland ecosystem to enhance the absorption and stabilization of the coastal system to normal waves, realize the ecological transformation of the artificial shoreline, and gradually establish a sustainable ecological coastal protection system [
37].
(2) Compared with traditional hard shore protection, dynamic coast has many advantages, but its implementation and application are characterized by local conditions. Vegetation planting conditions, wave energy, coastal erosion conditions, storm surge disaster frequency, and social and economic conditions are different in different regions, so there is no universal dynamic coast technology [
19]. The evaluation results also show that the dominant factors of coastal vitality are different in each study area of Fujian Province, so the installation and planting conditions of dynamic coastal materials are different in different places. The dynamic coast composed solely of vegetation is more suitable for low-energy coast, and the combination of mixed structure and hard revetment can cope with the conditions of high-energy coast [
8]. At the same time, the dynamic coast is subject to the type of utilization and the degree of erosion: the transformation of the dynamic coast is more urgent in the coasts with good socio-economic conditions, high wave energy, severe storm surge impact or vulnerable to erosion [
38]. This study excludes Pingtan Island from the research scope primarily due to systematic differences inherent in its offshore island characteristics compared to the mainland coastal zone. Hydrodynamic intensification driven by the funnel effect results in significantly distinct coastal erosion mechanisms and sediment transport patterns relative to the mainland. The dual geomorphic structure—characterized by bedrock headlands along the eastern coast and sandy tidal flats on the western coast—exhibits fundamental differences from the continuous muddy plains or homogeneous bedrock shorelines of the mainland. To ensure methodological rigor and comparability of research subjects, Pingtan Island is designated as an independent case study.
(3) Establish and improve the active coast monitoring and evaluation system. The technology of dynamic coast is not mature in China, and there is a lack of evaluation and monitoring system. At the same time, many benefits of dynamic coast can only be realized after the established ecosystem is planted and grown for a period of time, which is a long-term process. Only by establishing a long-term monitoring management system, obtaining effective quantitative evaluation data, and monitoring its transformation effect can regional adjustment and guidance be carried out. Only by constructing a dynamic coast evaluation system, improving the evaluation indicators of dynamic coast, and applying the evaluation results to practice can managers better understand the status quo of the vitality of the coastal zone system and provide a reference basis for timely formulation of more scientific and reasonable protection and disaster reduction measures.
5. Conclusions
1. This study carried out coastal vitality characteristics evaluation for 20 coastal evaluation units in Fujian Province, selected nine index factors representing disaster prevention capability, ecological vitality and economic potential of the study area, calculated the evaluation results of each evaluation unit in 2010 and 2020 by using the entropy weight method and natural breakpoint method, and preliminarily established the Fujian Province dynamic coast evaluation system. Through the comparative analysis of the evaluation results of the two periods, it is found that the overall coastal vitality of the central and southern areas of Fujian is better than that of the northern areas, which is related to the high degree of reasonable development and utilization of the coast and the long length of ecological bank protection.
2. The degree of differentiation of indicators in this evaluation is large, and the ecological benefit index is more obvious in the evaluation contribution. Compared with 2010, the coastal vitality in 2020 is significantly improved, but there are still large differences among different evaluation units, and the coastal ecosystem still needs targeted protection and restoration. The water quality and urbanization level of the study area have been greatly improved, which brings positive benefits to the improvement of coastal vitality. At the same time, the coastal hardening situation is very serious, improving economic benefits at the cost of ecological benefits. According to local conditions, carrying out ecological transformation of the coastline is the focus of coastal vitality transformation in the future.
3. As an early province in China to carry out comprehensive coastal zone management practice, Fujian Province, while making full use of rich natural wetland resources and developing adaptive technologies of dynamic coast, needs to establish a suitable dynamic coast evaluation index system during the implementation of coastal zone protection and restoration projects to evaluate the implementation effects of the projects. In order to promote the effective implementation of functional departments’ planning, it is of great significance to consolidate the achievements of ecological civilization construction in Fujian Province.


 ,
, 

