1. Introduction
In high-latitude seas, sea ice typically forms during winter months, imposing significant challenges for both marine navigation and coastal infrastructure. Ships operating in ice-covered areas are subjected to complex and highly variable ice loads on hulls and structural components [
1,
2]. Likewise, sea ice exerts considerable forces on coastal infrastructure, such as ports and harbor facilities. These interactions may result in structural damage, obstruction, or even failure [
3,
4], particularly under conditions where extreme-weather events, driven by climate change, complicate the prediction of ice conditions [
5,
6,
7]. In this context, a detailed understanding of sea ice’s mechanical properties is essential for the structural design and performance assessment of ice-capable vessels and coastal infrastructure [
8,
9,
10,
11].
During navigation in ice-covered areas, level ice is the most frequently encountered ice type [
12]. It forms through undisturbed thermodynamic growth and exhibits a relatively uniform internal structure [
13]. Piled ice develops in nearshore and harbor regions as loosely compacted brash or fragmented ice, driven by wave action, shoreline accumulation, or anthropogenic activities such as icebreaker operations [
14]. Piled ice can impose substantial loads on coastal infrastructure, and its interaction with structures remains an important yet insufficiently characterized engineering problem. The distinct morphological characteristics of level and piled ice lead to significantly different mechanical responses under compressive loading, which is a primary mode of interaction between sea ice and both vessel and coastal structures [
15,
16].
The compressive mechanical behavior of level ice has been extensively studied using laboratory and field experiments. However, the majority of these studies have focused on its columnar components. Sinha [
17] demonstrated an inverse relationship between temperature and compressive strength, while Schulson and Duval [
18] linked this behavior to temperature-dependent mechanisms such as grain-boundary sliding and microcrack initiation. Cox and Weeks [
19] established porosity–strength correlations via density, salinity, and temperature effects, and Li et al. [
20] developed a unified-strength surface that incorporated both porosity and strain rate effects across a broad range of strain rates. Strain rate has been shown to strongly influence compressive strength and failure mode, with ductile behavior prevailing at low strain rates (10
−6 to 10
−3 s
−1) and brittle failure dominating at higher rates (10
−3 to 10
−1 s
−1) [
21]. Thermal stratification further complicates the compressive response of natural sea ice, promoting asymmetric deformation and tensile cracking near the surface [
22,
23]. Recent studies employing digital image correlation [
24,
25] and high-speed photography [
26] have provided valuable insights into deformation and failure mechanisms at the grain scale. While significant progress has been made in characterizing the mechanical behavior of level ice, research on the compressive properties of piled ice remains sparse. Field studies have, to date, primarily addressed its morphology and formation processes [
14,
27], with limited experimental data on its mechanical response under compressive loading.
Moreover, granular ice constitutes a substantial component of both level and piled sea ice. Perovich et al. reported that granular ice content exceeded 50% at six out of fourteen Arctic ice stations, with an average of 41.5% across all stations [
28]. Similar processes were observed in the Bohai Sea, where delayed freeze-up, prolonged early ice formation, and repeated break-up and refreezing cycles promote a high granular ice content [
29]. Existing studies on the mechanical behavior of granular sea ice remain limited. Research on the granular components of level ice is relatively scarce, and research on piled ice is almost absent. Xiu et al. conducted three-point bending tests on granular-level ice from Liaodong Bay [
29]. Timco and Frederking [
30] summarized uniaxial compression data and developed models that relate compressive strength to strain rate and porosity. However, these models primarily apply to ductile behavior and are not suitable for high-porosity ice. Wang et al. performed uniaxial compression tests on granular Arctic level ice during the melt season, although their study was constrained by a limited sample size and did not address failure mechanisms [
31]. Consequently, our understanding of the compressive mechanical behavior of granular sea ice remains incomplete and warrants further systematic investigation.
To address these gaps, this study systematically investigates the uniaxial compressive behavior of granular sea ice, a crystal type that remains underrepresented in previous mechanical studies. Laboratory experiments were conducted on two structurally distinct ice types, level ice from Liaodong Bay and piled ice from Laizhou Bay in the Bohai Sea, to explore the influence of porosity and strain rate on both uniaxial compressive strength and uniaxial compressive elastic modulus. While most prior studies have emphasized uniaxial compressive strength, we introduce and quantify the uniaxial compressive elastic modulus as an independent stiffness parameter, offering new insight into deformation resistance prior to failure. Moreover, this study presents an empirical data comparing the mechanical differences of granular sea ice formed under distinct growth environments. It also proposes a hypothesis that the reduced mechanical properties observed in piled ice may be attributed to microcrack networks induced by repeated freeze–thaw cycles, which may delay brittle failure. The results provide new insights into the compressive behavior of granular sea ice, with implications for the design of ice-resistant vessels and coastal infrastructure in ice-affected regions.
2. Materials and Methods
2.1. Ice Sampling
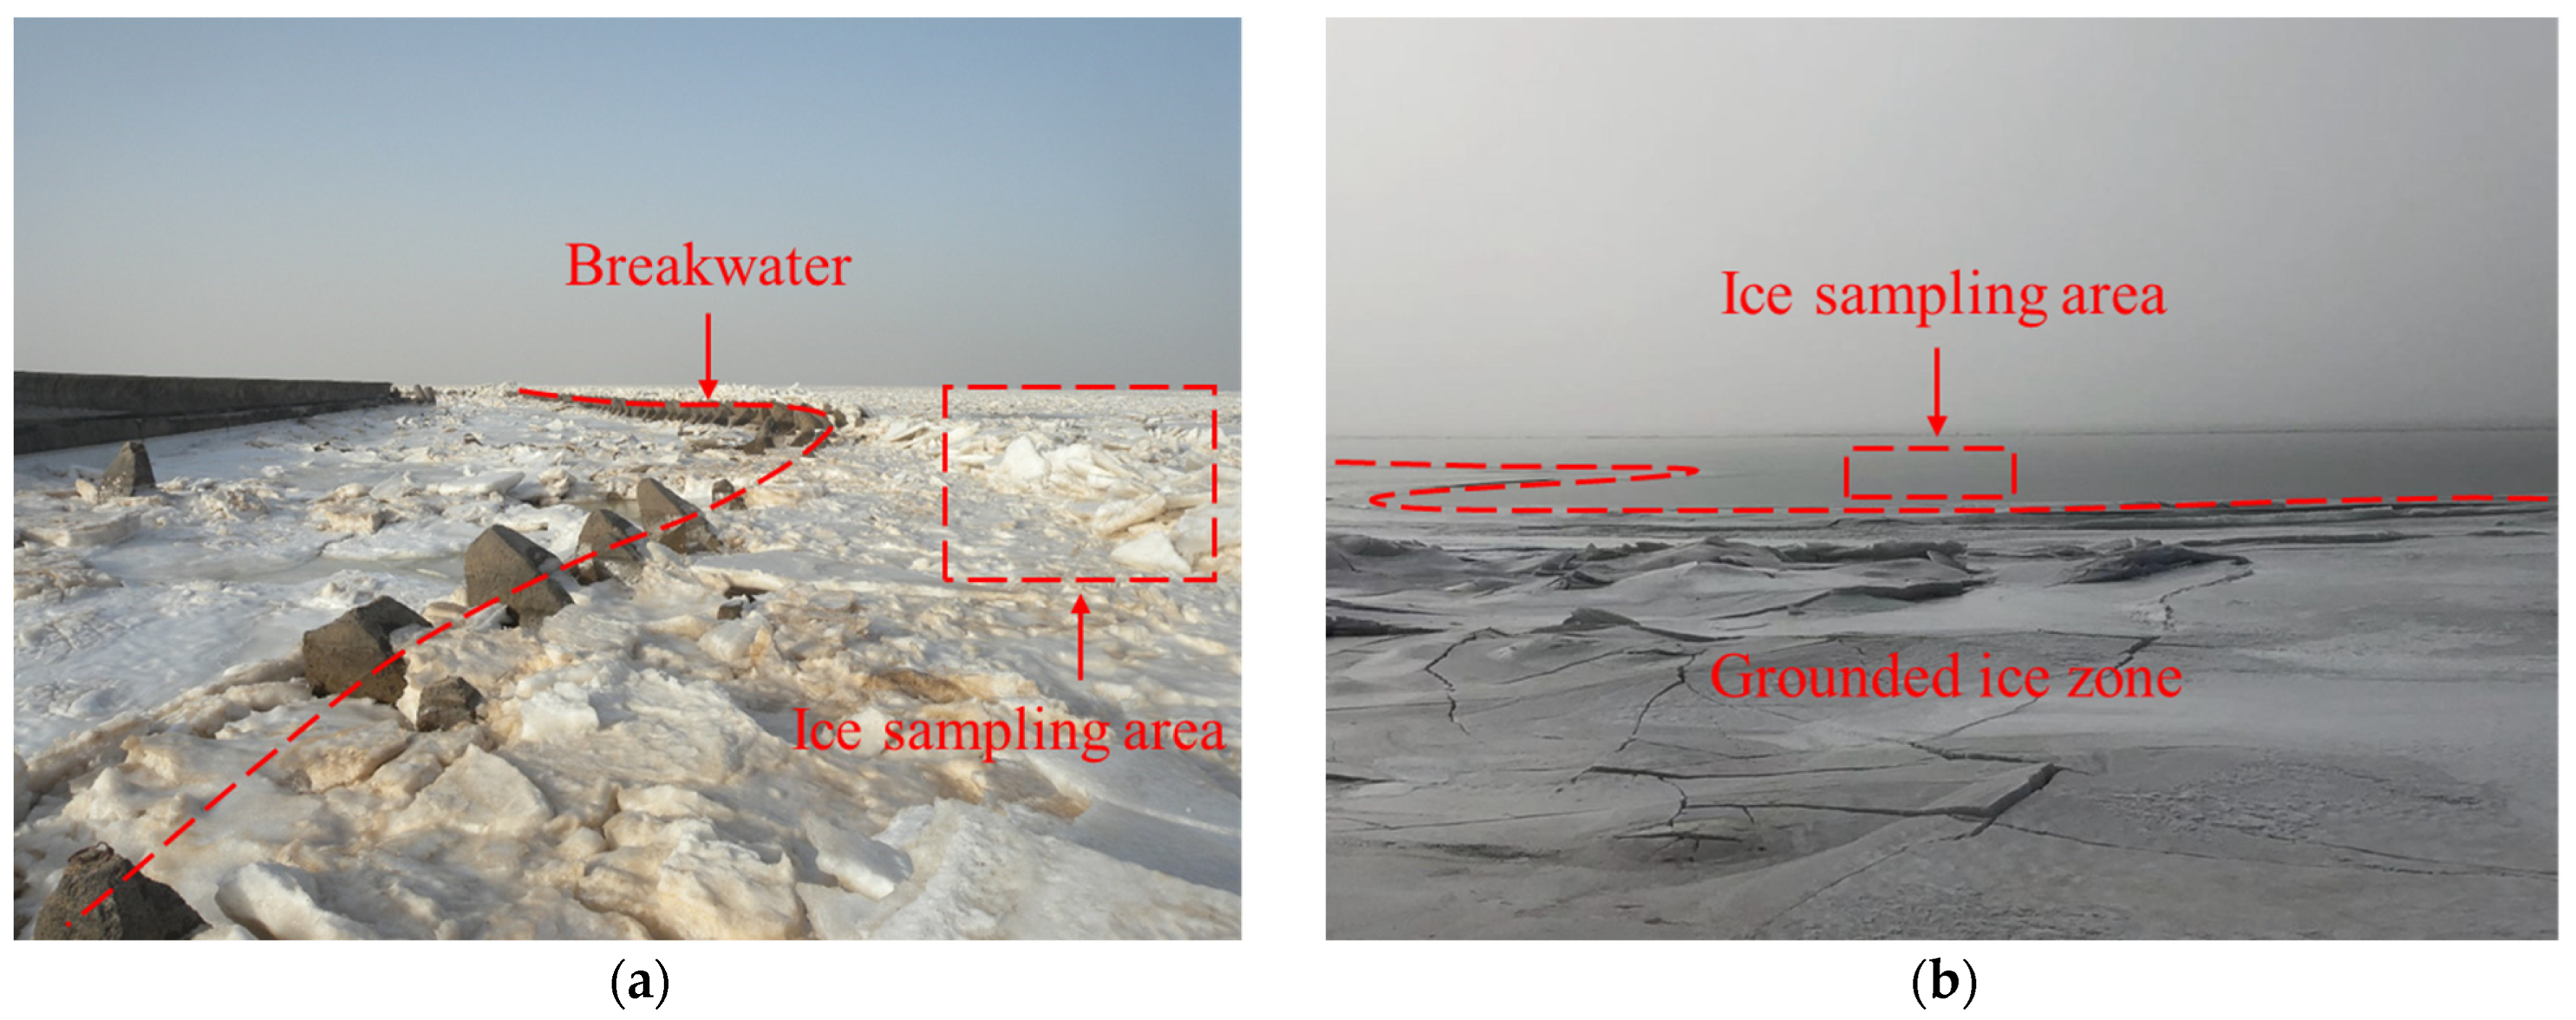
Piled ice samples were collected on 13 January 2021 at Site S1, located along the coast of Laizhou Bay (38.14° N, 118.69° E). As shown in
Figure 1a, piled ice was present near the breakwater, where tidal action had caused it to overtop the armor blocks. Beyond the breakwater, floating ice showed little to no drift, and the distant sea surface appeared level. Due to the limited thickness of the ice cover, direct extraction of blocks from the surface was neither safe nor feasible. Instead, ice blocks of appropriate sizes with smooth surfaces were selected from the piled ice. These were loosened with ice chisels (Langfang Shengao Outdoor Products Co., Ltd., Langfang, Hebei, China) and then shaped using an electric chainsaw (Dongcheng Power Tools Co., Ltd., Qidong, Jiangsu, China). The average thickness of the collected blocks was approximately 200 mm. To prevent sublimation, each block was tightly wrapped in plastic film immediately after sampling. Level ice samples were collected on 31 January 2023 at Site S2, located within the harbor basin of Panjin Port in Liaodong Bay (121.96° E, 40.75° N). As shown in
Figure 1b, grounded ice was observed in the nearshore foreground, while large sheets of level ice extended farther offshore. To ensure sample integrity and structural representativeness, the sampling area was carefully selected within the level region beyond the deformation zone. These ice blocks exhibited smooth top and bottom surfaces and showed no visible evidence of grounding or refrozen weak layers. All blocks were wrapped in plastic film immediately after collection to minimize sublimation, and were transported to the cold laboratory for further testing.
2.2. Crystal Structure and Physical Properties
To investigate the internal grain structure of the collected sea ice samples, selected blocks were sectioned vertically and horizontally using a bandsaw (Hangzhou ABCH Intelligent Technology Co., Ltd., Hangzhou, Zhejiang, China) in a cold laboratory. Sections were trimmed to dimensions of 80 mm × 80 mm × 20 mm (vertical) and 70 mm × 70 mm × 20 mm (horizontal). One surface of each section was polished and mounted on a glass slide. The final thickness was reduced to 0.2–0.5 mm using a microtome blade. All samples were observed under cross-polarized light using a polarizing microscope (Dalian Northern Analytical Instruments Co., Ltd., Dalian, China) to identify grain boundaries and determine crystal morphology. At Site S1, ice blocks were collected from piled ice that had been exposed to prolonged mechanical disturbance and solar radiation, resulting in highly irregular surfaces. Therefore, only the central portion of the ice, which was least affected by external factors, was selected for structural observation. In contrast, the blocks from Site S2 were sampled from level ice with minimal environmental disturbance, allowing for analysis across the entire ice thickness.
Temperature, density, and salinity are fundamental physical properties influencing the mechanical behavior of sea ice. In this study, physical property measurements were conducted on laboratory-prepared sea ice samples rather than in situ ice. The sample temperature was assumed to be equal to the climate chamber setting, without individual measurement. Before uniaxial compression testing, sample dimensions were measured using a caliper (±0.02 mm) (Delixi Instruments Co., Ltd., Shanghai, China), and mass was measured with an electronic balance (±0.1 g) (Shenzhen Meifu Electronics Co., Ltd., Shenzhen, Guangdong, China). Sample density was calculated from the mass and volume. After testing, fractured samples were sealed in clean plastic bags and melted at room temperature. Sample salinity was measured using a salinometer (±0.1%) (Shanghai Bangwo Instrument Equipment Co., Ltd., Shanghai, China).
Porosity (
v) in sea ice refers to the combined volume fraction of brine and gas trapped within the ice structure. In this study, it was calculated using measured values of temperature, salinity, and density, following the empirical method developed by Cox and Weeks [
19]. Their model, established under cold ice conditions (−22.9 °C to −2 °C), is based on the assumption of thermodynamic equilibrium and makes use of phase relationships in sea ice to estimate brine and gas volumes from bulk density. The method assumes that all salt is dissolved in the brine and does not explicitly account for gas bubbles or salt precipitation, although the bulk density indirectly reflects their influence. Leppäranta and Manninen later adapted this approach for use in warmer ice (−2 °C to 0 °C), updating the brine density–salinity relationship to better reflect conditions in temperate or brackish environments [
32]. This method remains a commonly accepted and practical tool for estimating sea ice porosity, especially in studies of ice’s mechanical properties.
2.3. Uniaxial Compression Tests
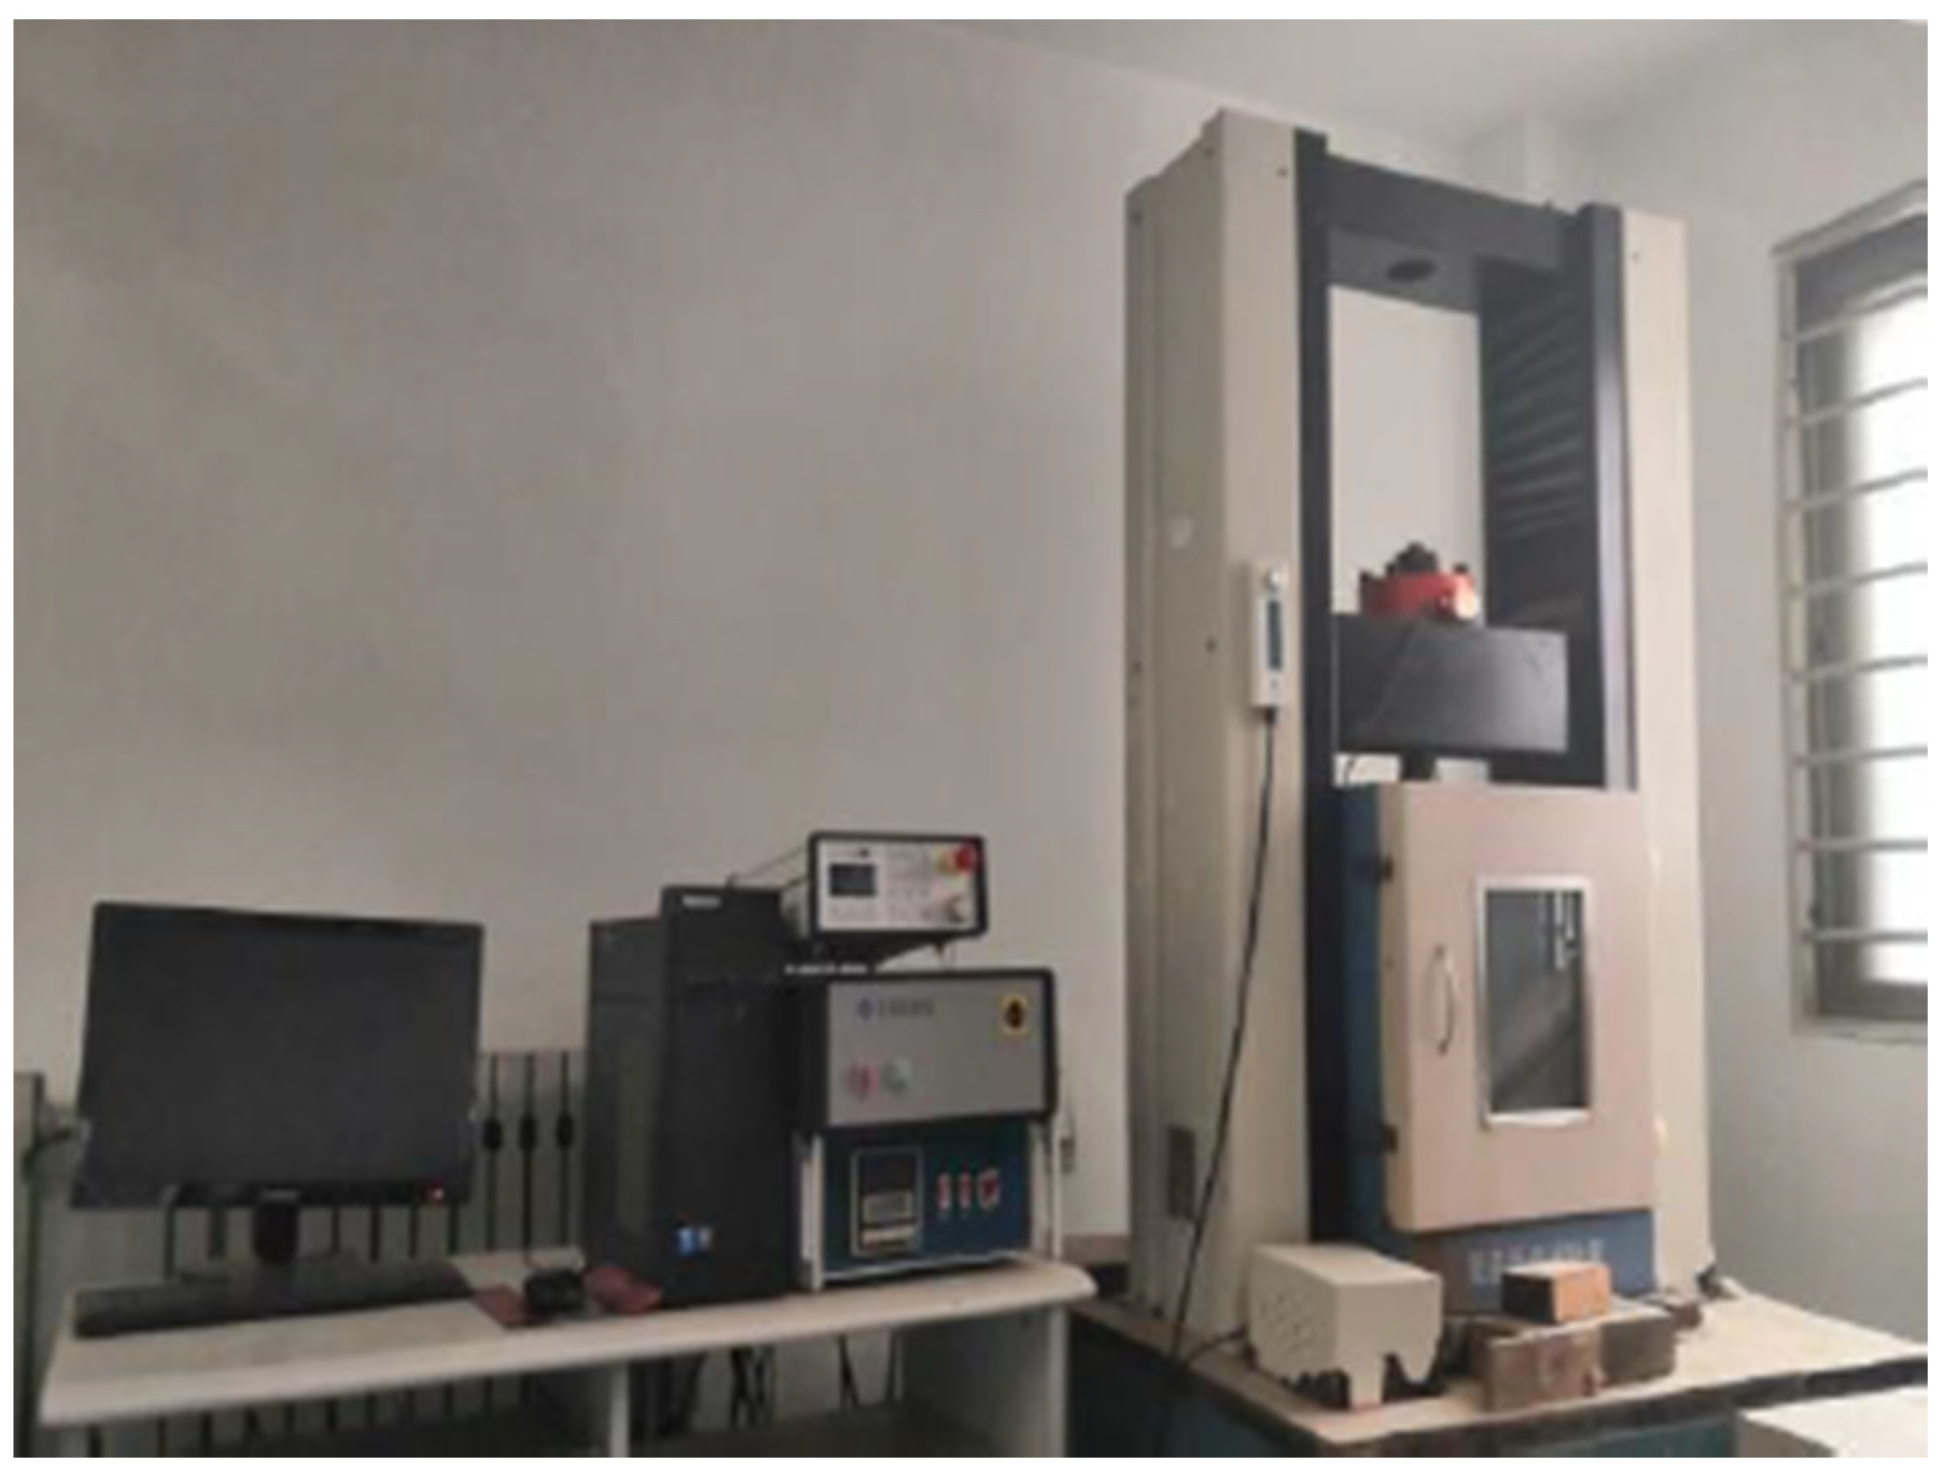
Uniaxial compression tests on sea ice were performed in the laboratory using an electronic universal testing machine (Sinotest Equipment Co., Ltd., Changchun, Jilin, China), as shown in
Figure 2. A low-temperature environmental chamber (temperature control accuracy ±0.1 °C) was placed between the crosshead and the base plate to maintain stable thermal conditions during testing. Granular ice layers from Sites S1 and S2 were selected and processed into specimens measuring 5 cm × 5 cm × 12.5 cm. Since engineering applications primarily focus on compressive strength parallel to the natural ice surface, and given the generally isotropic mechanical behavior of granular sea ice [
30], all tests were conducted under parallel-to-surface loading directions. Tests were performed at multiple temperatures. For piled ice, the temperatures were −3, −5, −7, −10, and −15 °C; for level ice, the temperatures were −2, −6, and −9 °C. The test strain rates ranged from 10
−5 to 10
−2 s
−1, which was consistent with full-scale ship–ice interaction scenarios. Specimens were conditioned at target temperatures for over 24 h before testing to ensure thermal equilibrium. A total of 269 valid datasets were obtained from piled ice, and 42 were obtained from level ice.
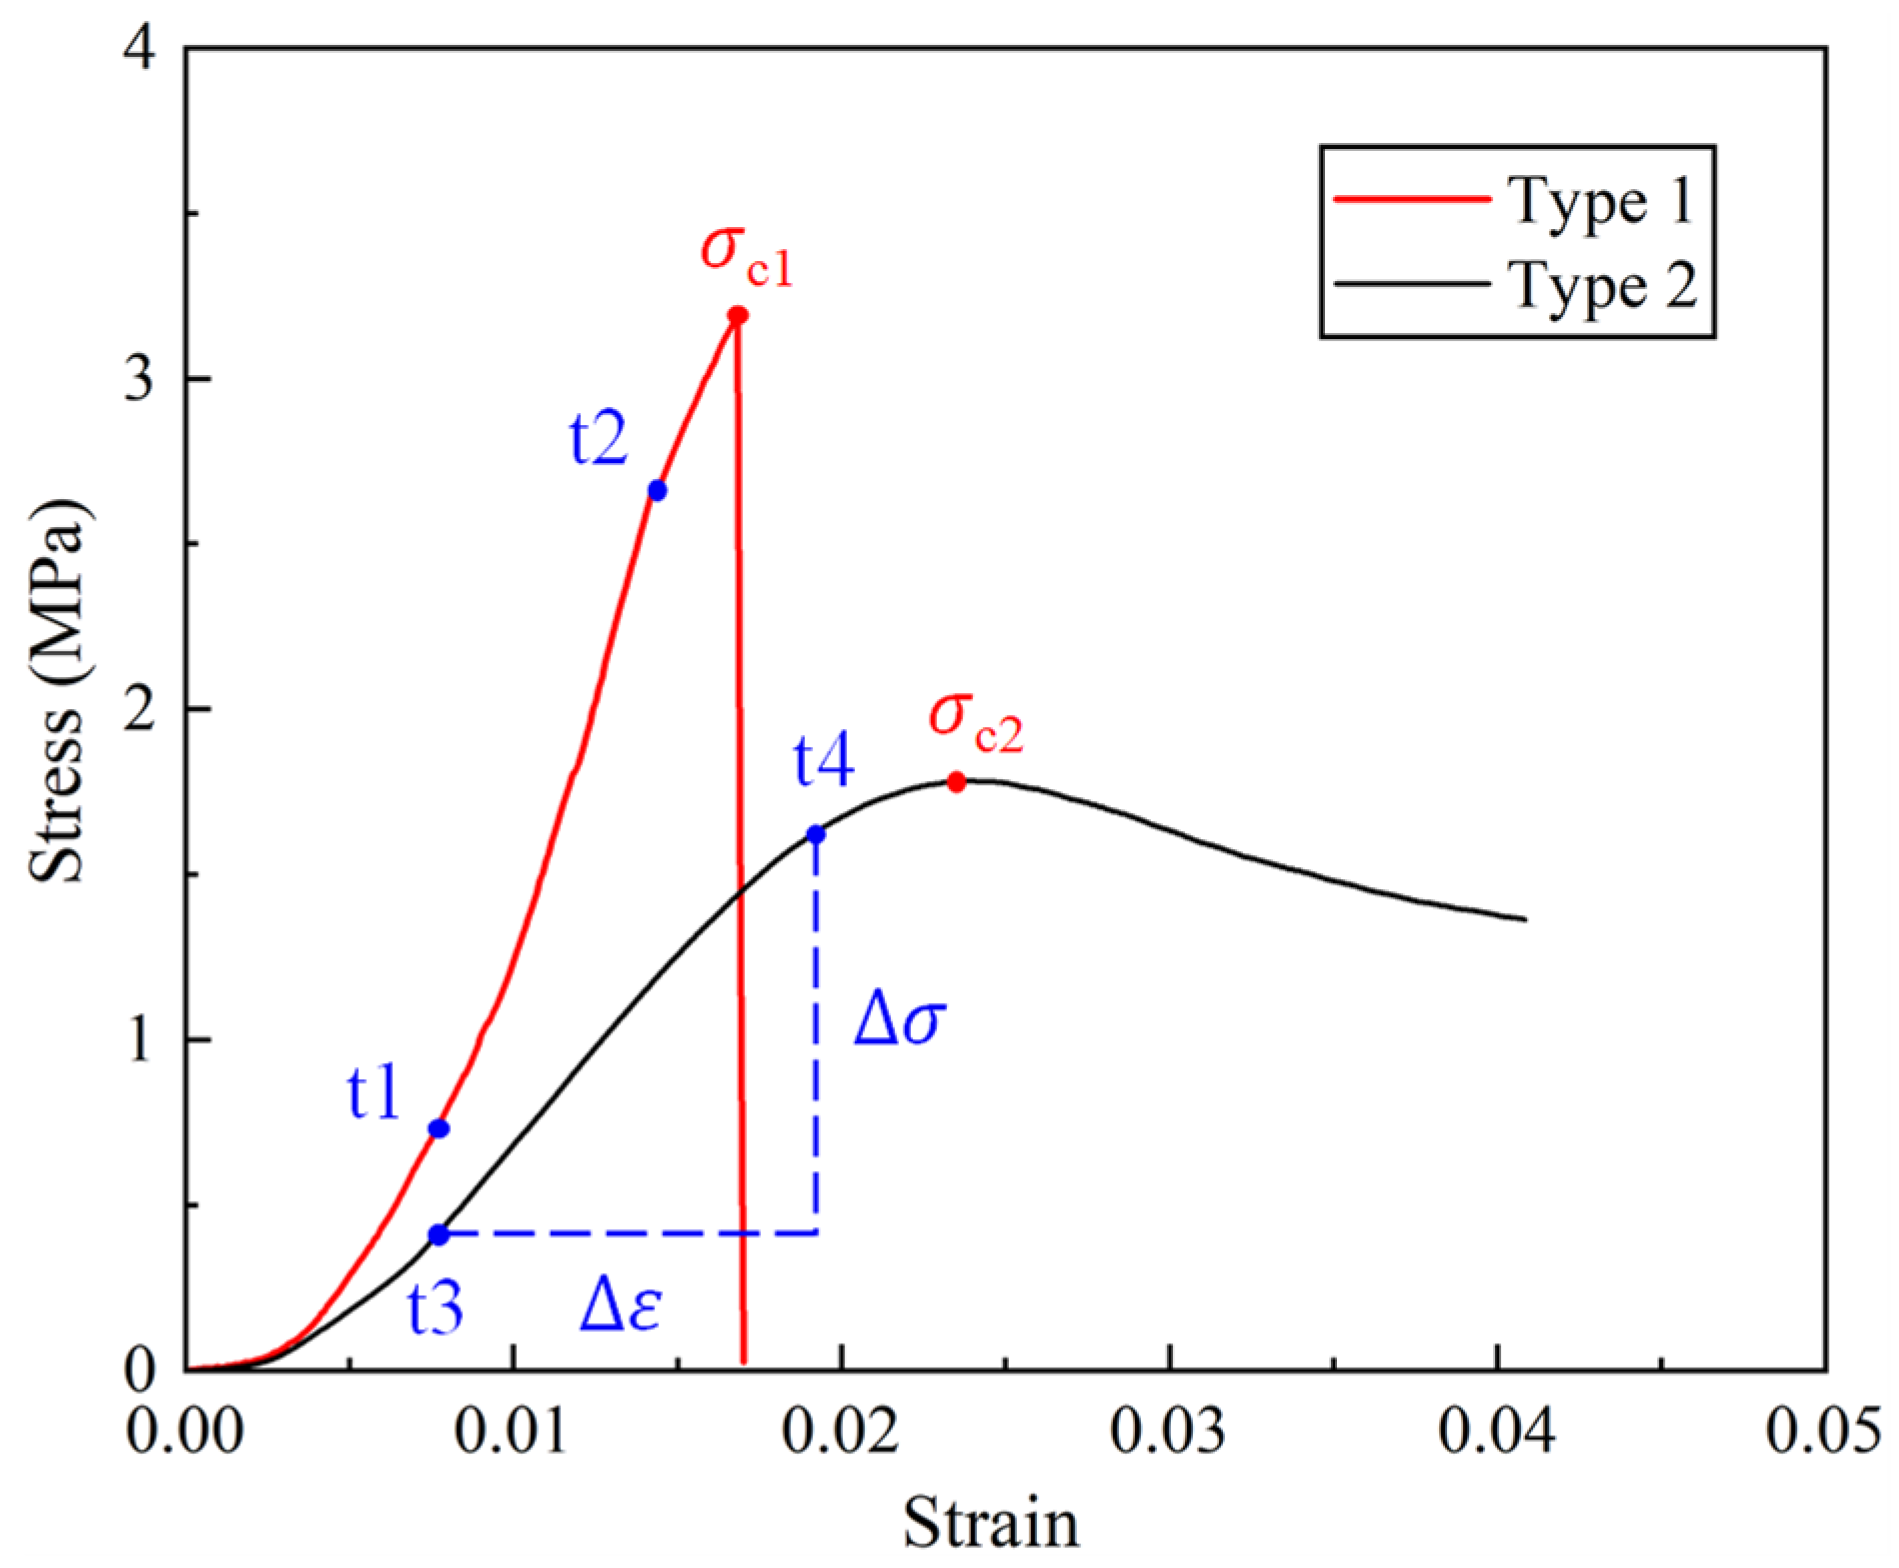
Each sea ice specimen subjected to uniaxial compression produced a full stress–strain curve. These curves varied significantly with the strain rate, reflecting the distinct mechanical behavior of sea ice [
33]. The shape of the stress–strain curve indicated whether failure occurs in a brittle or ductile manner.
Figure 3 shows two typical types of stress–strain curves of sea ice, where type 1 represents brittle failure and type 2 represents ductile failure. Under compression, sea ice exhibited increasing stress with deformation until reaching a peak stress
σc, beyond which yielding or failure occurred. The uniaxial compressive strength
σc was defined as the maximum load divided by the specimen’s initial cross-sectional area. The uniaxial compressive elastic modulus
Ec was determined from the slope of the linear loading portion of the curve and characterized the material’s resistance to axial deformation. It should be noted that this modulus differs from the flexural modulus commonly used in bending tests. For example, in
Figure 3, the type 2 curve is used to illustrate parameter extraction; the red point represents
σc, while
Ec is calculated from the stress and strain increment between
t3 and
t4. The type 1 curve is the same. It is worth noting that when the curve has multiple peaks,
Ec should be obtained from the steepest linear segment prior to the failure point. The strain rate (
) was defined as the speed of the loading plate of the test machine divided by the specimen length.
3. Results
3.1. Crystal Structure
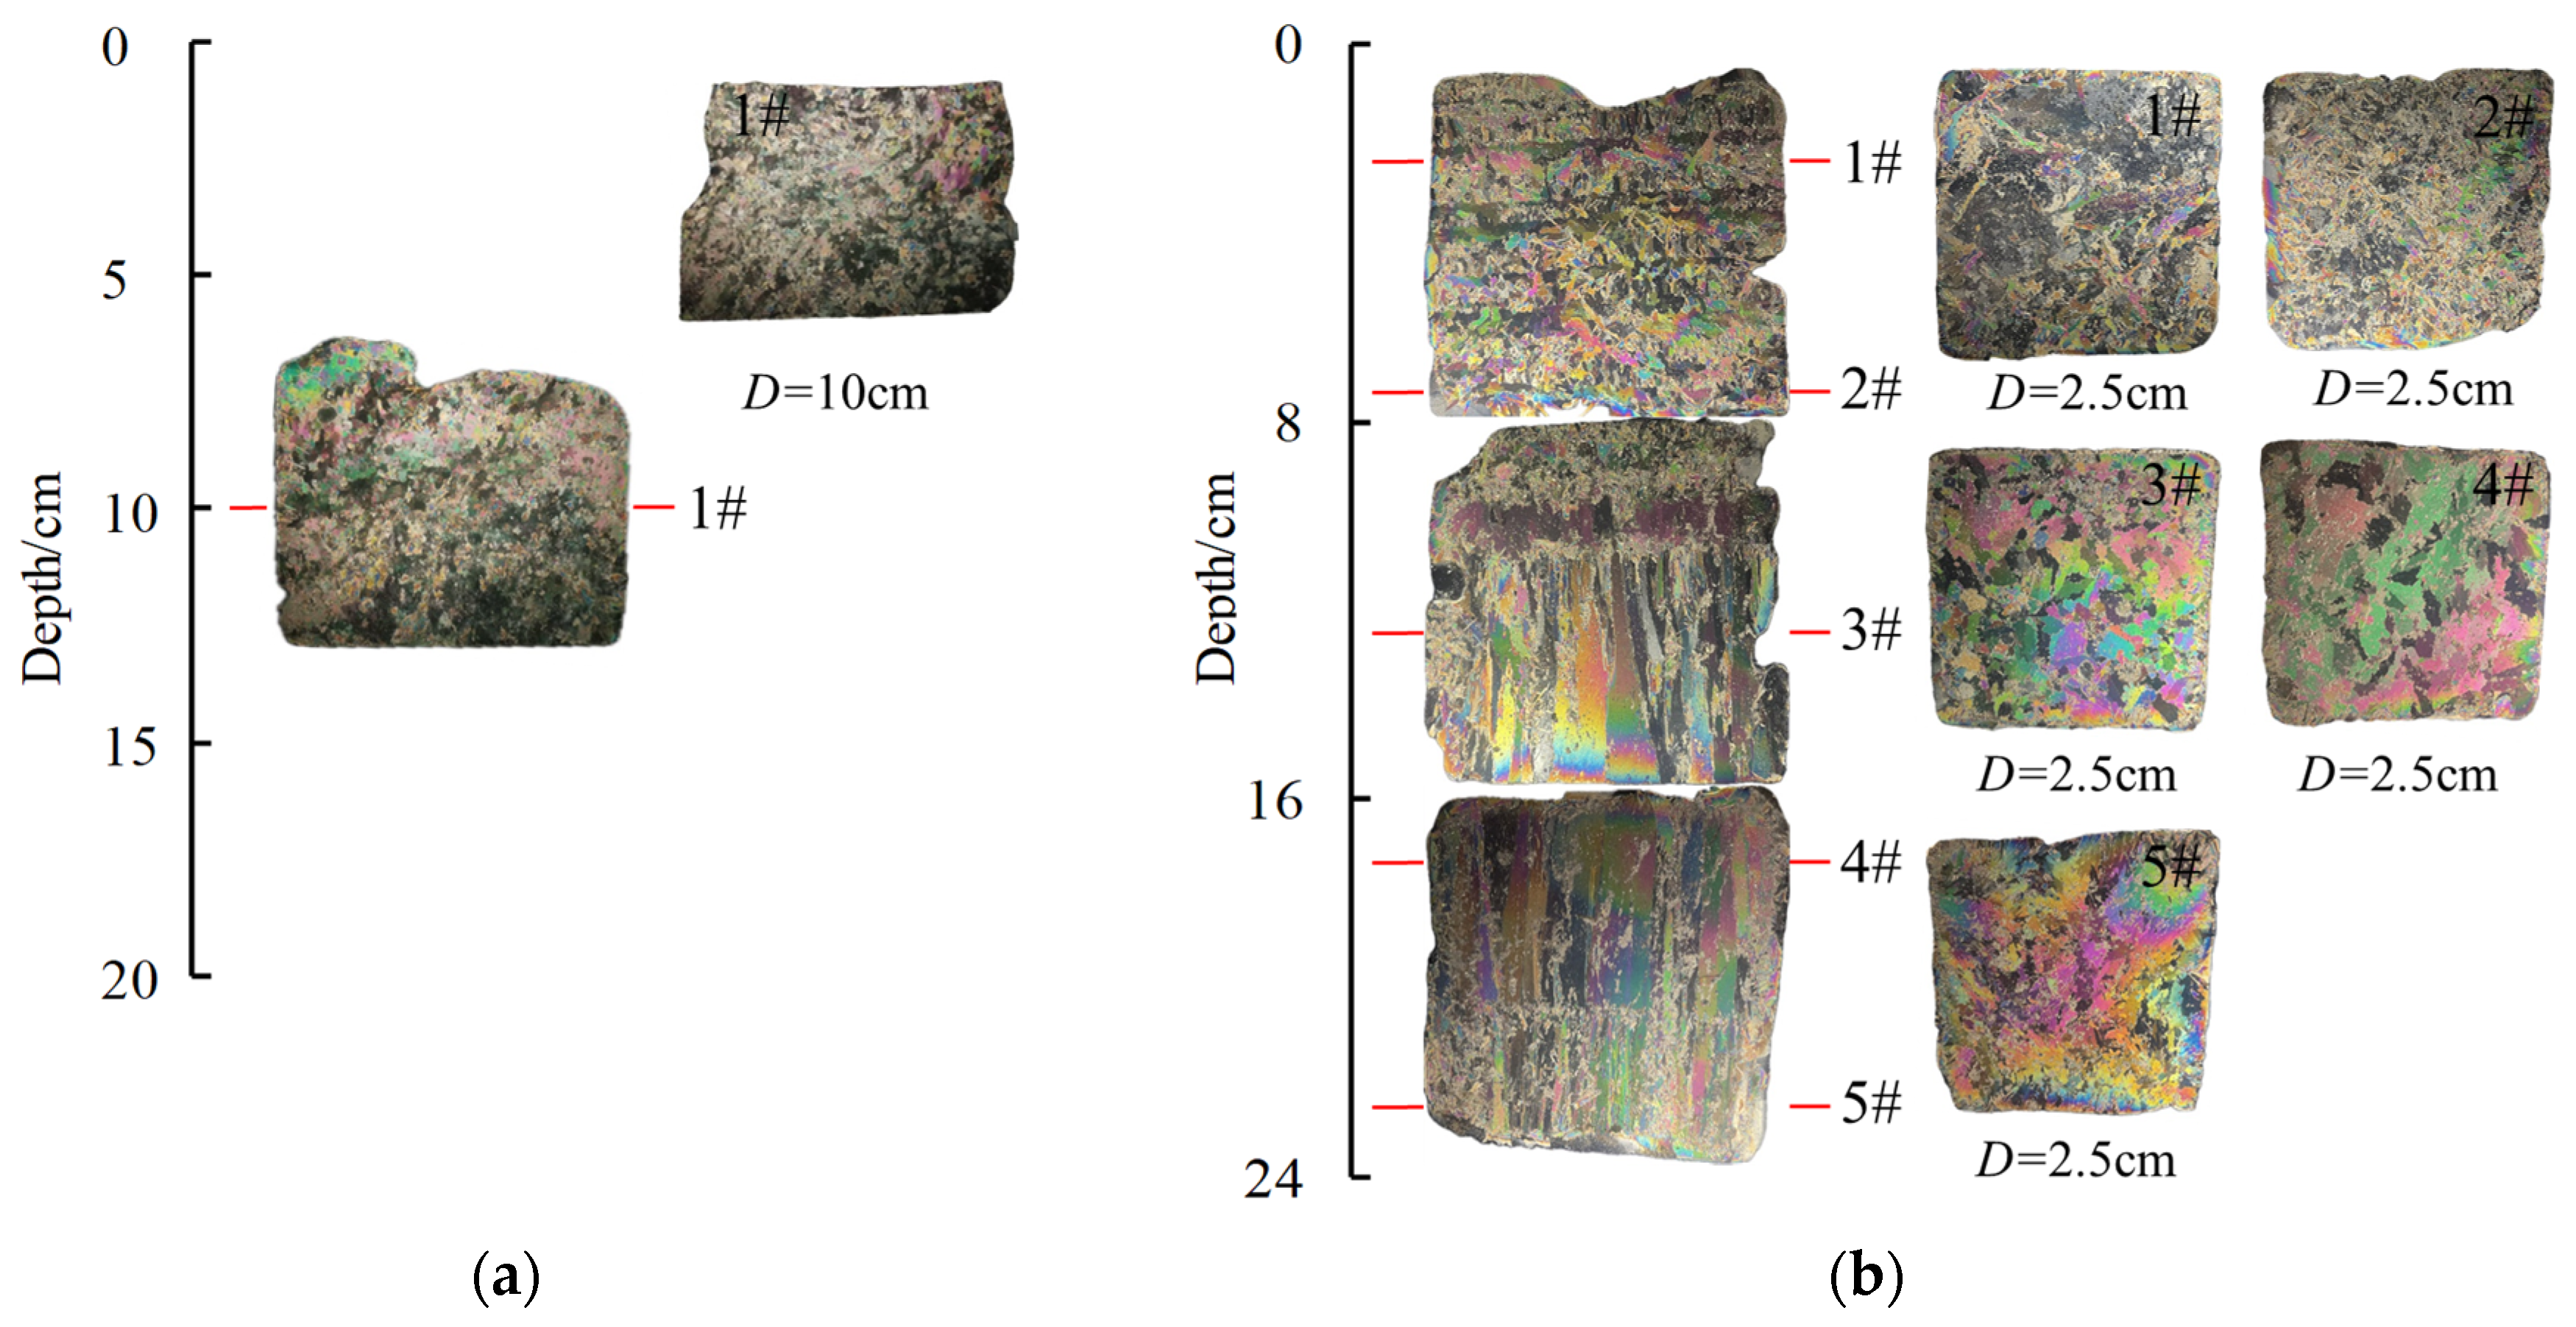
Figure 4 shows the crystal structures of sea ice from both sampling sites. According to Eicken’s classification scheme [
34], over 80% of the mid-section structure at Site S1 consisted of polygonal granular crystals, indicating the presence of granular ice. This suggested prolonged frazil ice presence during formation and possible exposure to sustained turbulence in the early growth stage [
35]. The irregular crystal boundaries and random orientations further confirmed that dynamic forces likely played a dominant role in the accretion process. The microstructure lacked clear vertical alignment, with individual grains displaying varying aspect ratios and sizes, supporting the inference of mechanical disruption and repeated freeze–thaw cycles. In the Site S2 sample, the upper 0–110 mm consisted of granular ice, and the lower section comprised vertically aligned columnar crystals. This stratification indicated a transition from an initial dynamic growth phase to a subsequent thermodynamic regime, characterized by a steady vertical heat flux. The granular-to-columnar transition zone was gradual, with no visible discontinuities or refrozen interfaces, suggesting uninterrupted in situ growth. The absence of embedded brine channels or sediment inclusions further supported the thermodynamic stability of the level ice formation process.
3.2. Physical Properties of Ice Samples
Across all tested samples, piled ice had a mean density of 0.73 ± 0.06 g·cm
−3 and a mean salinity of 2.7 ± 1‰. Level ice had a mean density of 0.72 ± 0.03 g·cm
−3 and a salinity of 2.0 ± 0.7‰. Based on these values, the corresponding mean brine volume fractions were 1.87 ± 1.24‰ for piled ice and 2.34 ± 1.79‰ for level ice. The mean air volume fractions were 20.39 ± 6.57‰ and 22.21 ± 2.74‰, and the mean porosity was 22.26 ± 6.33‰ and 24.55 ± 2.55‰, respectively. To clearly present these differences, a summary table of the overall physical properties of all tested samples is provided in
Table 1.
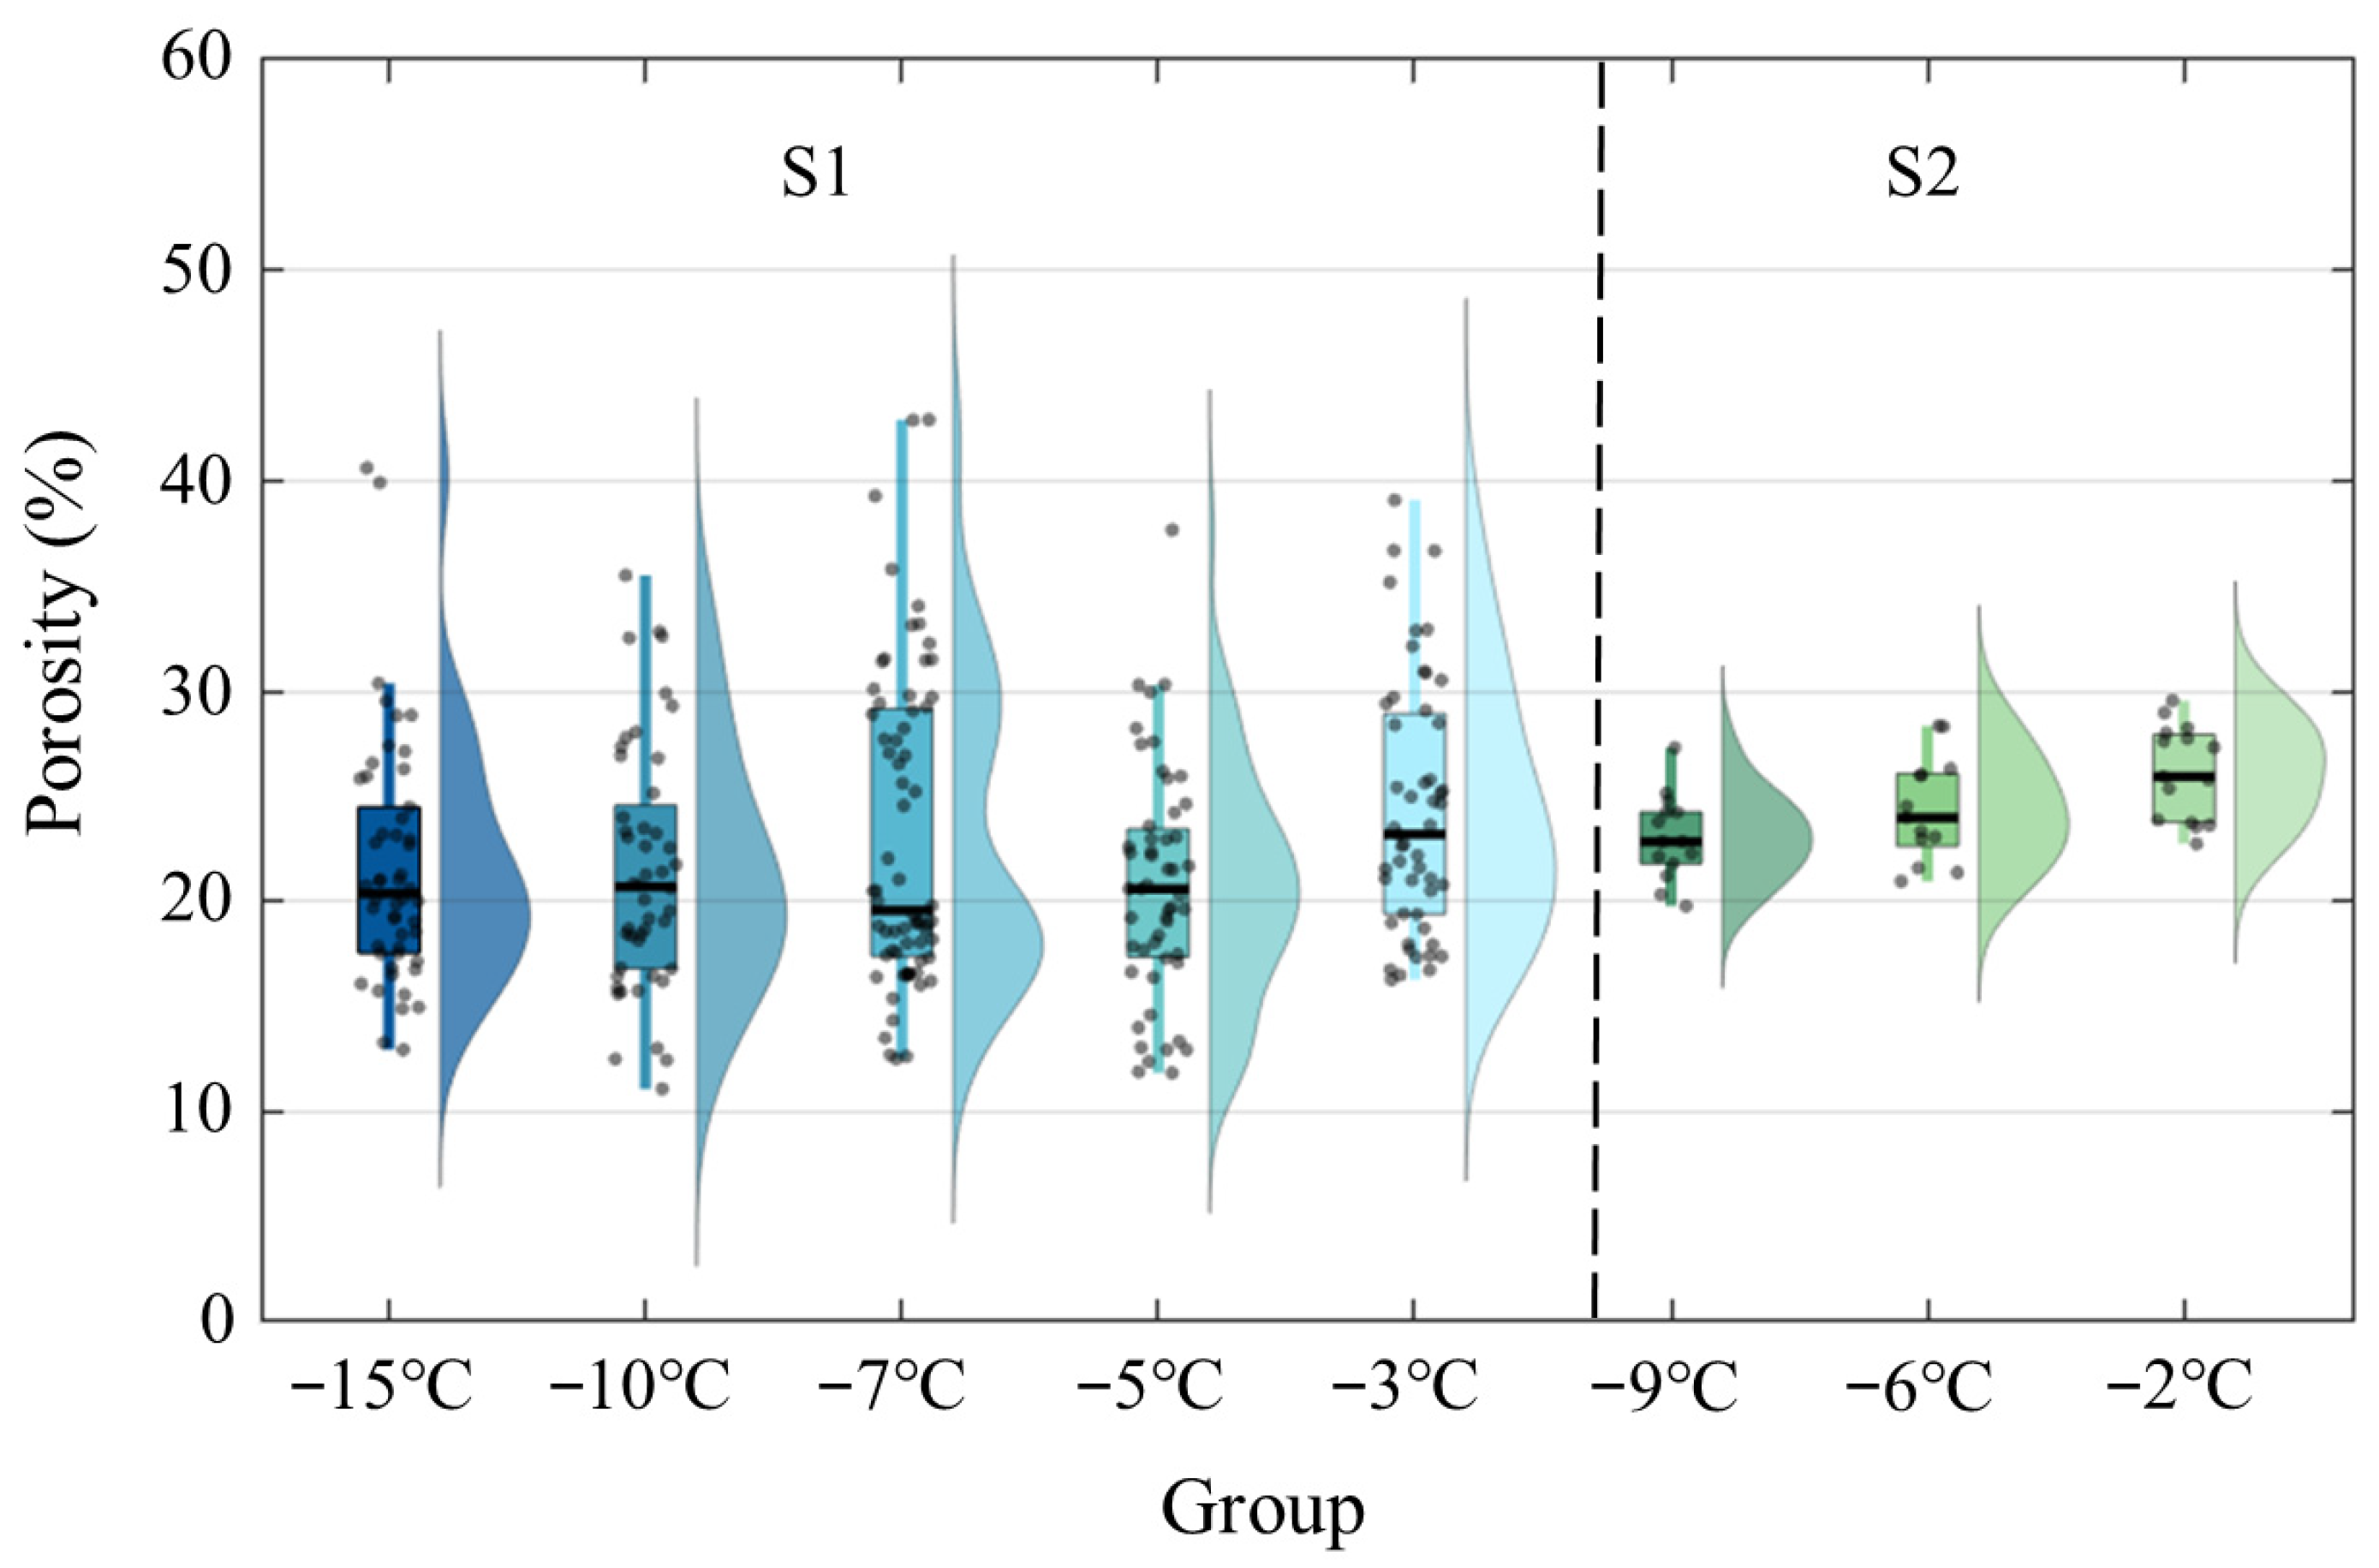
To address the limitations of temperature-based analysis, this study used porosity as a more comprehensive grouping parameter. The porosity data for all uniaxial compression specimens are shown in
Figure 5. Each group in the figure combines a violin plot with an embedded box plot to visualize the distribution of porosity values. The gray dots represent individual sample measurements, showing the raw data spread. The box plot summarizes the central tendency and variability of the data; the horizontal black line indicates the median, the box edges represent the interquartile range (from 25th to 75th percentiles), and the whiskers extend to capture the data within 1.5 times the interquartile range. The violin shape illustrates the kernel density estimate. For piled ice, the porosity ranged from 5.49% to 42.89%, with no consistent trend as temperature decreased. The intra-group variability was significant. In contrast, level ice showed a narrower range of porosity values (from 24.81% to 29.54%) and a clearer decreasing trend with temperature, along with less within-group variability. These findings highlight the structural complexity of pore networks in sea ice and emphasize the need to consider multiple physical parameters when assessing its mechanical behavior.
3.3. Failure Modes
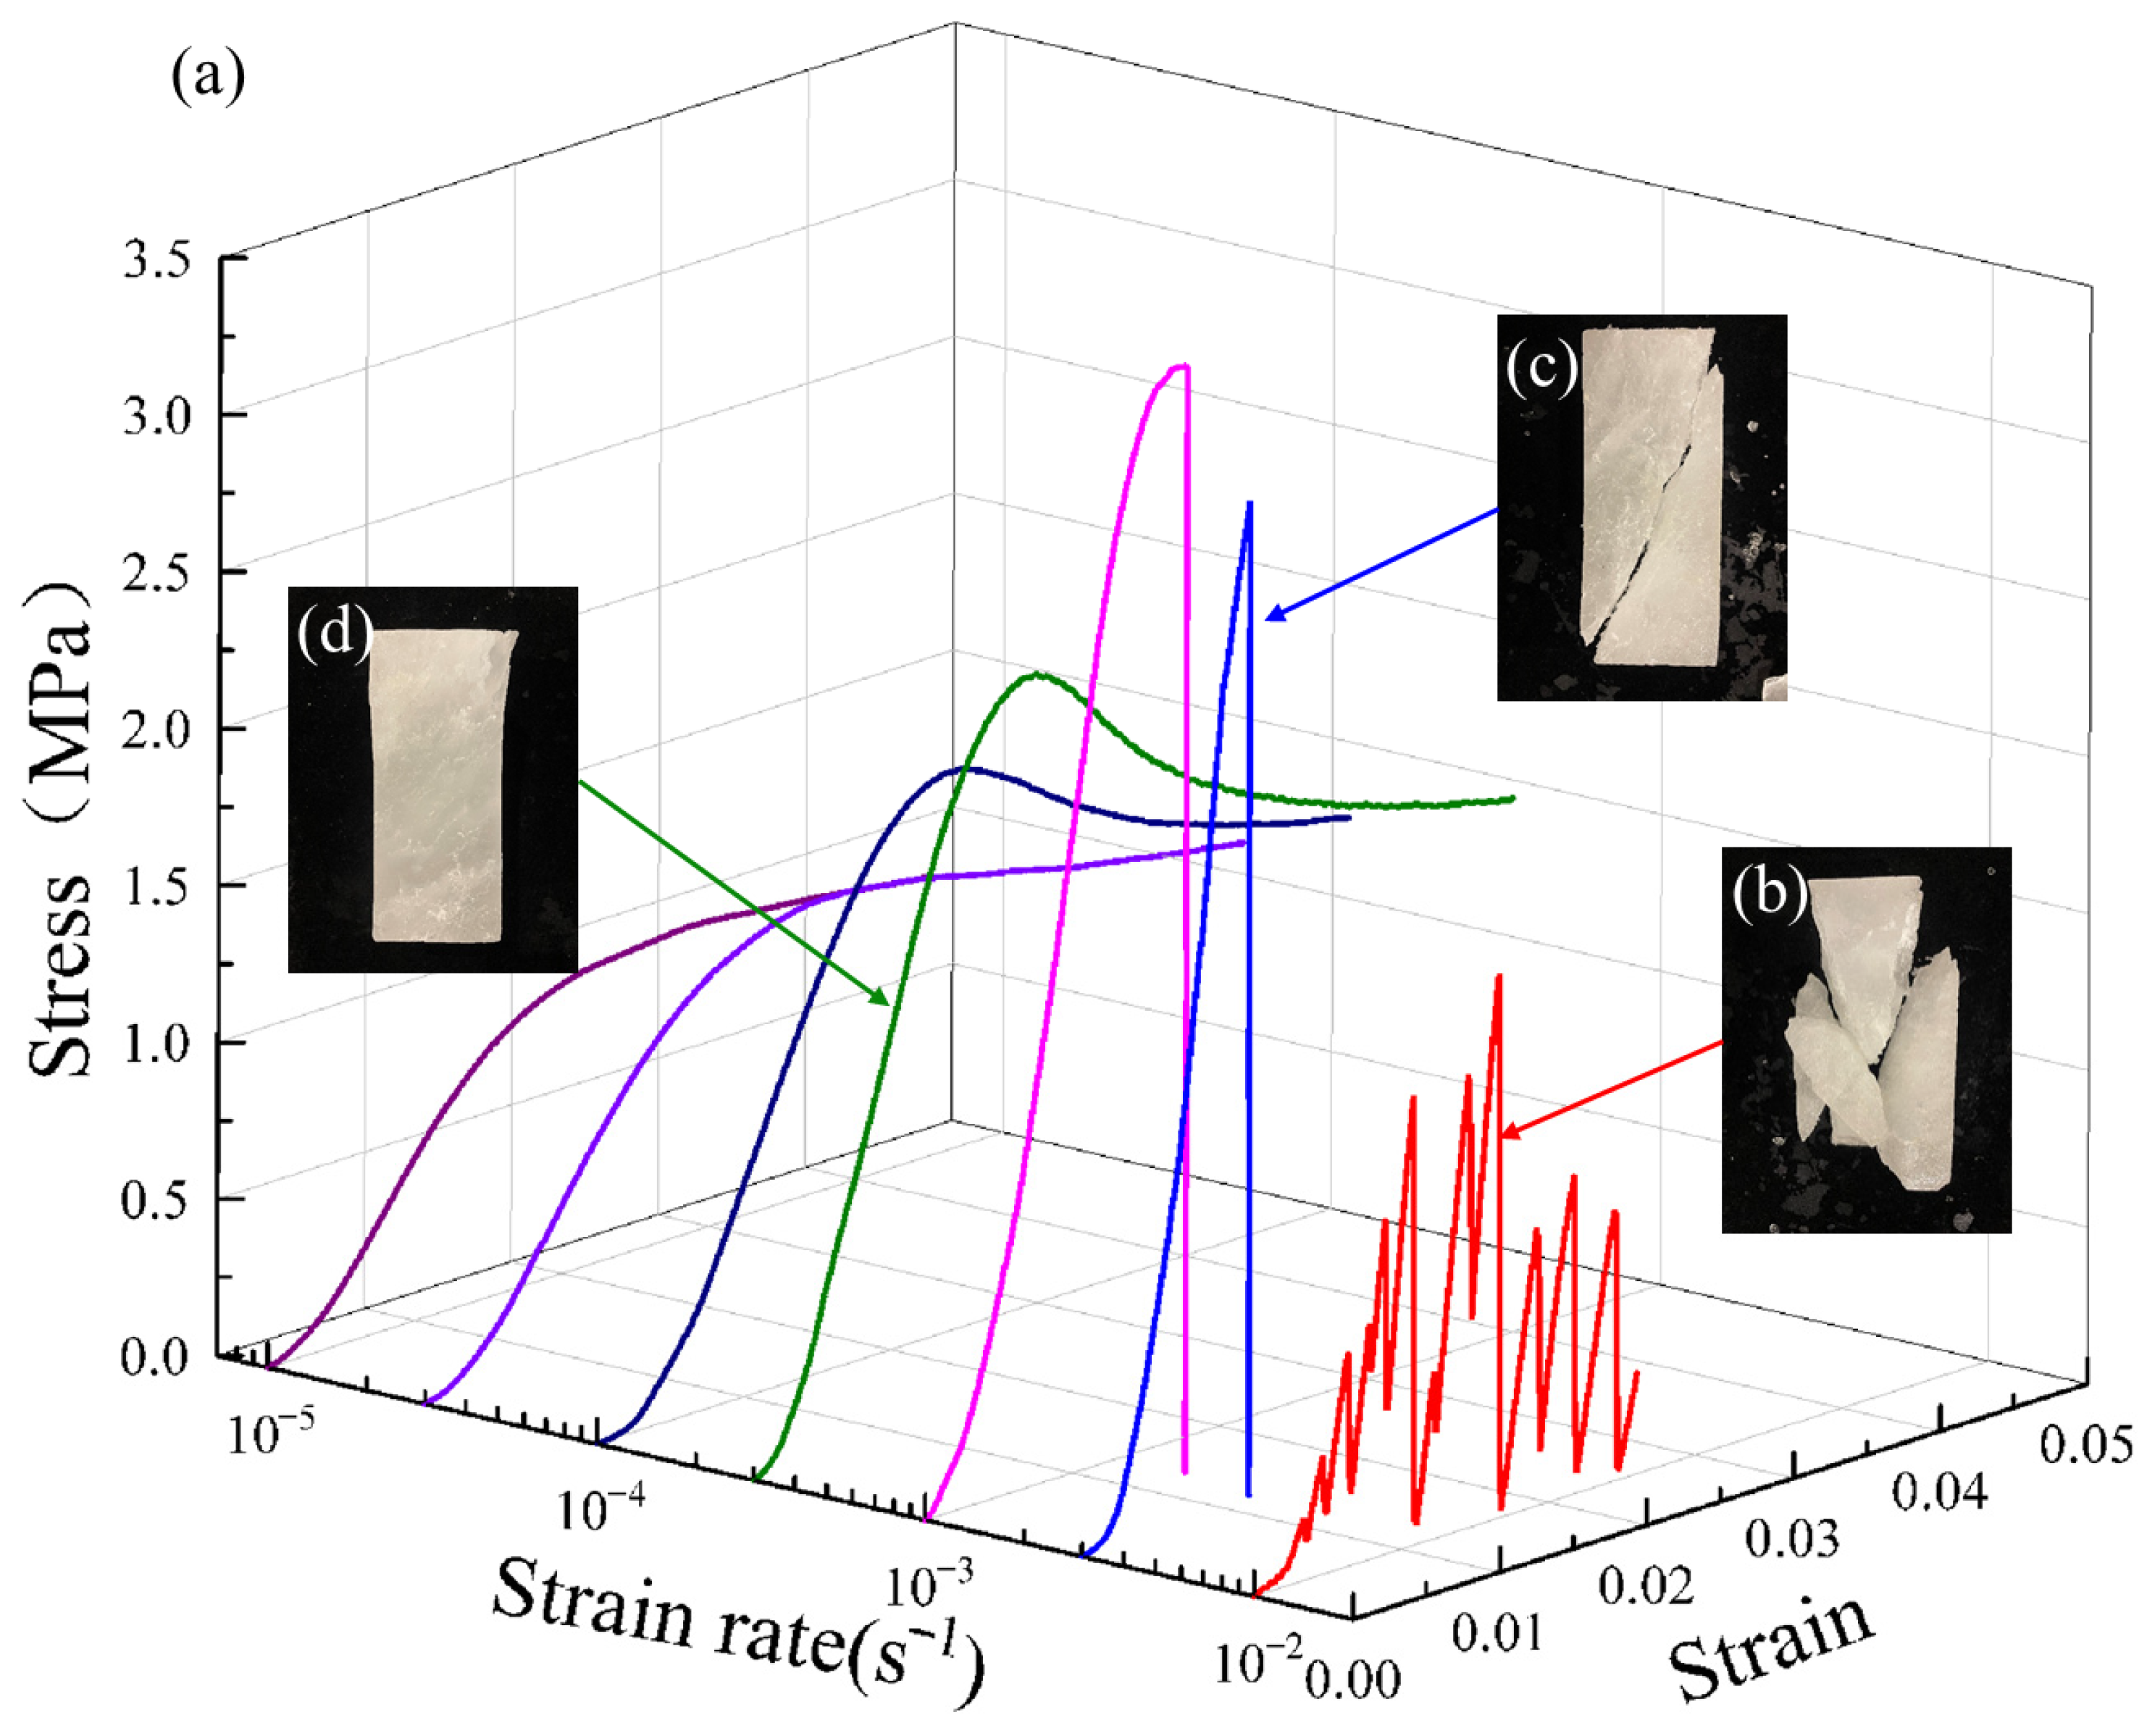
Since no significant differences were observed in the stress–strain responses and failure modes, this section focuses on representative results from piled ice specimens to illustrate their mechanical behavior under uniaxial compression.
These stress–strain curves demonstrate two main failure types: brittle and ductile. Brittle failure can be further classified into multi-peak failure and single-peak failure modes. At higher strain rates, limited dislocation slip between ice crystals led to sudden stress drops after reaching
σc, resulting in cliff-like curves. As shown in
Figure 6b (corresponding to the 10
−2 s
−1 case in
Figure 6a), cracking initiated near the specimen edges where confinement was lowest. The propagations were at large angles to the loading axis [
26]. These cracks extended diagonally toward the midsection. After the first fracture event, the specimen could still carry load, but, with further deformation, additional macroscopic cracks developed, leading to progressive fragmentation until structural integrity was lost. This repetitive stepwise failure process was categorized as multi-peak failure. At a lower strain rate of 3 × 10
−3 s
−1, the initial crack angle was reduced. Continued loading caused the crack to fully propagate vertically, splitting the sample into two parts. This complete failure process without secondary cracking was classified as single-peak failure (
Figure 6c).
At lower strain rates, intergranular slip became more active, which allowed for plastic deformation. The stress–strain curve exhibited a gradual post-peak decline with a smoother overall shape. The specimens showed modest axial shortening without major cracking. As seen in
Figure 6d (3 × 10
−4 s
−1), small internal cracks could initiate, but did not propagate, as local stress concentrations were relaxed via creep mechanisms. The specimen remained intact and failed in a ductile manner.
3.4. Effect of Strain Rate
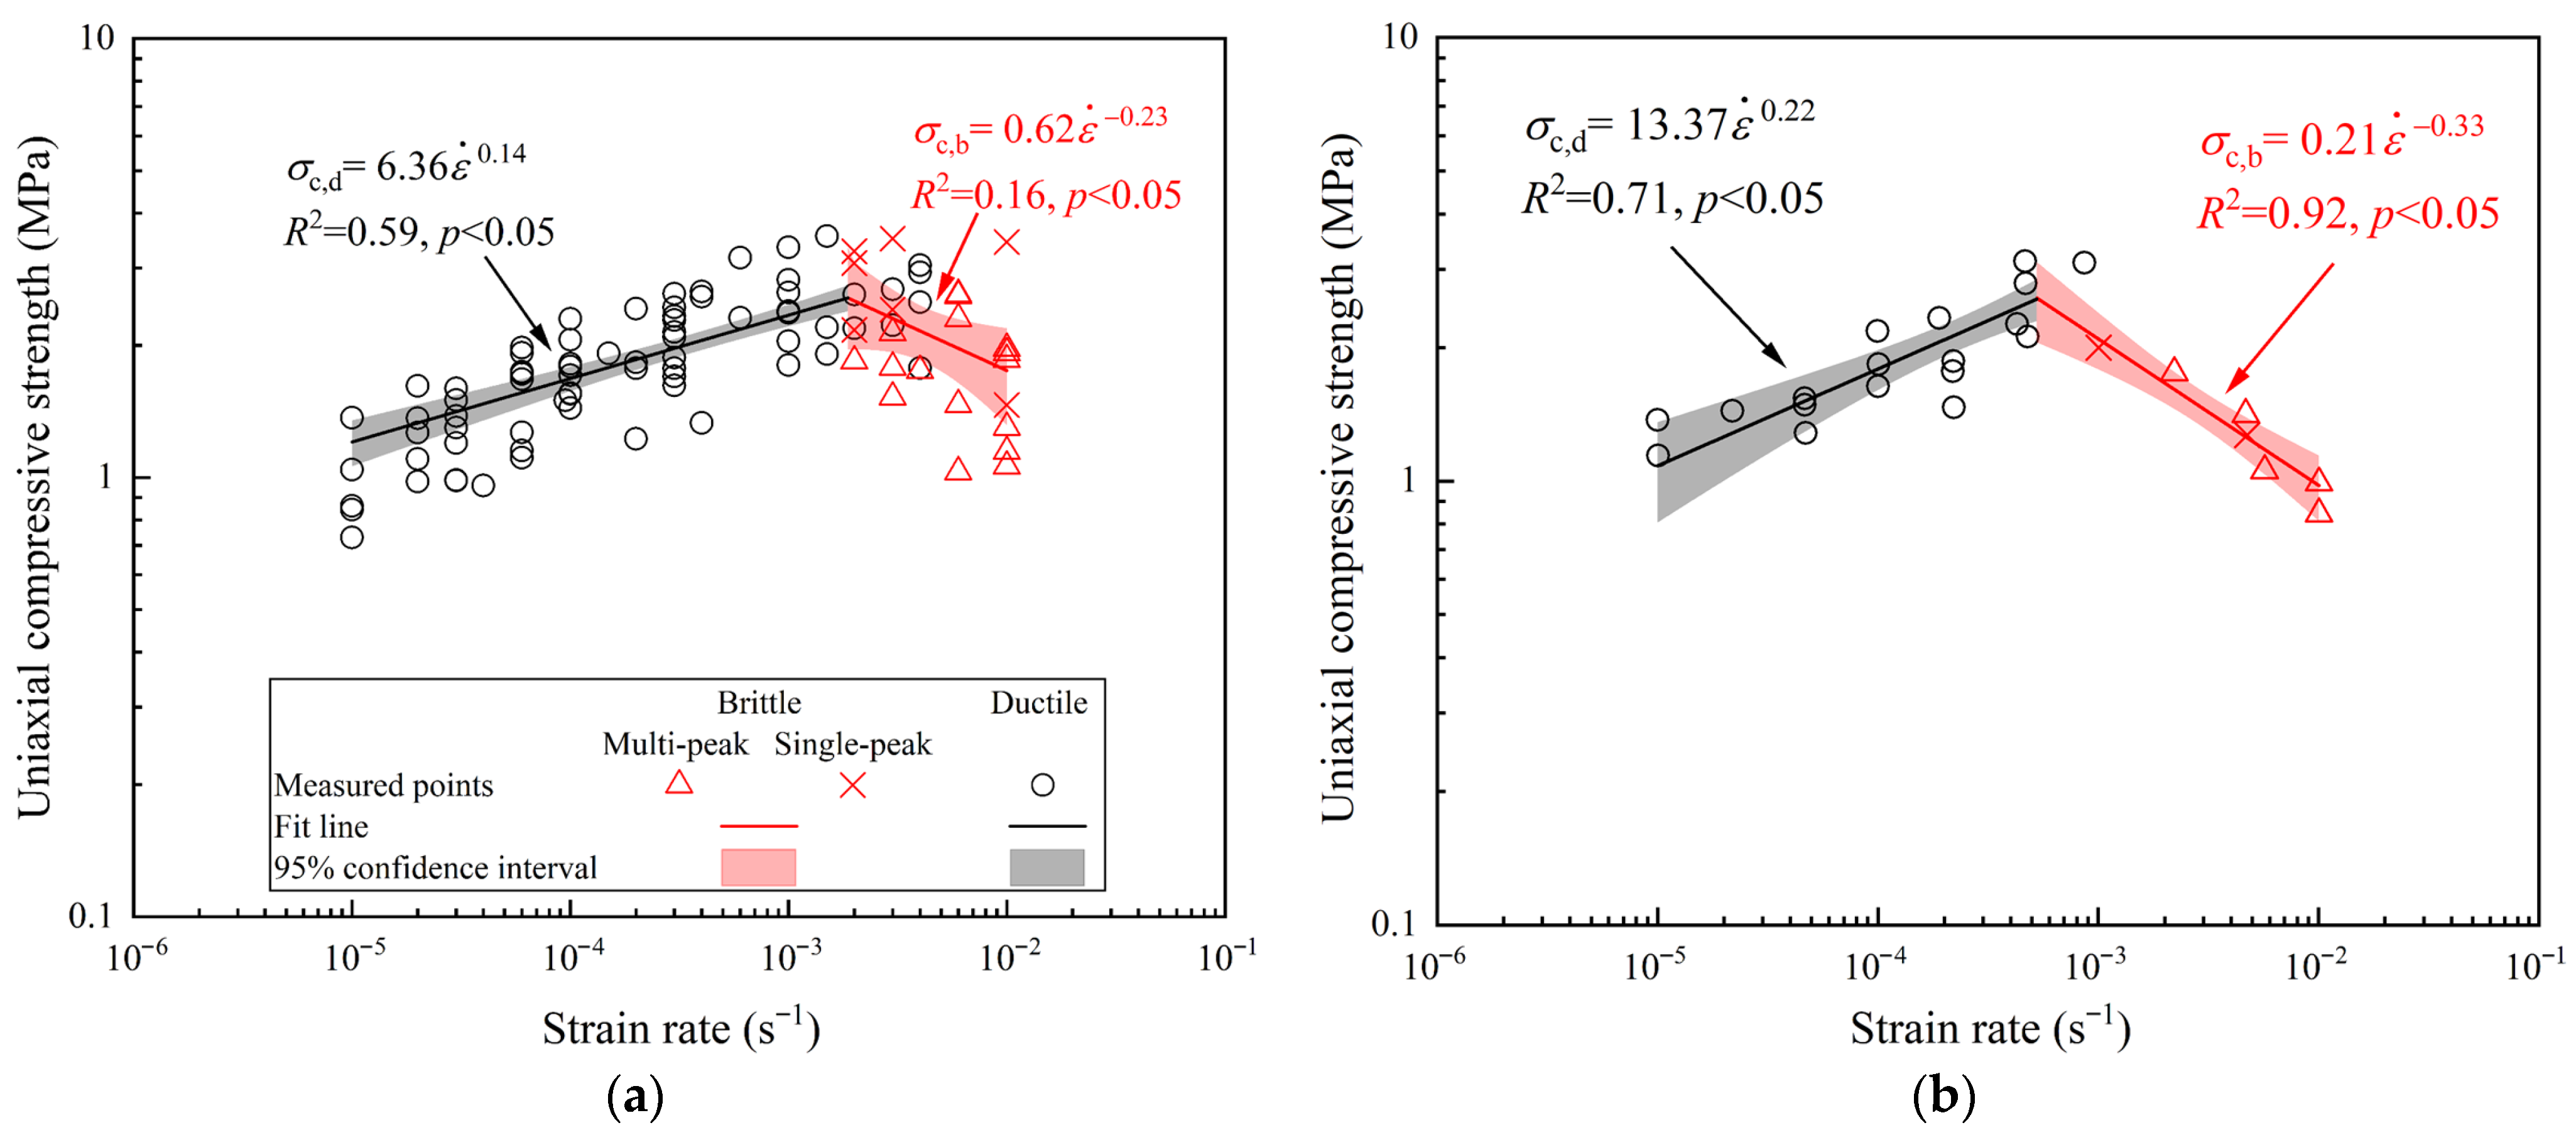
To evaluate the effect of the strain rate on the uniaxial compressive strength, mechanical test data were grouped by predefined porosity intervals. For each group, the failure mode was determined from the stress–strain curve morphology; a sudden post-peak stress drop indicated brittle failure, while a gradual decline was classified as ductile. Based on this distinction, the data were divided into ductile and brittle regimes, and strength–strain rate relationships were fitted using power-law expressions for each regime.
The compressive strength
σc was expressed as a function of the strain rate
using the following power-law form:
where
a and
b are empirical fitting coefficients. Separate parameters were determined for the ductile (
ad,
bd) and brittle (
ab,
bb) regimes. The strain rate at which the two curves intersected was defined as the ductile-to-brittle transition point
. The corresponding peak strength was calculated by evaluating the ductile fit at this transition point.
Figure 7 presents representative results for two porosity intervals: 15–20% for piled ice and 20–25% for level ice. In the piled ice samples, the ductile regime corresponded to strain rates below 1.65 × 10
−3 s
−1, where the strength increased with the strain rate and all specimens exhibited ductile behavior. Above this threshold, the brittle regime was characterized by decreasing strength with increasing strain rate. The failure mode transitioned from a mix of single-peak and multi-peak types to predominantly multi-peak failure. The peak compressive strength occurred near the transition point. Similar behavior was observed in level ice, although the brittle regime extended to lower strain rates, with a transition occurring at 3.98 × 10
−4 s
−1. This indicated a higher brittleness sensitivity in level ice compared to piled ice under similar porosity conditions.
To further investigate the effect of porosity, additional intervals were analyzed. The corresponding fitting parameters, transition strain rates, and peak strengths for both ice types are summarized in
Table 2. In piled ice samples, the transition strain rate initially increased with porosity from 3.83 × 10
−4 s
−1 (10–15%) to 1.65 × 10
−3 s
−1 (15–20%) and then gradually decreased at higher porosity. Meanwhile, the peak strength consistently declined from 2.26 MPa to 1.19 MPa across the porosity range. The level ice samples showed a similar strength degradation with porosity, although the peak values remained slightly higher than those of piled ice. The transition strain rate also decreased, indicating greater brittleness at lower porosity thresholds.
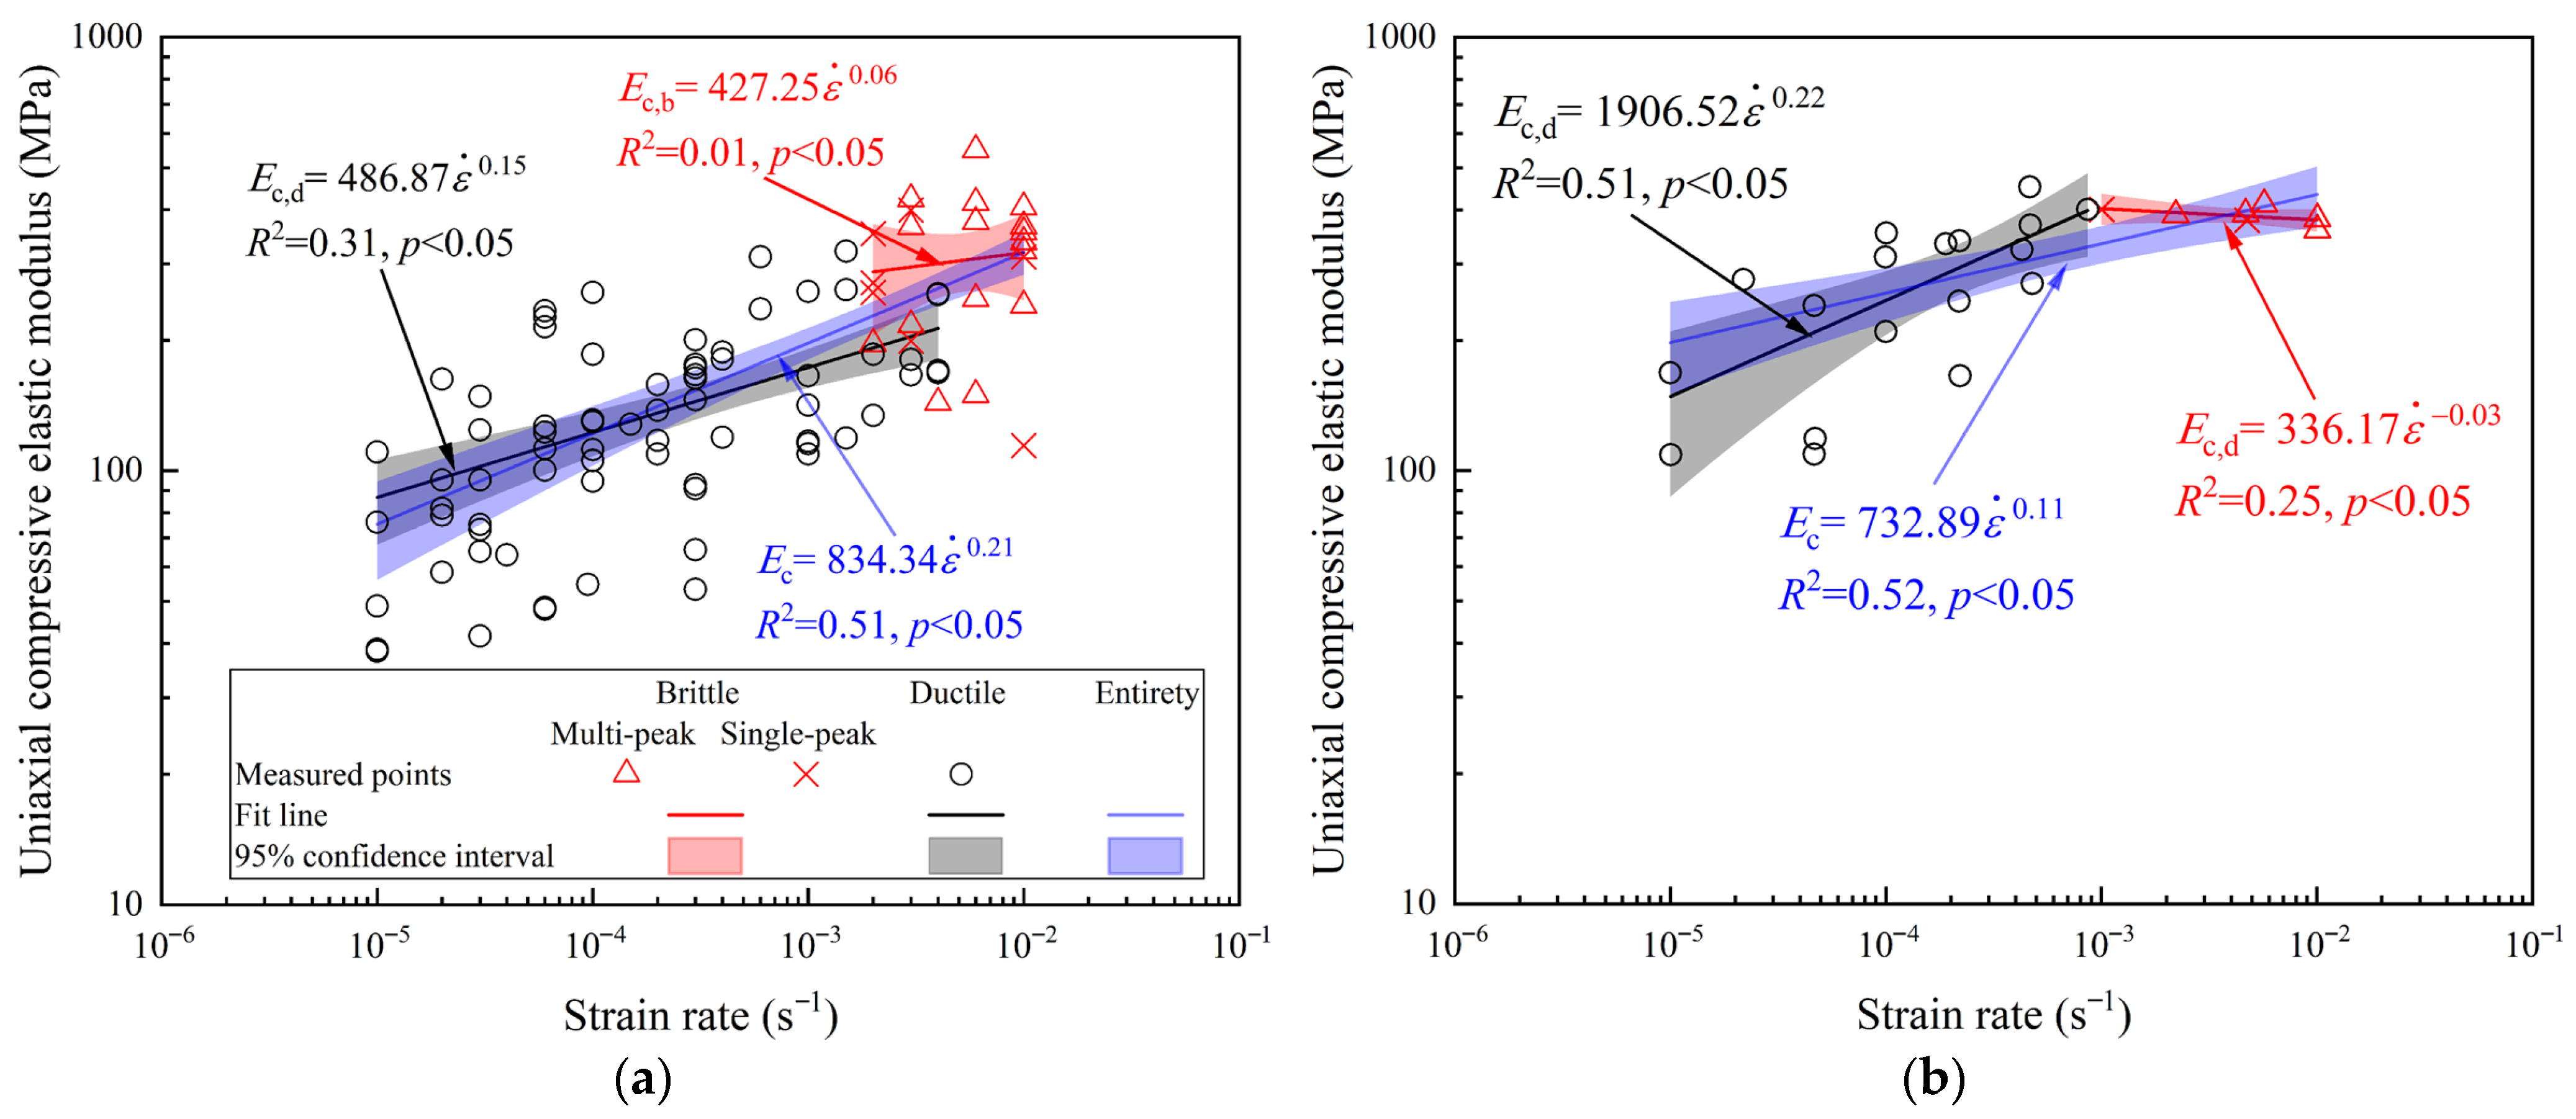
The uniaxial compressive elastic modulus data were analyzed using the same grouping approach used for compressive strength, as shown in
Figure 8. Unlike the well-established relationship between the strain rate and strength, the dependence of the uniaxial compressive elastic modulus on the strain rate is less commonly studied in sea ice mechanics, and no standardized model has been widely adopted.
In
Figure 8a (piled ice), a positive correlation was observed in the ductile regime, with the modulus increasing with the strain rate. A weak upward trend continued into the brittle regime, although the rate sensitivity was noticeably reduced. Conversely,
Figure 8b (level ice) shows a strong modulus increase in the ductile regime, but a slight decline in the brittle regime. These observations suggest that the strain-rate dependence of stiffness was sensitive to both porosity and structure. Since the modulus characterizes material stiffness prior to failure, it is independent of the fracture mode and can be treated across the full strain rate range. Accordingly, a single power-law function was proposed:
where
Ec is the uniaxial compressive elastic modulus (MPa) and
c and
d are the empirical fitting parameters. Compared with separate fits within the ductile and brittle regimes, the unified power-law fit showed stronger overall correlation, suggesting that elastic stiffness is more consistently described across a continuous loading spectrum. Notably, the correlation coefficients in
Figure 8 confirm that the full-range power-law fit yields higher determination values (
R2 = 0.51 for piled ice and
R2 = 0.52 for level ice) than fits performed within individual ductile or brittle regimes. This supports the conclusion that the rate dependence of the modulus in granular sea ice was more effectively captured using an integrated, regime-independent approach.
The fitting results for each porosity group are summarized in
Table 2. For the piled ice samples, the fitted exponent
d ranged from 0.20 to 0.24, indicating a moderately positive strain-rate sensitivity. The modulus prefactor
c decreased from 1023.10 (10–15% porosity) to 455.02 (30–45% porosity), reflecting the expected reduction in stiffness with increasing porosity. Similarly, the level ice samples showed lower prefactors
c with increasing porosity (from 835.92 to 622.89), while the strain-rate exponent
d ranged from 0.14 to 0.12, suggesting slightly weaker sensitivity compared to piled ice.
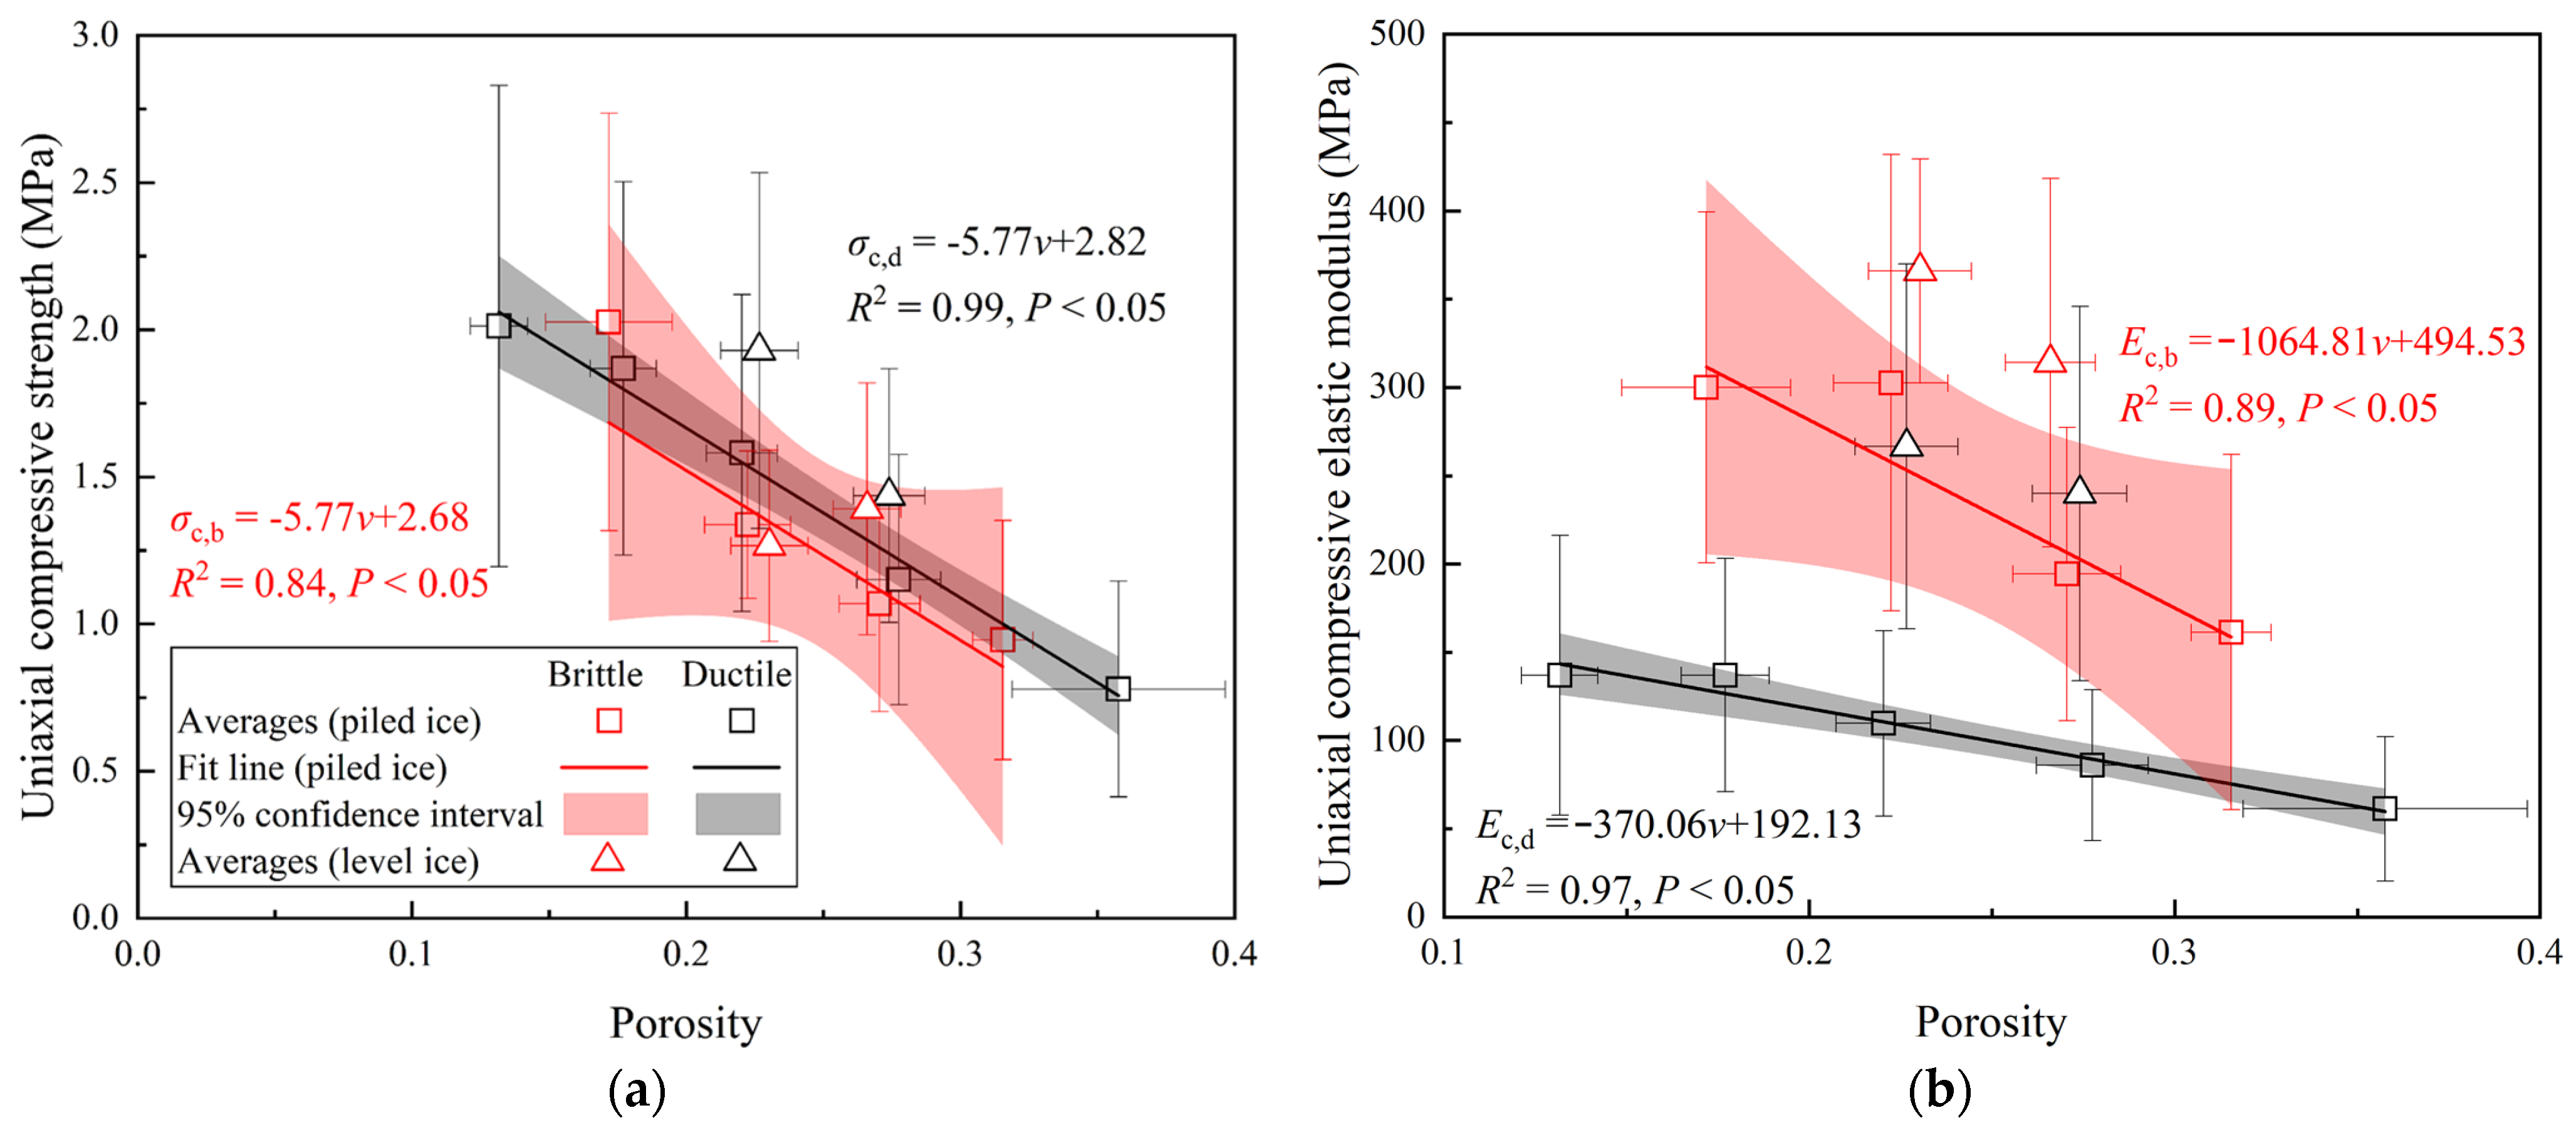
3.5. Effect of Porosity
Porosity is a key parameter influencing the uniaxial compressive properties of sea ice. In this study, the piled ice samples had porosity ranging from 11.1% to 42.9%, while the level ice samples ranged from 19.8% to 29.5%.
Figure 9 shows the variation in the uniaxial compressive strength and elastic modulus as a function of porosity.
Porosity data were grouped into 5% intervals. For each interval, average values and standard deviations of the strength and modulus were calculated separately for the ductile and brittle regimes. As shown in
Figure 9a, in the ductile regime, strength decreased with increasing porosity. At comparable porosity levels, level ice consistently showed higher ductile strength than piled ice. In the brittle regime, piled ice also showed a decreasing strength trend, while level ice exhibited a slight increase. This was likely due to the limited sample size and greater variability in crack propagation during brittle failure. Across all porosity ranges, the difference between brittle and ductile strength within each ice type was small. For piled ice, linear regression showed that the strength–porosity relationship could be described using a linear model. The similar slopes between the brittle and ductile fits suggested that porosity imposed a nearly uniform weakening effect, regardless of the failure mode. No regression was performed for level ice due to its narrower porosity range. A similar analysis was conducted for the modulus–porosity relationship (
Figure 9b). Both ice types showed a clear decrease in the modulus with increasing porosity across both regimes. As shown in
Section 3.4, the modulus was higher in the brittle regime than in the ductile regime. At equivalent porosity levels, level ice samples consistently showed higher modulus values than piled ice.
This difference was attributed to microstructural features arising from contrasting formation histories. Piled ice formed through repeated cycles of mechanical disruption, aggregation, and refreezing. These processes resulted in heterogeneous microstructures with irregular grain contacts, weak intergranular bonding, and unevenly distributed voids. Although the porosity may be similar to that of level ice, the quality of the load-bearing structure was diminished, increasing the likelihood of stress concentration and premature failure. In contrast, level ice formed under thermodynamically stable conditions, enabling uninterrupted vertical crystal growth and a more continuous, compact grain network. Even with similar porosity, the voids in level ice were more evenly distributed and embedded in a structurally cohesive matrix. This led to more uniform stress transmission and greater resistance to localized deformation. These differences were most evident in the modulus. At all porosity levels, the modulus of level ice exceeded that of piled ice. Moreover, while brittle samples consistently exhibited higher stiffness than ductile ones, the ratio between the brittle and ductile modulus decreased with increasing porosity, which ranged from approximately 2.42 in the 15–20% range to 2.10 in the 30–35% range. This suggests that the stiffness advantage of brittle ice became less pronounced as porosity increased and internal structural integrity decreased.
3.6. Parameterization
Previous studies have investigated the relationship between porosity and uniaxial compressive strength in the ductile regime, and recent work has extended the applicable strain rate range to include both ductile and brittle behaviors [
20,
36]. Building on earlier analyses of the effects of strain rate and porosity, a unified parametric model was developed to describe the compressive strength of granular sea ice over a wide strain rate range.
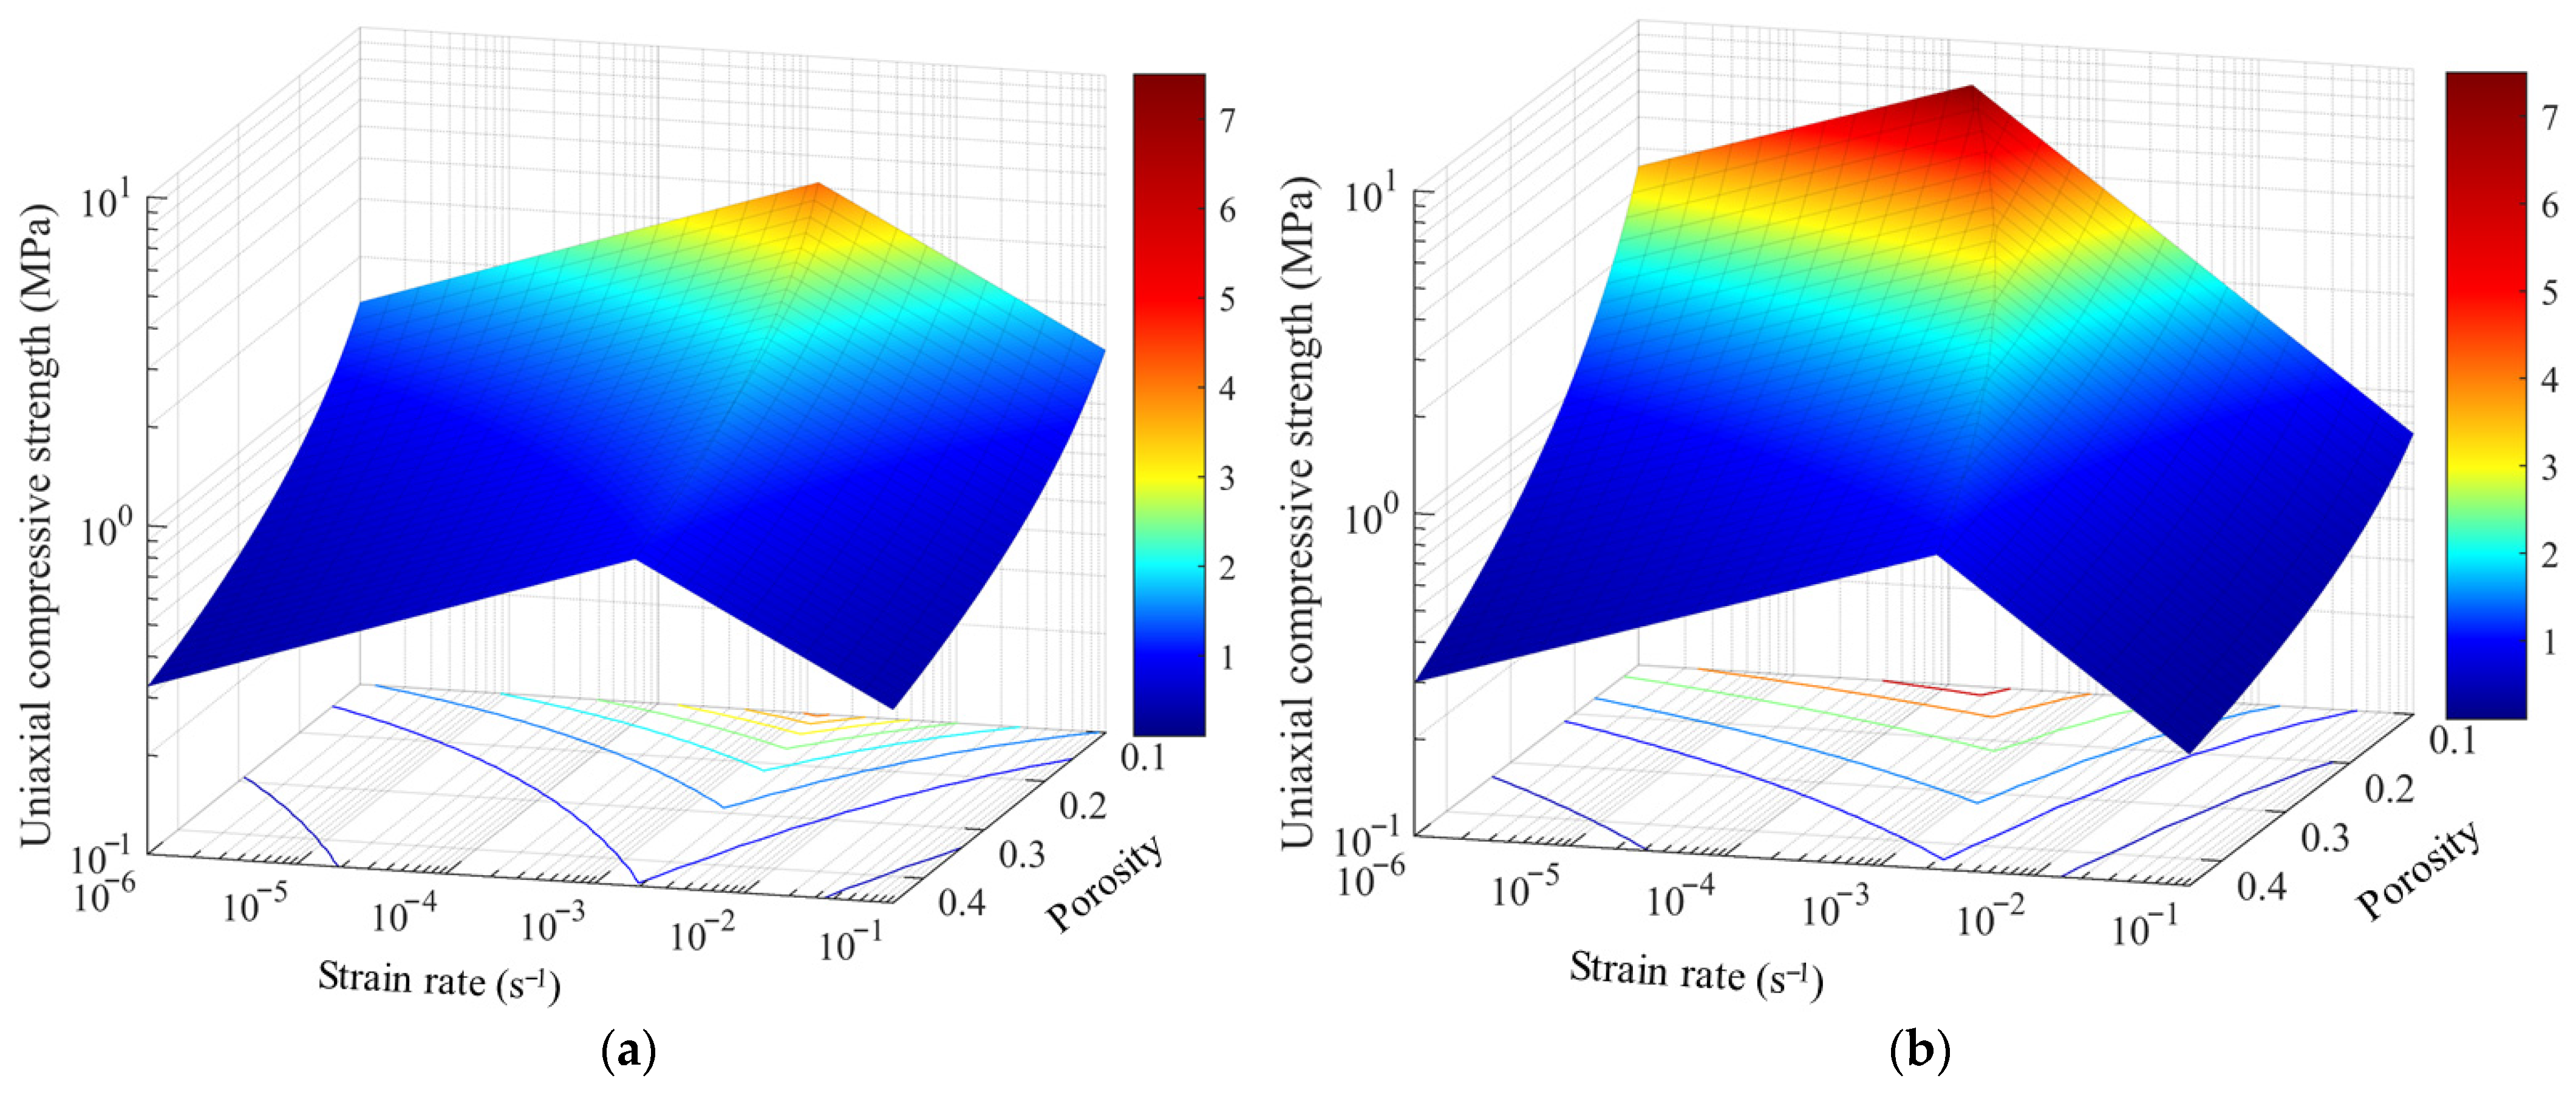
Figure 10 shows the fitted surface, and the mathematical form is defined in Equation (3):
The corresponding fitting coefficients
M,
N, and
P obtained through nonlinear surface regression are summarized in
Table 3. As shown in
Figure 10a,b, a critical strain rate
existed at each porosity level, beyond which the strength began to decline, indicating a transition from ductile to brittle failure. This transition strain rate showed a negative correlation with porosity; internal flaws, such as pores and microcracks, were reduced as the porosity decreased, and the resulting densification enhanced the stress concentration, promoting brittle failure at lower strain rates.
The strength transition behavior also differed significantly between the two ice types. In level ice, decreased significantly from 2.34 × 10⁻³ s−1 to 1.42 × 10⁻⁴ s−1 with decreasing porosity, suggesting high sensitivity to porosity. In contrast, of the piled ice varied more gradually from 1.87 × 10⁻³ s−1 to 1.19 × 10⁻³ s−1. This reduced sensitivity is hypothesized to result from the development of microcrack networks and interconnected pore structures, which are potentially induced by repeated freeze–thaw cycles and prolonged exposure to ambient air during the formation of piled ice. These microstructural features are believed to introduce additional pathways for stress redistribution and energy dissipation during rapid loading, thereby mitigating localized stress concentrations and delaying the onset of catastrophic brittle failure. However, it must be emphasized that this explanation remains speculative. The proposed mechanism is currently inferred from macroscopic mechanical behavior and environmental formation conditions, and it has not yet been corroborated by direct microstructural observations. Further targeted investigations, such as micro-CT imaging or thin-section analysis, would be required to validate this hypothesis and elucidate the underlying damage mechanisms.
A corresponding model was developed for the uniaxial compressive elastic modulus using the full dataset across a wide range of strain rates. Since the modulus reflected material stiffness prior to failure, it was considered to be independent of the failure mode.
Figure 11 shows the fitted surface, and Equation (4) provides the corresponding empirical form:
The corresponding fitting coefficients
m,
n, and
p are summarized in
Table 4. The modulus increased with the strain rate and decreased with porosity. At low strain rates, stress relaxation mechanisms played a key role. These mechanisms included dislocation movement and grain boundary sliding, which allowed for greater plastic deformation before failure. As a result, the observed stiffness was lower. As the strain rate increased, there was less time for stress redistribution, resulting in higher apparent stiffness. Similarly, greater porosity increased the likelihood of internal damage events, such as pore collapse and microcrack formation, which degraded the integrity of the load-bearing structure and lowered the modulus.
As shown in
Figure 11, level ice consistently showed higher modulus values than piled ice across all conditions. This difference was most pronounced at low strain rates and porosity. For example, at
= 1.0 × 10
−6 s
−1, the modulus of level ice exceeded that of piled ice by a factor of 3.59 at
v = 0.45 and 5.64 at
v = 0.10. At
= 1.0 × 10
−1 s
−1, the ratio narrowed to 1.01 and 1.59, respectively. At high strain rates and porosity levels, the observed convergence in the elastic modulus likely reflects a shift in dominant deformation mechanisms under more extreme loading conditions. While level ice generally maintains higher stiffness due to its denser internal structure, the pronounced reduction in the modulus of piled ice may be linked to its more complex and damaged microstructure. Repeated freeze–thaw cycles and extended atmospheric exposure are hypothesized to promote the development of microcrack networks and interconnected pores, which, in turn, weaken the ice matrix and reduce its resistance to deformation. Although this explanation remains speculative in the absence of direct microstructural observations, it aligns with the earlier hypothesis proposed for strength behavior and provides a consistent framework for interpreting the mechanical response of piled ice.
4. Discussion
4.1. Failure Modes in Different Ice Types
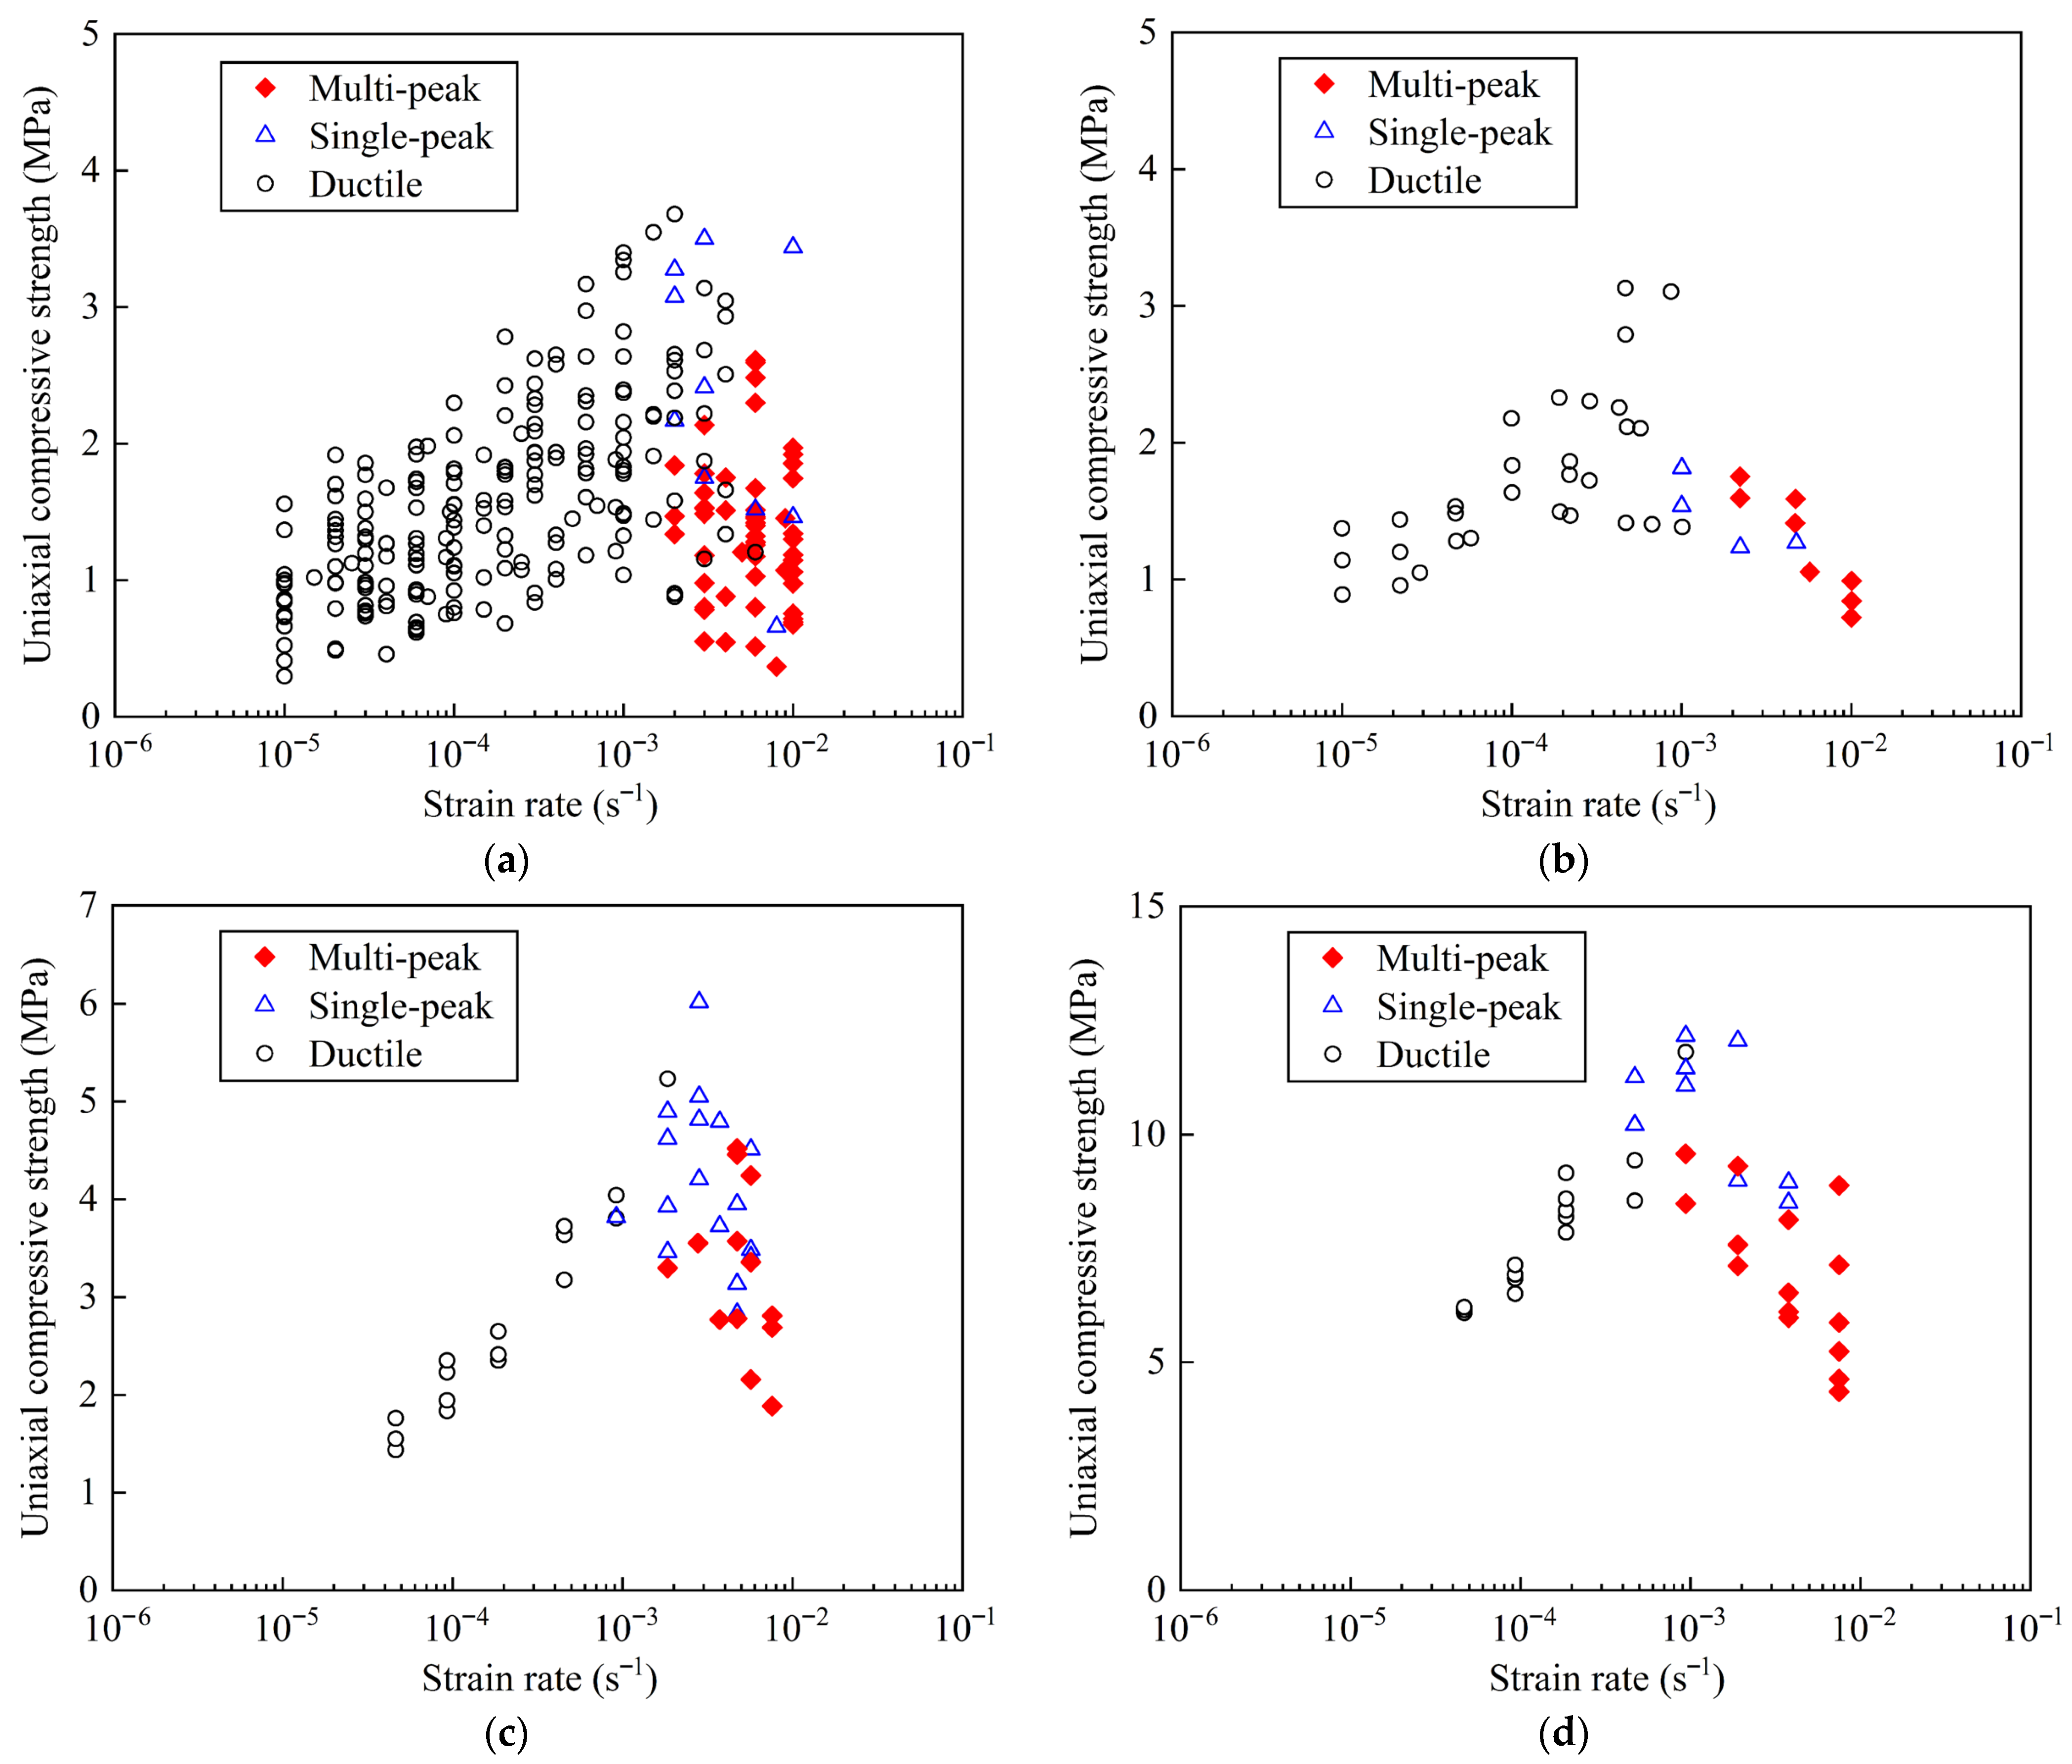
Figure 12 and
Figure 13 summarize the observed failure modes and their ratios of level and piled granular sea ice considered in this study, as well as vertical and horizontal columnar ice, with data from Ji et al. [
26]. Ji’s work provides valuable insights into the relationship between the strain rate and failure mode in columnar sea ice. Comparing our study with his research offered an opportunity for a deeper analysis of the mechanical behavior differences between sea ice with different crystal structures. These figures enable a direct comparison of how the strain rate influences both the failure mode distribution and its associated strength across different ice structures.
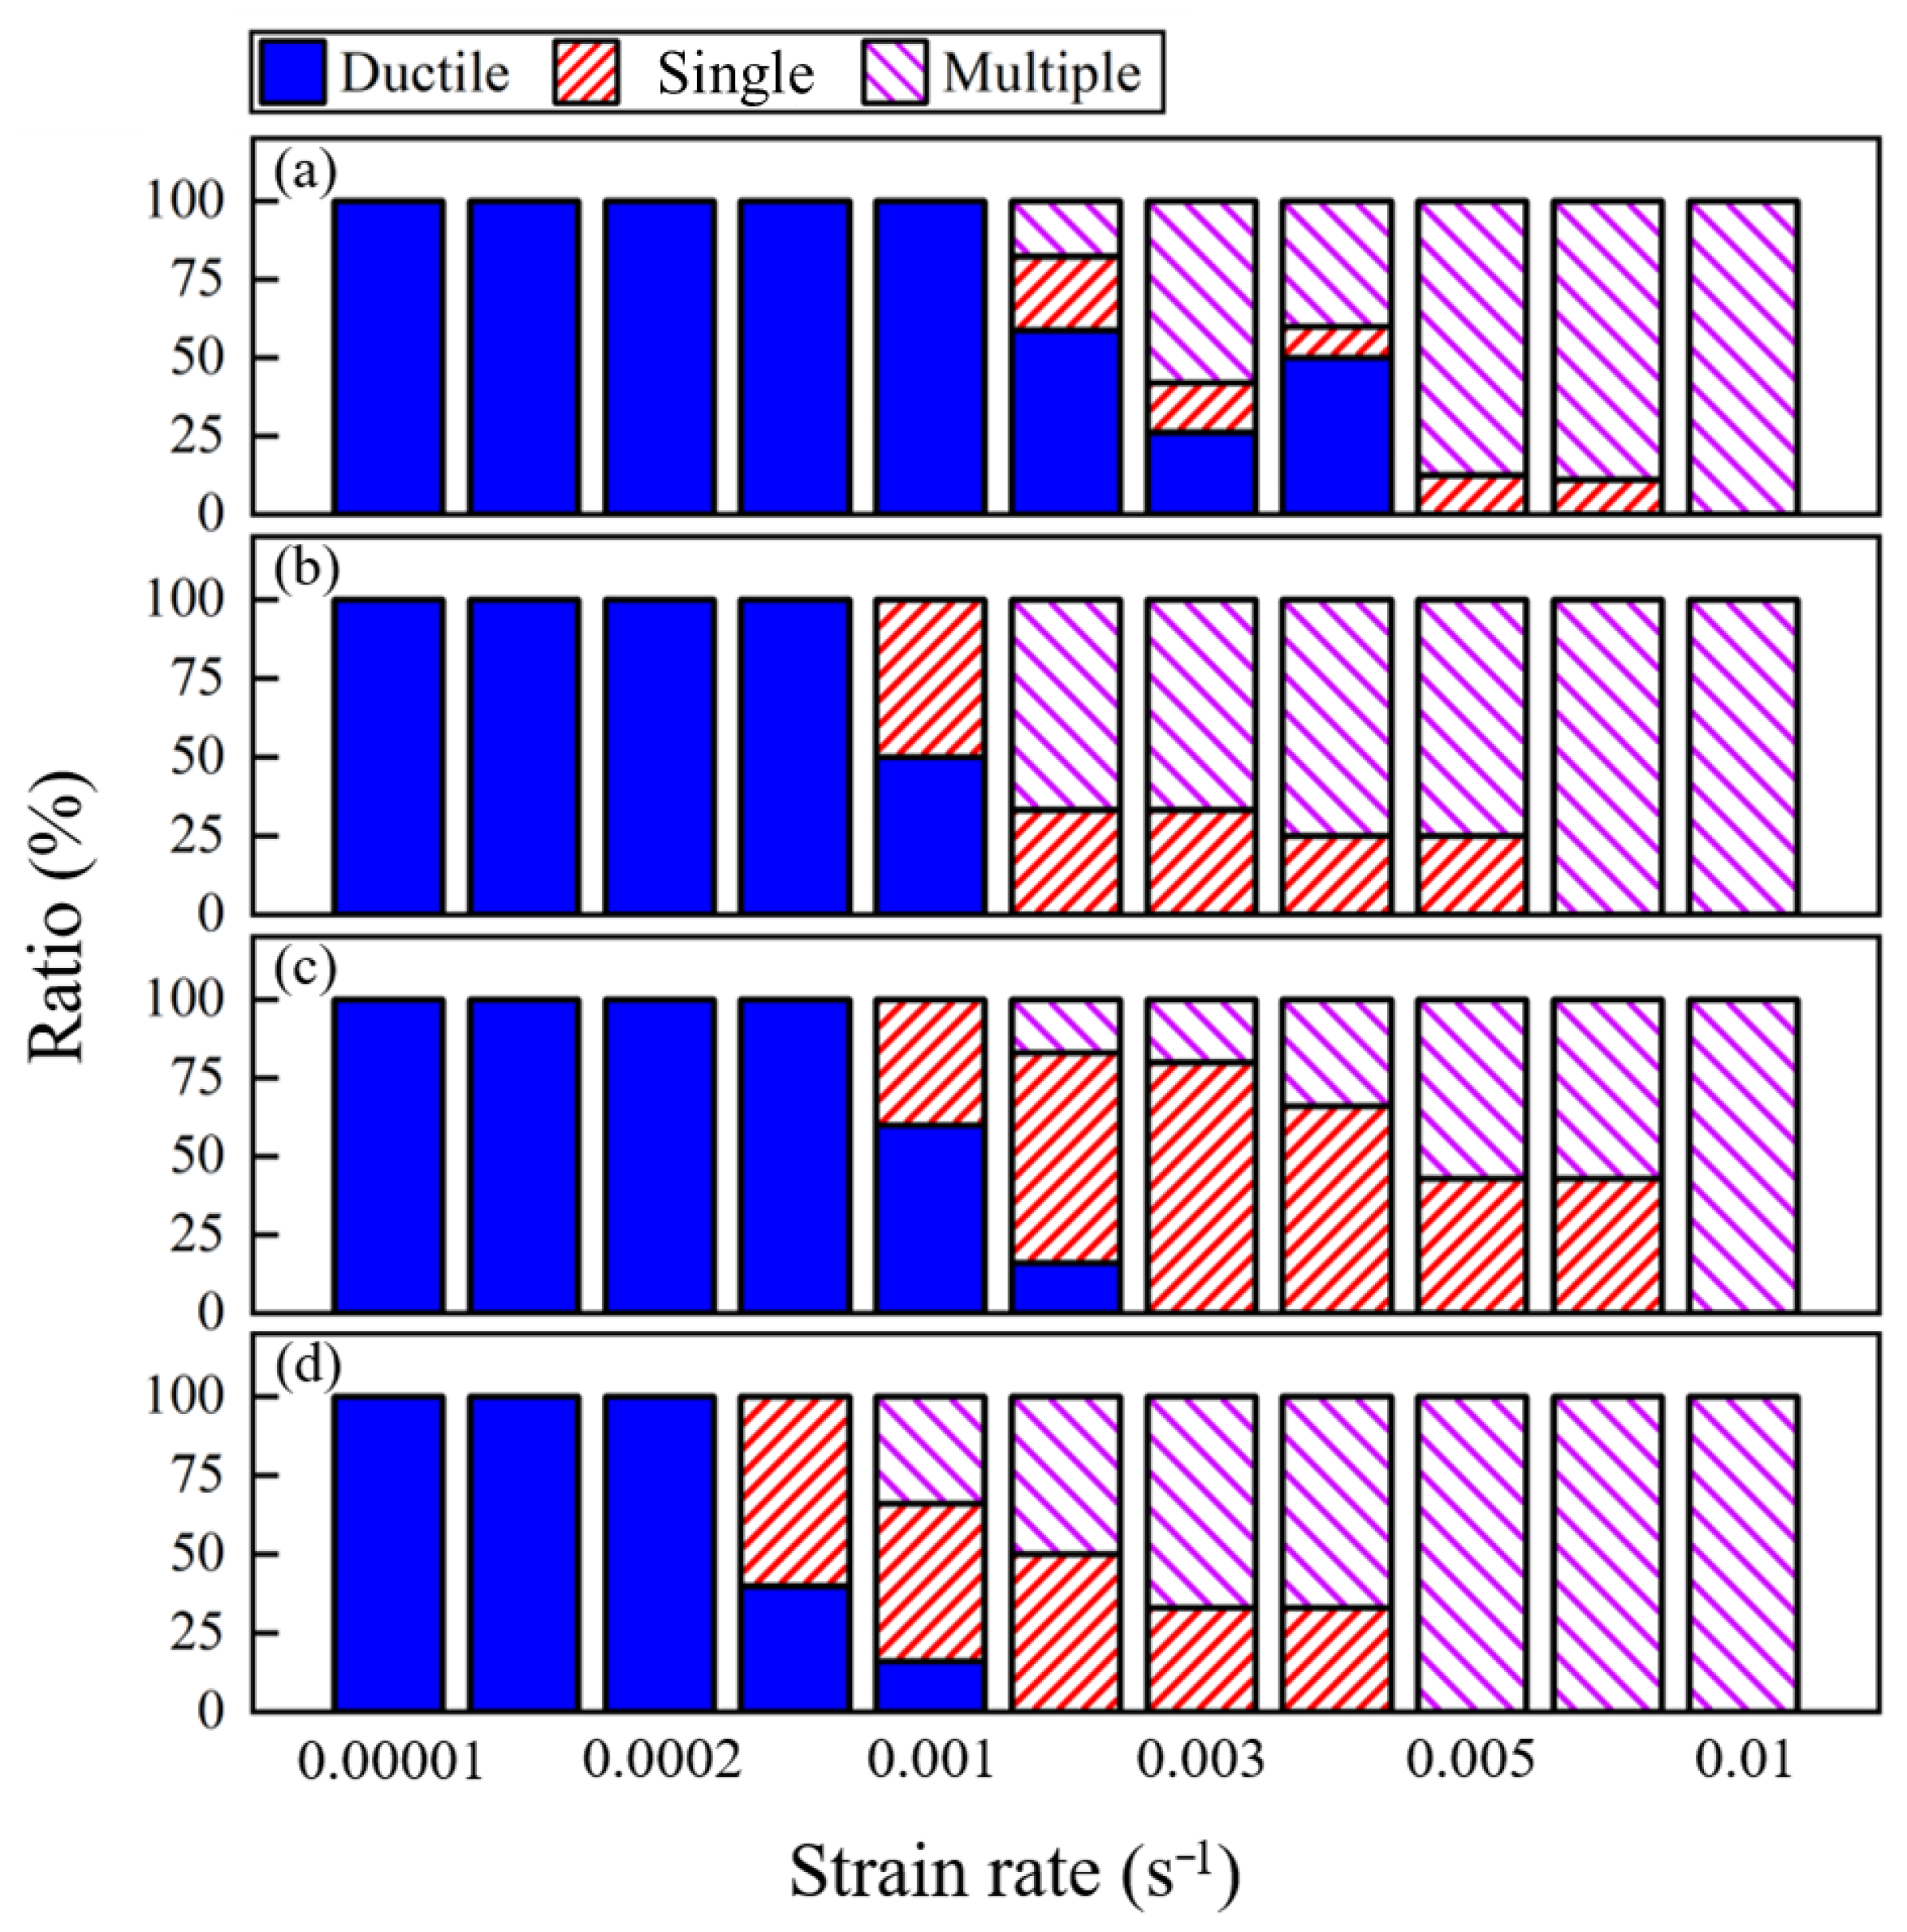
The failure modes of piled ice and level ice showed similar trends with increasing strain rate. As shown in
Figure 12a,b, both ice types predominantly exhibited ductile failure at low strain rates. As the strain rate increased, a gradual transition to single-peak failures and then multi-peak failures was observed. Specifically, ductile failure dominated below approximately 1 × 10
−3 s
−1 to 3 × 10
−3 s
−1, while single-peak failure and multi-peak failure became prevalent above this threshold. This evolution reflected the strain-rate sensitivity of the energy dissipation mechanisms in granular sea ice. Although piled and level ice exhibited a similar failure mode evolution with the strain rate, they differed in terms of absolute mechanical properties. As detailed in the Results section, piled ice generally showed a lower strength and elastic modulus than those of level ice. This was attributed to its looser internal structure and the presence of numerous unfused grain boundaries, which weakened the ice matrix and reduced its strength and ability to resist deformation.
In comparison with granular ice, columnar sea ice displayed both similarities and notable differences. Columnar sea ice also exhibited a strain-rate-dependent transition in failure mode, as reported by Ji et al. [
26]. However, in the ductile–brittle transition range, granular ice exhibited higher strength in ductile failure compared to its brittle failure strength. However, columnar ice showed the opposite trend, with higher strength in brittle failure (
Figure 12). This phenomenon can be explained by differences in the crystal structure and crack propagation mechanisms between the two types of ice.
Granular sea ice consisted of randomly distributed equiaxed crystals with no significant crystallographic orientation, exhibiting quasi-isotropic behavior. In this structure, crack propagation paths were influenced by the random orientation of grains, making it difficult to form a continuous crack. In the ductile–brittle transition range, microcrack nucleation and coalescence occurred through grain boundary sliding or intracrystalline deformation. In this process, ductile failure involved cooperative slip between grains, dissipating energy through multiple grain interactions. Strength was primarily determined by grain boundary cohesion and dislocation motion, resulting in relatively high strength. In contrast, brittle failure occurred due to local stress concentrations, causing rapid fracture along individual grains. Since grain boundary sliding was not sufficiently activated, energy dissipation was low, leading to decreased strength.
However, columnar sea ice had a highly anisotropic crystal structure, with grains aligned along the vertical growth direction. Under uniaxial compressive load, crack propagation depended on the angle between the loading direction and the grain orientation. In this case, ductile failure, dominated by grain boundary sliding, required overcoming grain boundary cohesion. In contrast, the brittle failure process required greater energy to overcome the cohesive forces between crystals and to initiate fracture within individual grains.
4.2. Ductile-to-Brittle Transition Behavior of Different Ice Types
The ductile-to-brittle transition (DBT) behavior of sea ice is strongly influenced by both its microstructure and loading conditions. For piled ice, the transition occurred over a wider strain rate range and exhibited higher variability in failure behavior within the DBT range, as shown in
Figure 12 and
Figure 13. This variability arose from microstructural heterogeneity, loose crystal packing, and numerous unfused grain boundaries. They introduced random stress concentration sites and prevented the formation of a single dominant fracture plane. As a result, the onset and completion of failure behavior were more scattered, making the brittle regime in piled ice relatively narrow and less well defined. In contrast, level ice exhibited a broader and more distinct brittle regime.
The comparison of the DBT in granular and columnar ice further highlighted structural differences. The brittle region in columnar ice, especially under vertical loading, was much larger than in granular ice. This can be explained by the strong anisotropic structure of columnar ice, where grain boundaries acted as natural weak planes, making crack propagation easier along these planes under loading. For granular ice, the isotropic structure, with a more random grain arrangement, limited crack propagation along a preferred path, resulting in a smaller brittle region. Furthermore, the transition from ductile to brittle failure in columnar ice was highly sensitive to the loading direction, as highlighted in Ji’s study. Specifically, vertical loading of columnar ice promoted brittle failure due to grain alignment, while horizontal loading presented a narrower brittle regime. This direction-dependent behavior was not observed in granular ice, where failure modes were more uniformly distributed across different loading conditions due to the absence of preferred crystals. These observations highlighted the structural basis for the differences in transition behavior. In columnar ice, brittle failure was energetically favorable when crack paths aligned with anisotropic grain structures. In granular ice, by contrast, the absence of preferred alignment and the presence of microstructural randomness limited crack continuity, delaying or diffusing the brittle response.
4.3. Comparison of Measured Strength with Historical Data
Although many empirical models have been developed to estimate the uniaxial compressive strength of sea ice, few are tailored specifically to granular ice. Among the most frequently referenced are the models by Timco and Frederking [
30] and Wang et al. [
36], both of which incorporate the combined influence of porosity and strain rate in strength prediction. These models are summarized in
Table 5. It should be noted that, while these models effectively capture the primary effects of porosity and strain rate, they do not explicitly incorporate the microstructural features that are also known to influence the compressive strength of sea ice. Sea ice is a highly heterogeneous material, and its mechanical behavior can be significantly affected by factors such as grain size distribution, pore connectivity, brine inclusion geometry, and the presence of pre-existing microcracks. These characteristics are inherently difficult to observe or quantify with precision, and, therefore, remain unaccounted for in most empirical models. In addition, the mechanical testing of sea ice is inherently destructive, precluding repeated measurements on the same specimen. As a result, even samples with similar bulk properties may exhibit notable differences in measured strength due to subtle internal variability. These issues contribute to the scatter commonly observed in both the models presented in this study (
Table 3 and
Table 4) and in prior formulations (
Table 5). Nevertheless, in the absence of detailed microstructural data, such models remain valuable tools for trend prediction and comparative analysis in sea ice research.
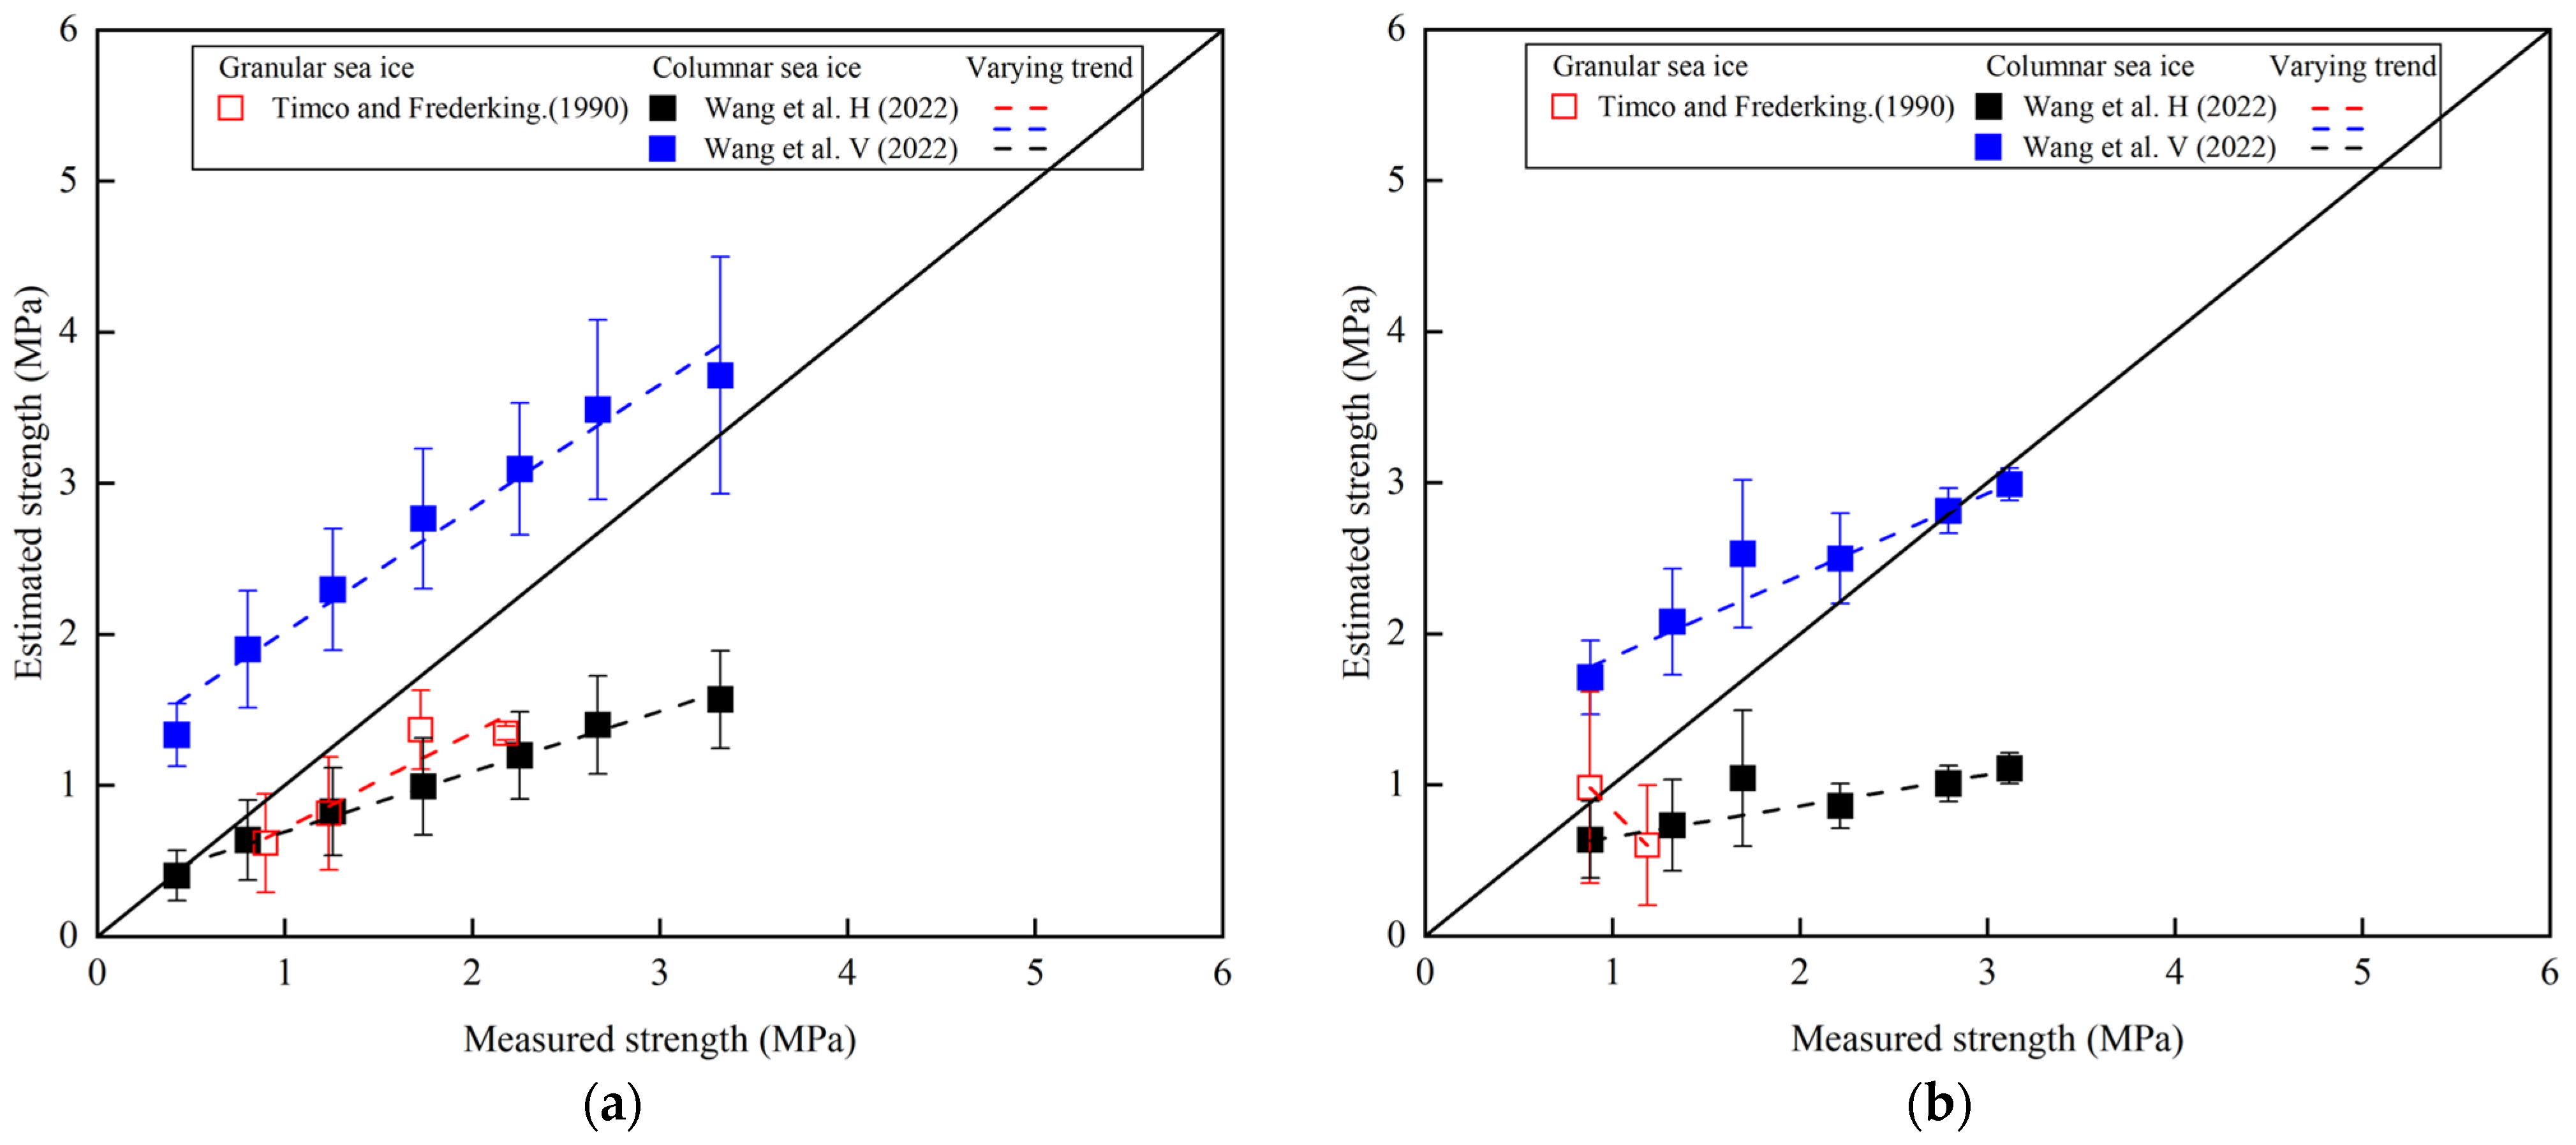
The former was derived from laboratory tests on various ice types, including some granular samples, while the latter was formulated exclusively for columnar sea ice and does not account for granular ice microstructures. To evaluate the applicability of these models to granular ice, we compared their predicted strength values with those measured in this study in
Figure 14. The experimental data were grouped into 0.5 MPa bins, with the corresponding model estimates averaged within each interval. The results for piled (S1) and level (S2) granular ice are shown in
Figure 14a and
Figure 14b, respectively. The Timco and Frederking model [
30], while foundational, was developed within a limited strain-rate range (1.0 × 10
−7–2.0 × 10
−4 s
−1) and assumes zero strength for porosity values exceeding 28% in granular ice. This constraint did not align with our experimental results, which showed that samples with porosity above 0.4 still retained measurable compressive strength. Consequently, the model significantly underestimated the granular ice strength at high porosities. In contrast, Wang et al.’s models extended the applicable strain-rate range to 1.0 × 10
−6–1.0 × 10
−2 s
−1 and provided separate expressions for brittle and ductile behavior under vertical and horizontal loading of columnar ice. Although not originally intended for granular ice, these models served as a practical reference in the absence of granular-specific formulations.
Our comparison showed that Wang et al.’s vertical-loading model consistently overestimated granular ice strength, while the horizontal-loading model underpredicted it, particularly in the 1–3 MPa range, where most of our data were concentrated. The experimental values, which aligned with the 1:1 reference line in
Figure 14, fell between the two predictions, forming a clear strength envelope. For piled ice, the vertical model overpredicted strength by 82.70% ± 58.02%, while the horizontal model underpredicted by 34.85% ± 28.02%. For level ice, the over- and underestimations were 50.04% ± 37.94% and 44.13% ± 25.71%, respectively. In specific intervals, such as 2–3 MPa and near 1 MPa, the prediction error was reduced, suggesting partial convergence.
These observations supported the use of Wang et al.’s columnar ice models as bounding cases for granular sea ice strength; the vertical-loading model provided an upper limit, while the horizontal-loading model offered a lower bound. Despite microstructural and formation differences, the consistency of this bounding behavior reflects the critical role of porosity and grain structure in compressive failure. In the absence of more targeted models, this framework offers a practical approach for estimating strength ranges in granular sea ice.
5. Conclusions
This study systematically investigates the uniaxial compressive behavior of granular sea ice using tests on piled and level ice samples from the Bohai Sea. The effects of porosity and strain rate on the compressive strength and elastic modulus were quantified, and empirical models were developed. The main findings are as follows:
- (1)
Compressive strength increased with increasing strain rate and reached a peak within the ductile-to-brittle transition range at low strain rates. Beyond this range, further increases in strain rate led to a reduction in strength. This work presents the first systematic investigation of the elastic modulus of granular sea ice. The elastic modulus exhibited a monotonic increase across the entire strain rate range tested (10
−6 s
−1 to 10
−1 s
−1). Both compressive strength and elastic modulus decreased significantly with increasing porosity. The uniaxial compressive strength and elastic modulus formulas are summarized in Equations (1) and (2). The ductile-to-brittle transition strain rates and peak compressive strengths of granular sea ice are summarized in
Table 2.
- (2)
Unified parametric surface models were established for both level ice and piled ice, as expressed in Equations (3) and (4). The compressive strength surfaces were fitted separately for the ductile and brittle regimes, with R2 values of 0.65 and 0.50 for the ductile and brittle regimes of piled ice and 0.74 and 0.86 for level ice, respectively. The elastic modulus surfaces, which were independent of failure mode, were fitted across the entire strain rate range, with R2 values of 0.50 for piled ice and 0.42 for level ice.
- (3)
The ductile-to-brittle transition (DBT) behavior of granular sea ice was primarily governed by porosity. The transition strain rate of level ice shifted from 2.34 × 10⁻³ s−1 at high porosity (45%) to 1.42 × 10⁻⁴ s−1 at low porosity (10%), while for piled ice, the transition strain rate changed from 1.19 × 10⁻³ s−1 to 1.87 × 10⁻³ s−1. The DBT range of level ice exhibits greater sensitivity to porosity, whereas the failure modes within the transition range for piled ice are more scattered.
- (4)
Under compressive loading, piled ice exhibits weaker mechanical properties compared with level ice. To explain this phenomenon, we propose the following hypothesis: repeated freeze–thaw cycles and prolonged exposure to air may promote the development of internal microcrack networks and interconnected pores. These structures can serve as energy dissipation paths, which, on the one hand, reduce the strength and deformation resistance of sea ice, and, on the other hand, delay the onset of brittle failure.
This study helps to improve the accuracy of ice load predictions and contributes to the design of ice-resistant structures, including vessels, offshore platforms, and coastal infrastructure. The results offer valuable data to support the safety and durability of such structures operating in harsh and dynamic environments, thereby enhancing the efficiency and reliability of engineering operations in ice-covered regions. It should be noted, however, that some limitations remain. In the present study, the comparison between granular and columnar sea ice was conducted using historical data for columnar ice rather than samples formed under identical growth conditions. This may introduce uncertainties when interpreting differences in mechanical behavior between the two ice types. Additionally, the empirical models employed in this study, like many prior formulations, rely on bulk parameters, such as porosity and strain rate, while omitting critical microstructural features. Future research should, therefore, incorporate detailed microstructural characterizations to improve the physical basis of predictive models. Techniques such as thin-section microscopy could be used to quantify grain size, shape, and orientation, X-ray computed tomography (CT) may reveal pore morphology and connectivity, and acoustic emission monitoring during compression testing could provide real-time insights into microcrack initiation and propagation. These approaches would not only help validate the hypotheses proposed in this study, such as the role of freeze–thaw-induced damage in altering mechanical responses, but also advance our understanding of the underlying failure mechanisms in granular sea ice.


