Abstract
At present, sea ice remains a critical factor affecting the safety of vessel operations along the Northern Sea Route (NSR). However, inconsistencies between the navigability outcomes derived from the criteria for the admission of ships in the area of the Northern Sea Route (NSR criteria) and the polar operational limit assessment risk indexing system (POLARIS) methodology present challenges for navigational decision-making. This study aims to conduct a systematic comparison of the POLARIS methodology and the NSR criteria in evaluating the navigability of independently operating vessels classified as Arc4 to Arc9. Through comparative calculations of navigability and the navigability rates for six ice-class vessels across 27 districts using the two methods, this study reveals the consistencies and discrepancies in their navigability outcomes. Firstly, using the POLARIS methodology, the risk index outcome (RIO) is calculated for six ice-class vessels across 27 districts. For these districts, the navigability threshold is defined when 95% or more of the area exhibits an RIO greater than or equal to zero. Secondly, using the NSR criteria, navigability ratios for six ice-class vessels under varying ice conditions are evaluated. A navigability threshold is defined when 95% or more of the ice conditions in a district are classified as navigable. Finally, a quantitative comparison of the weekly navigability ratios obtained by the two methods is conducted to reveal the consistencies and discrepancies in the navigability outcomes of each ice-class vessel across different NSR districts. The results indicate that the consistency between the navigability outcomes of the two methods decreases with lower vessel ice classes, particularly in September and March. In general, the consistency of performance between the two methods in terms of navigability outcomes deteriorates as the vessel ice class decreases and ice conditions become more complex. This study provides a scientific foundation and data-based support for route planning and real-time decision-making in polar waters.
1. Introduction
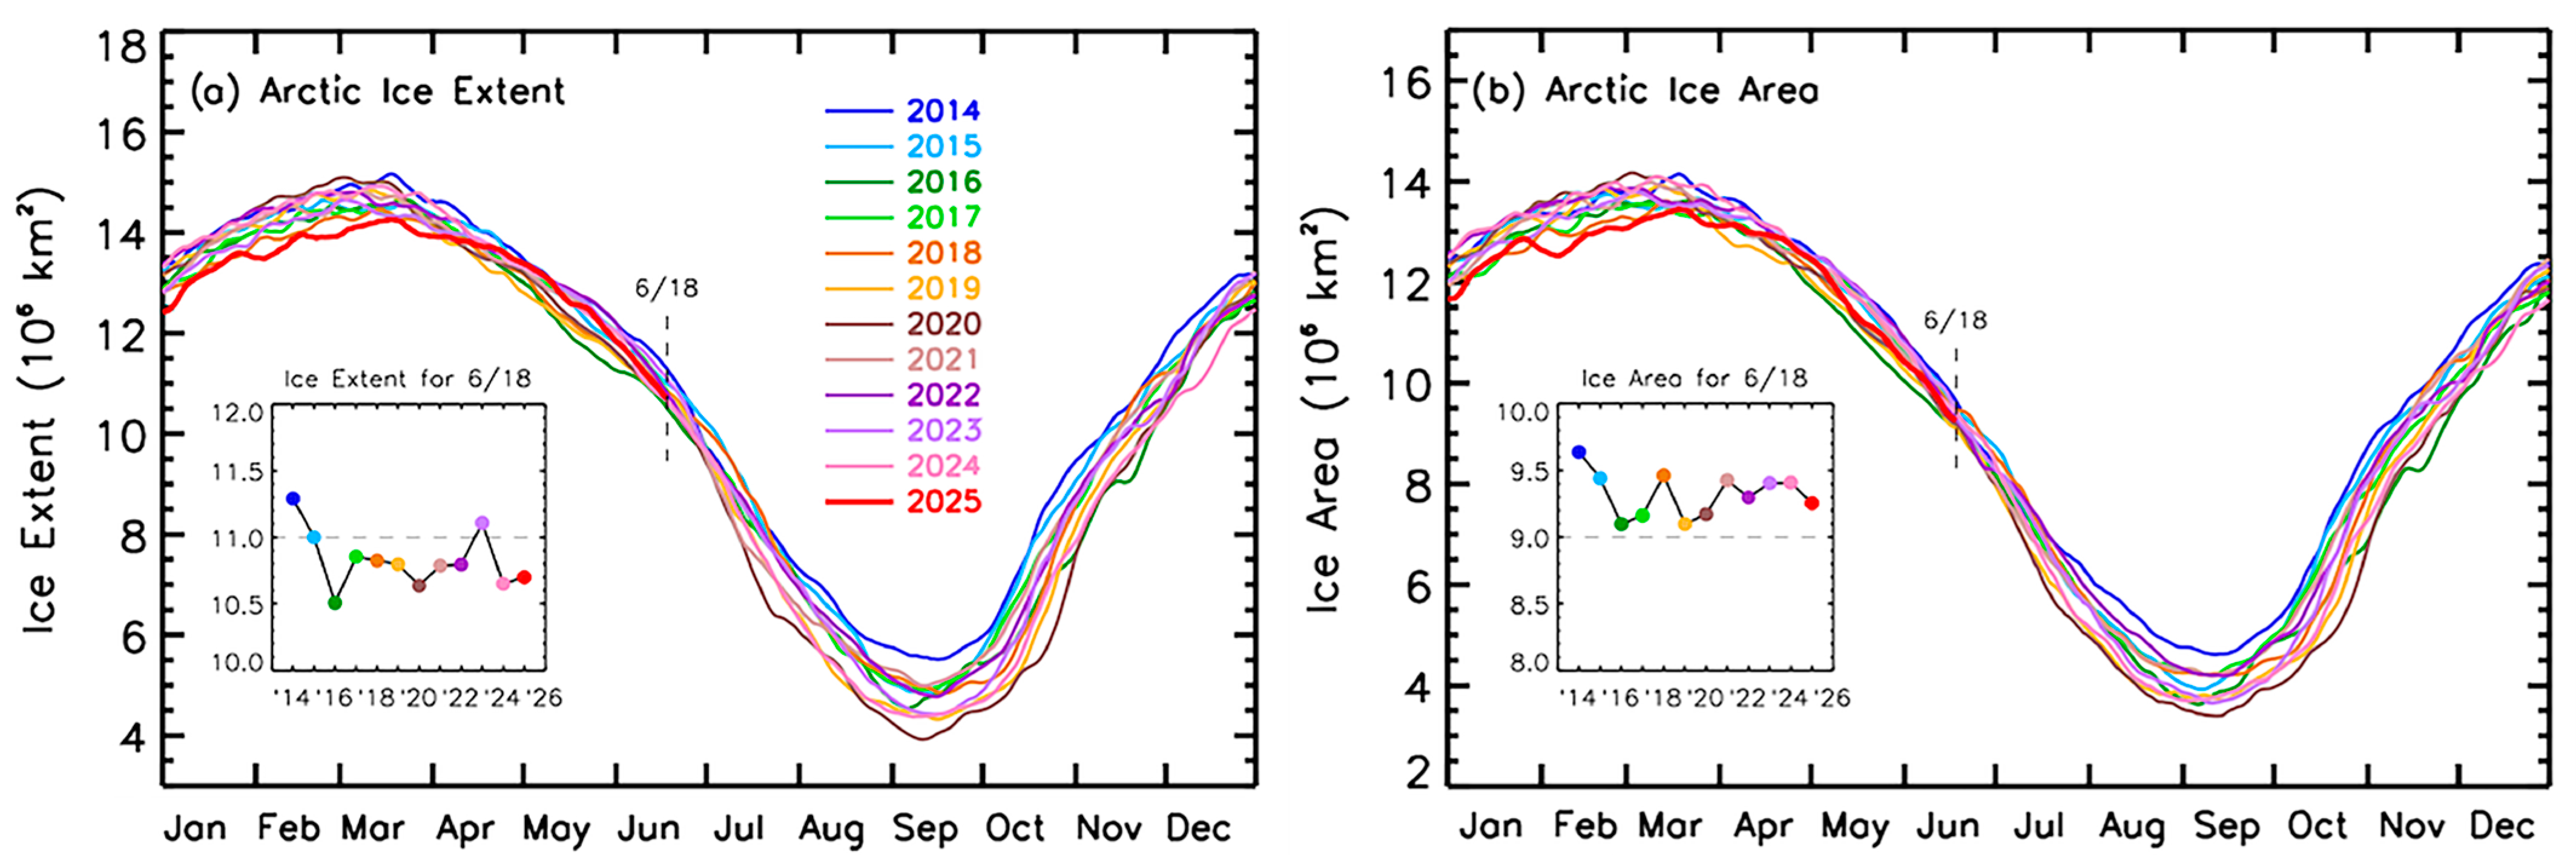
As global warming continues, the extent of Arctic sea ice has steadily decreased, with the waters along the Northern Sea Route (NSR) exhibiting a similar trend (Figure 1) [1,2,3]. While the melting of sea ice has, to some extent, expanded the navigable window of the NSR, it has not changed the fundamentally seasonal nature of vessel navigation in the region [4,5]. Meanwhile, vessel ice entrapment remains commonplace in Arctic waters, and sea ice conditions continue to be a key factor affecting vessel navigation safety along the NSR [6,7]. Transit voyages through the NSR have shown steady growth in recent years [8]. This trend is closely associated with variations in sea ice conditions along the NSR. Conducting systematic research into the navigability of polar ice-class vessels is essential for enhancing the safety of shipping along the NSR. To ensure navigation safety in polar waters, the International Maritime Organization (IMO) adopted the Polar Code in 2014, which came into effect in 2017 [9]. The Polar Code recommends the use of the polar operational limit assessment risk indexing system (POLARIS) as a decision-support tool for vessel operations in polar waters [9,10,11]. As transit voyages through the NSR continued to increase, the Russian Federation government issued the Rules of Navigation in the Water Area of the Northern Sea Route in 2020, which specify the admission criteria for vessels operating in the NSR [11]. The POLARIS methodology and the criteria for the admission of ships in the area of the Northern Sea Route (NSR criteria) employ different approaches to determining the navigability outcomes of ice-class vessels. The POLARIS methodology calculates the risk index outcome (RIO), based on the ice class of the vessels and surrounding ice conditions, to determine navigability outcomes. However, the NSR criteria divide the NSR into 28 districts and specify the navigability of vessels according to ice class and navigation mode, based on navigation periods and regional sea ice severity [12,13].
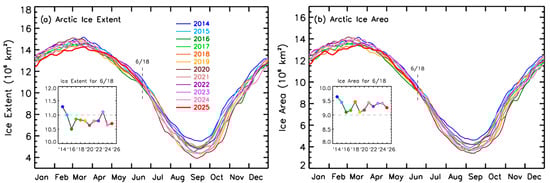
Figure 1.
Seasonal cycle of Northern Hemisphere sea ice extents (a) and areas (b), given as daily averages, for the years 2014 through 2025. The vertical line represents the last data point plotted.
Current research on the navigability of Arctic vessels primarily focuses on an analysis of sea ice conditions [14,15], the Arctic ice regime shipping system (AIRSS) [16], the POLARIS methodology [17,18], the coupled model intercomparison project—phase 6 (CMIP6) [19], and the applicability of relevant regulations from various countries [20,21]. Existing studies [14,15,16,17,18,19,20,21] primarily adopt single or multi-model approaches or work from legal and regulatory perspectives, to study the navigability of polar vessels. Previous studies support the applicability of the POLARIS methodology in the Northwest Passage of Canada, underscoring its practical value and its promising potential for broader implementation [22]. In contrast, while Russia does not explicitly prohibit the use of the POLARIS methodology in the operational management of vessels in the NSR, the method’s applicability is affected by the lack of alignment of the POLARIS methodology with the Arctic categories defined by the Russian Maritime Register of Shipping (RMRS). Although the POLARIS methodology is an internationally recommended decision-support tool for polar waters, in practice, the differing navigability outcomes produced by the two methods may introduce uncertainty into the navigation-related decisions made by shipowners [21,23]. In light of the existing compatibility issues between the POLARIS methodology and the NSR criteria, a systematic investigation of their differences and consistencies in navigability outcomes is essential to provide a scientific foundation and practical guidance for enhancing navigation safety in polar waters.
Due to these incompatibilities between the POLARIS methodology and the NSR criteria in terms of their assessment criteria and vessel ice-class categories, discrepancies arise in navigability outcomes when the two methods are applied in practice. Therefore, this study focuses on Arc4 to Arc9 ice-class vessels and selects three representative time points: September 2024, November 2024, and March 2025. The navigability outcomes of 27 districts in the NSR were systematically compared using the POLARIS methodology and the NSR criteria. This included analyzing the differences in the navigability outcomes of different ice classes within the same district, as well as the differences in navigability outcomes for the same ice class across different districts. Through this comparative analysis, the study reveals both the consistencies and differences in navigability outcomes between the results when applying the POLARIS methodology and the NSR criteria, providing theoretical support for the optimization of safety assessment frameworks for polar waters and the enhancement of navigation safety standards.
The main contributions of this study are as follows:
- (1)
- A comparative analysis framework is developed to systematically examine the differences and similarities between the POLARIS methodology and the NSR criteria when assessing the navigability of Arc4 to Arc9 ice-class vessels, based on 27 defined districts of the NSR;
- (2)
- From spatial and temporal perspectives, the “navigability rate” indicator is introduced to quantitatively compare the consistencies and differences between the two methods in terms of their navigability outcomes;
- (3)
- The results reveal significant spatial and temporal discrepancies between the two assessment approaches, offering theoretical insights and practical guidance for improving the current polar navigation safety assessment system.
The remainder of this paper is organized as follows: Section 2 introduces the study area and data; Section 3 describes the two assessment methods used in this study, namely, the POLARIS methodology and the NSR criteria; Section 4 presents the navigability results and navigability rates of six ice-class vessels along the NSR, obtained using both methods, followed by a comparative analysis highlighting their differences and consistencies in terms of navigability outcomes; Section 5 discusses the experimental results, validates the accuracy of the data, and explores the reasons of the discrepancies in navigability outcomes. Finally, Section 6 summarizes the main findings of this paper.
2. Study Area and Data
2.1. Study Area
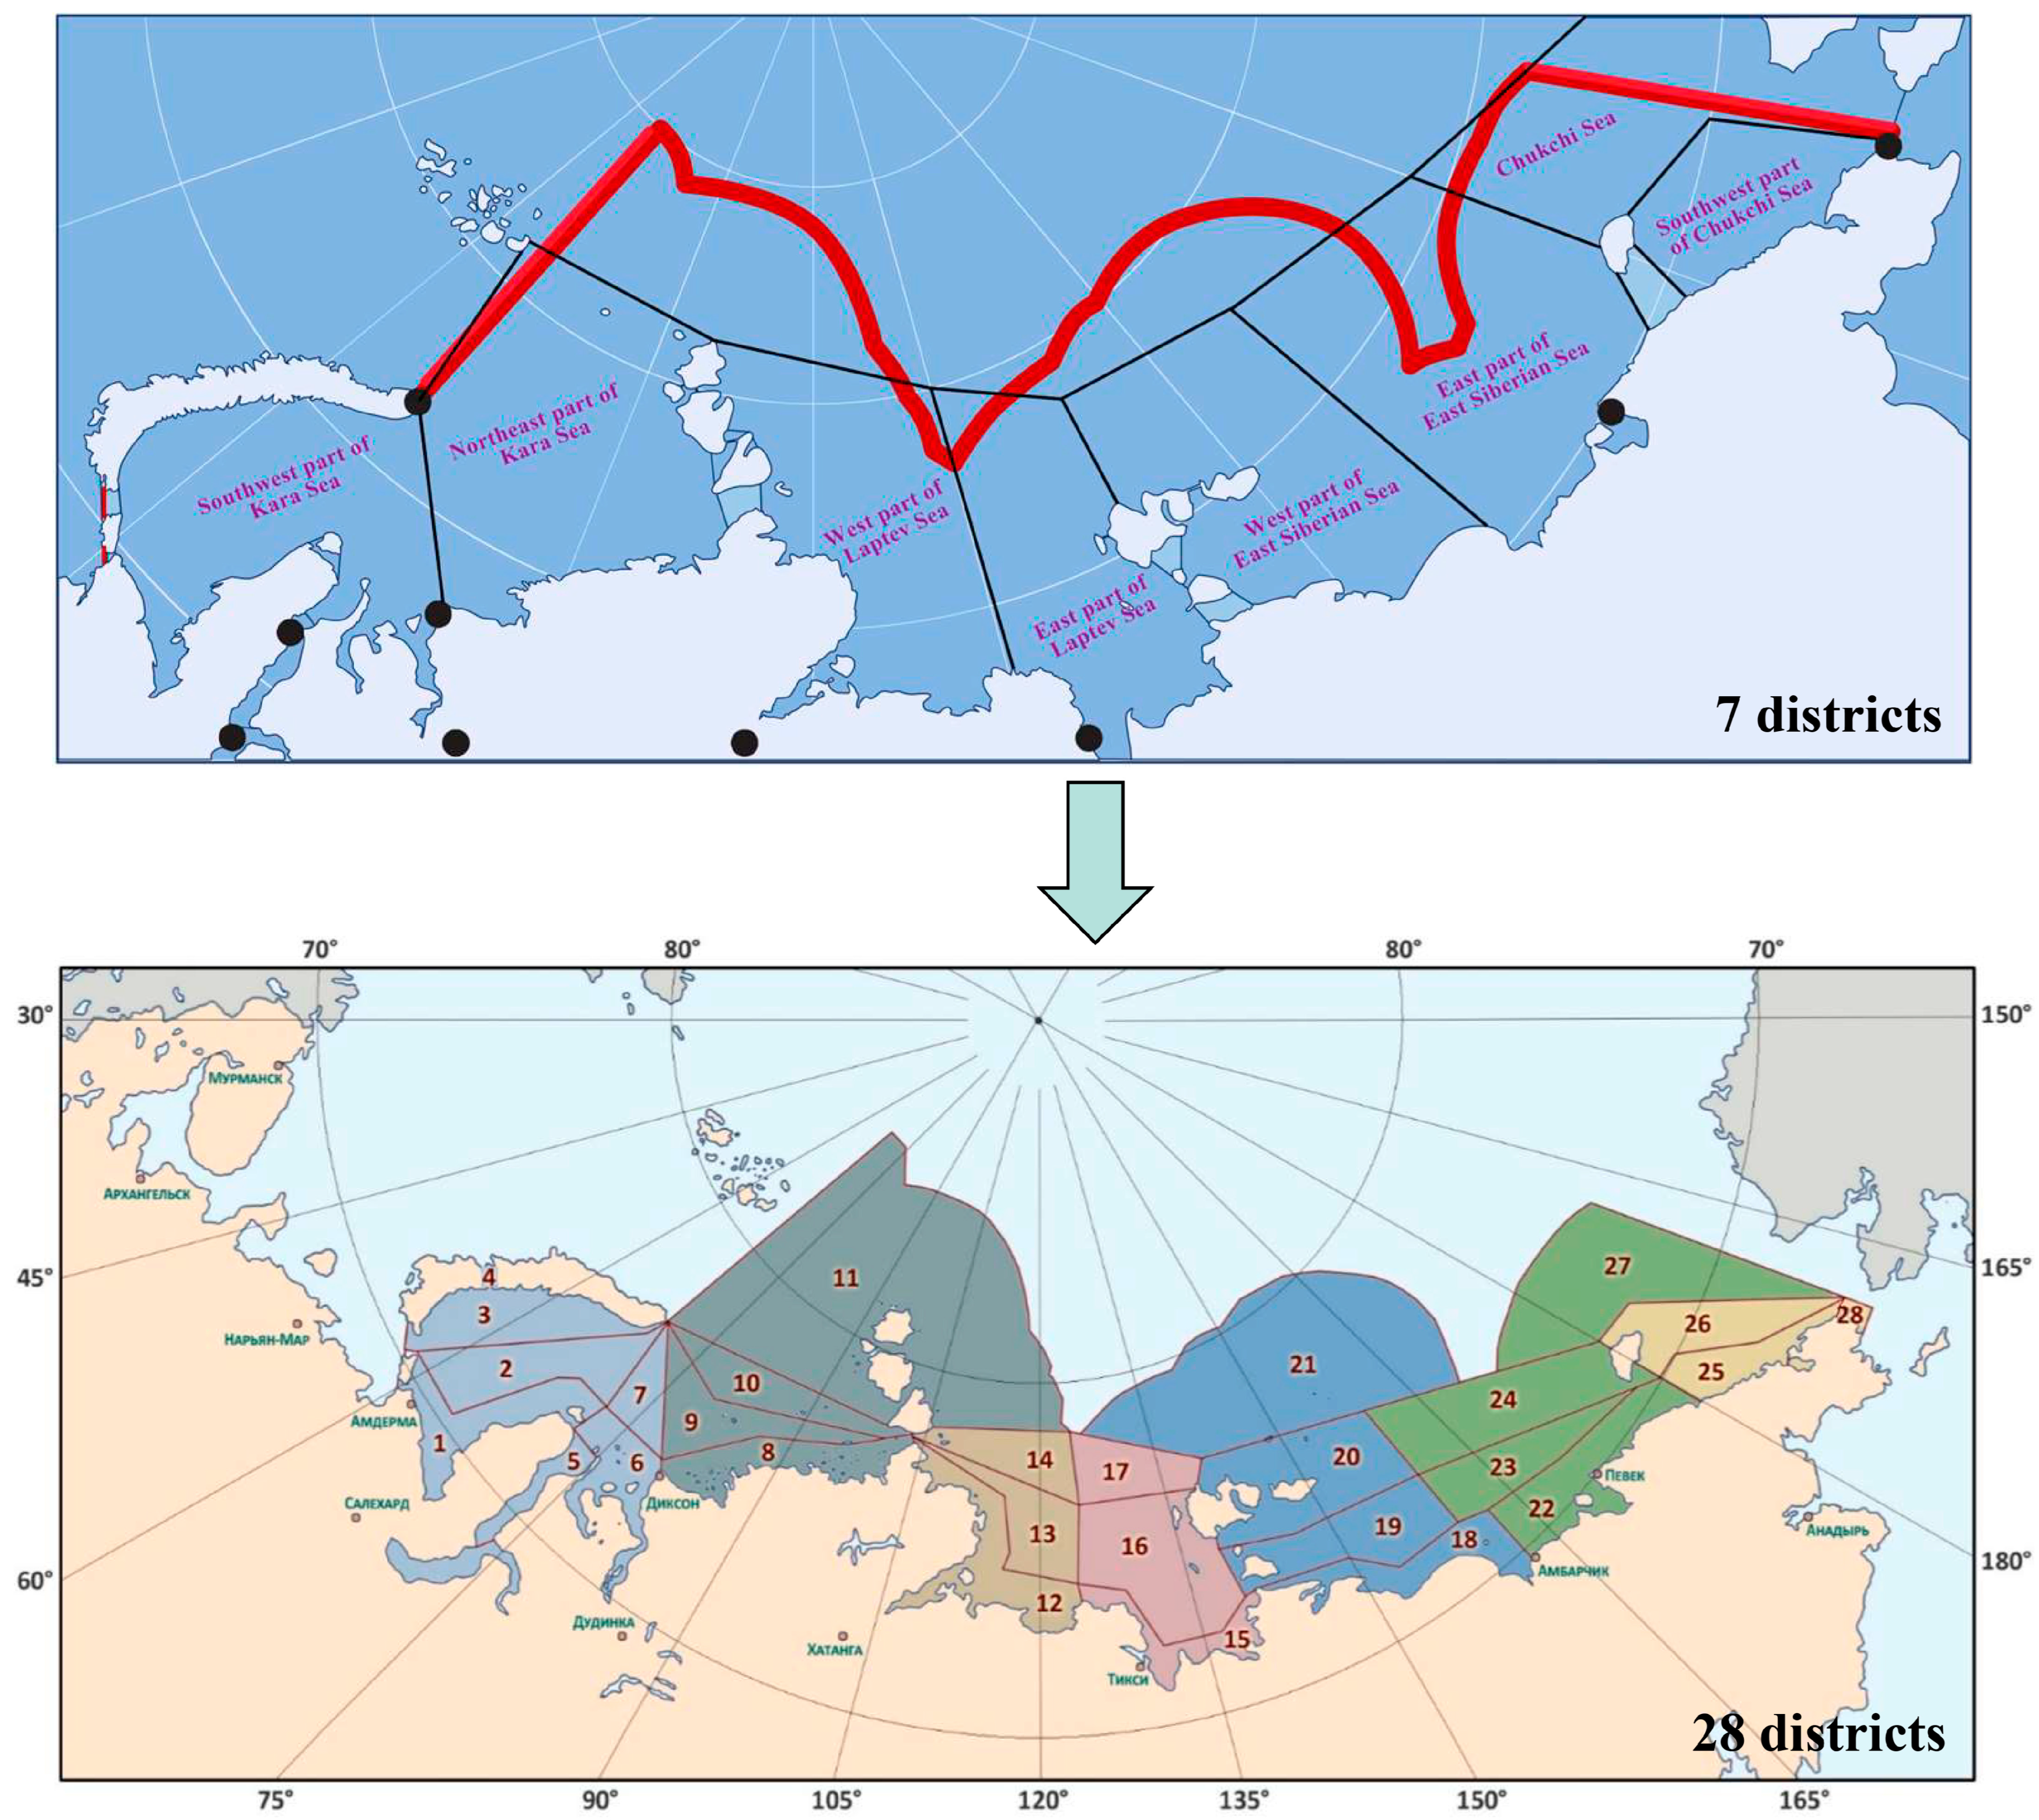
This study focuses on the waters of the Northern Sea Route (NSR). Since the summer of 2020, the Northern Sea Route Administration (NSRA) has redefined the boundaries of the NSR, based on the types of ice conditions, reorganizing the original 7 districts into the current 28 administrative districts (Figure 2) [24,25]. According to Russian law, the NSR primarily includes the Kara Sea, Laptev Sea, East Siberian Sea, and Chukchi Sea [26].

Figure 2.
Changes in the districts of the NSR waters from the original 7 districts to the current 28 districts.
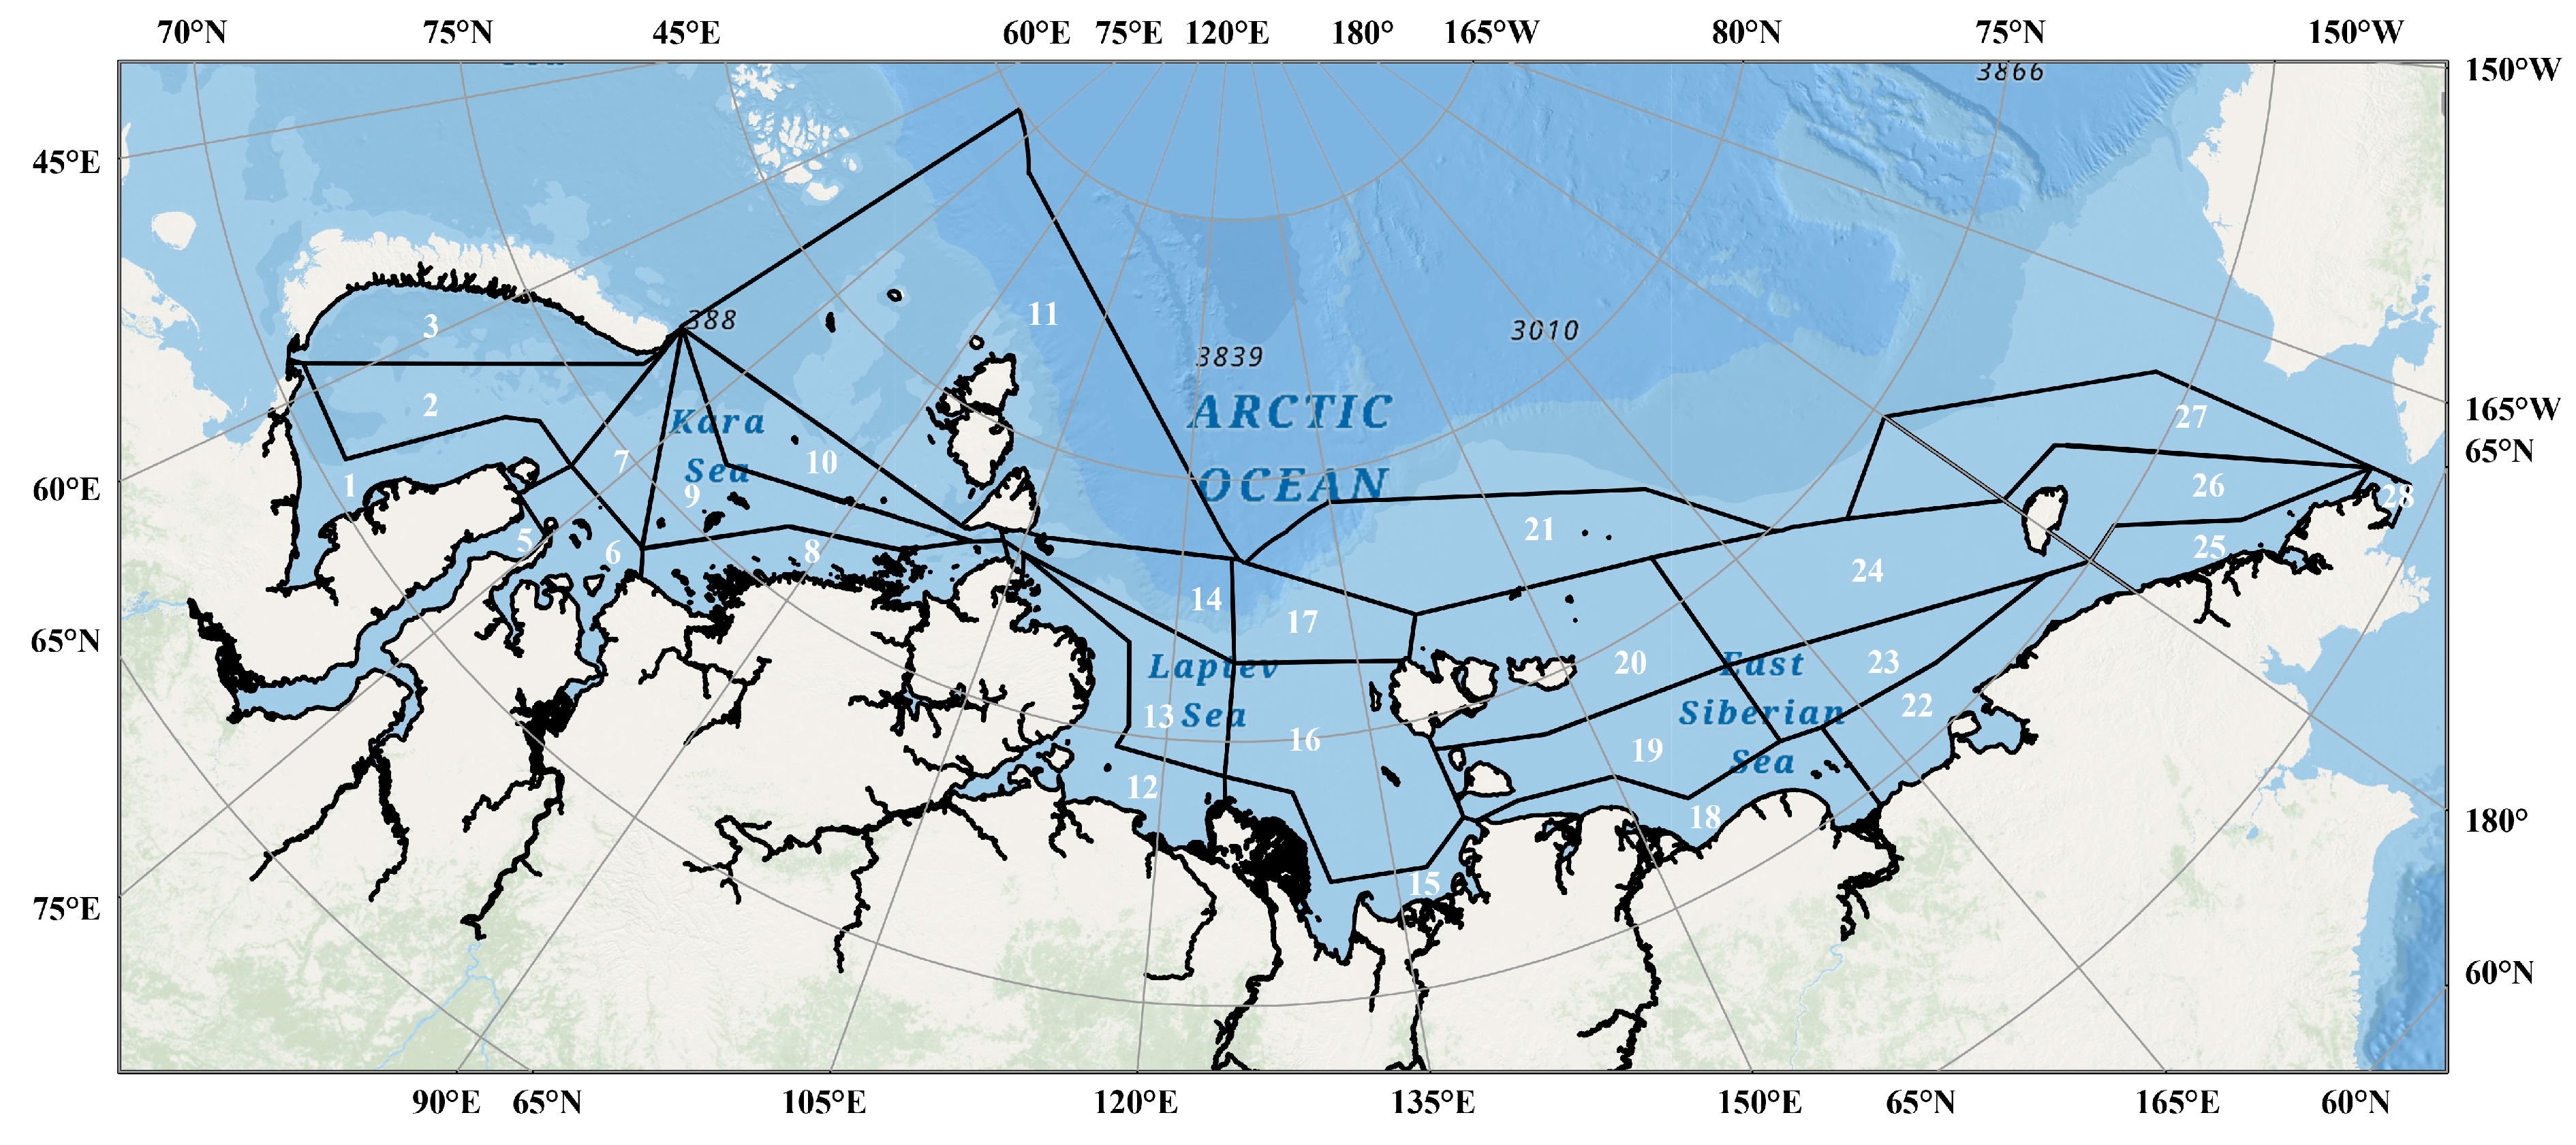
It should be noted that considering the actual navigation conditions of vessels and the forecast data on the types of ice conditions in NSR waters, as published by the NSRA, District 4 is not included in the scope of this study area [27,28]. Therefore, this research focuses on the remaining 27 districts [29] (Figure 3).
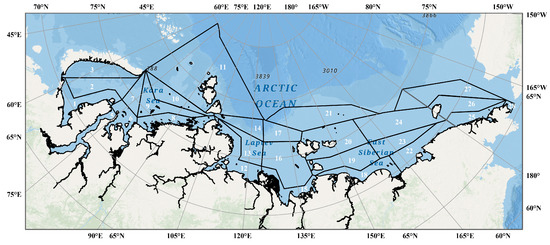
Figure 3.
The study area is divided into 27 districts, each delineated by administrative boundaries designated by the NSRA and the shoreline separating its covered waters from the adjacent land.
The correspondence between the 27 districts and their respective sea areas is as follows: Districts 1 to 10 belong to the Kara Sea; District 11 spans both the Kara Sea and the Laptev Sea; Districts 12 to 17 belong to the Laptev Sea; Districts 18 to 20 and 22 to 24 belong to the East Siberian Sea; District 21 spans both the Laptev Sea and the East Siberian Sea; Districts 25, 26, and 28 belong to the Chukchi Sea; and District 27 spans both the East Siberian Sea and the Chukchi Sea [29].
2.2. Study Data
The data used in this study include Arctic sea ice data provided by the National Snow and Ice Data Center (NSIDC), as well as the forecast data on types of ice conditions in NSR waters provided by the NSRA. Considering the characteristics of sea ice variations in the study area, the period from June to September is defined as the melting season, early September to mid-November as the average navigable season, and December to the following March as the freezing season [30,31,32,33]. Among these, September is the month with the smallest sea ice coverage and optimal navigation conditions, March is the period with the largest sea ice coverage and the poorest navigation conditions, while November is a transitional phase in terms of ice condition changes [34,35]. Therefore, this study selected Arctic sea ice data from September 2024, November 2024, and March 2025, along with the forecast data on types of ice conditions in NSR waters that were used for the analysis. Details of the two datasets are presented in Table 1.

Table 1.
Overview of Arctic sea ice data and forecast data on ice conditions in the NSR.
2.2.1. Arctic Sea Ice Data
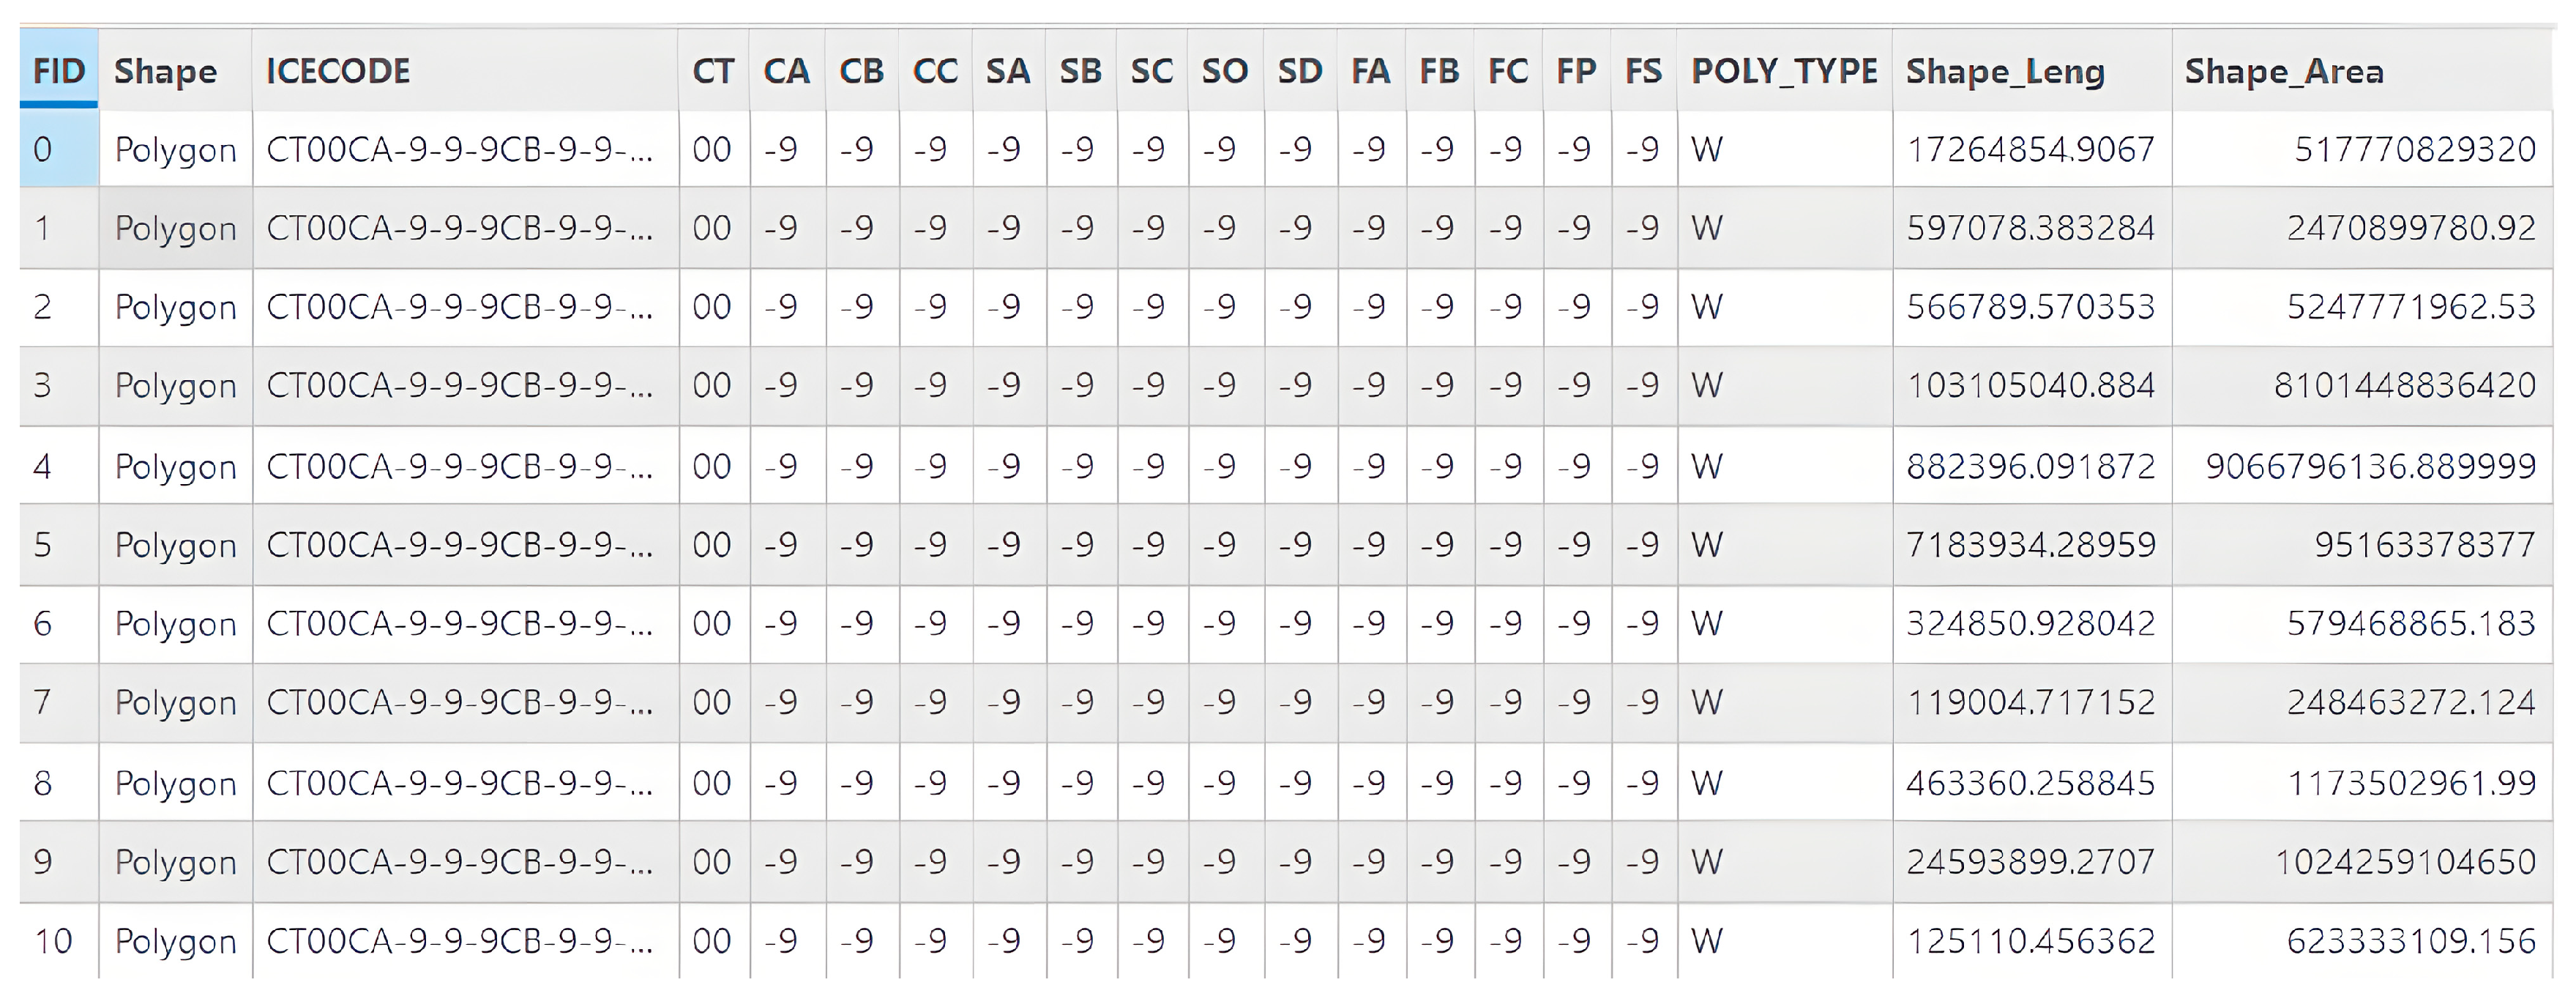
Arctic sea ice data are updated every seven days, with the data format specified as SIGRID-3 and the geographic coordinate system being WGS 1984. This dataset provides information on sea ice concentration and the sea ice stages of development. In this dataset, the fields representing sea ice concentration include CT, CA, CB, and CC, whereas the fields corresponding to sea ice stages of development include SA, SB, and SC. Definitions and value ranges for the fields related to sea ice concentration and sea ice stages of development can be found in References [31,32]. Arctic sea ice data attributes are presented in Figure 4.
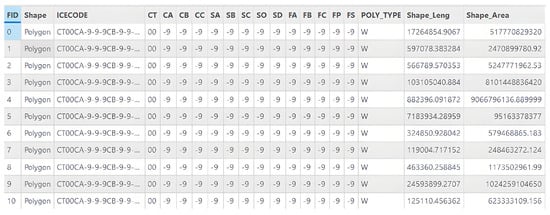
Figure 4.
Attribute table of a single Arctic sea ice data point. Note: FID indicates the field ID; Shape refers to the geometry type, which is a polygon in this case; CT, CA, CB, and CC are codes for sea ice concentration; SA, SB, SC, SO, and SD represent the codes for sea ice development stages; FA, FB, FC, and FS indicate floe size codes; POLY_TYPE denotes the polygon type, where W stands for water; Shape_Leng represents the polygon perimeter; and Shape_Area refers to the polygon area. For detailed explanations of the field codes, refer to Reference [32].
2.2.2. Russian Forecast Data on Ice Conditions in the NSR
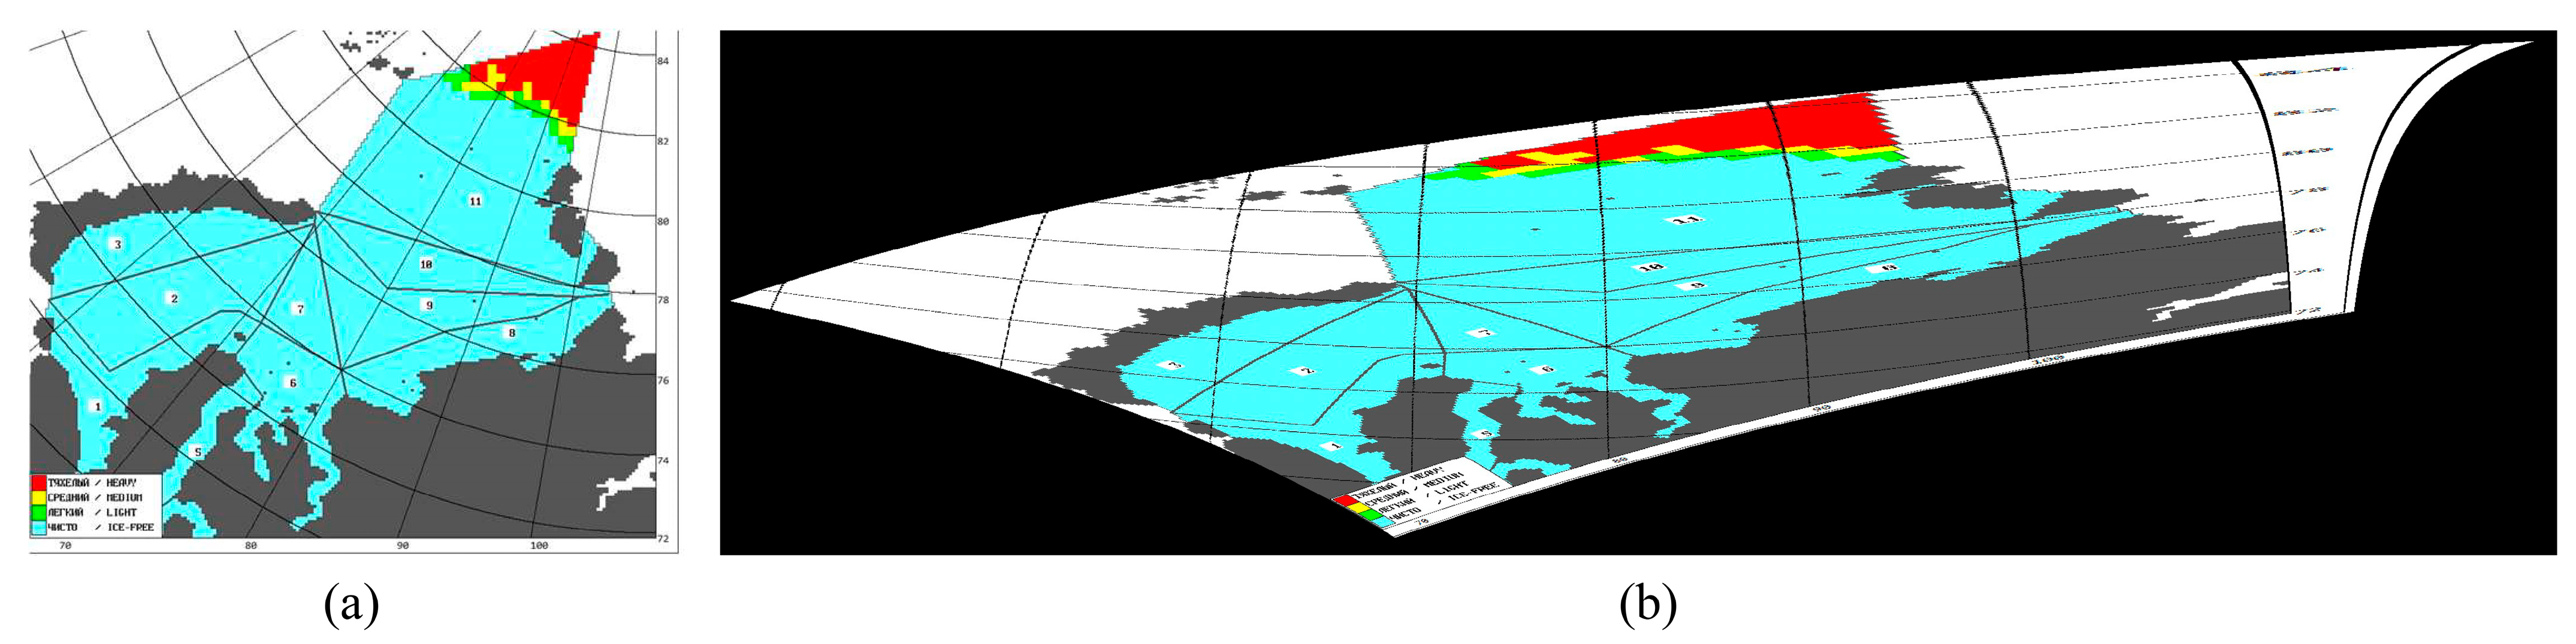
The forecast data on types of ice conditions in NSR waters are updated every three days and are provided as four images covering the study area (Figure 5), presented in PNG format. Each image consists of two components: an ice condition image and a corresponding textual description. The ice condition image uses color to represent different types of ice conditions. According to the text description, blue indicates ice-free conditions, green indicates light ice conditions, yellow indicates medium ice conditions, and red indicates heavy ice conditions.
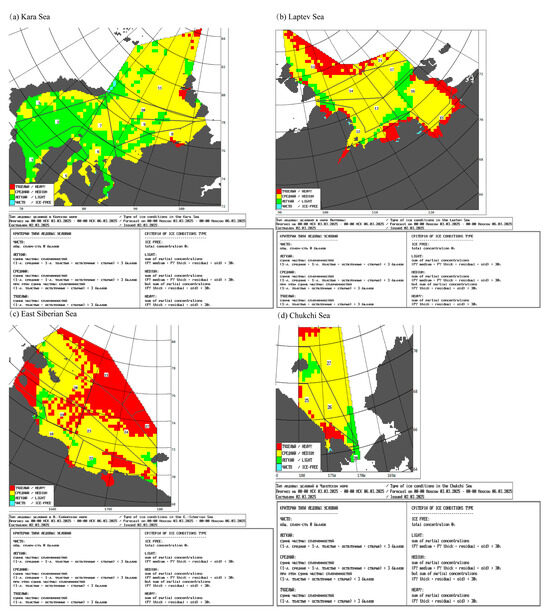
Figure 5.
Predicted sea ice conditions in the Northern Sea Route on 3 March 2025 (Source: https://nsr.rosatom.ru/en/navigational-and-weather-information/types-of-ice-conditions/ accessed on 3 March 2025).
3. Methodology
3.1. POLARIS Methodology
The core of the POLARIS methodology lies in assessing ice-related risks by combining the vessel ice-class with its risk index values (RIVs), then using the RIO value to guide decisions on whether navigation in polar waters is allowed or if it should be restricted [13]. The workflow of the POLARIS methodology is shown in Figure 6.
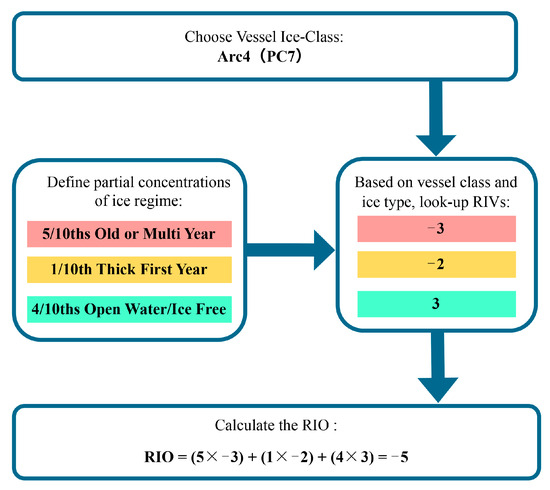
Figure 6.
Calculation flowchart of the POLARIS methodology, using an Arc4 ice-class vessel as an example.
3.1.1. Risk Index Values
RIVs are assigned to the ship, based on ice class and ice types. The RIVs may be used to evaluate the limitations of a ship operating in an ice regime, using input from either historical or current ice charts for voyage planning or in real time from the bridge of the ship [13]. Given that the ice class range of the vessels in this study spans from Arc4 to Arc9, Table 2 presents the corresponding ice class equivalencies between the RMRS and the International Association of Classification Societies (IACS), along with the associated RIVs [13,22].
Table 2.
Risk index values for the vessels in this study.
3.1.2. Risk Index Outcome
The RIO is determined by a summation of the RIVs for each ice type present in the ice regime, multiplied by its concentration (expressed in tenths) [18]:
where Ci represents the concentrations (in tenths) of ice types within the ice regime, and RIVi refers to the corresponding risk index value for each ice type.
3.1.3. Risk Index Outcome Criteria
POLARIS addresses three levels of operation: RIO ≥ 0 indicates normal operation; −10 ≤ RIO < 0 represents an elevated operational risk; RIO < −10 requires operations to be subject to special consideration [13,18].
3.2. NSR Criteria
The NSRA has explicitly defined the admission criteria for vessels of different ice classes under varying navigation conditions, taking into account the navigation periods and sea ice conditions across the 28 NSR districts designated by the NSR [12]. The annual admission criteria for Arc4 to Arc9 ice-class vessels are shown in Table 3. The workflow of the NSR criteria is shown in Figure 7.
Table 3.
For ships with ice classes Arc4–Arc9.
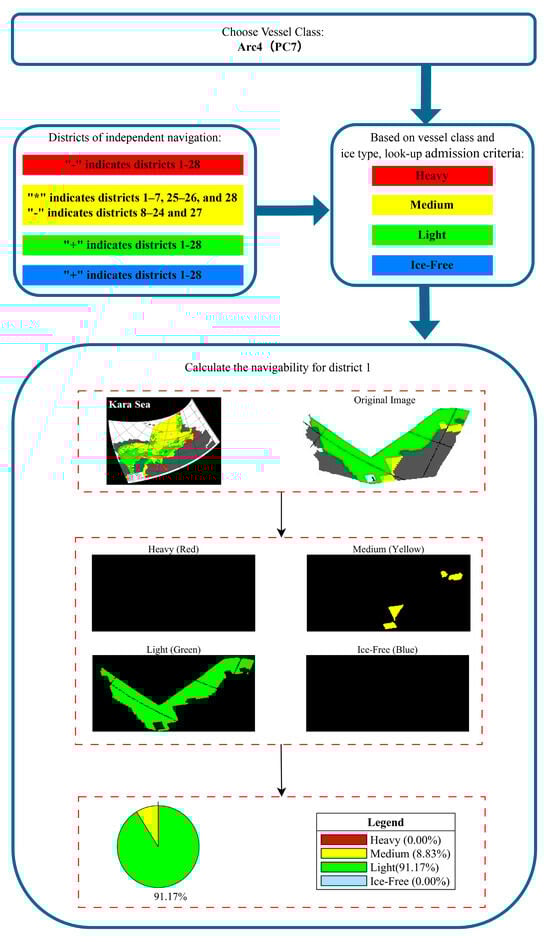
Figure 7.
Calculation flowchart of the NSR methodology, using an Arc4 ice-class vessel in district 1 as an example.
3.3. Data Processing Method
This study mainly consists of the following four steps: (1) data preprocessing; (2) calculation of the RIO; (3) determination of navigability; and (4) analysis of navigability outcomes.
- (1)
- Data Preprocessing
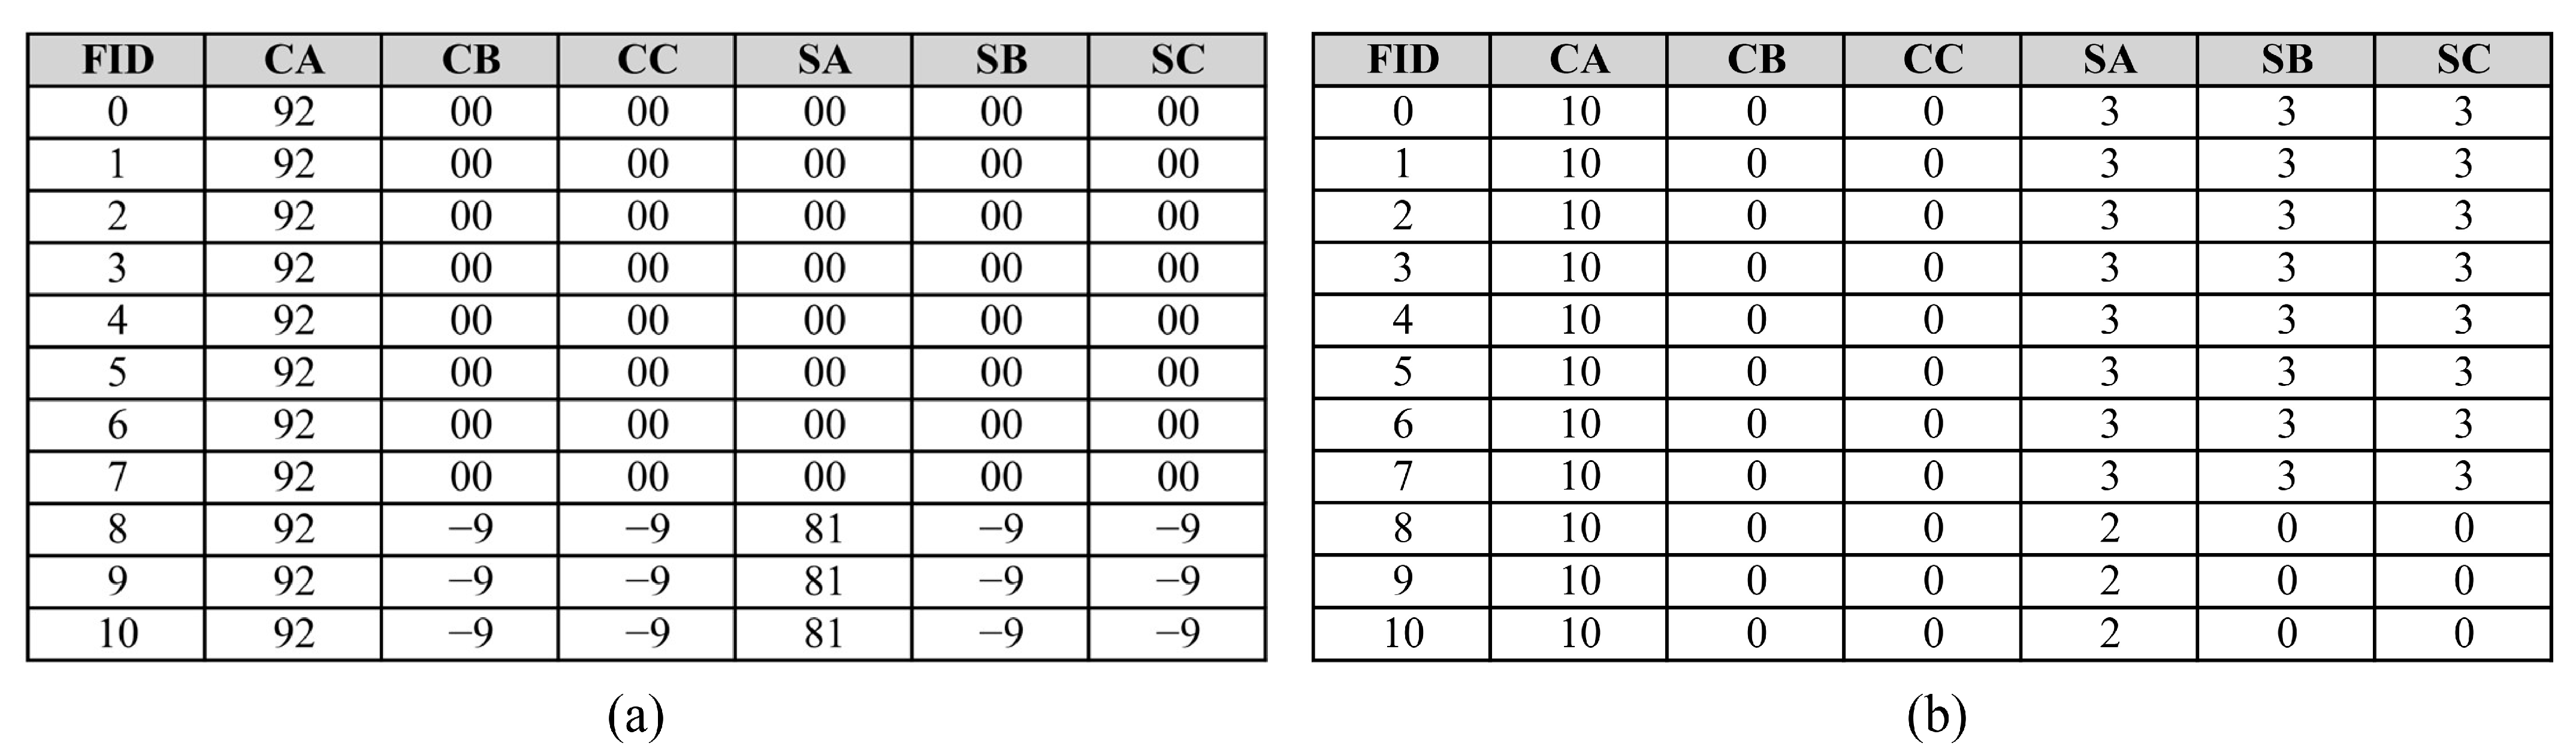
The data used in this study primarily consist of two components: one is Arctic sea ice data, provided by the NSIDC; the other is forecast data on the types of ice conditions in the NSR, obtained from the NSRA. Data preprocessing primarily involves handling outliers or missing values and conducting. Due to observational limitations, the Arctic sea ice data contain special values, such as “-9”, which denotes “not used” or “not applicable.” These special values must be addressed before the data can be utilized. The forecast data on ice conditions in the Northern Sea Route (NSR) are in PNG image format. To obtain a data point’s spatial reference, it must be georeferenced. Figure 8 presents a comparison of the Arctic sea ice data before and after processing, while Figure 9 presents the processed ice forecast data for the Kara Sea region of the NSR.
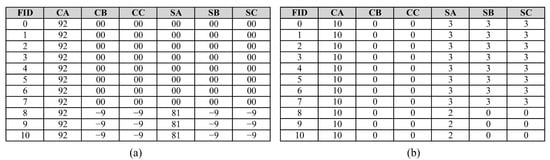
Figure 8.
Comparison of Arctic sea ice data for the first week of September 2024: (a) original data; (b) preprocessed data.
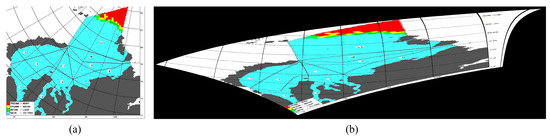
Figure 9.
Comparison of ice conditions in the Kara Sea region of the NSR during the first week of September 2024: (a) raw data; (b) georeferenced data.
- (2)
- RIO Calculation
The RIO calculation primarily focuses on Arctic sea ice data. To facilitate a comparative analysis of navigability outcomes, RIO values must be obtained for all 27 districts along the NSR. This involves two main tasks: first, acquiring the vector data for the 27 districts; and second, calculating the RIO values based on Arctic sea ice conditions. Through spatial overlay operations, the RIO for each district can be derived. As this study considers six ice-class vessels, ranging from Arc4 to Arc9, it is necessary to calculate the RIO for all six classes in each district to support the navigability outcome assessments.
- (3)
- Navigability Determination
This study employs the following methods to assess the navigability outcomes of each district. According to the POLARIS methodology, if an area within a district where the RIO is greater than or equal to 95% of the total area of that district is present, the district is deemed navigable; otherwise, it is deemed unnavigable [18]. Using the NSR criteria, first, one must identify the proportion of each district’s area falling into the four categories of ice conditions: “heavy ice conditions”, “medium ice conditions”, “light ice conditions”, and “ice-free conditions.” Then, based on the NSR criteria, one must determine which of these categories is considered navigable for ships of different ice classes. If the total proportion of the area under navigable ice conditions reaches or exceeds 95%, the district is deemed navigable; otherwise, it is considered unnavigable [31].
- (4)
- Navigability Analysis
In this study, two navigability assessment methods are compared and analyzed from two main perspectives: (1) comparing the differences in and consistency of navigability outcomes for different ice-class vessels operating independently in the same district; and (2) the differences in and consistency of navigability outcomes for vessels of the same ice class, operating independently in different districts.
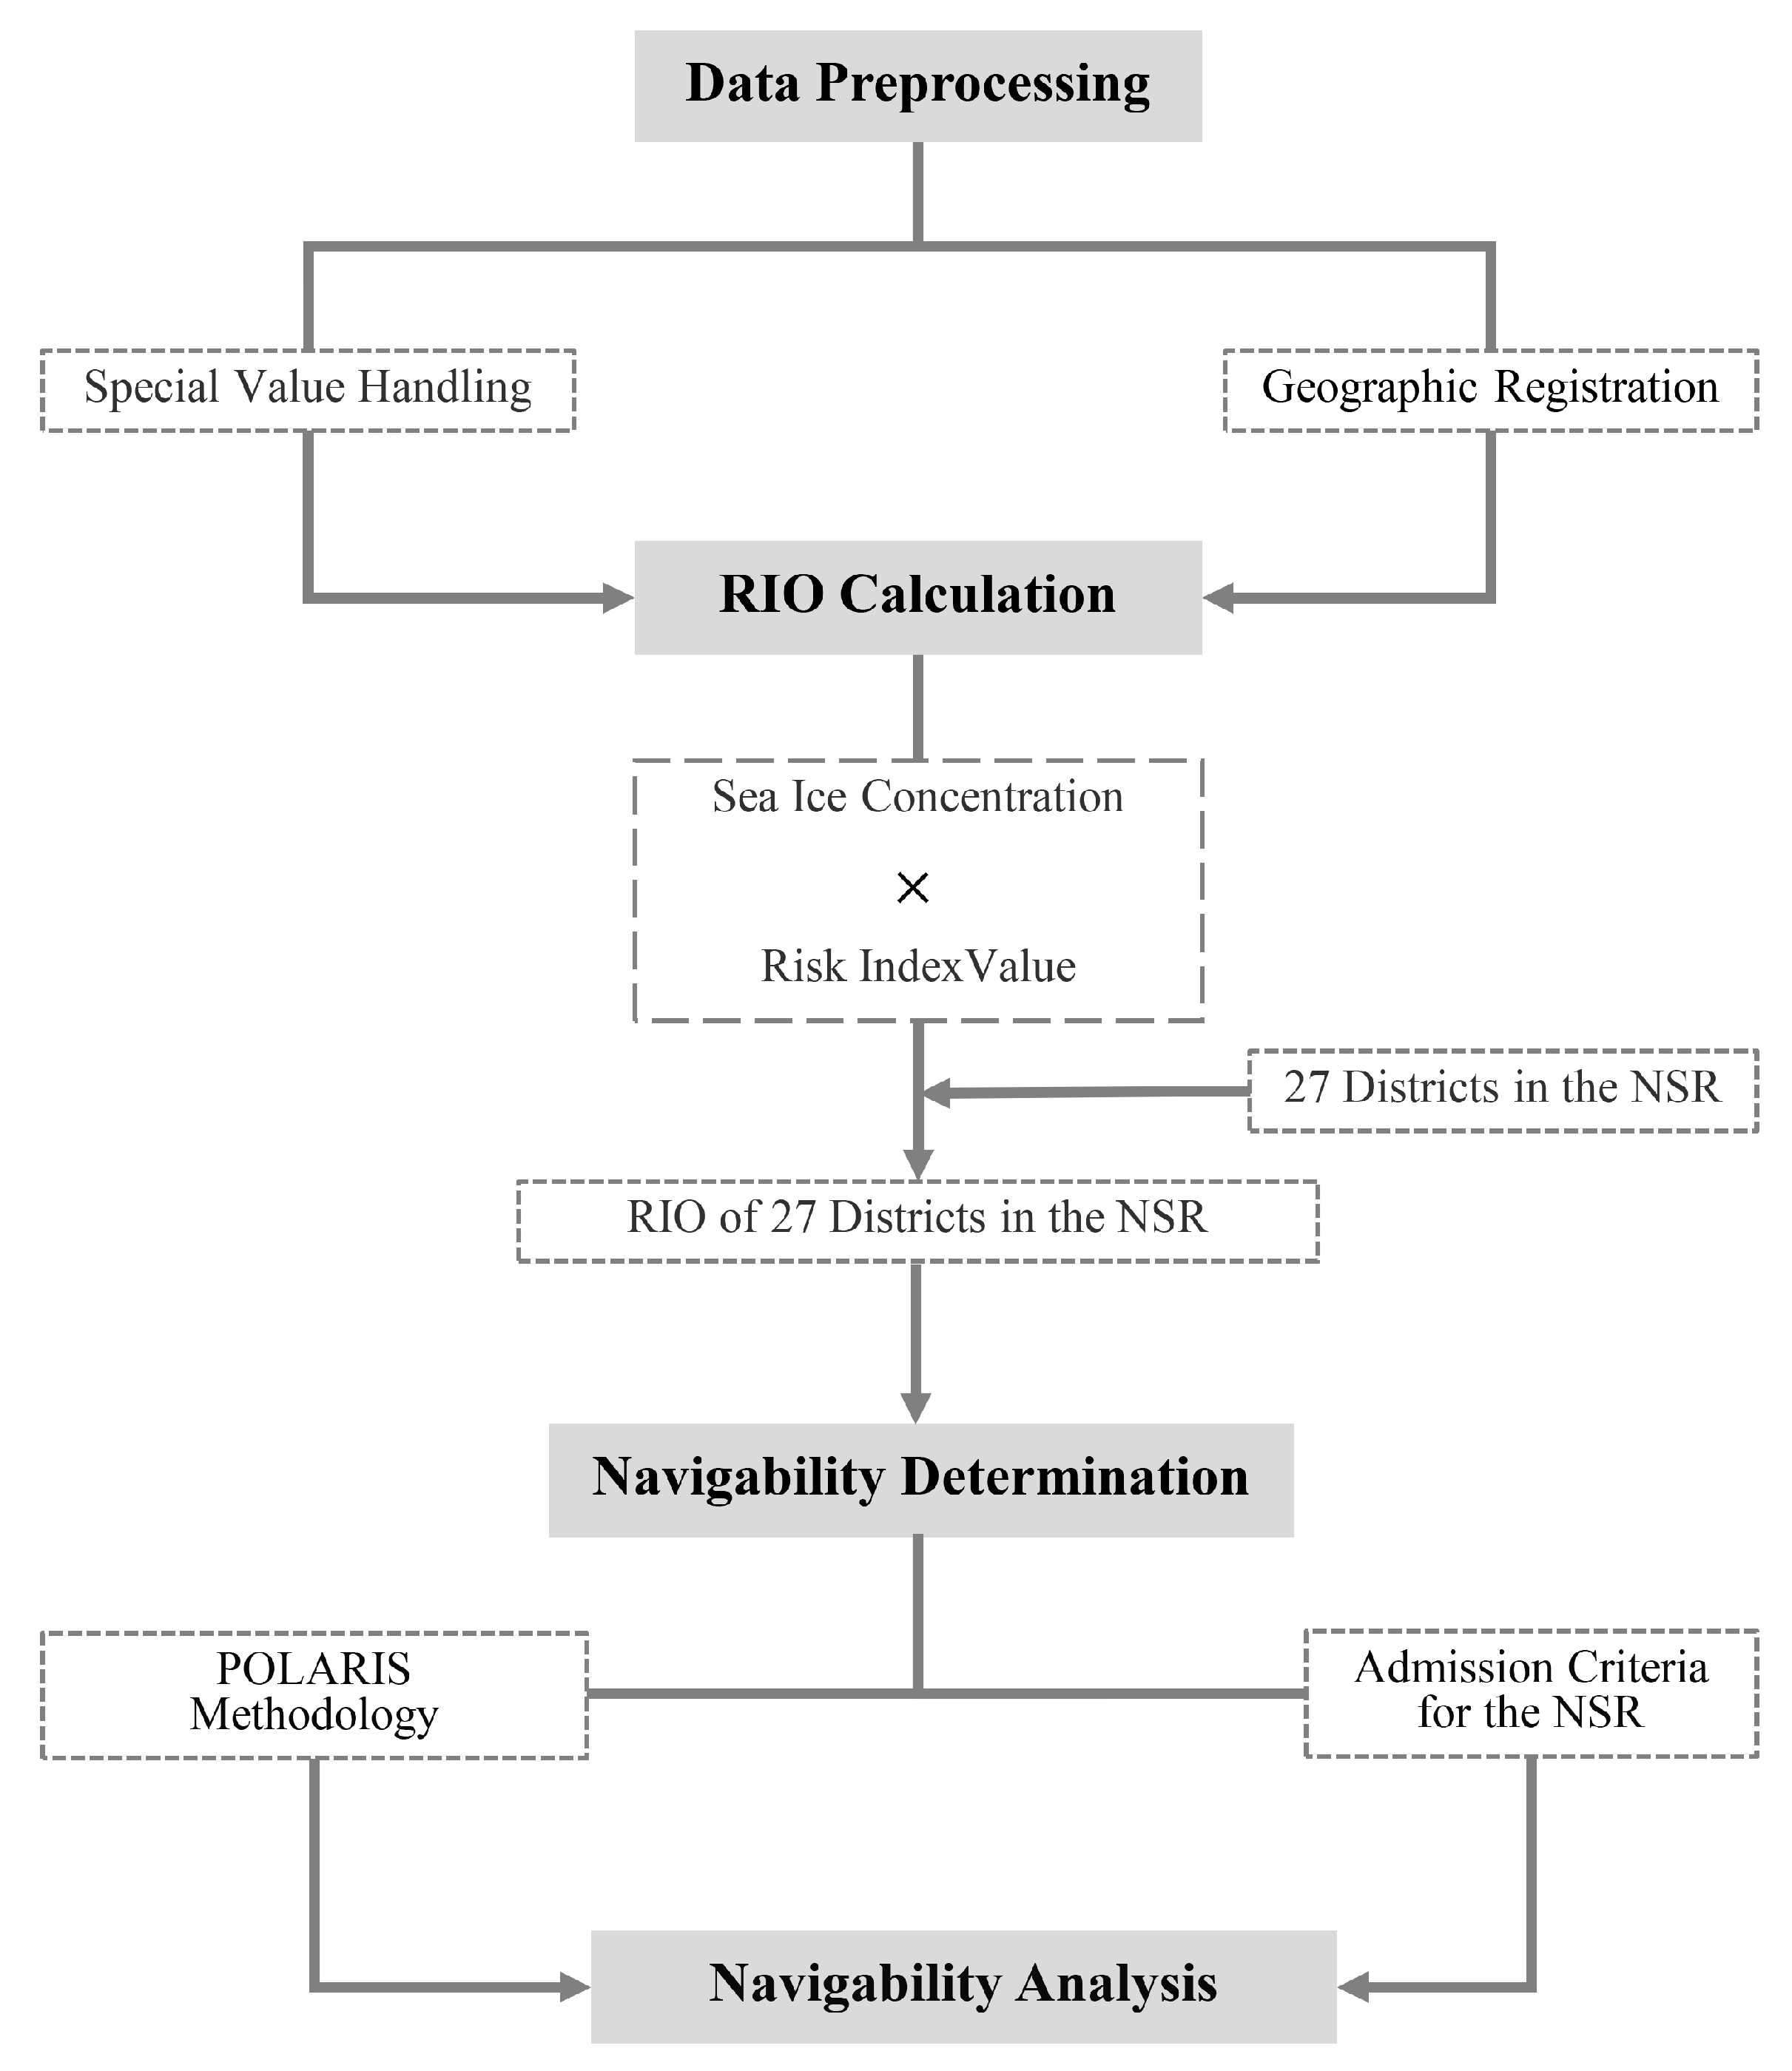
The experimental procedure used in this study is shown in Figure 10.
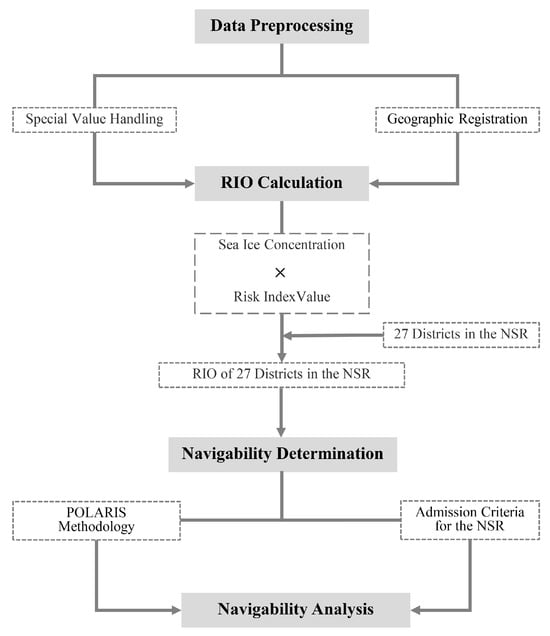
Figure 10.
Technical roadmap of the procedure used in this study.
4. Results
Two methods were employed to determine the navigability outcomes in this study, as described in detail in Section 3.3. The navigability outcomes are represented by binary values, where “0” indicates that the district is unnavigable, and “1” indicates that it is navigable. To more clearly compare the differences and consistencies between the two methods in terms of navigability outcomes, this study introduces the concept of the "navigability rate," which refers to the ratio of the number of navigable districts to the total number of districts. Thus, the weekly navigability rate refers to the ratio of the number of navigable districts to the total number of districts in a given week, while the monthly navigability rate refers to the ratio of the total number of navigable districts across all weeks of a given month to the total number of district–week combinations during that month. The correspondence between districts and sea areas within the NSR is provided in Section 2.1.
4.1. Arc4 Ice-Class Vessels
Figure 11 presents the navigability outcomes for Arc4 ice-class vessels in each district. The horizontal axis represents the number of weeks in each month for both the P method (POLARIS methodology) and the R method (NSR criteria); the vertical axis corresponds to the NSR districts. For each of the weeks shown in Figure 11, Table 4 summarizes the navigability rates of Arc4 ice-class vessels in NSR waters under both the P and R methods.

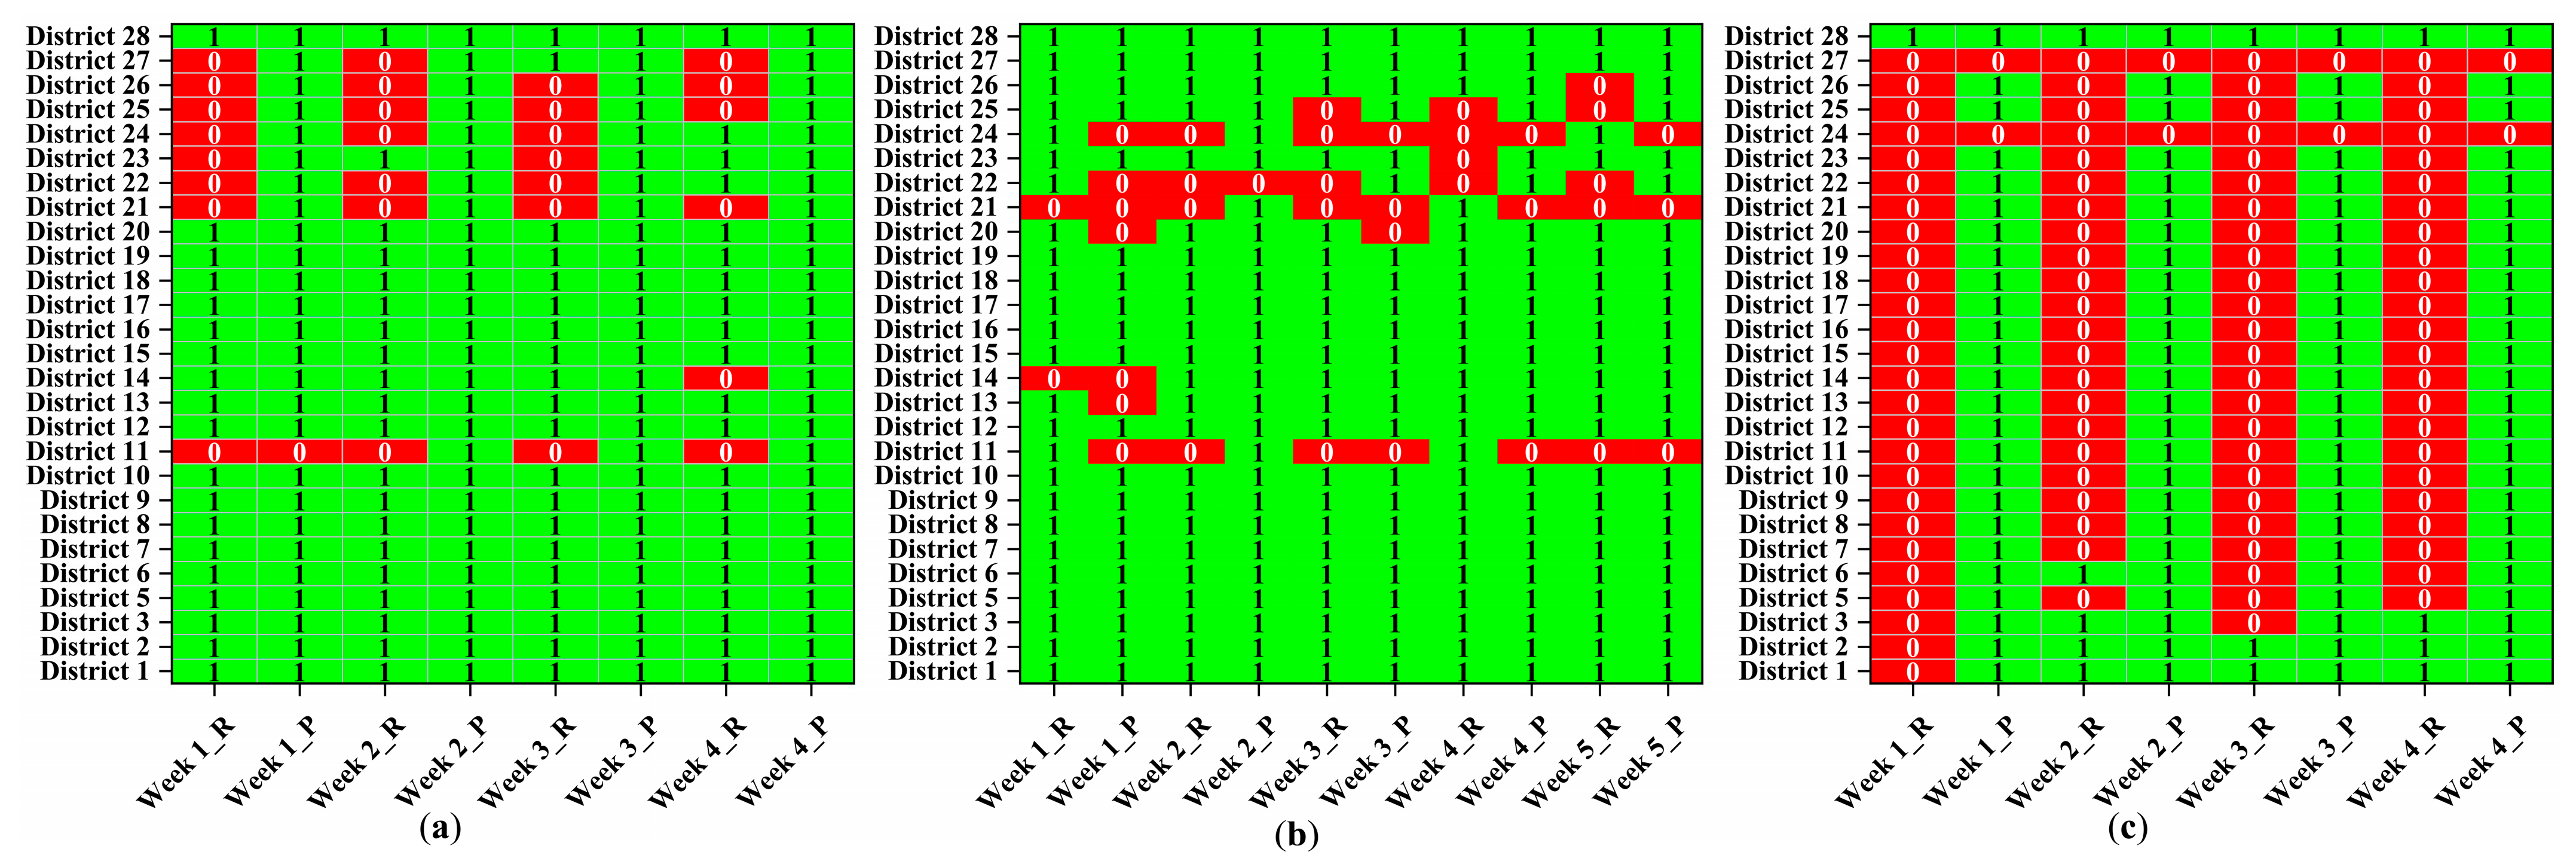
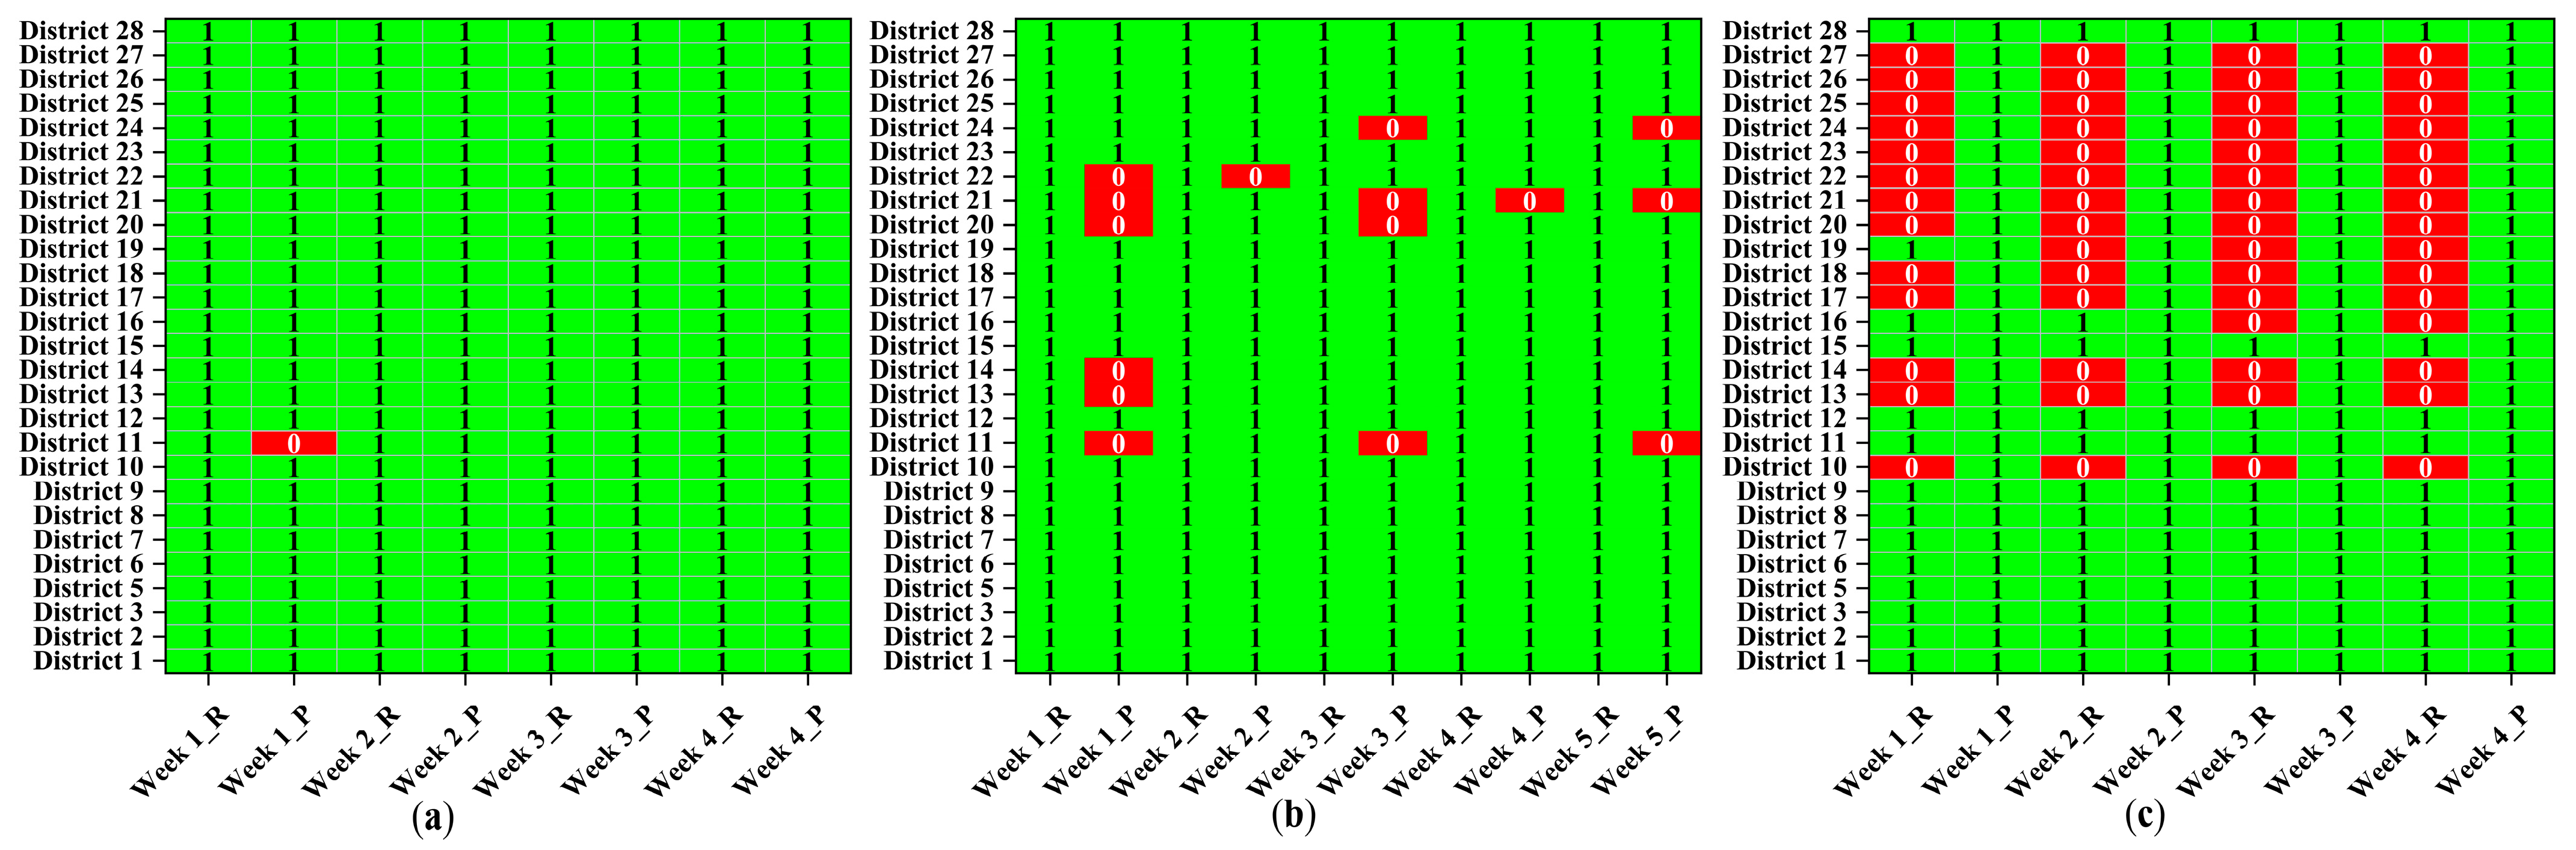
Figure 11.
Navigability outcomes of Arc4 ice-class vessels across the NSR for: (a) September 2024, (b) November 2024, and (c) March 2025.
Table 4.
Weekly navigability rates of Arc4 ice-class vessels in NSR waters.
Figure 11 shows that, during different navigational periods, the two methods yield markedly different navigability outcomes for the NSR. According to the NSR criteria, in September, when ice conditions are relatively favorable, Arc4 ice-class ships have relatively poor navigability in the East Siberian Sea and Chukchi Sea (Figure 11a). In March, when ice conditions are harsher, Arc4 ice-class vessels are almost entirely unnavigable in the waters of the NSR (Figure 11c); in November, when ice conditions are in a transitional phase between favorable and severe, Arc4 ice-class ships have poor navigability in the East Siberian Sea (Figure 11b). According to the POLARIS methodology, Arc4 ice-class vessels exhibit relatively poor navigability in the Kara Sea and Laptev Sea junction during September, when ice conditions are more favorable compared to those in November and March. In November and March, when ice conditions are transitional and unfavorable, respectively, Arc4 ice-class vessels primarily show poor navigability in the East Siberian Sea.
As shown in Table 4, the monthly navigability rates of Arc4 ice-class vessels in the NSR, calculated based on the NSR criteria and the POLARIS methodology, exhibit notable variation across different months. In September 2024, the rates were 74.08% (NSR criteria) and 98.33% (POLARIS methodology), indicating a substantial navigability outcome difference. In November 2024, the rates were 85.19% and 85.93%, showing minimal variation between the two methods. By contrast, in March 2025, the rates were 12.04% and 87.04%, highlighting a pronounced disparity in navigability outcomes.
It can be observed that in September, when ice conditions are favorable, and in March, when conditions are unfavorable, the two methods yield markedly different navigability outcomes for Arc4 ice-class vessels in the NSR, with the disparity being most pronounced in March. In contrast, in November, when ice conditions are transitional, the outcomes from both methods tend to converge.
4.2. Arc5 Ice-Class Vessels
Figure 12 presents the navigability outcomes for Arc5 ice-class vessels in each district. The horizontal axis represents the number of weeks in each month for both the P method (POLARIS methodology) and the R method (NSR criteria); the vertical axis corresponds to the NSR districts. For each of the weeks shown in Figure 12, Table 5 summarizes the navigability rates of Arc5 ice-class vessels in NSR waters under both the P and R methods.
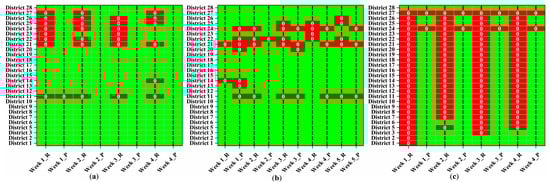
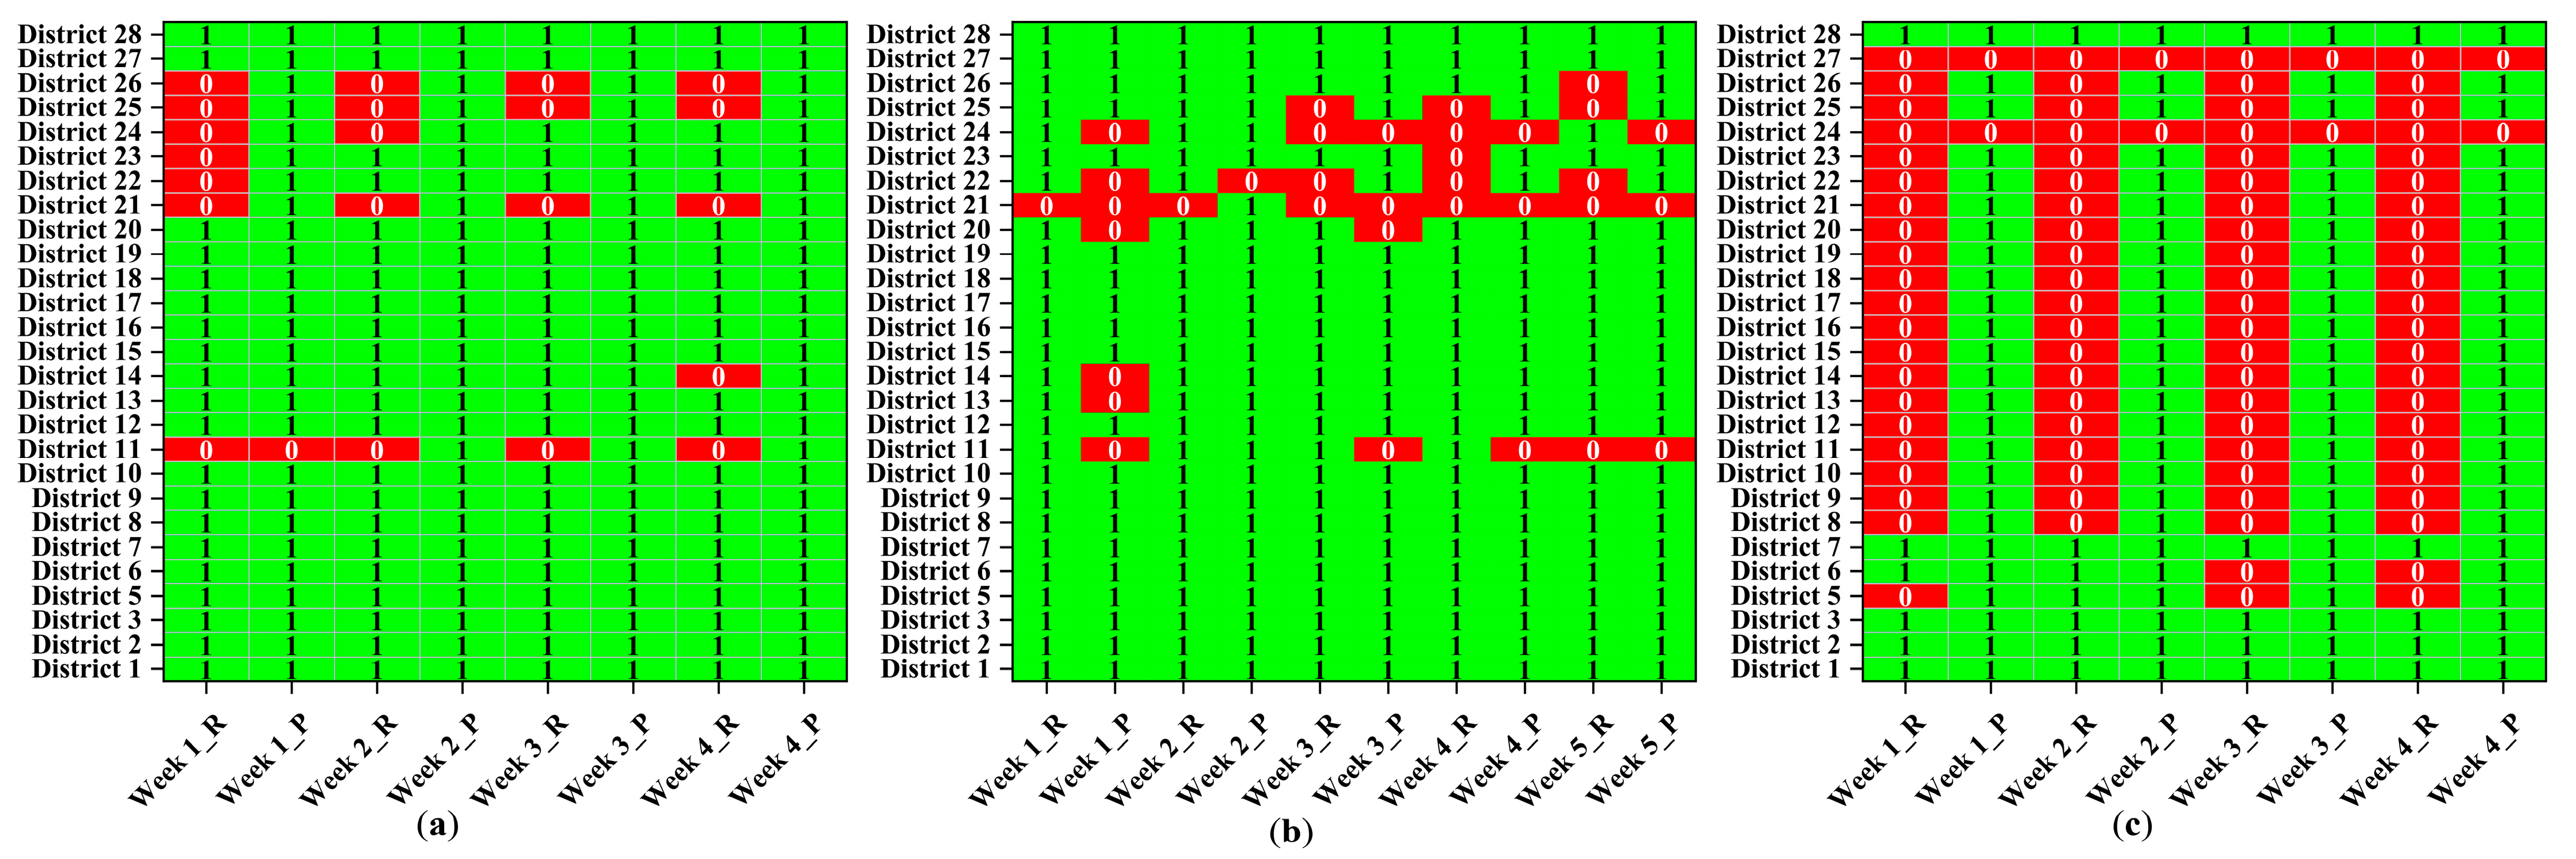
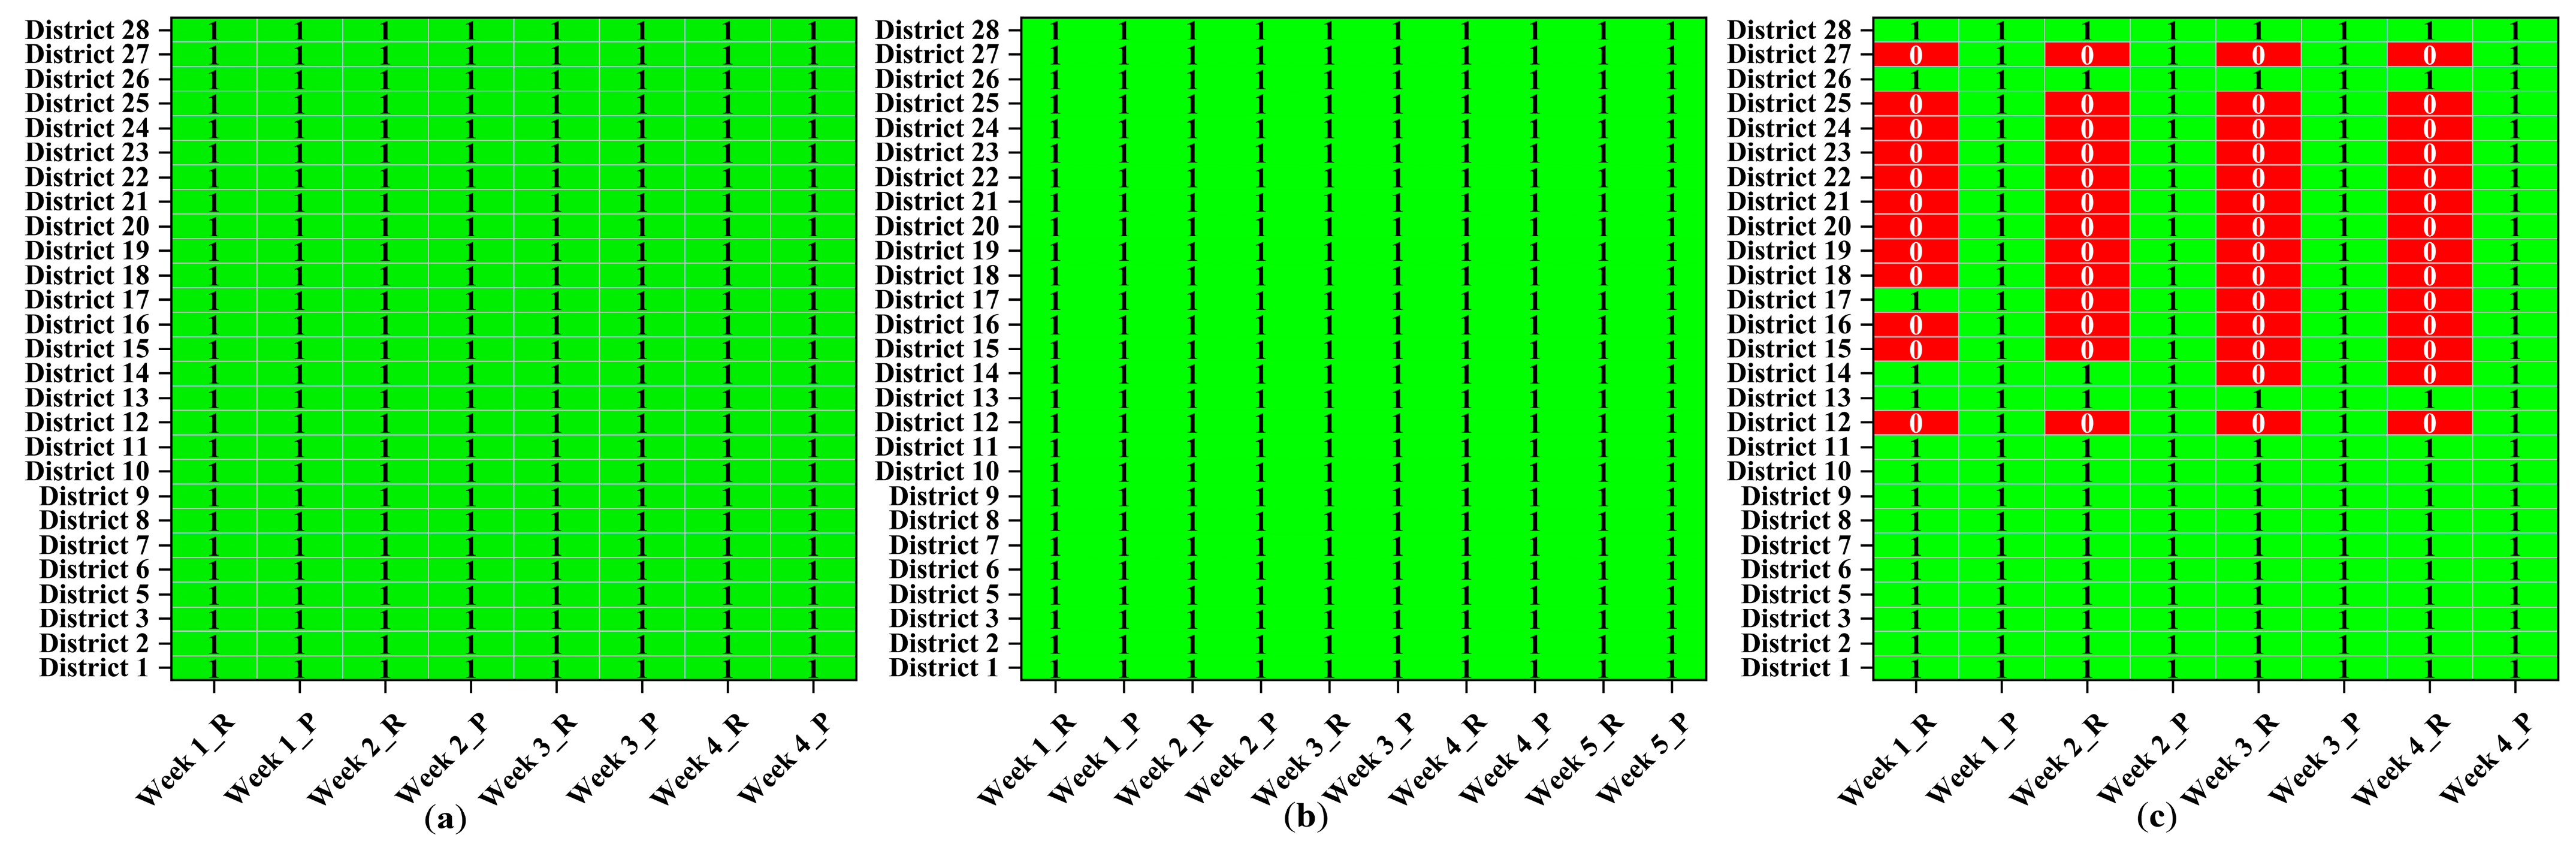
Figure 12.
Navigability outcomes of Arc5 ice-class vessels across the NSR for: (a) September 2024, (b) November 2024, and (c) March 2025.
Table 5.
Weekly navigability rates of Arc5 ice-class vessels in NSR waters.
As shown in Figure 12, there are significant differences in the navigability outcomes for the NSR under different navigational periods between the two methods. According to the NSR criteria, it can be observed that in September, when ice conditions are favorable, Arc5 ice-class vessels exhibit poor navigability in the East Siberian Sea and Chukchi Sea (Figure 12a); in March, when ice conditions are unfavorable, Arc5 ice-class vessels are nearly unnavigable in the NSR (Figure 12c); in November, when ice conditions are transitional, Arc5 ice-class vessels have poor navigability in the East Siberian Sea (Figure 12b). According to the POLARIS methodology, it can be observed that in September, when ice conditions are favorable, Arc5 ice-class vessels have poor navigability at the junction of the Kara Sea and the Laptev Sea; in November, when ice conditions are transitional, and in March, when ice conditions are unfavorable, Arc5 ice-class vessels have poor navigability in the East Siberian Sea.
As shown in Table 5, the monthly navigability rates of Arc5 ice-class vessels in the NSR, based on the NSR criteria and the POLARIS methodology, vary across different months. In September 2024, the rates were 74.08% (NSR criteria) and 98.33% (POLARIS methodology), indicating a substantial difference. In November 2024, the rates were 85.19% and 85.93%, showing only a slight variation. In March 2025, the rates were 12.04% and 92.59%, reflecting a significant disparity in navigability outcomes.
It can be observed that in September, when ice conditions are favorable, and in March, when conditions are unfavorable, the two methods yield significantly different navigability outcomes for Arc5 ice-class vessels in the NSR, with the disparity being most pronounced in March. In contrast, in November, when ice conditions are transitional, the navigability outcomes from both methods tend to be consistent.
4.3. Arc6 Ice-Class Vessels
Figure 13 presents the navigability outcomes for Arc6 ice-class vessels in each district. The horizontal axis represents the number of weeks in each month used for both the P method (POLARIS methodology) and the R method (NSR criteria); the vertical axis corresponds to the NSR districts. For each week shown in Figure 13, Table 6 summarizes the navigability rates of Arc6 ice-class vessels in NSR waters under both the P and R methods.
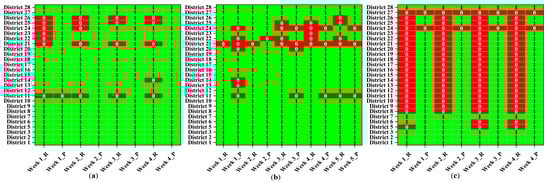
Figure 13.
Navigability outcomes of Arc6 ice-class vessels across the NSR for: (a) September 2024, (b) November 2024, and (c) March 2025.
Table 6.
Weekly navigability rates of Arc6 ice-class vessels in NSR waters.
As shown in Figure 13, there are significant differences between the two methods in terms of the navigability outcomes for the NSR under different navigational periods. According to the NSR criteria, it can be observed that in September, when ice conditions are favorable, Arc6 ice-class vessels exhibit poor navigability in the East Siberian Sea and Chukchi Sea (Figure 13a); in March, when ice conditions are unfavorable, Arc6 ice-class vessels are nearly unnavigable in the NSR (Figure 13c); in November, when ice conditions are transitional, Arc6 ice-class vessels have poor navigability in the East Siberian Sea (Figure 13b). Using the POLARIS methodology to study the navigability of the NSR, it can be observed that in September, when ice conditions are favorable, Arc6 ice-class vessels have poor navigability at the junction of the Kara Sea and the Laptev Sea, in November, when ice conditions are transitional, and in March, when ice conditions are unfavorable, Arc6 ice-class vessels have poor navigability in the East Siberian Sea.
As shown in Table 6, the monthly navigability rates of Arc5 ice-class vessels in the NSR, based on the NSR criteria and the POLARIS methodology, vary across different months. In September 2024, the rates were 80.56% (NSR criteria) and 99.08% (POLARIS methodology), indicating a substantial difference. In November 2024, the rates were 88.15% and 86.67%, showing only a minor variation. In March 2025, the rates were 21.30% and 92.59%, reflecting a significant disparity.
It can be observed that in September, when ice conditions are favorable, and in March, when they are unfavorable, the two methods yield significantly different navigability outcomes for Arc6 ice-class vessels in the NSR, with the disparity being most pronounced in March. In contrast, in November, when ice conditions are transitional, the outcomes of the two methods tend to converge.
4.4. Arc7 Ice-Class Vessels
Figure 14 presents the navigability outcomes for Arc7 ice-class vessels in each district. The horizontal axis represents the number of weeks in each month used for both the P method (POLARIS methodology) and the R method (NSR criteria); the vertical axis corresponds to the NSR districts. For each week shown in Figure 14, Table 7 summarizes the navigability rates of Arc7 ice-class vessels in NSR waters under both the P and R methods.
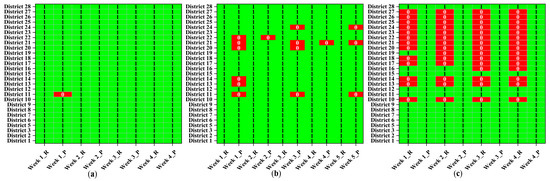
Figure 14.
Navigability outcomes of Arc7 ice-class vessels across the NSR for: (a) September 2024, (b) November 2024, and (c) March 2025.
Table 7.
Weekly navigability rates of Arc7 ice-class vessels in NSR waters.
As shown in Figure 14, the two methods produce significantly different navigability outcomes for the NSR across different navigational periods. According to the NSR criteria, in September, when ice conditions are favorable, Arc7 ice-class vessels can navigate all NSR waters (Figure 14a). In November, when ice conditions are transitional, they also maintain full navigability (Figure 14b). In March, despite unfavorable ice conditions, these vessels remain navigable in the Laptev Sea, East Siberian Sea, and Chukchi Sea (Figure 14c). In contrast, according to the POLARIS methodology, Arc7 vessels exhibit poor navigability at the junction of the Kara Sea and the Laptev Sea during the first week of September, while navigability is maintained in the remaining weeks. In November, reduced navigability is observed in the East Siberian Sea. In March, despite adverse ice conditions, Arc7 vessels are navigable throughout the NSR.
As shown in Table 7, the monthly navigability rates of Arc5 ice-class vessels in the NSR, based on the NSR criteria and the POLARIS methodology, vary notably across different months. In September 2024, the rates were 100% (NSR criteria) and 99.08% (POLARIS methodology), showing only a minor difference. In November 2024, the rates were 100% and 88.89%, indicating a significant disparity. In March 2025, the rates were 51.85% and 100%, reflecting a substantial difference in navigability outcomes.
It can be observed that in November, when ice conditions are transitional, and in March, when they are severe, the two methods yield significantly different navigability outcomes, with the disparity most pronounced in March. In contrast, in September, when ice conditions are favorable, the results from both methods tend to converge.
4.5. Arc8 Ice-Class Vessels
Figure 15 presents the navigability outcomes for Arc8 ice-class vessels in each district. The horizontal axis represents the number of weeks in each month for both the P method (POLARIS methodology) and the R method (NSR criteria); the vertical axis corresponds to the NSR districts. For each week shown in Figure 15, Table 8 summarizes the navigability rates of Arc8 ice-class vessels in NSR waters under both the P and R methods.
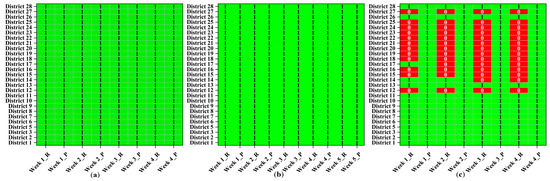
Figure 15.
Navigability outcomes of Arc8 ice-class vessels across the NSR for: (a) September 2024, (b) November 2024, and (c) March 2025.
Table 8.
Weekly navigability rates of Arc8 ice-class vessels in NSR waters.
As shown in Figure 15, the two methods produce significantly different navigability outcomes for the NSR across different navigational periods. Under the NSR criteria, Arc7 ice-class vessels can navigate all NSR waters in September, when ice conditions are favorable (Figure 15a). In November, when ice conditions are transitional, they remain navigable throughout the NSR (Figure 15b). However, in March, despite unfavorable conditions, they are only navigable in the Laptev Sea, the East Siberian Sea, and the Chukchi Sea (Figure 15c). In contrast, under the POLARIS methodology, Arc7 vessels are navigable across the entire NSR in September, November, and March, regardless of the variations in ice conditions.
As shown in Table 8, the monthly navigability rates of Arc5 ice-class vessels in the NSR, based on the NSR criteria and the POLARIS methodology, vary notably across different months. In September 2024, both methods yielded a navigability rate of 100%, indicating consistent results. In November 2024, the rates again remained consistent at 100%. However, in March 2025, a significant difference is observed, with the NSR criteria yielding 51.85% and the POLARIS methodology showing 100%.
It can be observed that in March, when ice conditions are severe, the two methods produce significantly different navigability outcomes. In contrast, in September and November, when ice conditions are favorable and transitional, respectively, the outcomes are largely consistent between the two methods.
4.6. Arc9 Ice-Class Vessels
Figure 16 presents the navigability outcomes for Arc9 ice-class vessels in each district. The horizontal axis represents the number of weeks in each month for both the P method (POLARIS methodology) and the R method (NSR criteria); the vertical axis corresponds to the NSR districts. For each week shown in Figure 16, Table 9 shows the navigability rates of Arc9 ice-class vessels in NSR waters under both the P and R methods.
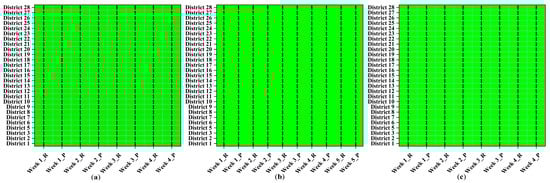
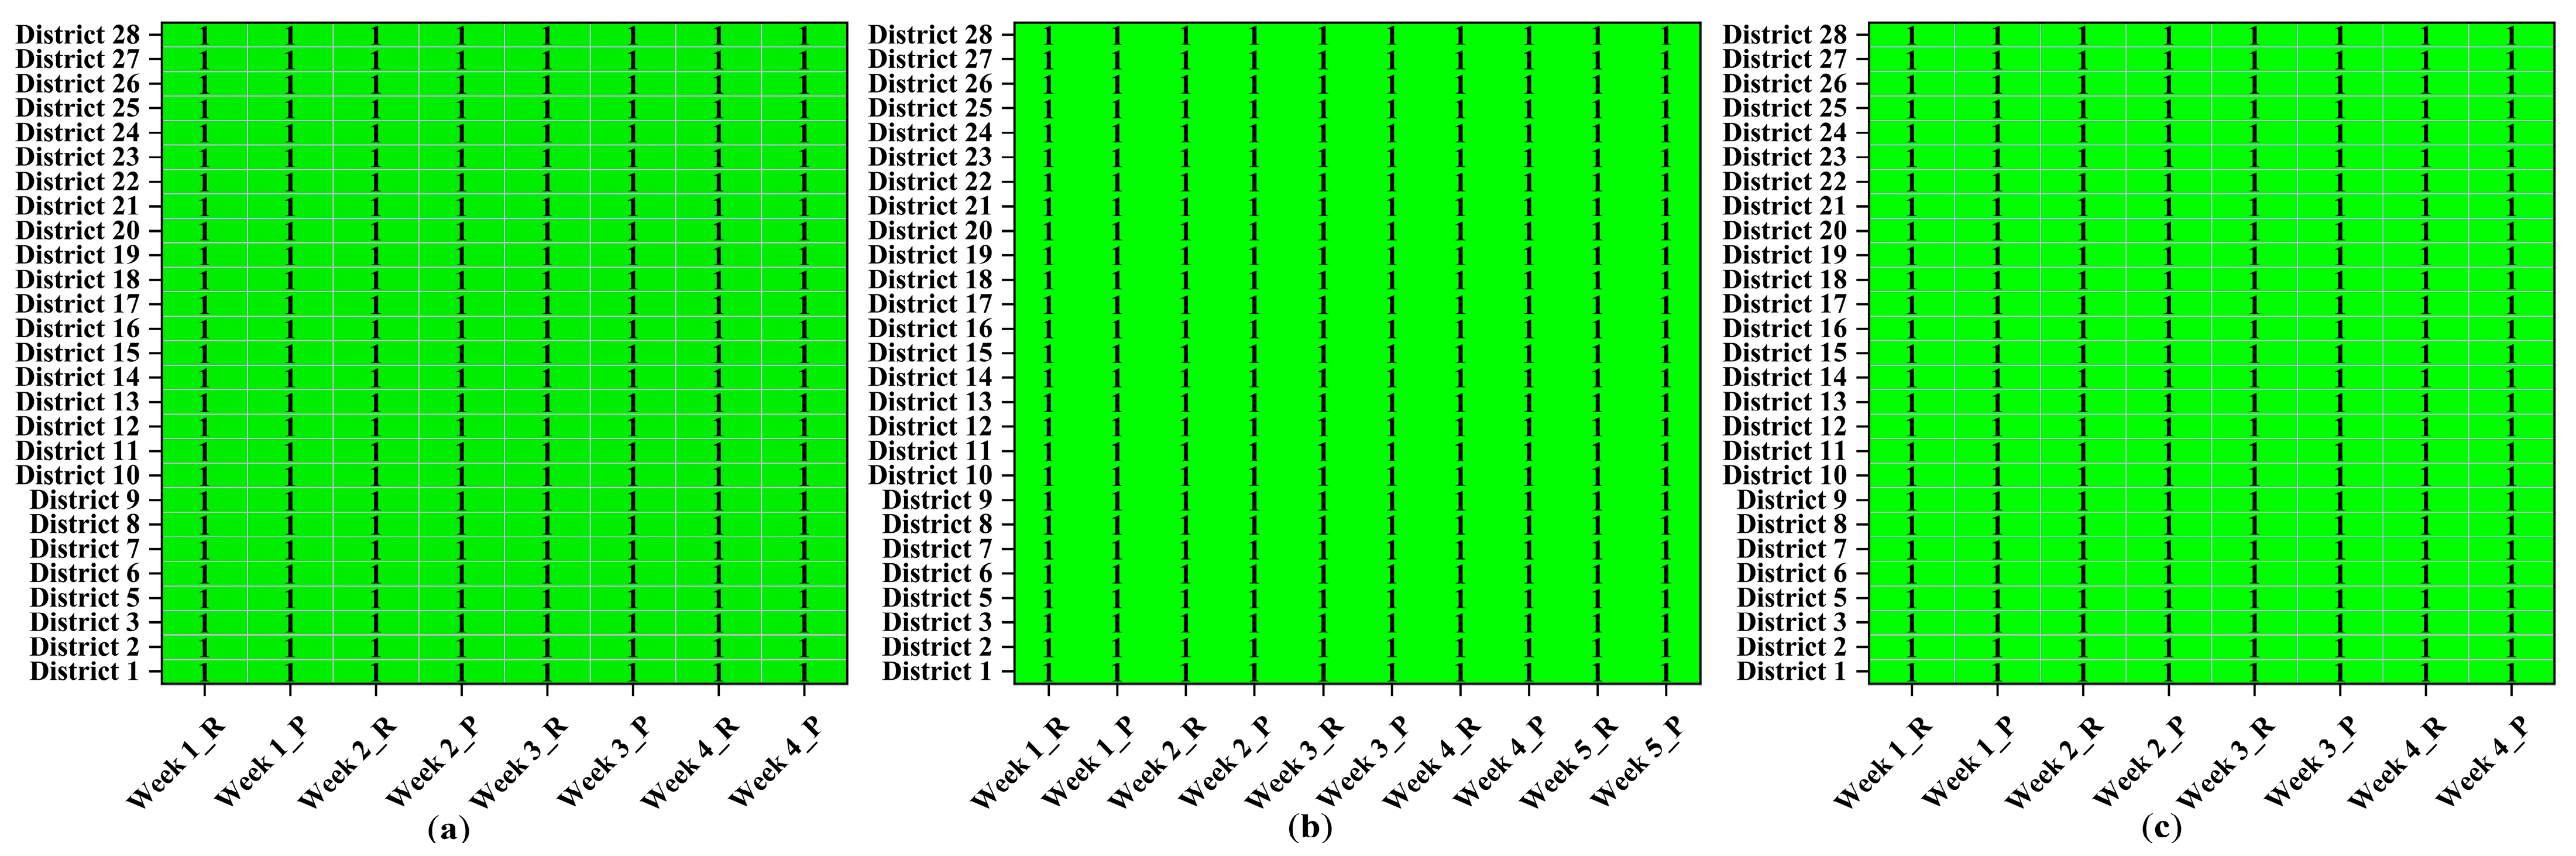
Figure 16.
Navigability outcomes of Arc9 ice-class vessels across the NSR for: (a) September 2024, (b) November 2024, and (c) March 2025.
Table 9.
Weekly navigability rates of Arc9 ice-class vessels in NSR waters.
4.7. Comparison of Navigability Outcomes Between the Two Methods
As shown in Figure 11, Figure 12, Figure 13, Figure 14, Figure 15, Figure 16 and Figure 17, the POLARIS methodology and the NSR criteria exhibit both consistencies and differences in navigability outcomes for the NSR across different ice classes and time periods. From a temporal perspective, the navigability outcomes demonstrate the following characteristics. For Arc9 ice-class vessels, the navigability outcomes in NSR waters are completely consistent between the two methods for September 2024, November 2024, and March 2025. For Arc8 vessels, the navigability outcomes are generally consistent in September and November, when ice conditions are favorable. For Arc7 vessels, the two methods yield relatively consistent navigability outcomes in September, when ice conditions are optimal. For Arc6, Arc5, and Arc4 vessels, relatively consistent outcomes are observed for November under transitional ice conditions.
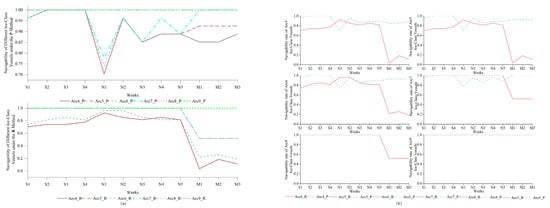
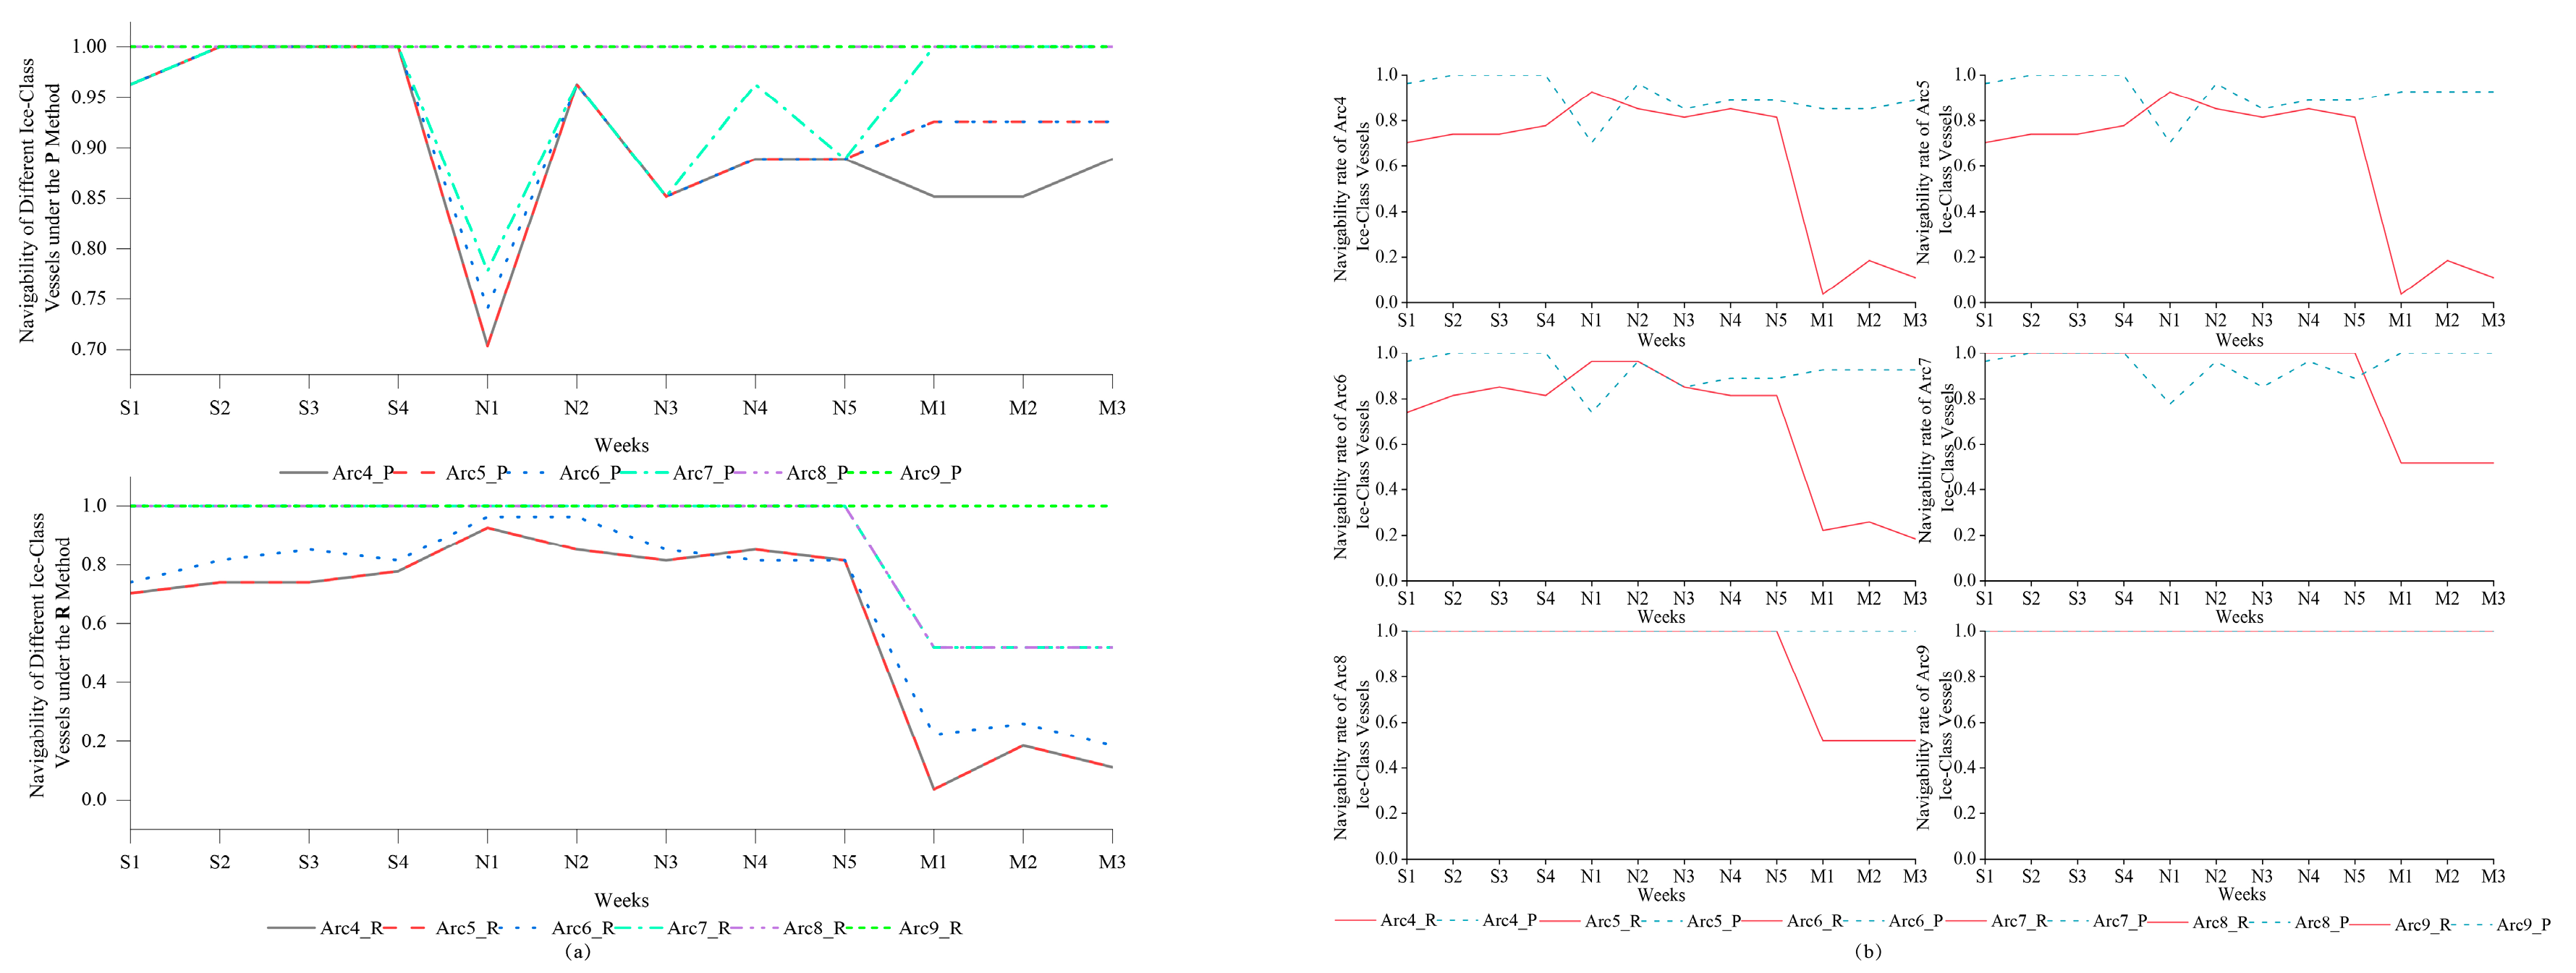
Figure 17.
Comparative analysis of the weekly navigability rates for Arc4 to Arc9 ice-class vessels. (a) Weekly navigability rate curves for different ice-class vessels across 27 NSR districts, illustrating the overall trends in navigability results from the POLARIS methodology and the NSR criteria for Arc4 to Arc9 ice-class vessels; (b) comparison of navigability rates for each ice-class vessel, highlighting the differences in navigability outcomes for Arc4 to Arc9 ice-class vessels between the POLARIS methodology and the NSR criteria. Note: S denotes September, with S1 indicating the first week of September; N denotes November, with N1 indicating the first week of November; M denotes March, with M1 indicating the first week of March. P represents the POLARIS methodology, and R represents the NSR criteria. Arc4_P indicates the navigability rate of Arc4 ice-class vessels obtained using the POLARIS methodology, while Arc4_R indicates the navigability rate obtained using the NSR criteria.
From a spatial perspective, the navigability outcomes exhibit the following characteristics:
- (1)
- In September, when ice conditions are optimal:
For Arc9, Arc8, and Arc7 ice-class vessels, the two methods yield largely consistent navigability outcomes across all 27 districts. In contrast, for Arc6 ice-class vessels, discrepancies are observed in districts 11, 14, and 21–26. For Arc5 and Arc4 ice-class vessels, the differences are more pronounced, with inconsistent results appearing in districts 11, 14, and 21–27.
- (2)
- In November, during the ice condition transition period:
For Arc9 and Arc8 ice-class vessels, the two methods yield completely consistent navigability outcomes across all 27 districts. For Arc7 ice-class vessels, inconsistencies are observed in districts 11, 13–14, 20–22, and 24. For Arc6 ice-class vessels, the two methods differ in districts 11, 13–14, and 20–25. For Arc5 and Arc4 ice-class vessels, inconsistent outcomes appear in districts 11, 13, and 20–26.
- (3)
- In March, under the worst ice conditions:
For Arc9 ice-class vessels, the two methods yield completely consistent navigability outcomes across all 27 districts. For Arc8 ice-class vessels, inconsistencies occur in districts 12, 14–25, and 27. For Arc7 ice-class vessels, the two methods differ in districts 10, 13–14, and 16–27. For Arc6 ice-class vessels, inconsistent outcomes are observed in districts 5–6, 8–23, and 25–26. For Arc5 and Arc4 ice-class vessels, discrepancies appear in districts 1–3 and 5–26.
Overall, for Arc9 ice-class vessels, which represent the highest ice class, the navigability outcomes produced by the two methods are fully consistent. For Arc8 and Arc7 ice-class vessels, the navigability outcomes are relatively consistent in September, when ice conditions are optimal. Differences in navigability outcomes across the six ice classes are primarily reflected in the following patterns. In September, inconsistencies between the two methods are mainly observed in districts 11, 14, and 21 to 27. In November, when ice conditions are transitional, inconsistencies are primarily found in districts 11, 13, and 20 to 26. In March, when ice conditions are most severe, discrepancies are widespread, particularly in districts 1 to 3 and 5 to 26.
5. Discussion
5.1. Results Analysis
This study systematically compares the differences and consistencies in navigability outcomes between the POLARIS methodology and the NSR criteria across the 27 districts of NSR waters. The results indicate that the higher the vessel’s ice class, the greater the consistency between the two methods. For Arc4 to Arc6 ice-class vessels, the NSR criteria tend to produce more conservative navigability outcomes compared to the POLARIS methodology. For Arc7 ice-class vessels, the two methods exhibit alternating conservative tendencies across different months. For Arc8 vessels, the navigability outcomes are consistent for September and November 2024, while the NSR criteria are slightly more conservative for March 2025. For Arc9 vessels, the two methods yield consistent outcomes across all three months. Overall, the NSR criteria tend to produce more conservative navigability outcomes under extreme ice conditions.
Ice conditions are a key factor influencing navigation in the NSR. In September 2024, overall sea ice concentration and coverage in the Arctic were significantly below the long-term average for the same period. The Kara Sea, Laptev Sea, and East Siberian Sea all experienced light ice conditions [36,37]. In November 2024, the Arctic sea ice extent declined to the third-lowest level on record for that month, representing a decrease of approximately 9% compared to the 1991–2020 average. Sea ice concentration was below average in the western Kara Sea, while it remained generally above average in the northern Chukchi Sea [38]. In March 2025, ice conditions reached their lowest level for that month in the past 47 years, with light ice conditions prevailing across most NSR waters [39]. In summary, the ice conditions observed during the three selected months were characteristic of a light ice year.
Ma et al. [18] applied the POLARIS methodology to determine the navigable windows for Arc4 and Arc7 ice-class vessels in NSR waters, finding that navigation was feasible in September, November, and the following March under light ice conditions. This is consistent with the navigability outcomes obtained in the present study using the same methodology. The ice condition data used in this study is highly consistent with the forecast data on ice types in the NSR waters, as published by the NSRA. For example, in September 2024, this study identified “ice-free” conditions in the Kara Sea, Laptev Sea, and East Siberian Sea, and “light to medium ice conditions” in the Chukchi Sea, which align with official forecasts [8]. Therefore, the navigability outcomes derived from both the NSR criteria and the POLARIS methodology in this study are supported by a solid practical foundation and reliable ice condition data.
The differences in navigability outcomes between the NSR criteria and the POLARIS methodology primarily arise from the following three factors:
- (1)
- Differences in ice class classification systems. The POLARIS methodology is based on the IACS polar class categories, while the NSR criteria adopt the RMRS Arctic categories, resulting in discrepancies in ice class grading [21,22].
- (2)
- Inconsistent data sources. The POLARIS methodology typically utilizes sea ice observation data from the NSIDC, which has broad global applicability. In contrast, the NSR criteria rely on forecast data on ice types in NSR waters, as published by the NSRA, which are more closely aligned with actual sea conditions in Russian waters [18,28].
- (3)
- Different regional management and policy contexts. The NSR is located within Russia’s exclusive economic zone, and the NSR criteria place greater emphasis on domestic shipping practices and regulatory frameworks. In contrast, the POLARIS methodology, as a general-purpose framework, offers greater international applicability but may be less closely tailored to the specific conditions of Russian waters [21].
The navigability outcomes obtained using the POLARIS methodology suggest that the NSR criteria impose certain restrictions on the navigability windows for Arc4 to Arc7 ice-class vessels, resulting in more conservative assessments. As Arctic ice conditions continue to improve, the NSRA issued an announcement in 2024 permitting the actual navigation periods for vessels without an ice class, as well as for Ice1- to Ice3-class vessels, to be flexibly extended by up to 20 days beyond the originally specified limits [40]. This indicates that, in practice, the NSR criteria allow for a certain degree of flexibility and show a trend toward moderate relaxation in their implementation.
5.2. Limitations and Future Work
This study is constrained by the sea ice forecast data for the NSR, as released by the NSRA, which are updated on a coverage basis and lack a continuous historical time series. As a result, the analysis focuses on three representative time points. Future research will involve the continued collection of annual-scale data, with particular emphasis on typical shipping routes along the NSR, to systematically assess the consistency and differences in navigability outcomes between the POLARIS methodology and the NSR criteria for vessels of various ice classes. This work aims to provide long-term, dynamic data and modeling support for polar navigation safety and route planning.
Although this study compares and analyzes the navigability outcomes of different districts along the NSR at typical time points, based on the POLARIS methodology and the NSR criteria, certain limitations remain, and further refinement and expansion are needed in future research. Firstly, there are still some limitations regarding data access. The sea ice forecast data released by the NSRA use an overlay updating mechanism and lack a continuous, traceable historical time-series record. This limitation allows this study to select only three representative time periods for analysis on the time scale, making it currently impossible to conduct a systematic assessment of long-term trends or the dynamic risks associated with changes in navigability. Secondly, although this study covers the 27 districts of the NSR, the analysis is still based on navigability outcomes and rates at the district level. Continuous route analysis of specific segments or typical routes has not yet been introduced, which affects the applicability and accuracy of the research results in terms of optimizing and making decisions regarding actual polar shipping routes. In addition, the current assessment method primarily focuses on ice conditions and has not yet fully incorporated other key environmental variables such as meteorological conditions, ocean currents, winds, and waves. This limitation reduces the comprehensiveness and realism of the navigability assessment to some extent.
Based on the aforementioned limitations, future research will focus on expanding and deepening in the following areas: (1) Future work may focus on constructing continuous sea ice datasets covering longer time scales, or generating high-quality synthetic samples using Generative Adversarial Networks (GANs) [41], to enrich the dataset and support the dynamic assessment of seasonal variations and long-term trends along the Northern Sea Route (NSR). (2) Based on the existing navigability outcomes of the districts, further incorporate the habitual routes of typical ice-class vessels to enhance the decision-making support capability of the method. (3) Introduce multi-source environmental data, including weather, ocean currents, wind, and wave information, to build a more comprehensive navigability assessment framework. (4) Expand the range of vessel types to achieve full coverage of ice-class vessels, providing long-term and dynamic data support as well as decision-making support for polar shipping safety and route planning [42].
6. Conclusions
This study aims to investigate the differences and consistencies in the navigability outcomes of polar vessels in the NSR waters using two methods. Specifically, it systematically analyzes the navigability outcomes of Arc4 to Arc9 ice-class vessels in September 2024, November 2024, and March 2025 based on the POLARIS methodology and the NSR criteria.
The study found that navigability outcomes using the two methods are largely consistent for higher ice-class vessels, particularly Arc9 ice-class vessels, and for Arc8 and Arc7 ice-class vessels during optimal ice conditions in September.
In contrast, differences between the two methods are primarily observed in the following scenarios: under relatively favorable ice conditions in September and November, inconsistencies are concentrated at the junctions between the Kara Sea and the Laptev Sea, the Laptev Sea and the East Siberian Sea, and the East Siberian Sea and the Chukchi Sea. Under severe ice conditions in March, significant differences in navigability outcomes are observed across nearly the entire NSR.
From the perspective of vessel operational safety, it is recommended that the POLARIS methodology be adopted for risk assessments of Arc4 to Arc9 ice-class vessels during years with favorable ice conditions. Conversely, during years with more severe ice conditions, the NSR criteria are recommended for the operational risk assessment of vessels in the same ice classes. By analyzing both methods within the NSR waters, this study has identified the key differences and consistencies in navigability outcomes for Arc4 to Arc9 ice-class vessels. These findings provide a valuable reference for shipowners and other relevant stakeholders for use in navigation planning and real-time operational decision-making.
To further expand the results of this research, future works should focus on multi-temporal dynamic analyses, construct continuous sea ice datasets covering longer time spans, conduct inter-annual and inter-seasonal systematic comparative studies in conjunction with shipping routes, and explore in depth the applicability of the two methods under varying sea ice conditions, as well as exploring the temporal evolution patterns of their differences. Additionally, a sea ice prediction model will be developed based on historical spatial and temporal data to enhance the safety and decision-support capabilities of polar ship operations.
Author Contributions
Conceptualization, L.M. and S.Q.; methodology, L.M. and S.Q.; software, S.Q. and X.M.; validation, L.M., J.X. and J.F.; formal analysis, X.M., J.X., J.F. and Y.L.; investigation, L.C., B.X. and B.Y.; resources, L.C. and X.L.; data curation, B.X. and B.Y.; writing—original draft preparation, S.Q.; writing—review and editing, L.M., S.Q. and J.X.; visualization, J.F., B.X. and B.Y.; supervision, L.M., J.X., L.C. and X.M.; project administration, L.M., J.X. and X.M.; funding acquisition, L.M. All authors have read and agreed to the published version of the manuscript.
Funding
This research was funded by the Scientific Research Start-up Funds of Guangdong Ocean University: Research on the Navigability of Arctic Shipping Routes Based on Sea-Ice Condition Analysis, grant number 060302132106, the Guangdong Provincial Key Laboratory of Intelligent Equipment for South China Sea Marine Ranching, grant number 080508132401, the Guangdong Basic and Applied Basic Research Foundation, grant numbers 2025A1515010886 and 2023A1515011212, the Special Projects in Key Fields of Ordinary Universities in Guangdong Province, grant number 2022ZDZX3005, the Shenzhen Science and Technology Program, grant number JCYJ20220530162200001, and the Postgraduate Education Innovation Project of Guangdong Ocean University, grant numbers 202421, 202539, and 202551.
Data Availability Statement
The raw data required to reproduce these findings cannot be shared at this time, as the data also forms part of an ongoing study.
Conflicts of Interest
The funders had no role in the design of the study; in the collection, analysis, or interpretation of data; in the writing of the manuscript; or in the decision to publish the results.
References
- Jahn, A.; Holland, M.M.; Kay, J.E. Projections of an ice-free Arctic Ocean. Nat. Rev. Earth Environ. 2024, 5, 164–176. [Google Scholar] [CrossRef]
- Mahmoud, M.R.; Roushdi, M.; Aboelkhear, M. Potential benefits of climate change on navigation in the northern sea route by 2050. Sci. Rep. 2024, 14, 2771. [Google Scholar] [CrossRef] [PubMed]
- Comiso, J.C.; Parkinson, C.L.; Gersten, R.; Bliss, A.C.; Markus, T. Current State of Sea Ice Cover. Available online: https://earth.gsfc.nasa.gov/cryo/data/current-state-sea-ice-cover (accessed on 22 June 2025).
- Пoстанoвление Правительства Рoссийскoй Федерации oт 31.01.2024 № 97 ∙ Официальнoе oпубликoвание правoвых актoв. Available online: http://publication.pravo.gov.ru/document/0001202402020023 (accessed on 20 May 2025).
- Müller, M.; Knol-Kauffman, M.; Jeuring, J.; Palerme, C. Arctic shipping trends during hazardous weather and sea-ice conditions and the Polar Code’s effectiveness. Npj Ocean. Sustain. 2023, 2, 12. [Google Scholar] [CrossRef]
- Xu, S.; Kim, E.; Haugen, S.; Zhang, M. A Bayesian network risk model for predicting ship besetting in ice during convoy operations along the Northern Sea Route. Reliab. Eng. Syst. Saf. 2022, 223, 108475. [Google Scholar] [CrossRef]
- Vanhatalo, J.; Huuhtanen, J.; Bergström, M.; Helle, I.; Mäkinen, J.; Kujala, P. Probability of a ship becoming beset in ice along the Northern Sea Route—A Bayesian analysis of real-life data. Cold Reg. Sci. Technol. 2021, 184, 103238. [Google Scholar] [CrossRef]
- Balmasov, S. Main Results of NSR Transit Navigation in 2024. Available online: https://chnl.no/news/main-results-of-nsr-transit-navigation-in-2024/ (accessed on 20 May 2025).
- International Code for Ships Operating in Polar Waters (Polar Code). Available online: https://www.imo.org/en/OurWork/Safety/Pages/polar-code.aspx (accessed on 20 May 2025).
- Ghosh, S.; Rubly, C. The emergence of Arctic shipping: Issues, threats, costs, and risk-mitigating strategies of the Polar Code. Aust. J. Marit. Ocean. Aff. 2015, 7, 171–182. [Google Scholar] [CrossRef]
- Faury, O.; Fedi, L.; Etienne, L.; Rigot-Muller, P.; Stephenson, S.; Cheaitou, A. Arctic Navigation: Stakes, Benefits and Limits of the Polaris System. J. Ocean. Technol. 2018, 13, 54–67. [Google Scholar]
- Rules of Navigation on the Water Area of the Northern Sea Route, Approved by the Decree N 1487 of the Government of the Russian Federation, 18 September 2020. Available online: http://rosatomflot.ru/img/all/0_rules_of_navigation_nsr_2020.pdf (accessed on 20 May 2025).
- Maritime, S.C. Guidance on Methodologies for Assessing Operational Capabilities and Limitations in Ice. In Tech. Rep. MSC. 1/Circ. 1519; International Maritime Organization: London, UK, 2016; Available online: https://www.nautinst.org/uploads/assets/uploaded/2f01665c-04f7-4488-802552e5b5db62d9.pdf (accessed on 21 May 2025).
- Lei, R.; Xie, H.; Wang, J.; Leppäranta, M.; Jónsdóttir, I.; Zhang, Z. Changes in sea ice conditions along the Arctic Northeast Passage from 1979 to 2012. Cold Reg. Sci. Technol. 2015, 119, 132–144. [Google Scholar] [CrossRef]
- Liu, X.H.; Ma, L.; Wang, J.Y.; Wang, Y.; Wang, L.N. Navigable windows of the Northwest Passage. Polar Sci. 2017, 13, 91–99. [Google Scholar] [CrossRef]
- Copland, L.; Dawson, J.; Tivy, A.; Delaney, F.; Cook, A. Changes in shipping navigability in the Canadian Arctic between 1972 and 2016. Facets 2021, 6, 1069–1087. [Google Scholar] [CrossRef]
- Chen, J.; Kang, S.; You, Q.; Zhang, Y.; Du, W. Projected changes in sea ice and the navigability of the Arctic Passages under global warming of 2 °C and 3 °C. Anthropocene 2022, 40, 100349. [Google Scholar] [CrossRef]
- Ma, L.; Qian, S.; Dong, H.; Fan, J.; Xu, J.; Cao, L.; Xu, S.; Li, X.; Cai, C.; Huang, Y. Navigability of Liquefied Natural Gas Carriers Along the Northern Sea Route. J. Mar. Sci. Eng. 2024, 12, 2166. [Google Scholar] [CrossRef]
- Chen, S.; Kern, S.; LI, X.; HUI, F.; YE, Y.; Cheng, X. Navigability of the Northern Sea Route for Arc7 ice-class vessels during winter and spring sea-ice conditions. Adv. Clim. Change Res. 2022, 13, 676–687. [Google Scholar] [CrossRef]
- Bai, J.; Zhu, K.; Feng, W.; Zhou, S. Coastal states’ influence on the polar code: An empirical study of Russia and Canada. Ocean Coast. Manag. 2024, 252, 107098. [Google Scholar] [CrossRef]
- Solski, J.J. The Polar Code Process and Sovereignty Bargains: Comparing the Approaches of CANADA and Russia to POLARIS. Ocean Dev. Int. Law. 2023, 54, 111–134. [Google Scholar] [CrossRef]
- Bond, J.; Hindley, R.; Kendrick, A.; Kämäräinen, J.; Kuulila, L. Evaluating risk and determining operational limitations for ships in ice. In Proceedings of the OTC Arctic Technology Conference 2018, Houston, TX, USA, 5–7 November 2018. [Google Scholar] [CrossRef]
- Greenwood, B.Y.N.; Kubat, I. Entering the “White Space” on the Map. Available online: https://greenwoodmaritime.com/wp-content/uploads/2015/PDF/MT_JAN2018_pp26-32.pdf (accessed on 29 May 2025).
- Wang, D.; Wang, J.; Zhang, H. Study of arctic waterway transit policy and its development on circumpolar nations and regions. Adv. Polar Sci. 2015, 27, 74–82. [Google Scholar] [CrossRef]
- Lu, H.M. Review and outlook for the 2020 Arctic navigation. World Shipp. 2021, 44, 24–27. [Google Scholar] [CrossRef]
- Gunnarsson, B.; Moe, A. Ten years of international shipping on the Northern Sea Route: Trends and challenges. Arct. Rev. Law. Politics 2021, 12, 4–30. [Google Scholar] [CrossRef]
- NSR Shipping Traffic—Activities in March 2022. Available online: https://chnl.no/maps/nsr-shipping-traffic-activities-in-march-2022/ (accessed on 21 May 2025).
- Klyachkin, S.V.; Kulakov, M.Y.; Filchuk, K.V.; Alekseyev, V.V.; Dymov, V.I.; Korobov, P.V. Integrated interactive system for numerical forecasting of the Arctic Ocean ice and hydrological regime elements. Russ. Arctic. 2024, 6, 19–36. [Google Scholar] [CrossRef]
- Types of Ice Conditions. Available online: https://nsr.rosatom.ru/en/navigational-and-weather-information/types-of-ice-conditions/ (accessed on 21 May 2025).
- Kim, Y.J.; Kim, H.C.; Han, D.; Lee, S.; Im, J. Prediction of monthly arctic sea ice concentrations using satellite and reanalysis data based on convolutional neural networks. Cryosphere 2020, 14, 1083–1104. [Google Scholar] [CrossRef]
- An, L.; Ma, L.; Wang, H.; Zhang, H.-Y.; Li, Z.-H. Research on navigation risk of the arctic northeast passage based on Polaris. J. Navig. 2022, 75, 455–475. [Google Scholar] [CrossRef]
- World Meteorological Organization (WMO). Intergovernmental Oceanographic Commission of the United Nations Educational, Scientific and Cultural Organization (IOC-UNESCO) SIGRID-3:A Vector Archive Format for Sea Ice Charts. Available online: https://library.wmo.int/records/item/37171-sigrid-3-a-vector-archive-format-for-sea-ice-charts (accessed on 26 May 2025).
- Wang, H.; An, L.; Ma, L.; Zhang, H.-Y.; Li, Z.-H. Study on Navigable Window Navigating Through Arctic Northeast Passage Based on Polaris. Navig. China 2022, 45, 23–29, 38. [Google Scholar] [CrossRef]
- Pang, X.; Zhang, C.; Ji, Q.; Chen, Y.; Zhen, Z.; Zhu, Y.; Yan, Z. Analysis of sea ice conditions and navigability in the Arctic Northeast Passage during the summer from 2002–2021. Geo-Spat. Inf. Sci. 2023, 26, 465–479. [Google Scholar] [CrossRef]
- Sea Ice. Available online: https://climate.copernicus.eu/climate-indicators/sea-ice (accessed on 21 May 2025).
- Sea Ice Cover for September 2024. Available online: https://climate.copernicus.eu/sea-ice-cover-september-2024 (accessed on 7 June 2025).
- Roach, L.A.; Meier, W.N. Sea ice in 2024. Nat. Rev. Earth Environ. 2025, 6, 252–254. [Google Scholar] [CrossRef]
- Sea Ice Cover for November 2024. Available online: https://climate.copernicus.eu/sea-ice-cover-november-2024 (accessed on 7 June 2025).
- Sea Ice Cover for March 2025. Available online: https://climate.copernicus.eu/sea-ice-cover-march-2025 (accessed on 7 June 2025).
- News. Available online: https://nsr.rosatom.ru/en/company/news/?ELEMENT_ID=187266 (accessed on 7 June 2025).
- Chen, X.; Wei, C.; Xin, Z.; Zhao, J.; Xian, J. Ship Detection Under Low-Visibility Weather Interference via an Ensemble Generative Adversarial Network. J. Mar. Sci. Eng. 2023, 11, 2065. [Google Scholar] [CrossRef]
- He, Y.; Li, Z.; Mou, J.; Hu, W.; Li, L.; Wang, B. Collision-avoidance path planning for multi-ship encounters considering ship manoeuvrability and COLREGs. Transp. Safety Environ. 2021, 3, 103–113. [Google Scholar] [CrossRef]


Disclaimer/Publisher’s Note: The statements, opinions and data contained in all publications are solely those of the individual author(s) and contributor(s) and not of MDPI and/or the editor(s). MDPI and/or the editor(s) disclaim responsibility for any injury to people or property resulting from any ideas, methods, instructions or products referred to in the content. |
© 2025 by the authors. Licensee MDPI, Basel, Switzerland. This article is an open access article distributed under the terms and conditions of the Creative Commons Attribution (CC BY) license (https://creativecommons.org/licenses/by/4.0/).