Article

Numerical Simulation of Multi-Cluster Fracture Propagation in Marine Natural Gas Hydrate Reservoirs

College of Safety and Ocean Engineering, China University of Petroleum, Beijing 102249, China
*
Author to whom correspondence should be addressed.
J. Mar. Sci. Eng. 2025, 13(7), 1224; https://doi.org/10.3390/jmse13071224
Submission received: 5 May 2025 / Revised: 7 June 2025 / Accepted: 10 June 2025 / Published: 25 June 2025
(This article belongs to the Section Geological Oceanography)

Abstract

Natural gas hydrates (NGHs) are promising energy resources, although their marine exploitation is limited by low reservoir permeability and hydrate decomposition efficiency. Multi-cluster fracturing technology can enhance reservoir permeability, yet complex properties of hydrate sediments render the prediction of fracture behavior challenging. Therefore, we developed a three-dimensional (3D) fluid–solid coupling model for hydraulic fracturing in NGH reservoirs based on cohesive elements to analyze the effects of sediment plasticity, hydrate saturation, fracturing fluid viscosity, and injection rate, as well as the stress interference mechanisms in multi-cluster simultaneous fracturing under different cluster spacings. Results show that selecting low-plastic reservoirs with high hydrate saturation (SH > 50%) and adopting an optimal combination of fracturing fluid viscosity and injection rate can achieve the co-optimization of stimulated reservoir volume (SRV) and cross-layer risk. In multi-cluster fracturing, inter-fracture stress interference promotes the propagation of fractures along the fracture plane while suppressing it in the normal direction of the fracture plane, and this effect diminishes significantly till 9 m cluster spacing. This study provides valuable insights for the selection of optimal multi-cluster fracturing parameters for marine NGH reservoirs.

1. Introduction

Natural gas hydrates (NGHs) are ice-like crystalline substances formed by methane and water under low-temperature and high-pressure conditions [1]. Global NGHs store approximately twice the carbon of traditional fossil fuels, which is about 10 16 kg [2,3], and are primarily distributed in the deep-water continental margins and continuous permafrost sediments [4]. The combustion of NGHs offers higher energy production, efficiency, and environmental benefits compared to coal and oil [5,6], positioning NGHs as a promising alternative resource with significant exploitation potential and commercial development value in the 21st century [7,8].
The primary methods for methane recovery from NGHs include depressurization [9], thermal stimulation [10,11], inhibitor injection [12], gas replacement [13], and combined methods [14]. Depressurization lowers reservoir pressure to induce NGH dissociation without extra energy consumption or material input, becoming the most feasible approach [15,16], but its gas production rate declines over time due to thermal deficits and low reservoir permeability hinders the propagation of pressure drop [17]. Thermal stimulation injects heated fluids to promote NGH dissociation, and it can supplement the thermal deficits during depressurization, yet poor reservoir permeability limits fluid injection efficiency, while significant heat loss occurs during heated fluid delivery from ground to downhole [18]. Inhibitor injection induces NGH dissociation by disrupting NGH phase equilibrium [19] but is limited by high costs and environmental risks. Gas replacement primarily utilizes CO2 to displace CH4, offering dual benefits of methane recovery and carbon storage, yet its industrial application is constrained by low replacement efficiency [13]. Combination methods enhance decomposition rates by integrating depressurization with thermal assistance but inherit the challenges of individual techniques [20]. Consequently, the low permeability of NGH reservoirs remains one of the major barriers to commercial exploitation.
To date, only Japan and China have conducted marine NGH trial productions. Japan’s 2013 test in the Nankai Trough yielded 12 ×   10 4   m 3 of gas over 6 days, and its 2017 test in two wells produced 3.5   ×   10 4   m 3 and 2 ×   10 5   m 3 gas over 12 and 24 days, respectively. China’s 2017 test in the Shenhu area of the South China Sea achieved continuous production for 60 days at 5151 m3/day, while its 2020 test reached 2 . 87   ×   10 4   m 3 / d a y over 30 days, which is 5.57 times the first test [21,22]. While these tests confirm the recoverability of marine NGHs, the current production level still remains sub-commercial [23].
The Nankai Trough is primarily composed of turbidite channel deposits in the submarine fan system [24,25], with the NGH reservoir dominated by sandy sediments with an average particle size of about 100 μm, porosity ranging from 40% to 50% [26] and high hydrate saturation ranging from 50% to 80%. In contrast, the Shenhu area consists of clay-silt reservoirs with pore sizes from 500 nm to 20 μm, porosity ranging from 33% to 55% [27,28], low permeability (0.2–40 mD), and hydrate saturation ranging from 10% to 40%. Although foraminiferal fossils in the Shenhu area create localized large pores and fractures, the overall permeability remains critically low, in some cases less than 1 mD [29], which increases gas flow resistance and hinders production [30,31]. To address this issue, multi-cluster fracturing technology offers an effective solution by continuously injecting high-pressure fluid into multiple perforation clusters within the target reservoir, thereby creating a network of artificial fractures that significantly improves reservoir permeability [32].
Fracturing technology, which has been extensively applied to unconventional low-permeability resources such as tight gas, shale gas, coalbed methane, and tight oil, is also considered suitable for enhancing the productivity of the NGH reservoir. To explore the deformability and fracture behavior of the hydrate-bearing layer (HBL), numerous laboratory-scale fracturing experiments have been carried out. Konno et al. [33] performed hydraulic fracturing on methane hydrate-bearing sand (MHBS), finding rock-like fracturing behavior and a significant post-fracturing permeability enhancement. Zhang et al. [34] trialed hydraulic fracturing on highly saturated MHBS, indicating that the low fluid filtrate loss under high saturation conditions enhances compressibility. Additionally, fracturing fluids with viscosities ranging from 1 to 120 mPa·s mainly induce tensile fractures in MHBS, whereas high-viscosity fluids around 3000 mPa·s generate both tensile fractures and local shear fractures. Wang et al. [35] conducted depressurization experiments in a triaxial hydraulic fracturing apparatus according to the samples obtained from the South China Sea, finding that the fracture initiation pressure is positively correlated with decreasing hydrate saturation (SH < 30%), with fractures consistently propagating vertically along the minimum principal stress direction, while gas production and sediment permeability are greatly improved post-fracturing.
However, experimental studies on HBL fracturing are often constrained by limited sample sizes and the challenges of parameter optimization under complex reservoir conditions. Numerical simulation provides an economical and effective approach to investigate fracturing mechanisms across multi-scale systems [36]. In recent years, researchers have conducted a series of numerical simulations on HBL fracturing. Liu et al. [37] proposed a coupled thermal-hydro-mechanical-damage (THMD) model to consider the variations in hydrate properties caused by hydrate phase transformation and reveal the effect of reservoir properties and fracturing parameters on fracture behavior as well as the mechanisms of fracture initiation and propagation. Ma et al. [38] built a two-dimensional(2D) model based on cohesive elements, which revealed that increasing hydrate saturation results in higher fracture initiation pressures and longer and narrower fractures. Wang et al. [39] simulated based on the extended finite element method (XFEM) and concluded that higher horizontal stress differentials and higher fracturing fluid injection rates contribute to longer fracture lengths and higher fracture initiation pressures. Huang et al. [40] simulated the continuous-discontinuous element method (CDEM), which couples finite and discrete element approaches, and concluded that when in situ stress is isotropic, fracturing is most readily achieved, albeit at the expense of further fracture propagation. Liang et al. [41] simulated based on discrete element method (DEM), and found that fracture complexity increases with hydrate saturation. Lower in situ stress and higher injection rates facilitate the generation of microcracks, whereas excessive injection rates reduce fracture lengths.
Most existing studies focused on 2D simplified models or single-fracture scenarios, neglecting the evolution of 3D fracture networks and the competitive interactions among multi-cluster fractures. Therefore, this study employs Abaqus 2022 with cohesive elements to establish a 3D fluid–solid coupling model for single-cluster and multi-cluster fracturing in multi-layer NGH reservoirs under the argillaceous silty conditions of the Shenhu area. The model shows the effects of sediment plasticity, hydrate saturation, and fracturing fluid parameters (displacement rate and viscosity) on the propagation behavior of single-cluster fractures while further quantifying the interference and competitive growth mechanisms among multiple fracture clusters under varying cluster numbers and spacing configurations. The results provide theoretical support for the implementation of multi-cluster fracturing stimulation strategies in NGH reservoirs.

2. Hydraulic Fracturing Theory Based on Cohesive Method

The four principal numerical approaches for simulating hydraulic fracturing are the displacement discontinuity method (DDM), discrete element method (DEM), extended finite element method (XFEM), and finite element method (FEM). DDM simulates natural fracture activation and hydraulic fracture intersection in homogeneous materials under weak fluid–solid coupling [42,43]. DEM efficiently characterizes dynamic fracture extension and fluid flow mechanisms in simplified models influenced by natural fractures [44,45]. XFEM predicts fracture propagation and multi-fracture competition with high precision in scenarios with minimal weak plane interaction or bifurcation [46]. FEM employs the cohesive element method to handle fracture intersection and bifurcation without complex shape functions [47], simulating fluid–solid coupling between rock and fractures [48], and model heterogeneous materials with intricate constitutive relations while avoiding stress and pressure singularities at fracture tips [49]. Although the cohesive element method requires predefined fracture paths, these paths can be predetermined via the triaxial in situ stress conditions of the custom model. Therefore, this study employs the cohesive element method to construct a 3D fluid–solid coupling model for multi-cluster hydraulic fracturing in HBL.

2.1. Cohesive Element Method Introduction

This method embeds zero-thickness cohesive elements along predefined fracture paths to simulate fracturing fluid flow and filtration, matrix deformation, fracture initiation, fracture propagation, and fracture geometry. The mechanical behavior of the cohesive elements follows the traction-separation law [50]. As shown in Figure 1, Fracture formation involves two stages: linear elastic behavior before initiation and damage evolution after initiation.

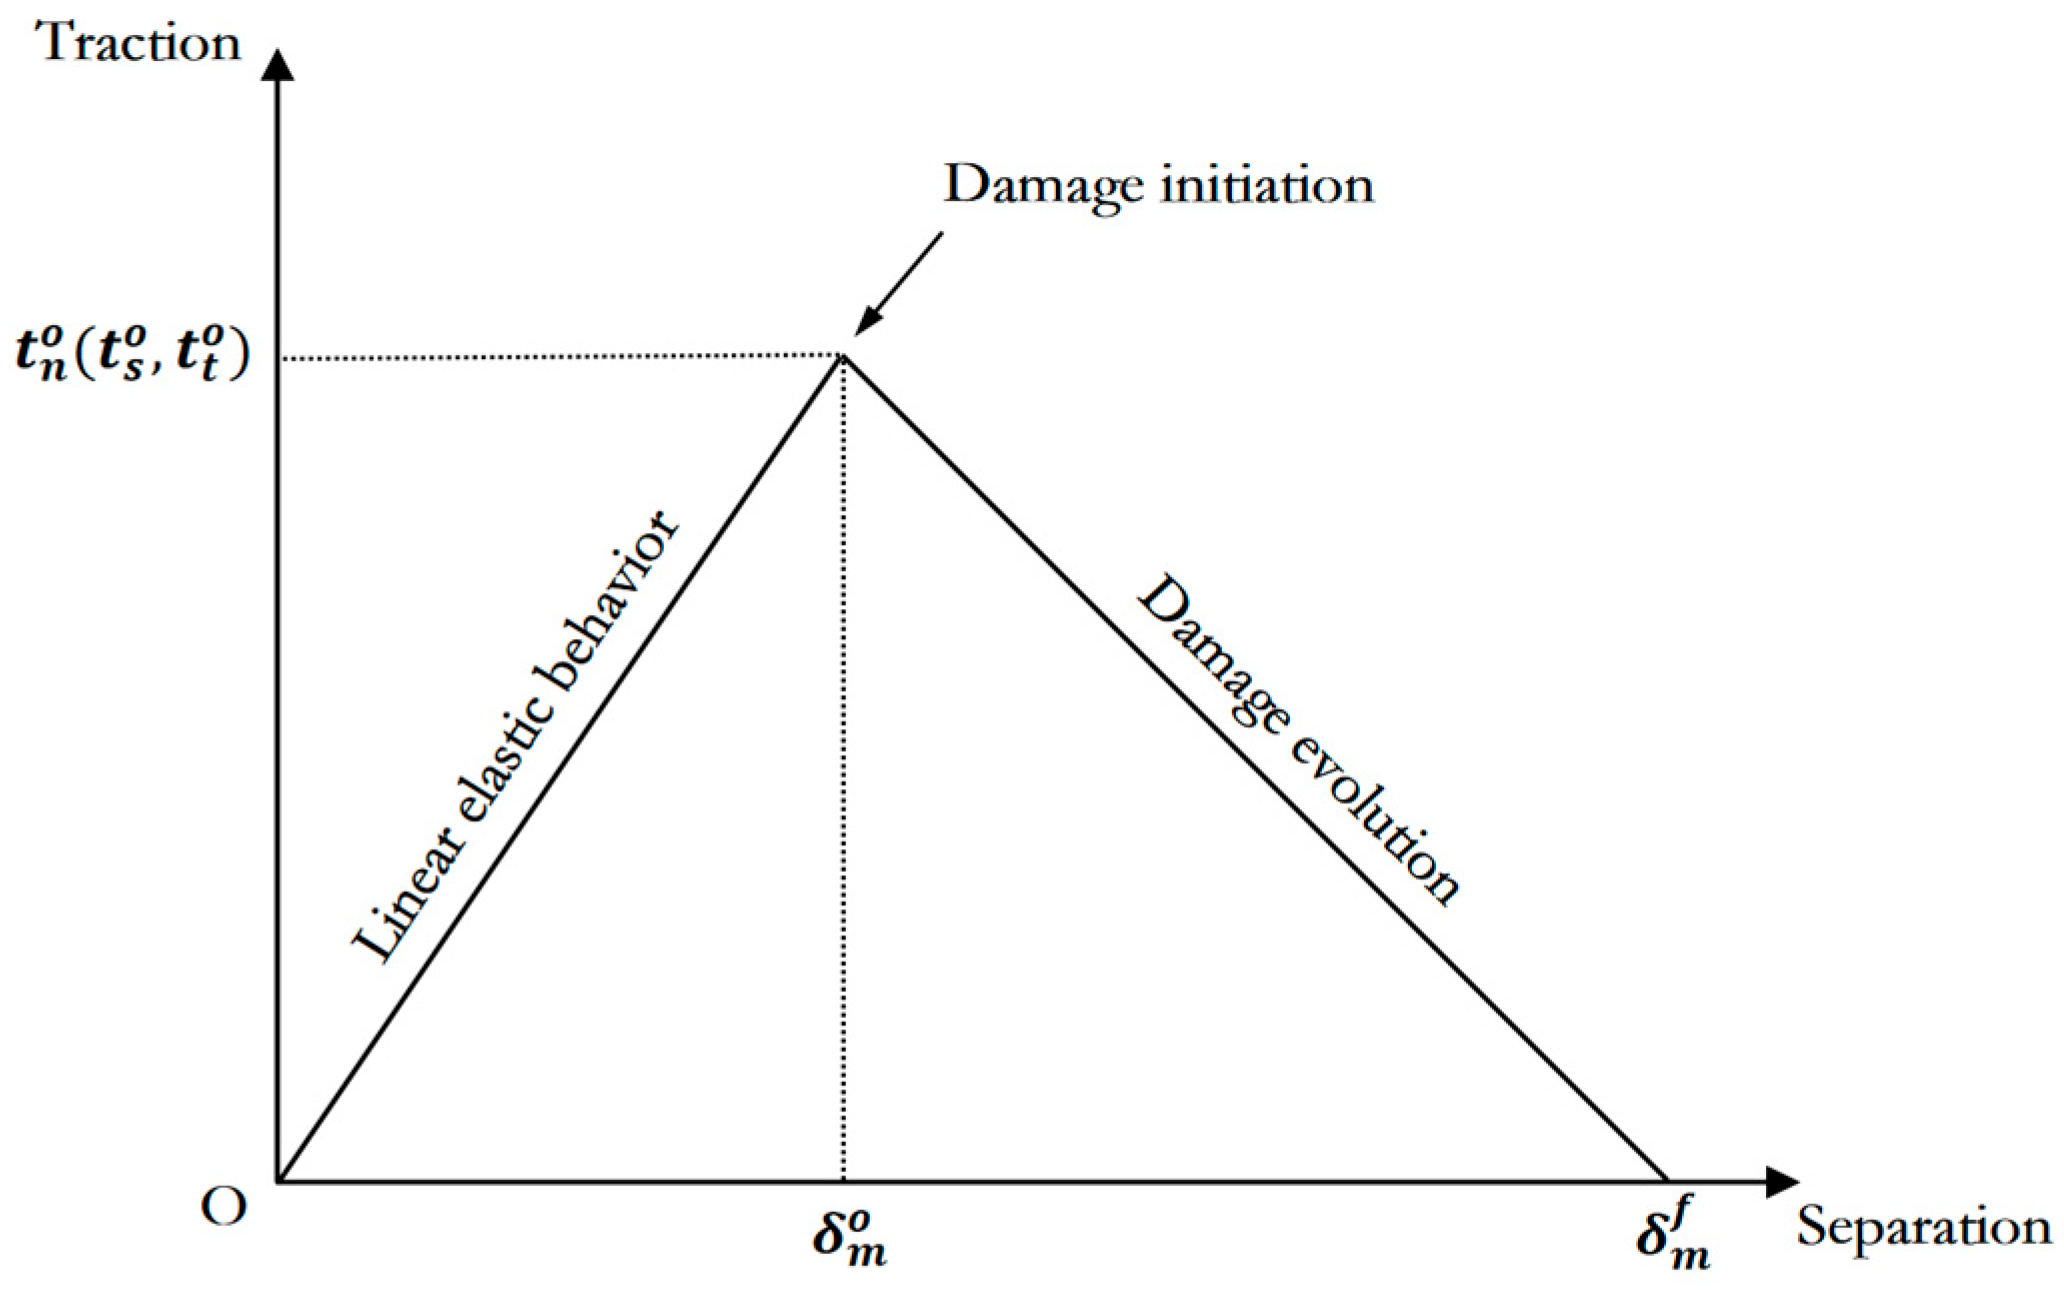
2.2. Analysis of Fracture Process

The linear elastic behavior before fracture initiation is expressed by the elastic constitutive matrix equation:
t = t n t s t t = E n n E n s E n t E n s E s s E s t E n t E s t E t t ε n ε s ε t = E ε
ε n ε s ε t = 1 T 0 σ n σ s σ t = E ε
where t , E , ε , and δ are the nominal traction vector, elastic modulus, strain, and displacement, respectively; n , s and t are the normal direction, the first shear direction, and the second shear direction, respectively; and T 0 is the initial thickness of a cohesive element.
The initiation of fracture is judged according to the maximum principal stress criterion [51]:
f = σ m a x σ m a x a
where σ m a x a is the critical maximum principal stress and σ m a x is Macaulay, indicating that when the maximum stress ratio reaches the critical value, the model begins to damage.
The stiffness degradation rate of the reservoir after fracture initiation is represented by the damage evolution criterion [51]:
t n = ( 1 D ) t n ¯ , t n ¯ 0 t n ¯ , o t h e r w i s e
t s = ( 1 D ) t s ¯
t t = ( 1 D ) t t ¯
where D is the overall fracture degree of the reservoir and t n ¯ , t s ¯ , and t t ¯ are the stress components corresponding to the strains when HBL is not damaged based on the traction separation law.

2.3. Flow Equation in Fracture

The fluid in the fracture is divided into tangential flow and normal flow. The tangential flow causes the fracture propagation, while the normal flow causes the fracturing fluid to leak out. The tangential flow equation [52] is as follows:
qd = k t p
k t = d 3 12 μ
where q is the flow rate; d is the fracture width; p is the pressure drop gradient along the cohesive element; k t is the tangential flow resistance; and μ is the fluid viscosity.
The normal flow causes the fluid to leak out through the upper and lower surfaces of the fracture. The normal flow equation [52] is as follows:
q t = c t ( p i p t )
q b = c b ( p i p b )
where q is the fracturing fluid velocity; c is the permeability coefficient; p is fluid pressure; and t , i , and b are the upper, middle, and lower surfaces, respectively.

3. Numerical Simulation

3.1. Model Assumptions

1. Each layer adjacent to the horizontal well is continuous, homogeneous, isotropic, and semi-infinite elastic media [53];
2. Hydrates occupy the pore space within the sediments, thereby reducing the effective permeability [54];
3. The strength and elastic modulus of hydrate-bearing sediments increases with hydrate saturation due to cementation effects and skeletal reinforcement by hydrates [55];
4. Hydrate saturation remains unchanged during hydraulic fracturing, so the permeability and mechanical properties of hydrate-bearing sediments remain invariant during the hydraulic fracturing process [38];
5. Fracture initiation is governed by tensile failure;
6. The created fractures are completely filled with an incompressible Newtonian fluid [39].

3.2. Model Construction

As is shown in Figure 2, the layers on both sides of the horizontal well are assumed to be infinite and homogeneous, resulting in fracture symmetry about the x-y plane containing the well axis. Therefore, only one side of the formation is selected for modeling. The model domain is defined as 60 m × 50 m × 50 m, consisting of an overburden layer, HBL, and underlying layer from top to bottom, with respective thicknesses of 10 m, 30 m, and 10 m, respectively. Without NGHs, the sediments in the overburden and underlying layer have higher permeability; therefore, once the hydraulic fractures in HBL propagate into the overburden or underlying layer, it will cause serious methane leakage, producing a significant greenhouse effect [56,57,58], so multi-layer model construction is significant. The horizontal well is located on the central line of the x-y symmetry plane parallel to the x-axis. As shown in Figure 2, three initiation points for fracturing fluid injection are predefined in the model to simulate multi-cluster hydraulic fracturing. The mesh type of sediment and fracture zones used C3D8P and COH3D8P elements, respectively, totaling 28,000 and 2000 elements for the single cluster model. Two cohesive elements near each injection point are initialized as initial damage elements. The symmetry surface imposes zero displacement and rotation constraints, while the remaining surfaces impose zero displacement, rotation, and pore pressure. The model construction and parameter setting in this study are based on our previous experimental investigation [59], and setting parameters including perforation position, reservoir properties, and fracturing fluid injection parameters.

3.3. Model Parameters

3.3.1. Tensile Strength

Yoneda et al. [26,60] proposed the shear strength formula of hydrate reservoir based on the Mohr–Coulomb criterion:
τ f = c ( S H ) + σ n tan φ = c ( S H = 0 ) + 1 sin φ 2 cos φ · α · S H β + σ n tan φ
where τ f represents the shear strength; S H represents the hydrate saturation; c ( S H ) represents cohesion; c ( S H = 0 ) is 0.045 MPa; σ n represents the normal stress; φ represents the internal friction angle, which is 34°; and α   a n d   β are the fitting values when the confining press is 0.5–5 MPa, which are 0.0012 and 1.96, respectively [60].
The tensile strength is set to be half of the shear strength [53]:
σ f = 1 2 · τ f
where σ f represents the tensile strength.

3.3.2. Elastic Modulus

Lijith et al. [61] proposed the elastic modulus formula of hydrate deposits:
E σ 3 = a + b · ( S H ) 2.5
where E represents the elastic modulus; σ 3 represents the horizontal effective confining pressure; and a and b are constants, respectively, related to the stiffness of hydrate-free sediments and hydrate morphology. When effective confining pressure is 0.25–0.50 MPa, they are, respectively, 400 and 0.025; when effective confining pressure is 3.0–5.0 MPa, they are, respectively, 160 and 0.01.

3.3.3. Permeability

Dai et al. [62] proposed a permeability model of a hydrate-bearing layer based on the Kozeny–Carman model [61]. The formula is as follows:
K = K 0 ( 1 S H ) 3 ( 1 + 2 S H ) 2
where K is the effective permeability of HBL and K 0 is the permeability of hydrate-free sediments.

3.3.4. Void Ratio

Solid Hydrate fills the pore of sediments, which reduces the effective porosity of HBL. The formula is as follows:
ϕ = ϕ · ( 1 S H ) ,
where ϕ is the effective porosity of HBL, and ϕ is the porosity of hydrate-free sediments.
The void ratio is calculated as follows:
e = ϕ 1 ϕ ,

3.4. Initial and Boundary Conditions

The data in this paper is from the SH2 site in the Shenhu area of the South China Sea [63]. The water depth is 1235 m, and the total overlying layer thickness is 188 m. The inherent permeability of HBL is 10 mD, and the inherent porosity is 63.3%.
At site SH2, the pore water in HBL and seawater are considered to be interconnected [64]. The pore water pressure is calculated as follows:
P p w = P a t m + ρ s w g ( h + h 2 + h 3 ) × 10 6
where P p w and P a t m represent the pore water pressure in sediment and atmospheric pressure, respectively; ρ s w represents the seawater density (its value is 1035 kg/m3); g represents gravitational acceleration (its value is 9.80 m/s2); and h ,   h 2 , and h 3 represent the seawater depth, total overburden thickness, and vertical distance from any point in the hydrate layer to the overburden bottom (the value ranges from 0 to 30 m), respectively.
The vertical geostress at any point in HBL is:
σ v = P a t m + σ v 1 + σ v 2 + σ v 3 = P a t m + ρ s w g h + ρ O B g h 2 + ρ H B L g h 3
where the σ v 1 , σ v 2 ,   a n d   σ v 3 represent the vertical stress caused by the weight of seawater, overlying layer, and HBL, respectively,   a n d   ρ O B   a n d   ρ H B L are the density of the overlying layer and the hydrate-bearing layer, respectively.
ρ O B and ρ H B L are calculated as follows:
ρ O B = ρ s ( 1 ϕ ) + ρ s w ϕ
ρ H B L = ρ s ( 1 ϕ ) + ρ H ϕ S H + ρ s w ϕ ( 1 S H )
where ρ s represents the sediment particle density (its value is 2600 kg/m3); ρ H is the hydrate particle density (its value is 940 kg/m3); and ϕ represents the porosity.
The vertical effective stress in HBL is calculated as follows:
σ v = σ v P p w
The soil is considered a semi-infinite elastic deformation body without lateral deformation. According to the generalized Hooke’s law, the horizontal geostress σ h and σ H are calculated as follows:
σ h = σ h = μ 1 μ σ v
where the μ represents the Poisson’s ratio, which is 0.3 in this paper.
This paper adopts values at the middle of each layer as uniform in situ stresses for their respective layers. The calculated in situ stresses of the overburden layer, HBL, and underlying layer are 0.44/0.44/1.03 MPa, 0.52/0.52/1.20 MPa, and 0.59/0.59/1.38 MPa, respectively. The reservoir physical parameters calculated under different hydrate saturations are shown in Table 1.

4. Results

4.1. Reservoir Property and Fracturing Parameters Influence Analysis

4.1.1. Plasticity of Sediment

This section investigates the HBL with 40% hydrate saturation under fracturing conditions of 0.6 m3/min injection rate, 1 m P a · s viscosity, and 120 s injection duration. Hydraulic fracture morphology at 120 s and injection pressure evolution for elastic and elastic-plastic HBL are compared in Figure 3. As shown in Figure 3a, in elastic HBL, fractures develop wider and square-shaped fronts. This is because proppant in fracturing fluid can effectively hinder the fracture from closing down [65], which forms wide flow channels, and the obvious tip stress concentration in the fracture front enables a regular and clear “square” fracture boundary. Conversely, elastic-plastic HBL develops narrower fractures with curved fronts. This occurs because the plasticity of HBL makes it hard for the fracturing fluid to fully widen fractures [65], which results in narrow openings. Additionally, the stress at the fracture tip is absorbed by nearby plastic deformation in fracturing, creating a curved ‘arc’ fracture front. As shown in Figure 3b, 6.208 MPa initiation pressure in elastic-plastic HBL is higher than that in elastic HBL with 3.522 MPa, and the injection pressure curve of elastic-plastic HBL is gentler than that of elastic HBL. Elastic HBL, characterized by high brittleness, facilitate rapid fracture initiation and propagation, causing lower initiation pressure and more frequent abrupt pressure drop. In contrast, elastic-plastic HBL require higher energy to overcome plastic deformation, resulting in higher initiation pressure, slower fracture growth and pressure release.

4.1.2. Hydrate Saturation

This section employs a fracturing fluid with 0.3 m3/min injection rate, 1 m P a · s viscosity, and 150 s total injection duration. Figure 4 illustrates the fracture morphology under different saturations at 150 s. As shown in the figure, increasing hydrate saturation from 30% to 50% reduces fracture width, slightly increases fracture length, and elevates fracture height. This trend arises because increasing hydrate saturation enhances the stratum’s elastic modulus [61], strengthening deformation resistance and thereby narrowing fractures. Higher elastic modulus also intensifies stress concentration at fracture tips, amplifying energy release and reducing propagation energy dissipation [66], thereby promoting fracture extension. However, increased elastic modulus concurrently raises fracture propagation resistance, limiting the growth of fracture length. With a constant volume of injected fluid, fracture height correspondingly increases. At hydrate saturations of 50–60%, fracture width expands due to reduced lateral fluid filtration [53], concentrating fluid energy to widen fractures. Consequently, fracture height slightly declines while length remains stable.
Figure 5 illustrates injection pressure evolution under varying hydrate saturations. The pressure exhibits cyclic fluctuation of gradual rises and abrupt drops, which correlate with fracture fluid filling phases (pressure accumulates with injection) and fracture propagations (new fractures absorb fluid, lowering pressure), respectively. Each pressure peak represents fracture pressure, and the initial peak denotes initiation pressure. Over time, pressure rise phases lengthen and weaken. This is because increasing fracture surface area elevates the required fluid volume and prolongs fluid filling duration. Concurrently, declining fracture tip resistance reduces pressure amplitude during propagation.
Figure 6 shows fracture initiation pressure and initiation time under varying hydrate saturations. As shown in the figure, as saturation rises from 30% to 50%, initiation pressure increases from 2.54 MPa to 4.75 MPa. This is because hydrates restrict sediment particle mobility [67], which enhances the HBL strength. At lower saturations, hydrates primarily form cemented or particle-encapsulated structures. At higher saturations (≥50%), it turns to skeleton-supported or porphyritic hydrates [67,68], further strengthening the layer and raising initiation resistance. Conversely, at 50–60% saturation, initiation pressure declines from 4.75 MPa to 3.93 MPa, and initiation time shortens from 6.13 s to 4.84 s. Specifically, higher hydrate saturation increases the stiffness of the sediment matrix, which enhances the transmission of stress and accelerates fracture initiation. Under a consistent pressure-rise rate, a faster initiation process results in a shorter time to reach failure and, thus, a lower initiation pressure.

4.1.3. Viscosity of Fracturing Fluid

This section investigates the HBL with 40% hydrate saturation, employing a fracturing fluid injection rate of 0.6 m3/min over 150 s. Figure 7a depicts injection pressure evolution under varying fracturing fluid viscosities, while Figure 7b presents corresponding initiation pressure and initiation time. As shown in Figure 7, higher viscosities of fracturing fluid elevate fracture injection and initiation pressures due to increased fluid flow resistance and reduced leakage [69]. As shown in Figure 7a, the pressure curve of low-viscosity fluids (1–10 m P a · s ) produces largely pressure fluctuations, whereas high-viscosity fluids (120–200 m P a · s ) exhibit smoother pressure curve, attributed to poor fluidity of the high-viscosity fracturing fluid slower the fracture absorption rates, thus limit pressure change speed. As shown in Figure 7b, elevated viscosity delays fracture initiation, as higher viscosity makes it more difficult for the fracturing fluid to flow into the layer, resulting in the initiation time delay.
Figure 8 compares fracture width and half-length at 150 s under varying fracturing fluid viscosities. As shown in the figure, low-viscosity fluids produce narrow and elongated fractures, whereas high-viscosity fluids generate wider and shorter fractures under the same injection conditions. This behavior arises because high-viscosity fracture fluid has lower lateral fluid filtration, concentrating more fluid for opening the fracture in width. At constant injection volumes, the larger the fracture width, the shorter the corresponding length. In addition, viscous fluids exhibit heightened flow resistance, suppressing fracture propagation in length and shortening the fracture length.

4.1.4. Injection Rate of Fracturing Fluid

This section investigates the HBL with 40% hydrate saturation, employing fracturing fluid with 1 m P a · s viscosity and 120 s injection duration. Figure 9 represents initiation pressure and initiation time under varying injection rates. As shown in the figure, increasing the injection rate shortens the fracture initiation time, as injecting more fluid per unit time accelerates the pressure accumulation to exceed the tensile strength of sediments, which makes it earlier to initiate. When the injection rate rises from 0.3 m3/min to 0.9 m3/min, the fracture initiation pressure increases from 3.08 MPa to 4.93 MPa due to injected fluid volume far exceeding formation absorption capacity, hastening pressure escalation and resulting in higher initiation pressure. However, when the injection rate increases further to 1.2 m3/min, the fracture initiation pressure decreases from 4.93 MPa to 3.24 MPa, as the fracture has been formed when the injection pressure reaches a lower pressure value due to a higher initiation rate.
Figure 10 shows fracture geometry variations under different injection rates at 120 s. As shown in the figure, when the injection rate increases from 0.3 m3/min to 0.6 m3/min, the fracture area remains nearly constant while the width expands obviously. When increasing to 0.9 m3/min, the fracture area and height increase, and the fracture propagates faster. When further increasing to 1.2 m3/min, both fracture area and height increase more obviously, with markedly accelerated horizontal and vertical propagation rates. This behavior stems from an elevated strain rate at the fracture tip, enabling injection pressure to surpass the tensile strength of sediments more rapidly in vertical and horizontal directions, which results in intensifying fracture propagation rates and exacerbating cross-layer risks.
Figure 11a illustrates fracture geometry under 0.6 m3/min injection rate, while Figure 11b depicts the fracture width variations. As shown in Figure 11a, at 11.52 s and 51.94 s, the fracture front is semi-circular, and the width is small, and they correspond to the sharp width decline phase in Figure 11b, which indicates the fracture propagating stage. At 41.04 s and 100 s, the fracture front is square, and the width is larger, and they correspond to the width growth phase in Figure 11b, which indicates fracturing fluid filling stages.

4.2. Multi-Cluster Fracturing Analysis

In fact, multi-cluster fracturing technology is commonly employed in field operations to enhance stimulated reservoir volume (SRV) and improve hydrocarbon recovery efficiency. Consequently, the pressure interference between fractures must be accounted for when predicting fracture geometry and propagation trends [70,71,72]. This part investigates the impact of cluster spacing on both initiation and propagation behaviors of double-cluster and three-cluster fractures during simultaneous fracturing. The findings offer design optimization recommendations that balance reservoir reconstruction scale with fracture network effectiveness.

4.2.1. Effect of Cluster Spacing on Double-Cluster Simultaneous Fracturing

This section focuses on the hydraulic fracturing process in HBL with 40% hydrate saturation. The fracturing fluid injection rate is 0.3 m3/min per cluster, with a total injection duration of 120 s. Three simultaneous double-cluster fracturing models were developed with cluster spacings of 3 m, 6 m, and 9 m, respectively.
Figure 12a,b show fracture geometry evolution and the distribution of S11 stress (x-directional normal stress) on the symmetry plane under a cluster spacing configuration of 3 m, respectively. As shown in Figure 12a, an extensive fine fracture area forms after initiation. As shown in Figure 12b, a high inter-fracture stress concentration zone forms and gradually attenuates with fracture propagation. As shown in Figure 12, at 4.503 s and 64.55 s, fracture interference is not obvious. At 105.3 s and 120 s, fractures form linear shape proximally and convex shape distally due to the extrusion effect between fractures. In addition, due to stress concentration effects, longitudinal mutual dislocation occurs between the fractures: The right fracture is at a relatively low position with an upward propagation tendency, while the left fracture is at a relatively high position with downward extension potential.
Figure 13 illustrates the fracture geometry at 3 m, 6 m, and 9 m cluster spacing after 120 s of double-cluster synchronous fracturing. As shown in the figure, at 9 m cluster spacing, it rarely exhibits inter-cluster interference. At 6 m cluster spacing, pronounced stress interference emerges, and fracture propagates faster compared to 9 m cluster spacing, while an extensive narrow fracture zone generates, which distributes throughout the whole predefined fracture plane in the model. At 3 m cluster spacing, it manifests the most significant interference effects, achieving faster propagation rates than 6 m cluster spacing. Notably, under high-stress interactions between fractures, two fracture clusters develop distinct upward and downward growth tendencies, substantially elevating the risk of cross-layer penetration.

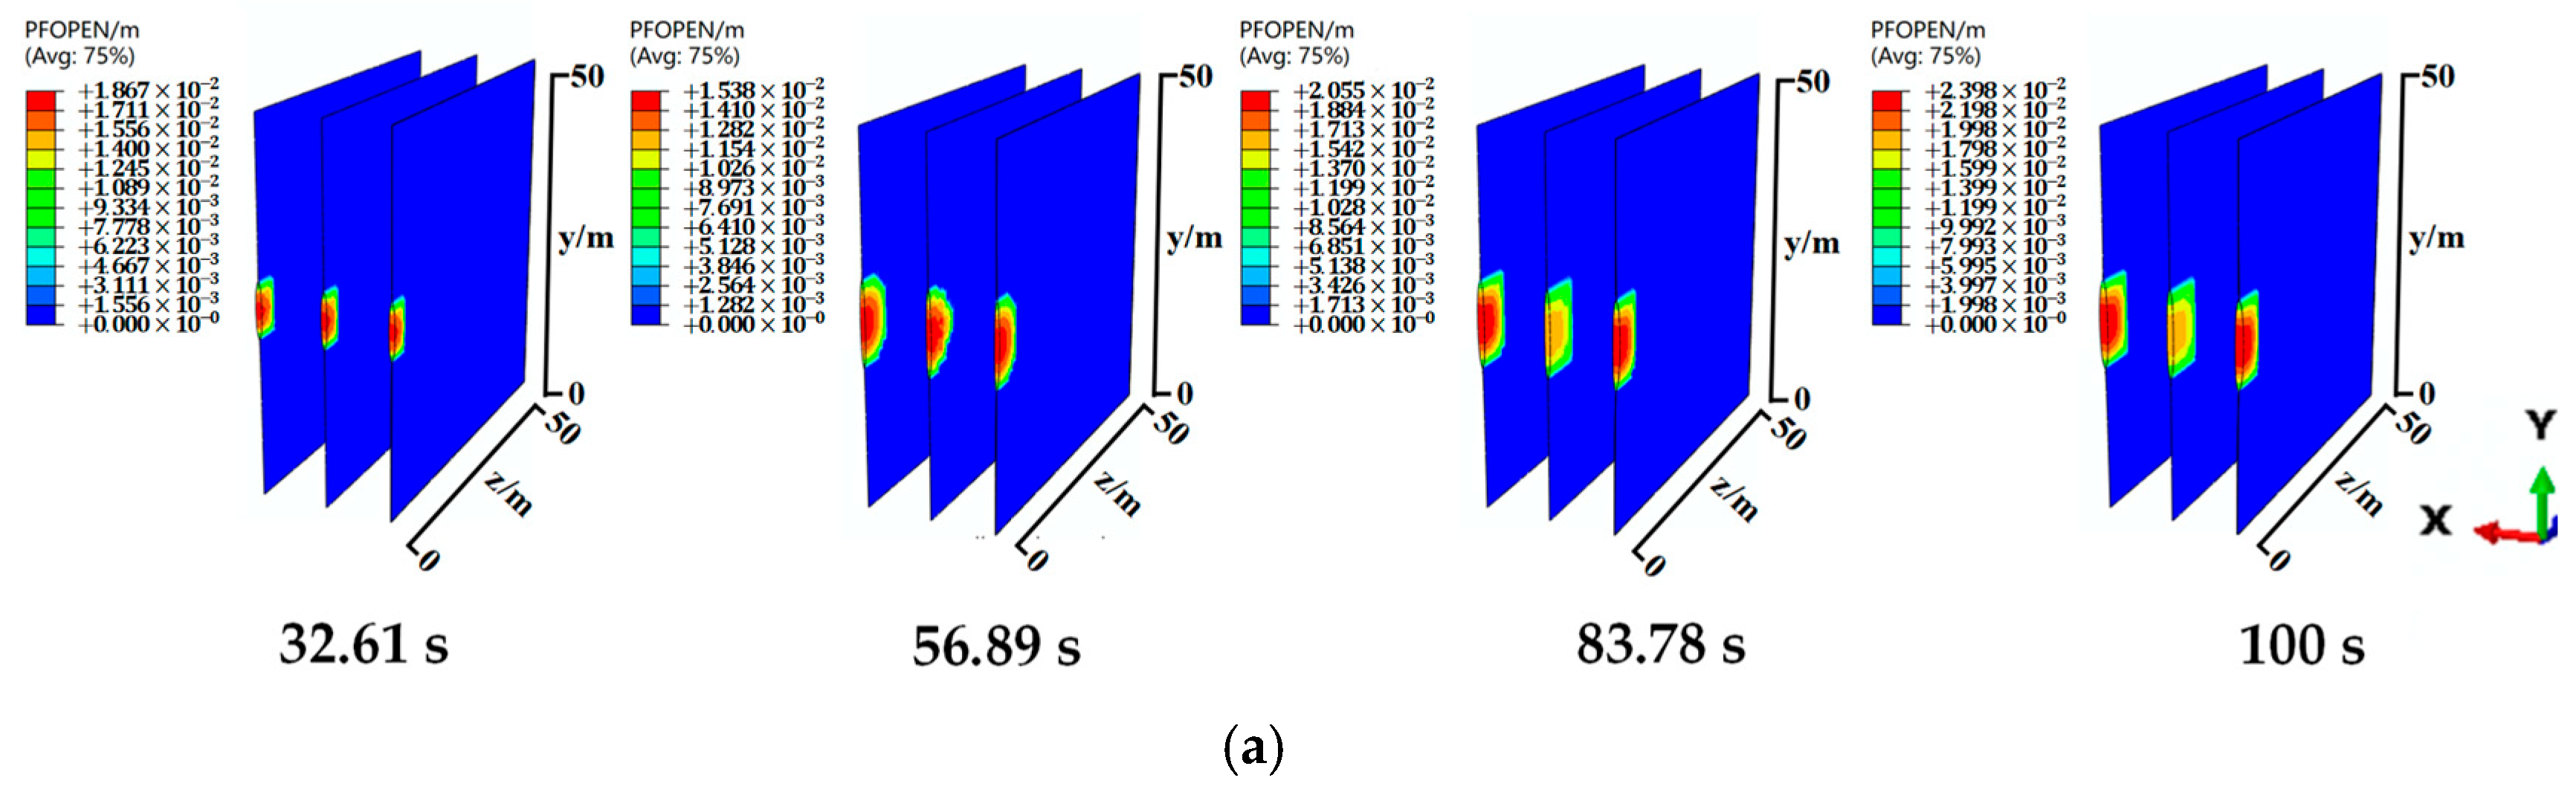
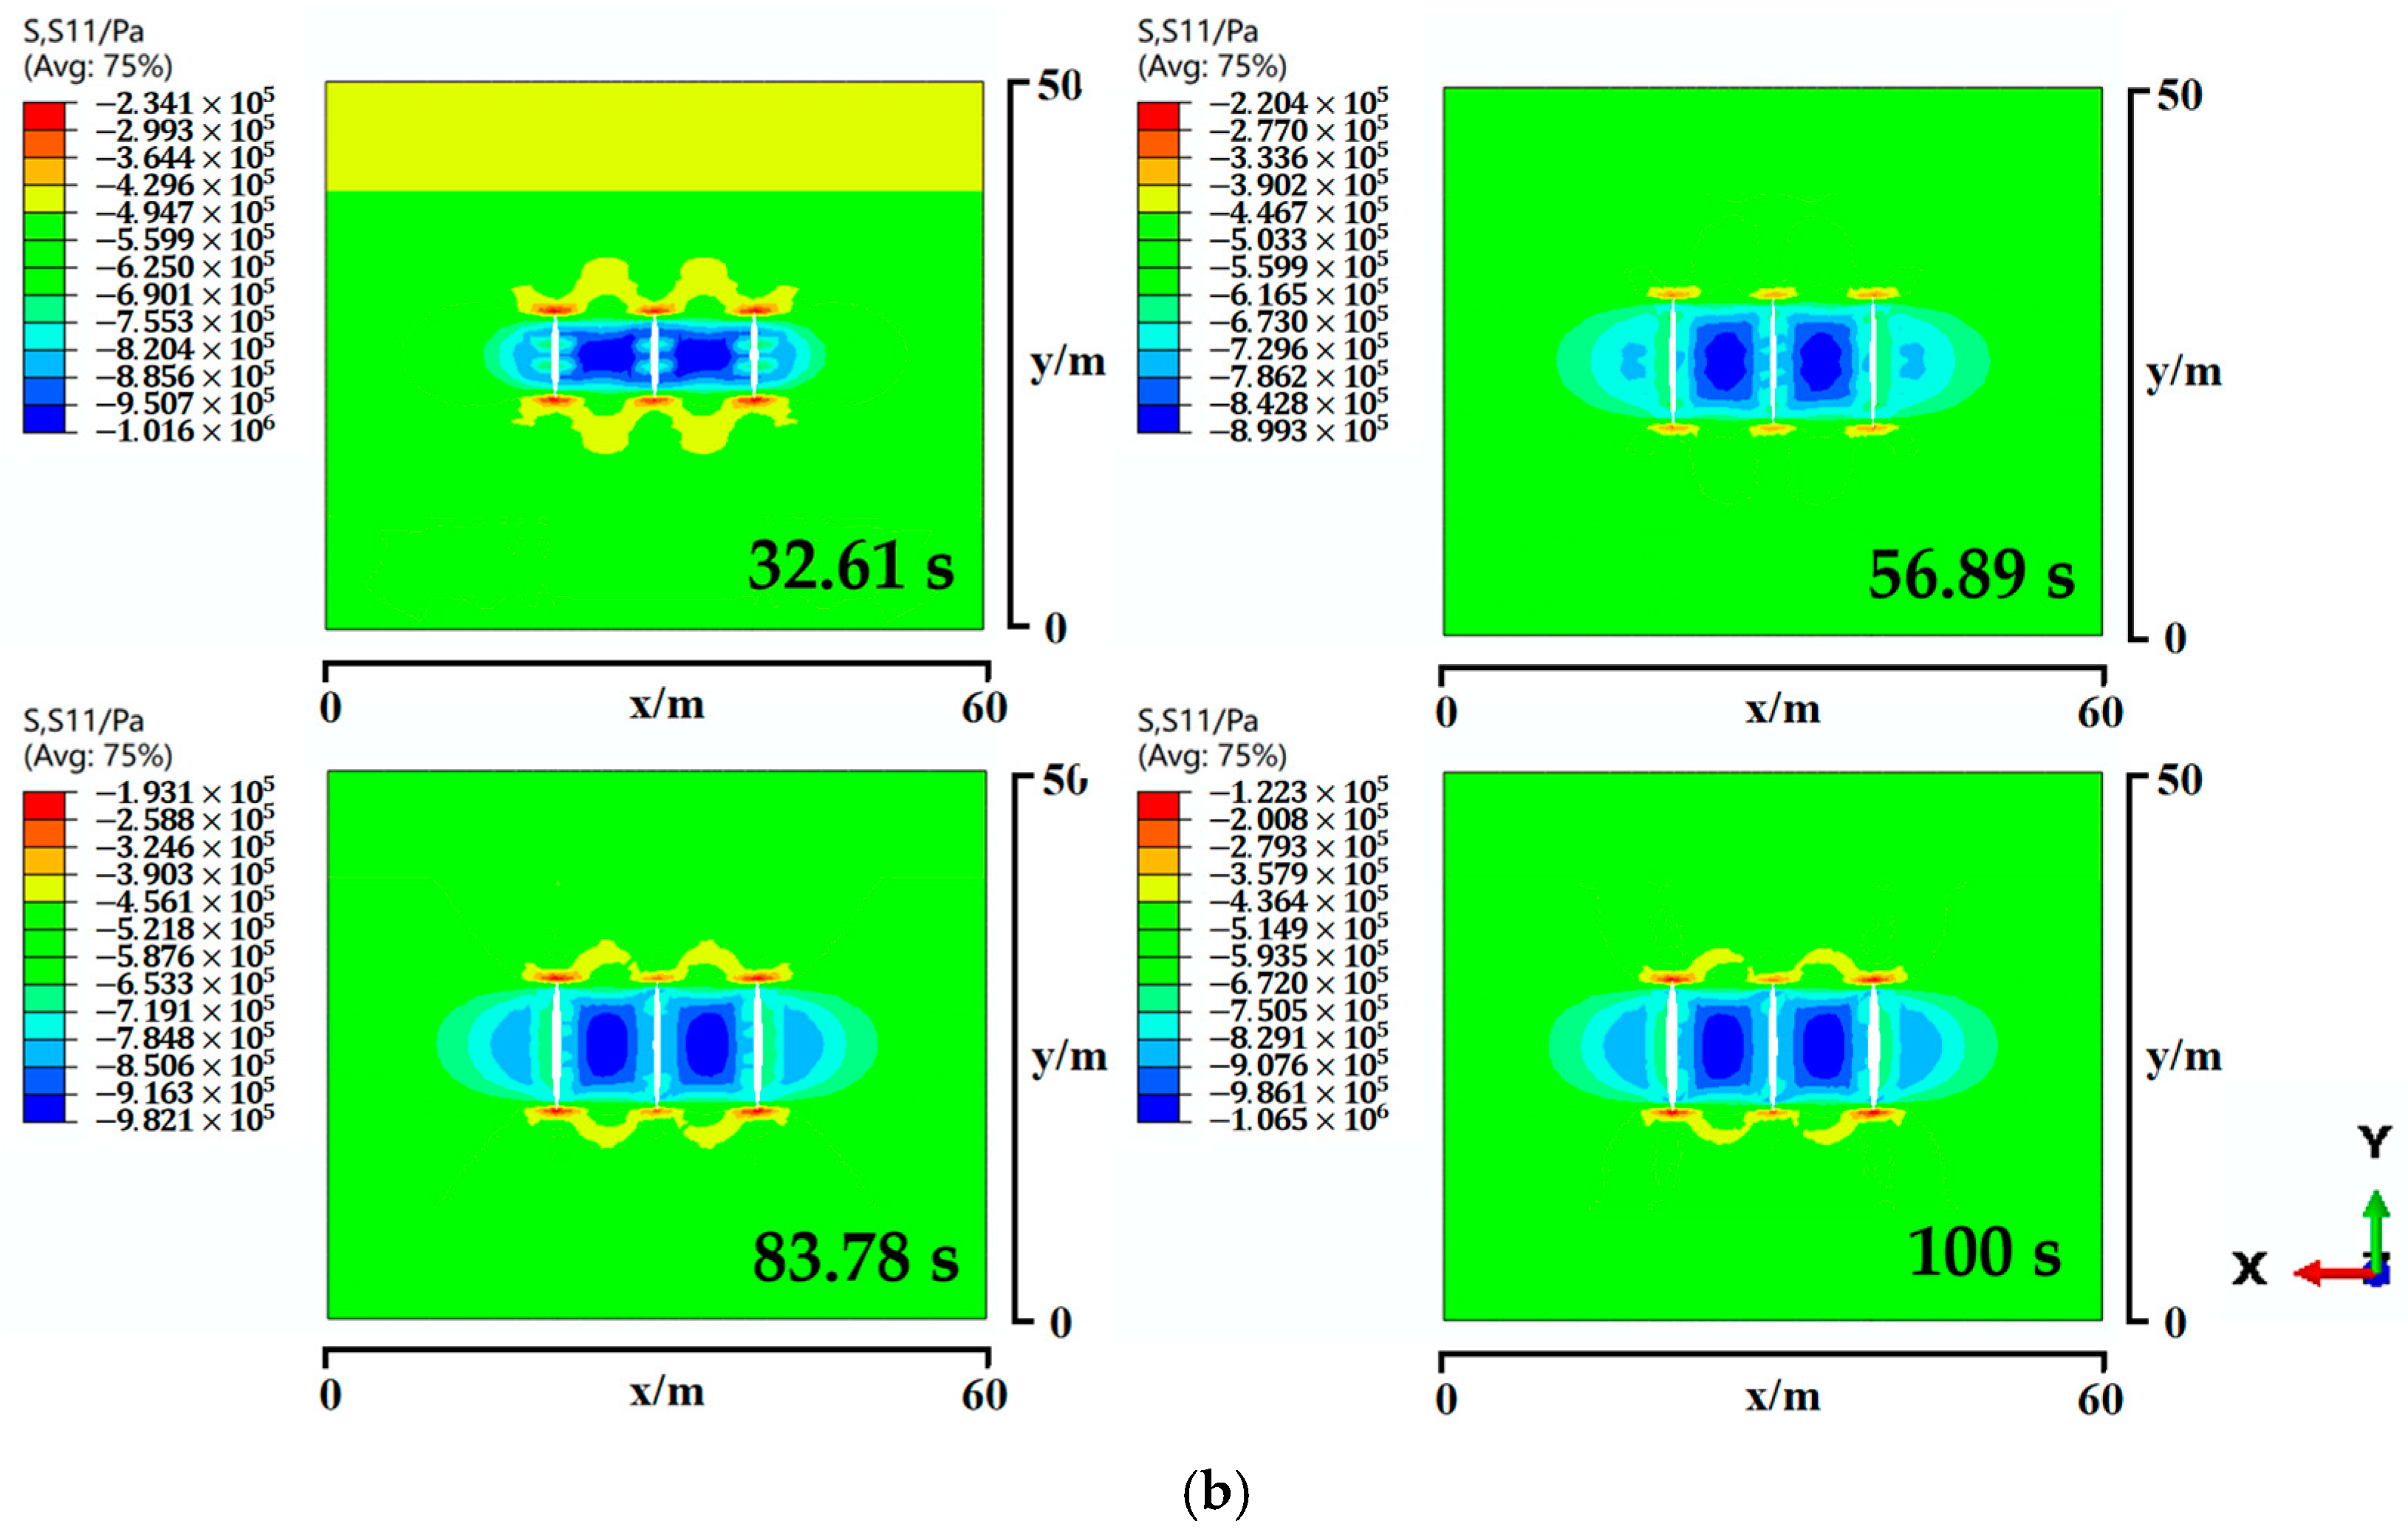
4.2.2. Effect of Cluster Spacing on Three-Cluster Simultaneous Fracturing

This part investigates a reservoir layer with 40% hydrate saturation under fracturing conditions of 0.6 m3/min per cluster fluid injection rate and 100 s total injection time. Three-cluster synchronous fracturing models were developed with respective cluster spacing configurations of 3 m, 6 m, and 9 m.
Figure 14a illustrates fracture geometry at 3 m cluster spacing, while Figure 14b shows the distribution of S11 stress (x-direction normal stress) on the symmetry plane. As shown in Figure 14, at 13.11 s, three-cluster fractures form initially, revealing minimal fracture interaction and a high-stress concentration zone between the side and middle fractures. At 41.54 s, the middle fracture becomes narrower than the lateral fractures and expands upward first due to the compressive effects from two side fractures. The in situ stress and pore pressure in the upper layer are smaller than HBL, which also prompts the fracture to propagate upward. At 79.77 s and 100 s, all three fractures extend upward, with the middle fracture extending most rapidly under the effect of high-stress concentration areas, posing significant cross-layer risks. Concurrently, the interception of the high-stress concentration areas between the fractures diverts a portion of the fracturing fluid from the middle fracture downward, forming a secondary branch.
Figure 15 shows the injection pressure and fracture width evolution of three injection points under 3 m cluster spacing. As shown in the figure, the pressure curve and width curve exhibit four distinct phases: rapid initial increase, sharp decline, gradual secondary rise, and eventual stabilization. During 0–10 s, three injection points display nearly identical injection pressure and fracture width. However, injection point 2 demonstrates a higher fracture initiation pressure, 4.33 MPa, than that of the other two injection points, which are 4.07 MPa, and the difference is 0.26 MPa. This is because stress concentrations between tightly spaced fractures have formed when fracture initiates, which elevates initiation resistance in the middle cluster. After 10 s, injection point 2 shows higher injection pressure and lower fracture width than lateral fractures. This is because the compressive stresses from the lateral fractures enhance the propagation resistance in the middle fracture. To overcome this resistance, higher injection pressures are required, ultimately constraining the width development of the middle fracture.
Figure 16a and Figure 16b present, respectively, the fracture geometry and S11 stress (x-direction normal stress) distribution during three-cluster synchronous fracturing under a cluster spacing configuration of 6 m. As shown in the figure, at 10.98 s, three cluster fractures form initially with weak inter-fracture interference, while high-stress concentration zones emerge between side fractures and the middle fracture. From 47.65 s to 100 s, under persistent high inter-fracture stress, the width in the middle fracture keeps narrower than in the side fractures, so the central fracture exhibits slightly greater height under equivalent injection fracturing fluid volume. Comparing Figure 14a and Figure 16a reveals significantly weaker compaction effects on the middle fracture from side fractures at 6 m spacing versus 3 m spacing. Additionally, comparing Figure 14b and Figure 16b demonstrates that 6 m cluster spacing produces larger inter-fracture stress concentration areas than 3 m spacing but with lower stress concentration levels.
Figure 17 illustrates the injection pressure and fracture width evolution of three injection points under 6 m cluster spacing. As shown in the figure, both the injection pressure and fracture width of the three injection points exhibit rapid initial growth followed by sharp decline, then gradual increase and subsequently slow decline several times before stabilizing. From 0 s to 8 s, the injection pressure and fracture width of three injection points are basically the same, while injection point 2 shows a marginally higher initiation pressure of 3.65 MPa than that of the other two injection points, which are 3.59 MPa, with a reduced differential pressure 0.06 MPa than the 3 m cluster spacing case which is 0.26 MPa. This is because, under 6m cluster spacing, the stress concentration zone between the fractures is just formed when fracture initiates, where the stress value is low, offering less resistance to middle fracture initiation than the 3 m cluster spacing case. From 8 s to 25 s, due to the need to offset the extra resistance imposed by the high-stress concentration zone, the injection pressure at point 2 is higher than the other two points, and its fracture width is slightly smaller than the other two points due to greater expansion difficulty. After 25 s, the injection pressure at three injection points drops to zero with the whole model pressed through, demonstrating that while adequate cluster spacing enhances fracture propagation, it concurrently increases risks of cross-layer risks.
Figure 18a and Figure 18b present, respectively, the fracture geometry and S11 stress (x-direction normal stress) distribution during three-cluster synchronous fracturing under a cluster spacing configuration of 9 m. As shown in Figure 18, at 32.61 s and 56.89 s, three fractures develop independently with nearly free interference, and high-stress concentrations emerge between lateral and middle fractures. At 83.78 s and 100 s, under the effect of high-stress concentration zones, the width of the middle fracture is smaller than that of the other two fractures. By comparing Figure 16a and Figure 18a, under 9 m cluster spacing, it represents weaker inter-fracture interference, slower propagation rates, and reduced cross-layer risks than the 6 m cluster spacing case. Comparing Figure 16b and Figure 18b indicates a prolonged fracturing fluid filling phase at 9 m cluster spacing, so the S11 stress value and concentration degree in the stress concentration zone are not lower than those in the 6 m cluster spacing case, which indirectly suggests that the fracture propagation is slower at 9 m cluster spacing.
Figure 19 represents the injection pressure and fracture width evolution of three injection points under 9 m cluster spacing. As shown in the figure, both injection pressure and fracture width of three injection points exhibit rapid initial escalation followed by an abrupt decline, then a repeated increase followed by a sharp decline. From 0 s to 15 s, the injection pressures and initiation pressures of three injection points are roughly the same, confirming that fracture interference is weak during this period, which also shows that stress interaction under 9 m cluster spacing initiates later than that of 3 m and 6 m cluster spacing. From 15 s to 80 s, the injection pressure of injection point 2 is slightly higher than that of injection points 1 and 3. This is because the occurrence of stress concentration zones marginally elevates the injection pressure of injection point 2, which constrains middle fracture propagation to a certain extent. After 80 s, the injection pressure of injection point 2 is lower than that of injection points 1 and 3, which correlates with the middle fracture upward extending into the lower stress overlying layer. From 0 s to 53 s, the fracture widths of the three injection points are nearly the same. After 53 s, the fracture width of injection point 2 is smaller than that of the other two injection points under the compression of lateral fractures.
Comparing Figure 15, Figure 17 and Figure 19 reveals that at 3 m and 6 m cluster spacings, fracture widths stabilize during later fracturing stages, whereas it exhibits continuous width fluctuations with an overall ascending trend at 9 m cluster spacing, ultimately yielding higher final width than those of 3 m and 6 m cluster spacings. This demonstrates that increased cluster spacing mitigates stress interference effects, enabling more natural fracture propagation. Smaller cluster spacing intensifies the squeezing effect on middle fracture, elevating width-direction propagation resistance and mostly generating narrow fractures, where the fracture area will correspondingly increase under the same volume of injection fracturing fluid. However, although the interference between fractures can promote the expansion of fractures to a certain extent, it will also increase the fracture cross-layer risk.

5. Conclusions

This study established a 3D fluid–solid coupled multi-cluster hydraulic fracturing model for multi-layer NGH reservoirs using cohesive elements, revealing the impacts of reservoir properties and construction parameters on single-cluster fracture initiation, propagation, and geometry, as well as the impacts of cluster spacing on stress interference in multi-cluster fracturing. The main conclusions were as follows:
  • The established model effectively characterizes the mechanical responses of fractures in NGH reservoirs during hydraulic fracturing. Cohesive elements successfully simulate the fracture morphology and dynamic propagation behavior, with the reservoir parameters of the model assigned using data from hydrate production tests at Site SH2 in the Shenhu Area, South China Sea.
  • Hydrate-bearing sediments with low plasticity exhibit higher hydraulic fracture propagation efficiency and reduced plastic deformation dissipation. Increasing hydrate saturation enhances the mechanical properties and reduces fluid filtration, driving fracture morphology from slender to short. The low-plastic reservoir with high hydrate saturation (SH > 50%) is identified as the optimal reservoir condition in this paper.
  • The fracturing fluid with a viscosity of 10 mPa∙s and an injection rate of 0.6 m3/min is the optimal combination for balancing fracture SRV and cross-layer risks.
  • In multi-cluster fracturing, inter-fracture stress interference significantly affects the fracture propagation behavior. It reduces the fracture width by 33–63% (3 m cluster spacing) and 57–62% (6 m cluster spacing) while increasing the fracture length and height, among which the middle fracture of three-cluster fracturing exhibits pronounced interference effect. The inter-fracture stress interference nearly vanishes till 9m cluster spacing.

Author Contributions

Conceptualization: L.L. (Lisha Liao), Y.A., J.W. and Y.Z.; methodology: L.L. (Lisha Liao), Y.A., J.W. and Y.Z.; software: L.L. (Lisha Liao), J.W., L.L. (Lerui Liu), M.C., Y.G. and J.H.; formal analysis: L.L. (Lisha Liao), Y.A. and J.W.; investigation: L.L. (Lisha Liao), Y.G. and J.H.; resources: Y.A., J.W. and Y.Z.; data curation: L.L. (Lisha Liao) and J.W.; writing—original draft preparation: L.L. (Lisha Liao); writing—review and editing: L.L. (Lisha Liao), Y.A., J.W. and Y.Z.; visualization: L.L. (Lisha Liao); supervision: Y.A., J.W. and Y.Z.; project administration: L.L. (Lisha Liao) and Y.Z.; funding acquisition: Y.Z. All authors have read and agreed to the published version of the manuscript.

Funding

National Key Research and Development Program of China (2023YFC2811003).

Data Availability Statement

The data that support the findings of this study are available from the corresponding authors upon reasonable request.

Conflicts of Interest

The authors declare that this research was conducted in the absence of any commercial or financial relationships that could be construed as a potential conflict of interest.

References

  1. Makogon, Y.F.; Holditch, S.A.; Makogon, T.Y. Natural gas-hydrates—A potential energy source for the 21st Century. J. Pet. Sci. Eng. 2007, 56, 14–31. [Google Scholar] [CrossRef]
  2. Kvenvolden, K.A. Methane hydrate—A major reservoir of carbon in the shallow geosphere? Chem. Geol. 1988, 71, 41–51. [Google Scholar] [CrossRef]
  3. Buffett, B.A. Clathrate Hydrates. Annu. Rev. Earth Planet. Sci. 2000, 28, 477–507. [Google Scholar] [CrossRef]
  4. Boswell, R.; Hancock, S.; Yamamoto, K.; Collett, T.; Pratap, M.; Lee, S.-R. Natural Gas Hydrates: Status of Potential as an Energy Resource. In Future Energy, 3rd ed.; Letcher, T.M., Ed.; Elsevier: Amsterdam, The Netherlands, 2020; pp. 111–131. [Google Scholar]
  5. Misyura, S.Y.; Manakov, A.Y.; Nyashina, G.S.; Gaidukova, O.S.; Morozov, V.S.; Skiba, S.S. Gas Hydrate Combustion in Five Method of Combustion Organization. Entropy 2020, 22, 710. [Google Scholar] [CrossRef]
  6. Antonov, D.V.; Donskoy, I.G.; Gaidukova, O.S.; Misyura, S.Y.; Morozov, V.S.; Nyashina, G.S.; Strizhak, P.A. Dissociation characteristics and anthropogenic emissions from the combustion of double gas hydrates. Environ. Res. 2022, 214, 113990. [Google Scholar] [CrossRef]
  7. Sloan, E.D., Jr.; Koh, C.A. Clathrate Hydrates of Natural Gases; CRC Press: Boca Raton, FL, USA, 2007. [Google Scholar]
  8. Sun, C.; Li, W.; Yang, X.; Li, F.; Yuan, Q.; Mu, L.; Chen, J.; Liu, B.; Chen, G. Progress in research of gas hydrate. Chin. J. Chem. Eng. 2011, 19, 151–162. [Google Scholar] [CrossRef]
  9. Kou, X.; Wang, Y.; Li, X.-S.; Zhang, Y.; Chen, Z.-Y. Influence of heat conduction and heat convection on hydrate dissociation by depressurization in a pilot-scale hydrate simulator. Appl. Energy 2019, 251, 113405. [Google Scholar] [CrossRef]
  10. Feng, J.-C.; Wang, Y.; Li, X.-S. Hydrate dissociation induced by depressurization in conjunction with warm brine stimulation in cubic hydrate simulator with silica sand. Appl. Energy 2016, 174, 181–191. [Google Scholar] [CrossRef]
  11. Wang, Y.; Feng, J.-C.; Li, X.-S.; Zhang, Y. Experimental investigation of optimization of well spacing for gas recovery from methane hydrate reservoir in sandy sediment by heat stimulation. Appl. Energy 2017, 207, 562–572. [Google Scholar] [CrossRef]
  12. Tupsakhare, S.S.; Castaldi, M.J. Efficiency enhancements in methane recovery from natural gas hydrates using injection of CO2/N2 gas mixture simulating in-situ combustion. Appl. Energy 2019, 236, 825–836. [Google Scholar] [CrossRef]
  13. Giovannetti, R.; Gambelli, A.M.; Rossi, A.; Castellani, B.; Minicucci, M.; Zannotti, M.; Nicolini, A.; Rossi, F. Thermodynamic assessment and microscale Raman spectroscopy of binary CO2/CH4 hydrates produced during replacement applications in natural reservoirs. J. Mol. Liq. 2022, 368, 120739. [Google Scholar] [CrossRef]
  14. Gambelli, A.M.; Rossi, F. Natural gas hydrates: Comparison between two different applications of thermal stimulation for performing CO2 replacement. Energy 2019, 172, 423–434. [Google Scholar] [CrossRef]
  15. Collett, T.S.; Kuuskraa, V.A. Hydrates contain vast store of world gas resources. Oil Gas J. 1998, 96, 90–95. [Google Scholar]
  16. Collett, T.S.; Ginsburg, G.D. Gas hydrates in the Messoyakha gas field of the West Siberian Basin-a re-examination of the geologic evidence. Int. J. Offshore Polar Eng. 1998, 8, 22–29. [Google Scholar]
  17. Chen, Z.-Y.; Li, Q.-P.; Yan, Z.-Y.; Yan, K.-F.; Zeng, Z.-Y.; Li, X.-S. Phase equilibrium and dissociation enthalpies for cyclopentane+ methane hydrates in NaCl aqueous solutions. J. Chem. Eng. Data 2010, 55, 4444–4449. [Google Scholar] [CrossRef]
  18. Tupsakhare, S.S.; Kattekola, S.; Castaldi, M.J. An application of the results from the large-scale thermal stimulation method of methane hydrate dissociation to the field tests. Ind. Eng. Chem. Res. 2017, 56, 4588–4599. [Google Scholar] [CrossRef]
  19. Gambelli, A.M.; Tinivella, U.; Giovannetti, R.; Castellani, B.; Giustiniani, M.; Rossi, A.; Zannotti, M.; Rossi, F. Observation of the main natural parameters influencing the formation of gas hydrates. Energies 2021, 14, 1803. [Google Scholar] [CrossRef]
  20. Hassanpouryouzband, A.; Joonaki, E.; Farahani, M.V.; Takeya, S.; Ruppel, C.; Yang, J.; English, N.J.; Schicks, J.M.; Edlmann, K.; Mehrabian, H. Gas hydrates in sustainable chemistry. Chem. Soc. Rev. 2020, 49, 5225–5309. [Google Scholar]
  21. Merey, S.; Chen, L. Worldwide regulations and policy trends on gas production from gas hydrates. Sci. Technol. Energy Transit. 2023, 78, 23. [Google Scholar] [CrossRef]
  22. Ye, J.; Qin, X.; Xie, W.; Lu, H.; Ma, B.; Qiu, H.; Liang, J.; Lu, J.; Kuang, Z.; Lu, C.; et al. Main progress of the second gas hydrate trial production in the South China Sea. Geol. China 2020, 47, 557–568. [Google Scholar]
  23. Zhou, S.; Li, Q.; Lv, X.; Fu, Q.; Zhu, J. Key issues in development of offshore natural gas hydrate. Front. Energy 2020, 14, 433–442. [Google Scholar] [CrossRef]
  24. Noguchi, S.; Shimoda, N.; Takano, O.; Oikawa, N.; Inamori, T.; Saeki, T.; Fujii, T. 3-D internal architecture of methane hydrate-bearing turbidite channels in the eastern Nankai Trough, Japan. Mar. Pet. Geol. 2011, 28, 1817–1828. [Google Scholar] [CrossRef]
  25. Saeki, T.; Fujii, T.; Inamori, T.; Kobayashi, T.; Hayashi, M.; Nagakubo, S.; Takano, O. Extraction of methane hydrate concentrated zone for resource assessment in the eastern Nankai Trough, Japan. In Proceedings of the Offshore Technology Conference, Houston, TX, USA, 5–8 May 2008. OTC–19311–MS. [Google Scholar] [CrossRef]
  26. Yoneda, J.; Masui, A.; Konno, Y.; Jin, Y.; Egawa, K.; Kida, M.; Ito, T.; Nagao, J.; Tenma, N. Mechanical properties of hydrate-bearing turbidite reservoir in the first gas production test site of the Eastern Nankai Trough. Mar. Pet. Geol. 2015, 66, 471–486. [Google Scholar] [CrossRef]
  27. Wei, J.; Liang, J.; Lu, J.; Zhang, W.; He, Y. Characteristics and dynamics of gas hydrate systems in the northwestern South China Sea-results of the fifth gas hydrate drilling expedition. Mar. Pet. Geol. 2019, 110, 287–298. [Google Scholar] [CrossRef]
  28. Li, J.-F.; Ye, J.-L.; Qin, X.-W.; Qiu, H.-J.; Wu, N.-Y.; Lu, H.-L.; Xie, W.-W.; Lu, J.-A.; Peng, F.; Xu, Z.-Q.; et al. The first offshore natural gas hydrate production test in South China Sea. China Geol. 2018, 1, 5–16. [Google Scholar] [CrossRef]
  29. Yan, J.; Yan, K.; Huang, T.; Mao, M.; Li, X.; Chen, Z.; Pang, W.; Qin, R.; Ruan, X. Research Progress on Characteristics of Marine Natural Gas Hydrate Reservoirs. Energies 2024, 17, 4431. [Google Scholar] [CrossRef]
  30. Gong, G.; Zhao, G.; Pang, W.; Yang, M.; Chen, B.; Zheng, J.-N. Review of hydrate-bearing sediment permeability for natural gas hydrate exploitation: Measurement and application development. J. Pet. Sci. Eng. 2023, 220, 111217. [Google Scholar] [CrossRef]
  31. Wang, J.; He, J.; Dong, H.; Ge, K. Association between multiphase seepage and exploitation of natural gas hydrate based on the Shenhu area of South China Sea. J. Pet. Sci. Eng. 2022, 209, 109855. [Google Scholar] [CrossRef]
  32. Ma, K.; Li, D.; Liang, D. Reservoir stimulation technologies for natural gas hydrate: Research progress, challenges, and perspectives. Energy Fuels 2023, 37, 10112–10133. [Google Scholar] [CrossRef]
  33. Konno, Y.; Jin, Y.; Yoneda, J.; Uchiumi, T.; Shinjou, K.; Nagao, J. Hydraulic fracturing in methane-hydrate-bearing sand. RSC Adv. 2016, 6, 73148–73155. [Google Scholar] [CrossRef]
  34. Zhang, W.; Shi, X.; Jiang, S.; Cao, Q.; Wang, F.; Wang, Z.; Ge, Y.; Du, Y. Experimental study of hydraulic fracture initiation and propagation in highly saturated methane-hydrate-bearing sands. J. Nat. Gas Sci. Eng. 2020, 79, 103338. [Google Scholar] [CrossRef]
  35. Wang, X.; Sun, Y.; Chen, H.; Peng, S.; Jiang, S.; Ma, X. Experimental study on the depressurization of methane hydrate in the clayey silt sediments via hydraulic fracturing. Energy Fuels 2023, 37, 4377–4390. [Google Scholar] [CrossRef]
  36. Lu, H.; Shang, S.; Chen, X.; Qin, X.; Gu, L.; Qiu, H. Research progress and development direction of numerical simulator for natural gas hydrate development. Acta Petrol. Sin. 2021, 42, 1516. [Google Scholar]
  37. Liu, X.; Sun, Y.; Guo, T.; Rabiei, M.; Qu, Z.; Hou, J. Numerical simulations of hydraulic fracturing in methane hydrate reservoirs based on the coupled thermo-hydrologic-mechanical-damage (THMD) model. Energy 2022, 238, 122054. [Google Scholar] [CrossRef]
  38. Ma, X.; Cheng, J.; Sun, Y.; Li, S. 2D numerical simulation of hydraulic fracturing in hydrate-bearing sediments based on the cohesive element. Energy Fuels 2021, 35, 3825–3840. [Google Scholar] [CrossRef]
  39. Wang, J.; Zhang, Y.; Hui, C.; Ren, Y.; Cui, X.; Jiang, Y.; An, Y.; Huang, H. Numerical research of fracture initiation in hydrate reservoirs based on XFEM. In Proceedings of the ARMA US Rock Mechanics/Geomechanics Symposium, Golden, CO, USA, 23–26 June 2024. D022S024R011. [Google Scholar] [CrossRef]
  40. Huang, Y.; Wang, T.; Wang, R.; Wang, H.; Lu, X.; Zhang, X. Numerical simulation of hydraulic fracture characteristics in gas hydrate bearing-sediments by using CDEM. Acta Mech. Sin. 2024, 40, 322273. [Google Scholar] [CrossRef]
  41. Liang, X.; Zhao, H.; Dang, Y.; Lei, Q.; Wang, S.; Wang, X.; Chai, H.; Jia, J.; Wang, Y. Numerical Investigation on Mesoscale Evolution of Hydraulic Fractures in Hydrate-Bearing Sediments. Energies 2023, 16, 7502. [Google Scholar] [CrossRef]
  42. Chuprakov, D.A.; Akulich, A.V.; Siebrits, E.; Thiercelin, M. Hydraulic-fracture propagation in a naturally fractured reservoir. SPE Prod. Oper. 2011, 26, 88–97. [Google Scholar] [CrossRef]
  43. Xie, L.; Min, K.-B.; Shen, B. Simulation of hydraulic fracturing and its interactions with a pre-existing fracture using displacement discontinuity method. J. Nat. Gas Sci. Eng. 2016, 36, 1284–1294. [Google Scholar] [CrossRef]
  44. Fatahi, H.; Hossain, M.M.; Sarmadivaleh, M. Numerical and experimental investigation of the interaction of natural and propagated hydraulic fracture. J. Nat. Gas Sci. Eng. 2017, 37, 409–424. [Google Scholar] [CrossRef]
  45. Jing, L.; Ma, Y.; Fang, Z. Modeling of fluid flow and solid deformation for fractured rocks with discontinuous deformation analysis (DDA) method. Int. J. Rock Mech. Min. Sci. 2001, 38, 343–355. [Google Scholar] [CrossRef]
  46. Belytschko, T.; Black, T. Elastic crack growth in finite elements with minimal remeshing. Int. J. Numer. Methods Eng. 1999, 45, 601–620. [Google Scholar] [CrossRef]
  47. Taleghani, A.D.; Gonzalez, M.; Shojaei, A. Overview of numerical models for interactions between hydraulic fractures and natural fractures: Challenges and limitations. Comput. Geotech. 2016, 71, 361–368. [Google Scholar] [CrossRef]
  48. Guo, J.; Luo, B.; Lu, C.; Lai, J.; Ren, J. Numerical investigation of hydraulic fracture propagation in a layered reservoir using the cohesive zone method. Eng. Fract. Mech. 2017, 186, 195–207. [Google Scholar] [CrossRef]
  49. Zhai, L.; Zhang, H.; Pan, D.; Zhu, Y.; Zhu, J.; Zhang, Y.; Chen, C. Optimisation of hydraulic fracturing parameters based on cohesive zone method in oil shale reservoir with random distribution of weak planes. J. Nat. Gas Sci. Eng. 2020, 75, 103130. [Google Scholar] [CrossRef]
  50. Chen, Z. Finite element modelling of viscosity-dominated hydraulic fractures. J. Pet. Sci. Eng. 2012, 88, 136–144. [Google Scholar] [CrossRef]
  51. Gao, Q.; Cheng, Y.; Han, S.; Yan, C.; Jiang, L. Numerical modeling of hydraulic fracture propagation behaviors influenced by pre-existing injection and production wells. J. Pet. Sci. Eng. 2019, 172, 976–987. [Google Scholar] [CrossRef]
  52. Wang, S.; Li, D.; Mitri, H.; Li, H. Numerical simulation of hydraulic fracture deflection influenced by slotted directional boreholes using XFEM with a modified rock fracture energy model. J. Pet. Sci. Eng. 2020, 193, 107375. [Google Scholar] [CrossRef]
  53. Ma, X.; Jiang, D.; Fang, X.; Wang, X. Numerical simulation of single-cluster and multi-cluster fracturing of hydrate reservoir based on cohesive element. Eng. Fract. Mech. 2022, 265, 108365. [Google Scholar] [CrossRef]
  54. Lu, J.; Lin, D.; Li, D.; Liang, D.; Wen, L.; Wu, S.; Zhang, Y.; He, Y.; Shi, L.; Xiong, Y. Microcosmic Characteristics of Hydrate Formation and Decomposition in the Different Particle Size Sediments Captured by Cryo-SEM. J. Mar. Sci. Eng. 2022, 10, 769. [Google Scholar] [CrossRef]
  55. Luo, T.; Li, Y.; Madhusudhan, B.; Zhao, J.; Song, Y. Comparative analysis of the consolidation and shear behaviors of CH4 and CO2 hydrate-bearing silty sediments. J. Nat. Gas Sci. Eng. 2020, 75, 103157. [Google Scholar] [CrossRef]
  56. Sun, J.; Ning, F.; Li, S.; Zhang, K.; Liu, T.; Zhang, L.; Jiang, G.; Wu, N. Numerical simulation of gas production from hydrate-bearing sediments in the Shenhu area by depressurising: The effect of burden permeability. J. Unconv. Oil Gas Res. 2015, 12, 23–33. [Google Scholar] [CrossRef]
  57. Moridis, G.J.; Reagan, M.T.; Kim, S.-J.; Seol, Y.; Zhang, K. Evaluation of the gas production potential of marine hydrate deposits in the Ulleung Basin of the Korean East Sea. SPE J. 2009, 14, 759–781. [Google Scholar] [CrossRef]
  58. Li, B.; Li, X.-S.; Li, G.; Chen, Z.-Y. Evaluation of gas production from Qilian Mountain permafrost hydrate deposits in two-spot horizontal well system. Cold Reg. Sci. Technol. 2015, 109, 87–98. [Google Scholar] [CrossRef]
  59. Hui, C.; Zhang, Y.; An, Y.; Hu, Z.; Zhuang, X.; Wang, J.; Qin, Y.; Li, G. Experimental research on fracture initiation and propagation behavior in argillaceous silt hydrate reservoirs. Geoenergy Sci. Eng. 2025, 249, 213774. [Google Scholar] [CrossRef]
  60. Yoneda, J.; Masui, A.; Konno, Y.; Jin, Y.; Kida, M.; Katagiri, J.; Nagao, J.; Tenma, N. Pressure-core-based reservoir characterization for geomechanics: Insights from gas hydrate drilling during 2012–2013 at the eastern Nankai Trough. Mar. Pet. Geol. 2017, 86, 1–16. [Google Scholar] [CrossRef]
  61. Carman, P.C. Fluid flow through granular beds. Chem. Eng. Res. Des. 1997, 75, S32–S48. [Google Scholar] [CrossRef]
  62. Dai, S.; Seol, Y. Water permeability in hydrate-bearing sediments: A pore-scale study. Geophys. Res. Lett. 2014, 41, 4176–4184. [Google Scholar] [CrossRef]
  63. Su, Z.; Moridis, G.J.; Zhang, K.; Wu, N. A huff-and-puff production of gas hydrate deposits in Shenhu area of South China Sea through a vertical well. J. Pet. Sci. Eng. 2012, 86, 54–61. [Google Scholar] [CrossRef]
  64. Sun, J.; Ning, F.; Liu, T.; Liu, C.; Chen, Q.; Li, Y.; Cao, X.; Mao, P.; Zhang, L.; Jiang, G. Gas production from a silty hydrate reservoir in the South China Sea using hydraulic fracturing: A numerical simulation. Energy Sci. Eng. 2019, 7, 1106–1122. [Google Scholar] [CrossRef]
  65. Zhang, D.; Ranjith, P.; Perera, M. The brittleness indices used in rock mechanics and their application in shale hydraulic fracturing: A review. J. Pet. Sci. Eng. 2016, 143, 158–170. [Google Scholar] [CrossRef]
  66. Hou, Z.-K.; Cheng, H.-L.; Sun, S.-W.; Chen, J.; Qi, D.-Q.; Liu, Z.-B. Crack propagation and hydraulic fracturing in different lithologies. Appl. Geophys. 2019, 16, 243–251. [Google Scholar] [CrossRef]
  67. Wu, P.; Li, Y.; Liu, W.; Sun, X.; Kong, X.; Song, Y. Cementation failure behavior of consolidated gas hydrate-bearing sand. J. Geophys. Res. Solid Earth 2020, 125, e2019JB018623. [Google Scholar] [CrossRef]
  68. Lei, L.; Seol, Y.; Choi, J.-H.; Kneafsey, T.J. Pore habit of methane hydrate and its evolution in sediment matrix–Laboratory visualization with phase-contrast micro-CT. Mar. Pet. Geol. 2019, 104, 451–467. [Google Scholar] [CrossRef]
  69. Mills, C.; Marshall, C.; Kay, A.; MacDonald, M. Flow measurement of high viscosity fluids. In Proceedings of the North Sea Flow Measurement Workshop, Tonsberg, Norway, 22–25 October 2013. [Google Scholar]
  70. Yu, Y.; Liu, J.; Ma, X.; Yang, G.; Sun, Y.; Sun, W.; Shi, W. Mechanism analysis of multi-cluster fracture interference in horizontal wells of hydrate reservoirs in the South China Sea. Energy Fuels 2022, 36, 3580–3595. [Google Scholar] [CrossRef]
  71. Lu, Q.; Zhang, L.; Guo, J.; Zou, L.; He, L.; Chen, L. Numerical investigation of fracture interference effects on multi-fractures propagation in fractured shale. Eng. Fract. Mech. 2023, 286, 109322. [Google Scholar]
  72. Huang, T.; Zhu, H.; Liu, Q.; Dai, X.; Tang, X.; Yi, X.; He, X.; She, C.; Zheng, M. Study on multi-cluster fracture interlaced competition propagation model of hydraulic fracturing in heterogeneous reservoir. Geoenergy Sci. Eng. 2025, 244, 213415. [Google Scholar] [CrossRef]
Figure 1. Traction separation law.
Jmse 13 01224 g001
Figure 2. Hydraulic fracturing model: (a) fracturing of 3D horizontal well; (b) cohesive interface; and (c) symmetry plane.
Jmse 13 01224 g002
Figure 3. Plastic influence: (a) fracture morphology at 120 s (PFOPEN is fracture opening, m); (b) injection pressure evolution.
Jmse 13 01224 g003
Figure 4. Fracture morphology under different hydrate saturation at 150 s.
Jmse 13 01224 g004
Figure 5. Injection pressure evolution under varying hydrate saturations.
Jmse 13 01224 g005
Figure 6. Fracture initiation pressure and initiation time under varying hydrate saturations.
Jmse 13 01224 g006
Figure 7. The influence of fracturing fluid viscosity: (a) injection pressure; (b) initiation pressure.
Jmse 13 01224 g007
Figure 8. Fracture width and half-length at 150 s under varying fracturing fluid viscosities.
Jmse 13 01224 g008
Figure 9. Fracture initiation pressure and initiation time under varying injection rates.
Jmse 13 01224 g009
Figure 10. Fracture geometry under different injection rates at 120 s.
Jmse 13 01224 g010
Figure 11. Fracture state under 0.6 m3/min injection rate: (a) fracture geometry; (b) fracture width.
Jmse 13 01224 g011
Figure 12. Cluster spacing (3 m): (a) fracture geometry (150 times deformation scaling factor); (b) distribution of S11 stress (x-direction normal stress) on the symmetry plane.
Jmse 13 01224 g012
Figure 13. Fracture geometry of two-cluster synchronous fracturing at 120 s (50 times deformation scaling factor): (a) cluster spacing = 3 m; (b) cluster spacing = 6 m; and (c) cluster spacing = 9 m.
Jmse 13 01224 g013
Figure 14. Three-cluster simultaneous fracturing at 3 m cluster spacing: (a) fracture geometry (50 times deformation scaling factor); (b) S11 stress distribution (x-direction normal stress) on the symmetry plane.
Jmse 13 01224 g014aJmse 13 01224 g014b
Figure 15. Injection pressure and fracture width evolution of three injection points under 3 m cluster spacing.
Jmse 13 01224 g015
Figure 16. Three-cluster simultaneous fracturing at 6m cluster spacing: (a) fracture geometry (50 times deformation scaling factor); (b) S11 stress distribution (x-direction normal stress) on the symmetry plane.
Jmse 13 01224 g016
Figure 17. Injection pressure and fracture width variations at three injection points under 6m cluster spacing.
Jmse 13 01224 g017
Figure 18. Three-cluster simultaneous fracturing at 9 m cluster spacing: (a) fracture geometry (50 times deformation scaling factor); (b) S11 stress distribution (x-direction normal stress) on the symmetry plane.
Jmse 13 01224 g018aJmse 13 01224 g018b
Figure 19. Injection pressure and fracture width variations at three injection points under 9 m cluster spacing.
Jmse 13 01224 g019
Table 1. Physical parameters of hydrate reservoir under different saturation.
Hydrate Saturation (%)Elastic
Modulus (MPa)
Tensile Strength (MPa)Permeability Coefficient (m/s)Void RatioFiltration
Coefficient
(m/(s·Pa))
Poisson’s
Ratio
Case 130266.850.4907.13×10−90.79571.786 × 10−130.3
Case 240339.590.5923.55 × 10−90.61241.786 × 10−130.3
Case 350439.500.4171.66 × 10−90.46311.786 × 10−130.3
Case 460578.990.8657.04 × 10−100.33901.786 × 10−130.3
Disclaimer/Publisher’s Note: The statements, opinions and data contained in all publications are solely those of the individual author(s) and contributor(s) and not of MDPI and/or the editor(s). MDPI and/or the editor(s) disclaim responsibility for any injury to people or property resulting from any ideas, methods, instructions or products referred to in the content.

