1. Introduction
In the UK, domestic cargo transportation primarily relies on road transport, which accounted for 81% of the freight moved (measured in tonne-kilometers) in 2023. Water transport represented 12%, rail handled 7% and air transport plays a minor role in domestic freight and is typically not reported in significant enough detail for such statistics [
1]. The United Kingdom, an island nation with large maritime boundaries and a leading transport sector globally (333.9 million tonnes) and nationally (91.9 million tonnes) [
2,
3,
4], is potentially in a particular position to spearhead coastal-waterway transportation [
5,
6]. Unlike countries such as Norway, Japan, those around the Great Lakes, or Germany, which utilize extensive regional waterborne freight systems on coastal or inland waterways, the UK primarily relies on road freight to distribute goods from its major ports to manufacturing centers and end users [
7]. The UK’s inland waterways, encompassing over 5000 miles of rivers and canals, serve as vital assets for transportation, tourism, environmental sustainability, and local economies [
4,
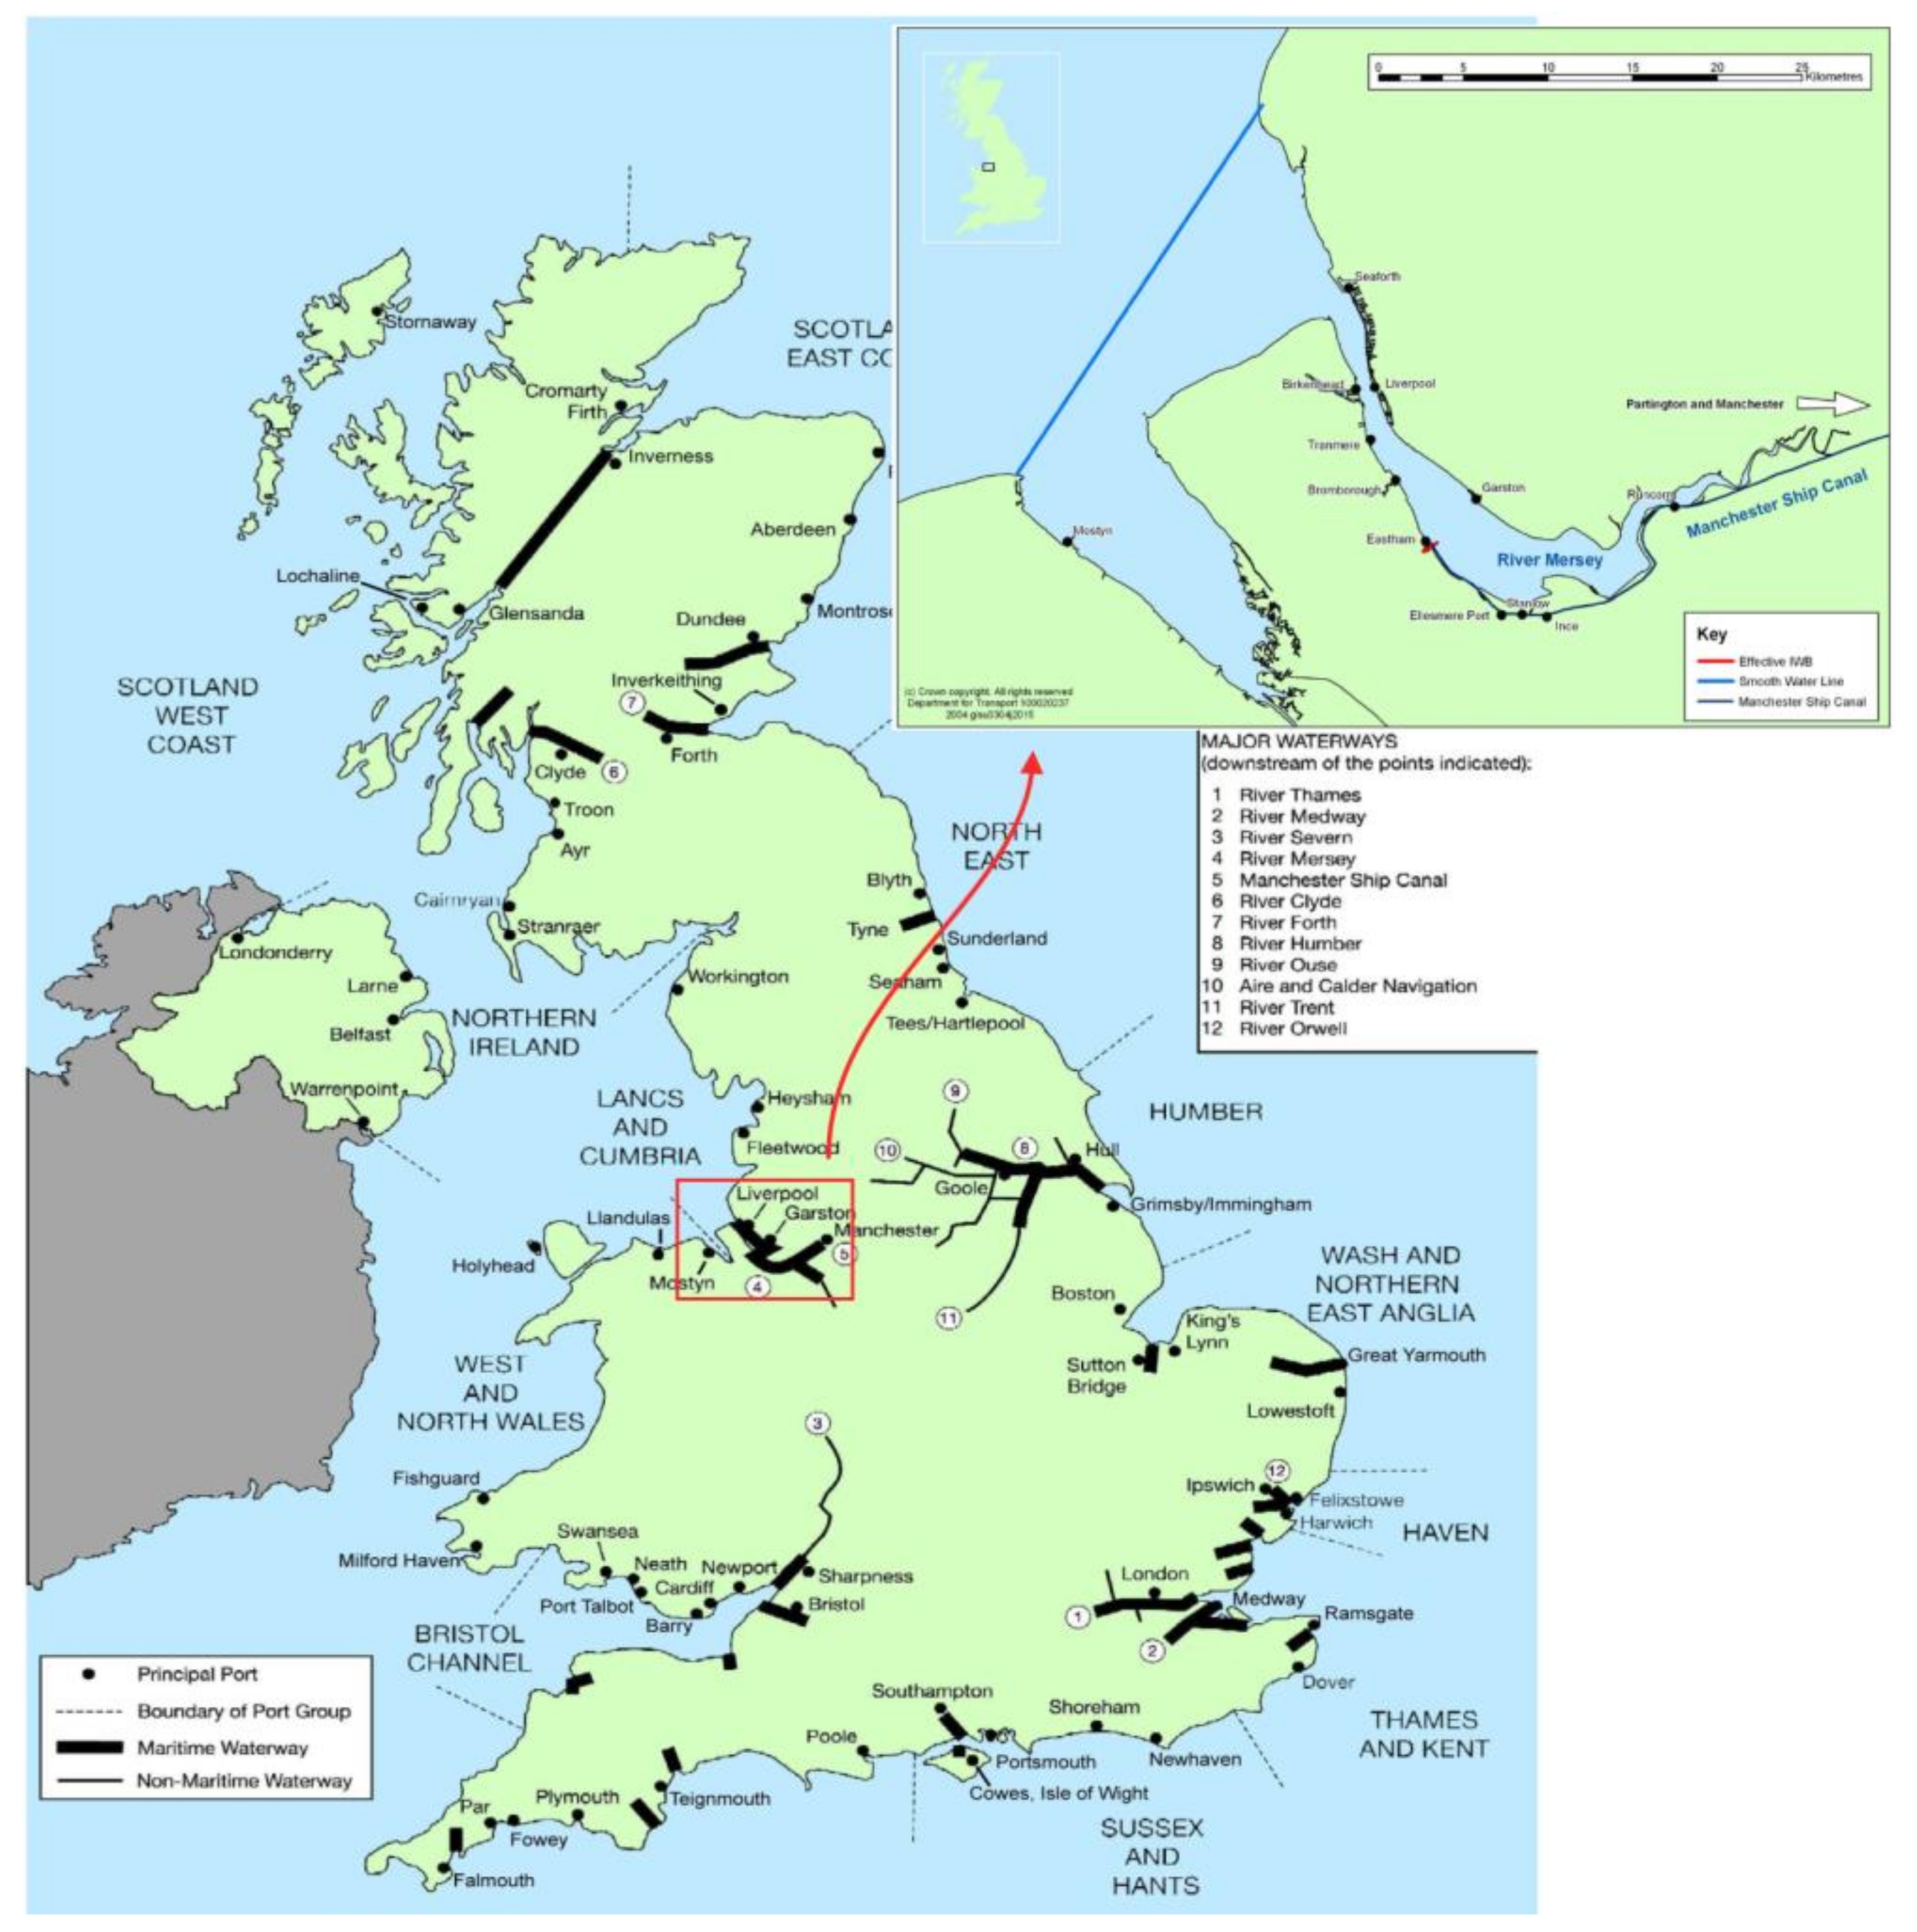
8]. For short to medium distances, coastal shipping can accommodate the transportation of goods and passengers along a country’s coastlines using small- to medium-sized vessels. Major rivers like the Thames, Trent, and Humber (See
Figure 1) handle significant freight traffic, with the Thames alone accounting for 23.6 million tonnes. The total inland freight capacity could increase by improving waterway infrastructure and integrating multimodal logistics. Accordingly, one may realise the potential of modal shift, transferring freight from road to waterways, as a cost-effective and environmentally friendly alternative for transporting unitized or bulk goods. Accordingly, this paper aims to propose and assess a multimodal transportation concept focusing on maritime coastal-waterway transportation across the UK, aiming to sustainably empower the usage of currently underutilized waterways. This alternative cargo shipping approach will complement the road transport supply chains to decongest road traffic [
9,
10,
11]. The Liverpool–Manchester corridor was chosen to highlight the UK’s leadership in decarbonization and its potential as a global model for sustainable freight systems, with findings applicable to similar systems worldwide. The proposed multimodal maritime transportation describes an aspiration to create a fully integrated inland waterway highway.
2. Literature Review
The transportation sector, driven by surging demand, is a key contributor to greenhouse gas (GHG) emissions. The European Commission and OECD have highlighted the sector’s reliance on road transport as unsustainable, urging a shift towards multimodal logistics solutions to cut emissions and improve efficiency [
13,
14,
15]. Intermodal transportation, which combines multiple modes such as road, rail, and maritime, has gained attention as a sustainable solution. Its role in logistics aligns with environmental sustainability efforts, offering cost-effective and eco-friendly transport that meets growing regulatory and consumer demands for low-carbon alternatives [
16]. Road transport presents significant challenges in terms of congestion, emissions, and infrastructure degradation. According to the International Energy Agency (IEA), road transport accounts for nearly 75% of global transport CO
2 emissions, making it a critical focus area for reducing environmental impacts [
17]. Externalities such as noise pollution, traffic accidents, and high energy consumption exacerbate its societal costs. In contrast, coastal and waterway transport offers a more sustainable alternative, with a lower carbon footprint. While waterways excel in energy efficiency and cost-effectiveness over long distances, their limitations include slower transit times, restricted access to inland regions, and dependency on port infrastructure. These contrasts highlight the need for integrated multimodal transportation systems to address growing global logistics demands while balancing economic and environmental considerations.
In recent years, several studies have explored the benefits of intermodal transportation, particularly in reducing emissions through optimal mode combinations [
18,
19,
20,
21]. Research shows that shifting from road to water and rail modes reduces overall emissions and traffic congestion, especially for long-haul freight [
22]. The adoption of maritime and rail systems, coupled with machine learning for emission forecasting, enables more accurate and sustainable transport planning. For example, recent work by Temizceri & Kara, 2024 [
23], in Turkey applies machine learning techniques like regression and decision trees to predict CO
2 emissions, informing green transport plans that optimize for both cost and sustainability.
Further studies demonstrate that multi-objective optimization models, which integrate environmental factors alongside economic objectives, support a balanced approach to sustainable logistics [
24,
25]. The use of algorithms and simulations, like discrete event simulation in logistics networks, allows for the analysis of different scenarios and the formulation of intermodal transport plans that minimize emissions while meeting demand efficiently [
26]. Emission minimization is particularly effective when transport routes are planned to favor modes with lower emission rates, such as coastal shipping or rail. Furthermore, financial incentives from governments, like those in Turkey, demonstrate that subsidy schemes can significantly bolster intermodal transport’s competitiveness and encourage widespread adoption.
This paper investigates the potential for transitioning road cargo transport to waterborne alternatives in the UK, with the goal of reducing greenhouse gas emissions and alleviating road congestion. The shift from road to waterborne transport is supported by evidence that waterborne alternatives typically produce fewer emissions and pollutants, thus contributing to improved air quality and a lower carbon footprint [
27]. Waterborne transport, in particular, presents an energy-efficient option for transporting larger freight volumes with reduced fuel consumption per tonne-kilometer, making it a viable alternative to traditional road transport [
28,
29]. To address this need, this paper focuses on conducting a comprehensive comparative analysis of various transportation scenarios, with a particular emphasis on their application in the Liverpool Port region.
The paper outlines key objectives, including the development of modal shift capacity aimed at establishing freight highways across the UK. This involves designing a small, decarbonized vessel capable of accommodating various cargo types, thereby enhancing the flexibility and efficiency of multimodal logistics networks [
30,
31,
32,
33]. Accordingly, we focus on the shift from road to water transport and the application of discrete event simulation (DES) in barge capacity optimization.
A DES model, constructed using Arena software (Version 2022), is employed to analyze a logistics scenario that incorporates a design study process. A sweep exploration will be conducted considering time, cost, and emissions, providing a comprehensive evaluation of the proposed logistics network. The findings of this research offer essential guidance for supporting the UK’s climate goals and governmental policies aimed at advancing sustainable transportation solutions. By demonstrating the viability of a multimodal logistics network that prioritizes waterborne transport, this paper contributes to the broader discourse on sustainable freight transportation and its role to show the advantages of maritime transport compared to road transportation [
34,
35,
36]. This modelling approach allows for a comprehensive analysis of the logistical challenges and opportunities associated with shifting freight from road to waterborne transport [
37].
Accordingly, this paper investigates the development of modal shift technology aimed at establishing freight highways across the UK focusing on the Liverpool–Manchester corridor. We bridge environmental sustainability and logistical efficiency by applying a design study on the optimum number of TEUs to achieve an optimal small barge vessel capable of accommodating various cargo types, and present an assessment of the economic and environmental viability of a multimodal logistics network. The establishment of freight highways is crucial for promoting the integration of waterborne transport into existing logistics frameworks, as it can enhance the connectivity between ports and inland destinations [
38,
39,
40]. This paper develops a discrete event simulation using ARENA software to model logistical operations across the UK, with a focus on the three objectives of time, cost, and emissions. The study centers on the Liverpool–Mersey River and Manchester Ship Canal, with Liverpool Port as a major logistics hub. Four scenarios simulate different container-loading and transport methods, comparing road and waterborne options to evaluate the efficiency and utility of small-scale waterborne transport. The DES captures processes such as loading, unloading, transit, and handling to identify inefficiencies and improve logistics. A sweeping design study technique is applied to determine the optimal barge capacity for Scenarios 2 and 3, considering time and cost efficiency and emission reduction. By integrating simulations and an exploratory design study, our study aims to design an efficient barge tailored to UK-specific logistics and environmental requirements, promoting sustainable transport alternatives. In summary, the key contributions of this study are as follows:
This study makes a significant contribution to the field by being the first to examine the integration of transportation decarbonization governance and governmental financial incentives within the context of UK waterway transportation, an area that has not been thoroughly explored. This innovative approach presents valuable opportunities for UK domestic logistics service providers in the realm of green intermodal freight transportation planning. By incorporating these incentives into the decision-making framework, our research offers insights into their effectiveness, which could be relevant not only to other regions of the UK but also to coastal and waterway initiatives globally.
Unlike most existing studies, this research proposes four distinct transportation scenarios aimed at maximizing logistics profit while minimizing emissions and delivery time, facilitating the shift from road to waterway transportation.
This paper introduces an innovative approach by integrating discrete event simulation for evaluating multimodal logistics, alongside a sweeping design study to optimize barge capacity for multimodal freight transport, while addressing complex trade-offs through a weighted multi-objective analysis.
The study provides actionable insights into the feasibility of transitioning road transport to waterborne transport, demonstrating its alignment with sustainability goals and the UK’s logistics landscape.
3. Problem Definition
To achieve an appropriate barge design, it is necessary to develop a logistic simulation that models key logistical operations across the UK. This simulation will capture the dynamic processes involved in the transportation of goods, focusing on specific logistics scenarios that reflect typical supply chain challenges within the UK. Additionally, a comparison between water and road transportation highlights their respective advantages and disadvantages, showcasing the strengths of each mode.
The barge capacity (optimum number of TEUs) will then be optimized based on the data generated from this simulation, ensuring that it meets UK-wide logistical requirements. These requirements may include factors such as load capacity, fuel efficiency, speed, and maneuverability in different waterways. Additionally, the barge design will be tailored to fit UK-specific regulations, infrastructure constraints, and environmental considerations. The combination of simulation data and capacity design exploration will guide the development of a barge that is not only efficient for current logistics demands but also flexible enough to adapt to future changes in the UK’s transportation network.
The Liverpool–Manchester corridor was selected due to its strategic importance in multimodal logistics within the UK, representing a typical urban–industrial corridor with diverse freight transport challenges. Liverpool port has been considered a major port of the UK’s logistics; its well-documented infrastructure and data availability make it an ideal case for modelling and analysis. Furthermore, the insights gained from this case study are highly generalizable, as the corridor exemplifies common characteristics of similar logistics networks in other regions. Four scenarios, according to different types of loading and offloading of containers in different areas, will be simulated by using the DES method.
Scenario 1: Comparison of cargo transportation between Glasgow Port and Liverpool Port in terms of road transportation and water transportation.
Scenario 2: Sea transloading and distributing barges to local ports.
Scenario 3: Delivering TEUs to major ports (Liverpool Port) and distributing barges from major ports to local ports.
Scenario 4: Delivering TEUs to Liverpool Port, from Liverpool Port to terminals and from terminals to truck.
Consequently, our study will compare different modes of transportation and scenarios to assess the utility of small waterborne transport compared to road transport, therefore contributing to the greater utilization of this sustainable and efficient mode of transport. The selection of these four scenarios was driven by their relevance to assessing the efficiency, sustainability, and operational feasibility of multimodal transport strategies. Each scenario was designed to test specific aspects of transport dynamics, allowing transport mode comparison. The first scenario examines the transport connections between Liverpool Port and Glasgow Port, comparing road and sea routes. The second explores the potential benefits and challenges of decentralized at-sea transloading as a novel logistics concept, followed by distribution via smaller vessels to local ports with poor loading operation infrastructure. The third tests the logistical and economic implications of centralizing transloading operations at a major port hub. Finally, the fourth scenario evaluates the connections between Liverpool and Manchester, contrasting road transport with the use of the Manchester Ship Canal. Together, these scenarios address critical variables in transport planning, offering a robust framework for validating our research hypotheses.
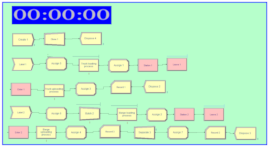
Appendix A presents a detailed visual representation of the simulation model used in this study, highlighting its complexity and the distinct process flows designed for various scenarios.
Finally, a design study optimization will be integrated into the logistics simulation to determine the optimal barge capacity for efficient transport operations. This algorithm will systematically analyze various factors that influence barge performance, including cargo load, fuel consumption, travel time, and operational costs [
41]. By simulating different scenarios with varying barge capacities, the algorithm will assess how each capacity impacts the overall efficiency and cost-effectiveness of the logistics system. This design study will be implemented in Scenarios 2 and 3, considering three objectives of time, cost, and emissions. Finally, by using the weighting method (Equation (1)), the multi-objective optimization converts to a single-objective optimization problem, and the best loading condition of barges based on the number of TEUs will be obtained from this study [
42]:
Fixed weights in the objective function have been assigned equally, reflecting current policy priorities and stakeholder preferences. These weights can be adjusted to accommodate changes in policy and market dynamics. Equal weighting simplifies the initial optimization process and enables stakeholders to transparently assess trade-offs. Each objective is converted to a normalized form by the Min-Max Normalization method, ranging from 0 to 1.
where the normalized time is the total time required for logistics operations to deliver the last cargo, normalized cost is the economic expenditure of the logistics operations and normalized emissions are the environmental impact in terms of carbon dioxide equivalent emissions.
Logistic Scenarios
In the next phase of the project, a discrete event simulation (DES) will be developed to model a complex logistics scenario specific to the Liverpool area, one of the UK’s most critical transport hubs. This simulation will focus on the movement of goods through key maritime infrastructure, including the Port of Liverpool, warehouses, distribution centers, and transportation networks connecting to the wider region. The parameters involved in this simulation are shown in
Table 1, derived from historical freight data and validated through stakeholder consultations and literature benchmarks. Four mentioned scenarios regarding at-sea transshipment and at-port transloading will be designed by using ARENA software and in-house Python (Version 3.11) programming for five simulation replications. To ensure that our simulation accurately represents real-world operations, both face validation and historical data calibration were conducted. Face validation was carried out through structured walkthroughs of the model logic with port operations experts, who confirmed that the sequence of activities, resource constraints, and routing decisions faithfully reflect current multimodal practices. For quantitative calibration, we matched our baseline scenario outputs (TEU throughput and vessel loading/unloading time) against historical records from Liverpool Port.
The under-studied port locations of this study are Glasgow Port, Liverpool Port, Runcorn Dock, Birkenhead Port, Bromborough Port, Garston Port, and Mostyn Port. Carbon emission factors for each mode of transport are established based on GHG protocol standards, with unit emissions (emission factor of transport mode (kg CO
2e/tonne-kilometer)) set at 0.14 for road transport and 0.04 for sea transport [
23].
where mass of goods is the weight of the transported goods in metric tons and distance traveled represents the distance the goods are transported in kilometers. The aggregated carbon dioxide equivalent emissions were calculated as the sum of emissions for all transport activities kgCO
2e. The capital cost (GBP) and operational cost (GBP/h; GBP/day) of road and sea transport are dependent on the daily work demand of ports and are fed into the simulation for whole logistic container distribution [
43].
The total barge cost includes the transportation cost, handling cost, and storage cost:
where
,
is the number of TEUs,
is the transportation cost per TEU-km, and
is the distance travelled by barge
i [
44].
is the cost for sorting and transferring cargo between cranes and depot areas at ports, and is the cost incurred for storing TEUs at each local port.
The total delivery time includes transport and port handling times:
where
is the transportation time using vehicles, barges and trucks, and
is cargo handling between container ship and barges in Scenario 2.
, where is the time for sorting cargo and is the time for moving TEUs between cranes and depot areas at port j.
Here are the main characteristics and underlying assumptions of the problem:
The model is static and stochastic due to the variability of the input distribution function.
Only unitized cargo, 20 ft TEU, is being transported.
The payload (in tonnes) of each TEU is determined by an average of 12 tonnes.
Sea transportation distance and barge speed are presented in nautical miles, which equals to 1.852 km.
The detailed power requirement costs for reefer containers and paid storage times have been neglected to maintain the generalizability and comparability of proposed logistic system.
Exponential distribution was used to model ship arrival times, as it appropriately represents stochastic interarrival times in queueing systems. Loading/unloading and sorting times were modelled using a normal distribution, given the absence of extensive historical data; averages were available due to the data collected from port and experts.
Table 1.
Simulation variables [
45,
46,
47].
Table 1.
Simulation variables [
45,
46,
47].
| | Value | Type |
|---|
| Capital Cost of each Barge (GBP) | 17,600,000 | Fixed |
| Capital Cost of each Truck (GBP) | 185,000 | Fixed |
| Hourly Operational Cost of Trailer Truck (GBP) | 35.24 | Fixed |
| Daily Non-Operational Cost of Trailer Truck (GBP) | 39.09 | Fixed |
| Hourly Operational Cost of River Barge (GBP) | 176.22 | Fixed |
| Daily Non-Operational Cost of River Barge (GBP) | 195.49 | Fixed |
| Handling Cost at Port per TEU (GBP) | 37 | Fixed |
| Storage Cost per TEU per Day (GBP) | 3 | Fixed |
| | Capacity | |
| Maximum Number of Containers for Each Barge (TEU) | 120 | Variable [Integer] |
| Crane Throughput Rate at a Port (TEU/h) | 30 | Fixed [Integer] |
| Crane Throughput Rate at Sea Transloading (Ship to Barge) (TEU/h) | 30 | Fixed [Integer] |
| Sorting and Transferring Time per TEU at Port (h) | 0.45 | Fixed |
| Average Traveling Speed of Barge (knot) | 15 | Fixed |
| Average Traveling Speed of Trucks (mph) | 54 | Fixed |
| Liverpool Port Daily Container Demand (TEU) | 3000 | Fixed [Integer] |
| Liverpool Port Annual Trade (TEU/Year) | 250,000 | Fixed [Integer] |
| Maritime Transport Emission (Emission Factor) | 0.040 | kg CO2e/TEU-km |
| Road Transport Emission (Emission Factor) | 0.140 | kg CO2e/TEU-km |
| Number of Operational Days per Year | 365 | Fixed |
4. Results and Discussion
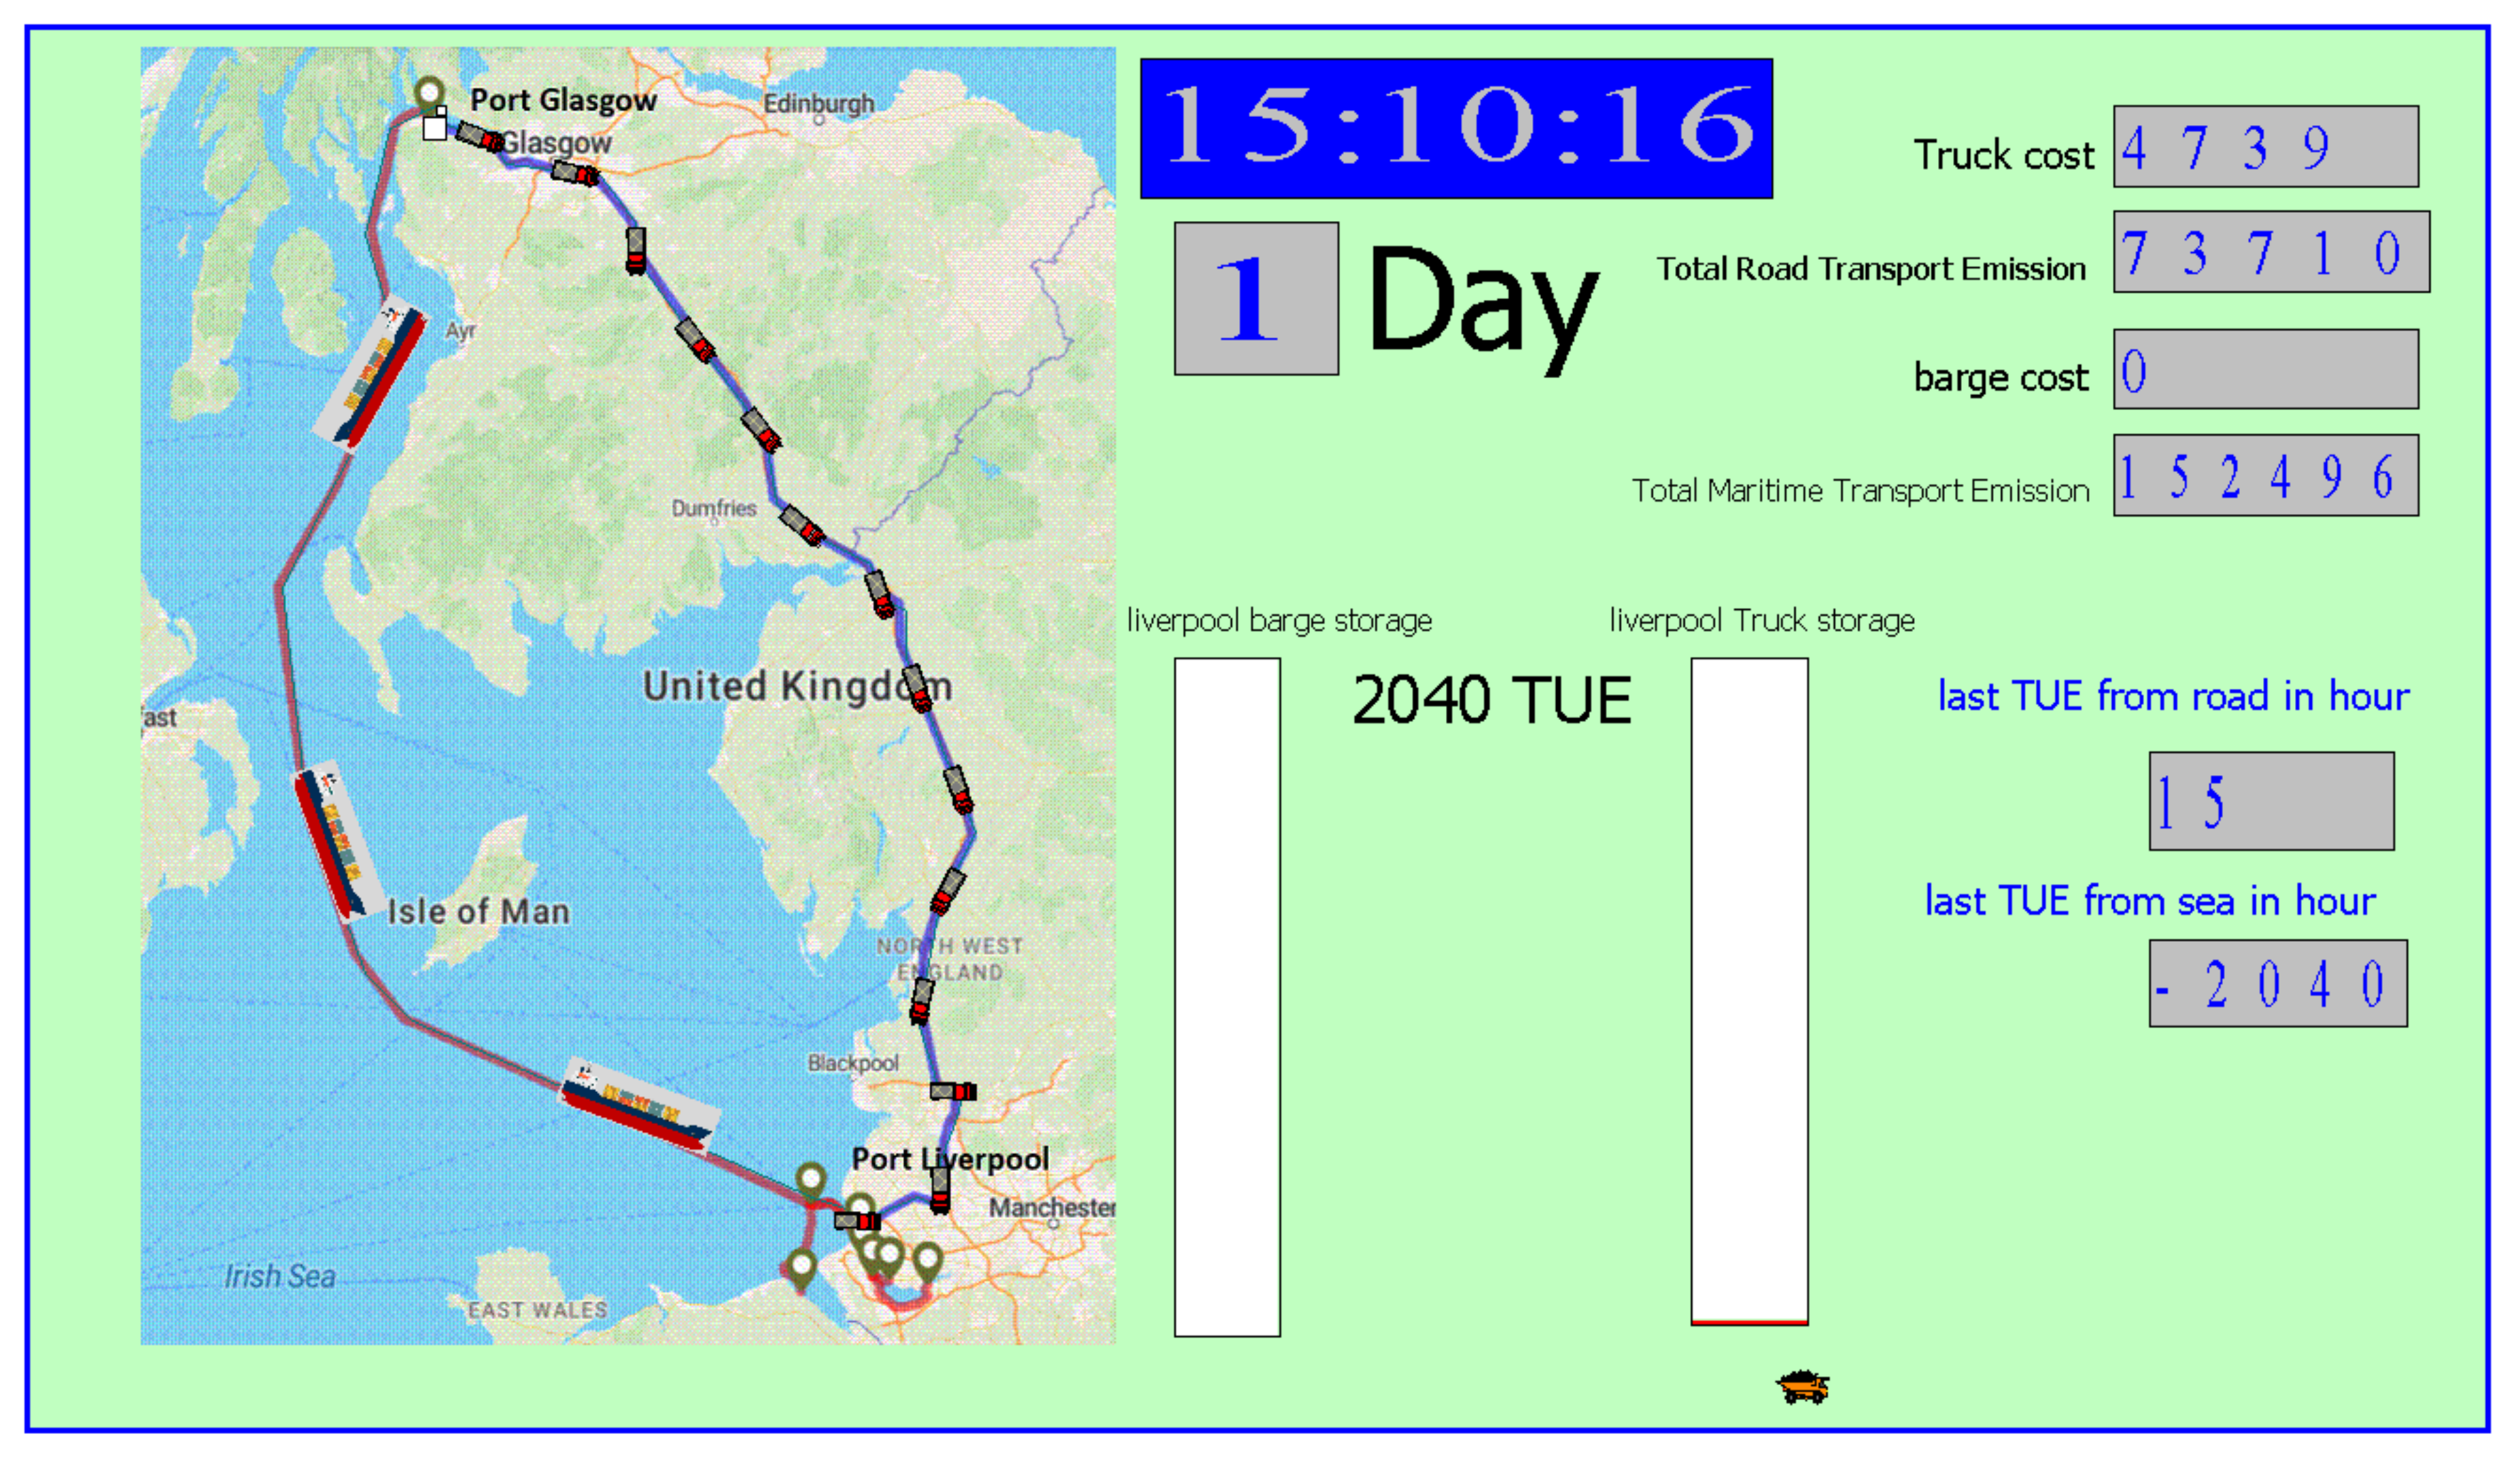
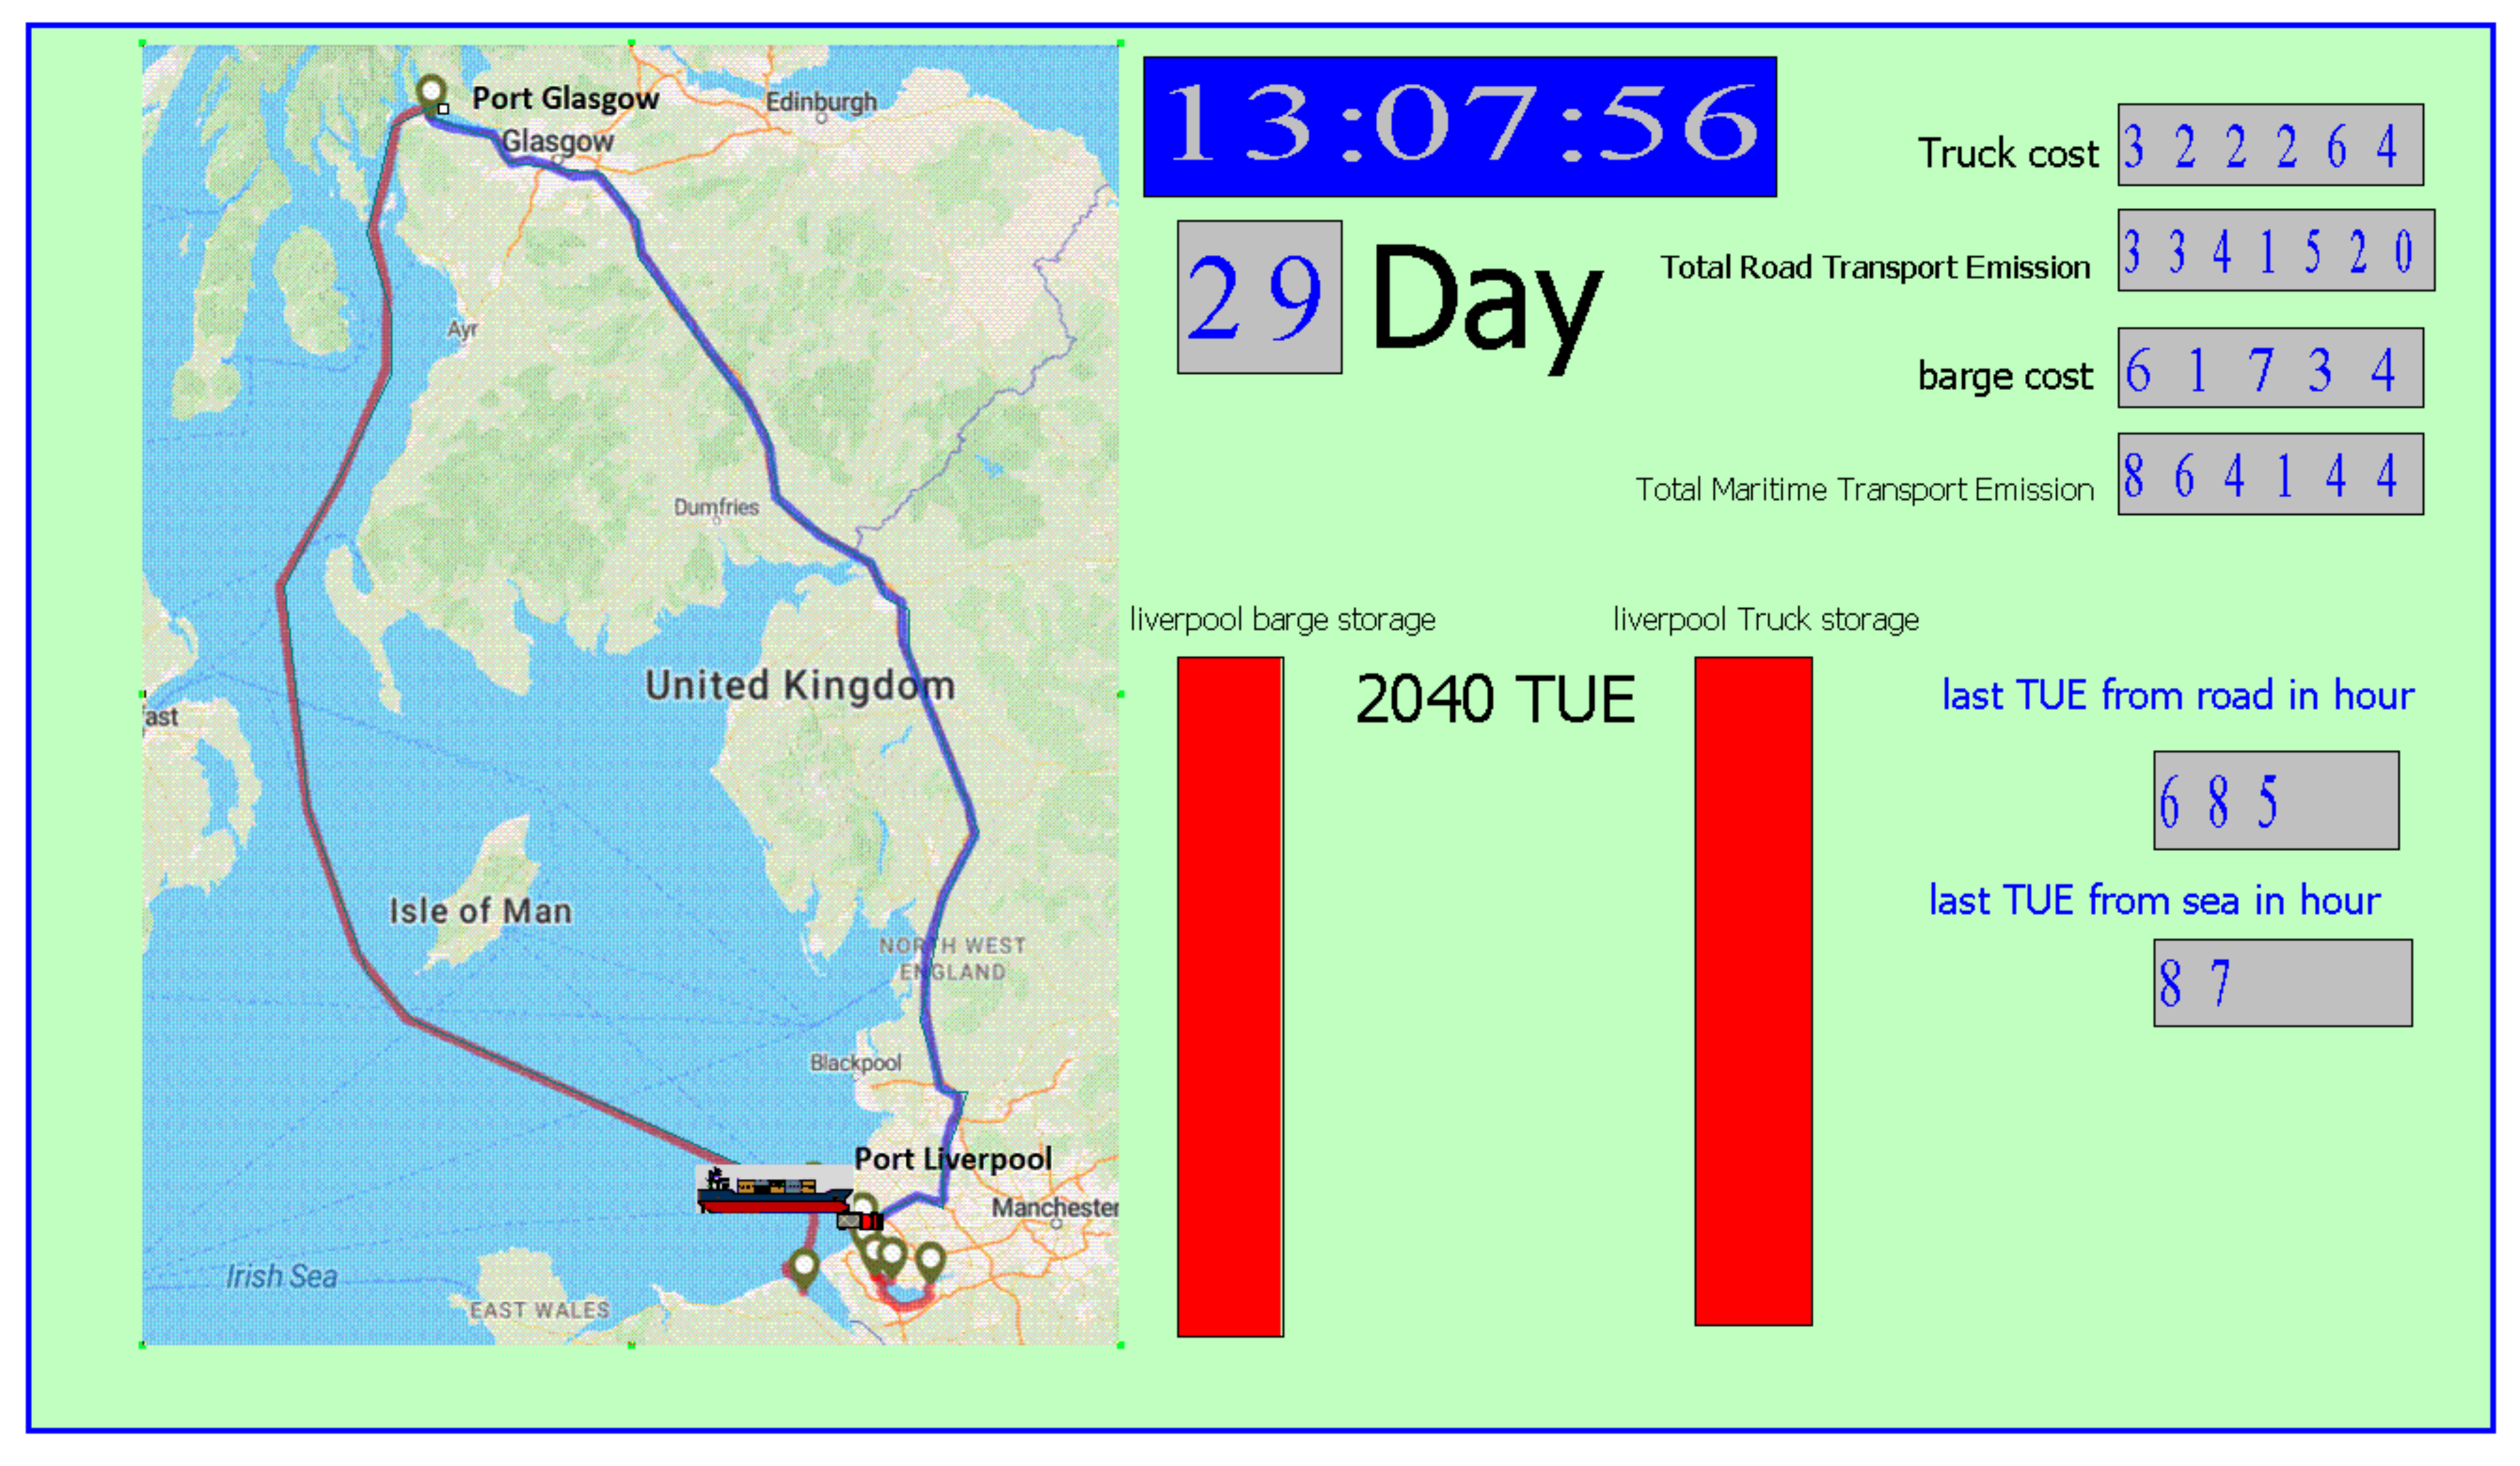
4.1. Scenario 1: Comparison of Cargo Transportation Between Glasgow Port and Liverpool Port
This study utilizes discrete event simulation to compare the efficiency of waterway and road transportation for transferring 2040 containers from the Port of Glasgow to the Port of Liverpool, a process that may extend over several days (as illustrated in
Figure 2). The road distance between the two ports is calculated using Google Maps, while the sea route spans approximately 219 nautical miles (equivalent to 252 statute miles), as determined from maritime navigation charts. The ports are strategically positioned at the respective endpoints of their transportation networks. This analysis evaluates key performance metrics, including transit time, capacity utilization, and logistics costs, to provide a comprehensive assessment of the optimal transportation mode under varying operational scenarios. The outputs of the DES model, including transport times (time on track with barge and truck) and cargo throughput (last cargo arrival from sea record and road record) from
Table 2, are compared with historical data from port and logistics operations. This comparison demonstrates the model’s validation based on the available data. The simulation results of Scenario 1 for the three objectives of cost, time, and emissions are depicted in
Table 2.
The total cost for sea transport using barges is about GBP 45 k, which is significantly lower than the total cost for road transport, which is twice as expensive. The last cargo arrival parameter is the total operation time, as well as the waiting and transferring times that show the end of cargo delivery. While road transport is faster in transit and cargo handling (shorter time on track), it suffers from substantial waiting delays, making its overall efficiency lower than anticipated. On the contrary, sea transport requires longer transit times but avoids the extreme waiting times seen in road transport, leading to better scheduling predictability. In other words, sea transportation between Glasgow Port and Liverpool Port is 6.5 times faster, with a transit time difference of 2 days compared to 14 days for logistics coverage. The total emissions from road transport are 978,174 kg CO2e/TEU-km, which is significantly higher than those from sea transport—725,390 kg CO2e/TEU-km.
The simulation demonstrates that sea transport is more cost-effective and environmentally sustainable than road transport for this logistic route. However, road transport offers faster transit times, albeit at the cost of higher emissions and waiting delays. These findings suggest the need for a hybrid or integrated transport strategy, leveraging the cost and environmental benefits of sea transport.
4.2. Scenario 2: At Sea Transloading and Distributing Barges to Local Port
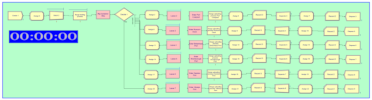
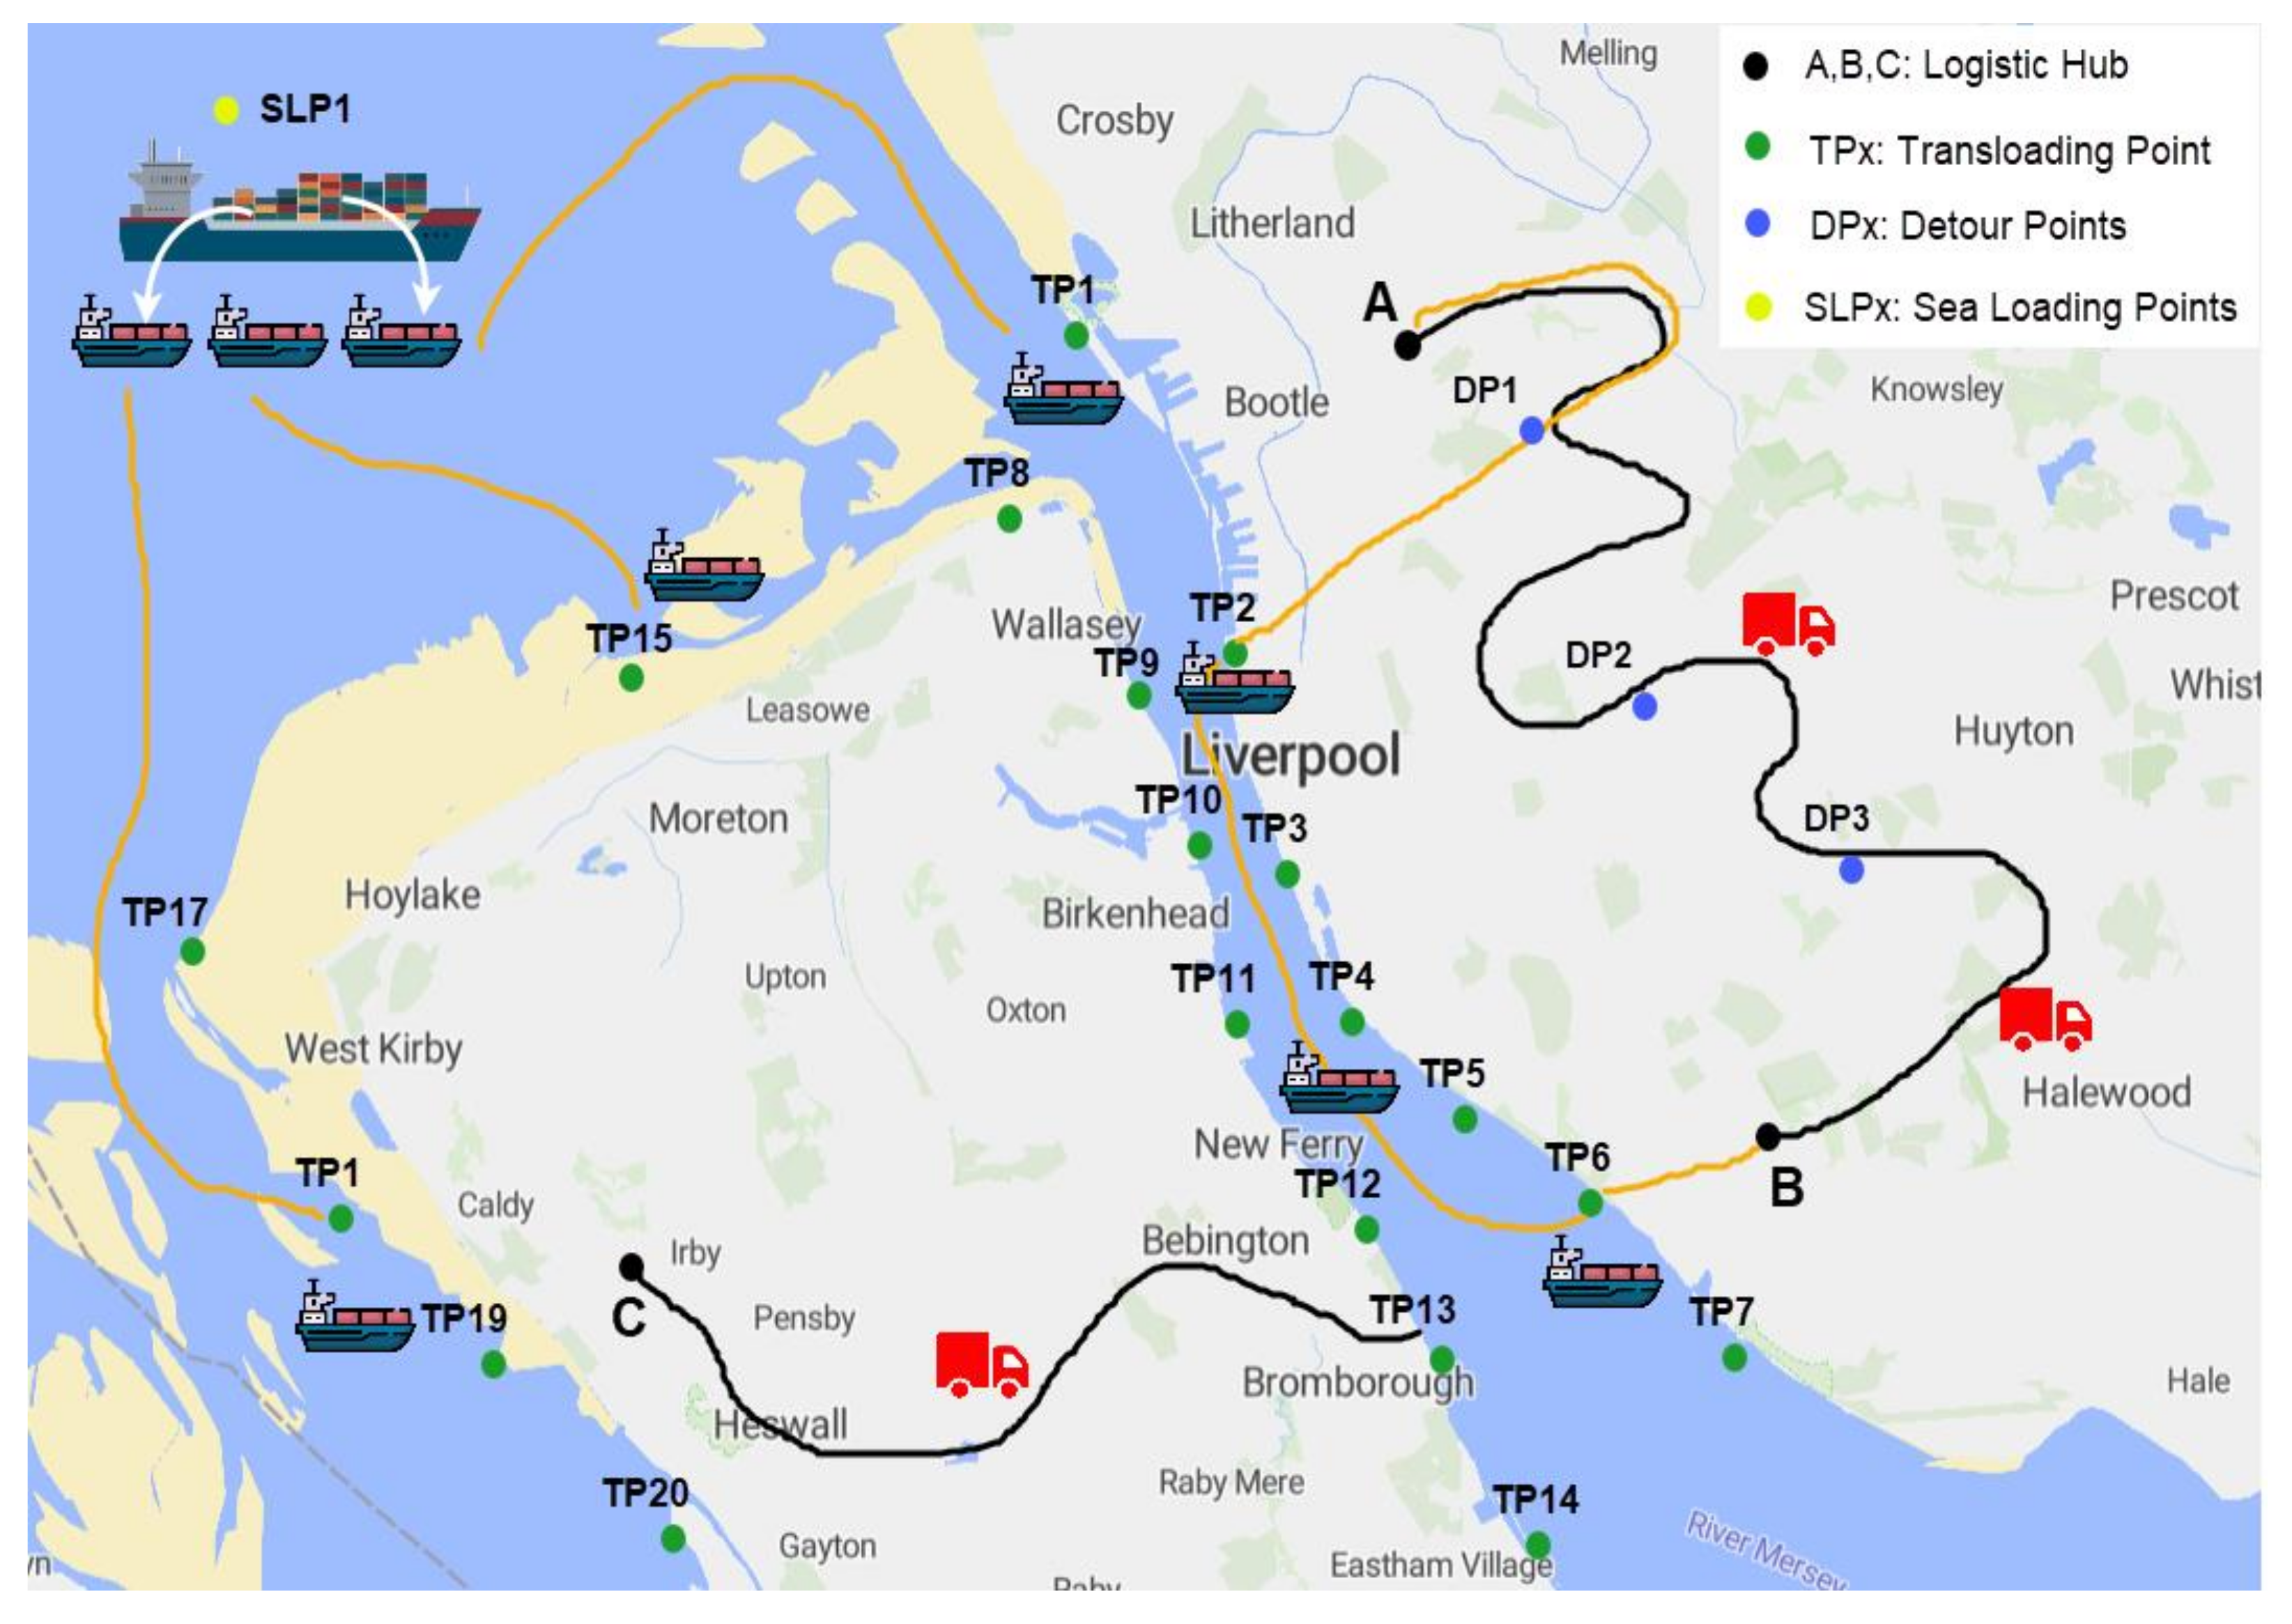
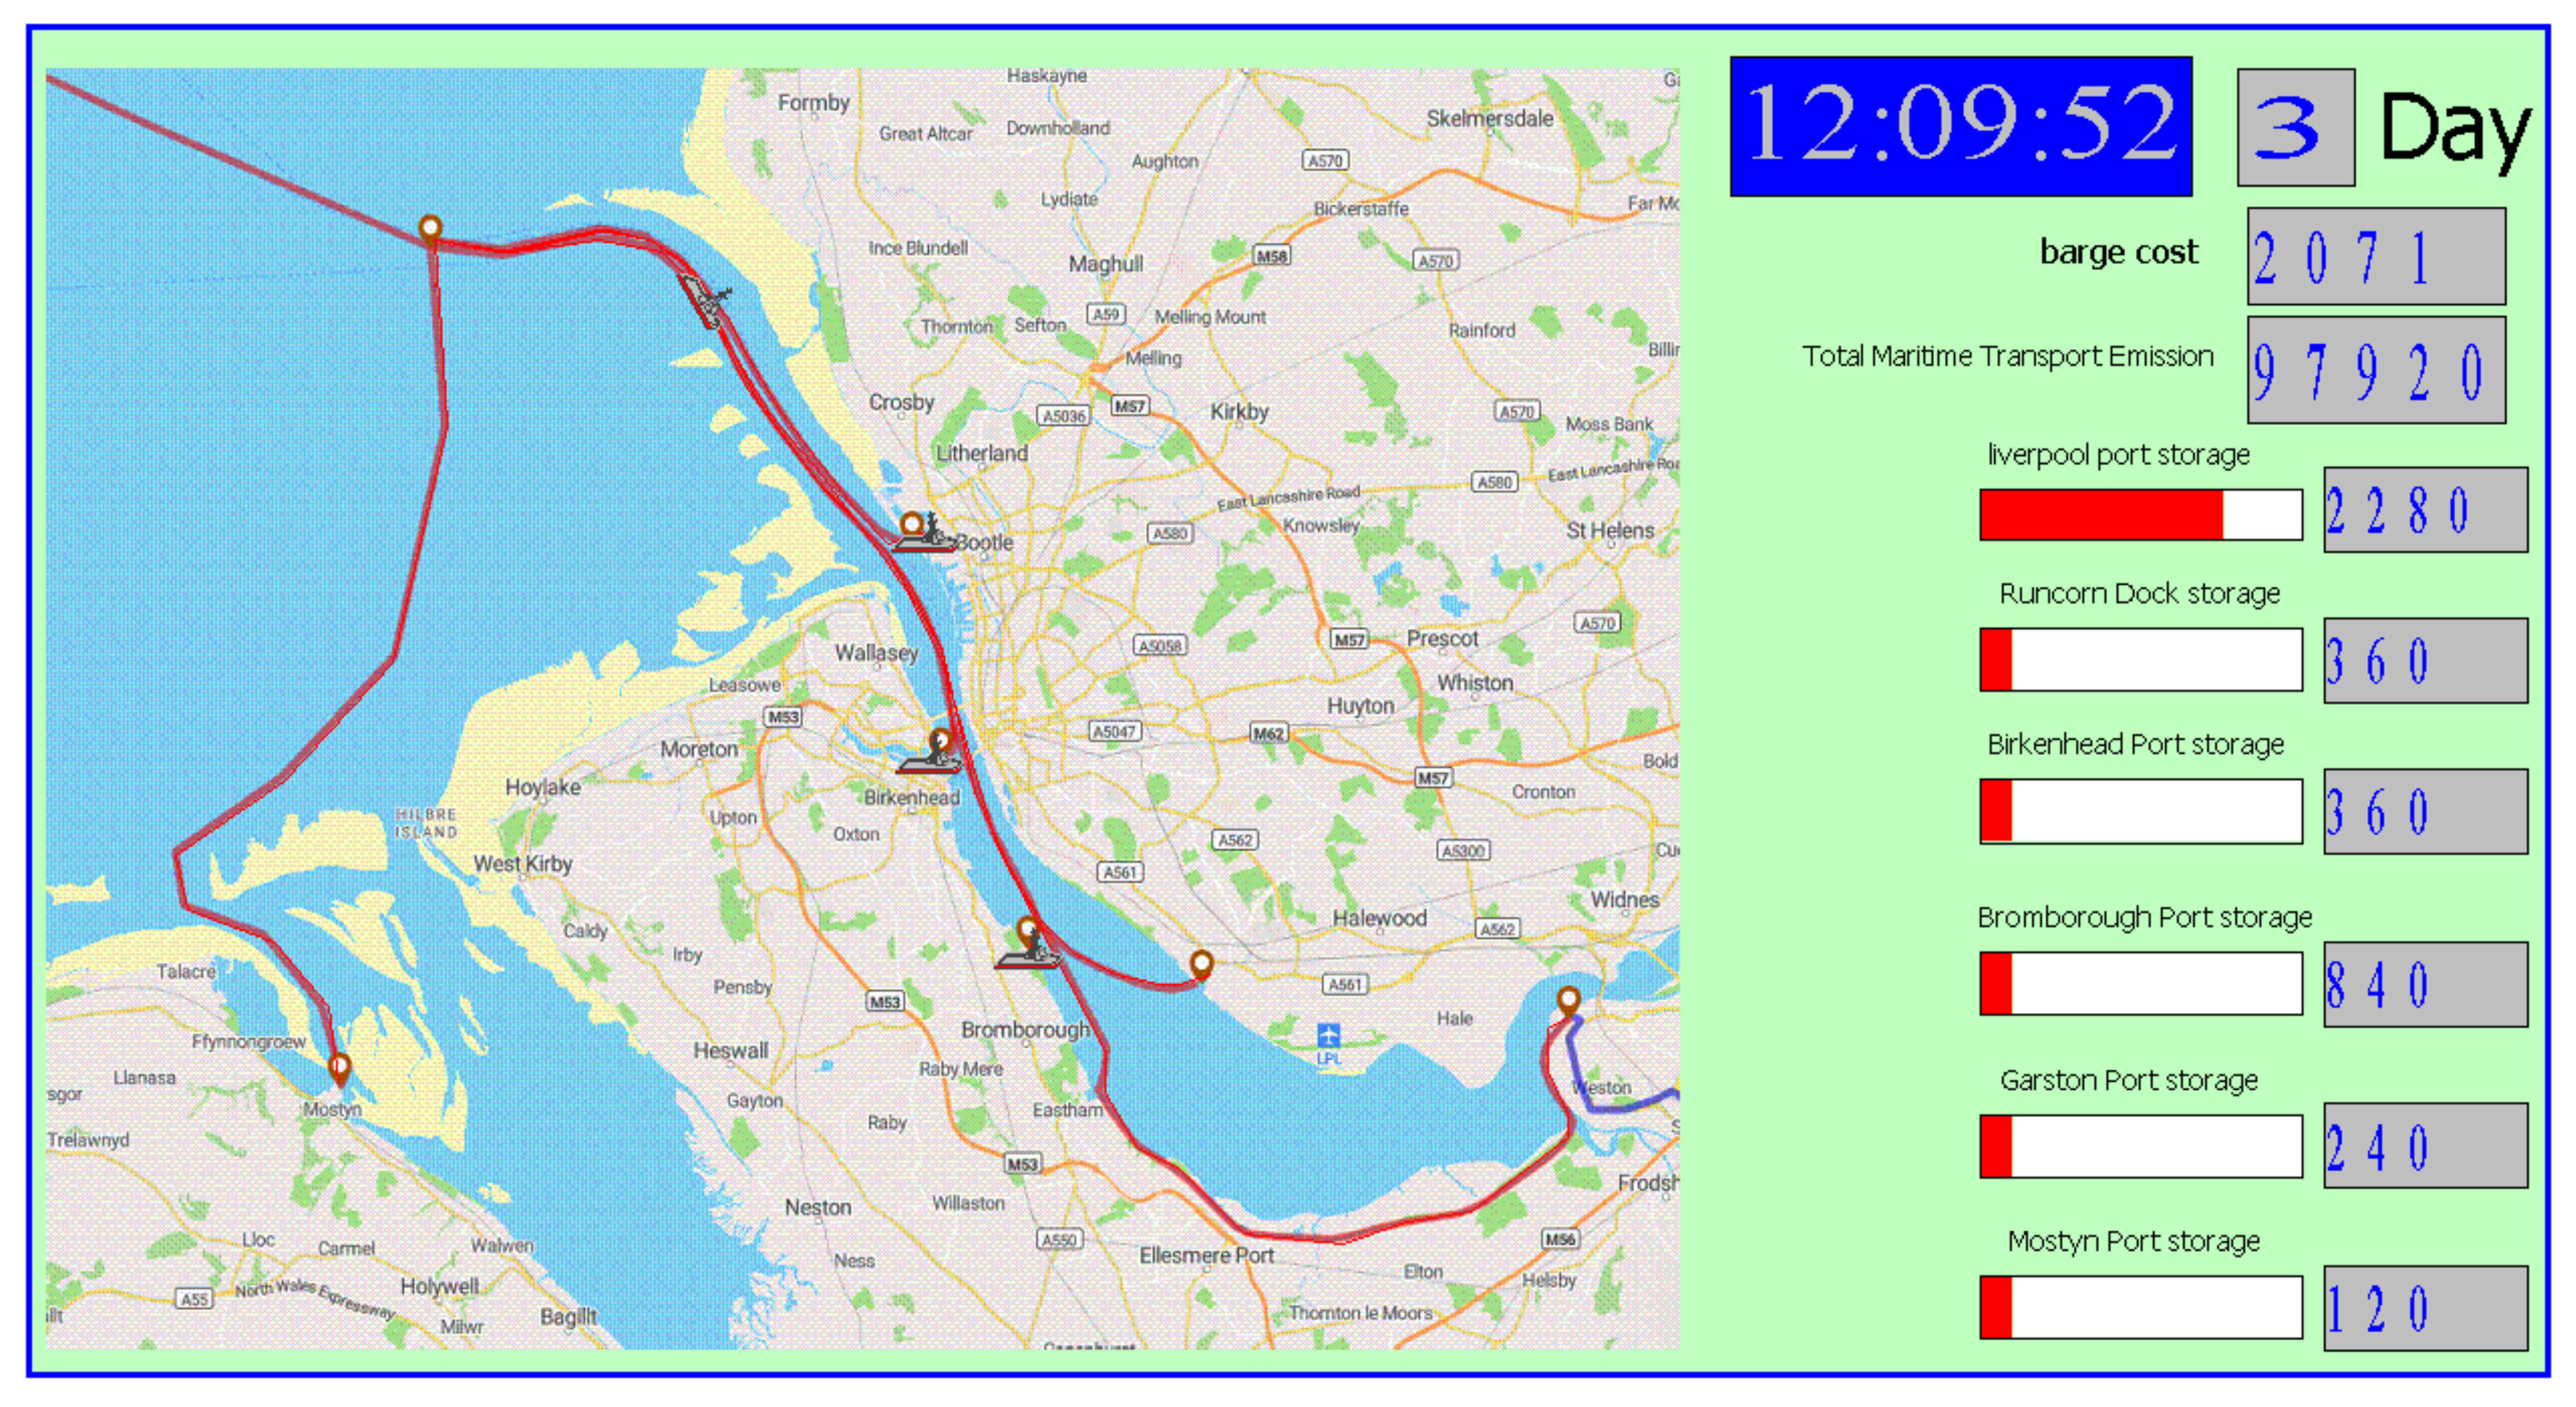
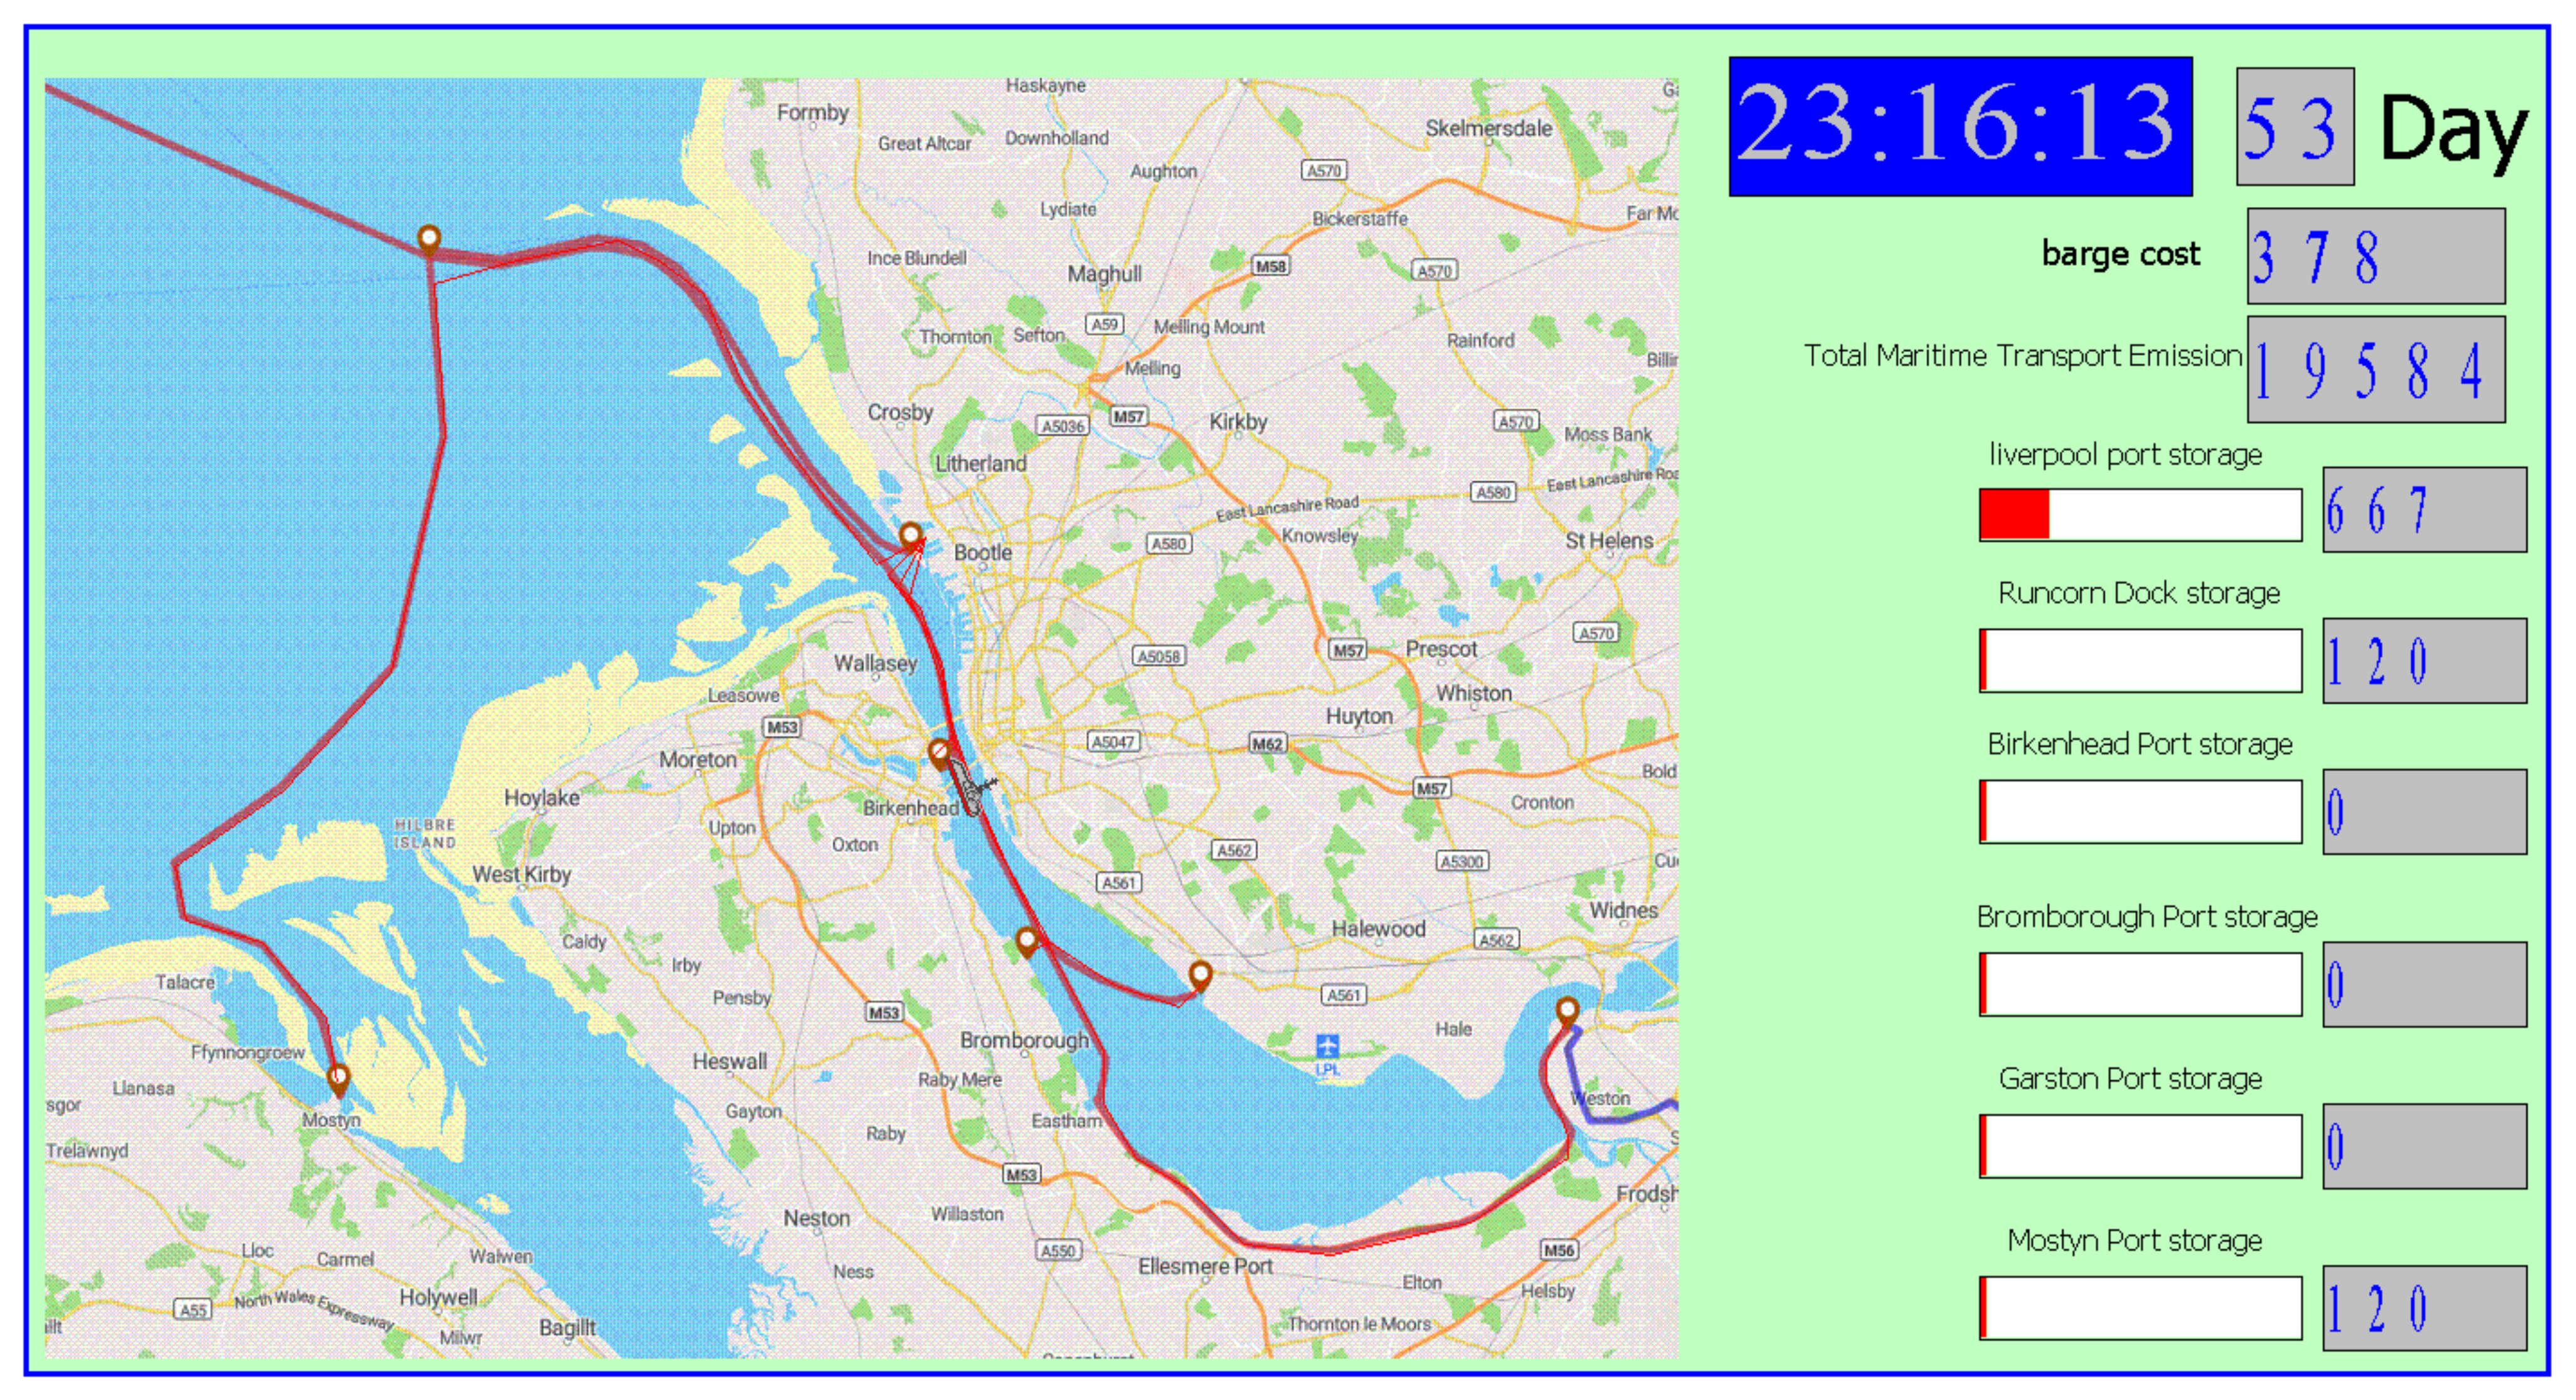
In this scenario, TEU containers transfer from big ships to smaller barges at sea and barges swarm to local ports and inaccessible ports and docking areas. This waterway transportation model could revolutionize regional logistics by decentralizing the flow of goods, making shipping more flexible, cost-effective, and environmentally sustainable. In this scenario, containers are first transferred to smaller barges at the sea loading point (indicated by the yellow circle in
Figure 3). These barges then transport the cargo to designated transshipment points (represented by the green circle in
Figure 3). Simultaneously, trucks are rerouted from detour points, marked by blue circles, to the transshipment points, where they transfer the cargo to logistics hubs. This approach streamlines the logistics network by reducing reliance on road transportation and positioning the cargo closer to its final destination, thereby enhancing efficiency and reducing transit complexity. The DES simulation of Scenario 2 is displayed in
Figure 4.
Once the TEU containers are transferred from large ships to barges, the small barges, acting like a “swarm,” can then navigate to various ports and docking areas in the region. Therefore, instead of relying on a single large port, the barges could service numerous smaller ports, docks, and industrial areas. This decentralization of cargo handling reduces congestion at major ports and allows for more flexible, efficient delivery to a variety of locations. Different types of barges can be used depending on the region and requirements. Shallow-draft barges can navigate rivers and shallow coastal waters, reaching destinations that larger ships cannot. In addition, some barges could be equipped with cranes for self-unloading at docks with limited infrastructure, making them suitable for small, underdeveloped ports that lack sophisticated handling equipment. This at-sea transloading process would involve specialized equipment and vessels designed to safely transfer containers from the containership to a fleet of smaller barges. This can be the main challenge of this concept of maritime logistics and safety; operability in different weather conditions and the coordination of the whole process should be addressed. The simulation results for Scenario 2 are depicted in
Table 3. The simulation underscores the effectiveness of barge swarming as a last-mile logistics strategy for transferring cargo from large containerships to multiple ports. The cost distribution is uniform across all destination ports, indicating no significant cost variations among the port locations.
4.3. Scenario 3: Deliver TEUs to the Major Port (Liverpool Port) and Distribute Barges from the Major Port to the Local Port
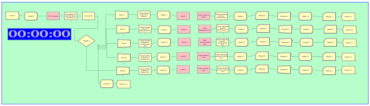
In this scenario, TEU containers are unloaded from the container ship at the Port of Liverpool and subsequently transferred to smaller barges. These barges navigate to various local ports, leveraging their swarming capacity to distribute cargo efficiently. This method eliminates the need for transshipment at sea, thereby simplifying the logistics chain while maintaining the advantages of barge swarming, such as flexible routing and efficient distribution to multiple destinations. Additionally, this approach minimizes the handling costs and risks associated with intermediate transfer points, ensures faster delivery to local ports, and enhances the overall sustainability of the maritime transportation network. It should be noted that all local ports are the same as in Scenario 2 to compare the effectiveness of this method. However, the sorting process at port terminals and cargo movement between the STS crane and depot area are added to the simulation and these processes increase the cargo delivery time. The DES simulation and results are depicted in
Figure 5 and
Table 4, respectively.
Scenario 3 has a lower barge cost tally (GBP 1275.18) compared to Scenario 2 (GBP 1442.64). This indicates the better cost efficiency in Scenario 3, despite the increased emissions and time. This improvement could be due to optimized routing or better resource allocation. Scenario 3 results in significantly higher emissions (58,425.80 kg CO2e) compared to Scenario 2 (38,195.12 kg CO2e), an increase of 52.98%. For reducing environmental impact and ensuring faster overall cargo delivery, Scenario 2 is better, considering that Scenario 3 is closer to reality, as well as the feasibility of cargo handling at port instead of at-sea transshipment.
4.4. Scenario 4: Deliver TEUs to Liverpool Port, from Liverpool Port to Terminals and from Terminals to Truck
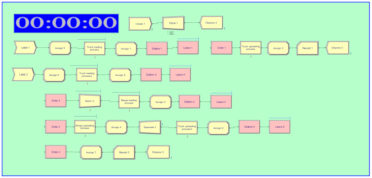
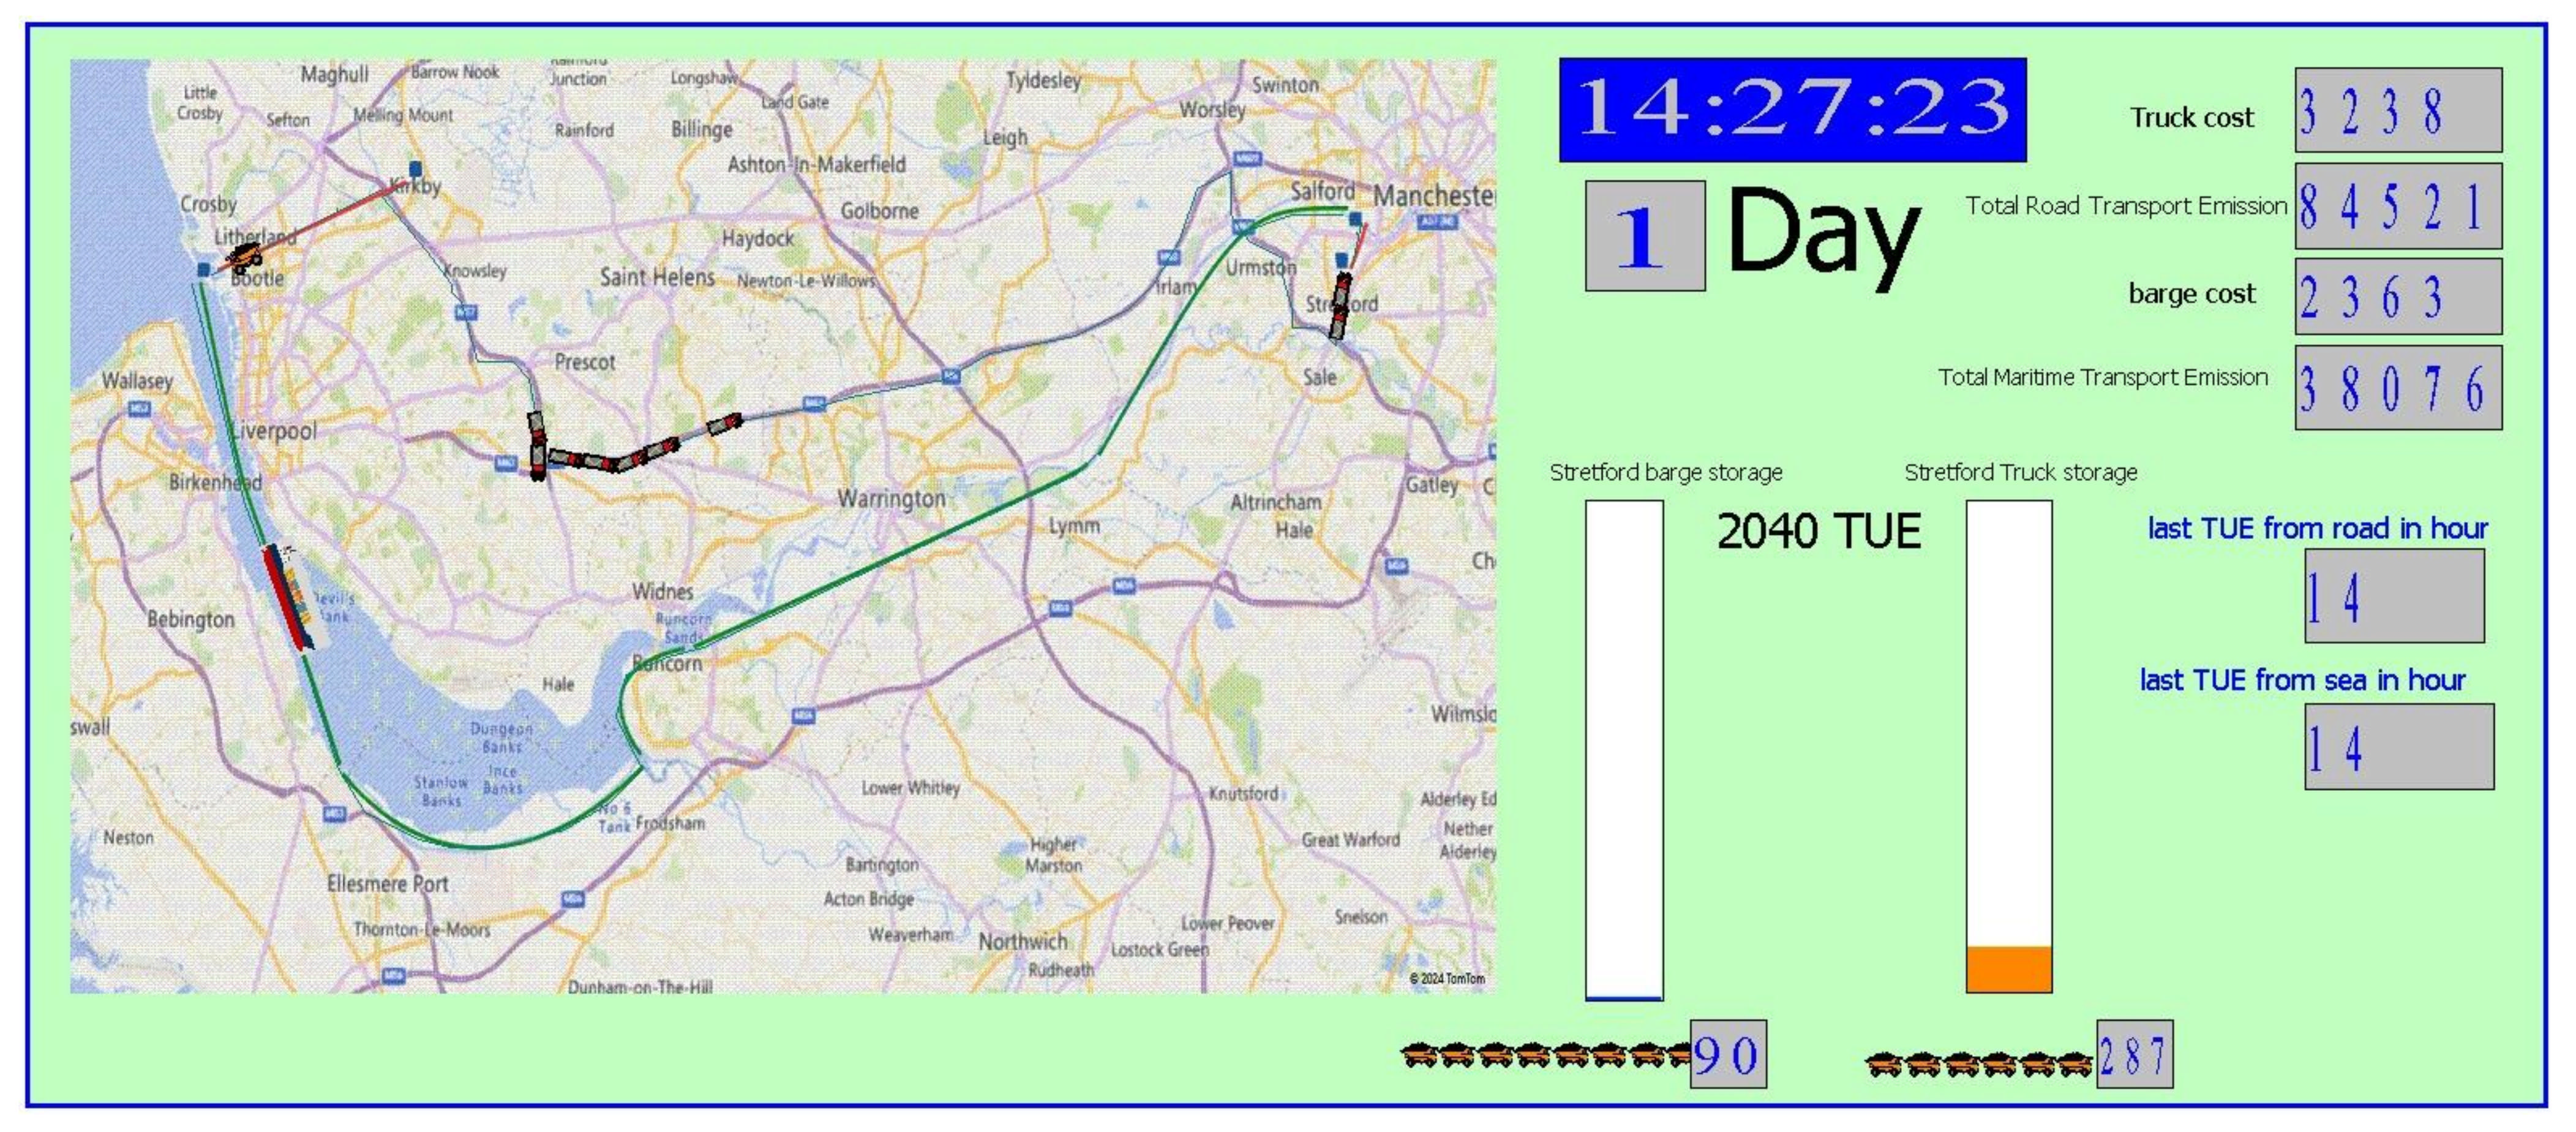
In this scenario, a comparison is to be made between transportation by truck in road freight and transportation via waterways using the Manchester Ship Canal by barge. The starting point is a warehouse in Liverpool, and the destination is another warehouse in the south of Manchester (see
Figure 6).
Table 5 provides a quantitative comparison of road transportation (using trucks) and waterway transportation (using barges via the Manchester Ship Canal) in terms of cost, time, and emissions.
Total costs combine both modes and include additional expenses like handling and intermediate transfers; as a result, the cost of waterway transportation (barges) is significantly lower than road transportation (trucks). Barges deliver cargos approximately 30% longer, which may be acceptable for non-time-sensitive shipments, especially given the lower costs and emissions. Waterway transportation is more environmentally friendly, emitting significantly fewer greenhouse gases (road transport emissions are approximately 75% higher than maritime transport emissions). Considering that the areas under study are predominantly residential zones and densely populated cities, the high levels of air emissions significantly exacerbate environmental and public health concerns.
4.5. Design Study
In this section, the results of the design exploration will be presented according to the weighted aggregation objective function and sweeping of all design possibilities. This solution aligns with achieving sustainable and economically viable transport operations for Scenario 2.
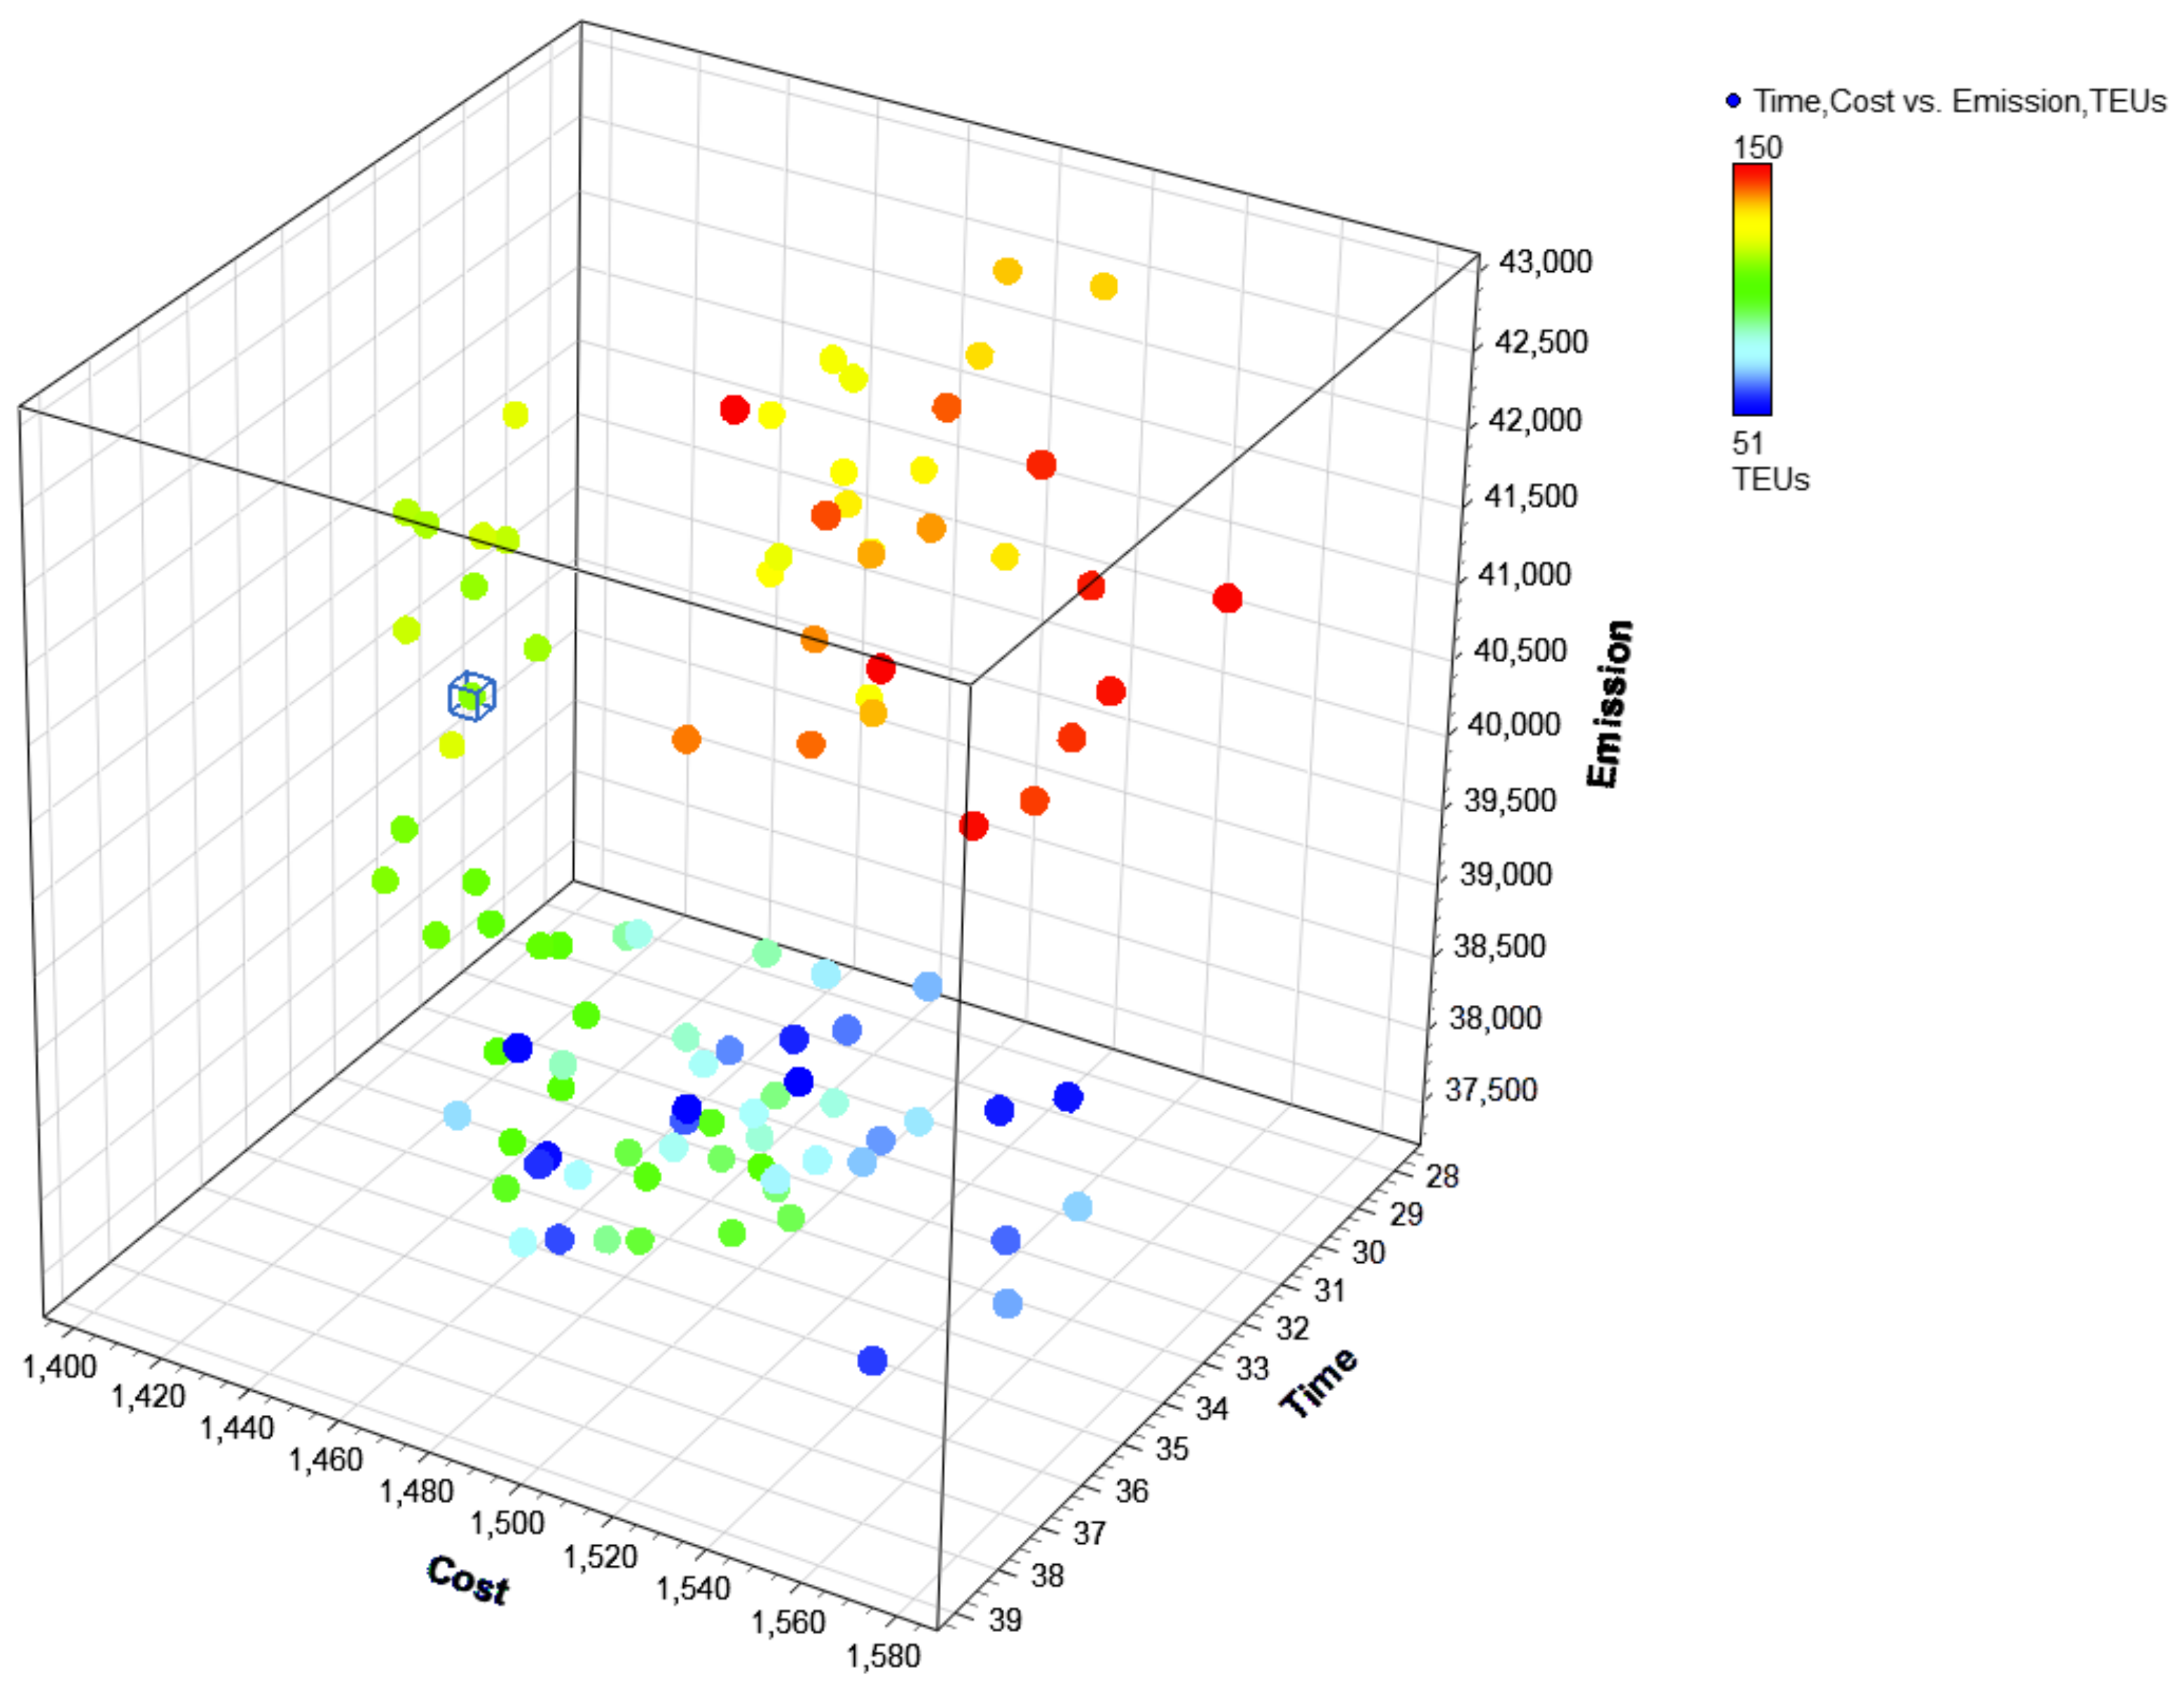
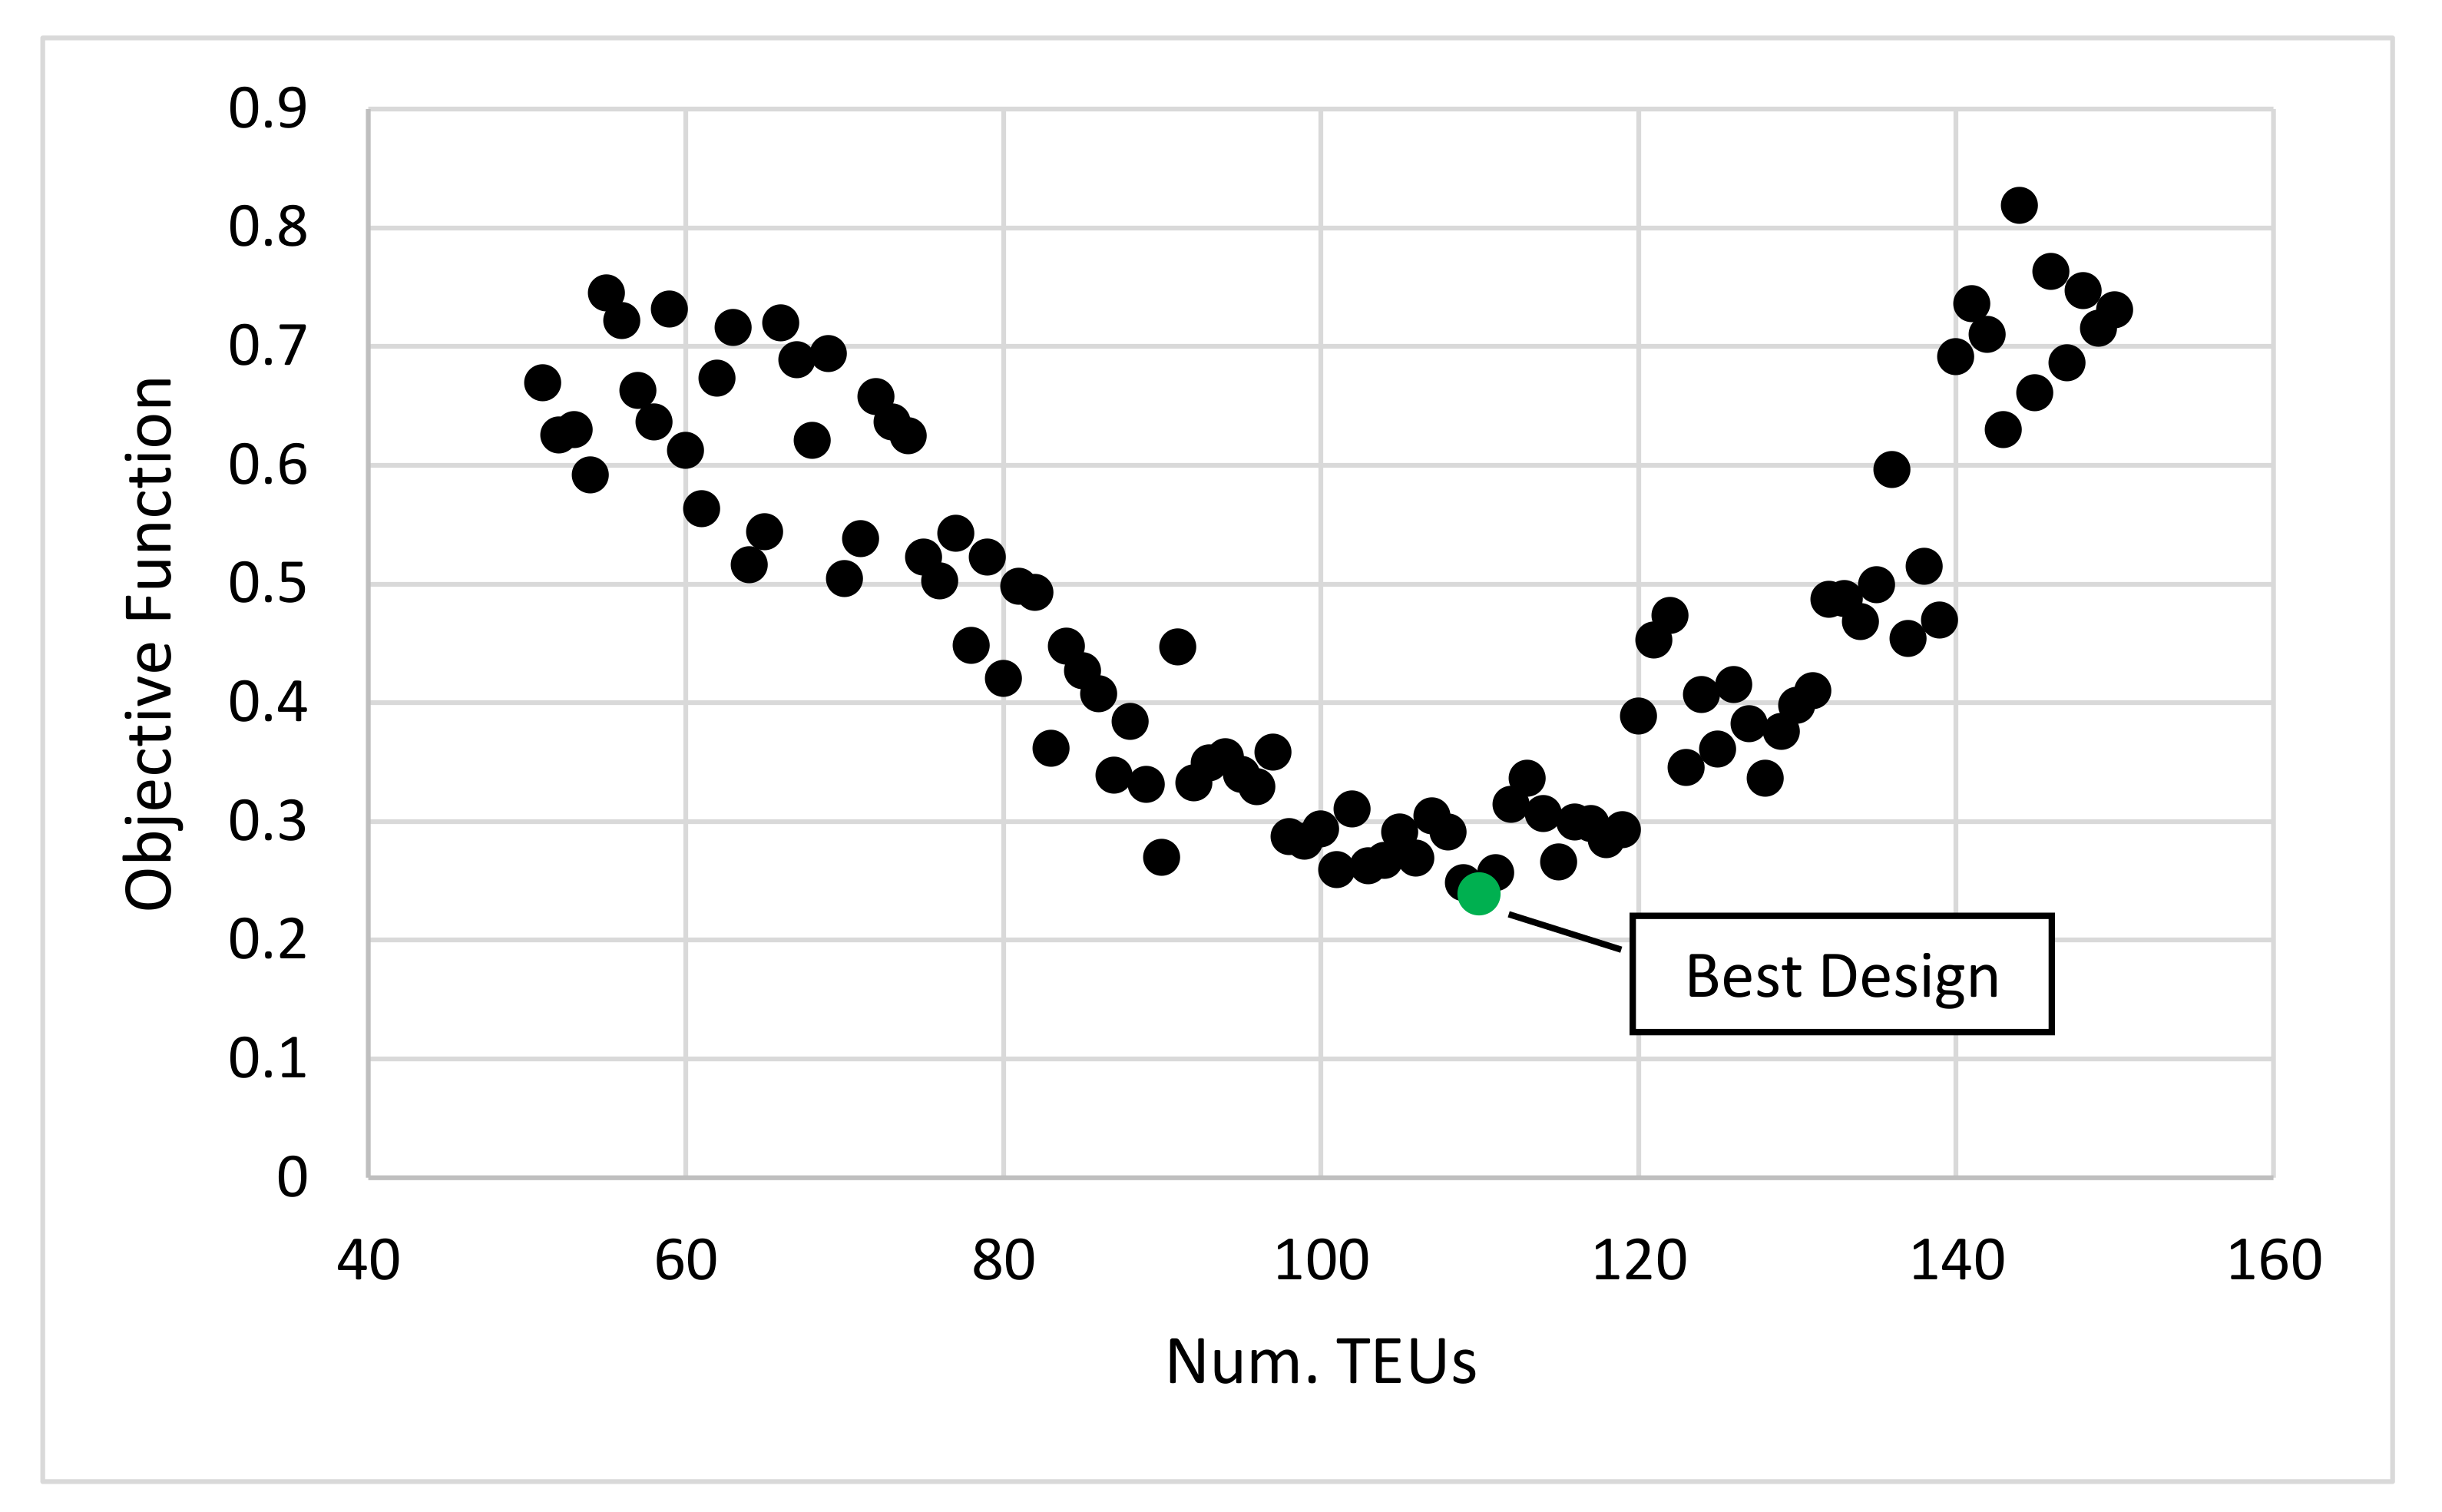
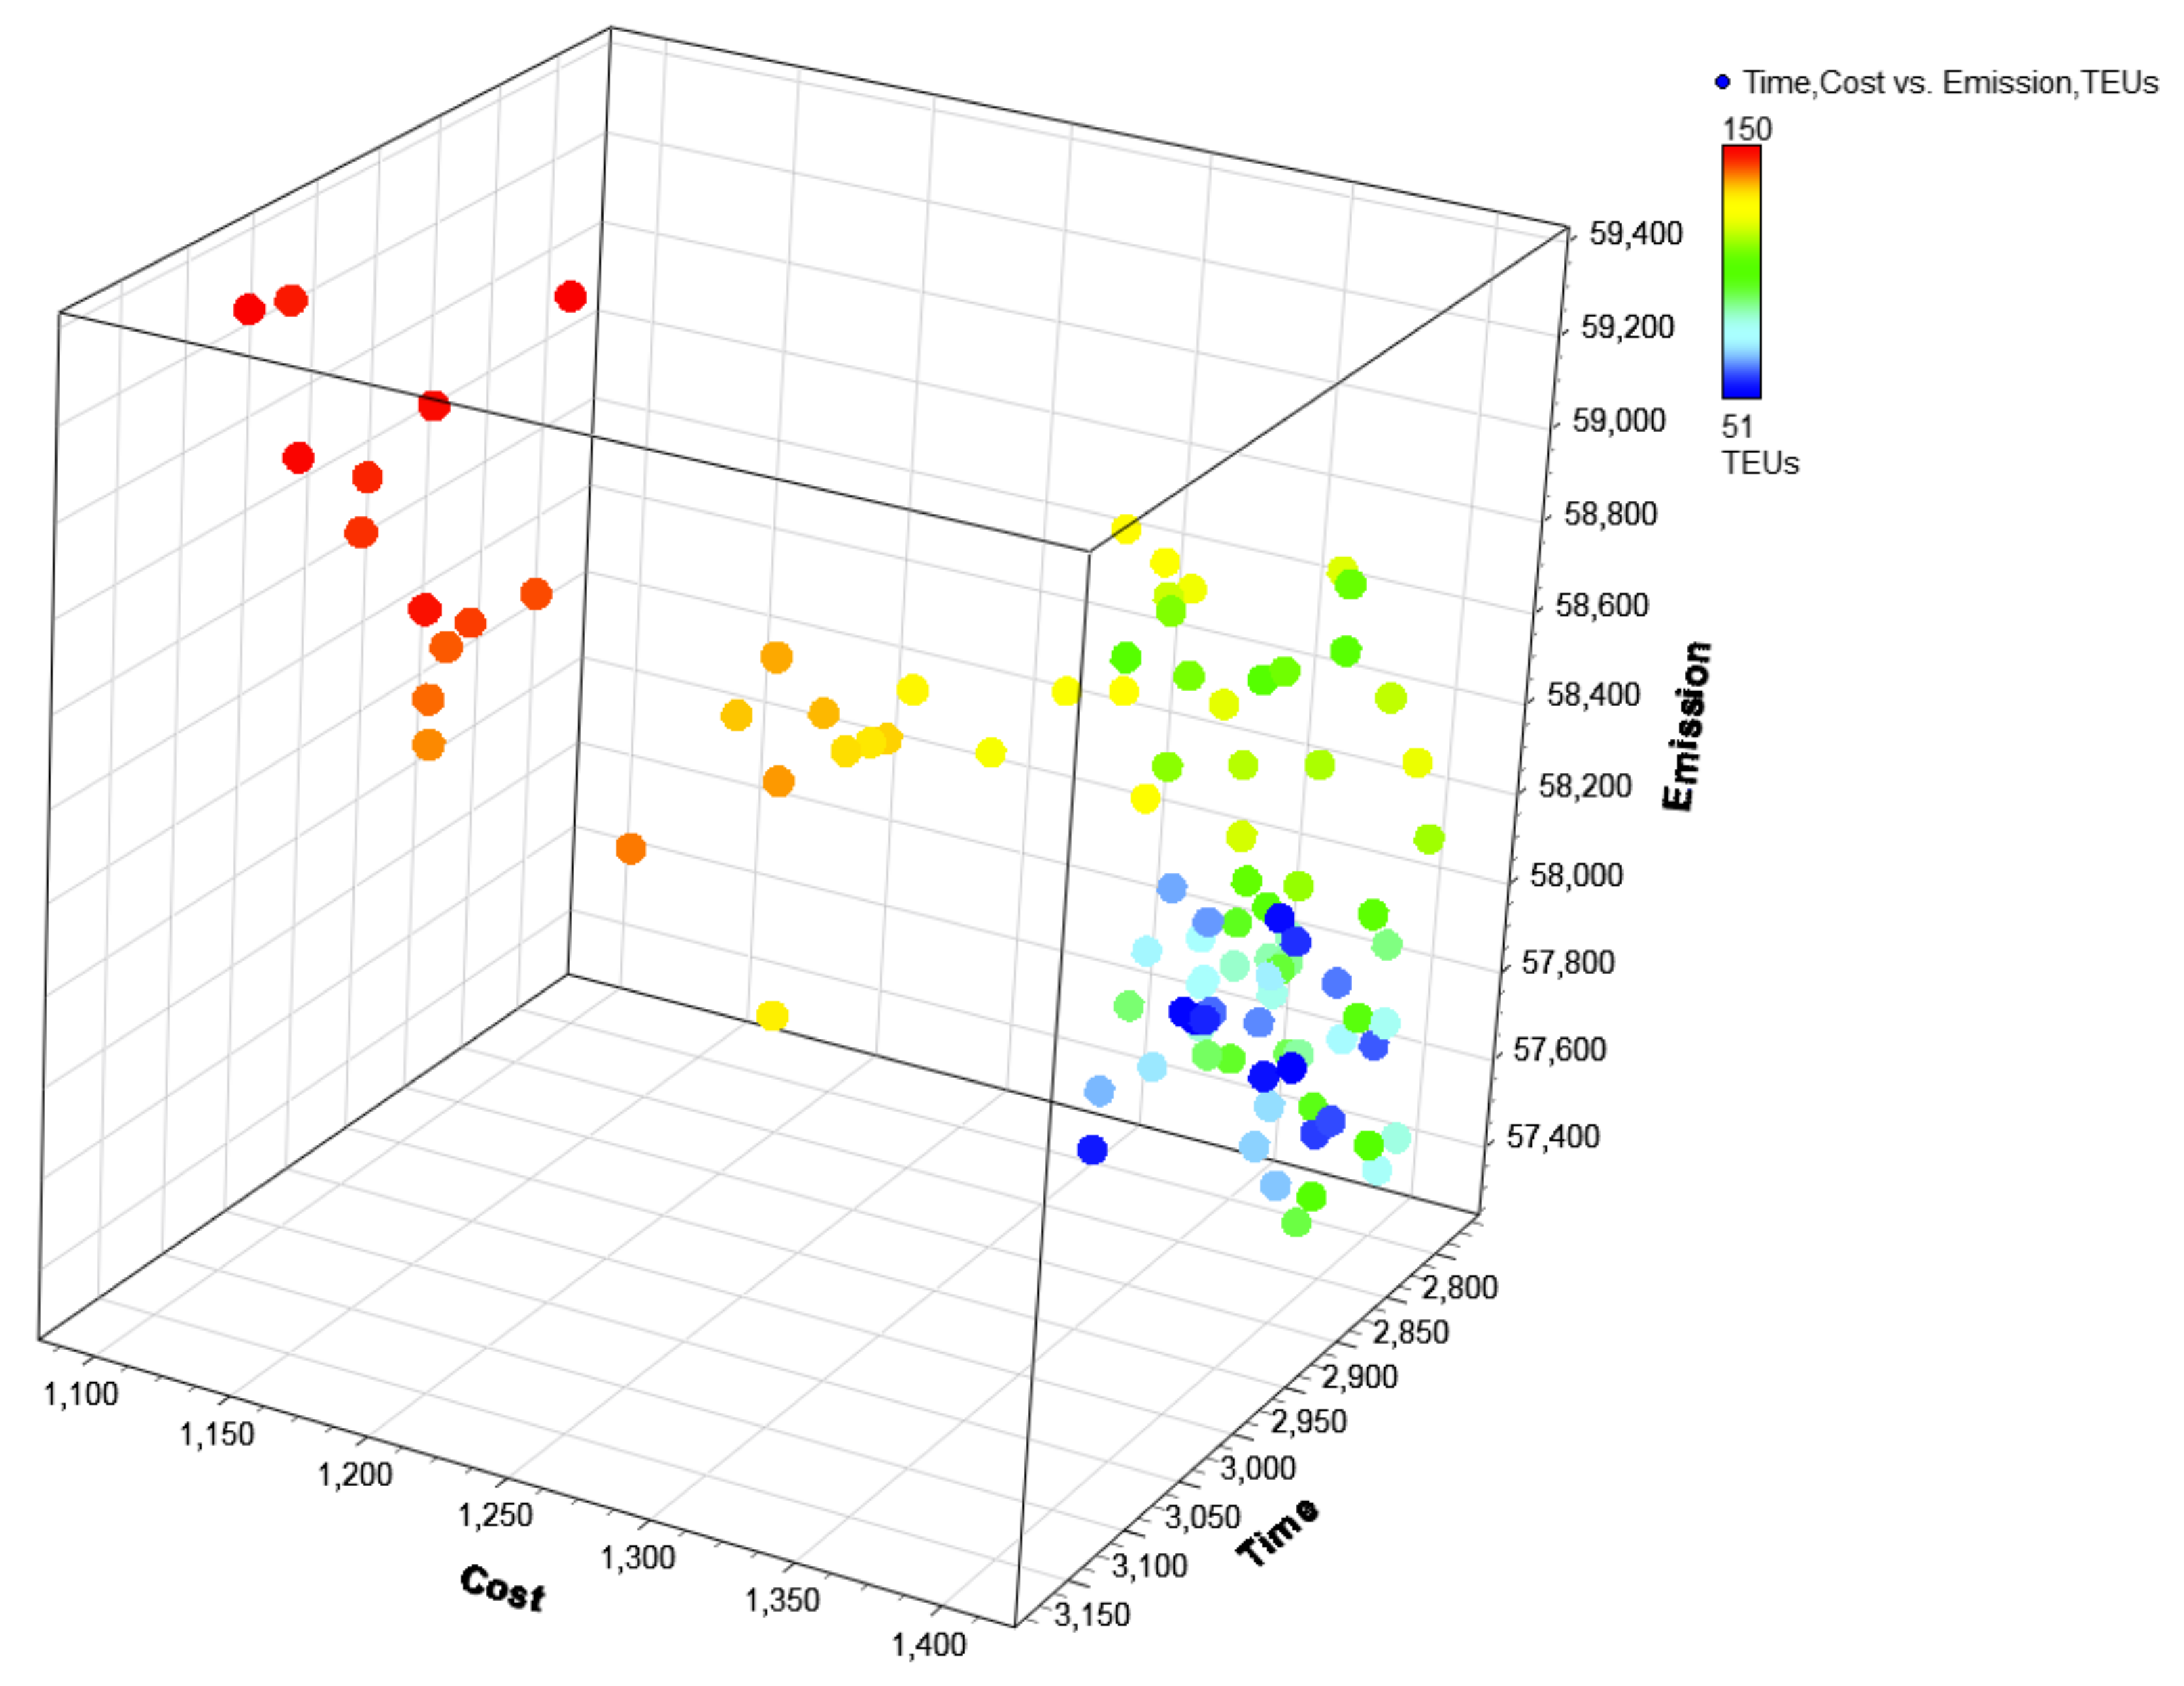
Figure 7 shows the three objectives of time, cost, and emissions for different numbers of TEUs [51 to 150]. Points in the lower cost, lower emission, and shorter time region (closer to the origin) are ideal.
The lower layer (blue-green points at the bottom) represent lower amount of TEUs and consequently smaller barges, which have lower emissions and are more concentrated around lower costs and moderate times. The upper layer (yellow-red points at the top) represents higher-capacity shipments, which result in higher emissions but may achieve economies of scale in cost per unit. The “Best Design” point, marked at 110 TEUs, minimizes the objective function, indicating the best balance between cost, time, and emissions. For TEUs above or below 110, the objective function increases, signifying worse trade-offs. High TEUs (red) correlate with higher emissions but lower costs and potentially longer times. Lower TEUs (blue) result in higher costs and lower emissions, with shorter times. The objective function for this design study is displayed in
Figure 8.
As shown in the figure above, transporting 110 TEUs via barge sea transport provides the best balance between cost, emissions, and time. A number lower than 110 TEUs increases costs (fewer units per trip), even if emissions and time might improve slightly. A number higher than 110 TEUs increase emissions significantly (due to inefficiencies or environmental impact of heavier loads), even if costs decrease slightly. The design study of Scenario 3 is shown in
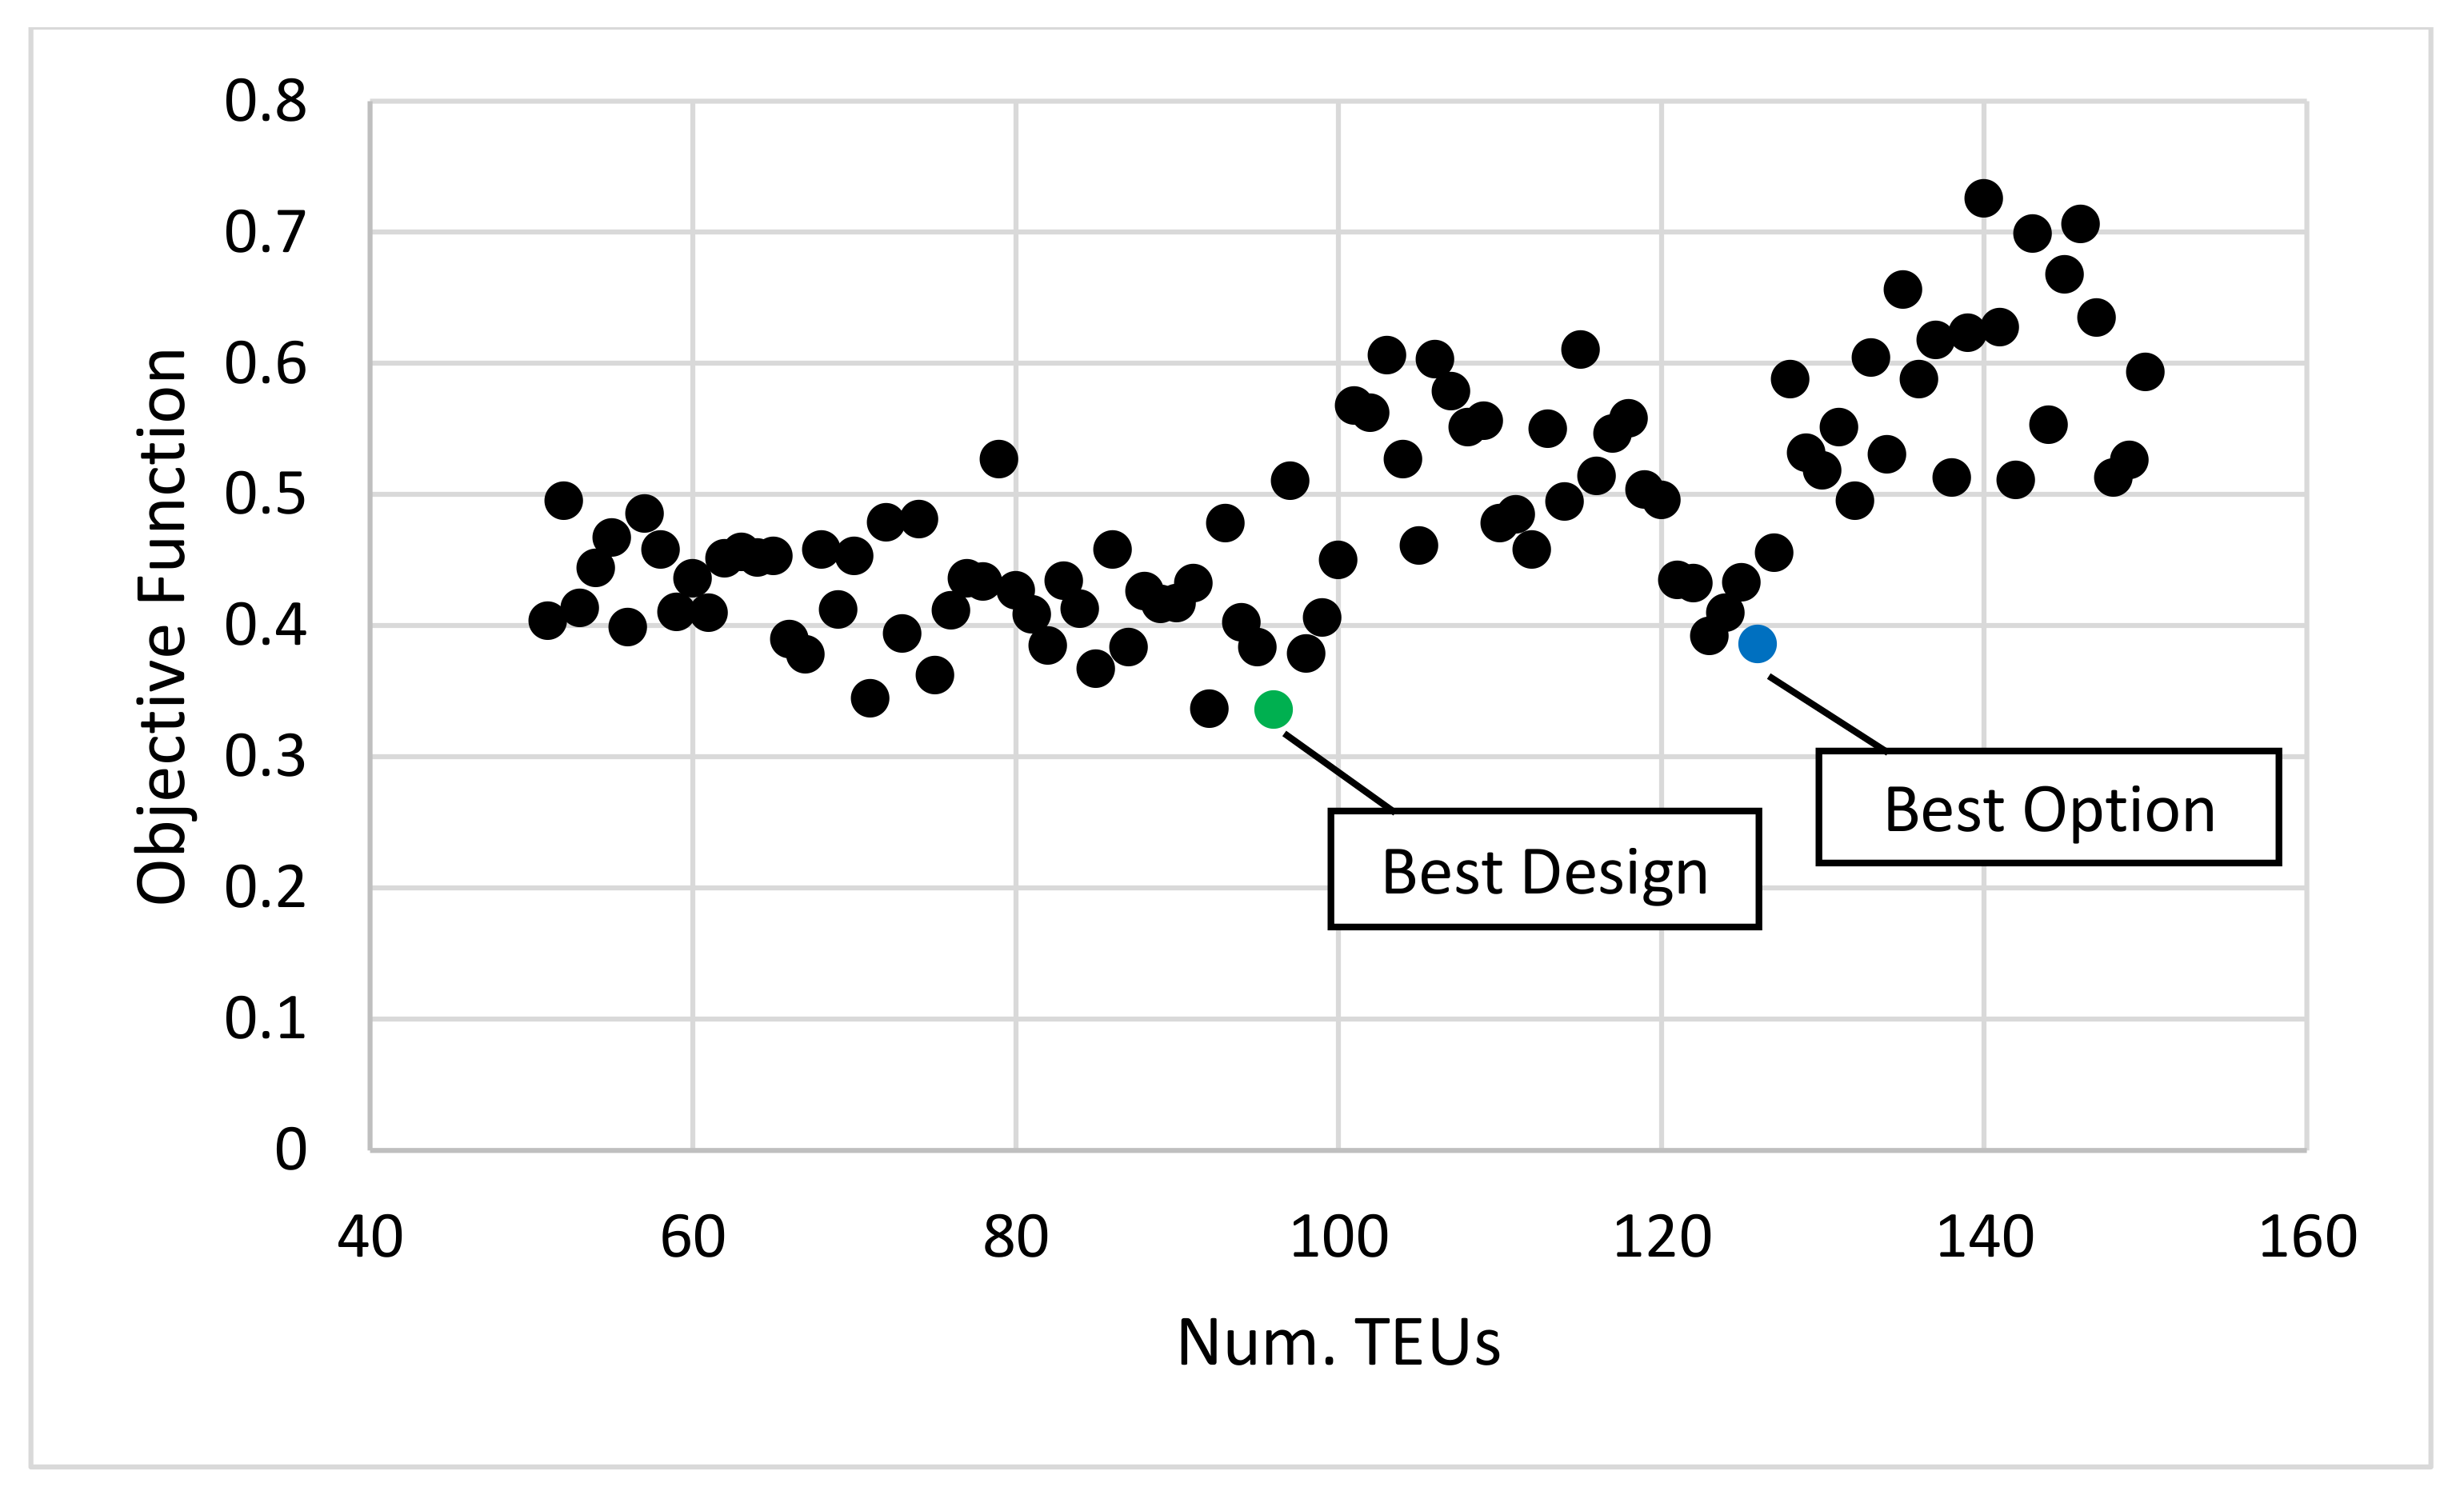
Figure 9, which presents for same number of TEUs as in Scenario 2. In addition, an objective function assessment can be seen in
Figure 10.
Higher TEU values (red) are predominantly found in regions associated with higher costs and emissions. Moderate TEU values (yellow-green) achieve a balanced trade-off between time, cost, and emissions. Lower TEU values (blue), while incurring the lowest costs, involve longer delivery times and higher emissions relative to their capacity. A barge configured for 96 TEUs is identified as the best design, as it ensures faster cargo delivery compared to configurations with higher TEUs, achieving an optimal balance across time, cost, and emissions. Meanwhile, a barge with 126 TEUs is selected as the best option due to its proximity to Scenario 2 (110 TEUs) and its practicality in accommodating higher transport capacities while maintaining acceptable trade-offs in cost, time, and emissions.
5. Conclusions
This paper seeks to illuminate the pathways for transitioning road cargo transport to waterborne alternatives, emphasizing the importance of technological innovation, sustainable vessel design, and integrated logistics systems. This study comprehensively explored the transition from road to waterborne freight transport in the UK, evaluating its potential to reduce greenhouse gas emissions, enhance cost-efficiency, and alleviate road congestion. Using discrete event simulation (DES) across four scenarios, key insights were derived about the logistical, environmental, and economic impacts of shifting to multimodal transport systems integrating coastal and inland waterways.
The results highlight that waterborne logistics is more sustainable than road transport. Scenario 1 demonstrated that maritime transport can reduce emissions by 25% and costs by nearly half, despite requiring longer transit times. Scenario 2, which involved at-sea transloading and barge swarming, showed significant flexibility and emissions reductions (38,195 kg CO2e) but required specialized equipment and coordination. Scenario 3, emphasizing distribution from a major port, achieved cost savings (GBP 1275.18 per barge) but increased emissions by 52.98% due to port handling processes. Scenario 4 revealed that waterborne transport along the Manchester Ship Canal could reduce emissions by 75% compared to road transport, albeit with slightly longer transit times. Additionally, the utilization of inland waterways, as observed in the small ports by using small size waterway barges, demonstrated that underutilized infrastructure can provide competitive alternatives to road transport, significantly lowering emissions while offering cost advantages. Moreover, the optimization of barge capacity further refined the findings. A configuration of 96 TEUs was identified as the best design for balancing cost, time, and emissions, while a 126-TEU capacity was the best option for scalability, offering a practical solution for high-demand scenarios. These insights emphasize the potential of tailored barge capacities to achieve operational efficiency while supporting environmental goals.
Thus, one may conclude the viability of integrating waterborne transport into the UK’s logistics framework as a critical step toward decarbonization. By providing data-driven evidence, it offers a blueprint for policymakers and industry stakeholders to develop sustainable freight highways. Furthermore, comparisons between scenarios highlight that, under stricter emissions policies, multimodal systems could achieve even greater reductions by incorporating cleaner fuels, low-emission propulsion systems, and advanced technologies to the proposed barge swarming system. To allow for a more comprehensive evaluation, future studies could include thorough social and ecological risk parameters like energy intensity, speed, congestion, and dependability. Furthermore, incorporating uncertainties and operational risks like weather conditions, seasonal water level fluctuations, and port congestion in problem parameters is a crucial step toward enhancing the realism of the study. Forecasting models could be utilized to develop auxiliary tools for alternative road transport, optimizing routes, transportation operations, energy consumption, and vehicle performance. Exploring the adoption of electric vehicles or low-carbon fuels within the sector presents an opportunity to further reduce greenhouse gas emissions and enhance ecological footprint optimization. Additionally, the authors aim to gather more detailed and realistic data for logistics simulations and focus on the design and development of a zero-emission barge vessel, adaptable for the entire waterborne transportation network of the UK.


