1. Introduction
Ocean wave energy has emerged as a promising renewable resource, driving advancements in wave energy converter (WEC) technologies [
1,
2]. Point absorber WECs (PAWECs) stand out due to their space-efficient structure and operational flexibility across diverse marine environments [
3,
4]. A persistent problem in practical PAWEC systems is the difficulty of maintaining stable and efficient power output when exposed to irregular, rapidly changing, and nonlinear wave forces. These fluctuations can cause significant variations in the generator’s performance, reduce energy capture efficiency, and lead to unstable grid-side power quality, especially for systems using permanent magnet synchronous generators (PMSGs) and grid-connected power take-off (PTO) units. These systems utilize vertically oscillating buoys coupled with PTO mechanisms to convert wave motion into electrical energy [
5,
6]. Recent studies have proposed various control strategies to address these challenges and improve the performance of PAWECs under stochastic sea conditions [
7,
8].
The wave-to-wire modeling paradigm presents unique control challenges across energy conversion stages. Ref. [
9] identifies three critical limitations in conventional approaches: simplified hydrodynamic coupling, linearized PTO dynamics, and decoupled electrical modeling. High-fidelity models such as those proposed by Penalba and Ringwood increase computational complexity for real-time control; however, this challenge can be mitigated using state-space modeling of convolution terms under harmonic input assumptions, as shown by Kristiansen et al. [
10]. Spectral-domain approaches [
11] enable efficient frequency-domain analysis yet struggle with transient wave conditions. These modeling compromises directly impact control performance—simplified models degrade maximum power point tracking (MPPT) accuracy by 15–20% under irregular waves [
12], while detailed models introduce latency incompatible with sliding-mode techniques.
Field-oriented control (FOC) has been widely adopted in WECs for its straightforward implementation and computational efficiency [
13]. Its decoupled flux–torque control architecture enables precise generator regulation under steady-state conditions [
14]. While effective in controlled environments [
15], FOC’s linear framework struggles with the nonlinear hydrodynamic interactions inherent in real ocean waves [
16]. Recent studies have highlighted FOC’s diminished performance under rapid wave variations [
17], underscoring the need for nonlinear control alternatives.
Sliding-mode control (SMC) has emerged as a robust alternative, recognized for its capacity to handle nonlinear system characteristics [
18,
19,
20]. First-order SMC (FOSMC) stabilizes system dynamics through sliding-surface enforcement [
21], demonstrating effectiveness in oscillating water column control [
22,
23,
24] and nonlinear WEC torque regulation [
25]. However, its discontinuous switching induces high-frequency chattering that accelerates mechanical wear [
26], particularly problematic for long-term marine operations. Higher-order SMC techniques address this limitation through derivative-based smoothing, with super-twisting SMC (STSMC) showing particular promise due to its continuous control law formulation [
27,
28]. Recent applications in hybrid wave–wind systems [
29] and array-level WEC control [
30] have demonstrated STSMC’s adaptability to multi-source energy scenarios. The algorithm’s dual-layer structure effectively compensates for hydrodynamic uncertainties while maintaining fixed-time convergence [
31], crucial for handling the non-stationary radiation forces in heaving PAWECs [
32]. Comparative studies in [
33] reveal a 40% chattering reduction compared to FOSMC, significantly enhancing device longevity.
Nonlinear adaptive backstepping (NAB) has emerged as a complementary approach to FOC for handling hydrodynamic nonlinearities in WECs through recursive parameter adaptation [
34]. While FOC struggles with nonlinear wave–structure interactions, NAB demonstrates superior performance in torque regulation through its hierarchical control structure, achieving 18% higher energy capture in irregular waves compared to FOC. Recent implementations in direct-drive WECs and grid-connected point absorbers validate NAB’s capacity to handle coupled electromechanical dynamics through Lyapunov-based stabilization. However, three critical limitations persist: (1) The computational complexity escalates exponentially with system order, requiring 40% more processing time than SMC for equivalent 6-DOF models [
35]. (2) Sensitivity to initial parameter estimates causes 15–25% performance degradation under measurement noise [
36]. (3) The absence of inherent chatter-suppression mechanisms leads to 2–5% THD increases in grid-connected systems [
37]. Hybrid strategies integrating NAB with sliding-mode elements partially address these issues but introduce new challenges in gain scheduling [
38].
The unique operational demands of PAWECs amplify these control challenges. Significant variations in wave amplitude, frequency, and direction induce complex nonlinear dynamics in heaving buoy systems. Effective control must simultaneously optimize energy capture, mitigate mechanical stresses, and ensure power quality for grid integration. While STSMC shows theoretical promise for these objectives, its application in PAWEC systems with grid-connected PMSG-based PTOs remains underexplored, particularly regarding THD management and experimental validation.
This study contributes to the existing research through three significant innovations:
- (1)
The proposed integrated STSMC framework, specifically tailored for PMSG-equipped PAWEC systems, significantly enhances robustness and operational efficiency under nonlinear dynamic behaviors and wave disturbances.
- (2)
A comprehensive nonlinear dynamic model of the PAWEC–PMSG system is established and rigorously supported by Lyapunov stability proofs, ensuring reliable and stable control performance under varying sea states.
- (3)
A systematic comparative analysis and validation of the proposed control method against three conventional strategies (FOC, FOSMC, and NAB) under regular and irregular wave conditions demonstrate significant improvements in key performance indicators, including generator dynamics, power quality, and integration stability.
Section 2 details the wave-to-wire energy conversion model, while
Section 3 presents the STSMC design and stability analysis.
Section 4 evaluates controller performance through simulation and experimental studies, followed by conclusions and future directions in
Section 5.
3. Control Strategy for PMSG-Based PAWEC
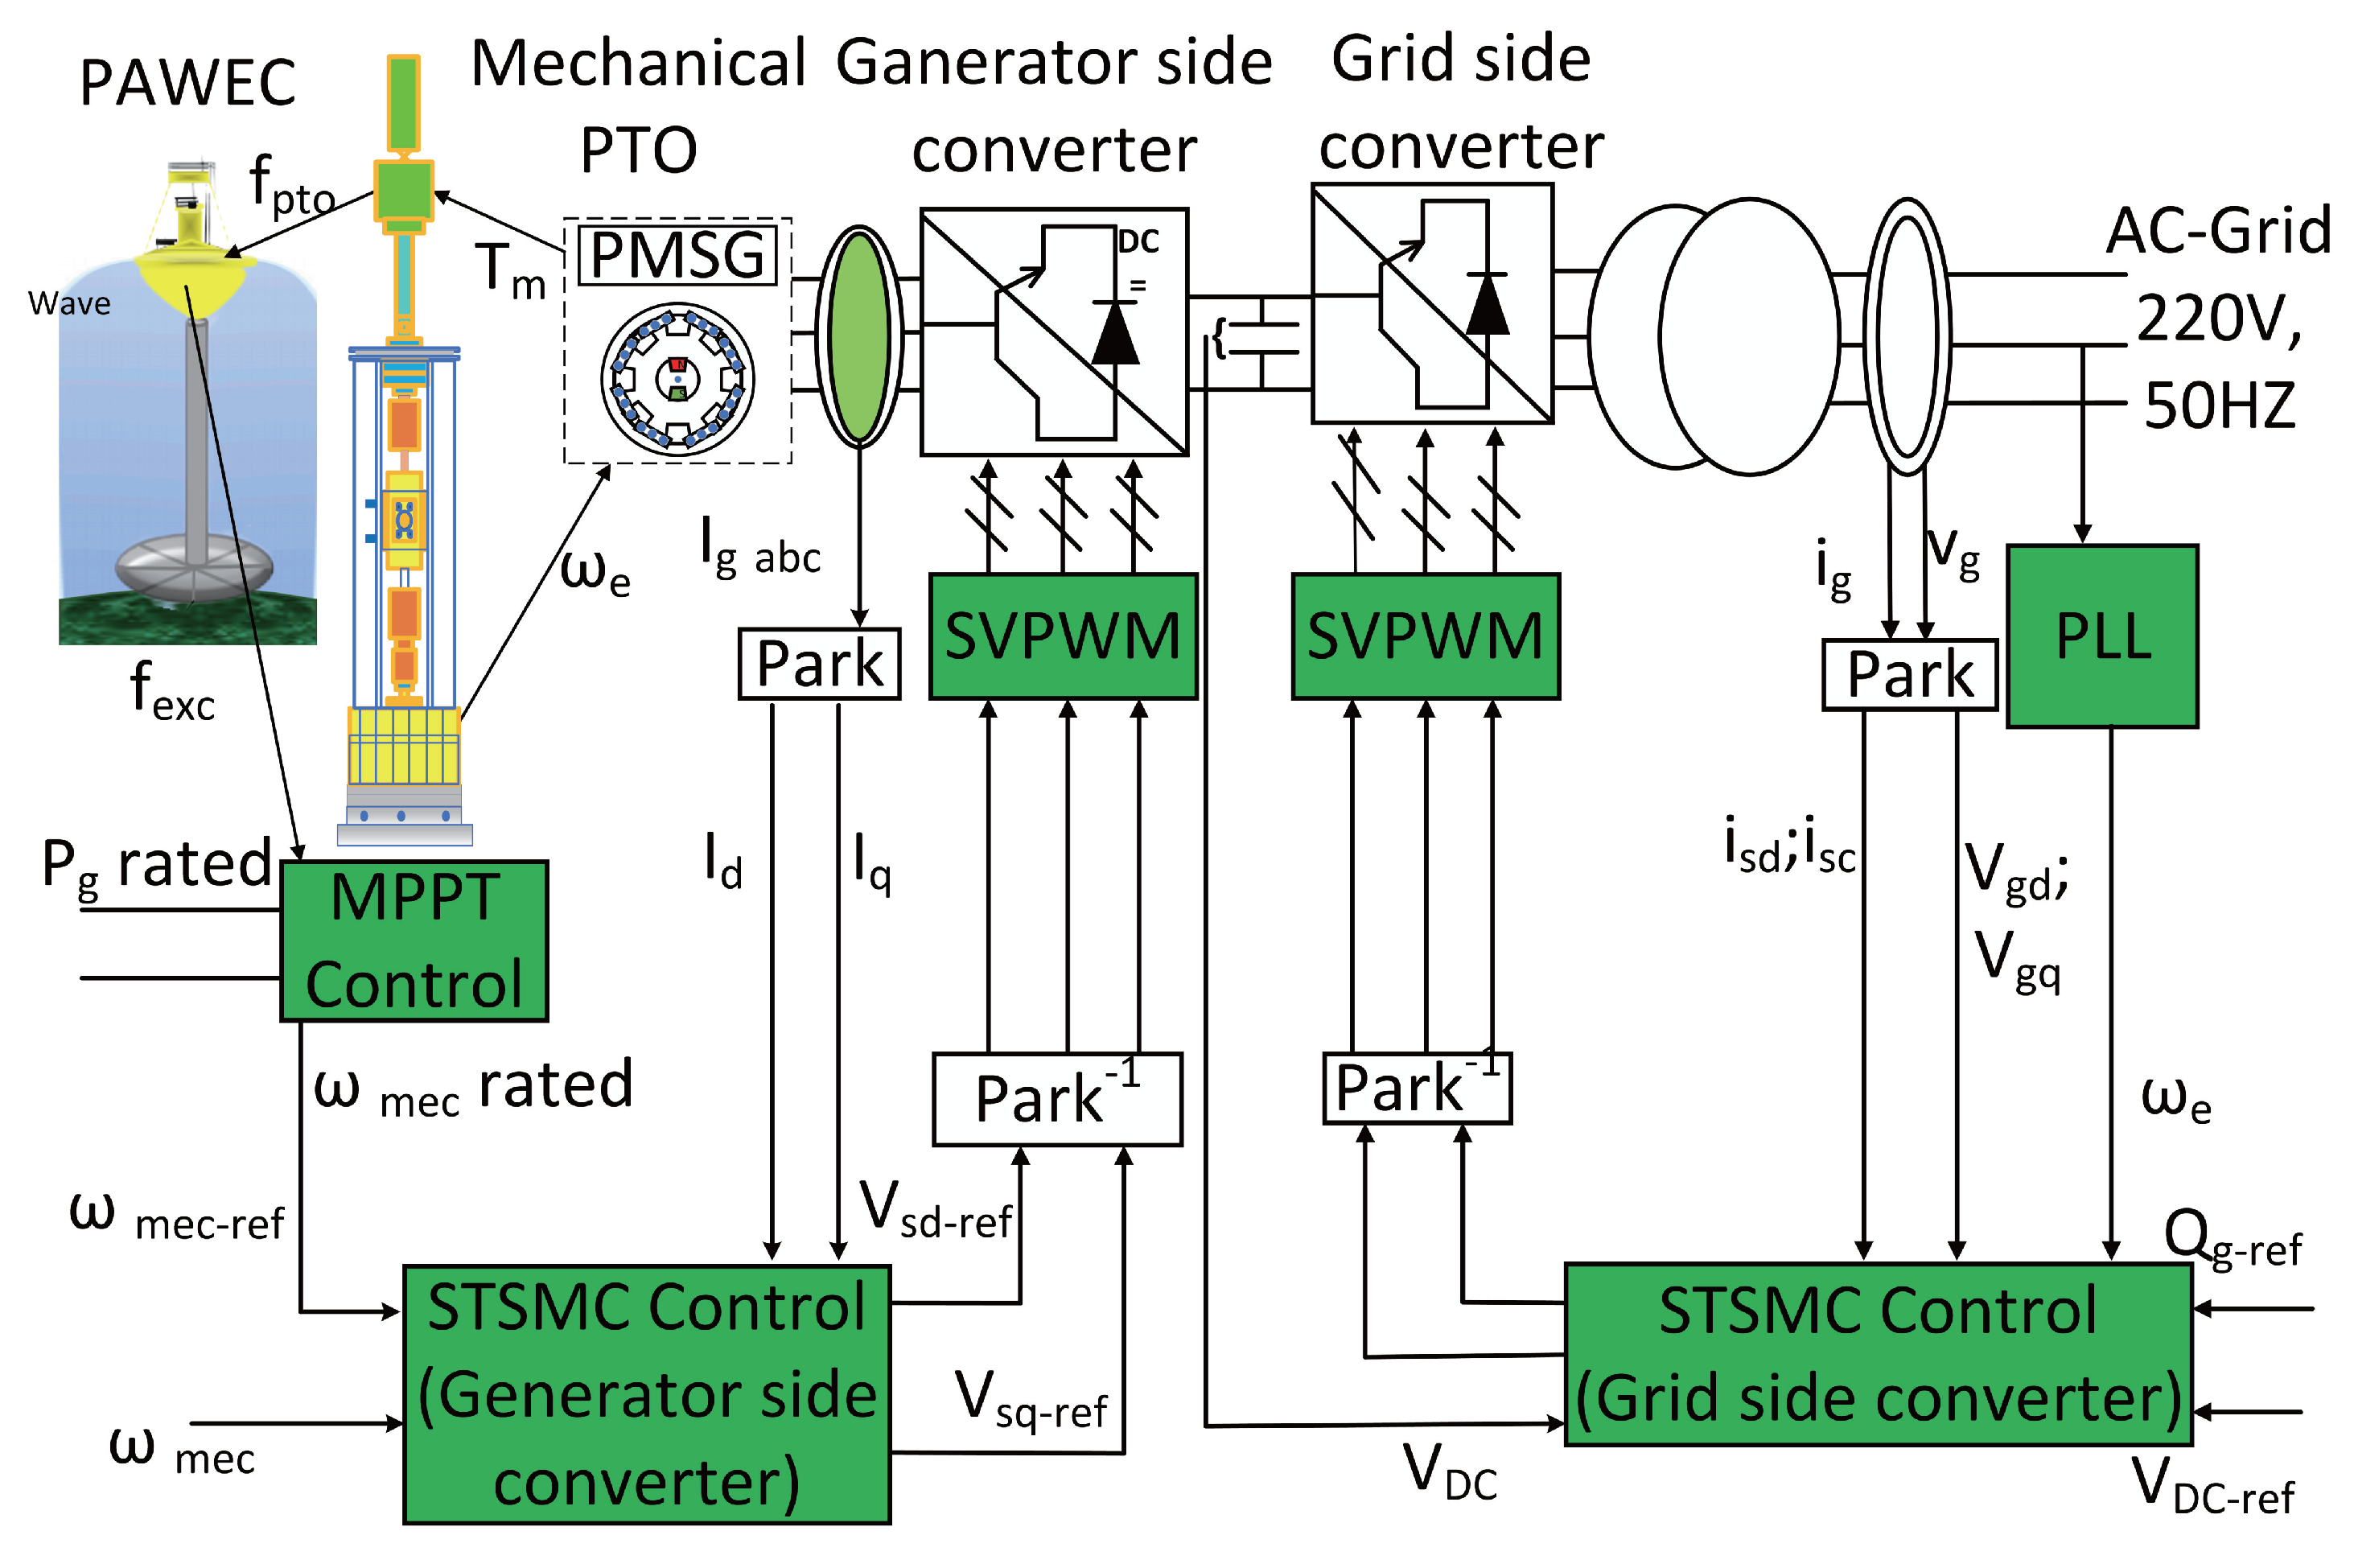
The control framework for the PAWEC system employing a PMSG, as shown in
Figure 2, integrates essential components to manage energy conversion efficiently and ensure grid compatibility. The MPPT controller updates the reference mechanical speed in real time, aligning the generator’s operating point with fluctuations in wave power to achieve optimal efficiency. This reference speed is then applied to the generator-side inverter, which uses Space Vector Pulse-Width Modulation (SVPWM) and Park transformation to regulate the generator current, thereby maximizing torque and minimizing losses. On the grid side, the inverter controller transforms the direct current (DC) output from the generator into an alternating current (AC) signal appropriate for 220 V, 50 Hz grid conditions. A Phase-Locked Loop (PLL) synchronizes the output AC voltage in both phase and frequency with the grid.
3.1. Control Strategy for Generator-Side Converter
The generator-side converter control strategy employs STSMC to address the high-frequency chattering commonly associated with FOSMC. By integrating the control input, STSMC effectively reduces chattering and facilitates the smooth convergence of state variables to zero within a finite-time frame [
39]. This ensures accurate tracking of the generator speed.
3.1.1. Nonlinear Control Problem Statement
The nonlinear system is represented as follows:
where
denotes the state variables,
are the input variables, and
represents the sliding surface [
40].
The derivative of the sliding surface is given by
Assumption 1. The control gain for all x and .
This assumption ensures that the control input always has a direct and sufficient influence on the system dynamics [
41]. Physically, for the PAWEC equipped with a PMSG, this condition is satisfied when the actuator (e.g., inverter or generator interface) is able to deliver torque to the mechanical system across its entire operating range. If
were zero, the control authority would be lost, making the system uncontrollable in certain states.
Assumption 2. The term is bounded by , where .
This assumption means that uncertainties, disturbances, or nonlinearities represented by
are not dominant and remain bounded relative to the sliding variable
S. For wave energy systems, this is a reasonable engineering condition, as physical disturbances (such as wave loading, friction, and parameter drifts) are generally limited by the machine’s mechanical design and operating envelope. The constant
reflects the maximum tolerable disturbance amplitude that the control system can handle without instability or performance loss [
41].
Definition 1. For a nonlinear system represented by Equation (
17)
, let be the sliding variable. The control objective is to drive this variable to zero within a finite-time frame [41]. The sliding order r is defined as the number of continuous derivatives of S that vanish on the sliding surface . Hypothesis 1. The control gain matrix remains non-singular, and the zero dynamics are asymptotically stable [40]. The system bounds are given by The solution of the differential equation with a discontinuous right-hand side is understood using Filippov’s definition [42]. The r-th order sliding surface satisfies The requirements above relate to the physical limits and response characteristics of the PAWEC system. For example, the boundedness of and ensures that neither the disturbance nor the system’s own dynamics can change too rapidly for the controller to react, which corresponds in practice to the physical limits of inertia, actuator slew rate, or sensor bandwidth. The non-singularity of means the actuator is always effective, while the stability of the zero dynamics implies that once on the sliding surface, the system will not exhibit internal instability (such as unmodeled mechanical resonances or oscillations). The constants should be chosen in accordance with the PAWEC’s mechanical and electrical parameter ranges, ensuring the controller remains effective under all expected sea states and load conditions.
3.1.2. STSMC Controller Design for PMSG-Based PAWEC
In conventional FOSMC systems, the sliding function S ensures that the system remains on the sliding surface. However, FOSMC frequently results in high-frequency chattering. To mitigate this issue, an STSMC strategy is employed. By integrating the control input, STSMC effectively reduces switching frequency and mitigates chattering. This control strategy ensures that the system’s state variables converge to zero within a finite time, as presented in the following formulation.
The control law is defined by
where
and
are the gains of the STSMC.
The state variables of the PMSG system are defined as
where
and
represent the desired and actual rotor speeds, respectively.
The sliding surfaces are defined as follows:
where
c is a constant.
The time derivative of the sliding surface
defined in Equation (
26) is given by
where
is the state variable and
c is a positive constant.
Taking the second derivative yields
Similarly, for the sliding surface
,
Based on the generic representation in (
28) and (
29), the sliding-surface dynamics can be rewritten as
where
To decouple the sliding surface in Equation (
28), a virtual control
U is introduced such that
. For the sliding surface
, the required control rate appears in Equation (
28). According to Hypothesis 1, the control law combines an equivalent control
and a switching control
as follows:
where
and
are positive gains and
denotes the sign function.
For the
d-axis current control, the control law is given by
where
and
are positive controller gains for the
d-axis and the other symbols are as previously defined.
The final STSMC control laws can be expressed as
All other parameters retain their standard definitions, as described above.
3.1.3. Stability Analysis for STSMC
Compared to traditional FOSMC, the control law in STSMC is modified by substituting the sliding surface
S with
. A new parameter
is introduced, enabling the construction of a Lyapunov function for stability analysis [
40].
Define
. The system dynamics are given by
Select a Lyapunov function
where
P is positive definite.
Differentiating Equation (
42),
where
Q is positive definite and
Z converges to
.
Thus, it can be concluded that the Lyapunov function is continuously decreasing, and the equilibrium point is reached.
3.2. Control Strategy for Grid-Side Converter
The grid-side converter (GSC) plays a critical role in synchronizing with the grid, stabilizing the DC bus voltage, and controlling power flow. It converts DC power to AC with a frequency and amplitude matching the grid’s, ensuring sinusoidal currents, reduced harmonic distortion, and stable DC voltage. A dual-loop control structure is implemented, comprising an outer loop for managing DC voltage and reactive power, and an inner loop for controlling grid currents.
The GSC control model in the
d-
q reference frame is defined as
where
and
are the grid
voltages and
and
are the grid resistance and inductance, respectively. These equations describe the relationship between the voltage control inputs and the grid currents, forming the basis for managing active and reactive power flow.
The active and reactive powers
and
in the GSC are defined as
These expressions allow for the alignment of generated power with grid requirements, thereby ensuring a stable energy exchange between the PAWEC system and the grid.
The grid currents
and
can be calculated using Equations (
47) and (48). The reactive current
is obtained as
This equation provides a means to control reactive power by adjusting the quadrature current component.
By controlling the DC bus voltage, the direct reference current
can be derived. Neglecting converter losses, the active power can be defined by
Thus, the direct current reference
is obtained from
This relationship allows the MPPT controller to adjust the active power component to match grid demands.
The sliding surfaces for the direct and quadrature grid current errors are chosen as follows:
These sliding surfaces are used to define the control objectives for the grid currents, ensuring that the reference and actual currents converge.
Differentiating Equation (
52) with respect to
t, the following equations are obtained:
These differentiated sliding surfaces are critical in determining the appropriate control actions required to drive the current errors to zero.
The control law is structured with an equivalent control component as follows:
The equivalent control terms
and
are defined by
These terms represent the control efforts required to maintain the desired current trajectory, effectively compensating for the system dynamics.
The final control laws are therefore given by
These control laws integrate both equivalent and switching control elements to ensure that the grid currents track their reference values accurately. The inclusion of the super-twisting terms helps minimize chattering, thus improving the robustness and stability of the GSC control under dynamic grid conditions. The combination of equivalent control and super-twisting ensures effective current regulation, enhancing the overall performance of the PAWEC system during grid integration.
4. Results and Analysis of PAWEC Control Strategies
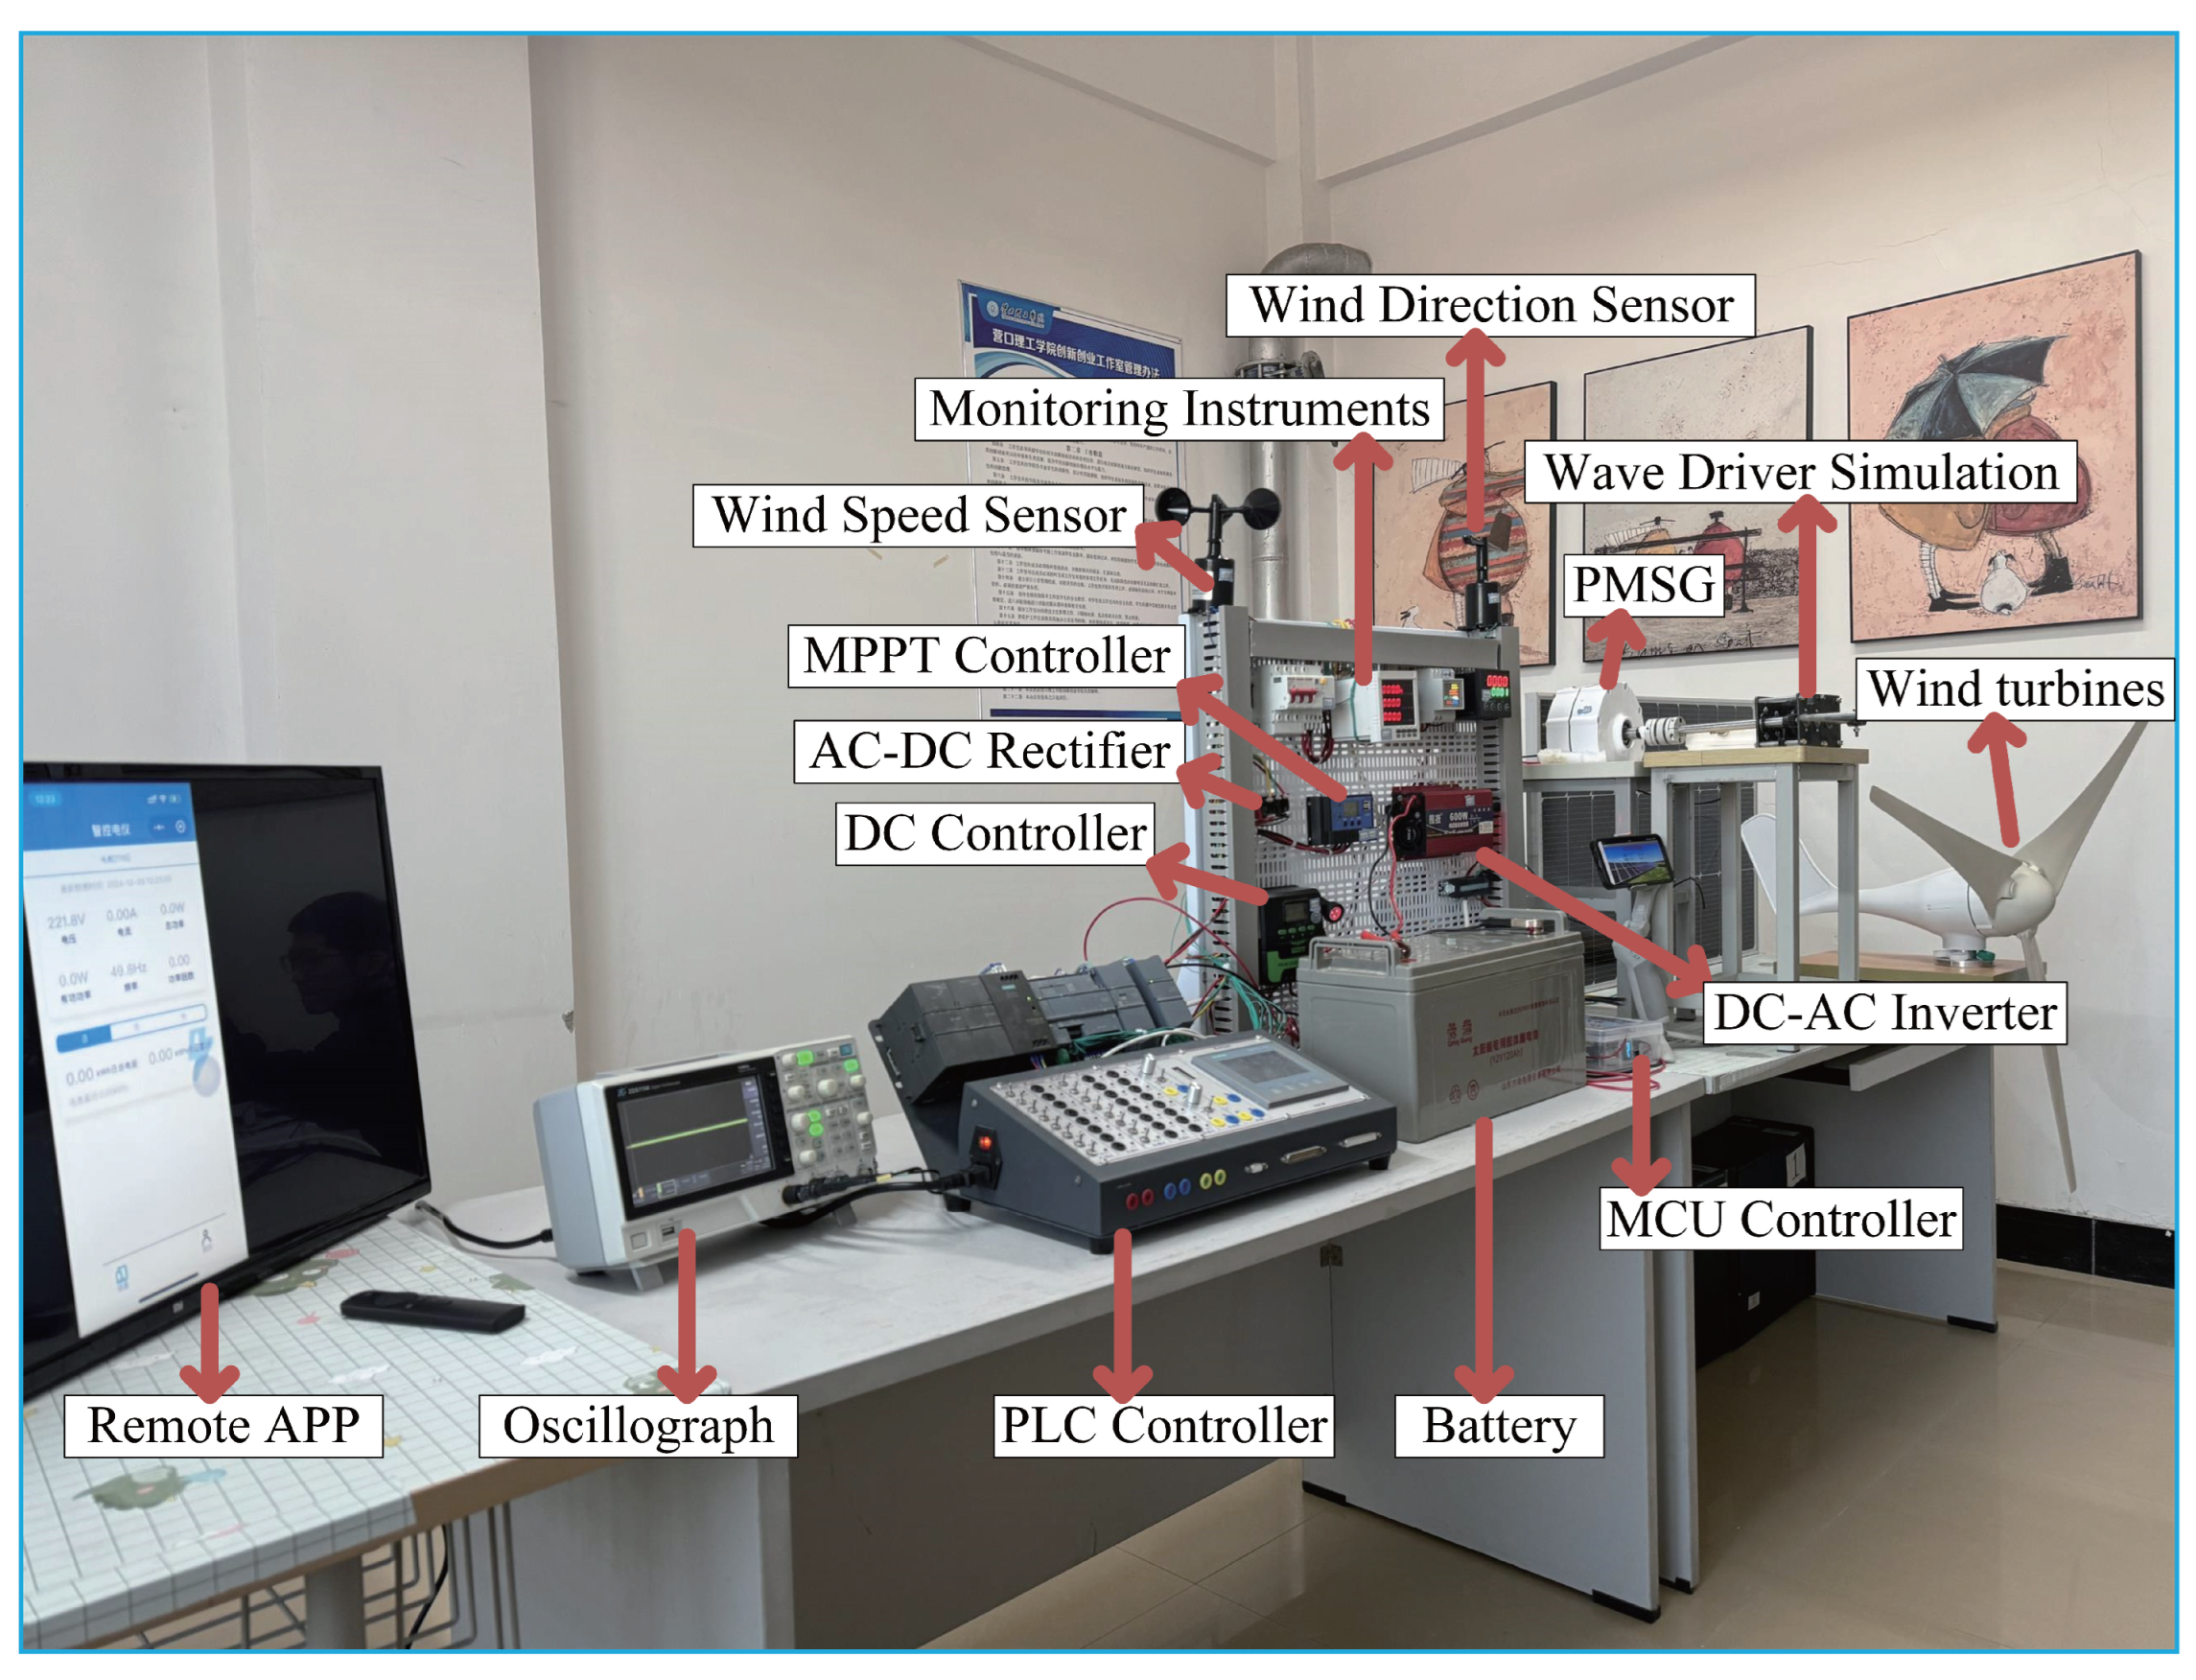
The PAWEC system, equipped with a 500 W PMSG, was simulated to evaluate the effectiveness of the four control strategies under both regular and irregular wave scenarios. A small-scale wave–wind energy power generation grid-connected device, as shown in
Figure 3, was constructed to replicate the wave-to-grid process in a laboratory environment. The wave energy power generation process was simulated using a gear-driven permanent magnet synchronous generator. To simulate different wave conditions, the laboratory controlled the rotational speed of the servo motor to emulate the rated speed of the generator under varying wave heights. The setup included a gear-driven wave simulation mechanism to mimic ocean wave forces, driving the PMSG for power generation. The generated power was then processed through an AC-DC rectifier and a DC-AC inverter for grid integration at 220 V, 50 Hz. Key components such as the MPPT controller, PLC controller, and monitoring instruments were integrated to ensure precise control and measurement. As detailed in
Table 1, the system parameters encompassed buoy properties, generator specifications, and grid conditions. These parameters capture typical operating ranges for small-scale devices, enabling a realistic assessment of control strategy performance.
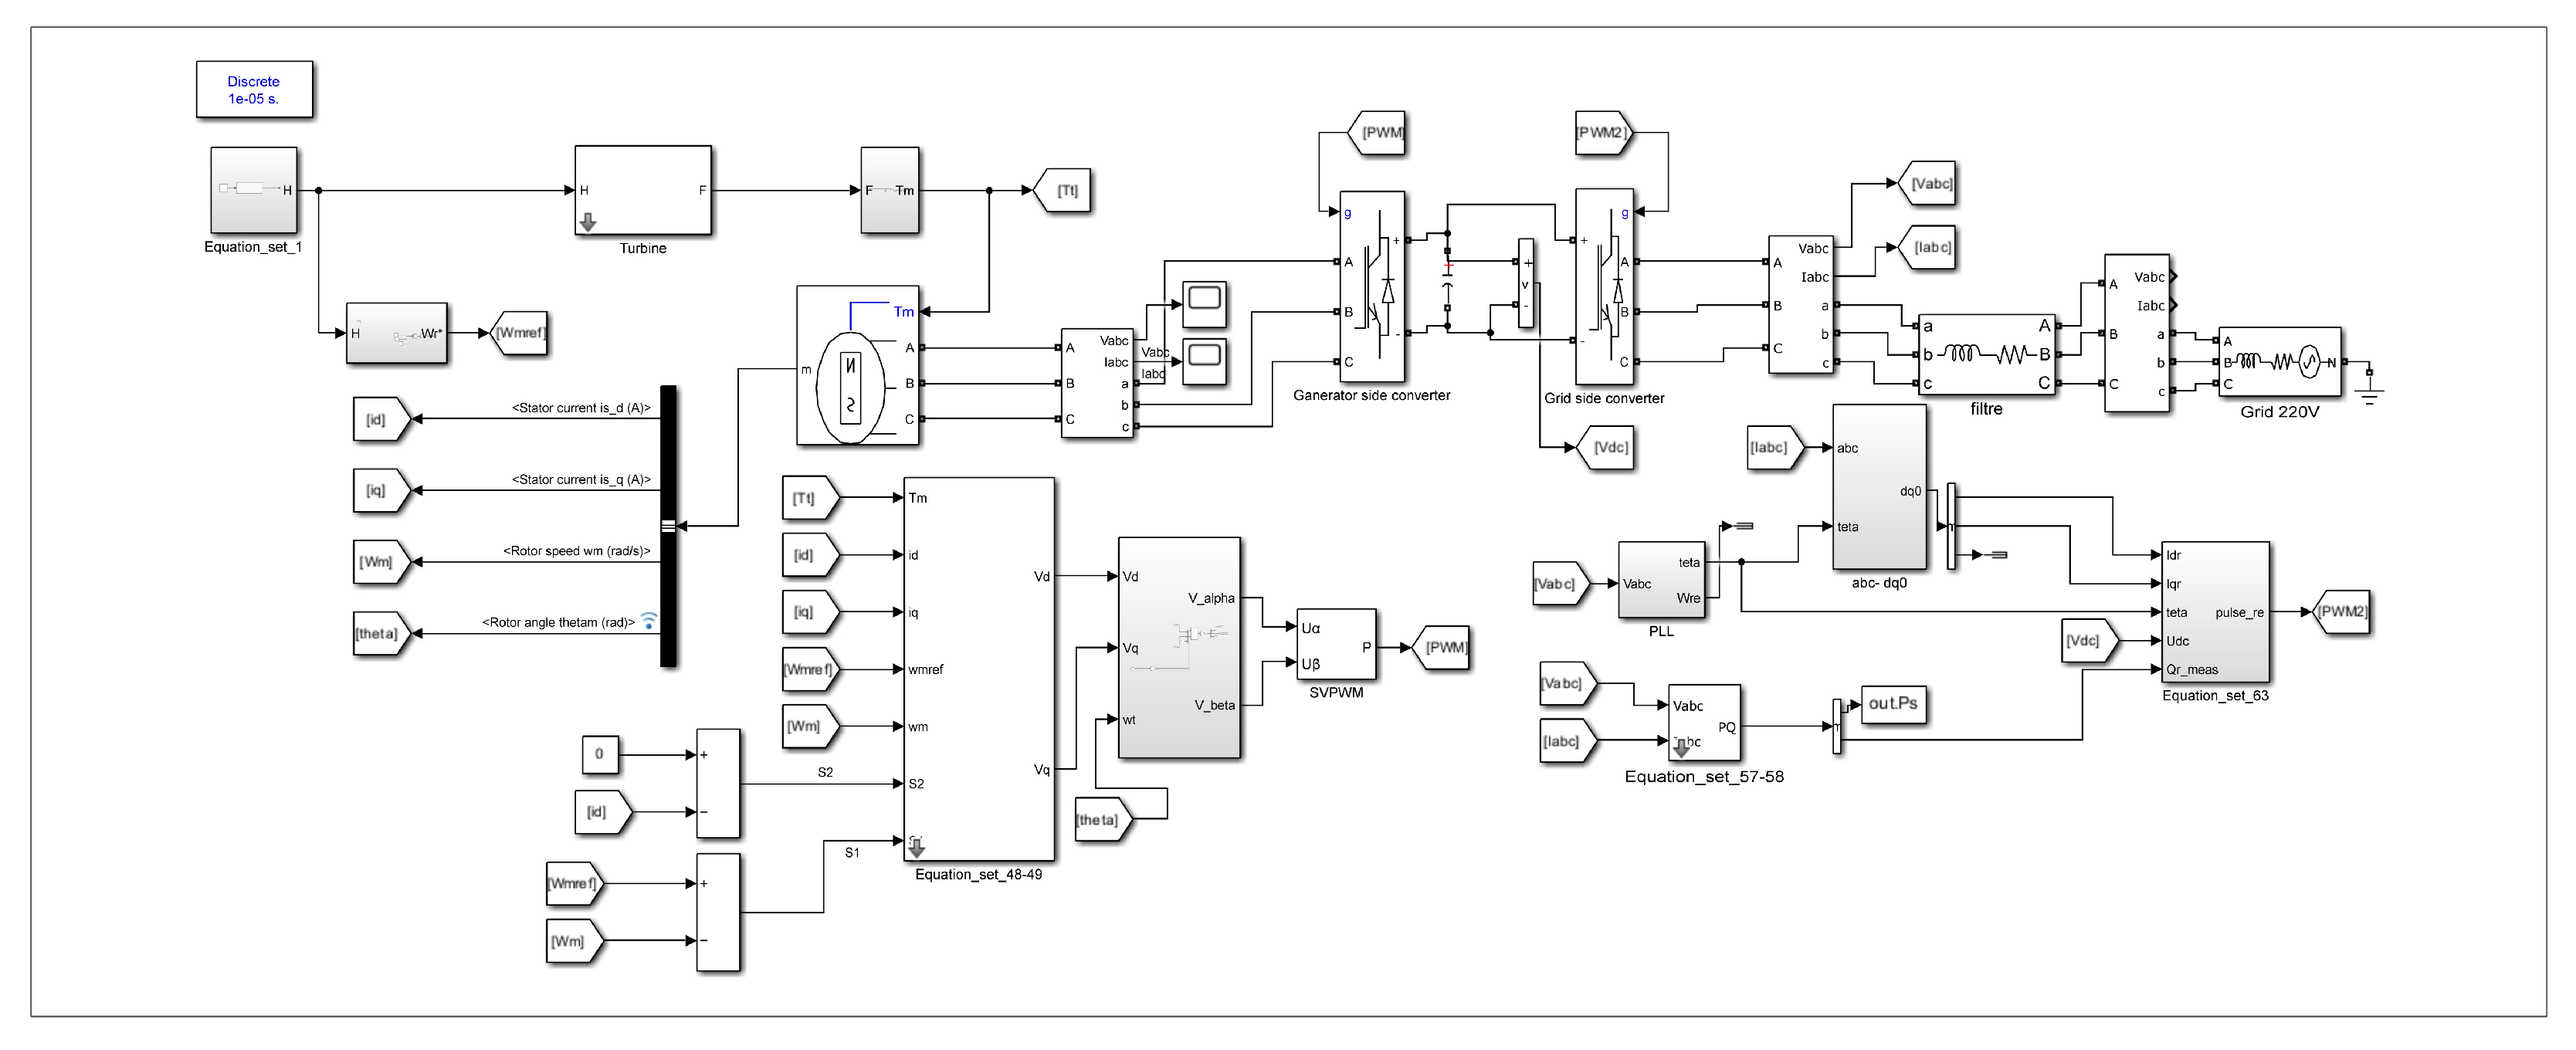
Figure 4 illustrates the PAWEC system and its control configuration as modeled in MATLAB/Simulink R2022b. The controller is designed to govern the PTO mechanism, promoting effective energy conversion from the wave-induced heaving motion of the buoy. The primary control objectives include maximizing power output while preserving stable system dynamics under fluctuating ocean conditions. In the simulations, both regular and irregular wave inputs were tested to capture a broad range of realistic sea states. Performance was assessed by analyzing power output levels, buoy motion stability, and grid-side indicators, such as voltage and frequency regulation.
4.1. Wave Input and Wave Excitation Force Analysis
The wave inputs generated using the models described in
Section 2 were used to evaluate the proposed STSMC approach for the PAWEC. Two wave scenarios were considered:
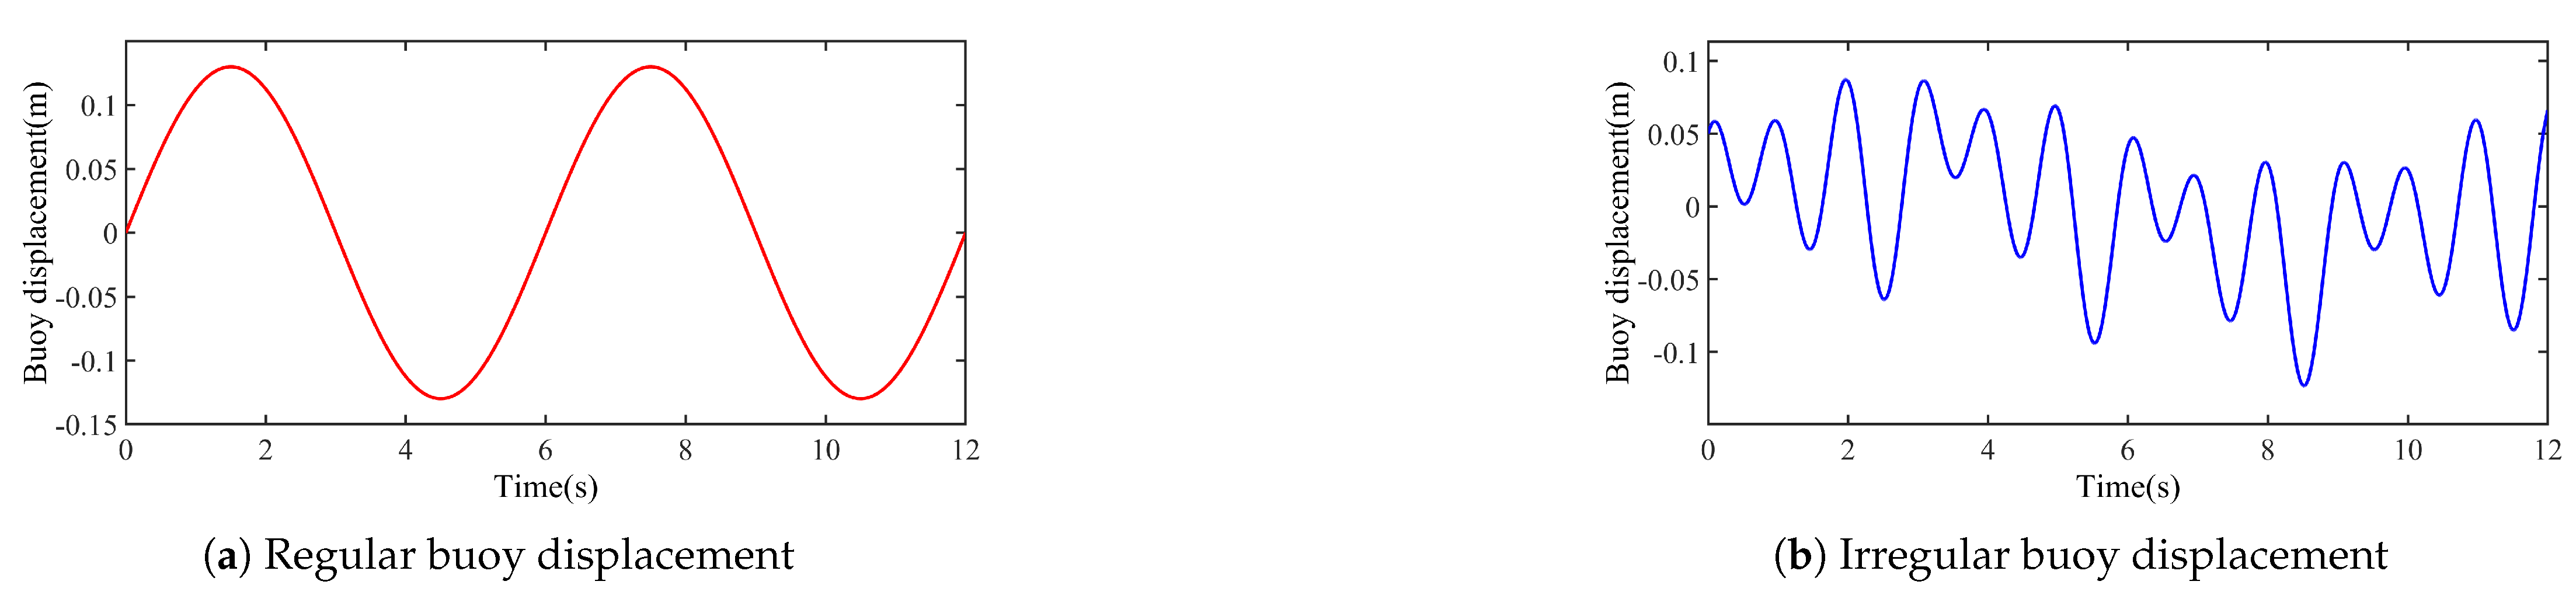
- (a)
Regular waves with a sinusoidal form and a peak height of 0.13 m.
- (b)
Irregular waves, reflecting real ocean conditions based on the Pierson–Moskowitz (PM) and JONSWAP spectra.
The regular wave scenario offered a controlled environment to examine the control strategy under known periodic inputs, whereas the irregular wave scenario introduced more realistic and variable sea states.
Table 2 summarizes the specific parameters adopted for these wave scenarios [
18].
Figure 5a,b illustrate the simulated wave inputs. Under regular conditions (
Figure 5a), the buoy height remained relatively uniform, allowing a clear examination of how the PAWEC and its control system responded to steady forcing. In contrast, the irregular wave scenario (
Figure 5b) captured the inherent randomness of real ocean environments, providing a more demanding test of control robustness.
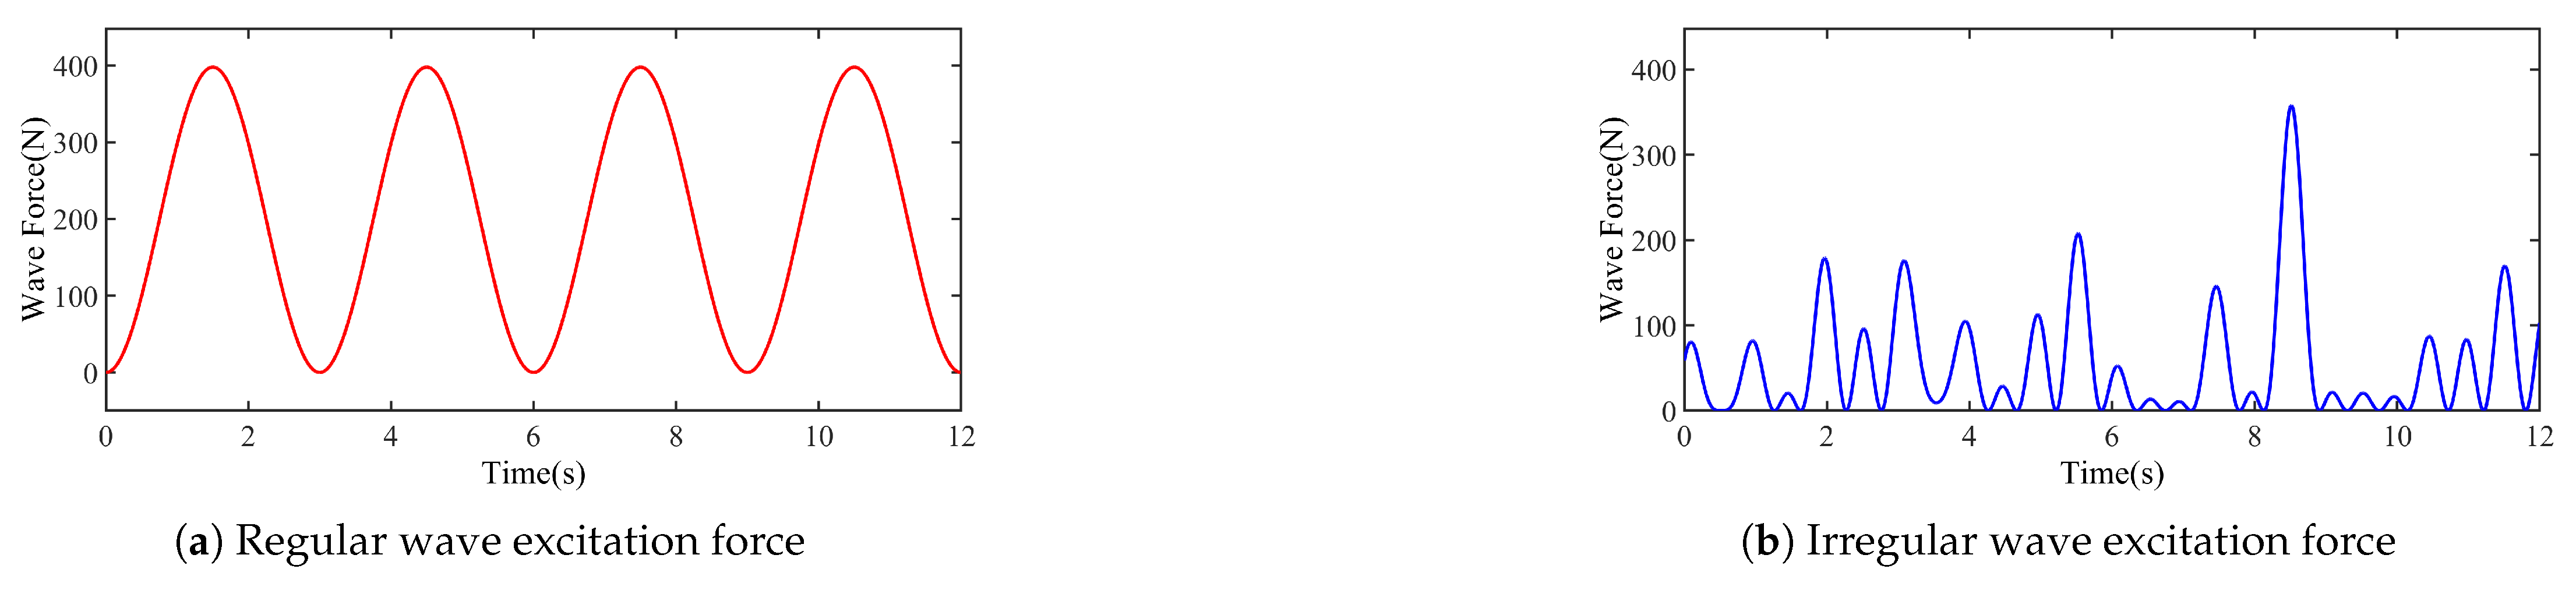
The corresponding wave excitation forces acting on the PAWEC are shown in
Figure 6. Under regular wave conditions (
Figure 6a), the excitation force followed a clear periodic pattern in line with the sinusoidal wave input. The maximum force reached approximately 400 N, matching the regular wave parameters (e.g., wave amplitude and wave number). Such predictable loading facilitates a straightforward evaluation of control strategies and serves as a reference point for assessing more variable scenarios.
Under irregular wave conditions (
Figure 6b), the excitation forces exhibited pronounced temporal fluctuations arising from the random phases and amplitudes specified by the PM and JONSWAP spectra. Peak forces varied considerably over time, reflecting the stochastic nature of ocean waves. These variations pose challenges for real-time control and underscore the significance of a robust control approach, such as STSMC, to maintain stable and efficient energy extraction.
4.2. Dynamic Speed Response of PMSG Under Different Control Strategies
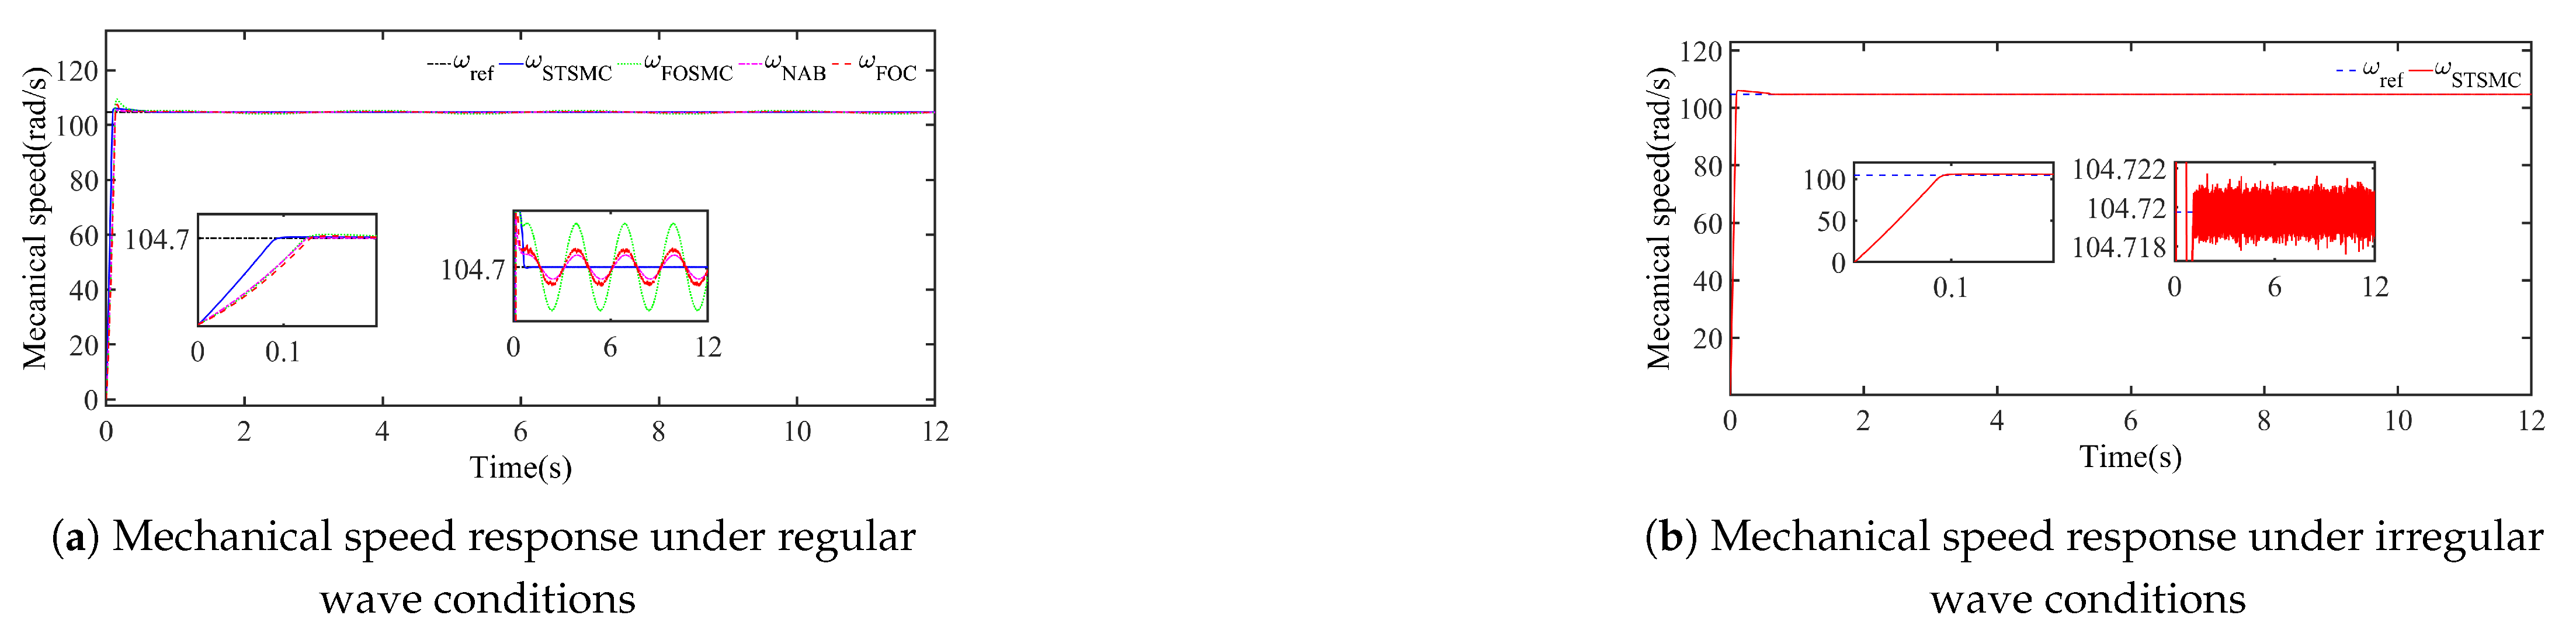
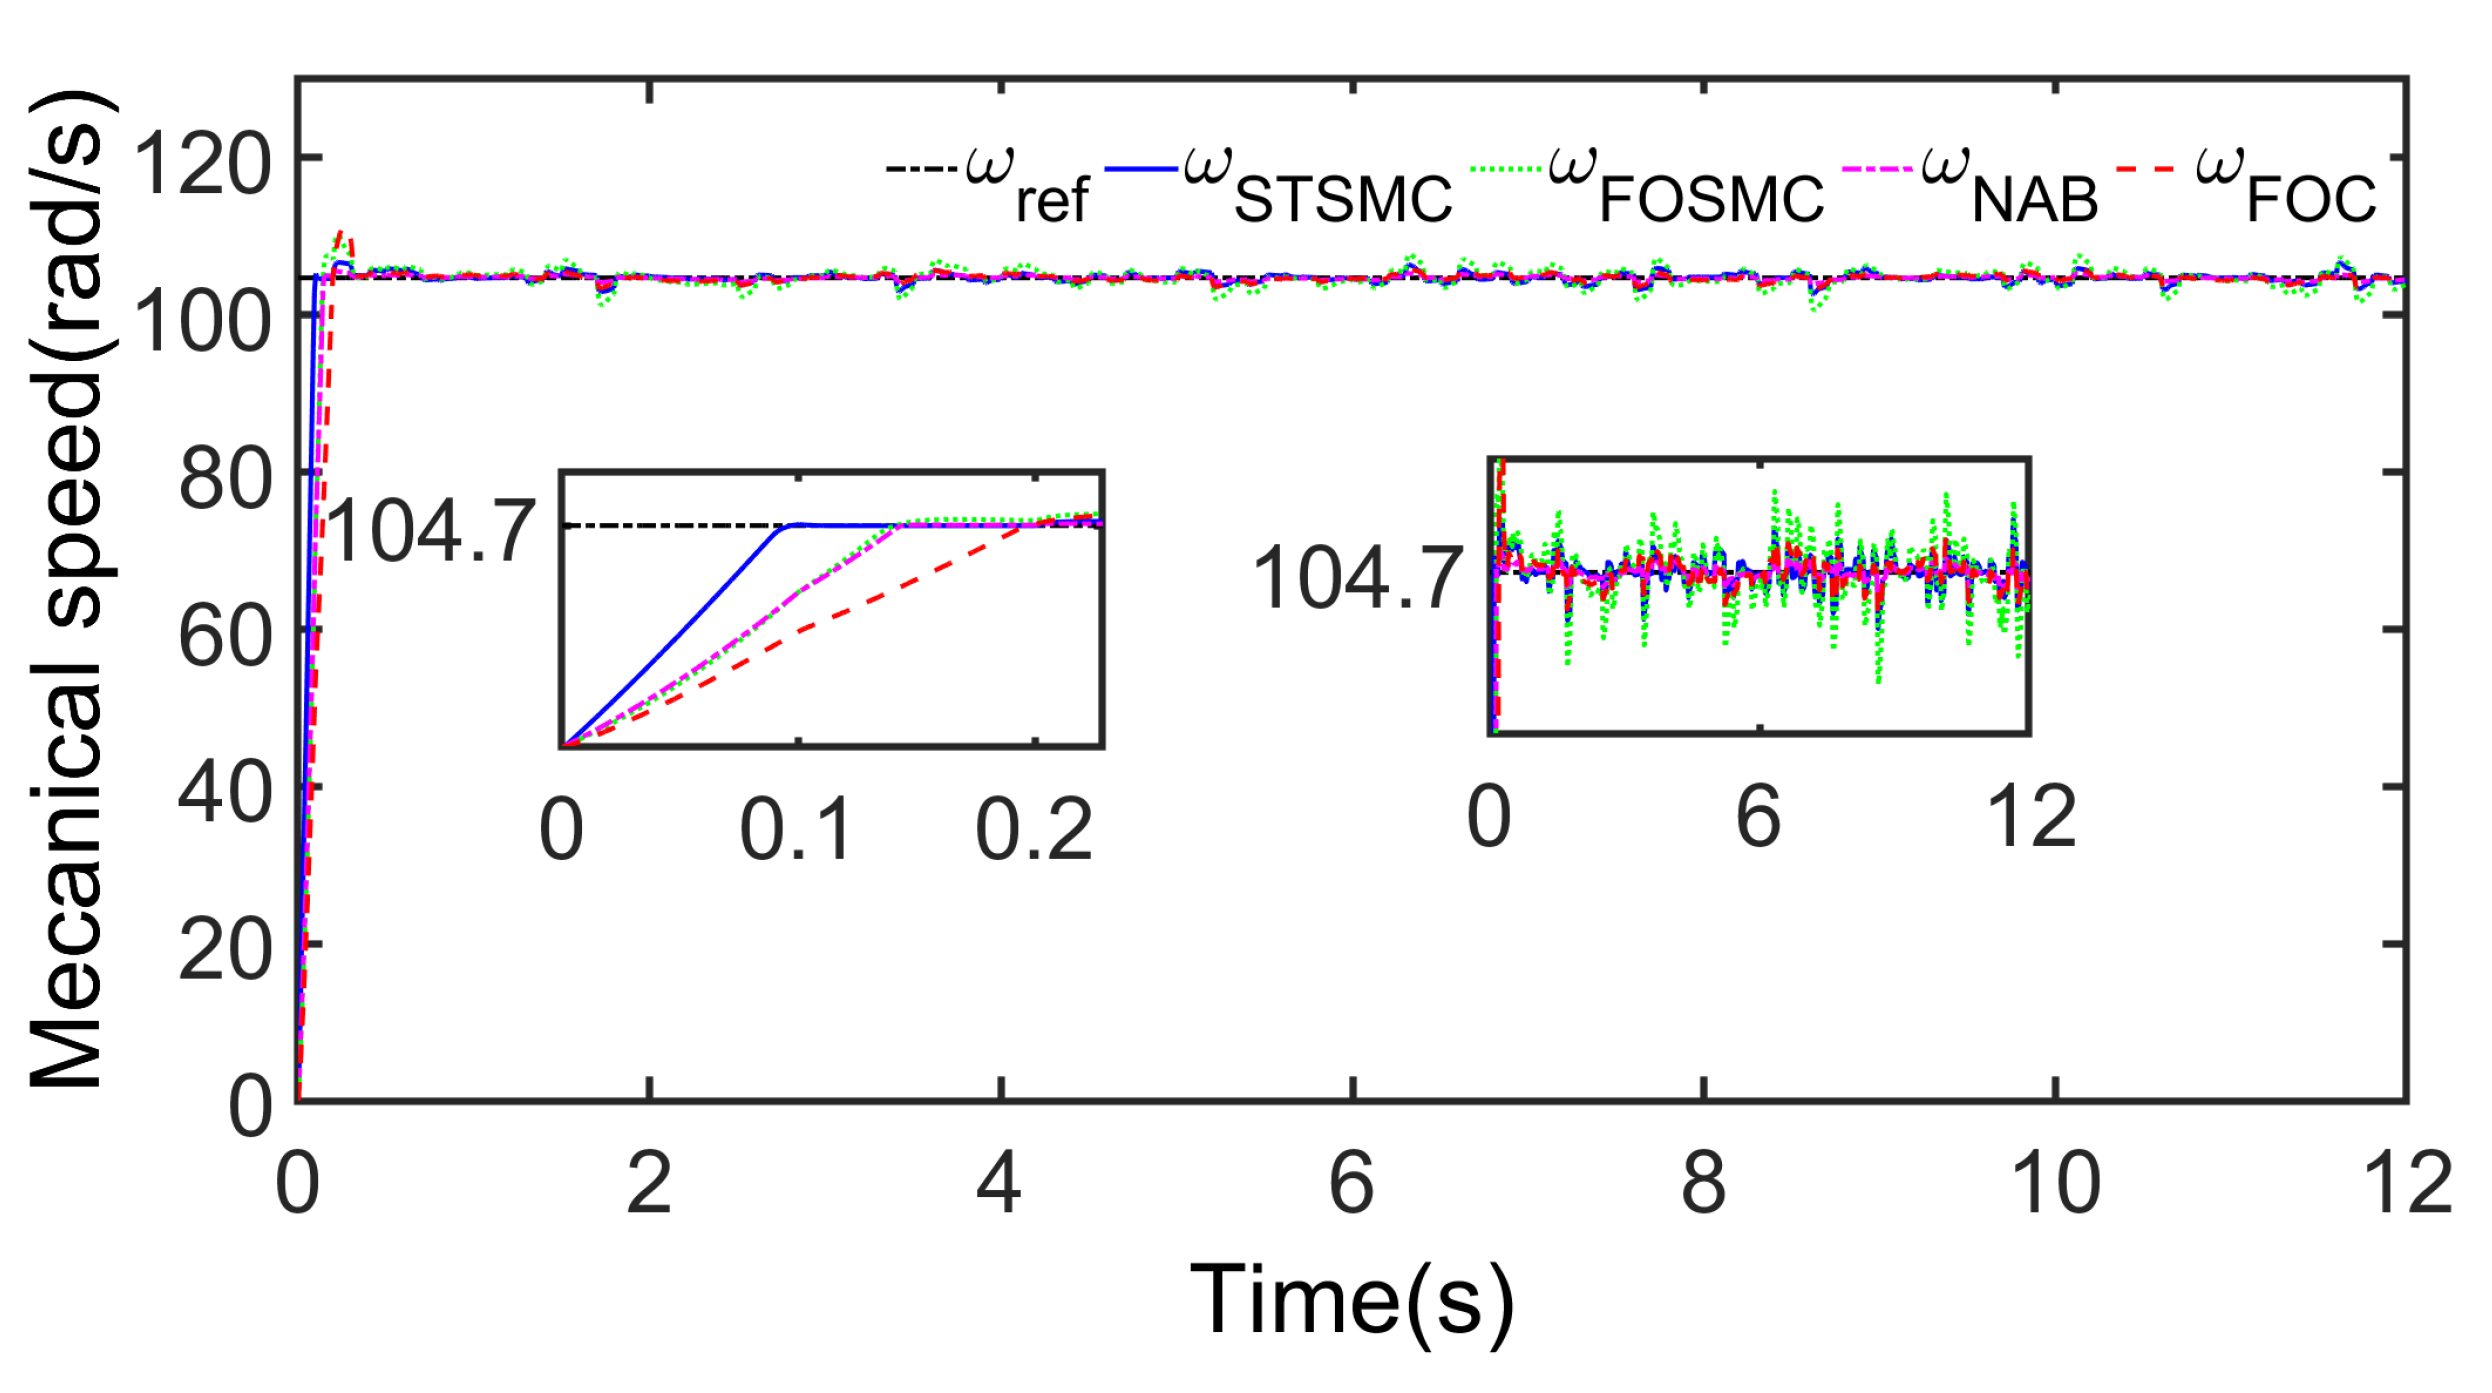
Figure 7 shows the mechanical speed response of the PMSG under different control strategies, including STSMC, FOSMC, NAB, and FOC, under regular wave conditions (
Figure 7a), while only STSMC was tested under irregular wave conditions (
Figure 7b). The results showed that STSMC achieved the fastest convergence to the reference speed of 104.7 rad/s, requiring approximately 0.1 s, whereas FOSMC, NAB, and FOC took about 0.12 s, 0.14 s, and 0.15 s, respectively, to reach steady state.
In the irregular wave case, STSMC demonstrated a strong ability to cope with fluctuating sea states, adapting to wave-induced disturbances rapidly and maintaining a stable speed profile. This quick response and low overshoot highlight the inherent robustness of STSMC, which effectively reduces chattering and handles complex ocean dynamics.
4.3. Torque Regulation Performance
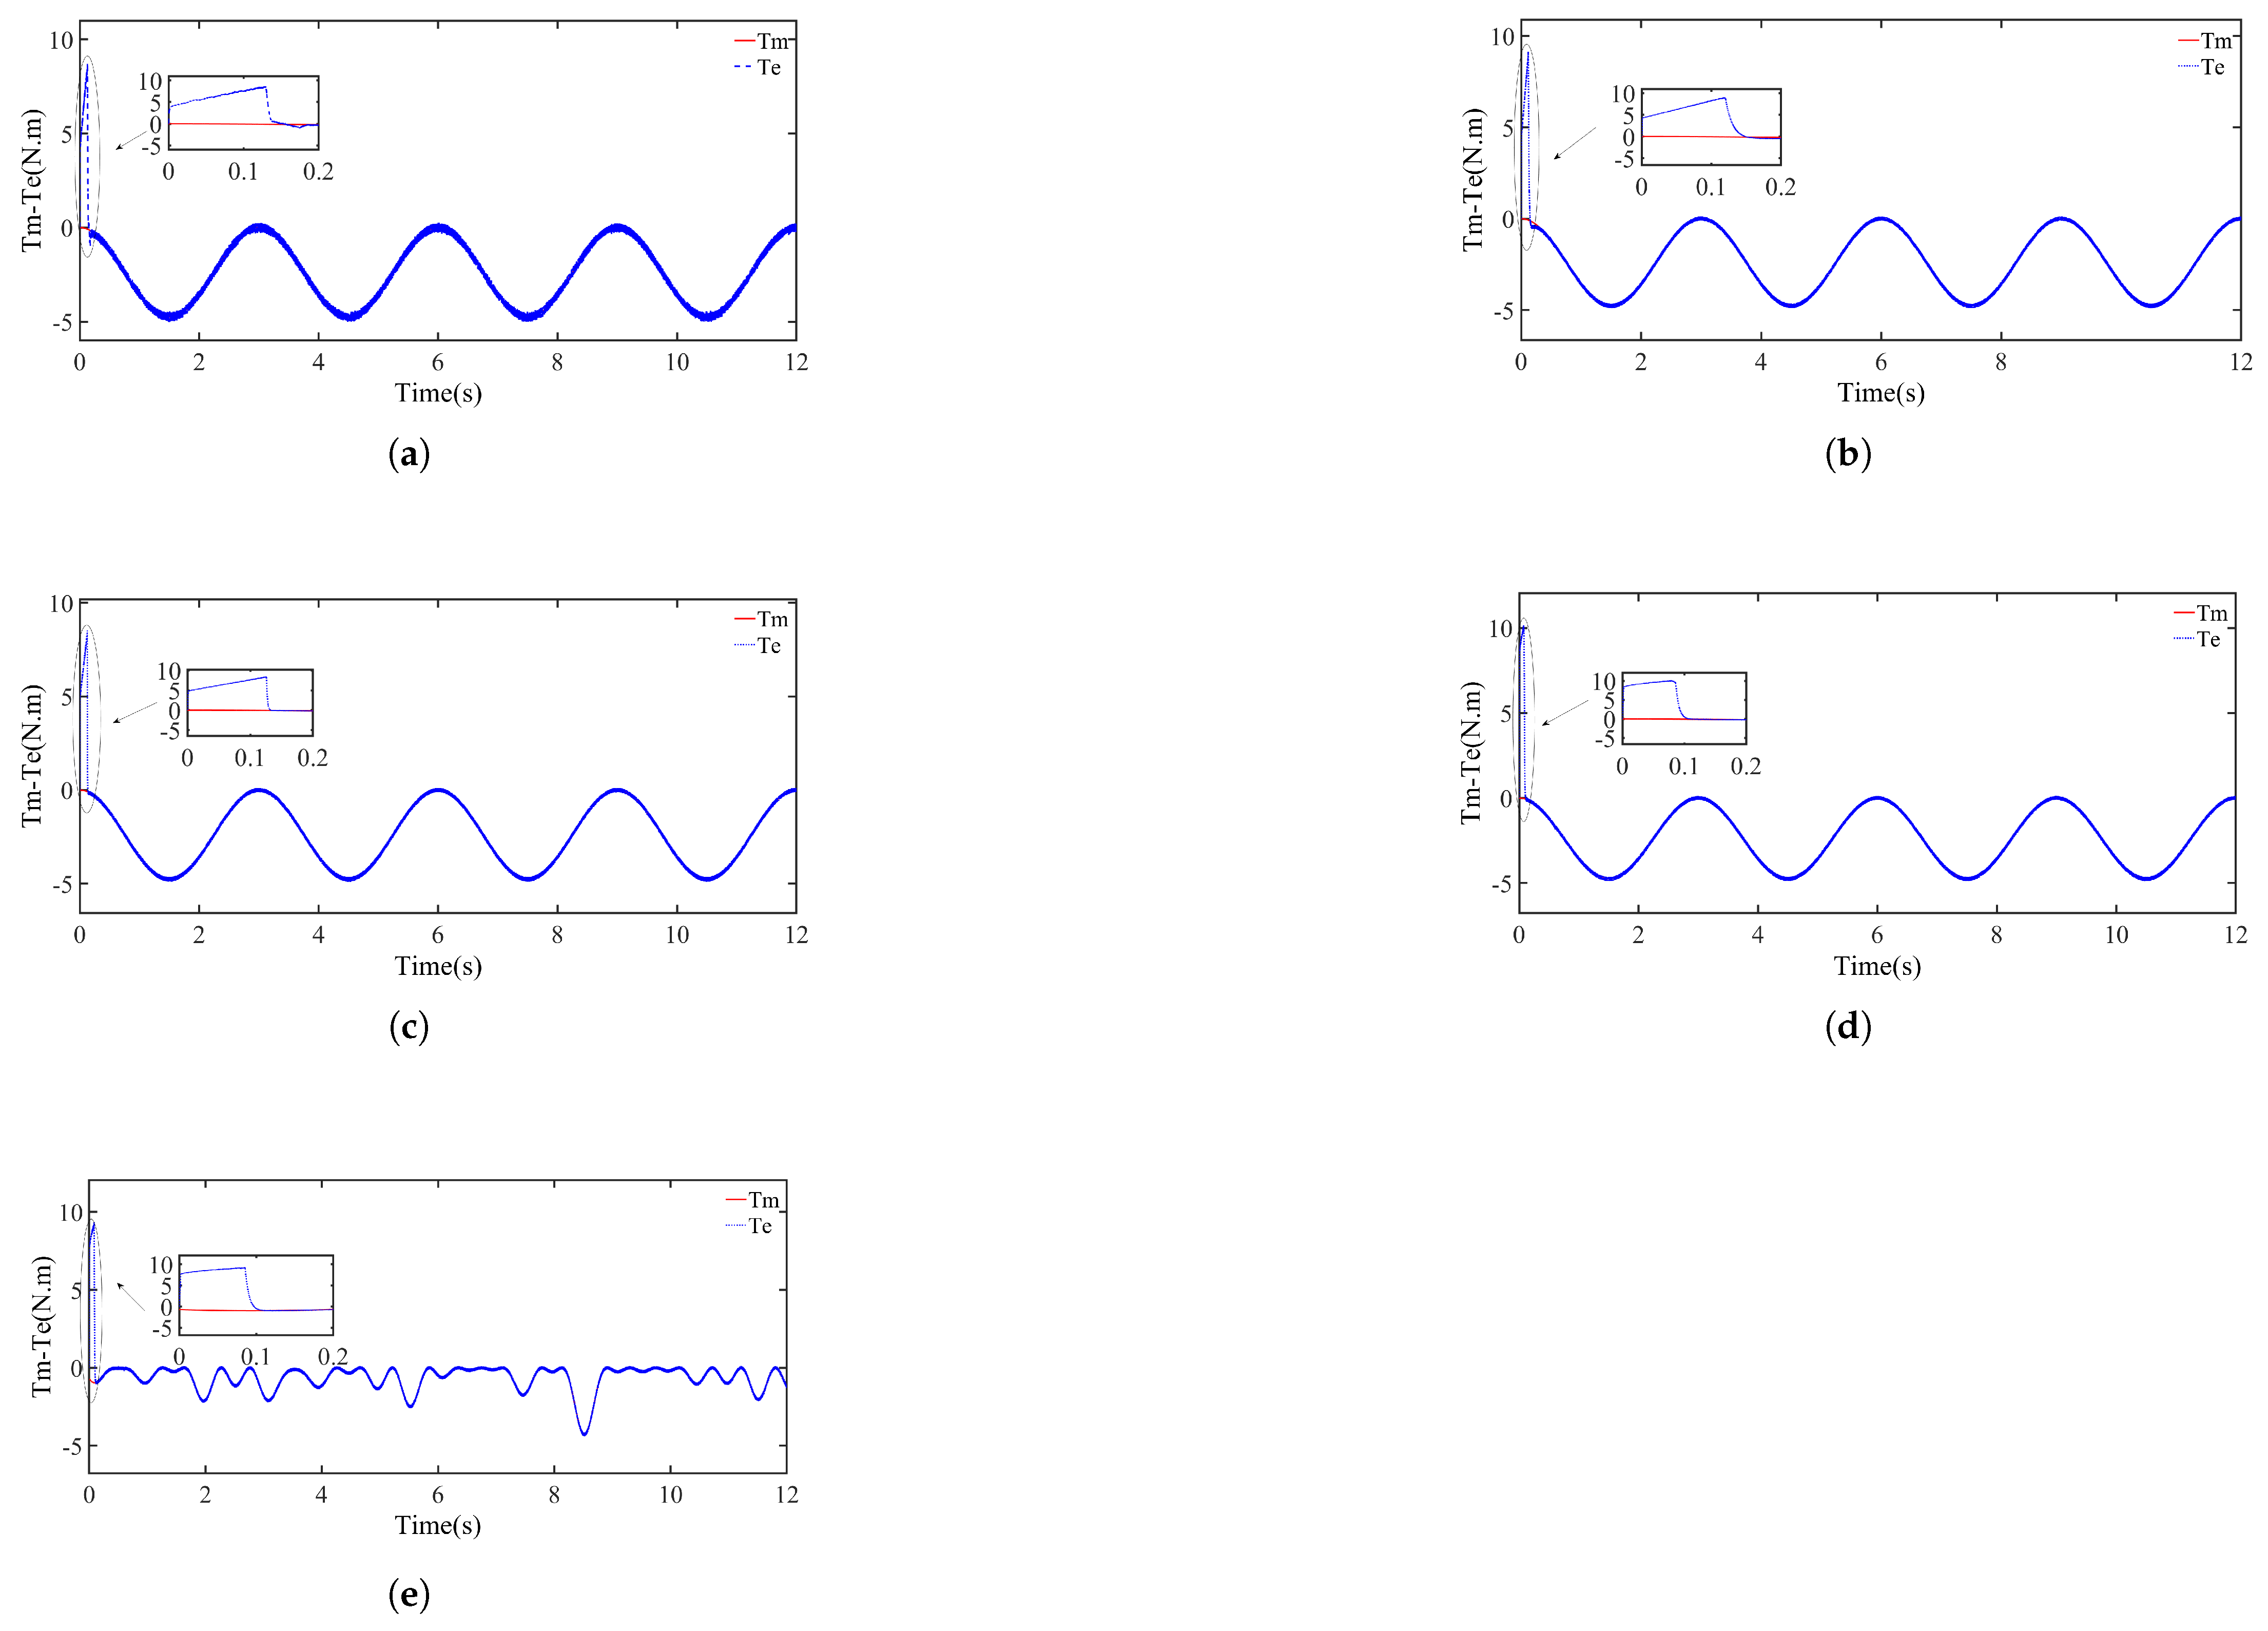
Figure 8 presents the torque response (
) of the PMSG under different control strategies. For the regular wave scenario, four methods—FOC, FOSMC, NAB, and STSMC—were compared, whereas only STSMC was evaluated under irregular wave inputs.
Figure 8a–c show that STSMC achieved the fastest convergence to the reference torque of 4.7 N·m, stabilizing in around 0.1 s (
Figure 8d). In contrast, FOSMC, NAB, and FOC stabilized in approximately 0.15 s, 0.3 s, and 0.2 s, respectively. This rapid response underscores STSMC’s ability to handle system nonlinearity and mitigate chattering, which commonly affects traditional sliding-mode approaches.
FOSMC exhibited a moderate settling time and reduced transient responses relative to FOC and NAB but still required more time than STSMC to reach steady state. NAB converged with minimal overshoot but was slower overall, primarily due to its sensitivity to parameter variations. FOC, as a conventional approach, experienced the longest settling time and exhibited a more pronounced transient response, illustrating its limitations when encountering dynamic disturbances.
Under irregular wave conditions (
Figure 8e), STSMC continued to show robust performance, keeping torque fluctuations low despite the stochastic nature of the wave input. The settling time remained close to that observed under regular wave conditions, highlighting the controller’s effectiveness in adapting to rapidly varying wave forces. Although minor oscillations were present due to the unpredictable nature of irregular waves, they were contained within acceptable bounds, ensuring the PMSG operated near its rated torque with minimal deviation.
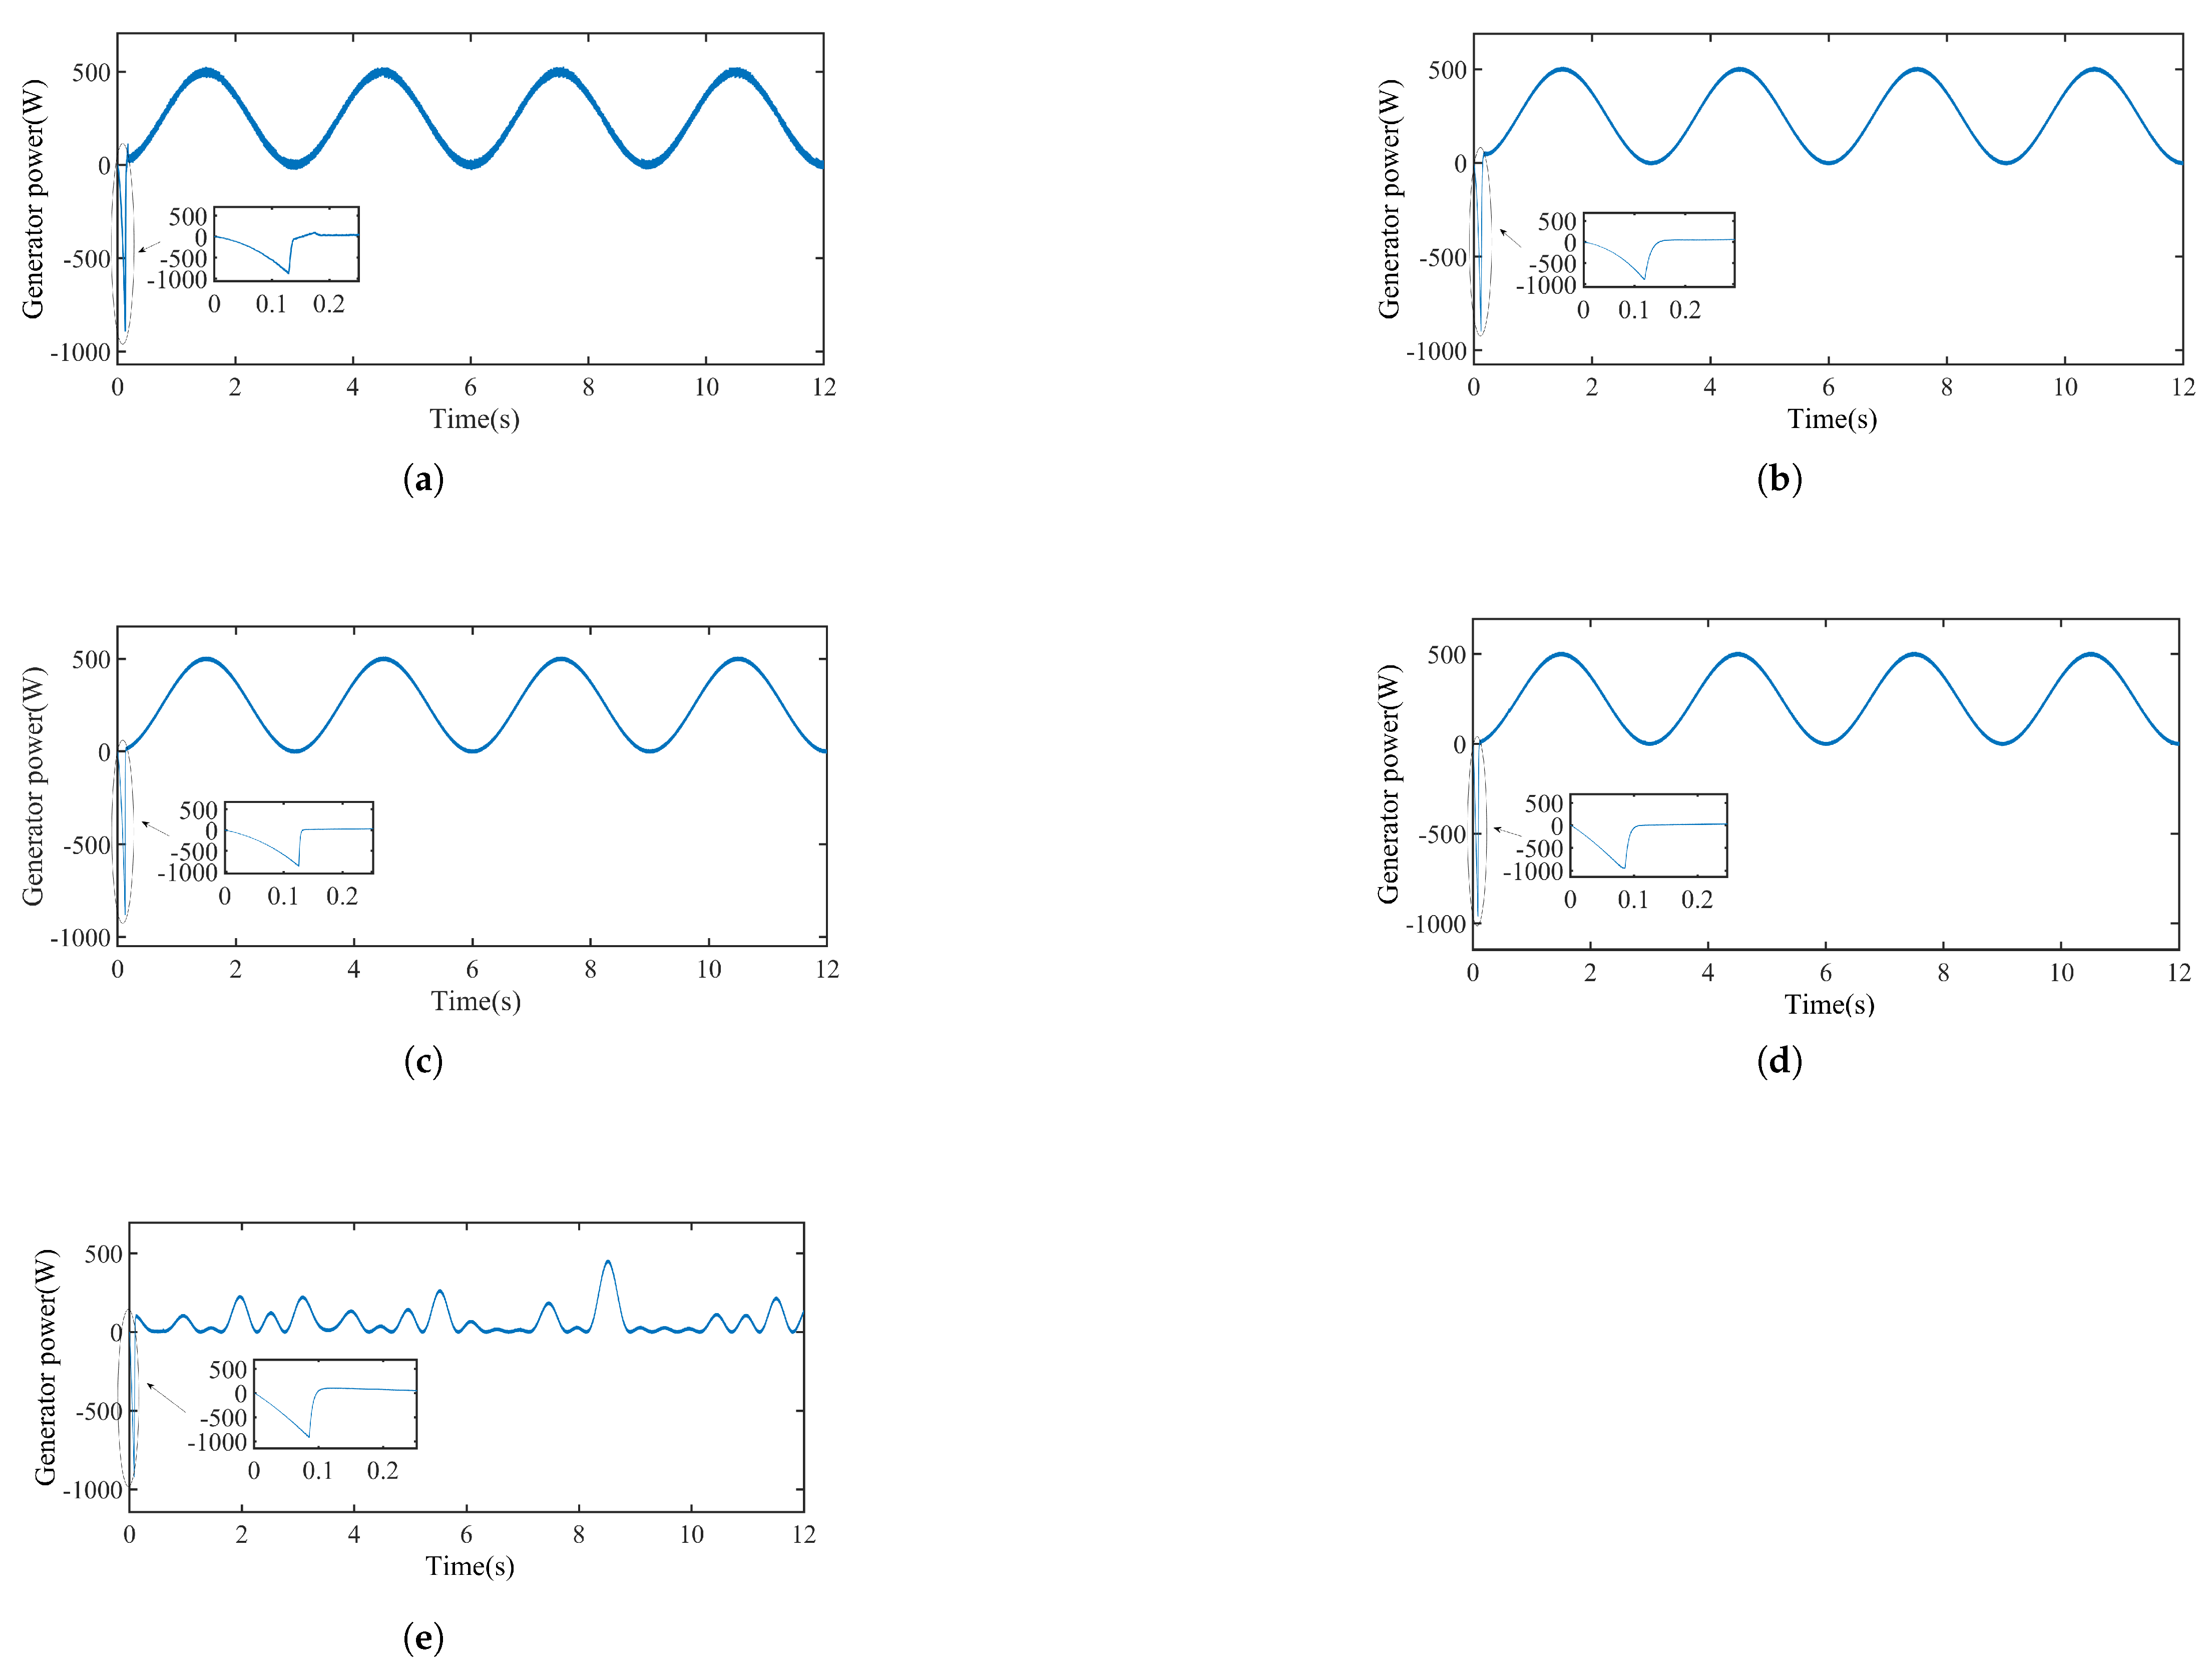
4.4. Power Output Analysis
Figure 9 compares the power output
of the PMSG under various control strategies under regular waves (FOC, FOSMC, NAB, and STSMC) and irregular waves (STSMC only). All methods converged to the 500 W rated power in the regular wave scenarios, but their dynamic responses exhibited clear differences.
Based on the grid and data tip measurements in
Figure 9a–d, the measured convergence times to steady state were approximately 0.13 s for FOC, 0.13 s for FOSMC, 0.12 s for NAB, and 0.09 s for STSMC. While STSMC achieved the fastest convergence, the difference compared to other advanced nonlinear strategies was on the order of tens of milliseconds. For example, NAB reached steady state at around 0.12 s, which was only 30 ms slower than STSMC. The performance ranking is STSMC < NAB < FOSMC < FOC. Under irregular wave conditions (
Figure 9e), STSMC maintained a fast dynamic response and stable power output despite the complexity of the input. The convergence time was marginally increased compared to the regular wave scenarios, but the controller still effectively limited power oscillations. This result demonstrates that, although the speed advantage of STSMC is less critical in typical sea states, its robustness and adaptability to fast fluctuations provide practical benefits for long-term reliability and energy yield.
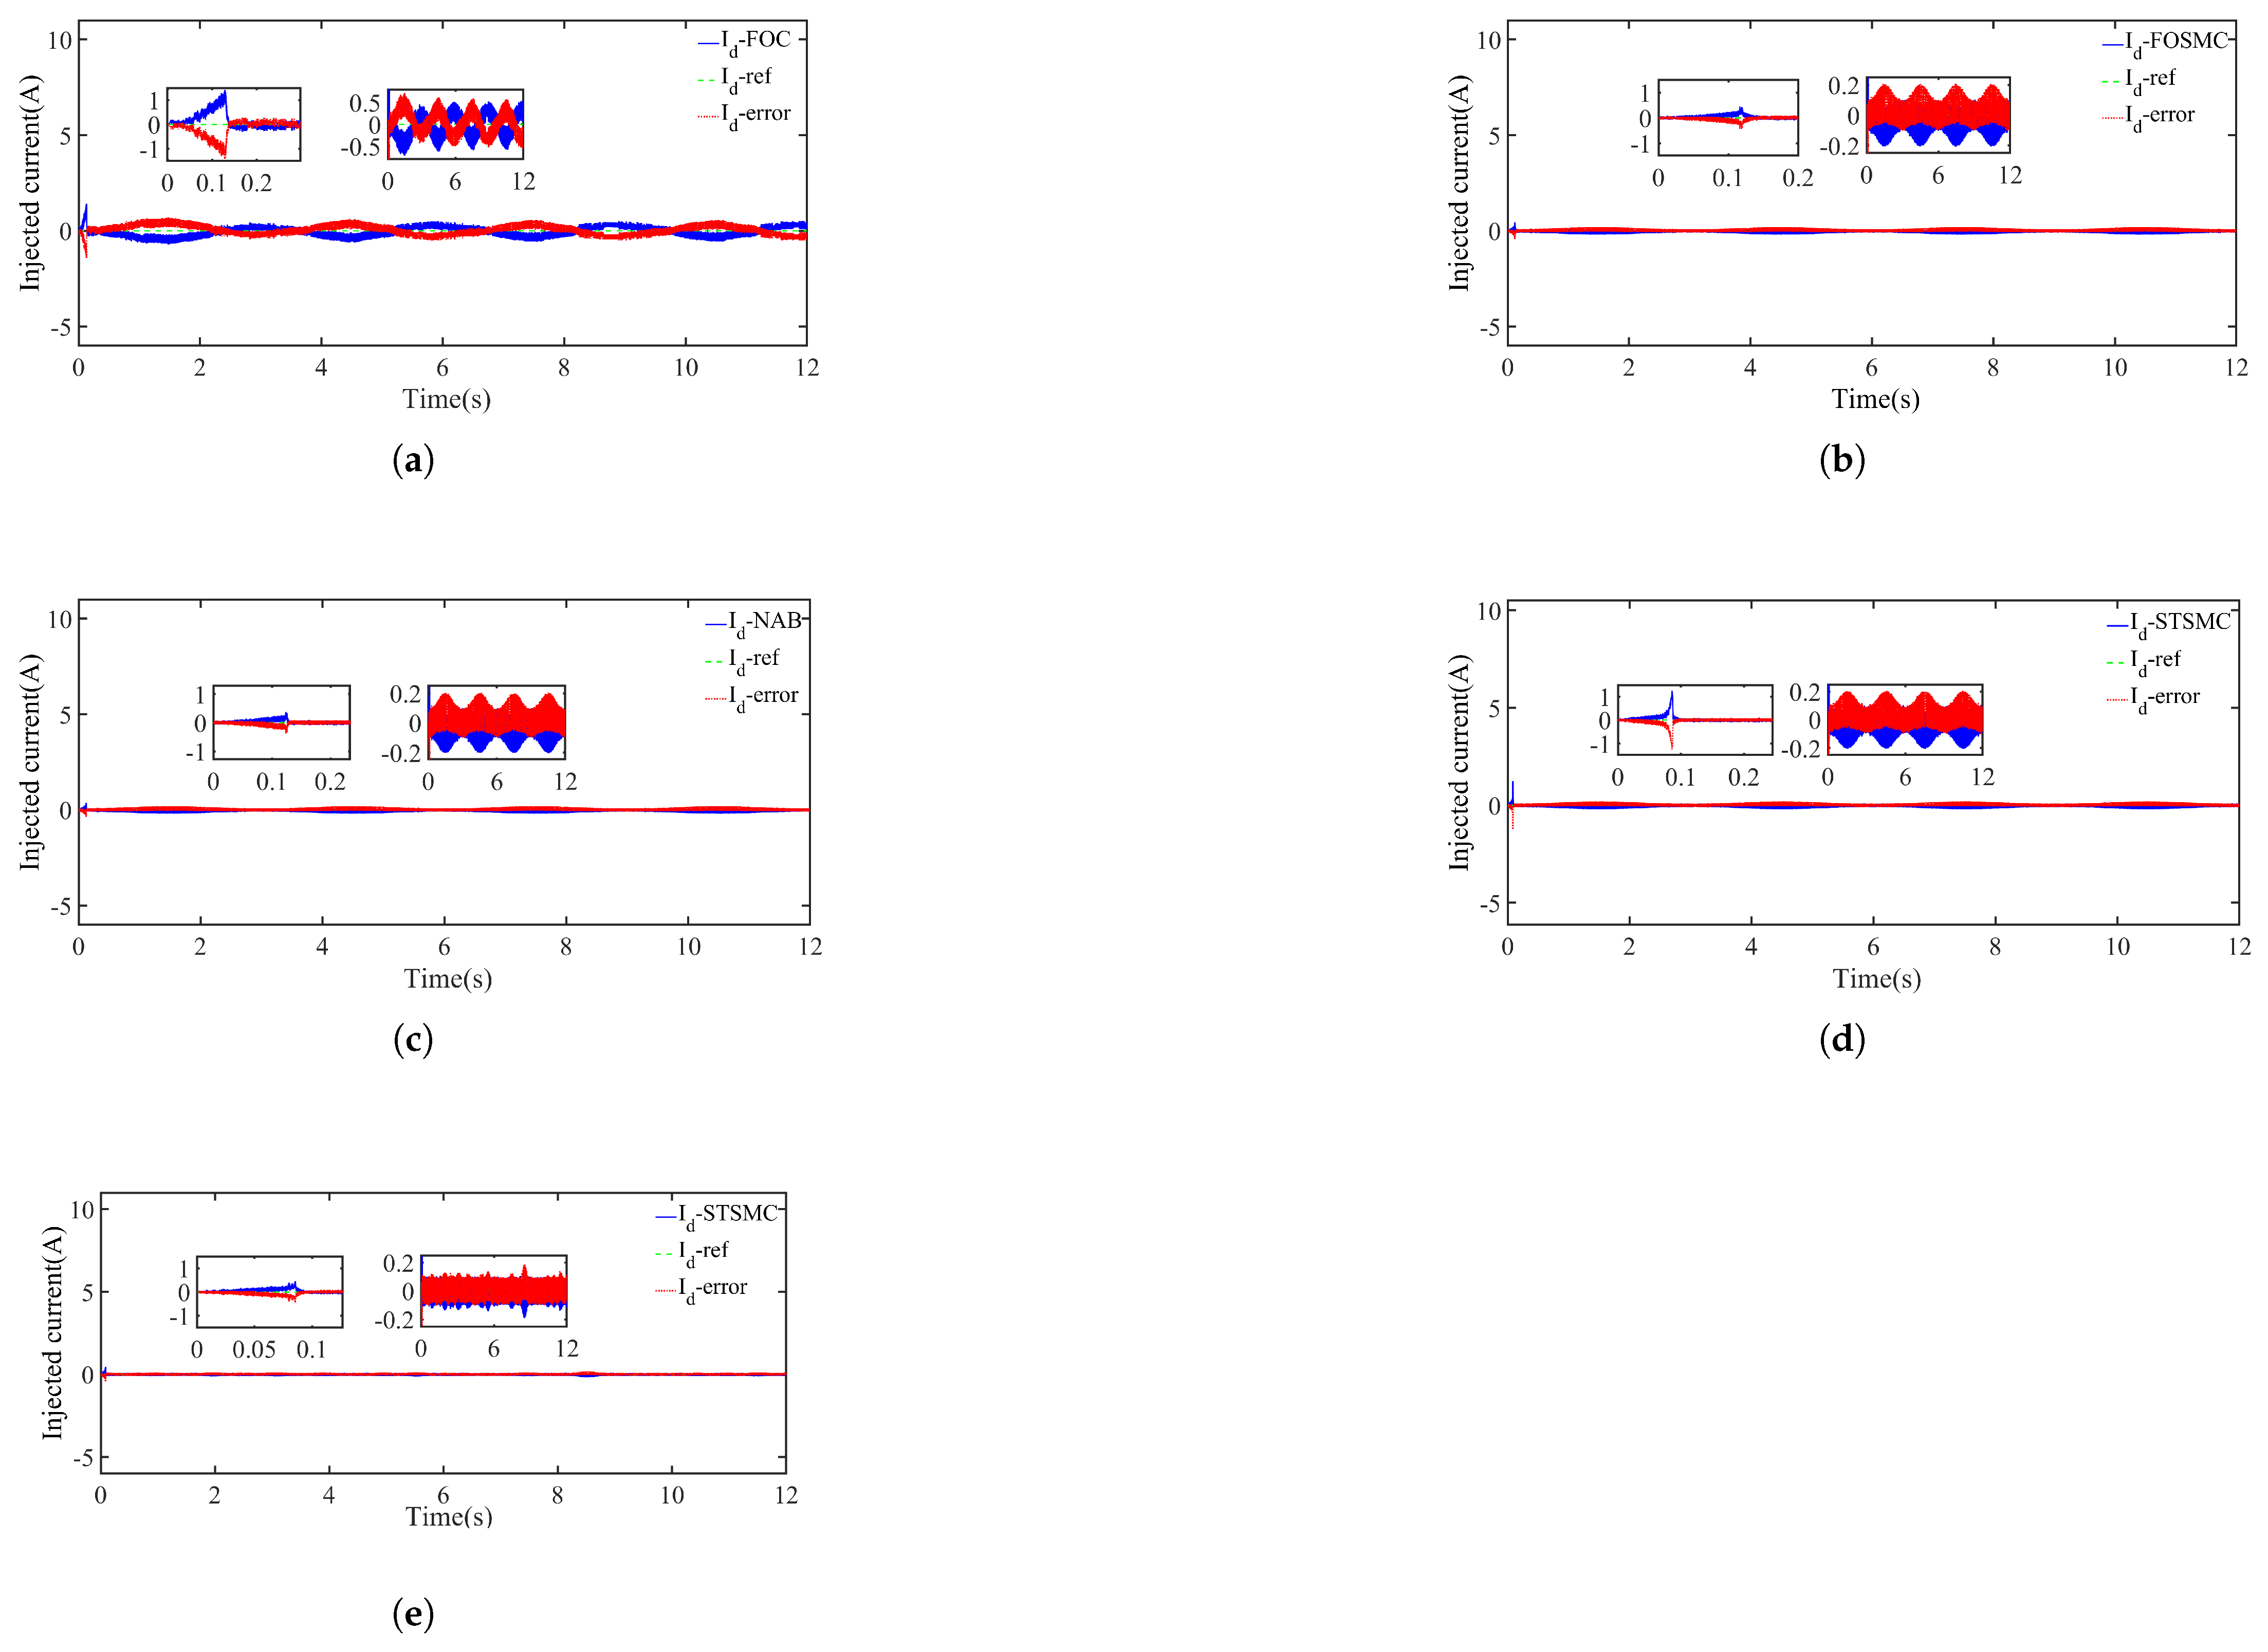
4.5. Machine-Side Current Tracking
To contextualize the current-tracking performance seen in
Figure 10 and
Figure 11, it is useful to recall the PMSG equations outlined in
Section 2.3. In this model, currents
and
directly influence flux and torque control, respectively. As shown by the relevant PMSG equations, maintaining
at zero helps reduce reactive power and improve active power generation. Furthermore, the voltage equation for
underscores the critical role of precise
regulation in achieving stable torque and efficient energy conversion.
Figure 10 displays the tracking behavior of
. Under regular wave conditions, STSMC (
Figure 10d) achieved minimal error and settled in approximately 0.1 s, outperforming FOC and FOSMC. The latter two methods showed longer settling times and more pronounced transients, indicating less effective current regulation. Even under irregular wave conditions (
Figure 10e), STSMC maintained accurate tracking and minimal overshoot, demonstrating robust performance.
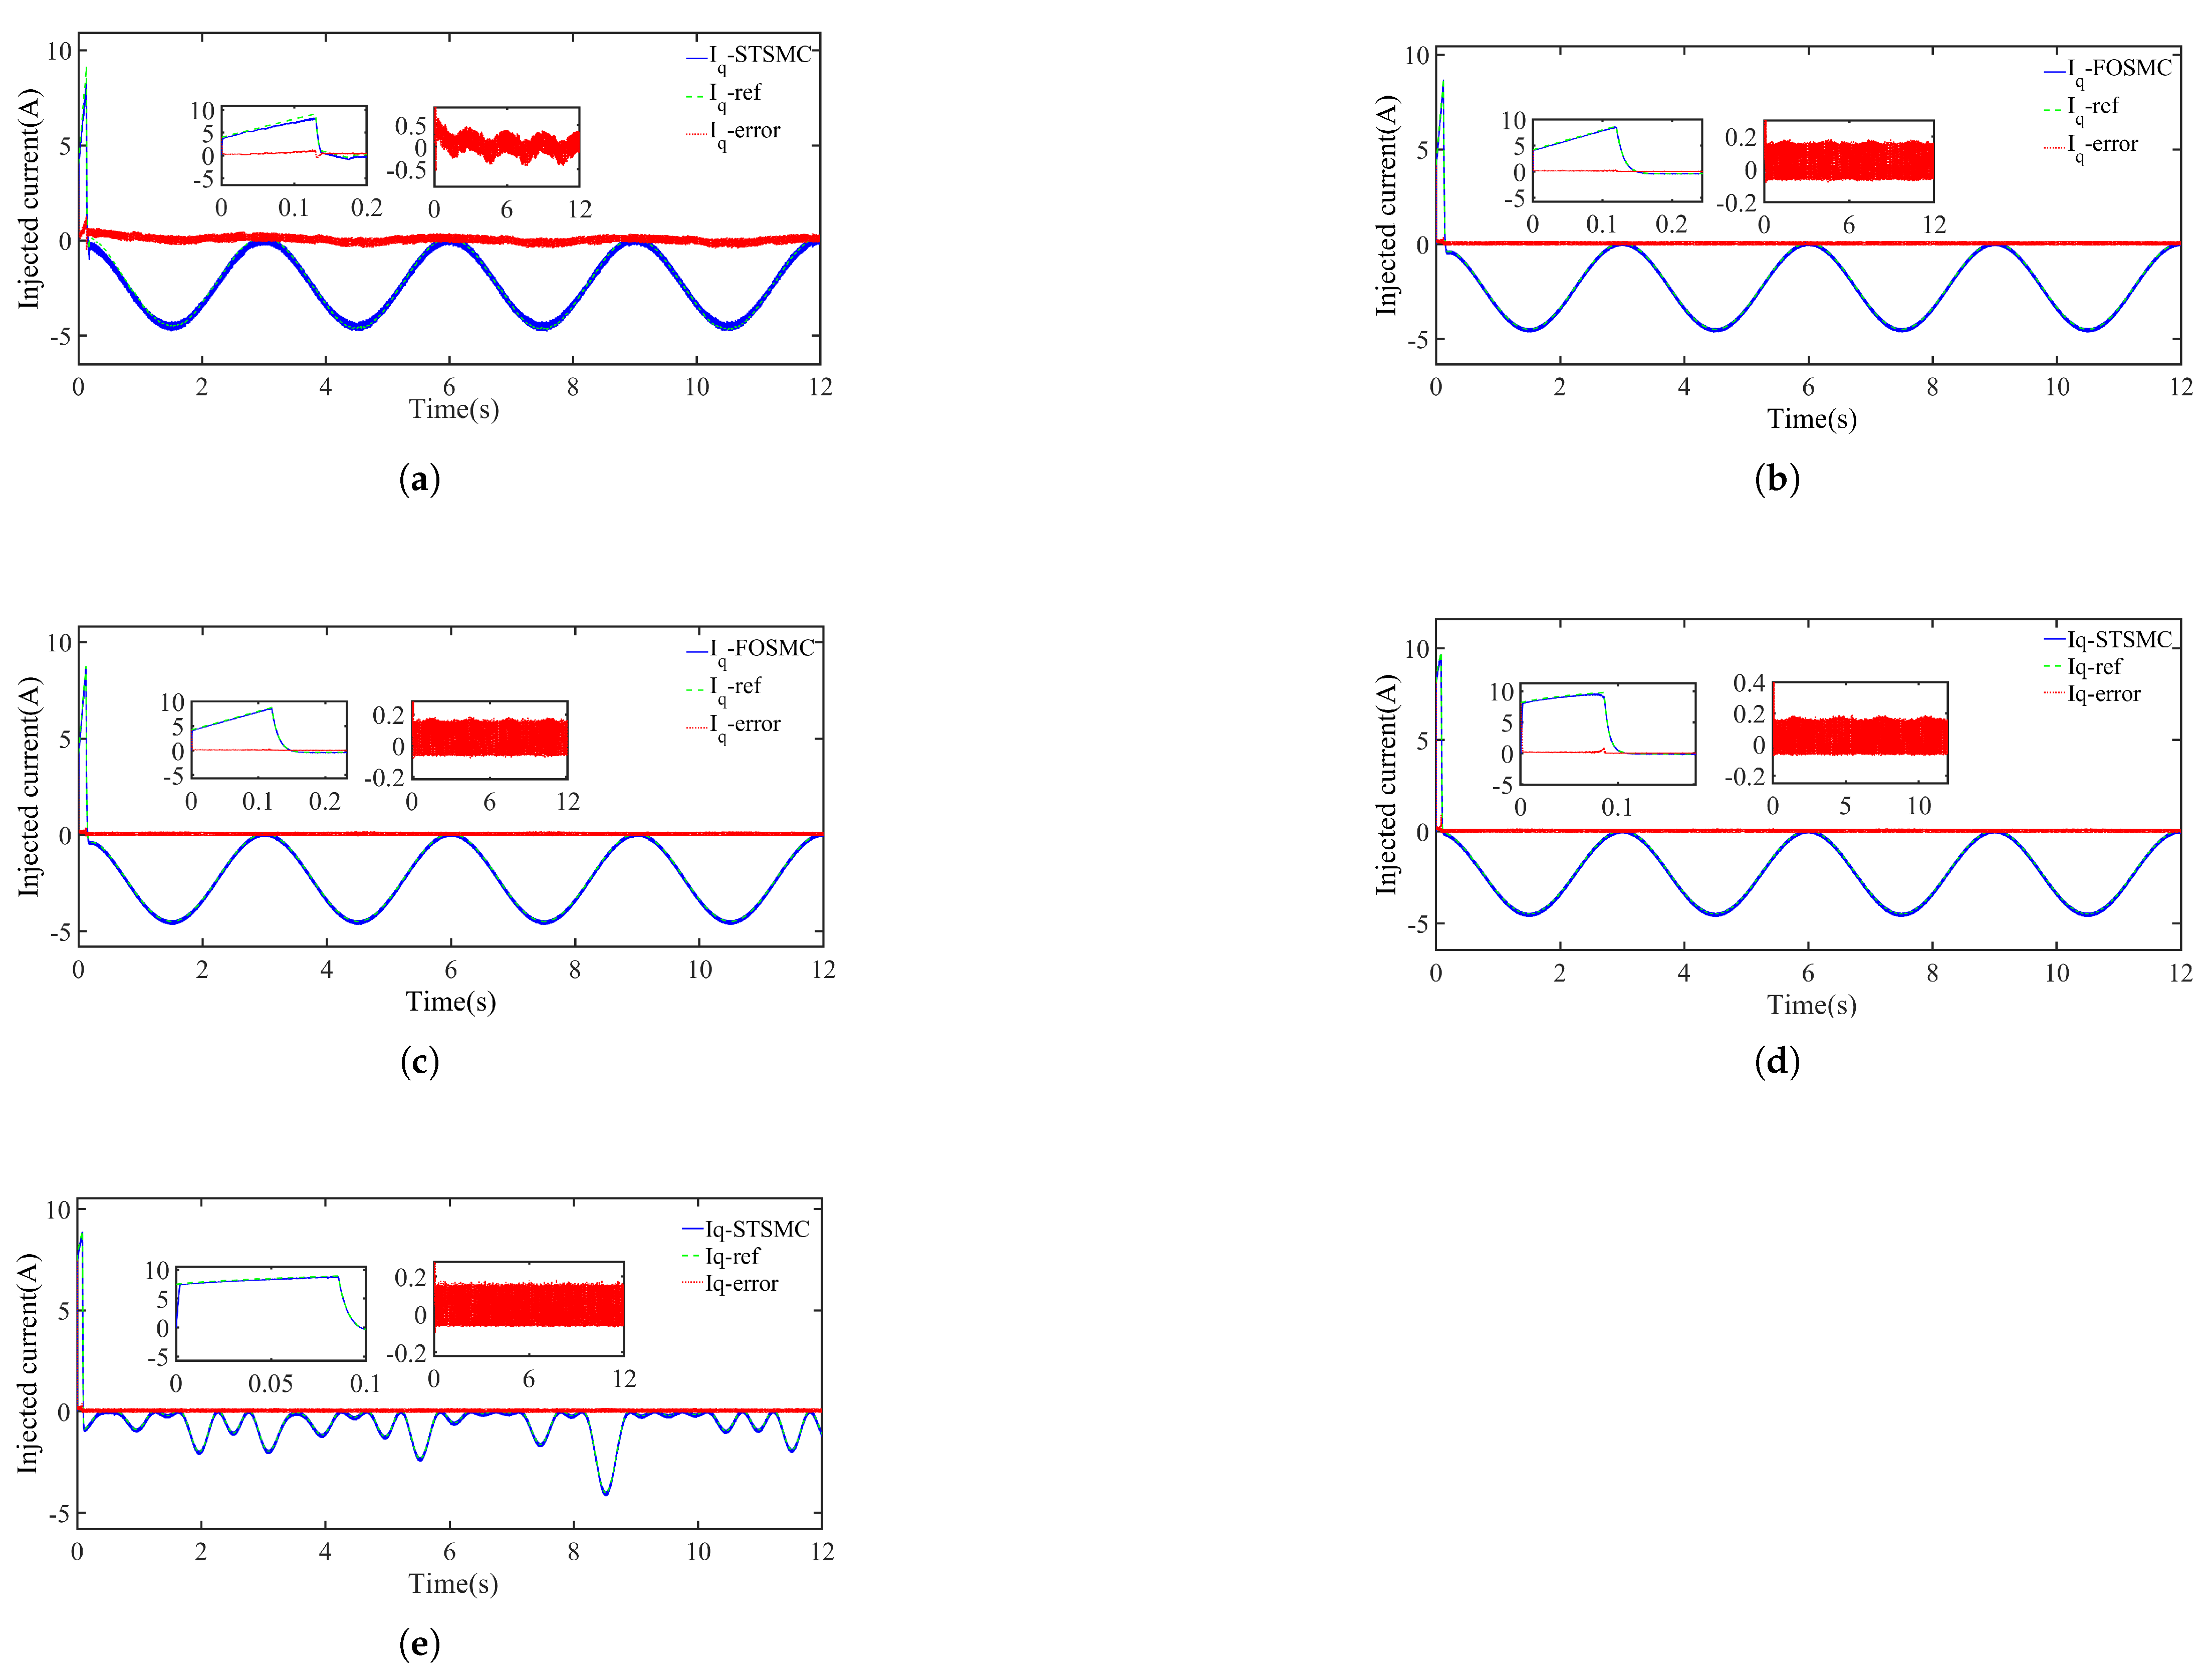
Figure 11 illustrates the
response. FOC (
Figure 11a) exhibited an initial transient of around 10 A and a steady-state offset of roughly 0.5 A, stabilizing in about 0.3 s. FOSMC (
Figure 11b) provided a faster transient response and a reduced steady-state error of 0.2 A. NAB (
Figure 11c) offered comparable response times but introduced slightly larger oscillations. STSMC (
Figure 11d) attained the quickest convergence with minimal overshoot and a steady-state error below 0.16 A, indicating a notable performance advantage over the other control strategies. Under irregular wave conditions (
Figure 11e), STSMC continued to deliver a rapid response and low error, reinforcing its capacity to adapt to complex, time-varying sea states.
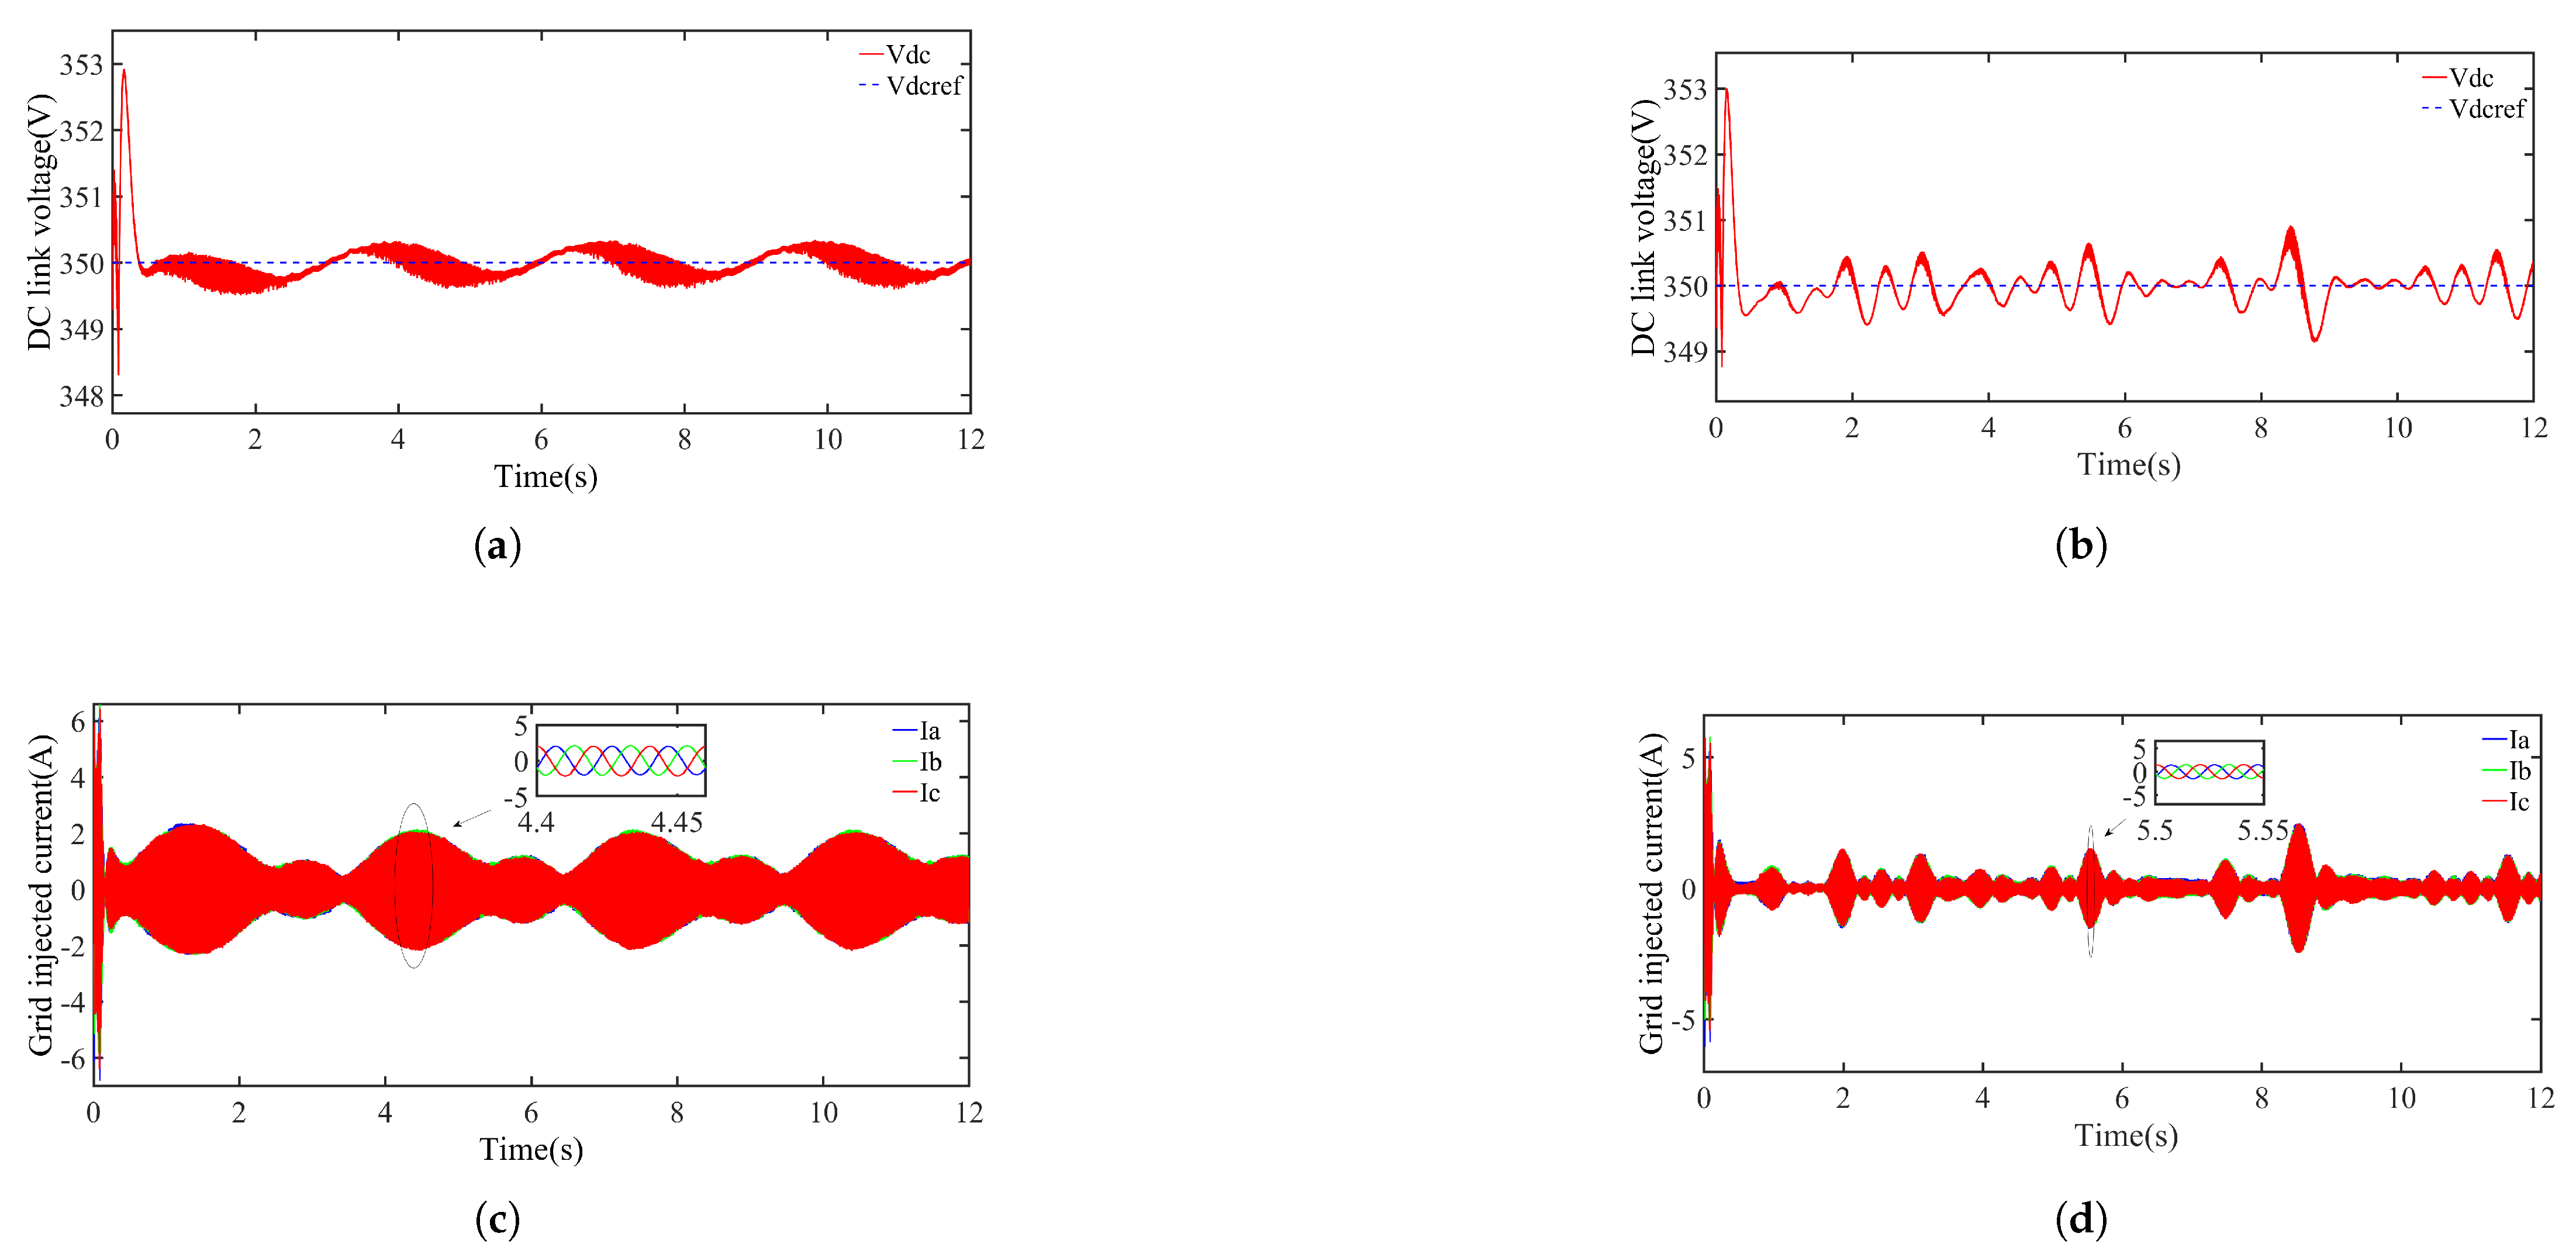
4.6. Grid Integration and Power Quality
Figure 12a,b show the DC link voltage response under regular and irregular wave conditions when controlled by STSMC. Under regular wave conditions (
Figure 12a), the DC link voltage stabilized rapidly at approximately 350 V, with a transient overshoot of around 352 V and steady-state deviations confined to
V. This indicates effective voltage regulation and reliable power conversion for grid integration. Under irregular wave conditions (
Figure 12b), minor voltage fluctuations were evident, yet the voltage remained within acceptable bounds, underscoring STSMC’s robustness in handling unpredictable wave profiles.
Figure 12c,d illustrate the grid-side current under regular and irregular wave conditions, respectively. In the regular wave case, the current tracked the reference frequency closely, displaying a negligible phase offset—an indication of successful grid synchronization. During irregular wave events, small deviations in current amplitude occurred due to fluctuating wave forces, but the resulting THD remained below standard thresholds, preserving power quality. These observations confirm STSMC’s reliability and adaptability in ensuring efficient grid integration across a wide range of sea states.
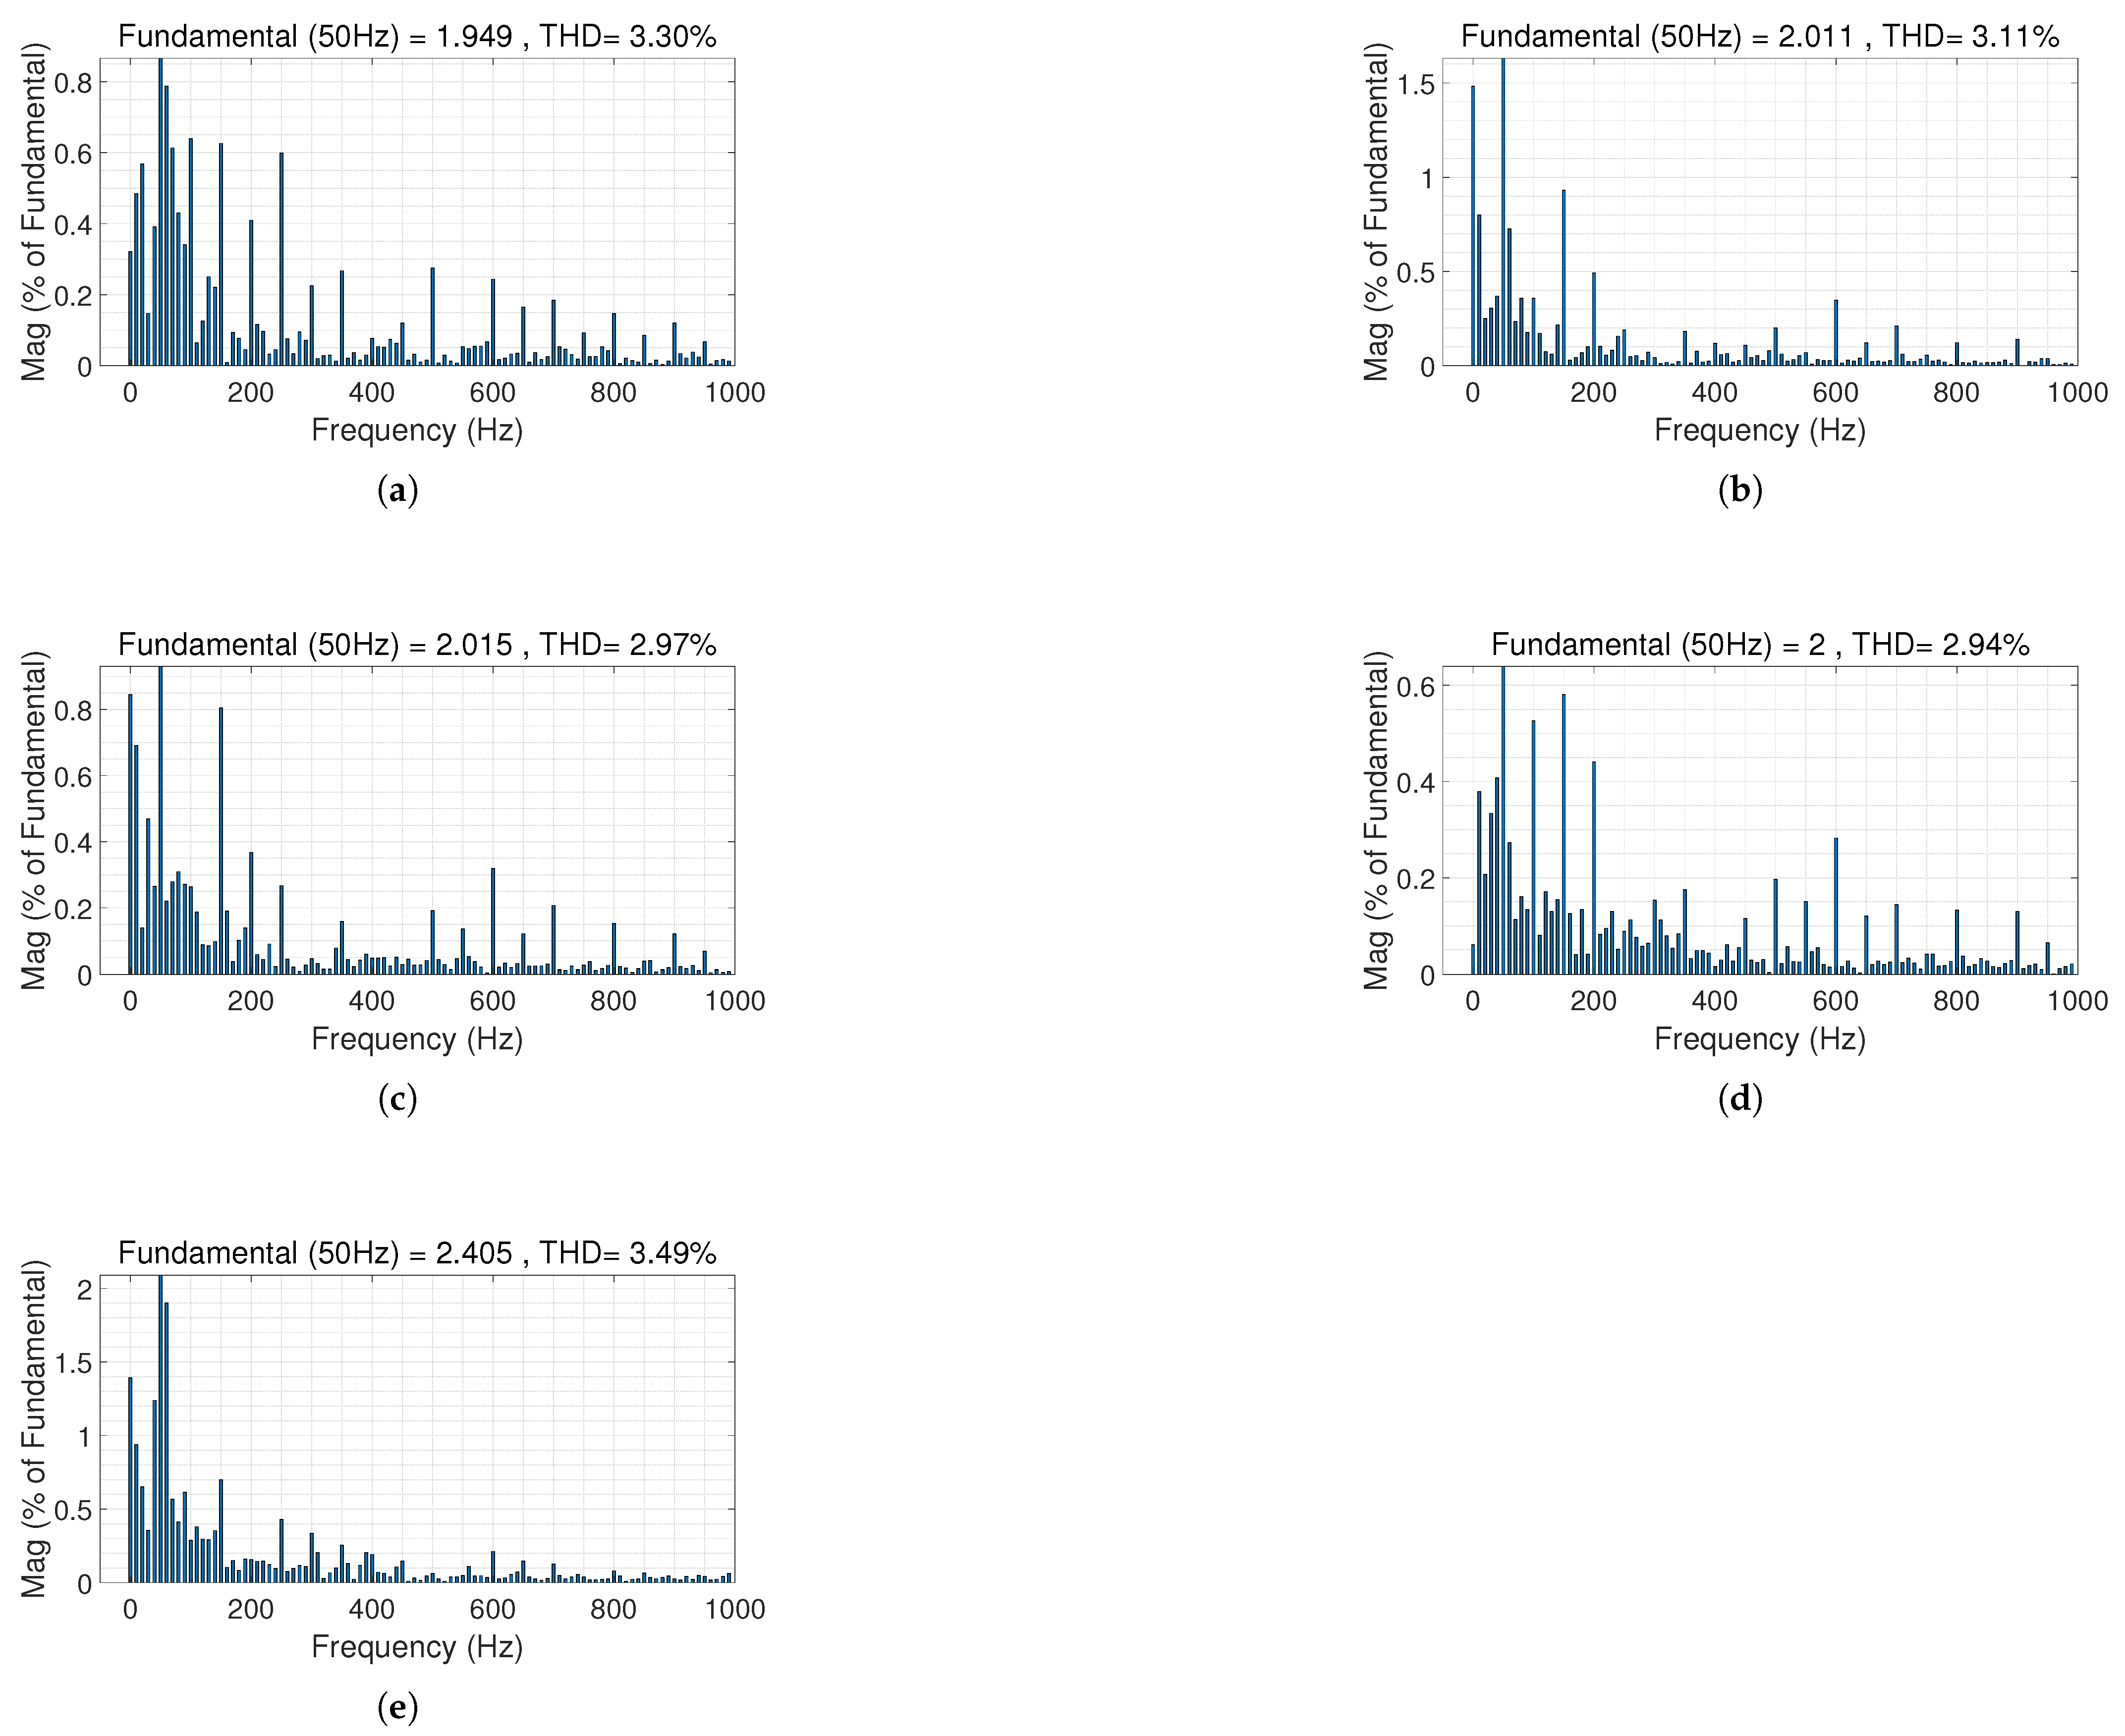
To comprehensively assess power quality, the THD of the grid-side current was analyzed and compared among different control strategies, including FOC, FOSMC, NAB, and STSMC, as shown in
Figure 13. Under regular wave conditions, the measured THD values were 3.30% for FOC, 3.11% for FOSMC, 2.97% for NAB, and 2.94% for STSMC, respectively. These results indicate that all four strategies are capable of maintaining the THD within the commonly accepted grid standard of 5%, but the NAB and STSMC controllers achieve slightly lower harmonic content. This demonstrates that advanced nonlinear control strategies, such as STSMC and NAB, can further reduce harmonics compared to conventional FOC and first-order sliding-mode approaches.
Under irregular wave conditions, STSMC achieved a THD of 3.49%, which remained well within grid requirements. The increase in THD compared to regular wave conditions is mainly attributed to the greater variability and complexity of real ocean waveforms. Nevertheless, the performance of STSMC under these conditions is robust, as it continues to provide stable power quality and reliable operation.
4.7. Comprehensive Analysis and Discussion
The comparative evaluation of STSMC, FOC, FOSMC, and NAB showed that STSMC consistently outperformed the other methods in response time, tracking accuracy, and resilience to wave-induced disturbances. These findings underscore the practical advantages of STSMC in PAWECs, especially in variable marine environments.
4.7.1. Performance Under Regular and Irregular Wave Conditions
As shown in
Figure 7, STSMC reached the reference generator speed of 104.7 rad/s in about 0.1 s under regular wave conditions, which was 17% faster than FOSMC (0.12 s), 29% faster than NAB (0.14 s), and 33% faster than FOC (0.15 s). This rapid convergence is attributed to STSMC’s superior handling of nonlinear disturbances. While FOSMC and NAB also achieved relatively short response times, they exhibited minor steady-state oscillations that could affect long-term efficiency. FOC, meanwhile, showed a slower settling time and a more pronounced transient response, rendering it less suitable for swiftly changing wave scenarios.
Under irregular wave inputs, STSMC maintained effective speed regulation with only minor increases in settling time and transient deviations. This adaptability is essential in real-world applications where wave characteristics can fluctuate significantly. In contrast, FOSMC and NAB experienced somewhat higher oscillations, and FOC continued to lag in response, suggesting potential reliability concerns under irregular conditions.
Torque tracking (
Figure 8) further highlights the effectiveness of STSMC, which stabilized torque at 4.7 N·m within 0.1 s, whereas FOC and NAB took roughly twice as long, and FOSMC lagged by approximately 33%. STSMC’s rapid stabilization can be linked to its enhanced chattering mitigation. FOC remained the slowest, showing an extended transient phase. Under irregular waves, STSMC sustained stable torque with minimal deviation, whereas FOSMC and NAB showed modestly higher steady-state errors. FOC was most affected by the irregularities, with prolonged oscillations and slower convergence.
4.7.2. Power Output and Machine-Side Current Tracking
Figure 9a–d illustrate the power output performance. Under regular waves, STSMC attained the rated 500 W in about 0.1 s—20% faster than NAB and notably quicker than both FOSMC and FOC, which required roughly 0.15 s. Furthermore, STSMC’s control effectively dampened power oscillations. FOC and FOSMC showed transient ripples that could lower efficiency, while NAB demonstrated some improvement but was still surpassed by STSMC in terms of overall smoothness.
When wave conditions became irregular, STSMC maintained stable power delivery with reduced oscillations, enhancing energy conversion efficiency in realistic marine scenarios. Although FOSMC and NAB partially mitigated oscillations, they did not match STSMC’s consistency. FOC again showed increased variability, indicating limited adaptation to sudden wave-force changes.
Machine-side current tracking (
Figure 10d and
Figure 12d) also confirms STSMC’s superiority. By accurately regulating
, STSMC decreased error by about 40% compared to NAB. FOSMC outperformed FOC in error reduction; however, FOC exhibited marked oscillations around the reference. Under irregular waves, STSMC continued to demonstrate precise current control, minimizing torque ripple and enhancing the PMSG’s overall reliability.
4.7.3. Grid Integration and Power Quality
In terms of grid integration, the effectiveness of STSMC is evident from the stable DC link voltage (
Figure 12a,b) and grid-side current behavior (
Figure 12c,d). Under regular waves, the DC link voltage rapidly settled near 350 V with minimal steady-state offset. This behavior remained robust under irregular waves, with only slight increases in transient fluctuations. Such performance is vital for stable power transfer and compliance with grid standards.
The grid current waveforms shown in
Figure 12c,d remain synchronized with the grid frequency, and the THD (
Figure 13) stands at around 3.35%, which satisfies typical grid requirements. This low THD reduces energy losses and fortifies system stability upon grid connection. FOSMC and NAB also managed acceptable THD levels, although they exhibited heightened variability under irregular wave conditions. FOC lagged behind, with higher THD levels that may jeopardize grid quality in rough sea states.
4.7.4. Discussion on Real-World Applicability
The deterministic analyses presented earlier characterize the inherent behavior of the STSMC strategy under ideal conditions. However, in realistic offshore deployments, two common types of disturbance can influence system performance: low-level sensor noise (SN) and slowly varying mooring dynamics (MD). SN is emulated by introducing small, zero-mean perturbations into the generator speed () and current () feedback channels, simulating the drift and quantization effects typically encountered in marine instrumentation. MD is modeled as a linearized catenary response added to the heave equation, introducing a soft restoring force and damping that couple surge and heave motions.
Figure 14 presents a comparison of the generator speed response with and without SN. The sliding surface remains unaffected; only narrow-band, high-frequency oscillations appear around the reference signal, without introducing any sustained deviation. This demonstrates that the discontinuous structure of STSMC inherently suppresses small measurement disturbances without requiring additional compensation or retuning.
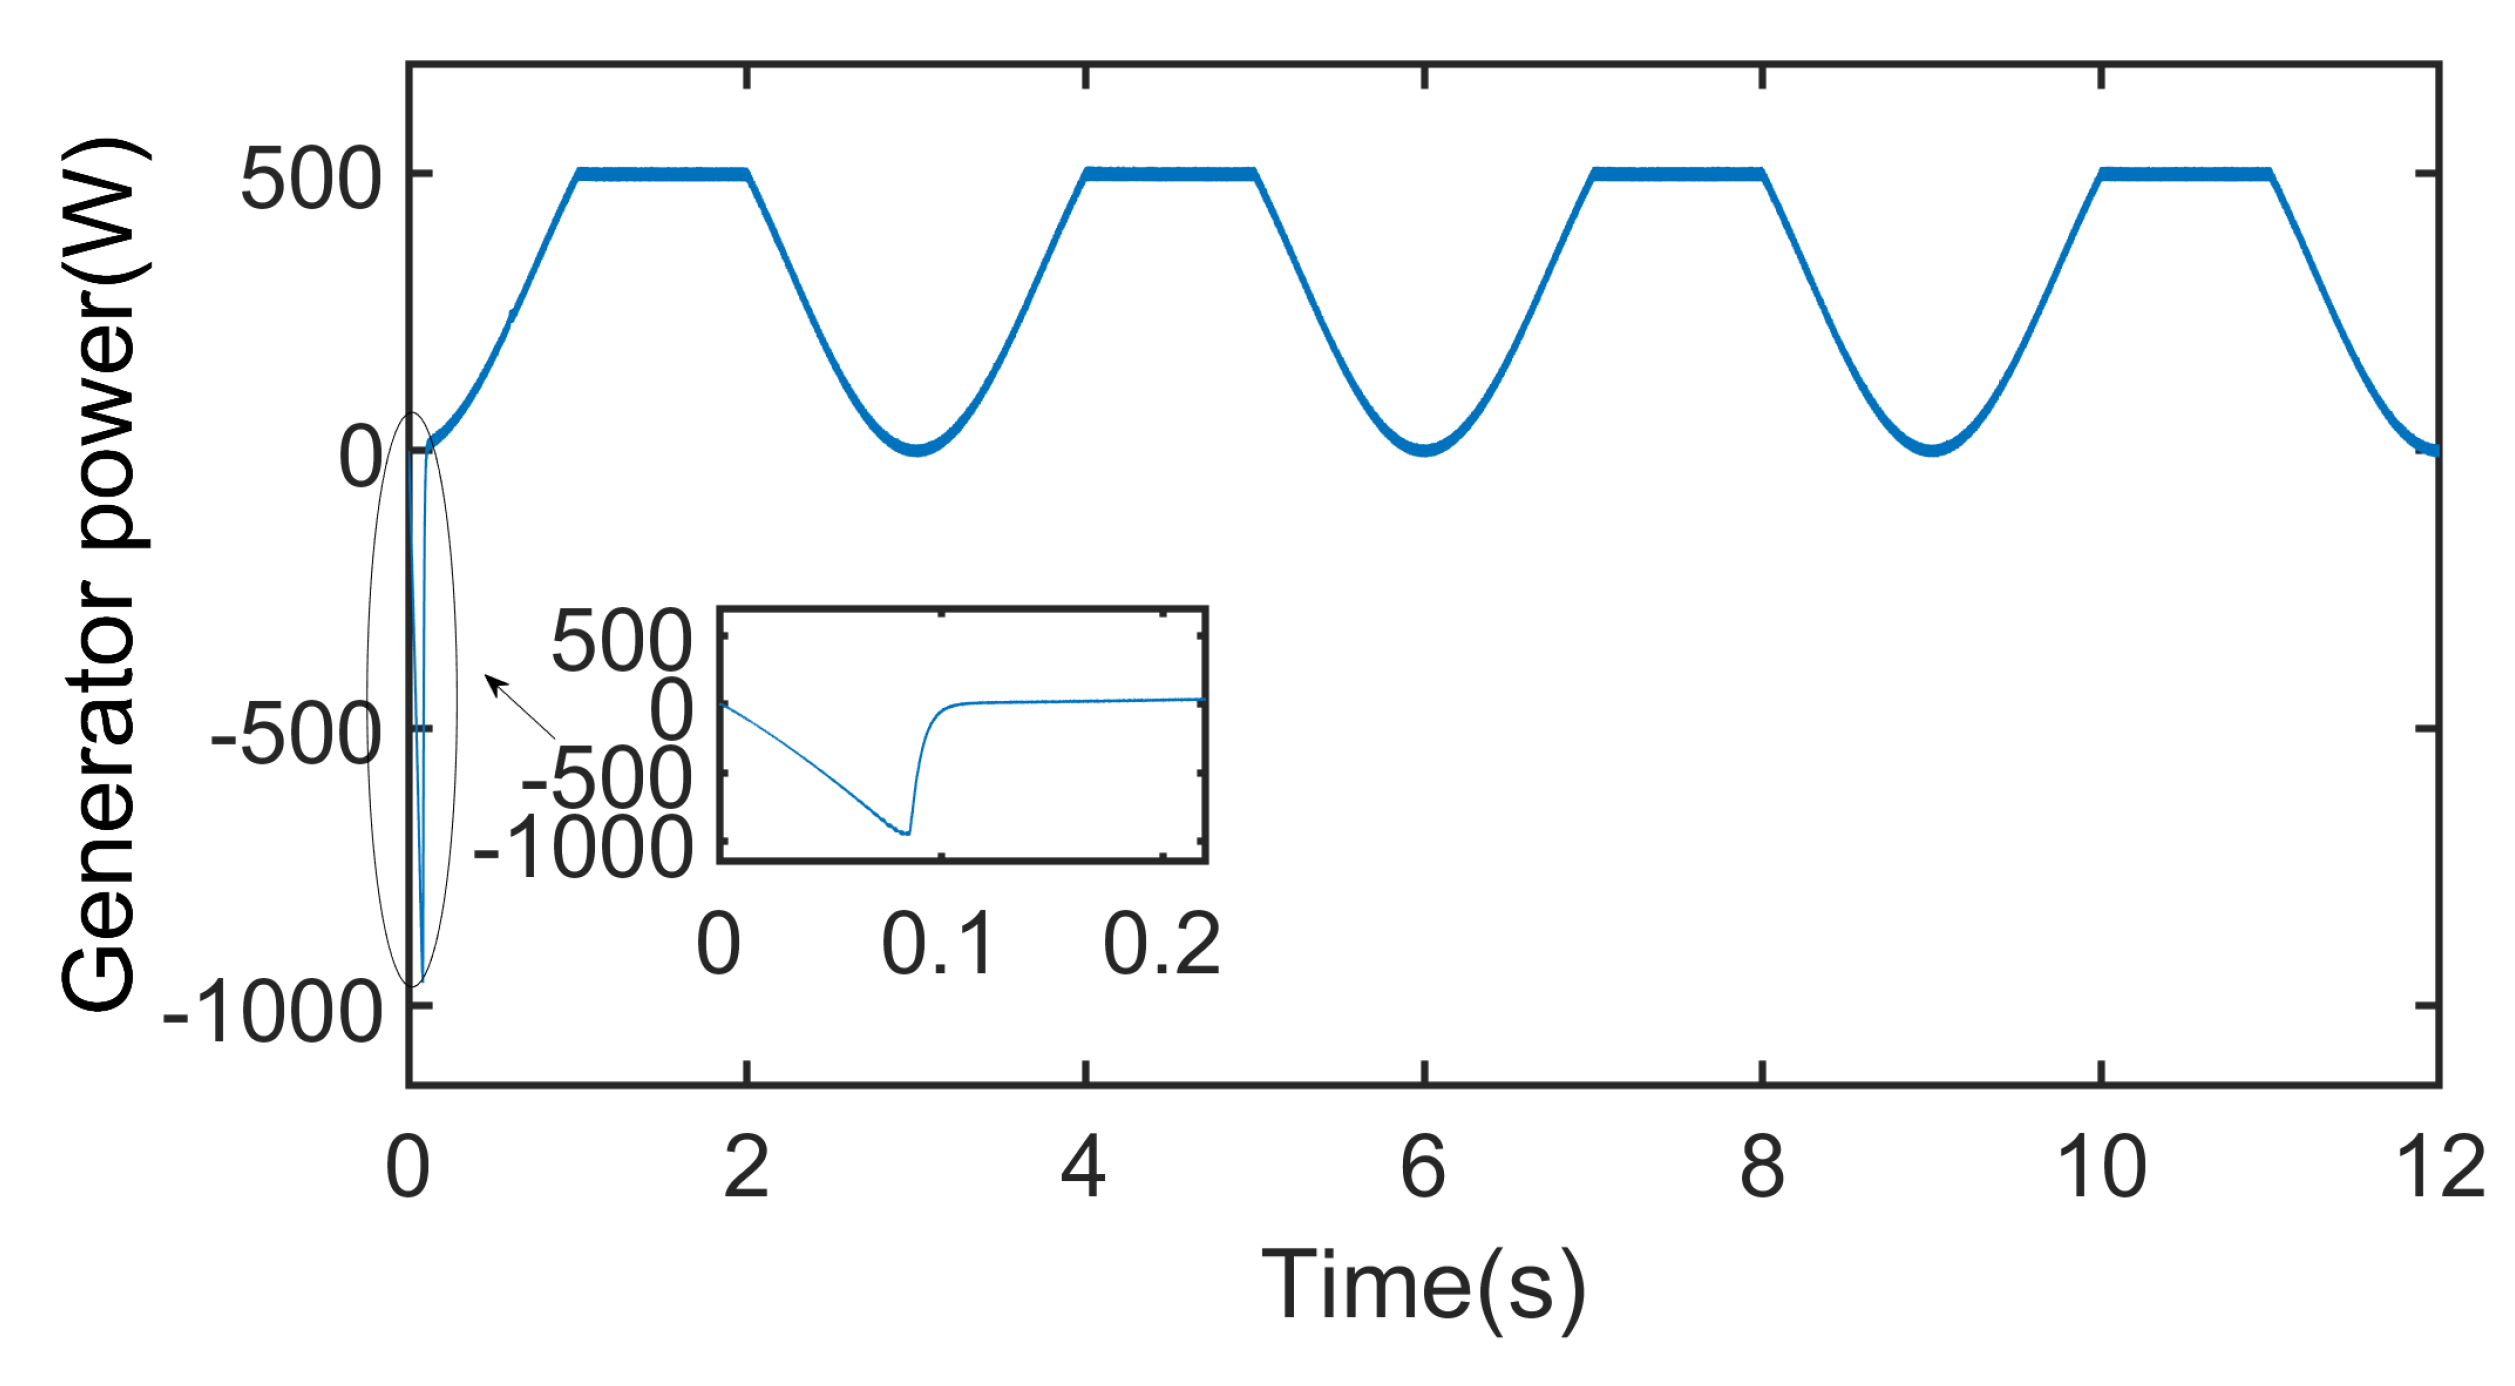
Figure 15 illustrates the electrical power
under the influence of MD. The slow oscillation of the mooring line induces gentle fluctuations near the nominal power level. Brief flat segments at the rated value (500 W) reflect the activation of the internal power-limiting function within the controller, designed to prevent overloading. These limit-induced plateaux are short in duration and do not push the system beyond safe operating limits. The overall power profile remains smooth, indicating that the controller tolerates mooring-induced variations without compromising performance.
These qualitative findings suggest that the proposed STSMC maintains its key advantages—fast dynamic response and stable power delivery—even in the presence of representative offshore disturbances. Future work will investigate broader disturbance scenarios, including cable dynamics in array configurations and time-varying delays in real-time embedded systems.
5. Conclusions
This paper presented a comprehensive model of a nonlinear heaving PAWEC with a PMSG and introduced an STSMC strategy to enhance both efficiency and stability. The overall wave-to-wire process was simulated in MATLAB/Simulink, encompassing wave energy capture and subsequent grid integration at 220 V, 50 Hz. Comparative results with conventional control methods—including FOC, NAB, and FOSMC—highlighted the notable advantages of STSMC.
The proposed STSMC demonstrated significant gains in response time, tracking precision, and robustness. Under regular wave conditions, it reached steady state up to 33% faster than FOC and reduced settling times by 20–50% relative to NAB and FOSMC. Under irregular wave conditions, STSMC sustained stable performance, mitigating steady-state errors and minimizing oscillations in torque, speed, and power output. Power quality analysis revealed that STSMC effectively controlled THD at approximately 3.49%, meeting typical grid standards.
These findings suggest that STSMC offers a promising control framework for practical wave energy applications, delivering higher reliability and efficiency for marine energy systems. Future efforts will focus on validating the proposed approach in real ocean environments to assess its adaptability, scalability, and long-term performance under authentic wave conditions.


