Article

Link Availability-Aware Routing Metric Design for Maritime Mobile Ad Hoc Network

1
School of Information Science and Technology, Dalian Maritime University, Dalian 116026, China
2
Maritime Safety Administration, Beijing 100736, China
*
Author to whom correspondence should be addressed.
J. Mar. Sci. Eng. 2025, 13(6), 1184; https://doi.org/10.3390/jmse13061184
Submission received: 25 April 2025 / Revised: 15 June 2025 / Accepted: 15 June 2025 / Published: 17 June 2025
(This article belongs to the Special Issue Advanced Studies in Marine Data Analysis)

Abstract

:
A maritime mobile ad hoc network (M-MANET) is an essential part of the maritime communication network and plays a key role in many maritime scenarios. However, the topology of M-MANET dynamically changes with the movement of vessels, which leads to unstable link states and poses the risk of data transmission interruption. In this paper, a mobility model for small unmanned surface vessels based on smooth Gaussian semi-Markovian and a trajectory prediction method for large vessels based on a bi-directional long short-term memory network are proposed to better simulate the nodes’ movement in the M-MANET. Then, a link available based routing metric is proposed for M-MANET scenarios, which incorporates factors of mobility model and vessel trajectory. Experiments demonstrate that compared with the benchmark methods, the proposed mobility model depicts the movement characteristics of vessels more accurately, the proposed trajectory prediction method achieves higher prediction accuracy and stability, the proposed routing metric scheme has a reduction of 14.59% in end-to-end delay, a 1.54% increase in packet delivery fraction, and a 4.43% increase in network throughput on average.

1. Introduction

A maritime mobile ad hoc network (M-MANET) is recognized as an essential component of maritime communications, particularly in the realms of emergency communications and rescue, marine monitoring, and maritime logistics [1]. With the advancement of technology, the potential applications of M-MANET in future maritime scenarios are expected to expand significantly. M-MANET has the features of decentralization and flexibility of general ad hoc networks, as well as the characteristics of strong node mobility and dynamic topology change [2]. Nodes in M-MANET include various types of vessels, which can be roughly divided into small unmanned surface vessels (USV) and large passenger or cargo vessels. Complex motion scenarios can be formed between multiple vessels. In particular, USVs typically act as relay nodes for ship-to-ship communications of large vessels, helping them expand the sensing range and promptly understand and keep track of the navigation dynamics of surrounding vessels. This enables large vessels to make further navigation decisions to better achieve navigation safety [3,4]. Therefore, considering its application scenarios, an M-MANET usually needs to provide high-quality communication services [5]. However, since the constant movement of vessels will lead to dynamic changes in network topology, coupled with the complex sea environment, such as harsh and variable meteorological conditions and relatively few and scattered communication nodes, the link state of the M-MANET is usually unstable. Packet loss and transmission interruptions occur constantly in M-MANET. Therefore, to better make a use of M-MANET, the improvement of stability and availability of it is a key problem that cannot be ignored. To address these, this paper proposes a routing metric designed for M-MANET.
Earlier mobility models, such as random waypoint (RWP), were widely used to simulate the movement of nodes and analyze the performance of communication protocols in mobile ad hoc networks [6]. However, the RWP model allows nodes to randomly change direction and speed upon reaching a destination, which can lead to unrealistic sharp turns or frequent changes in direction. Hence, subsequent research has started to focus on mobility models that more closely resemble realistic movement patterns. Gauss–Markov (GM) mobility models, Gaussian semi-Markov (GSM) mobility models, and smooth random mobility (SRM) models are illustrative of such movement models in which the movement at the current moment is closely related to the movement at the previous moment [7]. While these mobility models ensure smoother trajectories by allowing current movements to be correlated with previous movements, they are not linked to vessel movement characteristics in the marine environment [8]. Since the vessel mobility model is the foundation of M-MANET research, and its movement trajectories and dynamic distribution have a profound impact on the network topology and performance, it is necessary to explore vessel mobility models that conform to the realistic movement characteristics of vessels.
Although the vessel mobility model provides a modeling foundation for M-MANET research, the correlation mechanism between its spatiotemporal characteristics and communication links still needs to be further quantified. In recent years, scholars have carried out a series of studies in this regard. In order to improve the transmission efficiency and robustness of mobile ad hoc networks, many studies have been conducted to predict the duration of communication links by modeling and analyzing the link lifetime [9,10]. There are also scholars who have used received signal strength to measure node stability, as well as using packet reception ratio to assess the transmission quality between nodes [3,11]. Although there are many research scholars who have conducted a lot of analysis and modeling for link quality, it is not applicable enough for maritime application scenarios.
After obtaining the assessment of communication quality at the link level, the next step is how to effectively map it to a path selection criterion. Existing routing metrics are typically calculated based on factors such as hop count, bandwidth, and delay. Several studies have used link residual lifetime to characterize the availability of a link, and estimating the link residual lifetime becomes a difficult task since the movement of nodes is unpredictable. However, in a constantly moving M-MANET, the estimated link lifetime may not be accurate enough to be used as a routing metric in the route discovery process alone. There are also studies that simultaneously consider residual energy, distance to the base station, relative mobility, and node degree difference to evaluate link quality and select the next hop node based on link quality [12,13]. In summary, researchers worldwide have extensively studied routing protocol metrics and made significant contributions to this field. However, maritime communication-specific metrics remain understudied despite the distinct characteristics of vessel networks. Given that node mobility in M-MANETs critically determine link availability, a cross-layer mapping framework that integrates mobility modeling, link estimation, and path stability is vital for designing M-MANET specialized routing metrics.
Currently, there is no suitable physical layer node mobility model, and the routing metrics are not well-matched for M-MANET scenarios. Therefore, this paper presents a vessel mobility model and a vessel trajectory prediction method to lay the foundation for M-MANET simulation and implement link estimation for M-MANET. Based on this, a routing metric that is suitable for M-MANET is ultimately designed. It should be noted that the vessel mobility model proposed in this paper is oriented to USV, and the proposed vessel trajectory prediction method is oriented to large vessels, both of which describe the navigation behavior of different types of vessels so as to lay the foundation for maritime communication simulation scenarios. The contributions of this paper are as follows:
(1)
This paper presents a mobility model for USV based on a smooth Gaussian semi-Markov framework. The model accurately captures the realistic movement characteristics of small vessels.
(2)
A vessel trajectory prediction method is proposed, utilizing Bayesian optimization. This approach effectively exploits the spatiotemporal correlations of trajectories, thereby achieving superior performance in predicting vessel trajectories.
(3)
The concept of link availability is defined, upon which a routing metric suitable for M-MANET is designed. The routing protocol utilizing this metric achieves superior performance in terms of end-to-end delay, packet delivery fraction, and network throughput.
The rest of the paper is organized as follows: Section 2 discusses the related work. Section 3 describes the USV mobility model and predicts the vessel trajectory using real trajectory data of large cargo vessels. The link state estimation model is also proposed in this section. Section 4 gives extensive simulation results that validate the realism of the vessel mobility model, the accuracy of the trajectory prediction, and the routing protocol performance metric. Section 5 concludes the paper and discusses future extensions.

2. Related Work

This section presents the research directions and hotspots within four areas relevant to this paper: mobility model, trajectory prediction, link availability, and routing metrics. It provides a comprehensive summary and comparative analysis of the advancements and limitations of existing works in these areas.

2.1. Mobility Models

To develop a mobility model for M-MANET, this manuscript investigates the movement of individual nodes, specifically their positions and velocities relative to other nodes. These factors are critical in determining the formation and disruption of links. Based on distinct mobility characteristics, the models are generally classified into five primary categories, as illustrated in Figure 1 [14].
In random models, nodes move in a stochastic manner without considering any constraints. In time-dependent models, the current motion of a node is closely related to its previous motion [15]. The spatial dependency model considers the interactions between nodes in the spatial environment [16]. Geographical constraint models restrict the movement trajectories of nodes based on environmental factors such as streets, motorways, or obstacles [17]. Hybrid models integrate time-dependent, spatial-dependent, and geographically constrained movement patterns.
The existing mobility models designed for simulation environments are predominantly based on the movement patterns of pedestrians, vehicles, or drones, with a limited focus on the unique movement characteristics of vessels. The mobility of vessels, especially small USVs, is significantly distinct from that of ground vehicles and aerial drones, primarily due to maritime environmental constraints such as wind and waves. These constraints introduce complexities that current mobility models fail to capture accurately, leading to inaccuracies in simulating vessel movements. Therefore, there is an urgent need for a comprehensive investigation into the mobility model of vessels in order to develop a more accurate maritime simulation environment.

2.2. Trajectory Prediction

For large vessels, since their motion variations are relatively small, in the study of M-MANET, we are usually more concerned with their trajectory over a period of time rather than the mobility model. The implementation of trajectory prediction provides a priori information about the state of the link between the M-MANET nodes. Reference [18] reviews the existing approaches for vessel trajectory prediction, presenting a discussion on assisting techniques, complexity analysis, performance evaluation, and performance improvement for vessel trajectory prediction research. The problem of trajectory or trajectory prediction has been extensively studied, which demonstrates its significant potential for practical applications. Currently, popular trajectory prediction methods include linear models and nonlinear methods. Linear models are suitable for trajectory prediction of vessels when sailing mainly in a straight line. In order to solve the problem that the data trajectory prediction time is too long and the attitude cannot be predicted, the authors proposed an improved hidden Markov model trajectory and attitude prediction method in [19], which utilizes decoded states to predict future sequences. However, in real situations, when a vessel changes its speed or turns its course, the linear regression model prediction accuracy decreases, and its performance is weakened. Therefore, most researchers nowadays improve prediction accuracy by investigating nonlinear models.
With the development of deep learning, researchers tend to use more efficient data-driven methods [20]. Study [21] proposed a hybrid prediction model based on AIS data, which effectively reduces the uncertainty in short-term ship trajectory prediction. Studies have demonstrated the effectiveness of sequence-to-sequence models in vessel trajectory prediction with an encoder–decoder recurrent neural network architecture [22]. The long short-term memory (LSTM) network is also showing particular promise by leveraging historical trajectory data [23]. Furthermore, study [24] integrated bi-directional gated recurrent units and bi-directional LSTM networks, effectively enhancing the accuracy of vessel trajectory prediction. However, the existing research has not established a direct connection between trajectory prediction and ship navigation behavior, thus, failing to be well applied to communication scenario simulations.

2.3. Link State

Establishing available links in M-MANET is a critical issue because frequent topology changes in maritime environments can weaken the availability of link connections, link outages, and severe energy consumption of nodes, as well as significantly shorten the network lifetime. The same situation happens in other mobile ad hoc networks. Therefore, several studies have proposed routing protocols that focus on link stability. Study [25] analyzed multi-hop vehicle-to-unmanned aerial vehicles path availability and connection duration in unmanned aerial vehicle (UAV)-assisted vehicular networks. In contrast, study [10] predicted the UAV mobility and link expiration time to address flying ad hoc network (FANET) delay and delivery rate issues, with simulations validating its effectiveness. Previous studies predominantly employed simplified mobility models, such as exponential distributions or random waypoint models, to analyze network performance. Literature [9] proposes an optimized link state routing scheme incorporating a semi-Markov smooth mobility model with complexity bounds, introducing a residual link lifetime metric. In [26], the authors integrate deep learning technology with comprehensive node attribute evaluation and propose an efficient and adaptive link connectivity evaluation and routing strategy for maritime opportunistic networks. In [27], deep learning-based link selection methods are proposed. Compared with traditional methods, the proposed methods have enhanced the accuracy of prediction while reducing the test traffic, thus achieving a better balance between overhead and accuracy.
Although there is a large body of research on theoretical analyses of link and routing stability, most of the schemes are not coupled with node mobility model properties, and they are not able to reflect the real link state changes that will occur. Due to the dynamic nature of the maritime environment, the availability of a link that is measured as “better” based on past and/or present link state information may deteriorate over time, and this potential misjudgment of link availability can affect network performance. How to properly measure link availability in order to quantify routing metrics based on link availability has not been adequately addressed.

2.4. Routing Metrics

Most existing routing mechanisms primarily rely on metrics such as hop count, bandwidth, or delay, yet they fail to effectively ensure the continuity of M-MANET communication services. FANET, which shares the frequent topology-changing nature of M-MANET, have seen several routing protocol adaptations. For instance, ref. [12] analyzed the applicability of existing routing protocols in FANETs and proposed an enhanced ad hoc on-demand distance vector routing (AODV) protocol that selects the next-hop node based on neighbor count and hop distance. Similarly, ref. [28] introduced a forwarding strategy considering node residual energy, layer division, and received signal strength. Study [29] presented a novel path selection algorithm based on node reputation, defined as the ratio of lost packets to transmitted packets. Study [30] proposed a dynamic routing evaluation framework that integrates various metrics—such as node power, connectivity, link lifetime, mobility, and distance—using a reindeer herd optimization algorithm to enhance path selection. Study [31] developed a traffic-aware geographic source routing protocol for vehicular ad hoc networks, leveraging an ant colony algorithm to select paths with minimal cumulative weight by evaluating individual street segments. Although these studies propose effective routing metric improvements, their analysis of node mobility exhibits abrupt variations and discontinuity, leading to several unresolved limitations.
Link failures mainly occur due to the movement of nodes and the depletion of node energy, which shortens the network lifetime. When a route fails, the route discovery process must restart, significantly increasing network latency. To address this, researchers have proposed various enhancements. Study [32] introduced an AODV routing protocol that selects optimal paths based on predicted link lifetime and minimal energy consumption. Study [33] used node mobility and encounter rate metrics to select routes to enhance the stability of the network. Simulation results show that this method minimizes packet loss and reduces network delay. In [34], the concept of beam lifetime is defined as the duration from the current time to the time when an uncooperative target perceives the beam signal and the path lifetime is defined as the minimum beam lifetime along the routing path and is employed as a routing metric. Despite these advances, existing studies overlook link availability when calculating link lifetime, leaving a critical gap. In summary, while extensive research exists on routing metrics, no exclusive metric set has been established for M-MANET, and the criteria for determining the optimal link remain unresolved.

3. Methodology

3.1. The Proposed Framework

This section systematically and thoroughly introduces the proposed USV mobility model, vessel trajectory prediction, and routing metric design based on link availability. The relationships among these three research points are shown in Figure 2. The USV mobility model describes the movement of relay nodes in M-MANET, while vessel trajectory prediction describes the movement of source/destination nodes in M-MANET. Furthermore, the mobility model and trajectory prediction are integrated with link state analysis to introduce link availability, and a novel routing metric based on link availability is designed for M-MANET.

3.2. Unmanned Surface Vessel Mobility Model

Usually, the inherent operation of the vessel includes velocity change and direction change. Among them, the velocity change mainly includes acceleration, deceleration, and stopping, and the direction change includes a series of operations during the steering process of the vessel. In M-MANET, the USV, as a type of communication node, only needs to consider its movement pattern in the two-dimensional plane when modeling its mobility. As shown in Figure 3, the coordinates of navigation are the opposite of the Cartesian coordinates, i.e., the longitudinal axis is the x-axis, where the heading angle ψ is positive clockwise from due north, to the x of the kinematic coordinate system. The drift angle ω represents the angle between the combined velocity V   ( V = u 2 + v 2 ) , and the x of the kinematic coordinate system and is positive in the anti-clockwise direction.
In this paper, an USV mobility model based on smooth Gaussian semi-Markov (USV-SGSM) is given by combining the USV motion characteristics and the inherent vessel operation, and the proposed USV-SGSM has different descriptions in each motion phase. The USV’s motion is divided into three different phases: variable velocity, stable, and cyclotron. The cyclotron motion only occurs after the USV has been in the stabilized motion phase for some time.

3.2.1. Subsubsection Variable Velocity Motion Phase α

Since the motion of the USV is smooth and continuous rather than changing direction or velocity suddenly, a correlation memory parameter η is introduced to indicate the correlation between the current velocity and direction of the USV and the previous time slot, which helps to simulate the smooth motion and make it closer to the actual situation. η takes the value in the range of (0, 1), and the larger η is, the stronger the correlation is. It is assumed that η is constant in velocity and direction for each time period. Therefore, by adjusting the parameter η , the degree of correlation between the velocity, direction and time between two consecutive time periods can be controlled.
The variable velocity motion of USVs includes acceleration and deceleration. The target velocity V α U [ V min , V max ] is selected at the initial moment t 0 and the motion direction ψ α U [ 0 , 2 π ] . Throughout the α phase, the USV motion direction fluctuates around ψ α . Let the number of time slots in α phase α = t α t 0 Δ t , α U [ α min , α max ] , and t α is the end moment of α phase. The acceleration of the USV is a α = v α α Δ t . If the USV decelerates to a standstill, it chooses a period of dwell time t p and then temporarily stays at a standstill, and then moves again after the end of the dwell time.
The velocity and direction of motion for the (i + 1)-th time slot of α phase is expressed as follows:
V i + 1 = V i + a α i + 1 Δ t + σ V 1 η 2 V ˜ i ,
ψ i + 1 = η ( ψ i + ω ) + ( 1 η ) ψ ¯ + σ ψ 1 η 2 ψ ˜ i ,
where Δ t denotes the time slot, V i + 1 is the velocity of USV at the moment i + 1, V i is the velocity at the moment i, ψ i + 1 and ψ i denote the directions of motion at the moments i + 1 and i, respectively. V ˜ i , ψ ˜ i obey Gaussian distributions with a mean of 0 and variances of σ V and σ ψ , respectively. ψ ¯ is the mean value of the direction of motion.
Therefore, the horizontal and vertical coordinates of USV in the (i + 1)-th time slot of α phase are:
x i + 1 = x i + 1 2 a α i + 1 cos ψ i + 1 Δ t 2 ,
y i + 1 = y i + 1 2 a α i + 1 sin ψ i + 1 Δ t 2 ,
where x i and y i denote the horizontal and vertical coordinate information of USV at the current moment, x i + 1 and y i + 1 denote the horizontal and vertical coordinate information of USV at the next moment.

3.2.2. Stable Motion Phase β

Once the USV has moved at variable velocity to the target velocity, it enters a stable motion phase, denoted as the β phase, at the moment t α . The duration of β phase is β Δ t , and the ending moment is t β , where β U [ β min , β max ] . In the β phase, the velocity and direction of the USV fluctuate around V α and ψ α at each Δ t . Therefore, the motion velocity and motion direction of the (j + 1)-th time slot in β phase are expressed as follows:
V j + 1 = η V j + ( 1 η ) V ¯ + σ V 1 η 2 V ˜ j ,
ψ j + 1 = η ( ψ j + ω ) + ( 1 η ) ψ ¯ + σ ψ 1 η 2 ψ ˜ j ,
where V ¯ is the average value of the USV velocity, V ˜ j and ψ ˜ j obey Gaussian distributions with a mean of 0 and variances of σ V and σ ψ , respectively.

3.2.3. Cyclotronic Motion Phase ε

In real scenarios, the direction of USV may change after a period of stable motion, and this change is smooth, and the change in direction is usually within 180°. Therefore, the heading of USV is set to be less than or equal to 180°. At the initial moment t β , the target direction ψ ε is selected, so that Δ ψ ε = ψ ε ψ β , and Δ ψ ε [ π , π ] . Δ ψ ε [ π , 0 ] means left turn and Δ ψ ε [ 0 , π ] means right turn. The motion of the cyclotron to the target direction ψ ε is t ε , and the number of time slots lasting in the ε phase is ε = t ε t β Δ t . ε directly reflects the time of the ε phase, and ε U [ ε min , ε max ] .
In the process of the cyclotron, the initial diameter of the cyclotron is about 3–6 times the USV’s length, the feed distance is 0.6–1.2 times the initial diameter of the cyclotron, the lag distance is 1–2 times the USV’s length, and the USV offset is about 1% of the USV’s length when the USV is fully loaded [35]. Combining the above analyses, it can be deduced that the USV steering radius calculation formula is
R = 1 2 ( A d R e L k ) ,
where R is the steering radius of the USV, A d is the USV’s approach distance, R e is the USV’s lag distance, L k is the USV’s offset.
The time and direction update equations are:
t = sin Δ ψ R V t + 1 ,
ψ t + 1 = ψ t + ω + σ ψ 1 η 2 ψ ˜ t ,
where t denotes the time interval of the USV’s motion update in the ε phase, ψ t and ψ t + 1 denote the directions of motion at the moments t and t + 1 , respectively. Δ ψ denotes the direction offset of the USV’s rotation, ψ ˜ t obeying Gaussian distributions with a mean of 0 and variances of σ ψ .
When the USV turns left, the center of the cyclotron is calculated as follows:
x o = x t R cos ψ t ,
y o = y t + R sin ψ t .
The horizontal and vertical coordinates of the USV are given by:
x t + 1 = x o + R cos ( ψ t + 1 + ψ η ) ,
y t + 1 = y o R sin ( ψ t + 1 + ψ η ) .
where x o and y o denote the horizontal and vertical coordinates of the rotation center, respectively. x t and y t denote the horizontal and vertical coordinates of the USV’s current position. x t + 1 and y t + 1 denote the horizontal and vertical coordinates of the USV’s next moment. θ t and θ t + 1 are the direction of motion at the current moment and the next moment, respectively. When the USV turns right, it is similar to the left turn formula, with essentially the same center of rotation and position update, only differing in directions.
In the ε phase, the phenomenon of the USV’s motion velocity reduction will be produced, which is called cyclotronic velocity drop. The influence of the velocity drop coefficient is measured by three factors, which are the cyclotronic index K , the coefficient of rudder’s normal force C N , and the heading change Δ ψ . Therefore, the equation for estimating the USV’s cyclotronic velocity drop coefficient can be obtained by
V ε + 1 V ε = 8.697 + 6.361 K + 7.960 C N 5.295 K C N Δ ψ 57.3 + 0.067 ( K 2 ) + 0.028 ( Δ ψ 57.3 ) 2 ,
where V ε and V ε + 1 are the current moment and the next moment USV’s velocity, respectively. Figure 4 shows a schematic diagram of the trajectory of the USV in the ε phase.
To summarize, the USV undergoes the α phase from rest for α Δ t time to enter the β phase, and enters the ε phase after β Δ t time, and enters the next α phase after ε Δ t time turns to the direction ψ ε . USV may undergo m times of α β ε cycles before decelerating to rest, with m = 1, 2, …. The α m phase denotes the USV enters the α phase for the m-th time, the β m phase denotes the USV enters the β phase for the m-th time, and the ε m phase denotes the USV enters the ε phase for the m-th time.

3.3. Vessel Trajectory Prediction

In order to predict the trajectory of cargo vessels more accurately and efficiently, this paper proposes a vessel trajectory prediction model based on a Bayesian optimized convolutional neural network (CNN) and bi-directional LSTM network (BO-CNN-BiLSTM). Figure 5 shows the overall framework for BO-CNN-BiLSTM.
The proposed model employs CNN and LSTM as the basic networks because the trajectory prediction scenario can fully leverage the complementary advantages of these two networks. CNNs excel at capturing short-term spatial feature relationships, while LSTMs effectively model long-term temporal dependencies. Firstly, the CNN layer extracts latent hierarchical patterns from the input data, generating high-dimensional feature vectors. These feature vectors are then temporally sequenced and fed into a Bi-LSTM network for vessel trajectory prediction. Compared to a standalone LSTM, the CNN-Bi-LSTM framework significantly enhances input data validity, as the CNN preprocessing step explicitly encodes salient spatiotemporal features from raw sequential data. Moreover, the Bi-LSTM architecture further improves prediction robustness by incorporating both forward (past-to-future) and backward (future-to-past) temporal contexts, thereby capturing the mutual influence of historical and prospective states. Finally, Bayesian optimization is employed to systematically tune the Bi-LSTM hyperparameters, ensuring optimal model performance and prediction accuracy.

3.3.1. Convolution Networks

In this paper, the CNN layer is used to receive various variables characterizing a vessel’s trajectory, which include the longitude, latitude, speed to ground, heading to ground, and heading direction of the vessel’s voyage. The CNN consists of an input layer that accepts the variables as inputs, an output layer that extracts the features into the Bi-LSTM, as well as a convolutional layer, a rectified linear unit (ReLU) layer, and a pooling layer.
The convolutional layer performs a convolution operation on the input sequence to extract the local features of the input sequence and passes the result to the next layer. The ReLU is used as the activation function. It introduces sparsity into the prediction model by suppressing non-positive activations, thereby enhancing its ability to fit training samples more effectively. For nonlinear transformations in this scenario, the ReLU mitigates the vanishing gradient problem due to its constant gradient in the positive domain while simultaneously ensuring stable convergence during optimization. The pooling layer is added to optimize the network structure by downsampling the input feature vector while highlighting the extracted features.

3.3.2. Bi-LSTM

In this paper, Bi-LSTM is the up layer of CNN-BiLSTM that stores important features characterizing a vessel’s sailing state extracted through the CNN layer. The final Bi-LSTM outputs forward-learning and backward-learning navigation state features. Setting the spatial position of a vessel at time t can be expressed as
x t = ( l o n t , l a t t , s o g t , c o g t , h e a d i n g t ) ,
where l o n t , l a t t , s o g t , c o g t , and h e a d i n g t denote longitude, latitude, speed to ground, heading to ground, and heading direction of the vessel’s voyage, respectively. As shown in Figure 6, the spatial position of the i -th vessel at time l is x l i , and set the predicted state of the i -th vessel at time j to be x j i . Thus, Bi-LSTM outputs the future trajectory of the vessel o u t p u t i = x 1 , x 2 , , x T , where T denotes prediction time step.
LSTM controls the flow of information by combining structures such as input gates, oblivion gates, and output gates. When the input sequence x = ( x 1 , x 2 , , x T ) is input, the following equation is computed iteratively to obtain t = 1 , 2 , , T when the output sequence y t :
y t = W h y h t + b y ,
h t = o t tanh ( c t ) ,
where W denotes the weight matrix between each layer and gate, b y denotes the bias vector of the output y t , c t denotes the cell state, h denotes the hidden state, and o t denotes the output gate. Bi-LSTM consists of LSTMs in both directions. The forward LSTM starts processing from the start position of the time step, and the backward LSTM starts processing from the end position of the time step. Define the hidden state of the forward LSTM network as h t , the hidden state of the backward LSTM network as h t , and combine the two hidden vectors to get the final output of the Bi-LSTM network y t , as shown in Equations (18)–(20):
h t = L S T M ( h t 1 , x t ) ,
y t = h t h t .

3.3.3. Bayesian Optimization Algorithm

Choosing the correct hyperparameters is important for the performance of vessel trajectory prediction models. Due to the high computational complexity of Bi-LSTM and its sensitivity to hyperparameters, it often leads to low training efficiency and unstable performance. By combining Bi-LSTM with Bayesian optimization, tuning the hyperparameters of Bi-LSTM using Bayesian optimization can significantly improve the model’s performance. Therefore, we use a Bayesian optimization algorithm to tune the hyperparameters of learning rate, number of convolutional kernels, number of CNN-BiLSTM hidden units, and batch size of the trajectory prediction model so that the proposed model provides more accurate trajectory prediction. Figure 7 shows the flowchart of this algorithm. The objective of Bayesian optimization is to find a set of hyperparameters x * that minimize the objective function f ( x ) .
x * = arg min x χ f ( x )
The Gaussian process is first used as a proxy model for the objective function. A Gaussian process is a non-parametric model that can be used to model the probability distribution of the objective function. The Gaussian process is formulated as:
f ( x ) G P ( m ( x ) , k ( x , x ) ) ,
where m ( x ) is the mean function, and k ( x , x ) is the kernel function to measure the similarity between two input points x and x .
Then, we choose to use the expected improvement as a collection function for selecting the next set of hyperparameters with the following expression:
x n + 1 = arg max x E I ( x ) ,
E I ( x ) = Ε [ max ( 0 , f ( x + ) f ( x ) ) ] ,
where f ( x + ) is the current best objective function value and E ( ) denotes the expectation.
By continuously updating the Gaussian process agent model until the maximum number of iterations is reached, the optimal hyperparameter combination of the BO-CNN-BiLSTM model can be obtained. In order to evaluate the accuracy of the proposed model, three metrics are used in this paper for comparison: root mean square error (RMSE), maximum absolute error (Maxerr), and average displacement error (ADE).
  • RMSE: the average accuracy of model predictions compared to actual sample values;
  • Maxerr: the maximum absolute error between the predicted values and the true sample values;
  • ADE: the average distance error over all the predicted positions in the predicted trajectory and the corresponding points in the ground truth trajectory for all predicted time steps.
In trajectory prediction tasks, the prediction error is typically quantified using the aforementioned error metrics for performance evaluation [36]. Compared to metrics such as mean absolute error, mean absolute percentage error, and relative absolute error, RMSE is more sensitive to outliers, Maxerr can capture the worst-case scenario, and ADE is more intuitive. These three metrics collectively characterize the performance of the trajectory prediction model from both global and local perspectives, thereby enabling a comprehensive assessment of the model’s predictive quality.

3.4. Routing Metric Design Based on Link Availability

Based on the statistical characteristics of USV motion under the USV-SGM mobility model, this paper proposes the definition of maritime link availability (LA). We propose a maritime exclusive routing metric based on LA. The details are described in the following section.

3.4.1. Link Availability

Assume that two nodes i , j are moving in the same plane with their respective velocities V i and V j , node i is moving in the direction of θ i , node j is moving in the direction of θ j , with the coordinates of ( y i , x i ) and ( y j , x j ) , respectively, and that the two nodes are in the communication range of each other. As shown in Figure 8, V i j is the relative velocity of nodes i , j , θ i j is the angle between V i and V j , ϕ is the angle between V i j and V j , φ is the initial direction of node i ’s initial direction with respect to node j , r is the transmission range of the node, and r i j is the initial distance between nodes i , j .
In this paper, we define the link lifetime t i j as the time when the distance between two nodes reaches the transmission range r when the nodes are moving in a relative motion state, so we can obtain the link lifetime between nodes i , j as follows:
t i j = r i j cos ψ i j + r 2 r i j 2 sin 2 ψ i j v i j ,
where ψ i j = ( ϕ + φ ) .
Define the cumulative distribution function F ( ) as the probability that the link time is less than t i j , and the expression for F ( t i j ) is
F ( t i j ) = P ( r i j cos ψ i j + r 2 r i j 2 sin 2 ψ i j v i j t i j ) .
Define the threshold function h ( ϕ ) whose expression is as follows:
h ( ϕ ) = r i j cos ψ i j + r 2 r i j 2 sin 2 ψ i j t i j .
It can be demonstrated that multiplying both sides of Equation (26) by v i j results in the expression of P ( r i j cos ψ i j + r 2 r i j 2 sin 2 ψ i j v i j t i j ) . Thus, the equation is equivalent to the event v i j h ( ϕ ) .
Based on the nodal velocities of the α , β , and ε stages of the USV-SGSM model, we can obtain the velocity probability density function for each stage as follows. The variable velocity motion phase α function is
f α ( v ) = 2 v max + v min , 0 v v min 2 ( v max v ) v max 2 v min 2 , v min < v v max ,
where v min and v max are the minimum, and maximum speeds of the USV, respectively.
The stable motion phase β function is
f β ( v ) = 1 2 π σ exp ( ( v v α ) 2 2 σ 2 ) , v min v v max .
The cyclotronic motion phase ε function is
f ε ( v ) = 1 2 π σ ε exp ( ( v v β ) 2 2 σ ε 2 ) , v min v v max .
When the node is at rest and the velocity is 0, the corresponding probability density function is:
f p ( v ) = δ ( v ) ,
where δ ( v ) is the Dirac δ function. Since we can obtain φ and r i j from the AIS data, then, F ( t i j ) will be determined by the joint probability density function of v i j and ϕ . Thus, Equation (26) can be written again as
F ( t i j ) = π π h v i j max f v i j , ϕ ( v i j , ϕ ) d v i j d ϕ ,
where v i j max is the maximum value of v i j . The joint probability density function of v i j and ϕ is shown in the following equation:
f V i j , Φ ( v i j , ϕ ) = v j v i j f μ ( v i * ) f ν ( v j ) 2 π v i j 2 + v j 2 + 2 v i j v j cos ϕ d v j ,
where v i * = v i j 2 + v j 2 + 2 v i j v j cos ϕ , μ , ν α , β , ε , p .
Finally, we give the expression for LA as follows:
L A i j = P ( L L i j t i j ) = 1 F L L ( t i j ) .
After obtaining the link lifetime t i j and link availability L A i j between the nodes, the link duration availability time can be calculated as follows:
T L A = t i j × L A i j .
Since the connectivity of a communication path depends on the link states of all its constituent links, when any one of the links in the path fails, it will result in the disruption of the entire communication path. Suppose a transmission path consists of L L 1 , L L 2 , … L L n which are n links, the availability R L A of a route is defined as the minimum value of T L A with the expression:
R L A = min { T L A 1 , T L A 2 , , T L A n } .

3.4.2. Routing Metric Design

In this paper, we propose a new routing metric based on the proposed link availability and link lifetime improvement AODV. In the route discovery phase, when the source node wants to send data, firstly, it will detect whether there is any route in the routing table to reach the destination node route; if not or expired, then the path needs to be re-planned and the path selection is based on the path with good availability. Set L A i j as LA of any node i , and node j , and L A t h as the preset threshold of link availability, which will be considered if and only if L A i j L A t h . Figure 9 shows an example of route selection in M-MANET. Assuming that node S is the source node and D is the destination, then there are many possible routes from S to D . Some of the possible routes are listed below:
Route 1: S N 1 1 N 1 2 D ;
Route 2: S N 2 1 N 2 2 D ;
Route 3: S N 2 1 N 3 2 N 2 2 N 3 3 D .
The source node should choose the path with the highest priority among multiple paths for data transmission, in this paper the link priority L P R I i j is set as the node i to node j link metric. L P R I i j considers LA and link lifetime; the expression L P R I i j is given by the following equation:
L P R I i j = λ L A i j + μ 1 1 t i j ,
where λ + μ = 1 . The L P R I of each route can be obtained by obtaining the link priority and the number of hops for each link in the route, so the routing metric L P R I i is shown in the following equation:
L P R I i = j = 1 n L P R I i j H o p ,
where H o p denotes routing hops. When a node needs to send data to the destination node, the link lifetime and LA are obtained by using Equations (25) and (34) so that the path priority is calculated and dynamically updated according to Equation (38). Based on the above routing metric design, we give the route discovery algorithm as shown in Algorithm 1.
Algorithm 1: Route Discovery algorithm
Input: Information of nodes— S ,   D ,   and   N i j , Threshold L A t h .
Output: Discover the optimal route with L P R I i from S to D.
1. When S node wants to transmit data to the D node.
2. if S node L A s j   value   L A t h ,   then ,
3.  It is not able to initiate the route discovery process.
4.  Exit the process.
5. else
6.  S sends the RREQ packet to N i j .
7. end if
8. When N i j receives an RREQ packet.
9. if N i j s   L A i j value L A t h then
10.  Drop the RREQ packet.
11. else
12.  Receives RREQ packet.
13.  Store RREQ information in R T i j
14.   R S i j = max j N ( L P R I i k L P R I k j )
15.  Forward RREQ packet with R S i j to N j d
16. end if

4. Experiment Results and Analysis

4.1. Unmanned Surface Vessel Mobility Model Simulation

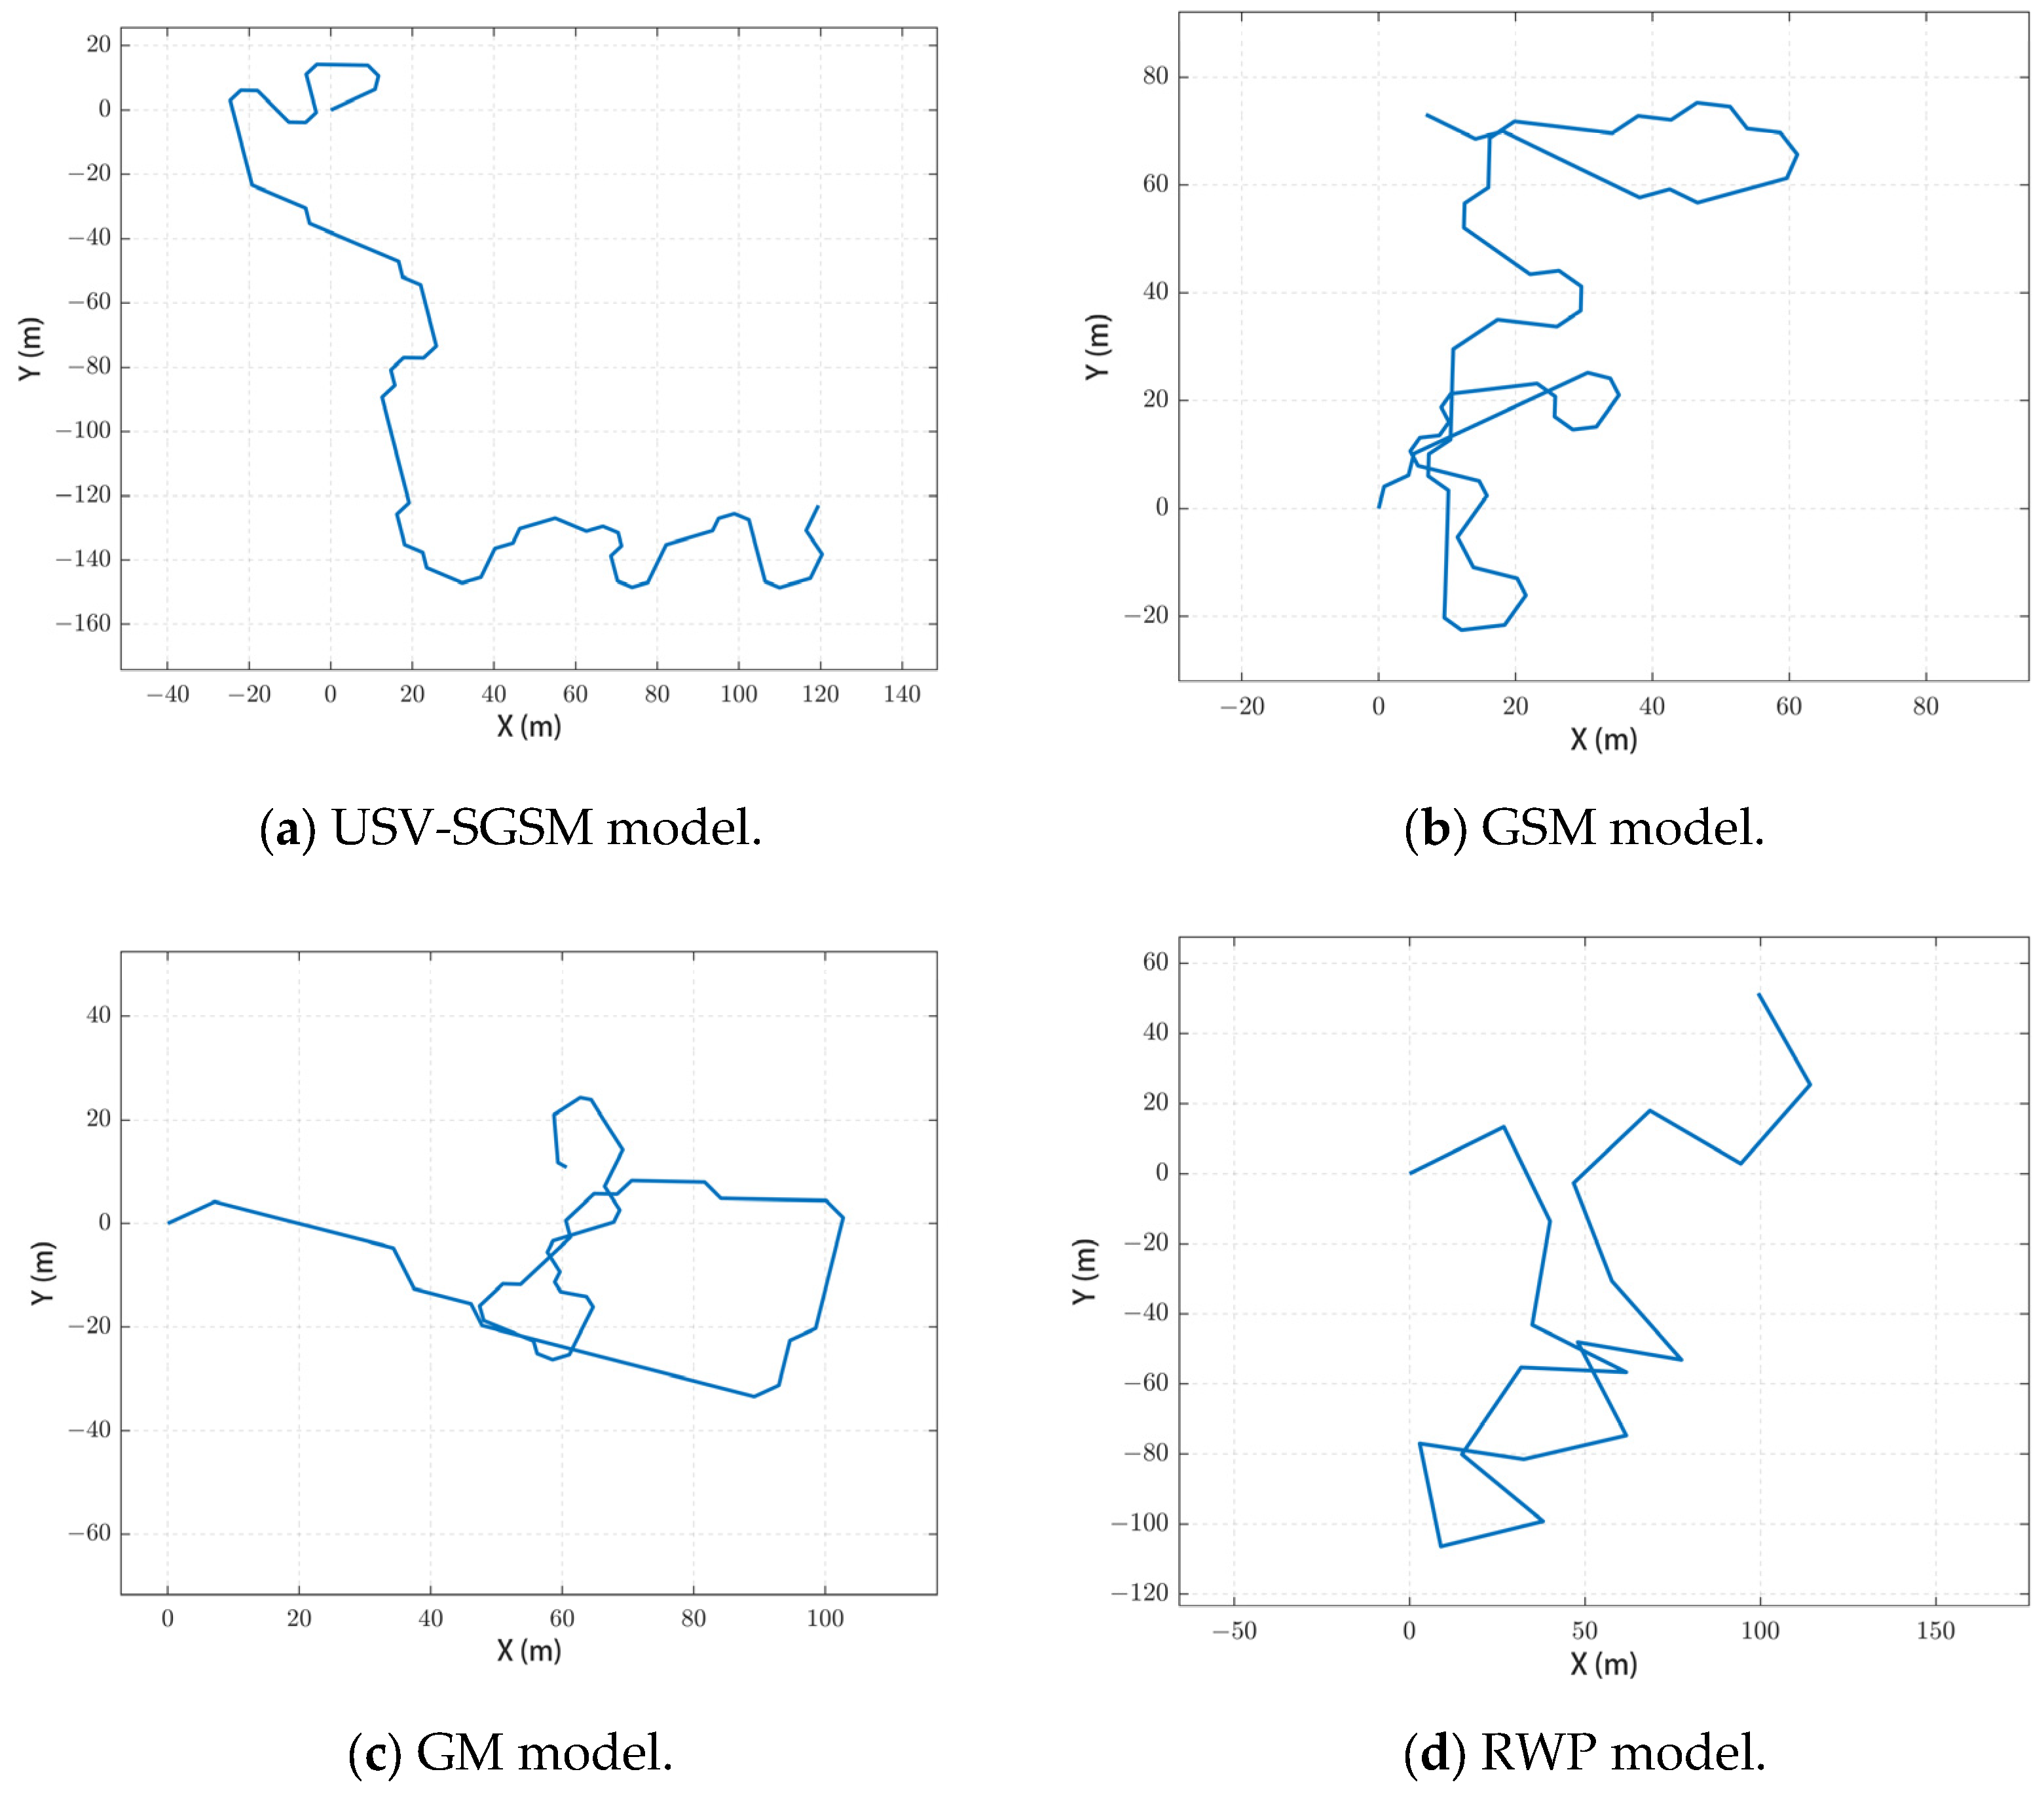
The simulation results of the movement of catamaran USV using the proposed USV-SGSM compared with GSM, GM, and RWP models are shown in Figure 10. The USV is 7.5 m in length, 2.8 m in width, with a displacement of less than 2.5 tons, and a working sailing speed of 5–12 knots. As can be seen from Figure 10, in the cyclotronic motion phase, the proposed USV-SGSM model has a suitable steering radius, and its trajectory is smooth, while the steering trajectories of the remaining three models show abrupt changes with obvious inflection points. In the straight-line motion phase (including variable velocity and stable motion phase), the trajectory of the USV-SGSM model shows a slight offset, which is in line with the straight-line motion of the USV under the action of waves, while the trajectories of the remaining three models show a stable straight line. Therefore, the characteristics of the USV-SGSM model are more in line with the real movement characteristics of USV when it is traveling on the sea surface and can more accurately simulate the motion state of the USV, thus laying the foundation for the subsequent simulation of the relevant network performance.
To further quantify the performance of different mobility models, Table 1 presents two key metrics: steering radius and average link hold time. In vessel design, specific requirements are set for the steering radius to ensure maneuverability. For a USV with good maneuverability, the minimum steering radius is typically around 1.5 m. As shown in Table 1, the USV-SGSM model exhibits superior cyclotronic characteristics compared to other models and achieves the highest link duration. These results highlight the advantages of the proposed USV-SGSM mobility model.

4.2. Vessel Trajectory Prediction Experiments

The experimental environment for vessel trajectory prediction is configured with CPU: Intel Core i5-11260H 2.60 GHz; RAM: 16.0 GB; and MATLAB R2024b. In this paper, the data set is divided into training, validation, and test sets in the ratio of 8:1:1, where the training set is used for model parameter optimization and feature learning to improve the model’s generalization ability. The validation set assumes the functions of model performance evaluation and structural adjustment and optimizes the hyper-parameters by monitoring the performance on the validation set; the test set, as an independent evaluation set, is used only after the completion of model training and tuning and is used to objectively evaluate the final prediction performance of the model to ensure the fairness and availability of the evaluation results.
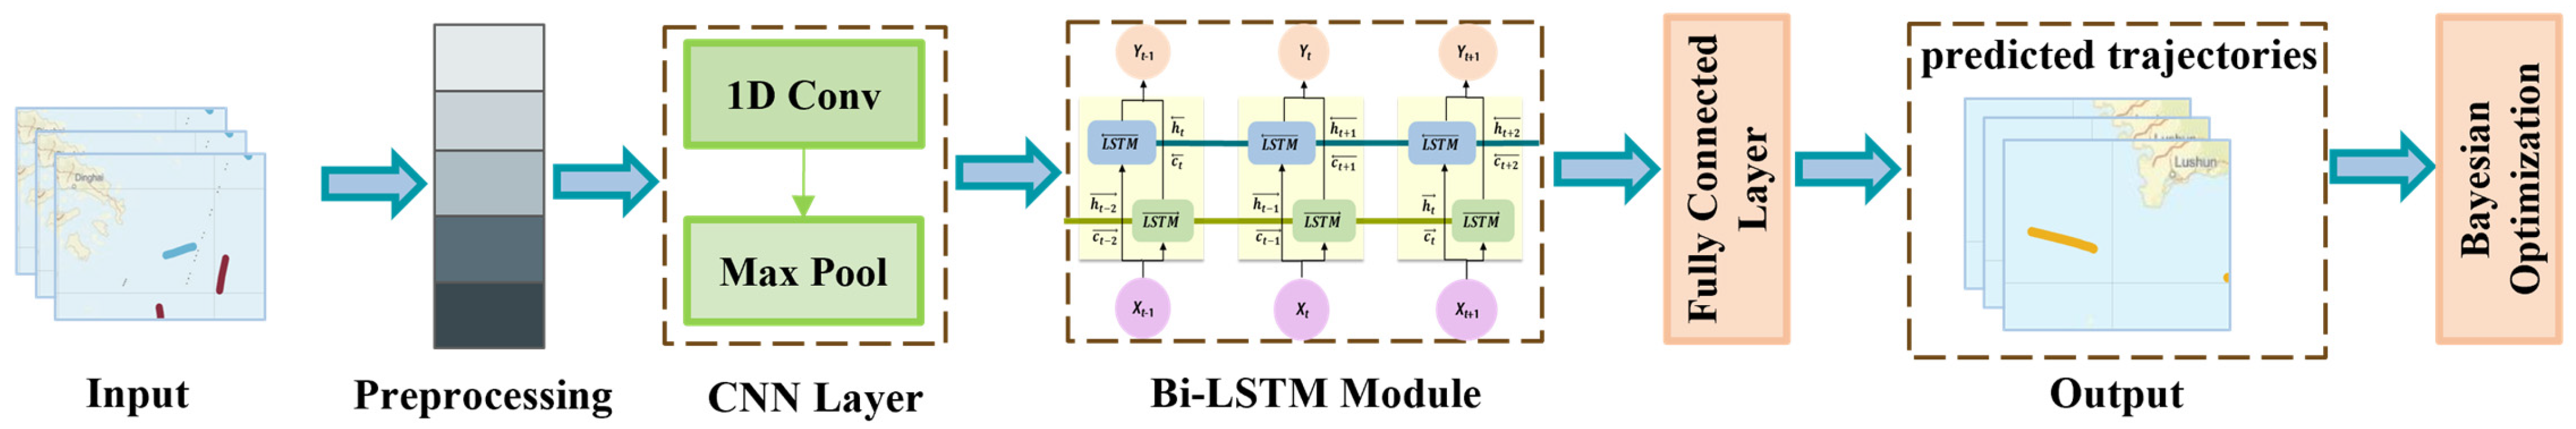
In the trajectory prediction model, the latitude and longitude of the vessel at the next moment are output by inputting the vessel data at four consecutive moments. In the CNN-Bi-LSTM model, the convolution kernel size of 1DCNN is 3, and the output time step is 2. In this paper, we adopt a zero-pooling strategy for the convolution operation, which ensures that the size of the feature map before and after the convolution is consistent by replenishing zero-valued elements at the boundary of the input feature map. Meanwhile, the pooling operation adopts the mean pooling method, i.e., the arithmetic mean of the feature values within the specified sensory field is calculated as the output. This processing not only maintains the spatial dimension of the feature map but also realizes the down sampling of the features, which is conducive to the network to extract more representative feature information. The number of neurons in the forward-backward LSTM layer of the Bi-LSTM is 100, and the number of neurons in the full-connectivity layer is 80, 40, and 10, respectively.
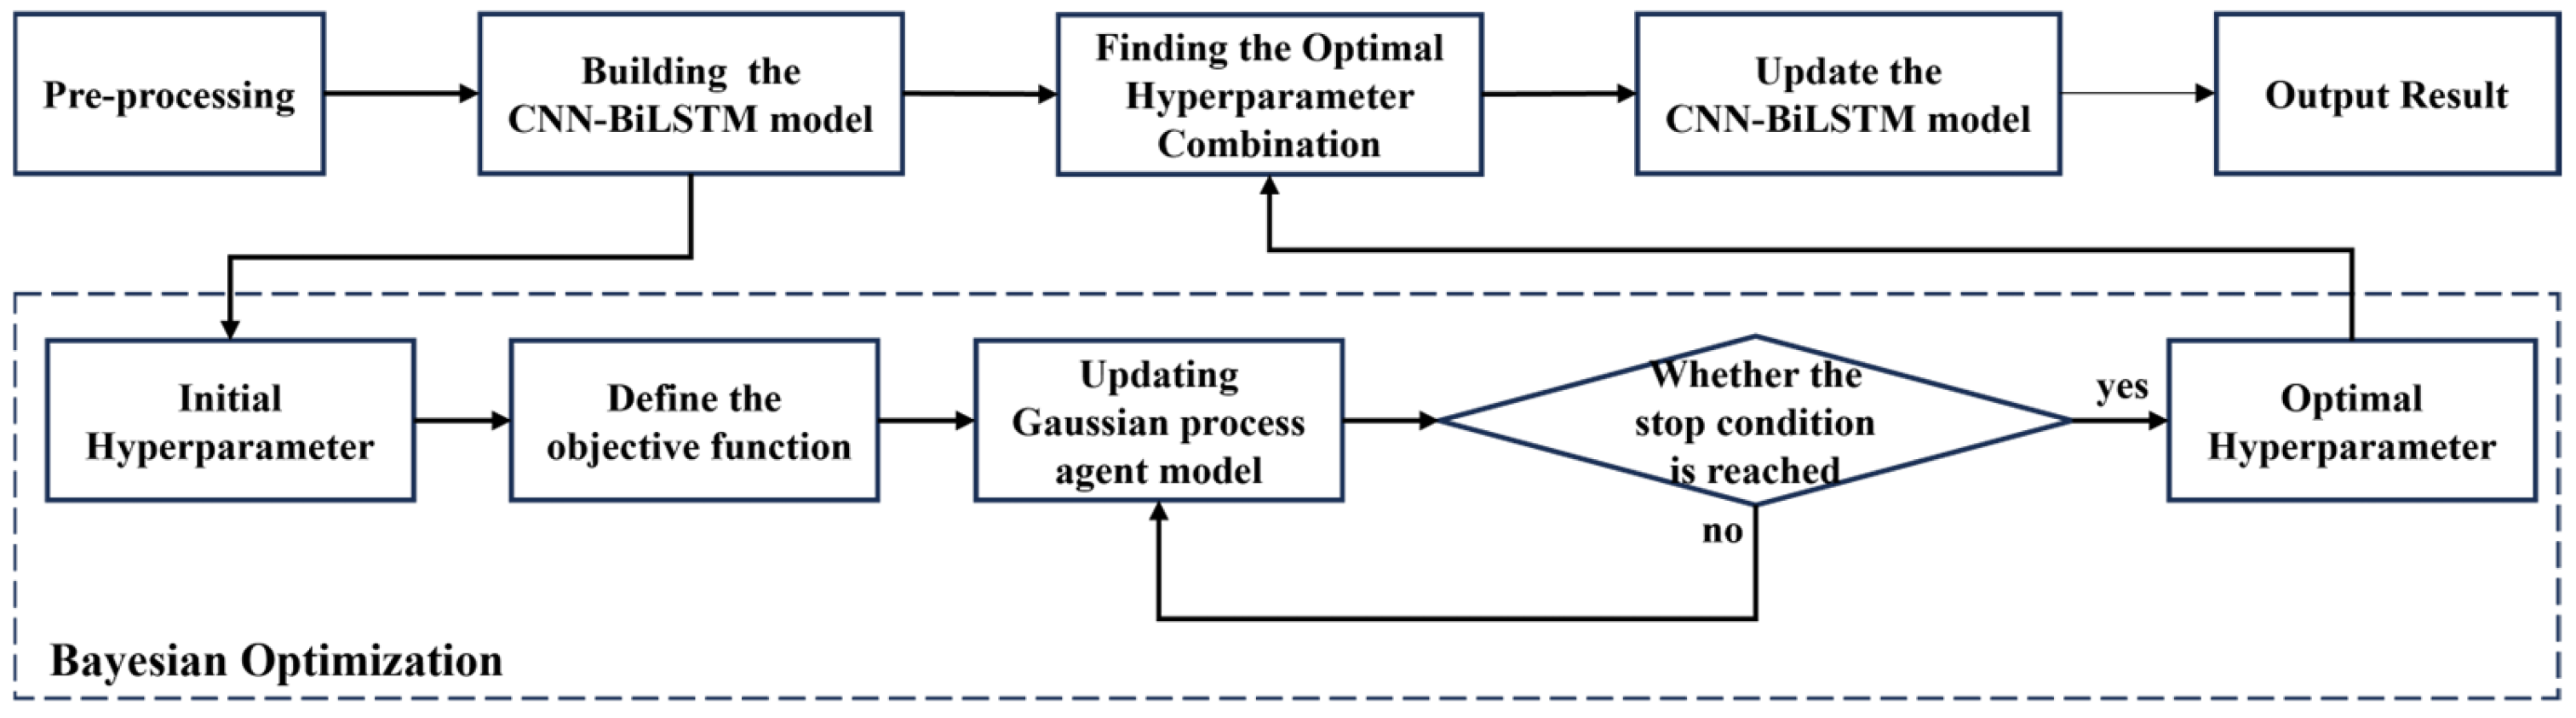
To optimize the hyperparameters of CNN-BiLSTM, we adopt Bayesian optimization, whose time complexity mainly comes from Gaussian process regression and the maximization of the acquisition function. The total complexity of Bayesian optimization is O ( T 3 ) . The time complexity of the CNN part is O ( C 2 ) . The complexity of the Bi-LSTM part is O ( h 2 ) , which dominates the overall computational cost of the model. Future work can further reduce h through pruning to optimize efficiency.
During the optimization of the model in the training and validation sets, the hyper-parameter combinations were tuned using Bayesian optimization, and the specific comparison results are shown in Table 2.
Comparison of the predicted trajectories obtained by BO-CNN-BiLSTM and real vessel trajectories are shown in Figure 11, and it can be visualized that the real trajectory of the vessel almost completely overlaps with the predicted trajectory.
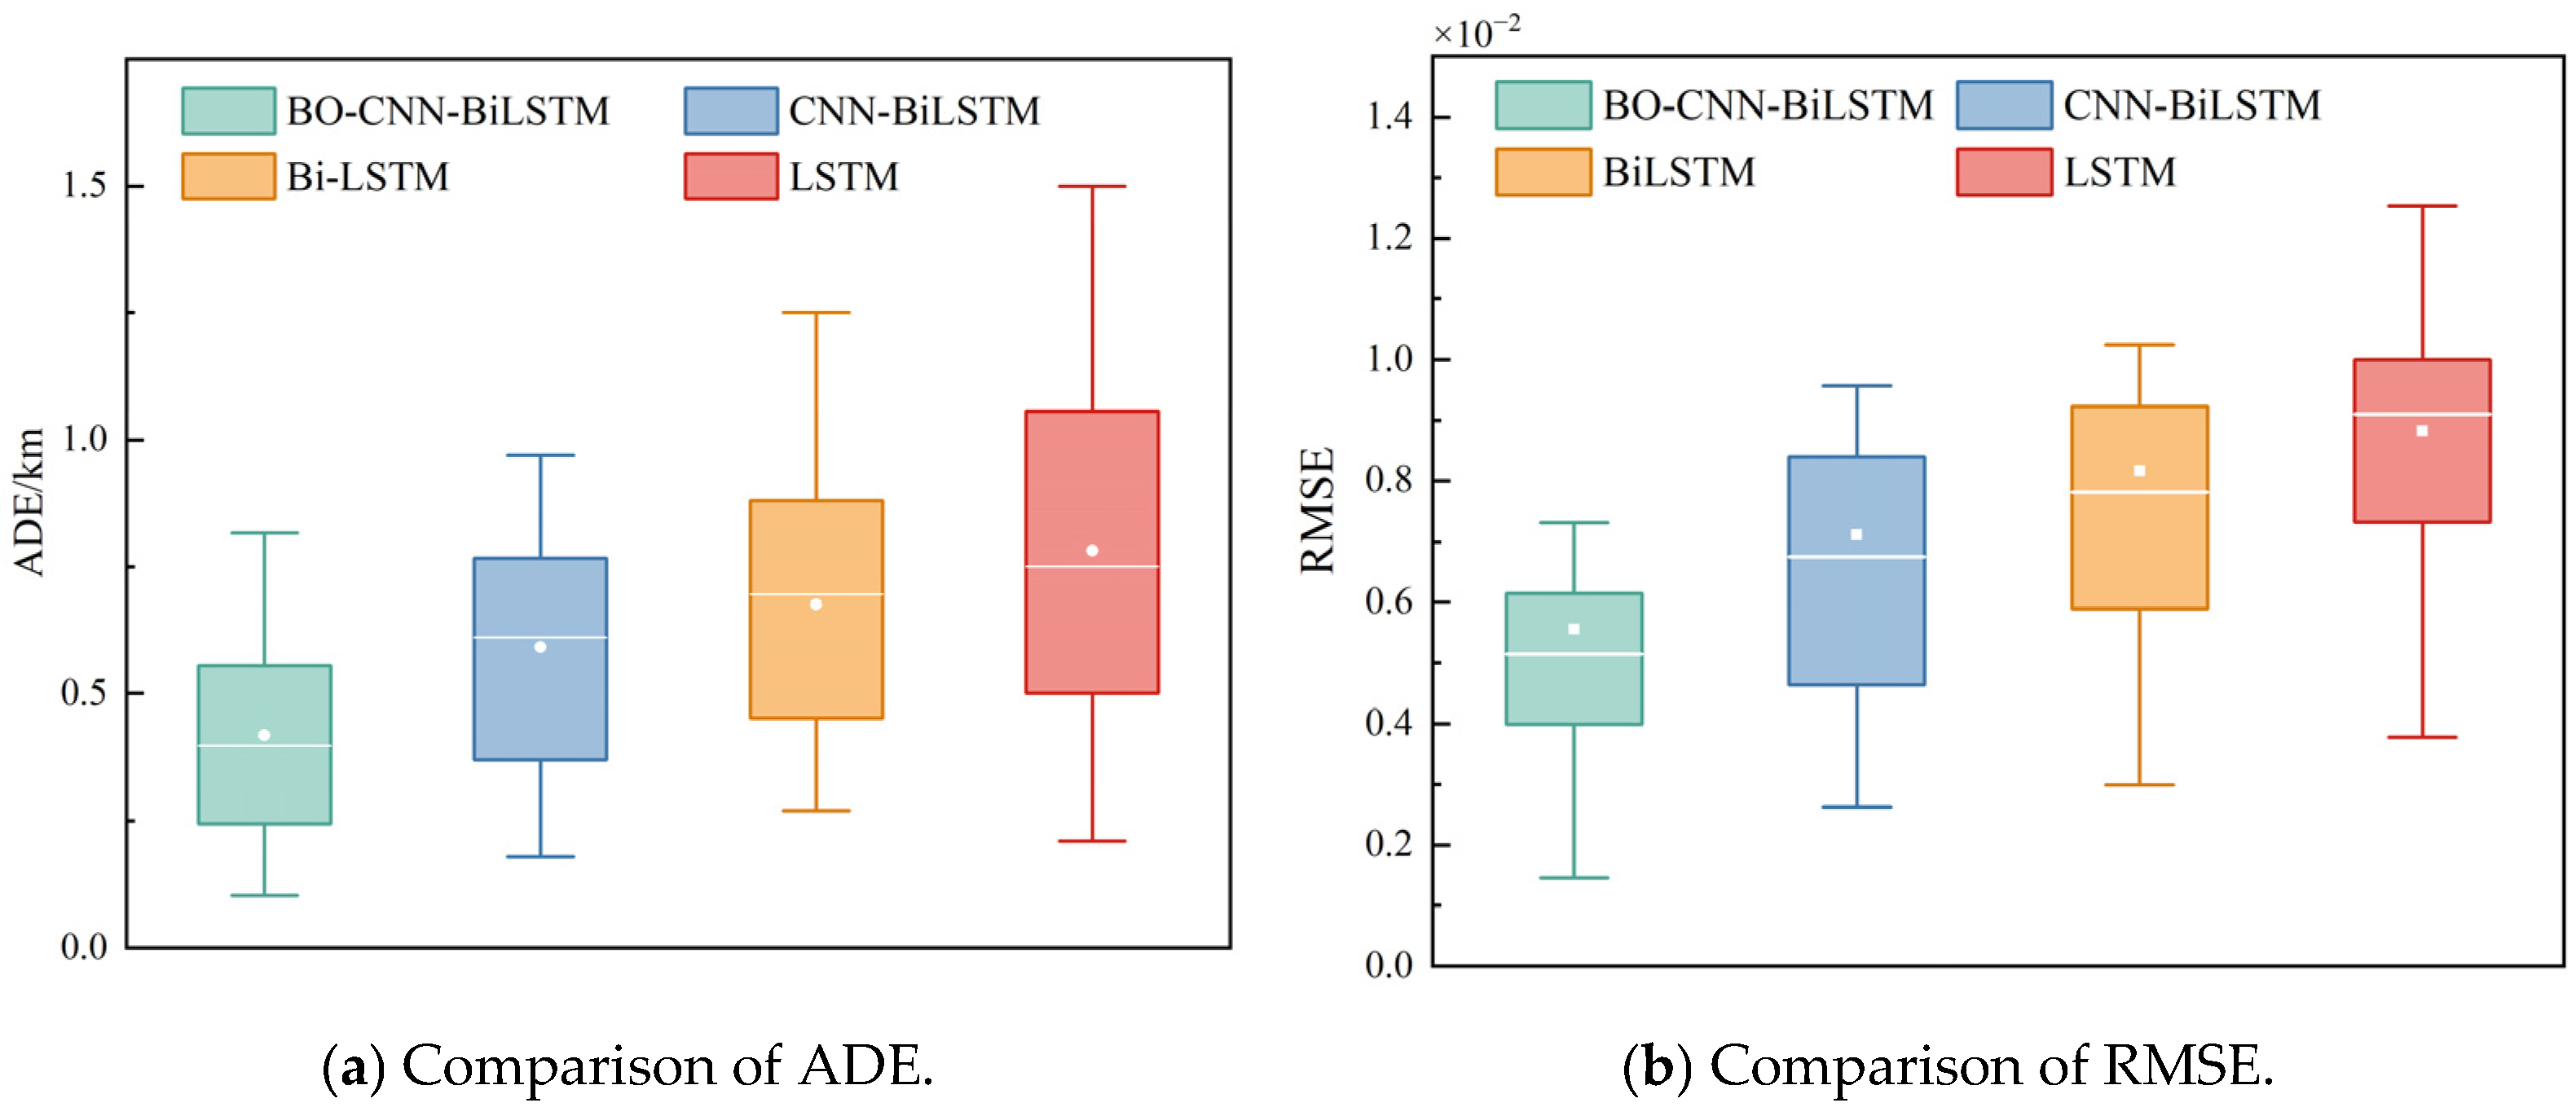
Furthermore, the performance of the BO-CNN-BiLSTM model is evaluated against the CNN-BiLSTM model, the Bi-LSTM model, and the LSTM model [37], as shown in Table 3, Figure 12a,b. The BO-CNN-BiLSTM model shows significant improvements in all three metrics compared to the CNN-BiLSTM algorithm, where the RMSE, Maxerr, and ADE are reduced by 20.77%, 50.36%, and 29.37%. This demonstrates that it can fully utilize the trajectory information extracted from historical trajectories, it has lower performance variance, and effectively improves the trajectory prediction model performance in terms of accuracy and computational efficiency. Moreover, when handling long-term forecasting tasks, it is able to maintain excellent performance.
It can be seen that the proposed BO-CNN-BiLSTM algorithm performs well in the vessel trajectory prediction task, with the smallest average deviation of the prediction results, a narrower range of data distribution, a low degree of discretization, and fewer outliers, which indicates that the model has a high prediction accuracy and stability, and is able to predict the vessel’s trajectory more accurately.
The ten-fold cross-validation method is used to evaluate the performance of the four models. Through cross-validation, the inherent overfitting risk of a single split can be mitigated. The dataset is divided into 10 parts, 9 parts are used as the training set, and 1 part as the testing set for a total of 10 experiments. The average ten-fold cross-validation accuracy of each model is shown in Table 4.
It can be seen from the table that the proposed BO-CNN-BiLSTM has the best performance, and its average accuracy is significantly higher than that of other models. CNN-BiLSTM is secondary, indicating that the combination of CNN feature extraction and Bi-LSTM timing modeling is better than that of a single LSTM. Bi-LSTM is better than LSTM, which verifies the effectiveness of bi-directional structure.

4.3. Routing Protocol Simulation

In this section, to evaluate the performance of the proposed protocol, two enhanced AODV protocols, FL-AODV [38] and EASP-AODV [39], are selected for comparative experimentation. M-MANETs are constructed using the OMNET++ simulation platform. All the network nodes move in the simulation area according to the USV-SGSM model, and the simulation system model only contains the vessel terminal nodes. 
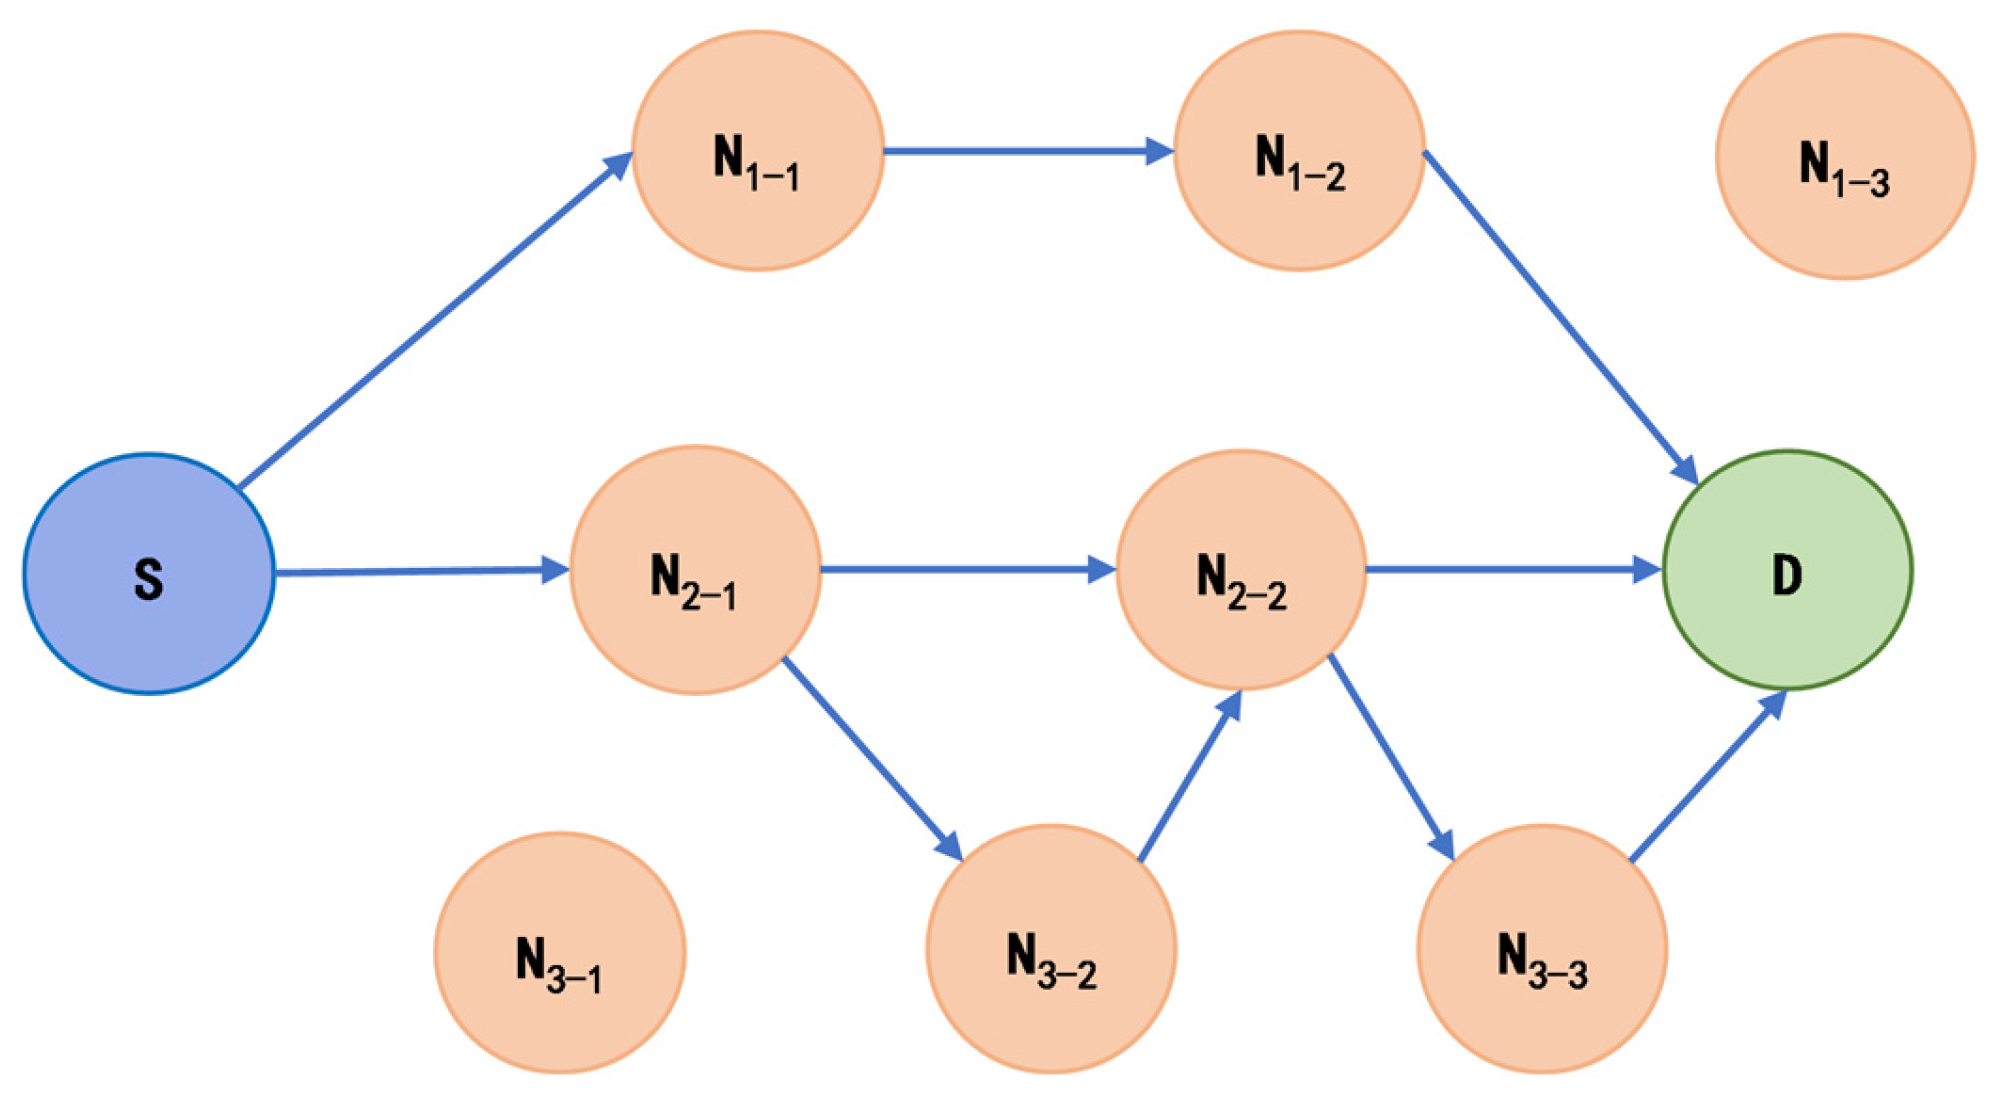
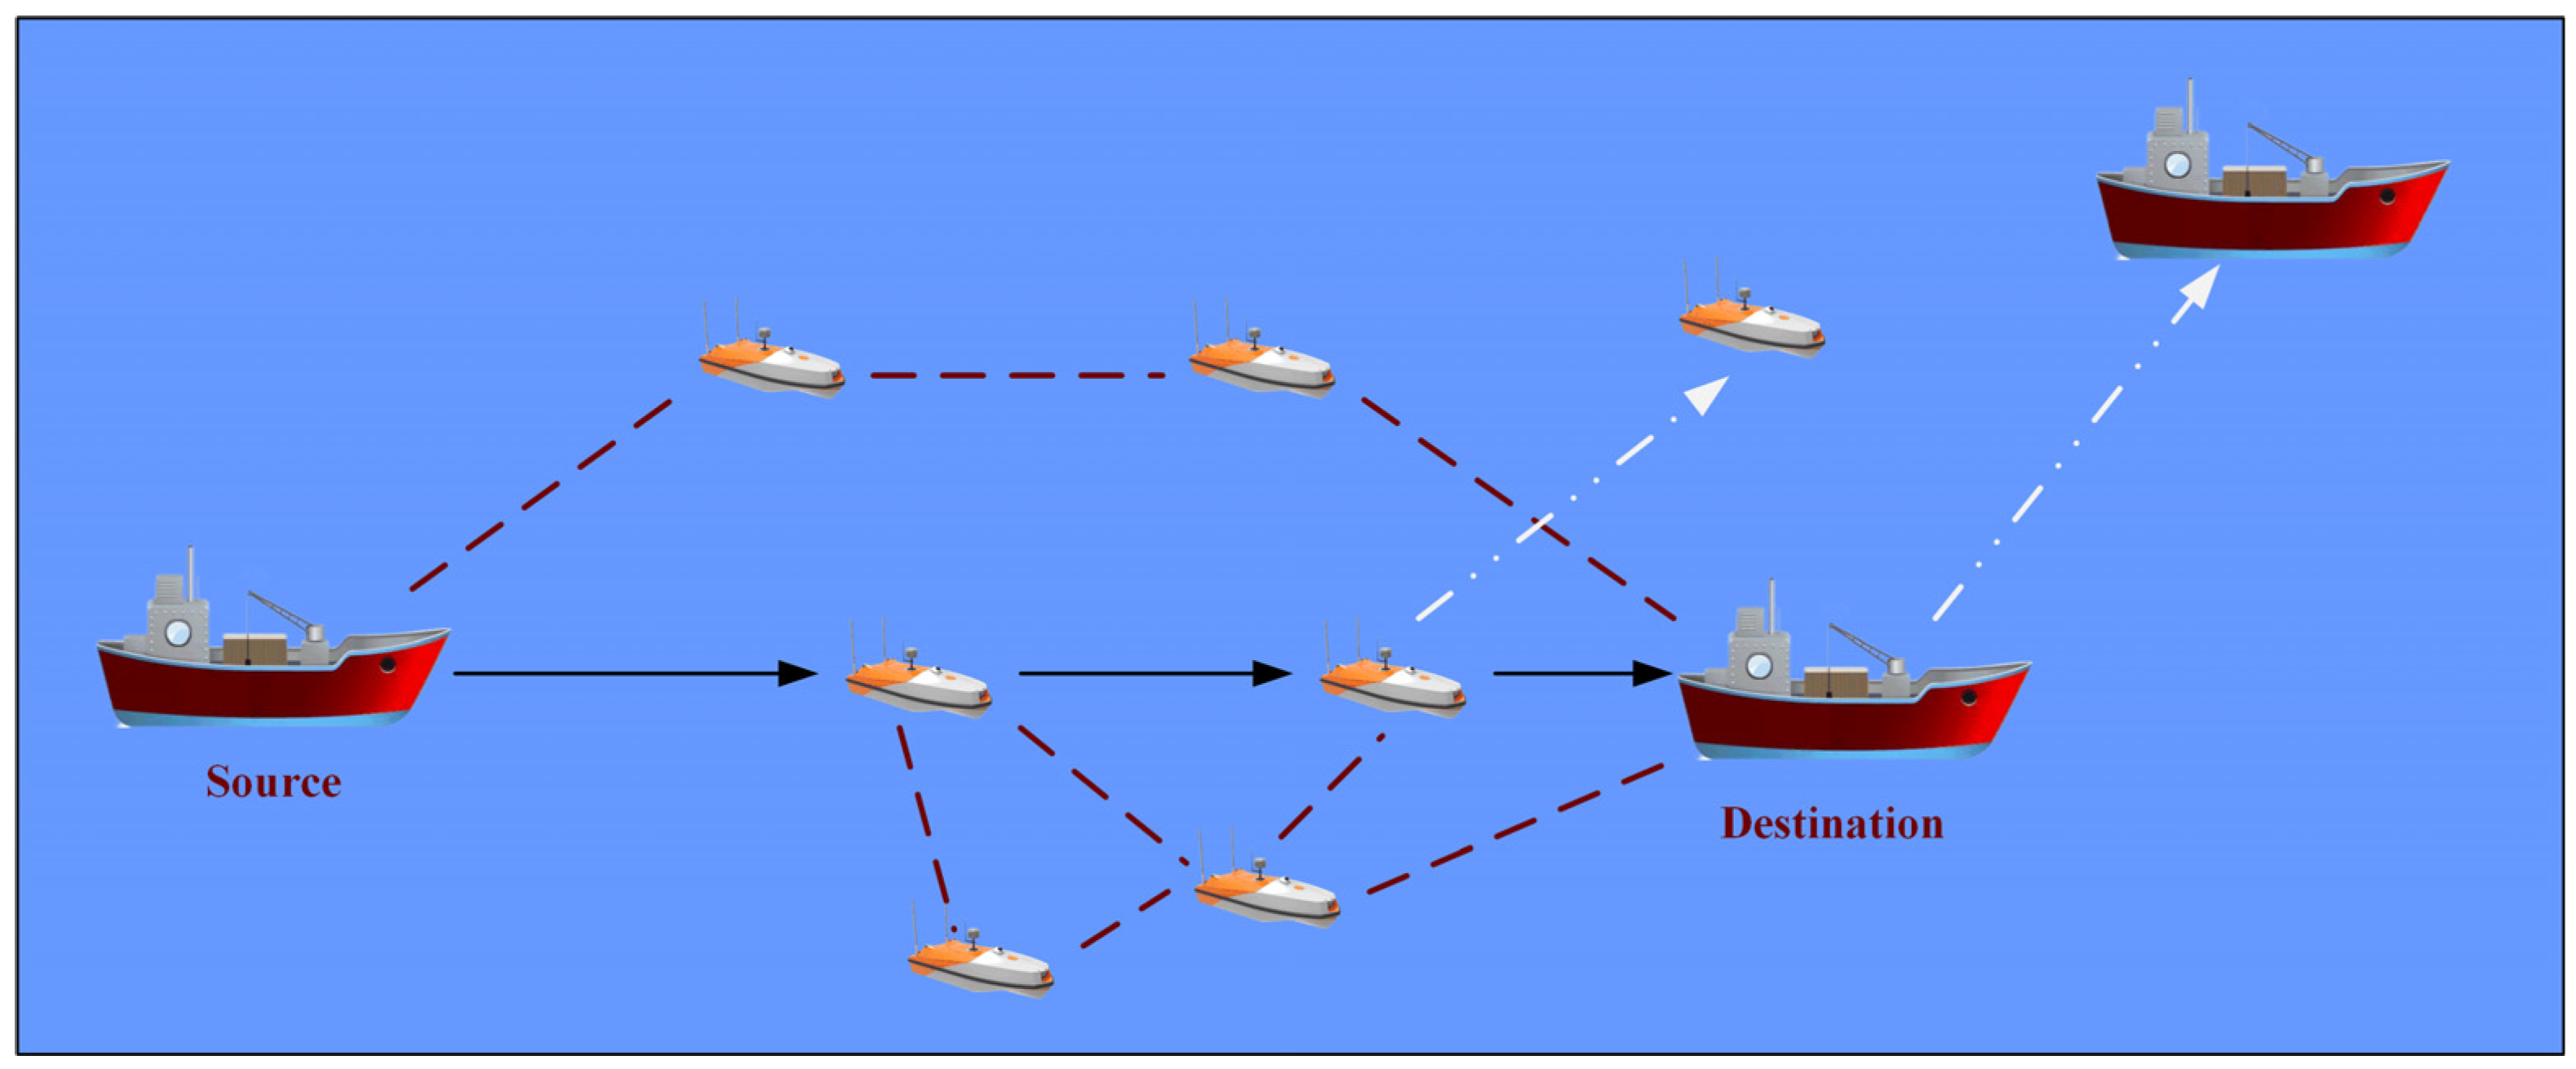
Figure 13 illustrates the M-MANET communication scenario. Multiple potential routing paths exist between the source and destination nodes, depicted by red dashed lines without arrows, while the chosen routing path is indicated by black solid lines with arrows. Taking one USV and the destination node as an example, white dashed lines with arrows are used to represent their directions of movement. In the experiments, USVs are the relay nodes, and the cargo vessels are the source nodes and the destination nodes. Specifically, one cargo vessel acts as the source node, responsible for generating and sending data packets, while another cargo vessel functions as the destination node, receiving the transmitted information. USVs play critical roles in ensuring reliable and efficient communication by relaying signals, particularly in scenarios where direct communication between the source and destination nodes may be hindered by long distances.
Average end-to-end delay, average routing overload, packet delivery rate and network throughput are used to evaluate the performance of routing protocols. For VHF physical layer parameters, we adopted ITU-R M.1842 guidelines for maritime VHF bands. The frequency range is 156–174 MHz, and the propagation models are ITU-R P.1546 for over-water path loss and Rayleigh Fading for small-scale variations.
To ensure the availability of the experimental results, this paper adopts the method of repeating experiments, and each group of simulation experiments is repeated 50 times under the same configuration. Finally, the average value of the results is taken as the final performance evaluation index. The simulation parameters are shown in Table 5.
Figure 14 shows the detailed data interaction log graph between two vessel nodes of M-MANET intercepted in OMNET++ (OMNet++4.6). As shown in the figure, the cargo vessel node 0 first transmits the data packet to the USV nodes 0, 1, and 2, and after USV node 0 successfully receives the data packet and completes the next-hop node selection, it forwards the data packet to USV node 1. Finally, it is sent through the USV node 1 to complete the transmission of the data packet to the cargo vessel node 1.
This paper focuses on the impact of node movement speed and number of nodes on protocol performance. The node movement speed directly affects the degree of dynamic change of the network topology. When the node movement speed is low, the network topology remains relatively stable, while when the node movement speed is high, the network topology will experience frequent dynamic changes. The maximum speeds of USV nodes are set from 5 m/s to 15 m/s, and the packet sending rate is 10 packets/s.

4.3.1. Average End-to-End Delay Comparison

End-to-end delay refers to the average delay time for all data packets from the source node to the final successful reception of the data by the target node, which can be used to analyze the timeliness of routing. This section evaluates the impact of node mobility and network density on the average end-to-end delay of the three routing protocols. Figure 15a demonstrates the comparison of the average end-to-end delay performance of the three routing protocols for different node movement speeds. As can be seen from the figure, the average end-to-end delay of all three protocols shows an increasing trend as the node movement speed increases. This is due to the frequent network topology changes and the corresponding increase in routing maintenance overhead. As topology changes accelerate, AODV-LPRI outperforms the other two protocols, reducing average end-to-end latency by 14.59% compared to the FL-AODV protocol.
Figure 15b shows the comparison of the average end-to-end delay performance of the three routing protocols with different numbers of nodes. As can be seen from the figure, with the increase in node density, the average end-to-end delay of the three routing protocols decreases first and then increases. This is due to the small number of nodes and low density, resulting in poor network connectivity and high latency. As the number of nodes increases, the network becomes more connected, and the latency decreases. However, when too many nodes are added, the network size becomes larger; as more relay nodes are selected during path discovery, the average hop count increases dramatically, resulting in a rapid increase in average end-to-end delay. However, AODV-LPRI preferentially selects routes with high link quality to establish links so that the average end-to-end delay of AODV-LPRI is basically lower than that of the other two protocols.

4.3.2. Average Routing Load Comparison

Routing load refers to the ratio of the number of routing control packets sent by all nodes in the network to the number of data packets received by the destination node, which reflects the degree of network congestion. This section studies the routing load of the three protocols under different mobility and network densities and compares the efficiency and routing stability of the three protocols to balance control packets.
Figure 16a shows the comparison of routing load at different node movement speeds. As the topology changes dynamically, the average routing overhead of all three routing protocols keeps increasing. As the speed of node movement increases, the stability of the link decreases, so more control packet packets are required to assist in the transmission of data packets, resulting in an increase in routing overhead. However, the link availability acknowledgment mechanism is added to the AODV-LPRI protocol to increase the number of control packet packets, so the average routing cost of this protocol is higher than that of EASP-AODV. AODV-LPRI outperforms FL-AODV protocol when topology changes are more frequent. This is because AODV-LPRI establishes available routes through link availability, which reduces the frequency of route reconfiguration and has low maintenance costs.
Figure 16b shows the average routing load for the three routing protocols with different node counts. As can be seen, the average routing load of the three routing protocols increases with the increase in node density. Compared with other routing protocols, AODV-LPRI has a lower routing load. The AODV-LPRI routing protocol uses the nodes with high link availability as the next hop nodes to forward packets instead of selecting all neighbor nodes that can communicate for flood forwarding, which reduces the number of intermediate nodes on the communication link and the number of routing control packets is also reduced. Therefore, the AODV-LPRI protocol has a lower routing load than the other two protocols.

4.3.3. Packet Delivery Fraction Comparison

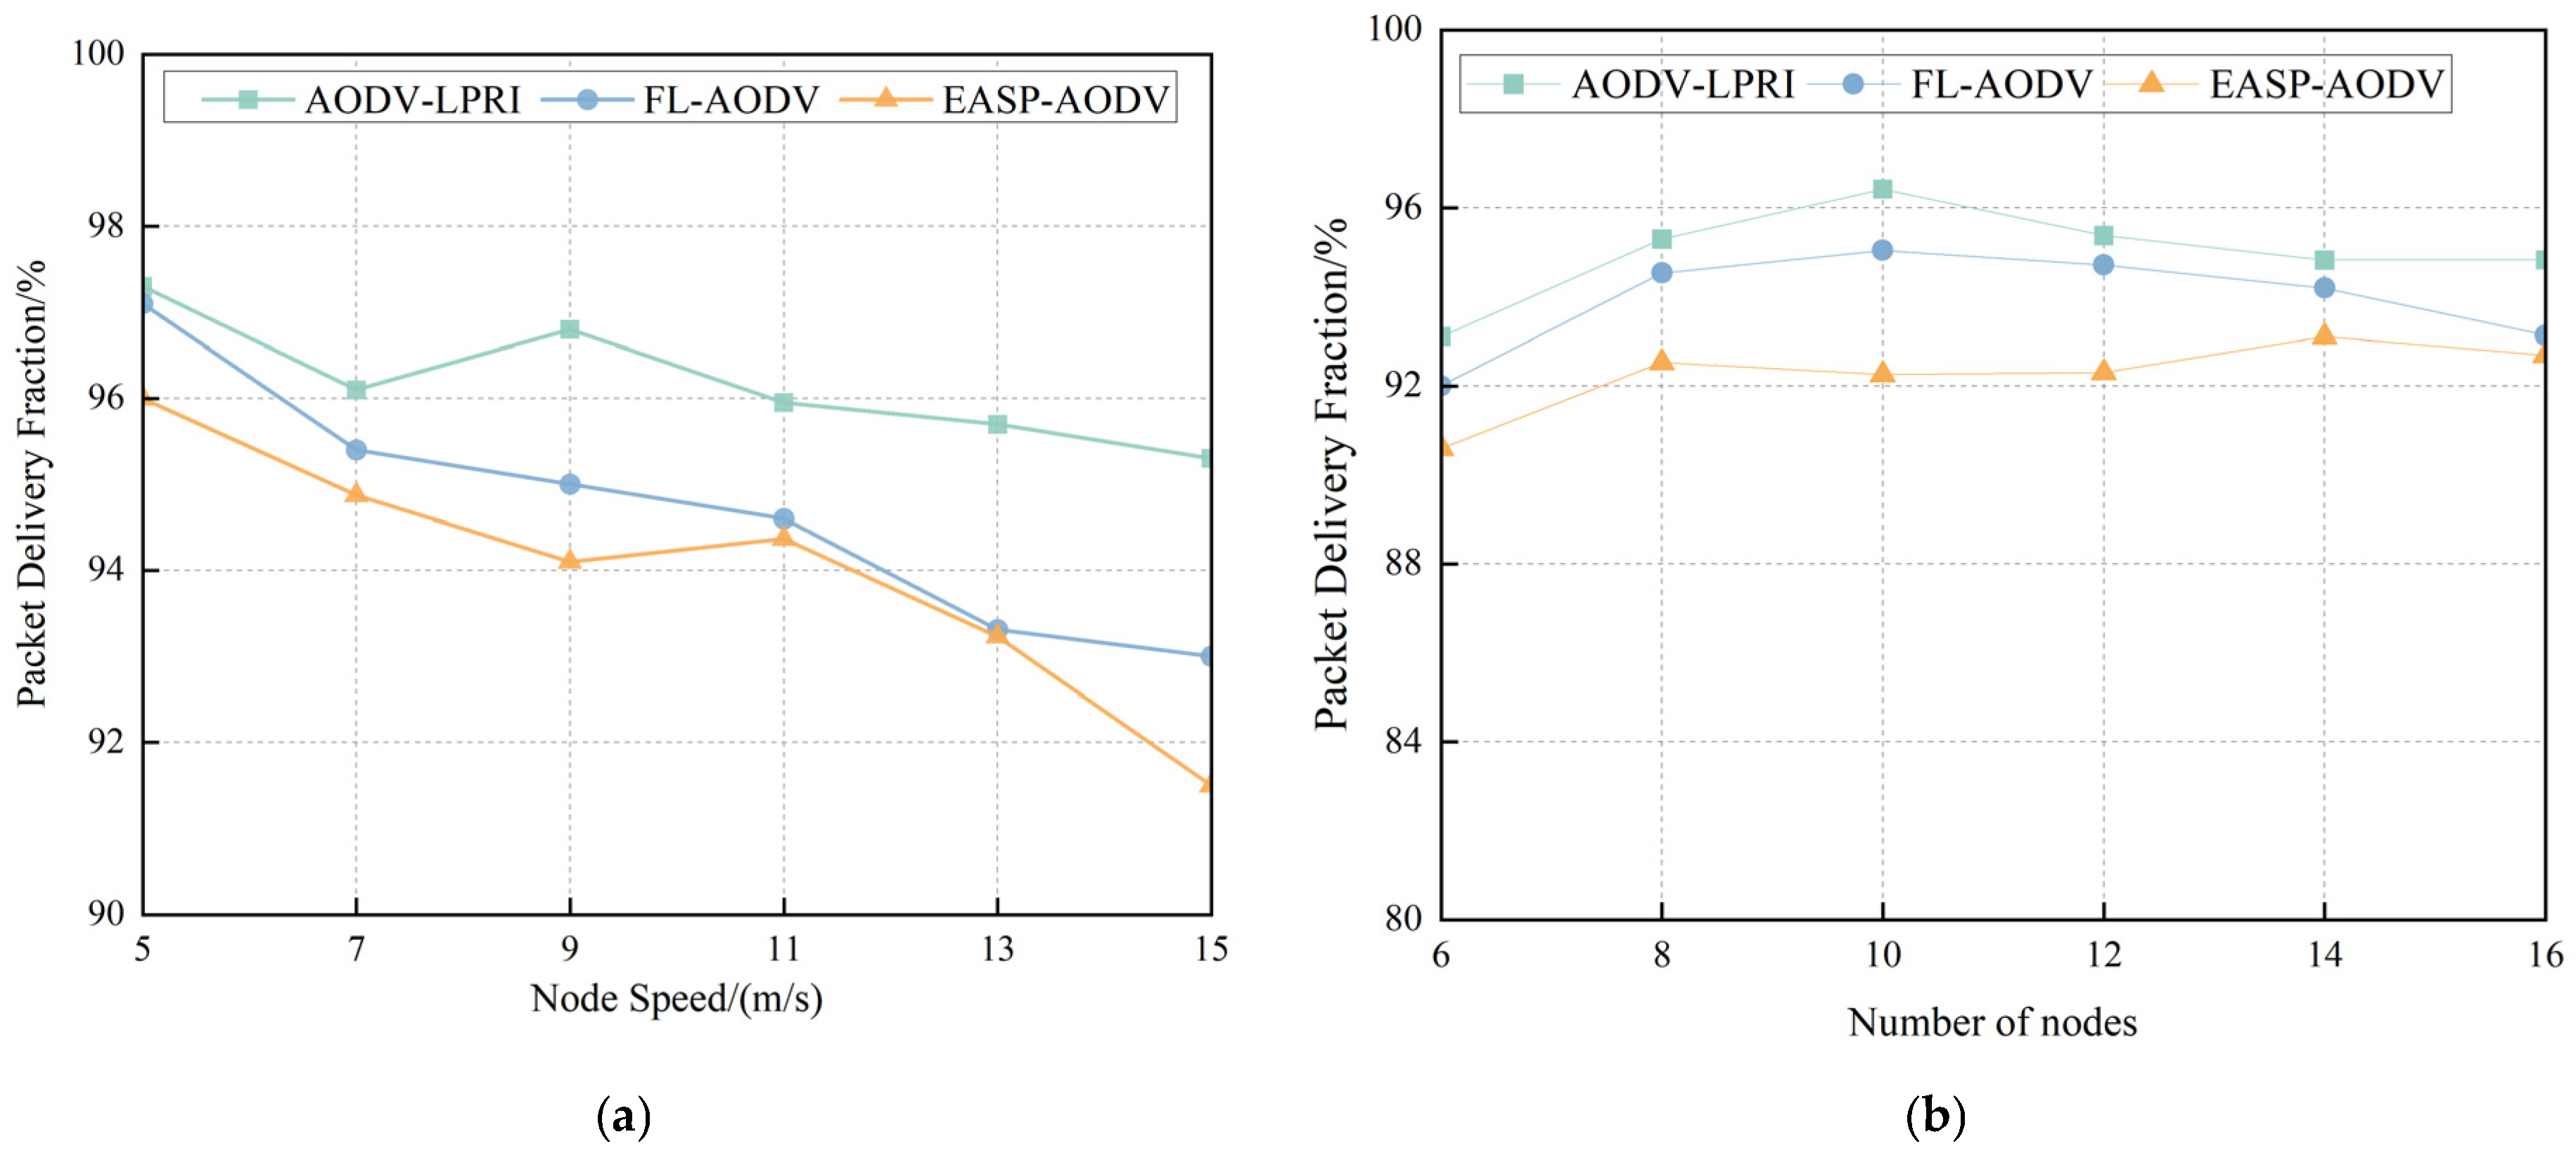
Packet delivery fraction refers to the proportion of packets received over a period of time to the total number of transmissions. The larger the packet delivery fraction, the better the integrity and accuracy of data transmission and the more reliable the network. This section evaluates the reliability of the three routing protocols by analyzing their packet delivery performance at different moving speeds and network densities.
A comparison of the packet delivery fraction performance of the routing protocols under different changes in mobility speed is shown in Figure 17a. Various routing protocols are gradually decreasing as speeds continue to increase. This is because the stability of the communication link decreases with the increase of the movement speed, which increases the probability of packet loss. AODV-LPRI shows better protocol performance by maintaining a relatively high and stable packet delivery rate over the entire range of node mobility speeds, with an average increase of 1.54% over the packet delivery fraction of the FL-AODV protocol. This is because AODV-LPRI selects routes based on the L P R I routing metric with optimal route availability, which can effectively reduce the packet loss caused by route interruption.
Figure 17b shows the packet delivery fraction performance of the three routing protocols at different node counts. It can be seen from the results that the AODV-LPRI protocol has the best performance in packet delivery fraction and is relatively stable.
In M-MANET, the limitation of the AIS communication rate has a certain impact on the packet delivery fraction of various protocols, but it can be seen from the simulation that the AODV-LPRI protocol has the best performance in packet delivery fraction and is relatively stable, with an average delivery rate of about 94.98%. The more nodes, the more intermediate nodes in the communication link from the source to the destination, and the increase in the number of receiving and forwarding packets, the more congested the network becomes and leads to loss of data packets in transmission. By obtaining the link availability of neighboring nodes, the AODV-LPRI protocol determines whether a node can forward packets. Flood forwarding is restricted, so the packet delivery fraction of the AODV-LPRI routing protocol is higher than that of other routing protocols under the same conditions, especially when the density of nodes is large.

4.3.4. Network Throughput Comparison

Throughput refers to the average number of data packet bits received per unit of time by all target nodes in the network, which is used to analyze the pressure that the network can withstand. This section analyzes the impact of node mobility and network density on throughput. Figure 18a demonstrates the network throughput performance comparison at different node movement speeds. It can be observed that the network throughput of the three protocols shows a decreasing state as the node movement speed increases. This is because when the topology changes frequently, the link quality decreases, which directly affects the success rate of packet transmission, thus leading to a decrease in network throughput. However, AODV-LPRI outperformed the other two protocols, with an average 4.43% increase in network throughput compared to the FL-AODV protocol. This performance advantage is due to the fact that AODV-LPRI introduces the link availability evaluation mechanism that monitors the link status in real-time and selects available routes based on L P R I routing metric, which effectively reduces the frequency of routing reconfiguration and improves the packet transmission rate and, thus, the AODV-LPRI can maintain a high network throughput.
Figure 18b illustrates the network throughput of the three routing protocols with different numbers of nodes. With the increase in the number of nodes, the number of nodes in the communication range of a node increases, which means that the number of intermediate nodes in the communication link between the source node and the destination node increases, and the nodes in the communication range need to receive and forward data packets, resulting in the network becoming congested, and the number of data packets successfully transmitted per unit time decreases, so the network throughput of these three protocols first increases and then decreases. However, compared with other routing protocols, the AODV-LPRI routing protocol selects the node with high link availability as the next-hop node to forward packets instead of selecting all neighbor nodes that can communicate for forwarding, which reduces the number of next-hop nodes selected and reduces the congestion degree of the network. Therefore, the AODV-LPRI routing protocol has a larger network throughput than other routing protocols.

4.4. Discussion

The simulation experiments in this section systematically validate the effectiveness of the proposed models and routing metrics. In terms of the mobility model, the proposed USV-SGSM model demonstrates superior performance in simulating real-world vessel movements. Compared with traditional models, it achieves a more reasonable steering radius and significantly longer average link hold time, reducing abrupt trajectory changes and better reflecting the smooth motion characteristics of USVs under marine environmental constraints. This improvement enables more accurate simulation of network topology dynamics in M-MANET.
For vessel trajectory prediction, the proposed BO-CNN-BiLSTM model shows remarkable accuracy and stability. It reduces the RMSE by 20.77%, Maxerr by 50.36%, and ADE by 29.37% compared with the CNN-BiLSTM model. The integration of Bayesian optimization enhances the model’s ability to capture spatiotemporal correlations in trajectories, making it more suitable for predicting the motion patterns of large vessels and providing reliable a priori information for link state estimation.
In routing protocol performance, the proposed AODV-LPRI protocol based on link availability achieves comprehensive optimizations. It reduces the average end-to-end delay by 14.59%, increases the packet delivery fraction by 1.54%, and improves network throughput by 4.43% compared with benchmark methods. The routing metric that integrates link availability effectively mitigates the impact of dynamic topology changes, demonstrating strong adaptability in dynamic maritime scenarios.
Collectively, these results confirm that the proposed framework establishes a tight coupling among mobility modeling, trajectory prediction, and routing metrics design, providing a practical solution for enhancing the stability and efficiency of M-MANET.

5. Conclusions

In this paper, a routing metric for M-MANET is designed. The scheme has four novel aspects. Firstly, in order to better simulate the real movement characteristics of small USV, we propose the USV-SGSM model, which lays the foundation for the node mobility model in the M-MANET simulation. Secondly, we propose a Bayesian optimization-based convolutional Bi-LSTM network, which achieves vessel trajectory prediction using actual vessel movement data and is deployed in the routing algorithm. Thirdly, based on the proposed USV-SGSM model and the communication link lifetime, we put forward a new expression for link availability and further proposed a routing metric based on link availability. Finally, through simulation experiments, we demonstrate the feasibility of the proposed mobility model, the accuracy of the proposed trajectory prediction method, and the effectiveness of the proposed link availability in achieving a more realistic link state assessment. Moreover, based on the new routing metric, more efficient data transmission can be realized in M-MANET.
However, this study only roughly classified the vessels in M-MANET into large and small vessels without fully considering the diversity of ships. In future studies, we will attempt to introduce the mobility models of different types of vessels and incorporate environmental factors such as waves and wind speed into the mobility models.

Author Contributions

Conceptualization, S.H. and Q.H.; methodology, S.H. and T.L.; software, T.L.; validation, S.H.; formal analysis, T.L. and Y.J.; writing—original draft preparation, S.H. and T.L.; writing—review and editing, T.L. and Y.D.; supervision, Y.J. and Q.H.; project administration, F.X.; funding acquisition, S.H. All authors have read and agreed to the published version of the manuscript.

Funding

This work is supported in part by the National Key Research and Development Program of China under Grant No. 2021YFB3901501, and in part by the China Postdoctoral Science Foundation under Grant No. 2021M690504.

Data Availability Statement

The original contributions presented in this study are included in the article. Further inquiries can be directed to the corresponding author.

Conflicts of Interest

The authors declare no conflicts of interest.

Abbreviations

The following abbreviations are used in this manuscript:
ADEaverage displacement error
AODVad hoc on-demand distance vector routing
AODV-LPRIAODV protocol that uses the proposed routing metric LPRI
BO-CNN-BiLSTMBayesian optimized CNN and bi-directional LSTM network
CNNconvolutional neural network
DSRdynamic source routing protocol
FANETflying ad hoc network
GMGauss–Markov
GSMGaussian semi-Markov
HMMhidden Markov model
LAlink availability
LSTMlong short-term memory
Maxerrmaximum absolute error
M-MANETmaritime mobile ad hoc network
ReLUrectified linear unit
RMSEroot mean square error
RWPrandom waypoint
SRMsmooth random mobility
UAVunmanned aerial vehicle
USVunmanned surface vessel
USV-SGSMUSV mobility model based on smooth Gaussian semi-Markov

References

  1. Zheng, Y.; Chin, K.W. On Data Collection in SIC-Capable Space–Air–Ground Integrated IoT Networks. IEEE Syst. J. 2023, 17, 1431–1442. [Google Scholar] [CrossRef]
  2. Dhurandher, S.K.; Obaidat, M.S.; Verma, K.; Gupta, P.; Dhurandher, P. FACES: Friend-Based Ad Hoc Routing Using Challenges to Establish Security in MANETs Systems. IEEE Syst. J. 2011, 5, 176–188. [Google Scholar] [CrossRef]
  3. Wang, X.; Zhang, Y.; Liu, Z.; Wang, S.; Zou, Y. Design of Multi-Modal Ship Mobile Ad Hoc Network under the Guidance of an Autonomous Ship. J. Mar. Sci. Eng. 2023, 11, 962. [Google Scholar] [CrossRef]
  4. Dou, X.; Lyu, T.; Ren, X.; Liang, D. A Non-Orthogonal Modulation Based High Spectral Efficiency and High Security Multi-Carrier Differential Chaos Shift Keying for Maritime Communications. Tsinghua Sci. Technol. 2025, 30, 1079–1095. [Google Scholar] [CrossRef]
  5. Chen, D.; Wen, J.; Dai, H.; Xi, M.; Xiao, S.; Yang, J. Enhancing Transportation Management in Marine Internet of Vessels: A 5G Broadcasting-Centric Framework Leveraging Federated Learning. IEEE Trans. Broadcast. 2024, 70, 1091–1103. [Google Scholar] [CrossRef]
  6. Younes, O.S.; Albalawi, U.A. Analysis of Route Stability in Mobile Multihop Networks Under Random Waypoint Mobility. IEEE Access 2020, 8, 168121–168136. [Google Scholar] [CrossRef]
  7. Li, C.; Du, X.; Tian, X. A Layering Routing Protocol Based on Node Mobility Prediction for Underwater Sensor Networks. IEEE Sens. J. 2023, 23, 31368–31379. [Google Scholar] [CrossRef]
  8. Mboup, D.; Diallo, C.; Cherifi, H. Temporal Networks Based on Human Mobility Models: A Comparative Analysis with Real-World Networks. IEEE Access 2022, 10, 5912–5935. [Google Scholar] [CrossRef]
  9. Li, Z.; Wu, Y. Smooth Mobility and Link Reliability-Based Optimized Link State Routing Scheme for MANETs. IEEE Commun. Lett. 2017, 21, 1529–1532. [Google Scholar] [CrossRef]
  10. Zhang, M.; Cheng, H.; Yang, P.; Dong, C.; Zhao, H.; Wu, Q.; Quek, T.Q.S. Adaptive Routing Design for Flying Ad Hoc Networks: A Joint Prediction Approach. IEEE Trans. Veh. Technol. 2024, 73, 2593–2604. [Google Scholar] [CrossRef]
  11. Ge, L.; Jiang, S. An Efficient Opportunistic Routing Based on Prediction for Nautical Wireless Ad Hoc Networks. J. Mar. Sci. Eng. 2022, 10, 789. [Google Scholar] [CrossRef]
  12. Prasad, S.K.; Sharma, T.; Sharma, V.; Chauhan, S. RSETR: Route Stability Based Energy and Traffic Aware Reactive Routing Protocol for Mobile Ad hoc Network. In Proceedings of the 2022 IEEE Delhi Section Conference (DELCON), New Delhi, India, 11–13 February 2022; pp. 1–9. [Google Scholar]
  13. Dai, Y.; Lyu, L.; Cheng, N.; Sheng, M.; Liu, J.; Wang, X.; Cui, S.; Cai, L.; Shen, X. A Survey of Graph-Based Resource Management in Wireless Networks-Part I: Optimization Approaches. IEEE Trans. Cogn. Commun. Netw. 2024, 1. [Google Scholar] [CrossRef]
  14. Aschenbruck, N.; Gerhards-Padilla, E.; Martini, P. A survey on mobility models for performance analysis in tactical mobile networks. J. Telecommun. Inf. Technol. 2023, 2, 54–61. [Google Scholar] [CrossRef]
  15. Bai, Y.; Yu, D.; Zhang, X.; Chai, M.; Liu, G.; Du, J.; Wang, L. A Deep Learning Approach for Wireless Network Performance Classification Based on UAV Mobility Features. Drones 2023, 7, 377. [Google Scholar] [CrossRef]
  16. Sarmiento, L.; Förster, A. TRAILS mobility model. Simulation 2023, 99, 385–402. [Google Scholar] [CrossRef]
  17. Surobhi, N.A.; Jamalipour, A. A Modified M2M-Based Movement Prediction for Realistic Emergency Environments. In Proceedings of the 2013 IEEE Wireless Communications and Networking Conference (WCNC), Shanghai, China, 7–10 April 2013; pp. 4552–4557. [Google Scholar]
  18. Zhang, X.; Fu, X.; Xiao, Z.; Xu, H.; Qin, Z. Vessel Trajectory Prediction in Maritime Transportation: Current Approaches and Beyond. IEEE Trans. Intell. Transp. Syst. 2022, 23, 19980–19998. [Google Scholar] [CrossRef]
  19. Gao, Z.; Ge, S.; Li, J.; Feng, K. Inertial Navigation Trajectory and Attitude Prediction Based on Improved Hidden Markov Model. In Proceedings of the 2023 IEEE 16th International Conference on Electronic Measurement & Instruments (ICEMI), Harbin, China, 9–11 August 2023; pp. 383–389. [Google Scholar]
  20. Yang, Y.; Liu, Y.; Li, G.R.; Zhang, Z.K.; Liu, Y.B. Harnessing the power of Machine learning for AIS Data-Driven maritime Research: A comprehensive review. Transp. Res. Part E Logist. Transp. Rev. 2024, 183, 103426. [Google Scholar] [CrossRef]
  21. Wang, C.; Han, P.; Zhu, M.; Osen, O.; Zhang, H.; Li, G. AIS Data-Based Hybrid Predictor for Short-Term Ship Trajectory Prediction Considering Uncertainties. IEEE Trans. Intell. Transp. Syst. 2024, 25, 20268–20279. [Google Scholar] [CrossRef]
  22. Capobianco, S.; Millefiori, L.M.; Forti, N.; Braca, P.; Willett, P. Deep Learning Methods for Vessel Trajectory Prediction Based on Recurrent Neural Networks. IEEE Trans. Aerosp. Electron. Syst. 2021, 57, 4329–4346. [Google Scholar] [CrossRef]
  23. Chondrodima, E.; Pelekis, N.; Pikrakis, A.; Theodoridis, Y. An Efficient LSTM Neural Network-Based Framework for Vessel Location Forecasting. IEEE Trans. Intell. Transp. Syst. 2023, 24, 4872–4888. [Google Scholar] [CrossRef]
  24. Li, H.H.; Xing, W.B.; Jiao, H.; Yuen, K.F.; Gao, R.B.; Li, Y.; Matthews, C.; Yang, Z.L. Bi-Directional information Fusion-Driven deep network for ship trajectory prediction in intelligent transportation systems. Transp. Res. Part E Logist. Transp. Rev. 2024, 192, 103770. [Google Scholar] [CrossRef]
  25. Khabbaz, M.; Assi, C.; Sharafeddine, S. Multihop V2U Path Availability Analysis in UAV-Assisted Vehicular Networks. IEEE Internet Things J. 2021, 8, 10745–10754. [Google Scholar] [CrossRef]
  26. Xie, H.; Jiang, S. Maritime Opportunistic Network Routing Strategies for Assessing Link Connectivity Based on Deep Learning. Electronics 2025, 14, 1187. [Google Scholar] [CrossRef]
  27. Hoeft, M.; Gierlowski, K.; Wozniak, J. Wireless Link Selection Methods for Maritime Communication Access Networks—A Deep Learning Approach. Sensors 2023, 23, 400. [Google Scholar] [CrossRef]
  28. Khan, M.U.; Otero, P.; Aamir, M. An Energy Efficient Clustering Routing Protocol Based on Arithmetic Progression for Underwater Acoustic Sensor Networks. IEEE Sens. J. 2024, 24, 6964–6975. [Google Scholar] [CrossRef]
  29. Guaya-Delgado, L.; Pallarès-Segarra, E.; Mezher, A.M.; Forné, J. A novel dynamic reputation-based source routing protocol for mobile ad hoc networks. EURASIP J. Wirel. Commun. Netw. 2019, 77. [Google Scholar] [CrossRef]
  30. Nivedita, V.; Shieh, C.S.; Horng, M.F. An integrated Trust-Based secure routing with intrusion detection for mobile Ad Hoc network using adaptive snow geese optimization algorithm. Ain Shams Eng. J. 2025, 16, 103385. [Google Scholar] [CrossRef]
  31. Goudarzi, F.; Asgari, H.; Al-Raweshidy, H.S. Traffic-Aware VANET Routing for City Environments—A Protocol Based on Ant Colony Optimization. IEEE Syst. J. 2019, 13, 571–581. [Google Scholar] [CrossRef]
  32. Zhang, D.G.; Chen, L.; Zhang, J.; Chen, J.; Zhang, T.; Tang, Y.M.; Qiu, J.N. A Multi-Path Routing Protocol Based on Link Lifetime and Energy Consumption Prediction for Mobile Edge Computing. IEEE Access 2020, 8, 69058–69071. [Google Scholar] [CrossRef]
  33. Rajaram, G.; R S, A.V.; Rajamanickam, D.; Packialatha, A. Node Mobility and Encounter Rate Metrics to Enhance Stability in MANET. In Proceedings of the 2023 Second International Conference on Augmented Intelligence and Sustainable Systems (ICAISS), Trichy, India, 23–25 August 2023; pp. 1413–1417. [Google Scholar]
  34. Jiang, Z.; Zhong, X.; Chen, F.; Yan, S.; Ji, F. Directional Antenna-Based Routing Protocol with Low Detection Probability in Airborne Networks. IEEE Sens. J. 2024, 24, 6919–6929. [Google Scholar] [CrossRef]
  35. Corsi, P.; Jakovlev, S.; Figari, M. Ship maneuverability modeling for Autonomous Navigation. In Proceedings of the 2024 IEEE Workshop on Complexity in Engineering (COMPENG), Florence, Italy, 22–24 July 2024; pp. 1–4. [Google Scholar]
  36. Zhang, B.; Xu, Z.; Zhang, J.; Wu, G. A warning framework for avoiding Vessel-Bridge and Vessel-Vessel collisions based on generative adversarial and Dual-Task networks. Comput. Civ. Infrastruct. Eng. 2022, 37, 629–649. [Google Scholar] [CrossRef]
  37. Wang, M.; Wang, C. Vessel Trajectory Prediction Method Based on LSTM Model. In Proceedings of the 2024 IEEE 2nd International Conference on Sensors, Electronics and Computer Engineering (ICSECE), Jinzhou, China, 29–31 August 2024; pp. 1280–1285. [Google Scholar]
  38. Li, J.; Wang, M.; Zhu, P.; Wang, D.; You, X. Highly Reliable Fuzzy-Logic-Assisted AODV Routing Algorithm for Mobile Ad Hoc Networks. Sensors 2021, 21, 5965. [Google Scholar] [CrossRef] [PubMed]
  39. Legesse, T.; Girmaw, D.W.; Yitayal, E.; Admassu, E. Energy aware stable path ad hoc on-demand distance vector algorithm for extending network lifetime of mobile ad hoc networks. PLoS ONE 2025, 20, e0320897. [Google Scholar] [CrossRef] [PubMed]
Figure 1. The categories of mobility models in mobile ad hoc networks.
Jmse 13 01184 g001
Figure 2. Diagram of the framework.
Jmse 13 01184 g002
Figure 3. Description of vessel’s planar motion.
Jmse 13 01184 g003
Figure 4. Simulation trajectory diagram of cyclotronic motion of the USV.
Jmse 13 01184 g004
Figure 5. Vessel trajectory prediction framework.
Jmse 13 01184 g005
Figure 6. Schematic diagram of vessel trajectory prediction.
Jmse 13 01184 g006
Figure 7. Bayesian optimization flowchart.
Jmse 13 01184 g007
Figure 8. Relative motion model of node.
Jmse 13 01184 g008
Figure 9. M-MANET routing example.
Jmse 13 01184 g009
Figure 10. Comparison of mobility models simulations.
Jmse 13 01184 g010
Figure 11. BO-CNN-BiLSTM Trajectory prediction.
Jmse 13 01184 g011
Figure 12. Comparison of evaluation indicators.
Jmse 13 01184 g012
Figure 13. M-MANET communication scenario.
Jmse 13 01184 g013
Figure 14. Data interaction log.
Jmse 13 01184 g014
Figure 15. Comparison of average end-to-end delay for different node states. (a) Comparison of average end-to-end delay at different node speeds. (b) Comparison of average end-to-end delay for different node counts.
Jmse 13 01184 g015
Figure 16. Comparison of average routing load at different node states. (a) Comparison of average routing load at different node speeds. (b) Comparison of average routing load for different node counts.
Jmse 13 01184 g016
Figure 17. Comparison of packet delivery fraction at different node states. (a) Comparison of packet delivery fraction at different node speeds. (b) Comparison of packet delivery fraction for different node counts.
Jmse 13 01184 g017
Figure 18. Comparison of network throughput at different node states. (a) Comparison of network throughput at different node speeds. (b) Comparison of network throughput for different node counts.
Jmse 13 01184 g018
Table 1. Comparison of mobility model quantization.
Mobility ModelSteering RadiusAverage Link Hold Time
USV-SGSM2.2 m ± 1.1 m 262 s
GSM5.1 m ± 4.3 m178 s
GM7.5 m ± 1.8 m166 s
RWP-60 s
Table 2. Hyperparameter comparison.
HyperparameterCNN-Bi-LSTMBO-CNN-BiLSTM
Learning rate0.010.0077
Convolution kernels<10, 20><15, 25>
Batch_size1612
Hidden cells10080
Epoch200150
Table 3. Comparison of indicators for the assessment of predictive models.
ModelRMSEMaxerrADE
LSTM0.008770.850620.78176
Bi-LSTM0.007960.721820.67538
CNN-BiLSTM0.007320.645560.59194
BO-CNN-BiLSTM0.005800.320450.41809
Table 4. Accuracy value of ten-fold cross-validation in the prediction model.
ModelMinimum Value/10−4Maximum Value/10−4Average/10−4
LSTM0.565912.81648.8342
Bi-LSTM0.36189.25965.0693
CNN-BiLSTM0.25596.51644.1834
BO-CNN-BiLSTM0.14655.27133.4535
Table 5. Simulation parameters.
ParameterSize
Node mobility modelUSV-SGSM
Simulation area100 km × 100 km
MAC transport protocolIEEE 802.11
Transmission rate307.2 kbps
Packet size512 bytes
Timer Duration τ5 s
Link Availability Threshold L R t h 0.57
Communication distance20 km
Routing algorithmAODV-LPRI, FL-AODV, EASP-AODV
The number of USV6, 8, 10, 12, 14, 16
The number of cargo vessel4
Maximum USV nodes speed m/s5, 7, 9, 11, 13, 15
The speed of cargo vesselBased on the proposed trajectory prediction model
Communication time500 s
Disclaimer/Publisher’s Note: The statements, opinions and data contained in all publications are solely those of the individual author(s) and contributor(s) and not of MDPI and/or the editor(s). MDPI and/or the editor(s) disclaim responsibility for any injury to people or property resulting from any ideas, methods, instructions or products referred to in the content.

