Abstract
Ship weather routing is heavily dependent on weather forecasts. However, the predictive nature of meteorological models introduces an unavoidable level of uncertainty which, if not accounted for, can compromise navigational safety, operational efficiency, and environmental impact. This study examines the temporal degradation of forecast accuracy across certain oceanographic and atmospheric variables, using a six-month dataset for the area of North Atlantic provided by the National Oceanic and Atmospheric Administration (NOAA). The analysis reveals distinct variable-specific uncertainty trends with wind speed forecasts exhibiting significant temporal fluctuation (RMSE increasing from 0.5 to 4.0 m/s), while significant wave height forecasts degrade in a more stable and predictable pattern (from 0.2 to 0.9 m). Confidence intervals also exhibit non-monotonic evolution, narrowing by up to 15% between 96–120-h lead times. To address these dynamics, a Python-based framework combines distribution-based modeling with calibrated confidence intervals to generate uncertainty bounds that evolve with forecast lead time (R2 = 0.87–0.93). This allows uncertainty to be quantified not as a static estimate, but as a function sensitive to both variable type and prediction horizon. When integrated into routing algorithms, such representations allow for route planning strategies that are not only more reflective of real-world meteorological limitations but also more robust to evolving weather conditions, demonstrated by a 3–7% increase in travel time in exchange for improved safety margins across eight test cases.
1. Introduction
The maritime industry is under growing pressure to align its operations with global environmental and safety standards. The International Maritime Organization’s ambitious 2023 strategy targets a 20% reduction in greenhouse gas emissions by 2030 (striving for 30%) and 70% by 2040 (striving for 80%) compared to 2008 levels, alongside a 40% reduction in carbon intensity (CO2 emissions per transport work) by 2030 [1]. Weather routing aligns with the IMO’s short-term measures, such as the Energy Efficiency Existing Ship Index (EEXI) and Carbon Intensity Indicator (CII) regulations, making it an increasingly relevant strategy for achieving compliance and reducing emissions. Modern ship weather routing systems aim to simultaneously reduce fuel consumption, limit voyage time, enhance crew safety, and mitigate environmental impact [2,3]. However, their effectiveness is fundamentally dependent on the accuracy and temporal resolution of weather forecasts, which are inherently uncertain [2,4,5]. Weather forecast uncertainty, which becomes increasingly pronounced beyond 72 h, presents a major operational blind spot. This is noticeable and important for transoceanic routes, where ship-routing decisions must be made early in the voyage planning phase, often with still incomplete information about future weather conditions.
Ensemble Prediction Systems (EPSs) have been introduced as a way to unify forecast uncertainty through multiple model realizations with slightly perturbed initial conditions [6,7,8,9]. These systems offer probabilistic insight into both forecast confidence and the probability of extreme events. As highlighted in [10], despite this recognition, ensemble forecasts are frequently post-processed or reduced to deterministic averages before being integrated into ship-routing algorithms. As a result, the probabilistic nature of weather is often unaccounted for [10,11]. Subsequently, routing decisions are made under the assumption of fixed environmental conditions, thus ignoring the time-dependent and variable-specific nature of forecast degradation [8,12].
A number of approaches to ship route optimization have attempted to incorporate uncertainty into routing algorithms and decision-making, detailed in [12]. However, these methods often exhibit significant limitations in their treatment of forecast uncertainty. Recent advances include multicriteria weather routing with fuzzy logic to handle uncertain conditions [13] and the VISIR framework for least-time routing [14,15]. While these approaches acknowledge uncertainty, they primarily focus on immediate routing decisions without considering how forecast reliability degrades over extended time horizons. Similarly, probabilistic roadmap algorithms (PRM) [16] and various optimization methods, including dynamic programming [17], improved A* algorithms [18], and multi-objective ant colony optimization [19], treat uncertainty as a static parameter rather than a time-evolving function. Studies on fuel consumption uncertainty [4,5] have demonstrated significant differences between probabilistic and deterministic approaches. However, these works typically apply uniform uncertainty bounds across all meteorological variables, ignoring the distinct degradation patterns of wind, wave, and other parameters. This limitation is particularly problematic given that forecast error growth is not strictly monotonic but often stabilizes or fluctuates due to model tuning and atmospheric dynamics [8]. Recent advances in machine learning and generative modeling have further demonstrated potential for enhanced environmental prediction and marine object detection under adverse conditions [20,21], suggesting potential research directions for uncertainty-aware navigation systems.
Speed optimization research has made progress in specific contexts, such as offshore supply vessels [22] and learning-based Pareto optimization [11]. Adaptive strategies for vessels with wind propulsion [23] have provided insights into stochastic wind variability. Even so, these studies remain focused on single variables or specific vessel types, lacking a comprehensive framework that captures cross-variable uncertainty relationships and their evolution over forecast horizons. The choice between deterministic and ensemble forecasts significantly impacts optimization outcomes [24], and next-generation routing systems must incorporate uncertainty quantification [25]. Despite this recognition, the existing literature lacks systematic characterization of how different meteorological variables exhibit distinct uncertainty patterns. Wave height predictions were found to typically exhibit more consistent behavior compared to the volatile behavior of wind speed forecasts that are highly sensitive to spatial and temporal dynamics [26,27], but current routing methods fail to exploit these variable-specific characteristics in their uncertainty models. Climate-sensitive regions present additional challenges [28], and recent parametric post-processing frameworks [29] enhance ensemble forecast functionality. To date, these advancements have not been integrated into a unified uncertainty model that dynamically adjusts to both spatial and temporal variations in forecast reliability.
The evolution of numerical weather prediction has undergone what can be described as a “quiet revolution” [26], dramatically improving forecast reliability. However, this improvement is not uniform across all variables or forecast horizons. Recent breakthroughs in AI-based weather forecasting from organizations such as Google DeepMind (GraphCast), Huawei (Pangu-Weather), and NVIDIA (FourCastNet) have demonstrated comparable accuracy to traditional numerical weather prediction systems like ECMWF and NOAA while reducing computation time from hours to minutes or even seconds [30,31]. This acceleration in forecast generation enables more dynamic ship-routing strategies, allowing vessels to update their routes more frequently during voyages as new weather predictions become available [32]. Research on uncertainties in ship speed loss evaluation under real weather conditions [33] has shown that proper understanding of forecast reliability is crucial for accurate performance prediction. This continues the earlier work examining fuel consumption and CO2 emissions in realistic seaway conditions [34,35] and coupling voyage and weather data to estimate speed loss [36]. Similarly, the benefits of speed reduction under different weather conditions were assessed [37], confirming that uncertainty in weather forecasts significantly impacts the expected fuel savings.
It was established that forecast error growth is not strictly monotonic (i.e., not consistently increasing with forecast lead time) but often stabilizes or fluctuates due to model tuning and data assimilation cycles [8], creating a complex uncertainty landscape that surpasses simple characterization. For instance, the need for robust navigational decision-making methods that can accommodate uncertainty in inland waterways is emphasized [38], while traditional routing approaches like Dijkstra’s algorithm [39] require adaptation to incorporate probabilistic information.
This study addresses these limitations by developing a comprehensive framework that quantifies weather forecast uncertainty across multiple dimensions, characterizes variable-specific degradation patterns, and demonstrates their practical integration into ship-routing optimization. By identifying and exploiting non-monotonic, anomalous patterns in forecast uncertainty evolution, a practical methodology is presented that characterizes uncertainty as a dynamic function sensitive to both variable type and forecast horizon. Rather than replacing existing systems, this approach enhances them by incorporating variable-specific, time-evolving uncertainty profiles that, in turn, enable more robust routing strategies. This addresses the challenge discussed in [40], regarding the need for more sophisticated integration of weather forecast services in ship routing, while supporting the broader goals of sustainable and safe marine transportation. The resulting framework provides a data-driven foundation for more resilient decision-making in the unpredictable ocean environment.
2. Materials and Methods
2.1. Data Collection and Preprocessing
An automated data collection system was used to download and organize gridded binary (GRIB2) format files from NOAA’s public forecast archives, covering six months in the winter period from October to March. Weather forecasts were retrieved at four daily cycles (00, 06, 12, and 18 UTC), with forecast horizons extending to 168 h in 3 h intervals. The raw data were obtained from NOAA at their operational 0.25° × 0.25° latitude–longitude grid resolution and subset to cover the North Atlantic area (30° N–65° N, 80° W–10° E) to ensure spatial consistency. Multiple forecasts valid for identical temporal points were assembled into pseudo-ensembles. For example, a 48 h forecast initialized at 00 UTC on January 1st and a 24 h forecast initialized at 00 UTC on January 2nd both predict conditions for 00 UTC on January 3rd. By collecting all such forecasts targeting the same valid time but initialized at different times, we created pseudo-ensemble datasets that enable statistical analysis of forecast uncertainty without requiring operational ensemble prediction system data. The number of pseudo-ensemble members varied depending on the target valid time and data availability. A minimum of 3 forecasts was required for the analysis, with typical ensemble sizes ranging from 3 to 30 members. When more than 30 forecasts were available for a single valid time, a random sample of 30 was selected to maintain computational efficiency. This approach provided sufficient statistical robustness while keeping processing times manageable for the six-month dataset. In addition, temporal smoothing was applied using a 12 h moving average filter to remove high-frequency forecast variations. This filtering eliminated short-term fluctuations (<12 h) that could trigger unnecessary course corrections while preserving synoptic-scale weather patterns (>24 h) relevant for strategic routing decisions. For final implementation into the optimization system, substantial meteorological trends are thus able to be considered, rather than short-term variations.
The data were processed using Python 3.13.5, including scientific and geospatial libraries. Decoding files from the GRIB2 format was handled using cfgrib, eccodes, xarray and numpy. For statistical modeling and distribution fitting, scipy.stats was used with additional imports such as statsmodels for regression analysis and sklearn.metrics for scoring model performance. Confidence intervals and continuous ranked probability scores (CRPSs) were calculated using custom formulas alongside scikit-learn and properscoring. The pandas library was utilized for data organization and batch processing, while visualizations of results, distributions, and spatial maps were carried out using matplotlib, seaborn, and cartopy for georeferenced plotting.
2.2. Statistical Methods and Metrics
For describing and evaluating the reliability of weather forecasts, temporal degradation, systematic bias, and probabilistic variability were quantified for each variable. This analysis focused on three primary meteorological variables of relevance for ship routing: wind speed at 10 m, significant wave height and primary wave mean period. These variables were selected based on their direct impact on ship performance and their availability across all forecast horizons in the NOAA GFS dataset. A systematic comparison was made between forecasts of various horizons using the shortest available lead time forecast (typically 6–24 h) as the reference dataset. This approach, commonly used in forecast verification when observations are sparse over oceanic regions, assumes that short-range forecasts provide the most accurate representation of actual conditions. For each valid time with multiple available forecasts (e.g., 24 h, 48 h, 72 h, and 96 h forecasts all targeting the same moment), the shortest lead time forecast served as the reference against which longer-range forecasts were evaluated. For each meteorological variable, forecasts ranging from 24 to 168 h were evaluated against the reference dataset, representing the most accurate available estimate of actual conditions. Following the approach outlined in Buizza and Leutbecher [8], the Root Mean Square Error (RMSE) was calculated:
where represents the forecasted value at grid point for lead time after the initial conditions, and is the corresponding (reference) analysis value at the same valid time , while is the total number of grid points within the North Atlantic region. In addition to RMSE, the Mean Absolute Error (MAE) was also calculated to ensure a more robust measure less sensitive to outliers.
The temporal evolution of forecast errors was modeled following the theoretical basis established in [41]:
where is the forecast error at lead time t, α represents the error growth rate, and β is the initial error magnitude. This relationship was then linearized through logarithmic transformation:
where is the forecast lead time. The coefficient of determination () was also used to assess how well this exponential model captures the temporal degradation patterns for each chosen variable. Thus, R2 was computed through linear regression analysis:
where is the covariance between forecast lead time and log-transformed error, and and are their respective standard deviations [42]. For this part, SciPy’s stats.linregress function was used, with handling of non-finite values to ensure statistical validity.
Forecast bias, which is actually the systematic difference between forecasted and observed values, was computed for each chosen variable and lead time using the approach described in [42]:
Unlike random errors that cancel out with increased sampling, biases correspond to systematic model tendencies that can significantly impact routing decisions if left uncorrected. Following the methodology in [43], bias patterns were analyzed across different forecast horizons to identify temporal trends in systematic errors for the chosen variables. Furthermore, empirical distributions of forecast errors were fitted into several probability distributions, including Normal, Lognormal, Weibull, Gamma, and Generalized Extreme Value (GEV) (as visualized in Section 3.3). The goodness-of-fit was assessed using the Sum of Squared Errors (SSEs) between empirical histograms and theoretical probability density functions:
where is the height of the normalized histogram at bin i, and is the value of the theoretical probability density function interpolated to the center of bin i. The bins are the intervals into which data are divided when creating a frequency distribution.
For each variable and forecast lead time, the distribution with the lowest SSE was selected as the best representation of uncertainty. This approach allowed for non-Gaussian error characteristics to be accurately captured, addressing the limitations of traditional normal distribution assumptions [44]. Mean, standard deviation, skewness, and kurtosis were calculated to provide comprehensive distribution shapes and their growth with forecast lead time.
Distribution parameters were estimated using maximum likelihood methods through SciPy’s statistical functions. For the GEV distribution, the shape (ξ), location (μ), and scale (σ) parameters were determined by optimizing the log-likelihood function against empirical data. Regarding confidence intervals, two complementary approaches were used to calculate these intervals for forecast variables, following the methodological framework in [42]. Firstly, parametric confidence intervals were calculated, based on normal distribution assumptions:
where notes the mean forecast value, is the standard deviation, and is the z-score corresponding to the desired confidence level (e.g., 1.96 for 95% confidence). Secondly, non-parametric, percentile-based confidence intervals were calculated directly from the empirical distribution:
where represents the i-th ordered statistic, n is the sample size, and p1, p2 define the lower and upper percentile bounds (e.g., 0.025 and 0.975 for a 95% interval). Confidence intervals were calculated at multiple probability levels (50%, 67%, 80%, 90%, 95%, and 99%) for each variable and forecast lead time.
To evaluate the probabilistic skill of forecasts, the continuous ranked probability score (CRPS) was used, which measures the integrated squared difference between the cumulative distribution function of the forecast and the step function corresponding to the observation in [45,46]. For ensemble forecasts, CRPS can be computed as per [46]:
where xi and xj are ensemble members, and n is the ensemble size. This metric integrates both sharpness (narrowness of prediction intervals) and calibration (statistical consistency with observations), thus making it a comprehensive measure of forecast skill. Lower CRPS values indicate better forecast performance, with a theoretical minimum of zero for a perfect deterministic forecast. CRPS was calculated for each chosen variable across different lead times, enabling quantitative comparison of forecast skill degradation patterns.
Finally, for consideration of safety in ship routing, the upper tail of forecast distributions is particularly important. Following the methodology in [47], extreme value analysis was performed by fitting the Generalized Extreme Value (GEV) distribution to the upper decile (top 10%) of the forecast values:
where is the location parameter, is the scale parameter, and ξ is the shape parameter determining the tail behavior. The GEV distribution parameters were estimated using maximum likelihood methods, which made generating level plots that relate event magnitude to return periods possible.
2.3. Weather Forecasting Uncertainty Model
The statistical analyses described in the previous subsection, and the results from the following subsections, were merged and implemented into a comprehensive computational framework to quantify weather forecast uncertainty across multiple dimensions. A comprehensive flowchart for this framework can be found in Figure 1, depicting data collection, processing and analysis. The framework consists of five principal components, including temporal uncertainty evolution, systematic bias correction, spatial uncertainty modulation, cross-variable correlation structure and probabilistic distribution modeling.
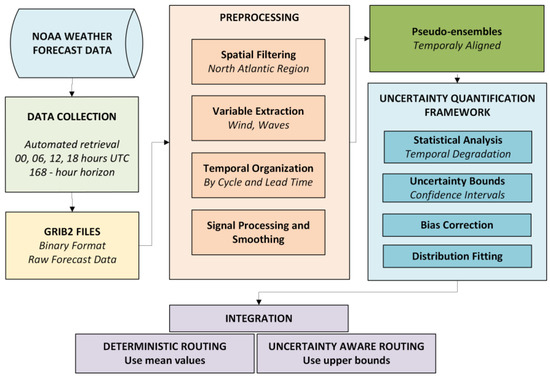
Figure 1.
Weather forecast uncertainty quantification process prior to integration into ship route optimization.
Following [8], variable specific temporal degradation is modeled using an exponential function:
where is the uncertainty for variable v at lead time t, is the baseline uncertainty from the analysis, and and are variable specific coefficients, determined through regression (with R2 = 0.87–0.93). The non-linear evolution accurately captures predictability limits as discussed by Lorenz [41]. Systematic biases, as characterized in Section 3.2, are corrected through a bias adjustment following [43]:
where is the empirically derived bias function. For wind speed, a bias model based on [44] is applied:
To account for spatial heterogeneity in forecast reliability [27], regional scaling functions were introduced. Confidence intervals were generated following [42], while GEV distribution was used for extreme behavior with bounded upper tails , as per the analysis.
The weather uncertainty model was integrated into the ship-routing model in two ways, making a distinction between deterministic and uncertainty-aware routes. The difference is in how weather parameters are evaluated. For deterministic routes, the mean forecasted values are used directly:
For uncertainty-aware routing, the upper bounds of confidence intervals were used instead:
where is the z-score corresponding to the desired confidence level (1.64 for 90% confidence), and the values are derived from the weather uncertainty model based on the forecast lead time. A risk-averse approach was adopted by using the upper bounds of the 90% confidence intervals. This conservative strategy assumes worst-case weather conditions within the probabilistic forecast range, prioritizing safety and operational reliability over fuel efficiency. While this approach may result in longer routes or increased fuel consumption under favorable conditions, it provides robust protection against forecast uncertainty and reduces the risk of encountering dangerous weather beyond operational thresholds. This methodology is particularly relevant for cargo vessels operating under strict schedule constraints, where weather-related delays can incur significant costs that outweigh marginal fuel savings.
2.4. Ship-Routing Model
A simplified variation of a stochastic optimization method was used to generate routes that account for probabilistic weather forecasts rather than deterministic predictions alone. The method in question is simulated annealing (SA), a probabilistic metaheuristic inspired by the physical annealing process in metallurgy. As formalized in [48,49], SA is particularly well suited for global optimization problems with non-convex search spaces. The ship-routing problem was formulated as finding the optimal sequence of waypoints , where represents the departure port, and the destination port. The decision variables are the coordinates of the intermediate waypoints {, where each waypoint, , is defined by its geographical coordinates . The pseudocode for the SA algorithm that was used can be found in Appendix A (Table A1).
An initial route was generated by connecting the departure and destination ports with great circle waypoints slightly perturbed to avoid land. A neighboring solution was then created by randomly selecting one waypoint and perturbing its position. The new obtained solution was accepted if it improved the objective function; otherwise, it was accepted with probability. After 2000 iterations, or in case no improvement was found after 500 iterations, the search was stopped. The algorithm was implemented in Python, with the weather uncertainty model integrated directly into the objective function evaluation. The algorithm hence initializes with n=8 intermediate waypoints between origin and destination, positioned along the great circle route with small random perturbations to avoid local minima. The number of waypoints was used to balance computational efficiency with route flexibility. This resolution adequately captures synoptic-scale weather patterns (500–1000 nm) while maintaining tractable optimization times for comparing deterministic and uncertainty-aware approaches. Operational implementations might use finer discretization (20–50 waypoints) for detailed route optimization. The objective function was formulated as follows:
where is the total travel time, is the total fuel consumption, represents the safety violation penalties, denotes the land-crossing penalties, and are the respective weighting coefficients. For each route segment/leg between two consecutive waypoints, the travel time is calculated as follows:
where is the great circle distance calculated using the Haversine formula. The attainable ship speed is determined considering both the target speed and the environmental conditions:
where is the wind speed along the segment and is the significant wave height along the segment. The wind speed reduction coefficient is noted as and set to 0.05 knots, while the wave height reduction coefficient is set to 0.5 knots for waves up to 3 m, increasing to 1.0 knots for waves exceeding 3 m. These values are simplified representations based on typical speed loss curves for bulk carriers in moderate conditions [33,34,35]. While more sophisticated models incorporating vessel-specific resistance and propulsion characteristics exist [33], these linearized coefficients provide a reasonable approximation for demonstrating the uncertainty quantification methodology. Operators implementing this framework could calibrate these coefficients based on their specific vessel performance data. The simplified speed loss model in Equation (18) considers only wind speed and wave height magnitudes, omitting directional effects which significantly influence ship performance. Following established naval architecture principles [50,51], relative wind and wave angles typically modify resistance by factors of 0.5–2.0 depending on the ship’s heading. Similar magnitude-only approaches have been validated in preliminary routing studies [3,5,34], showing that while directional effects can modify resistance, the uncertainty in forecast magnitude often dominates routing decisions. Incorporating full directional dependencies would require detailed ship-specific resistance curves for all relative angles, complex optimization of both route geometry and heading at each waypoint, and significantly increased computational complexity. For this study’s primary objective of demonstrating uncertainty integration methodology, the magnitude-only approach provides adequate representation of weather impact trends while maintaining computational tractability. Operational implementations should incorporate vessel-specific directional resistance models calibrated from sea trial data.
The fuel consumption for each route segment is calculated using a cubic relationship between speed and fuel consumption rate [52], adjusted for environmental conditions:
where is the nominal fuel consumption rate (30 tons/day at nominal speed) and is the nominal speed (14 knots). The wind impact coefficient is noted as and set to 0.005 (0.5% increase per m/s), while the wave impact coefficient, noted as , is set to 0.15 (15% increase per meter of wave height). Total fuel consumption was hence calculated as follows:
The fuel consumption reduction or increase between routing strategies is not assumed or estimated heuristically but is derived directly from the integration of the weath-er-adjusted speed model into the objective function. Each segment’s fuel consumption is computed using a cubic function of attainable speed (Equation (19)), which itself is dynami-cally influenced by the local wind and wave conditions and adjusted with the uncer-tainty bounds. Thus, changes in fuel consumption emerge naturally as a function of the route geometry, speed reduction decisions, and environmental loads. Safety violations were quantified based on exceedance of predefined thresholds for meteorological variables, and a two-component penalty function was used for land crossing penalty cal-culations:
where the indicator function returns a value of 1 if the great circle segment connecting waypoints and intersects any landmass, and 0 otherwise:
This term penalizes infeasible segments that cross land. The second component, , represents the coastal proximity penalty and is defined as follows:
where is the minimum distance from the route segment to the nearest coastline, and is 12 nautical miles, which corresponds to the international territorial water limit. This component penalizes segments that pass too close to the coast, to keep safe distances in accordance with typical navigational practices. The penalty weights are set to and , ensuring that land crossings are effectively prohibited, while coastal proximity is strongly discouraged but still allows for gradient-based optimization. Real-world operational routing systems would incorporate more complex constraints such as Traffic Separation Schemes (TSSs), Emission Control Areas (ECAs), and dynamic under-keel clearance assessments based on vessel draft. While the navigational constraint formulation is not novel in itself, it is deliberately designed as a practical and computationally efficient approximation. The primary contribution of this work is the integration of probabilistic forecast uncertainty into the route optimization framework, where these constraints ensure that the resulting paths remain navigationally feasible under uncertainty.
3. Results
3.1. Temporal Degradation of Forecast Accuracy
The analysis of forecast error growth with increasing forecast lead time exhibited distinct patterns across the chosen meteorological variables. Figure 2, Figure 3 and Figure 4 present the temporal degradation of RMSE for primary wave period, significant wave height, and wind speed, respectively, for forecast horizons from 6 to 168 h.
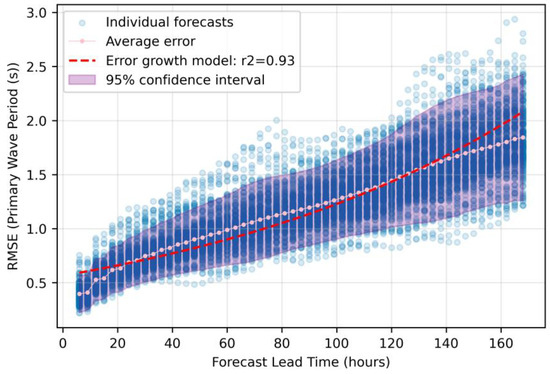
Figure 2.
The error growth characteristics for primary wave period forecasts.
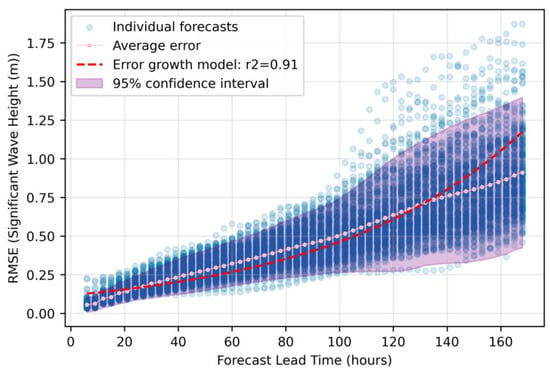
Figure 3.
The error growth characteristics for significant wave height forecasts.
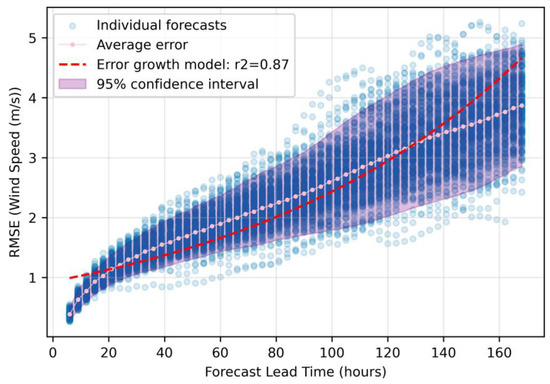
Figure 4.
The error growth characteristics of wind speed forecast errors.
Individual forecast errors (light blue points) demonstrate considerable spread, with the variability increasing specifically beyond the 96 h horizon for primary wave period. The average error (pink dotted line) exhibits approximately linear growth over the forecast horizon shown, though the fitted exponential model achieves an R2 value of 0.93. The small growth rate parameter (α = 0.015) results in near-linear behavior over the 168 h range, as exponential functions with small exponents approximate linear growth over limited domains. This suggests that wave period forecast errors accumulate at a relatively constant rate, making them more predictable than the highly nonlinear error growth observed in wind speed forecasts. Significant wave height forecasts (Figure 2) exhibit a more constrained error growth pattern compared to the wave period. Initial errors in the 24 h forecast remain below 0.2 m, while 168 h projections show average errors close to 0.9 m.
The pronounced variability in wind speed forecast errors compared to wave parameters (increasing from 0.5 m/s at 24 h to 4.0 m/s at 168 h) quantitatively demonstrates the disproportionate uncertainty growth in atmospheric versus oceanographic predictions. This differential error propagation rate of 0.5 m/s per day, coupled with the wider error dispersion at extended horizons (120–168 h), indicates that traditional uniform uncertainty models systematically underestimate risk in mid-to-long range voyage segments. Integrating these variable-specific error growth functions into routing algorithms would enable dynamic uncertainty quantification, with precise declining at mathematically predictable rates. The empirical error distributions could be directly transformed into probability-weighted safety margins that expand proportionally to the forecast horizon, balancing between operational efficiency and safety margins.
3.2. Bias and Systematic Error Analysis
Figure 4, Figure 5 and Figure 6 visualize the forecast bias characteristics for forecast horizons from 6 to 168 h.
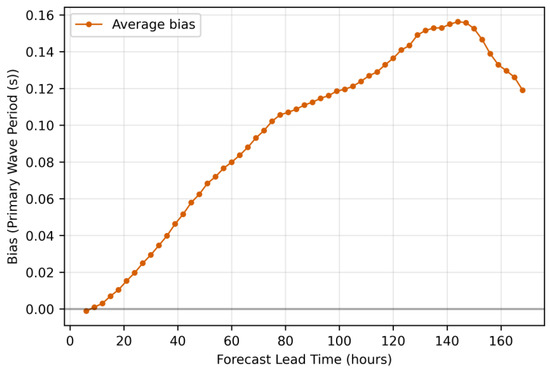
Figure 5.
The bias evolution for primary wave period forecasts.
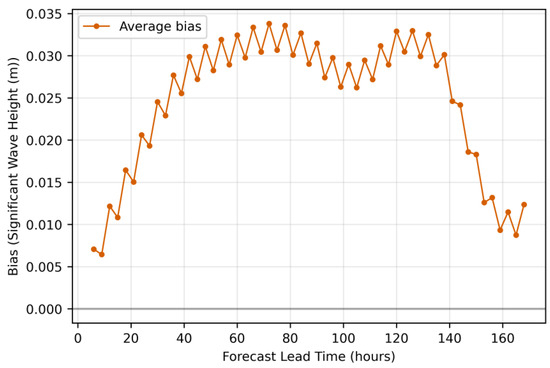
Figure 6.
The bias evolution for significant wave height forecasts.
Figure 5 shows the bias evolution for primary wave period forecasts. The pattern shows a consistently positive trend from approximately zero at the initial forecast to a maximum of 0.156 s at around 144 h, followed by a decline. This strictly positive bias indicates that the forecasting model overestimates wave periods throughout the forecast horizon, while the smooth, monotonic growth in the first 140 h suggests a cumulative process driven by model physics rather than random fluctuations. Significant wave height bias (Figure 6) rapidly increases from near-zero to approximately 0.03 m within the first 40 h, then maintains a plateau with oscillatory behavior through most of the forecast range before declining after 140 h. These oscillations may reflect the model’s handling of variations or the influence of assimilation cycles, as suggested in [43].
Wind speed forecasts (Figure 7) again display the most complex and variable bias pattern among the three variables. The bias oscillates between predominantly negative values (underestimation) from approximately 10 to 80 h, followed by fluctuations between negative and positive values in the 80–140 h range, and finally a sharp positive turn. This high variability aligns with [44], considering the inherent challenges in wind prediction due to complex atmospheric dynamics. The magnitude of wind speed bias, while generally small (±0.03 m/s), shows more pronounced variations than those observed for wave parameters. The practical implications of these bias patterns for ship routing should be acknowledged. The consistent positive bias in wave period forecasts means that routing algorithms should anticipate shorter actual wave periods than predicted, potentially affecting ship motion calculations. The positive bias in wave height suggests that actual sea states may be slightly less severe than forecasted, while the oscillating bias in wind speed forecasts presents the greatest challenge for routing algorithms as it requires adaptive corrections that vary with forecast lead time and may switch between positive and negative adjustments.
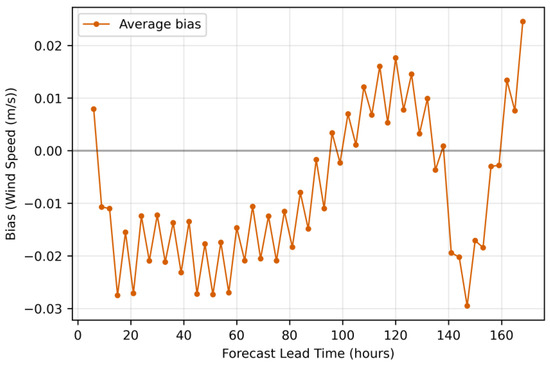
Figure 7.
The bias evolution for wind speed forecasts.
3.3. Probabilistic Distribution Modeling
A comprehensive examination of primary wave period distributions from 24 to 168 h was conducted, utilizing histograms and normality assessments through Q-Q plots. Figure 8 shows Q-Q plots for each variable over different forecast horizons. The Generalized Extreme Value (GEV) distribution consistently provides the best fit across all forecast horizons, outperforming normal, lognormal, and Weibull alternatives [47]. For all variables and forecast horizons, the Q-Q plots clearly demonstrate that the empirical distributions of forecasts differ from normality as lead time increases. At 24 h, the primary wave period exhibits near-Gaussian behavior with symmetric distribution, while wave height and wind speed already show signs of positive skew. By 96 and 168 h, non-linearity in the upper quantiles becomes pronounced across all three variables. This pattern, especially visible in the upper-right corners of the Q-Q plots, justifies the use of GEV and lognormal models, which provided the best fit for significant wave height and wind speed, respectively.
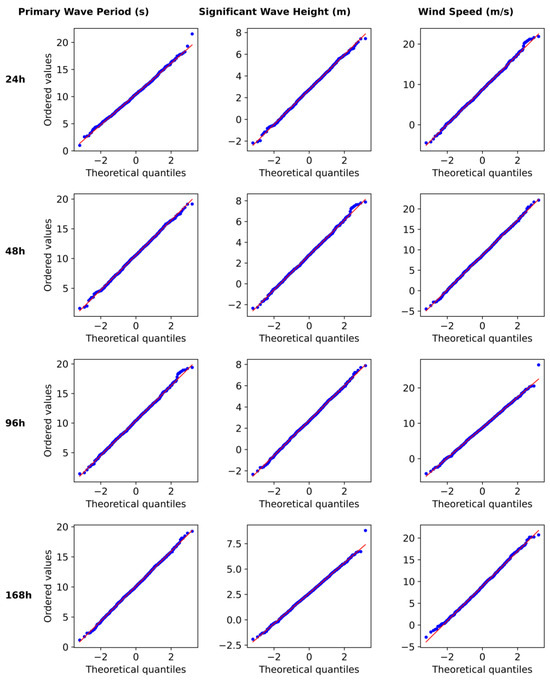
Figure 8.
Normality assessments through Q-Q plots for each variable over different forecast horizons (24 h, 48 h, 96 h, 168 h). The first column represents the primary wave period, the second is the significant wave height, and the third is the wind speed.
Skewness remains near zero for shorter forecast horizons (0.02 at 24 h, 0.01 at 48 h), indicating relatively symmetric distributions. However, a slight positive skewness develops at longer horizons (0.12 at 120 h, 0.14 at 168 h), suggesting an emerging tendency toward longer wave periods in the distribution tail. This skewness at longer forecast horizons indicates a possible tendency to underestimate the probability of encountering longer wave periods, which could have significant implications for ship motion responses and ship stability calculations. Kurtosis similarly evolves from slightly platykurtic values in mid-range forecasts (−0.16 at 48 h, −0.15 at 72 h) toward mesokurtic values at longer horizons (0.03 at 144 h, 0.17 at 168 h), indicating a gradual transition toward normal-like distributions.
3.4. Confidence Intervals
The values of confidence interval (CI) widths were analyzed across multiple probability levels for the three primary meteorological variables. Figure 9, Figure 10 and Figure 11 visualize these patterns from 24 to 168 h lead time.
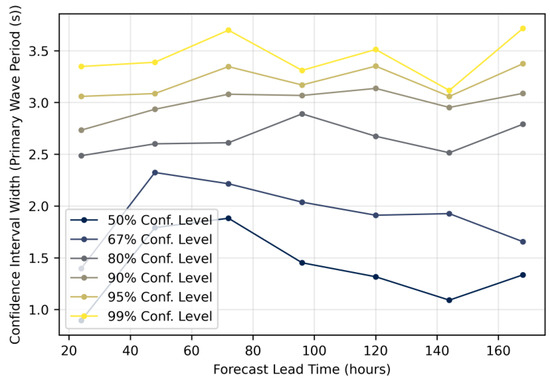
Figure 9.
Growth of confidence interval width for primary wave period (s).
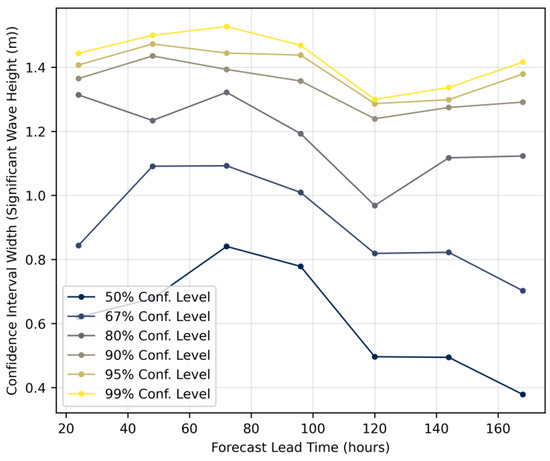
Figure 10.
Growth of confidence interval width for significant wave height (m).
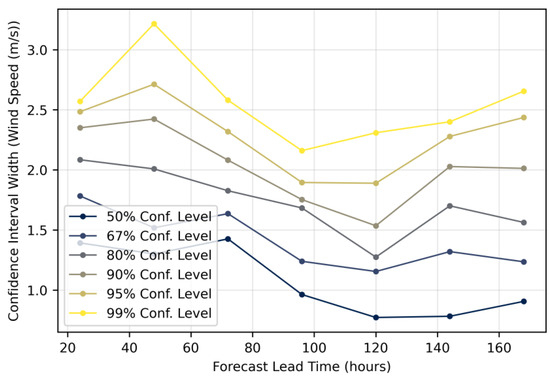
Figure 11.
Growth of confidence interval width for wind speed (m/s).
Confidence intervals for all three variables show complex, non-linear growth with increasing forecast lead time, exhibiting previously undocumented non-monotonic behavior where uncertainty actually decreases at certain lead times before increasing again. While flow-dependent predictability has been acknowledged conceptually in the ensemble forecasting literature [8], and isolated cases of non-monotonic bias have been reported for wave models in specific contexts [27], this research provides the first systematic documentation of confidence interval narrowing across multiple meteorological variables (wind speed, wave height, and wave period) as a general forecasting phenomenon. This contradicts the common assumption that forecast uncertainty increases steadily with lead time, instead revealing distinct variable-specific patterns with important operational implications for ship-routing systems. Primary wave period confidence intervals (Figure 9) show a distinctive pattern with initial growth until approximately 72 h, followed by a slight reduction through 120 h. A pronounced local minimum can be noticed at 140 h, where the 95% CI narrows to 3.1 s before expanding to 3.4 s at 168 h. This unexpected contraction may reflect the model’s internal calibration processes or the influence of ensemble initialization cycles.
Significant wave height confidence intervals (Figure 10) exhibit pronounced non-linear behavior, especially at higher confidence levels. The 95% CI widens to 1.47 m at 72 h, narrows to 1.28 m at 120 h, and increases again to 1.38 m at 168 h. At the 50% confidence level, the interval width sharply contracts from 0.85 m to 0.38 m over the same period, highlighting strong predictability gains in the medium range. Wind speed confidence intervals (Figure 11) show an early peak in uncertainty (3.25 m/s at 40 h), then steadily narrow to 2.3 m/s by 120 h. This early-stage volatility, diverging from classical monotonic error growth models, emphasizes the dominant influence of initial condition errors and assimilation processes within the first 48 h.
Interestingly, all variables show anomalous behavior around 96–120 h, corresponding to the transition from medium- to extended-range numerical forecast models. For ship routing, this implies that forecast uncertainty evolves non-monotonically and requires dynamic handling: medium-range forecasts (up to 120 h) support tighter confidence-based route adjustments, while forecasts beyond 120 h demand greater safety buffers and scenario-based planning. The anomalous uncertainty behavior represents a novel finding in operational weather forecasting verification. Unlike previous studies that attributed similar patterns to model-specific tuning issues [53] or adaptive methods for special weather regimes [54], our analysis showed this as an inherent characteristic of forecast uncertainty evolution that occurs systematically across different meteorological variables and forecast systems. These results support the integration of empirically derived, variable-specific confidence intervals into routing algorithms rather than relying on generic error growth assumptions.
3.5. Forecast Skill Assessment
Figure 12 shows CRPS values (see Equation (9)) for primary wave period, significant wave height, and wind speed from 24 to 168 h. All three variables exhibit unexpected CRPS patterns that again defy the assumptions about the explicit degradation of forecast skill with increasing lead time.
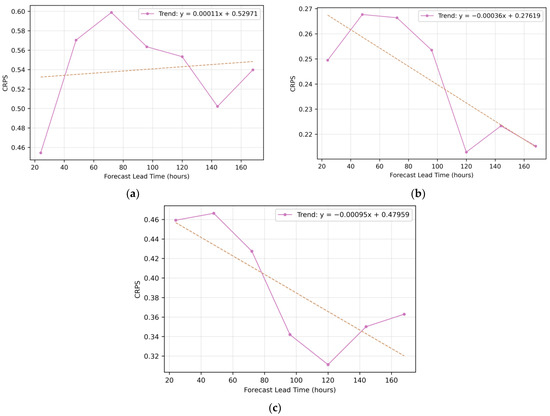
Figure 12.
Continuous ranked probability score over 168 h forecast lead time for (a) primary wave period; (b) significant wave height; and (c) wind speed.
Primary wave period forecasts exhibit the most anomalous CRPS behavior, initially decreasing (0.45 at 24 h) before peaking at 72 h (0.60), then gradually improving with a sharp drop at 144 h. The overall flat trend (y = 0.00011x + 0.52971) suggests minimal skill loss over time. Significant wave height shows a counterintuitive improvement with lead time (y = −0.00036x + 0.27619), where CRPS peaks early (0.267 at 48–72 h) but declines to 0.215 by 168 h, implying greater forecast reliability at longer horizons. Wind speed forecasts, despite higher absolute CRPS values, demonstrate the strongest improvement trend (y = −0.00095x + 0.47959), particularly between 120 and 144 h.
This reflects dynamic calibration strategies within numerical weather prediction models. As shown, forecast skill does not uniformly degrade with lead time; instead, surprisingly robust guidance can be found in extended-range forecasts, especially at 120–144 h. These periods of enhanced skill can be exploited in routing algorithms by dynamically adjusting the weighting of forecast inputs based on empirical CRPS performance.
3.6. Extreme Value Analysis
The upper decile (>90th percentile) of forecast distributions was analyzed using Generalized Extreme Value (GEV) theory to quantify these rare, high-impact events. Figure 13, Figure 14 and Figure 15 present the results for primary wave period, significant wave height, and wind speed.
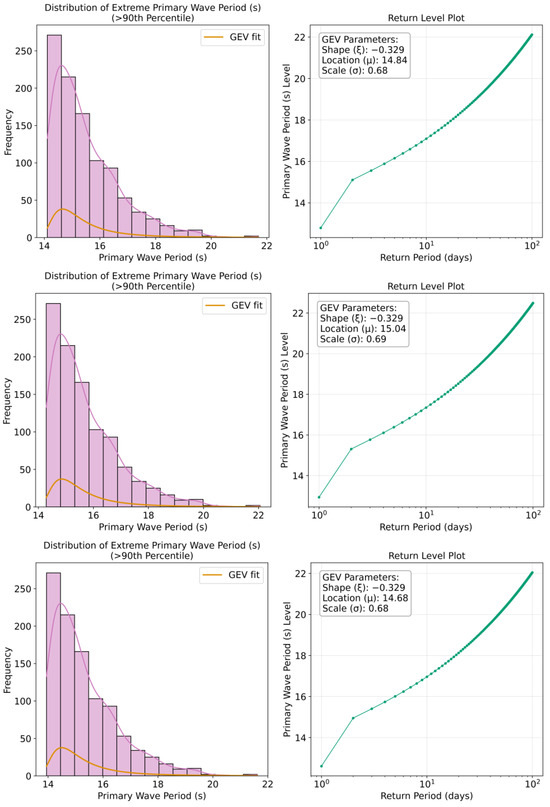
Figure 13.
The upper decile of forecast distributions for primary wave period (histograms on the (left), return level plots on the (right)), with the first row corresponding to the forecast horizon of 24 h, the second row to 96 h, and the third row to 168 h.
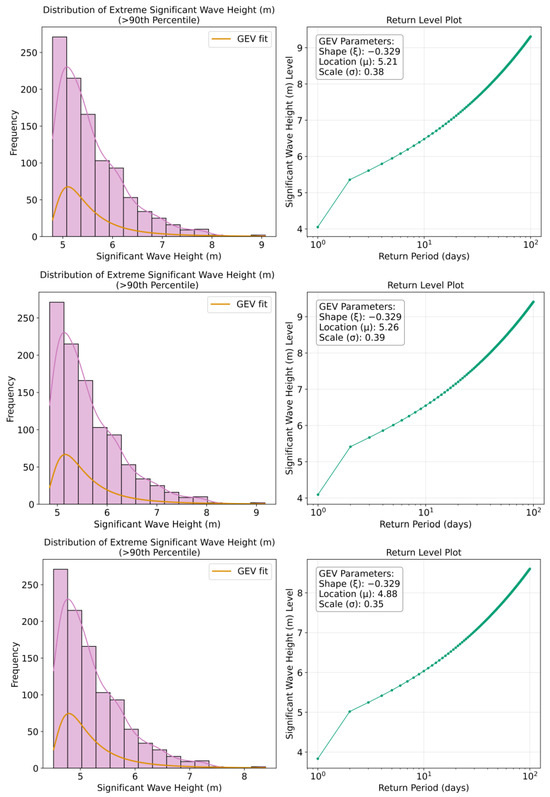
Figure 14.
The upper decile of forecast distributions for significant wave height (histograms on the (left), return level plots on the (right)), with the first row corresponding to the forecast horizon of 24 h, the second row to 96 h, and the third row to 168 h.
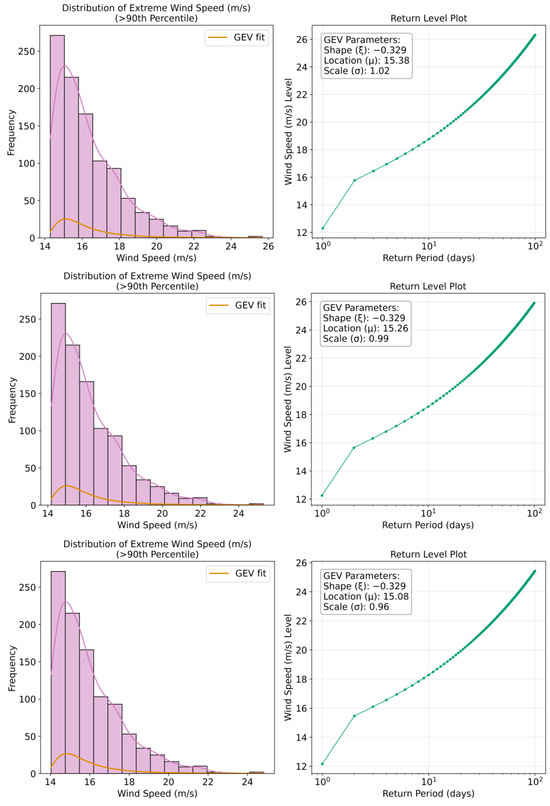
Figure 15.
The upper decile of forecast distributions for wind speed (histograms on the (left), return level plots on the (right)), with the first row corresponding to the forecast horizon of 24 h, the second row to 96 h, and the third row to 168 h.
Although extreme value analysis is commonly applied to significant wave height and wind speed, the maximum wave period is also important to consider in terms of ship motion and stability, particularly due to the risk of resonance effects when wave encounter periods approach the natural frequency of the vessel. When a ship encounters waves with periods that coincide with its natural roll or pitch periods, even moderate wave heights can induce severe motions through parametric rolling phenomena. The ship’s structural integrity and operational safety can be compromised in such conditions, possibly leading to capsizing in severe cases. The analysis of wave period extremes therefore offers valuable insights for anticipating potentially hazardous conditions that might not be captured by wave height assessments alone. Its inclusion is thus justified in operational risk assessments and routing decisions, particularly for vessels with roll periods in the range of 8–16 s, which corresponds to the upper tail of the wave period distributions observed in this referenced North Atlantic dataset. The GEV distribution’s fit to wave period extremes further supports this approach, suggesting that extreme value theory provides an appropriate statistical framework for characterizing the probability of encountering problematic wave periods during trans-Atlantic voyages.
Primary wave periods show potential extremes of 17–18 s for 365-day return periods, increasing to 20–22 s for 3652-day events. Wave heights demonstrate potential extremes of 7–8 m for 365-day periods, rising to 11–13 m for 3652-day return periods. Wind speeds show the most substantial extremes, with 365-day maxima around 19–20 m/s escalating to 25–28 m/s for 3652-day events. It should be noted that while the return period plots are presented in days for direct relevance to voyage planning timeframes, these can be converted to the more conventional annual return periods by dividing by 365.25. For instance, the 365-day return level corresponds to the annual maximum (1-year return period), while the 3652-day return level would represent the 10-year return period. This presentation in days rather than years was chosen to provide more immediate relevance for operational maritime decision-making, where voyage durations typically span days to weeks rather than years.
The location parameter (μ) remains relatively stable across forecast horizons for each variable (14.72–15.05 s for wave period, 5.30–5.91 m for wave height, 15.77–16.41 m/s for wind speed), indicating that while forecast uncertainty increases with lead time, the central tendency of extreme values maintains consistency. Scale parameters (σ) show slight variations (0.66–0.68 for wave period, 0.61–0.77 for wave height, 1.46–1.68 for wind speed), reflecting variable-specific dispersion characteristics in extreme conditions.
These results can provide quantitative thresholds for evaluating operational risks during voyage planning and navigation. Probabilistic risk assessment can be enabled by the return level plots by relating extreme conditions to their recurrence odds.
3.7. Implications for Ship Weather Routing Based on Weather Forecasting Uncertainties
The practical impact of uncertainty quantification is demonstrated through comparative analysis of routing decisions, where the optimization framework (Section 2.4) incorporates time-varying forecast confidence bounds derived from the statistical analysis presented in Section 3.1, Section 3.2, Section 3.3, Section 3.4, Section 3.5 and Section 3.6.
For this demonstration of the weather uncertainty model, a transatlantic shipping route between the ports of Norfolk and Rotterdam was selected. The departure date and time were set to 8 January 2025 to align with the observed and analyzed forecasts for the winter months in the North Atlantic Ocean area. The observed ship is a bulk carrier with a maximum attainable speed of 16.197 knots and a service speed of 14 knots. The ship’s length overall (LoA) is 169.37 m, its breadth is 27.20 m, and its full-load displacement is 34753 MT. The main engine’s output is 4970 kW at 122 RPM, with average fuel consumption ranging from 28–32 tons/day. Because fuel consumption is linked to ship speed adjusted according to the weather at each route segment, the uncertainty-aware approach tends to generate longer travel times with moderate fuel changes by reducing speed under high-risk conditions.
The results of different case studies with varying weather conditions across different forecast lead times can be found in Table 1.

Table 1.
Comparative results of deterministic and uncertainty-aware routing across eight weather scenarios.
The results reveal that uncertainty-aware routing consistently produces marginally longer voyage durations (11.1–12.7 days versus 10.7–12.3 days), which reflects the algorithm’s conservative approach when using 90% confidence upper bounds. The speed reduction strategy, while increasing the voyage time by 3–7%, provides enhanced safety margins for forecast uncertainty. The most pronounced differences occur in Cases 5–6, where deterministic routing achieves shorter travel times (10.7–10.9 days) at the cost of reduced safety margins. Selected output routes are visualized in Figure 16 for three different weather forecast scenarios (cases 2, 5 and 8), where the differences can be noticed between deterministic and uncertainty-aware routes across the North Atlantic.
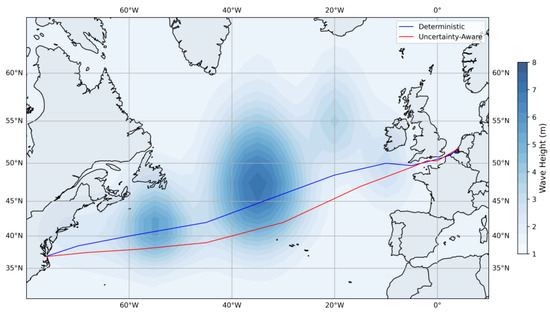
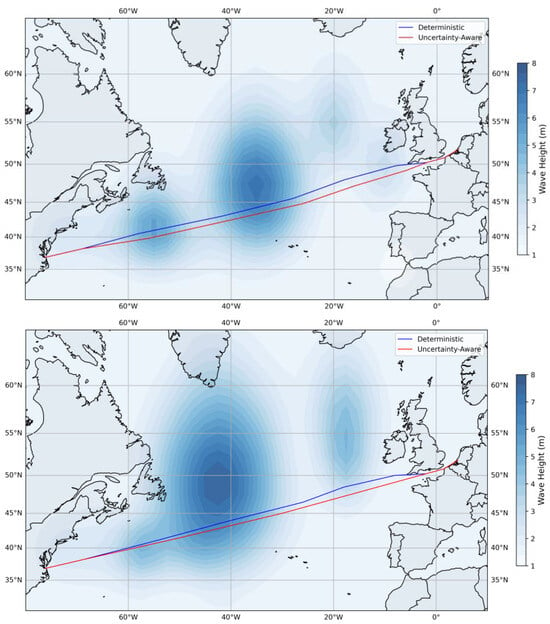
Figure 16.
Deterministic (blue) and uncertainty aware (red) route visualizations for selected case studies (2,5,8).
The routes shown in Figure 16 reveal that the uncertainty-aware approach does not simply avoid high-wave areas through simple thresholds, but instead implements graduated response based on forecast confidence. In Case 2 (top), the uncertainty-aware route (red) maintains greater separation from the storm system’s uncertain periphery, where forecast confidence intervals are widest. Case 5 (middle) demonstrates the most significant deviation, where the uncertainty-aware route accepts a 10.4 nm longer total path to avoid regions where the 90% confidence bound for significant wave height exceeds 8 m—not only where the mean forecast exceeds this threshold.
While the visual differences between routes appear subtle, the value of the uncertainty-aware approach is not in dramatic route changes but in nuanced speed and timing decisions. Rather than fixed thresholds (e.g., avoidance of areas with waves > 6 m), the uncertainty-aware approach adjusts safety margins based on forecast reliability. For instance, at 48 h horizons where confidence is high, the algorithm accepts routes in areas with 5–6 m waves. However, at 144 h horizons where uncertainty has grown substantially (as shown in Section 3.1), the same 5–6 m forecast triggers avoidance due to the expanded confidence intervals. This time-varying response cannot be replicated with static thresholds. The model also recognizes that wind speed uncertainty grows differently than wave height uncertainty (as shown in Section 3.1, Section 3.2 and Section 3.3), applying appropriate confidence bounds to each variable rather than uniform safety factors. Time-dependent routing decisions are also enabled.
Hence, the fundamental difference lies in the handling of forecast uncertainty: while deterministic routing optimizes based on expected conditions, uncertainty-aware routing considers the full probabilistic range across all forecast horizons during the voyage. This manifests primarily through dynamic speed reduction instead of dramatic route changes. The algorithm reduces speed beforehand when approaching regions of high forecast uncertainty, accepting longer voyage times to maintain safety margins. This explains the consistent pattern in Table 1 where uncertainty-aware routes show marginally longer distances but disproportionately longer voyage times—the primary risk mitigation occurs through speed adjustments rather than spatial avoidance.
This conservative approach aligns with practical ship-routing operations where schedule reliability often outweighs marginal time savings and would be most valuable for ships with strict safety requirements or in cases when the cost of weather-related delays exceeds the penalty of reduced speed. The simplified optimization framework was developed primarily to explore the integration of a weather uncertainty model into ship-routing optimization, aiming to generate routes that balance operational efficiency with significantly enhanced safety margins under forecast uncertainty. The results demonstrate that explicitly modeling forecast uncertainty can lead to substantially different routing outcomes, enabling further research in optimization strategies that are more aligned with individual operator’s risk preferences and practical operational constraints.
4. Discussion
The main goal of this research was to advance the integration of probabilistic meteorology into ship routing by quantifying weather forecast uncertainties across temporal, spatial, and variable-specific dimensions. This study makes several notable contributions to the fields of weather forecast verification and ship weather routing. The first systematic documentation of non-monotonic confidence interval evolution across multiple meteorological variables is presented—including wind speed, significant wave height, and wave period—in an operational weather forecast uncertainty framework. While non-monotonic uncertainty has been noted anecdotally for individual variables, to our knowledge, this is the first time it is demonstrated collectively and quantitatively for the parameters most relevant to ship routing. Empirical evidence was provided that CRPS may improve rather than degrade with forecast lead time for certain variables, contradicting the conventional assumption of monotonic skill loss in probabilistic forecasting [45,46]. The anomalous behavior in the 96–120 h forecast range is particularly noteworthy, where the metrics demonstrate unexpected improvements rather than degradation—for instance, wind speed CRPS improved by 23% and significant wave height confidence intervals contracted by 15%. This pattern suggests underlying transitions in model physics at these horizons, aligning with Pinson’s [44] findings on non-monotonic quality in extended range forecasts. Unlike in [8], where primarily monotonic error growth was observed, this analysis revealed complex non-linear patterns with a high coefficient of determination values (R2 = 0.93 for wave period, R2 = 0.91 for wave height, R2 = 0.87 for wind speed). Generalized Extreme Value distributions consistently outperformed Gaussian representations, with negative shape parameters (ξ from −0.21 to −0.15) indicating bounded upper tails. This contradicts the unbounded normal distributions used in many operational systems [43] and provides a more realistic statistical foundation for extreme event forecasting, resulting in maximum wave heights of 11–13 m for 10-year return periods.
The uncertainty model integration demonstrates tangible benefits for routing decisions. The test cases between Norfolk and Rotterdam showed that incorporating probabilistic forecast information yields operationally superior solutions through dynamic speed modulation rather than spatial avoidance. Enhanced safety margins were achieved at the cost of modest increases in voyage duration (3–7% longer than deterministic approaches). Implementation in commercial systems could follow a staged approach, with operators choosing between deterministic routing for time-critical voyages and uncertainty-aware routing when safety margins and schedule reliability take precedence over speed. This methodology demonstrates a shift from threshold-based routing toward risk-informed decision-making that explicitly accounts for forecast confidence degradation across different lead times.
However, several limitations should be acknowledged that constrain the broad applicability and operational implementation of these findings. The North Atlantic winter focus of this research (October–March) may limit application to other regions or seasons with different atmospheric dynamics such as tropical regions or monsoon-affected areas. Arctic and Southern Ocean applications would also require separate validation due to ice effects and polar atmospheric processes not captured in this analysis. The pseudo-ensemble approach that was used, while statistically robust, cannot fully replicate operational ensemble prediction systems’ structural uncertainties or capture model physics variations. The 6-month dataset, though comprehensive, may not capture inter-annual variability or long-term climate trends affecting forecast skill. Additionally, the simplified ship performance model, while adequate for demonstrating the methodology, would require vessel-specific calibration for operational use. Real-time implementation faces significant computational barriers, as processing uncertainty ensembles for dynamic route optimization currently requires substantial computing resources exceeding typical shipboard capabilities. Route discretization, while adequate for this demonstration, limits operational precision compared to industry-standard implementations. Future research directions should address these limitations through multi-regional validation campaigns spanning different climate zones and seasons and integration with operational ensemble prediction systems from multiple weather forecasting centers. As an extension to climate change scenarios where traditional forecast skill patterns may evolve, specific uncertainty models should be developed for each ship in question, incorporating detailed ship performance characteristics. Real-time adaptive frameworks could be included that update uncertainty parameters using shipboard observations. Computational optimization enabling practical implementation in commercial routing systems should be considered as well.
5. Conclusions
In this research, a framework for quantifying and characterizing weather forecast uncertainty in the North Atlantic region was developed, with specific application to ship weather routing. Our analysis demonstrated that forecast uncertainty shows distinct patterns across variables, lead times, and geographical regions that can be effectively modeled and incorporated into decision support systems. To our knowledge, this study provides the first comprehensive documentation of non-monotonic confidence interval evolution in operational weather forecasts, challenging traditional assumptions about uniform uncertainty growth and providing a foundation for more sophisticated uncertainty modeling in ship-routing applications. The main findings include (1) the non-linear growth of uncertainty with forecast lead time, particularly accelerating after 72 h; (2) significant spatial heterogeneity in uncertainty patterns; (3) strong cross-variable correlations between wind speed and wave height that enable effective uncertainty propagation in ship performance models; and (4) verification metrics showing that ship routes considering weather forecast uncertainty can reduce weather-related risk exposure while maintaining satisfactory operational efficiency.
Collectively, these findings challenge several assumptions in operational weather forecasting and ship weather routing: (1) that forecast uncertainty grows monotonically with lead time; (2) that probabilistic skill uniformly degrades with forecast horizon; and (3) that all meteorological variables exhibit similar uncertainty evolution patterns. With these research advancements, decision-making during navigation could be redefined, moving beyond worst-case scenario planning toward sophisticated optimization that appropriately weighs the reliability of weather forecasts across different forecast horizons, specific variables, and geographical regions. Such improvements could contribute to enhanced operational safety during navigation and, when weather conditions permit, improve fuel efficiency through better-informed routing decisions.
Author Contributions
Conceptualization, M.M., J.P.-O., A.T. and M.V.; methodology, formal analysis, investigation, data curation, M.M. writing—original draft preparation, M.M.; writing—review and editing, J.P.-O., A.T. and M.V.; visualization, M.M.; supervision, J.P.-O., A.T. and M.V.; funding acquisition, J.P.-O. All authors have read and agreed to the published version of the manuscript.
Funding
This work was supported by the Croatian Science Foundation under the project HRZZ-IP-2022-10-2821.
Data Availability Statement
Weather forecast data used for this analysis can be publicly accessed on the NOAA servers.
Conflicts of Interest
The authors declare no conflicts of interest.
Appendix A
The simulated annealing algorithm proceeds as follows:

Table A1.
Pseudocode for the SA algorithm used for ship route optimization.
Table A1.
Pseudocode for the SA algorithm used for ship route optimization.
| Simulated Annealing for Ship Weather Routing | ||||
|---|---|---|---|---|
| Inputs:
departure port coordinates (lat0, lon0) destination port coordinates (lat_n+1, lon_n+1) weather forecast data for wind speed weather forecast data for wave height uncertainty bounds (σ_Ws(x,y,t), σ_Hs(x,y,t) at confidence level α) ship parameters | ||||
| Output: Optimal route P = {p0, p1, …, p8, p9}, minimizing objective function F | ||||
| 1 | Initialization: generate initial route P0 with 8 intermediate waypoints on great circle | |||
| 2 | For each waypoint pi = (lati, loni), add perturbation ~ U (-0.5°, 0.5°) | |||
| 3 | Initial temperature setting: T0 = 50.0 | |||
| 4 | Cooling rate setting: γ = 0.97 | |||
| 5 | F_best ←∞, P_best ← P0 | |||
| 6 | For iteration k = 1 to 2000 do | |||
| 7 | Select random waypoint index i ~ U {1,8} | |||
| 8 | Perturb waypoint position, Δlat, Δlon ~ U(-ρk,ρk) | |||
| 9 | where ρk = 1.0 × (1 − k/2000) // Adaptive search radius | |||
| 10 | Create candidate route: P’ ← P | |||
| 11 | p’i ← (lati +Δlat, loni +Δlon) | |||
| 12 | ||||
| 13 | if segment in P’ intersects land then | |||
| 14 | continue to next iteration | |||
| 15 | Evaluate objective function: | |||
| 16 | F(P’) = w_T × T(P’) + w_F × F(P’) + w_S × S(P’) + w_L × L(P’) | |||
| 17 | where | |||
| 18 | T(P’) = Σ di,i+1/vi,i+1 // total time | |||
| 19 | F(P’) = Σ fuel(vi,i+1, di,i+1, Wsi,i+1, Hsi,i+1) // fuel consumption | |||
| 20 | S(P’) = Σ max(0, Hsi,i+1 − 5.0) + max(0, Wsi,i+1 − 20.0) // safety violations | |||
| 21 | L(P’) = 1000 × number of land crossings | |||
| 22 | For uncertainty-aware routing: | |||
| 23 | Wsi,i+1 = E[Ws] + z_α×σ_Ws // upper confidence bound | |||
| 24 | Hsi,i+1 = E[Hs] + z_α×σ_Hs // z0.90 = 1.64 | |||
| 25 | ΔF = F(P’) − F(P) | |||
| 26 | if ΔF < 0 or random() < exp(-ΔF/Tk) then | |||
| 27 | P ← P’ // Accept new solution | |||
| 28 | if F(P’) < F_best then | |||
| 29 | P_best ← P’, F_best ← F(P’) | |||
| 30 | if k mod 50 = 0 then | |||
| 31 | Tk+1 =γ × Tk // Temperature reduction | |||
| 32 | if no improvement for 500 iterations then | |||
| 33 | terminate | |||
| 34 | return P_route | |||
References
- IMO. 2023 IMO Strategy on Reduction of GHG Emissions from Ships. Annex 1, Resolution MEPC.377(80). 2023. Available online: https://www.imo.org/en/OurWork/Environment/Pages/2023-IMO-Strategy-on-Reduction-of-GHG-Emissions-from-Ships.aspx (accessed on 12 January 2025).
- Zis, T.P.V.; Psaraftis, H.N.; Ding, L. Ship weather routing: A taxonomy and survey. Ocean Eng. 2020, 213, 107697. [Google Scholar] [CrossRef]
- Walther, L.; Rizvanolli, A.; Wendebourg, M.; Jahn, C. Modeling and optimization algorithms in ship weather routing. Int. J. E-Navig. Marit. Econ. 2016, 4, 31–45. [Google Scholar] [CrossRef]
- Vettor, R.; Guedes Soares, C. Reflecting the uncertainties of ensemble weather forecasts on the predictions of ship fuel consumption. Ocean Eng. 2022, 250, 111009. [Google Scholar] [CrossRef]
- Vettor, R.; Bergamini, G.; Guedes Soares, C. A comprehensive approach to account for weather uncertainties in ship route optimization. J. Mar. Sci. Eng. 2021, 9, 1434. [Google Scholar] [CrossRef]
- Leutbecher, M.; Palmer, T.N. Ensemble forecasting. J. Comput. Phys. 2008, 227, 3515–3539. [Google Scholar] [CrossRef]
- Mylne, K.R.; Woolcock, C.; Denholm-Price, J.C.W.; Darvell, R.J. Operational calibrated probability forecasts from the ECMWF Ensemble Prediction System: Implementation and verification. In Proceedings of the Preprints of Symposium on Observations, Data Assimilation, and Probabilistic Prediction, AMS, Orlando, FL, USA, 13–17 January 2002; pp. 113–118. [Google Scholar]
- Buizza, R.; Leutbecher, M. The forecast skill horizon. Q. J. R. Meteorol. Soc. 2015, 141, 3366–3382. [Google Scholar] [CrossRef]
- Randriamampianina, R.; Iversen, T.; Storto, A. Exploring the assimilation of IASI radiances in forecasting polar lows. Q. J. R. Meteorol. Soc. 2011, 137 (Suppl. S1), 1700–1715. [Google Scholar] [CrossRef]
- Ksciuk, J.; Kuhlemann, S.; Tierney, K.; Koberstein, A. Uncertainty in maritime ship routing and scheduling: A literature review. Eur. J. Oper. Res. 2023, 308, 499–524. [Google Scholar] [CrossRef]
- Guo, Y.; Wang, Y.; Chen, Y.; Wu, L.; Mao, W. Learning-based Pareto-optimum routing of ships incorporating uncertain meteorological and oceanographic forecasts. Transp. Res. Part E Logist. Transp. Rev. 2024, 192, 103786. [Google Scholar] [CrossRef]
- Chen, Y.; Zhang, C.; Guo, Y.; Wang, Y.; Lang, X.; Zhang, M.; Mao, W. State-of-the-art optimization algorithms in weather routing —Ship decision support systems: Challenge, taxonomy, and review. Ocean Eng. 2025, 331, 121198. [Google Scholar] [CrossRef]
- Szłapczyński, R.; Szłapczyńska, J.; Vettor, R. Ship weather routing featuring w-MOEA/D and uncertainty handling. Appl. Soft Comput. 2023, 138, 110142. [Google Scholar] [CrossRef]
- Mannarini, G.; Pinardi, N.; Coppini, G.; Oddo, P.; Iafrati, A. VISIR-I: Small vessels, least-time nautical routes using wave forecasts. Geosci. Model Dev. 2016, 9, 1597–1625. [Google Scholar] [CrossRef]
- Mannarini, G.; Salinas, M.L.; Carelli, L.; Petacco, N.; Orović, J. VISIR-2: Ship weather routing in Python. Geosci. Model Dev. 2024, 17, 4355–4382. [Google Scholar] [CrossRef]
- Charalambopoulos, N.; Xidias, E.; Nearchou, A. Efficient ship weather routing using probabilistic roadmaps. Ocean Eng. 2023, 273, 114031. [Google Scholar] [CrossRef]
- Shao, W.; Zhou, P.; Thong, S.K. Development of a novel forward dynamic programming method for weather routing. J. Mar. Sci. Technol. 2012, 17, 239–251. [Google Scholar] [CrossRef]
- Shin, Y.W.; Abebe, M.; Noh, Y.; Lee, S.; Lee, I.; Kim, D.; Bae, J.; Kim, K.C. Near-optimal weather routing by using improved A* algorithm. Appl. Sci. 2020, 10, 6010. [Google Scholar] [CrossRef]
- Zhang, G.; Wang, H.; Zhao, W.; Guan, Z.; Li, P. Application of improved multi-objective ant colony optimization algorithm in ship weather routing. J. Ocean Univ. China 2021, 20, 45–55. [Google Scholar] [CrossRef]
- Chen, X.; Wei, C.; Xin, Z.; Zhao, J.; Xian, J. Ship Detection under Low-Visibility Weather Interference via an Ensemble Generative Adversarial Network. J. Mar. Sci. Eng. 2023, 11, 2065. [Google Scholar] [CrossRef]
- Liu, X.; Qiu, L.; Fang, Y.; Wang, K.; Li, Y.; Rodríguez, J. Event-Driven Based Reinforcement Learning Predictive Controller Design for Three-Phase NPC Converters Using Online Approximators. IEEE Trans. Power Electron. 2025, 40, 4914–4926. [Google Scholar] [CrossRef]
- Norlund, E.K.; Geibkovskaia, I. Environmental performance of speed optimization strategies in offshore supply vessel planning under weather uncertainty. Transp. Res. Part D Transp. Environ. 2017, 57, 10–22. [Google Scholar] [CrossRef]
- Mason, J.; Larkin, A.; Gallego-Schmid, A. Mitigating stochastic uncertainty from weather routing for ships with wind propulsion. Ocean Eng. 2023, 281, 114674. [Google Scholar] [CrossRef]
- Luo, X.; Yan, R.; Wang, S. Comparison of deterministic and ensemble weather forecasts on ship sailing speed optimization. Transp. Res. Part D Transp. Environ. 2023, 121, 103801. [Google Scholar] [CrossRef]
- Perera, L.P.; Guedes Soares, C. Weather routing and safe ship handling in the future of shipping. Ocean Eng. 2017, 130, 684–695. [Google Scholar] [CrossRef]
- Bauer, P.; Thorpe, A.; Brunet, G. The quiet revolution of numerical weather prediction. Nature 2015, 525, 47–55. [Google Scholar] [CrossRef]
- Kodaira, T.; Sasmal, K.; Miratsu, R.; Fukui, T.; Zhu, T.; Waseda, T. Uncertainty in wave hindcasts in the North Atlantic Ocean. Mar. Struct. 2023, 89, 103370. [Google Scholar] [CrossRef]
- Zhang, Y.; Sun, X.; Zha, Y.; Wang, K.; Chen, C. Changing Arctic Northern Sea Route and Transpolar Sea Route: A Prediction of Route Changes and Navigation Potential before Mid-21st Century. J. Mar. Sci. Eng. 2023, 11, 2340. [Google Scholar] [CrossRef]
- Baran, Á.; Baran, S. Parametric model for post-processing visibility ensemble forecasts. arXiv 2023, arXiv:2310.16824. [Google Scholar] [CrossRef]
- Lam, R.; Sanchez-Gonzalez, A.; Willson, M.; Wirnsberger, P.; Fortunato, M.; Alet, F.; Ravuri, S.; Ewalds, T.; Eaton-Rosen, Z.; Hu, W.; et al. Learning skillful medium-range global weather forecasting. Science 2023, 382, 1416–1421. [Google Scholar] [CrossRef]
- Bi, K.; Xie, L.; Zhang, H.; Chen, X.; Gu, X.; Tian, Q. Accurate medium-range global weather forecasting with 3D neural networks. Nature 2023, 619, 533–538. [Google Scholar] [CrossRef]
- de Burgh-Day, C.O.; Leeuwenburg, T. Machine learning for numerical weather and climate modelling: A review. Geosci. Model Dev. 2023, 16, 6433–6477. [Google Scholar] [CrossRef]
- Prpić-Oršić, J.; Sasa, K.; Valčić, M.; Faltinsen, O.M. Uncertainties of ship speed loss evaluation under real weather conditions. J. Offshore Mech. Arct. Eng. 2020, 142, 031106. [Google Scholar] [CrossRef]
- Prpić-Oršić, J.; Faltinsen, O.M. Estimation of ship speed loss and associated CO2 emissions in a seaway. Ocean Eng. 2012, 44, 1–10. [Google Scholar] [CrossRef]
- Prpić-Oršić, J.; Vettor, R.; Faltinsen, O.M.; Guedes Soares, C. The influence of route choice and operating conditions on fuel consumption and CO2 emission of ships. J. Mar. Sci. Technol. 2016, 21, 434–457. [Google Scholar] [CrossRef]
- Vitali, N.; Prpić-Oršić, J.; Soares, G.C. Coupling voyage and weather data to estimate speed loss of container ships in realistic conditions. Ocean Eng. 2020, 210, 106758. [Google Scholar] [CrossRef]
- Taskar, B.; Andersen, P. Benefit of speed reduction for ships in different weather conditions. Transp. Res. Part D Transp. Environ. 2020, 85, 102337. [Google Scholar] [CrossRef]
- Xu, L.; Wang, J.; Chen, M. Navigational decision-making method for wide inland waterways using AIS data and navigation rules. Brodogradnja 2025, 76, 76201. [Google Scholar] [CrossRef]
- Silveira, P.; Teixeira, A.P.; Soares, C.G. AIS Based Shipping Routes Using the Dijkstra Algorithm. Int. J. Mar. Navig. Saf. Sea Transp. 2019, 13, 565–571. [Google Scholar] [CrossRef]
- Życzkowski, M.; Szłapczyńska, J.; Szłapczyński, R. Review of weather forecast services for ship routing purposes. Pol. Marit. Res. 2019, 26, 80–89. [Google Scholar] [CrossRef]
- Lorenz, E.N. Predictability: A problem partly solved. In Seminar on Predictability; ECMWF: Reading, UK, 1995; Volume I, pp. 1–18. Available online: http://www.ecmwf.int/sites/default/files/elibrary/1995/10829-predictability-problem-partly-solved.pdf (accessed on 15 March 2025).
- Wilks, D.S. Statistical Methods in the Atmospheric Sciences, 4th ed.; Academic Press: Cambridge, MA, USA, 2019. [Google Scholar]
- Saetra, O.; Bidlot, J.R. Potential Benefits of Using Probabilistic Forecasts for Waves and Marine Winds Based on Ensemble Prediction Systems. Weather. Forecast. 2004, 19, 673–689. [Google Scholar] [CrossRef]
- Pinson, P. Adaptive Calibration of (u,v)-Wind Ensemble Forecasts. Q. J. R. Meteorol. Soc. 2012, 138, 1273–1284. [Google Scholar] [CrossRef]
- Gneiting, T.; Balabdaoui, F.; Raftery, A.E. Probabilistic Forecasts, Calibration and Sharpness. J. R. Stat. Soc. Ser. B 2007, 69, 243–268. [Google Scholar] [CrossRef]
- Hersbach, H. Decomposition of the continuous ranked probability score for ensemble prediction systems. Weather. Forecast. 2000, 15, 559–570. [Google Scholar] [CrossRef]
- Coles, S. An Introduction to Statistical Modeling of Extreme Values; Springer: London, UK, 2001. [Google Scholar]
- Kirkpatrick, S.; Gelatt, C.D., Jr.; Vecchi, M.P. Optimization by Simulated Annealing. Science 1983, 220, 671–680. [Google Scholar] [CrossRef] [PubMed]
- Kosmas, O.T.; Vlachos, D.S. Simulated annealing for optimal ship routing. Comput. Oper. Res. 2012, 39, 576–581. [Google Scholar] [CrossRef]
- Faltinsen, O.M. Sea Loads on Ships and Offshore Structures; Cambridge University Press: Cambridge, UK, 1990; pp. 1–5. [Google Scholar]
- Journée, J.M.J.; Massie, W.W. Offshore Hydromechanics; Delft University of Technology: Delft, The Netherlands, 2001. [Google Scholar]
- Adland, R.; Cariou, P.; Wolff, F.C. Optimal ship speed and the cubic law revisited: Empirical evidence from an oil tanker fleet. Transp. Res. Part E Logist. Transp. Rev. 2020, 140, 101972. [Google Scholar] [CrossRef]
- Ravdas, M.; Zacharioudaki, A.; Korres, G. Implementation and validation of a new operational wave forecasting system of the Mediterranean Monitoring and Forecasting Centre in the framework of the Copernicus Marine Environment Monitoring Service. Nat. Hazards Earth Syst. Sci. 2018, 18, 2675–2695. [Google Scholar] [CrossRef]
- Pinson, P.; Kariniotakis, G. On-line adaptation of confidence intervals based on weather stability for wind power forecasting. In Proceedings of the Global WindPower Conference, Chicago, IL, USA, 28–31 March 2004; p. hal-00529488. Available online: https://minesparis-psl.hal.science/hal-00529488v1 (accessed on 21 May 2025).
Disclaimer/Publisher’s Note: The statements, opinions and data contained in all publications are solely those of the individual author(s) and contributor(s) and not of MDPI and/or the editor(s). MDPI and/or the editor(s) disclaim responsibility for any injury to people or property resulting from any ideas, methods, instructions or products referred to in the content. |
© 2025 by the authors. Licensee MDPI, Basel, Switzerland. This article is an open access article distributed under the terms and conditions of the Creative Commons Attribution (CC BY) license (https://creativecommons.org/licenses/by/4.0/).