
The Risk to the Undersea Engineering Ecosystem of Systems: Understanding Implosion in Confined Environments

Abstract
1. Introduction
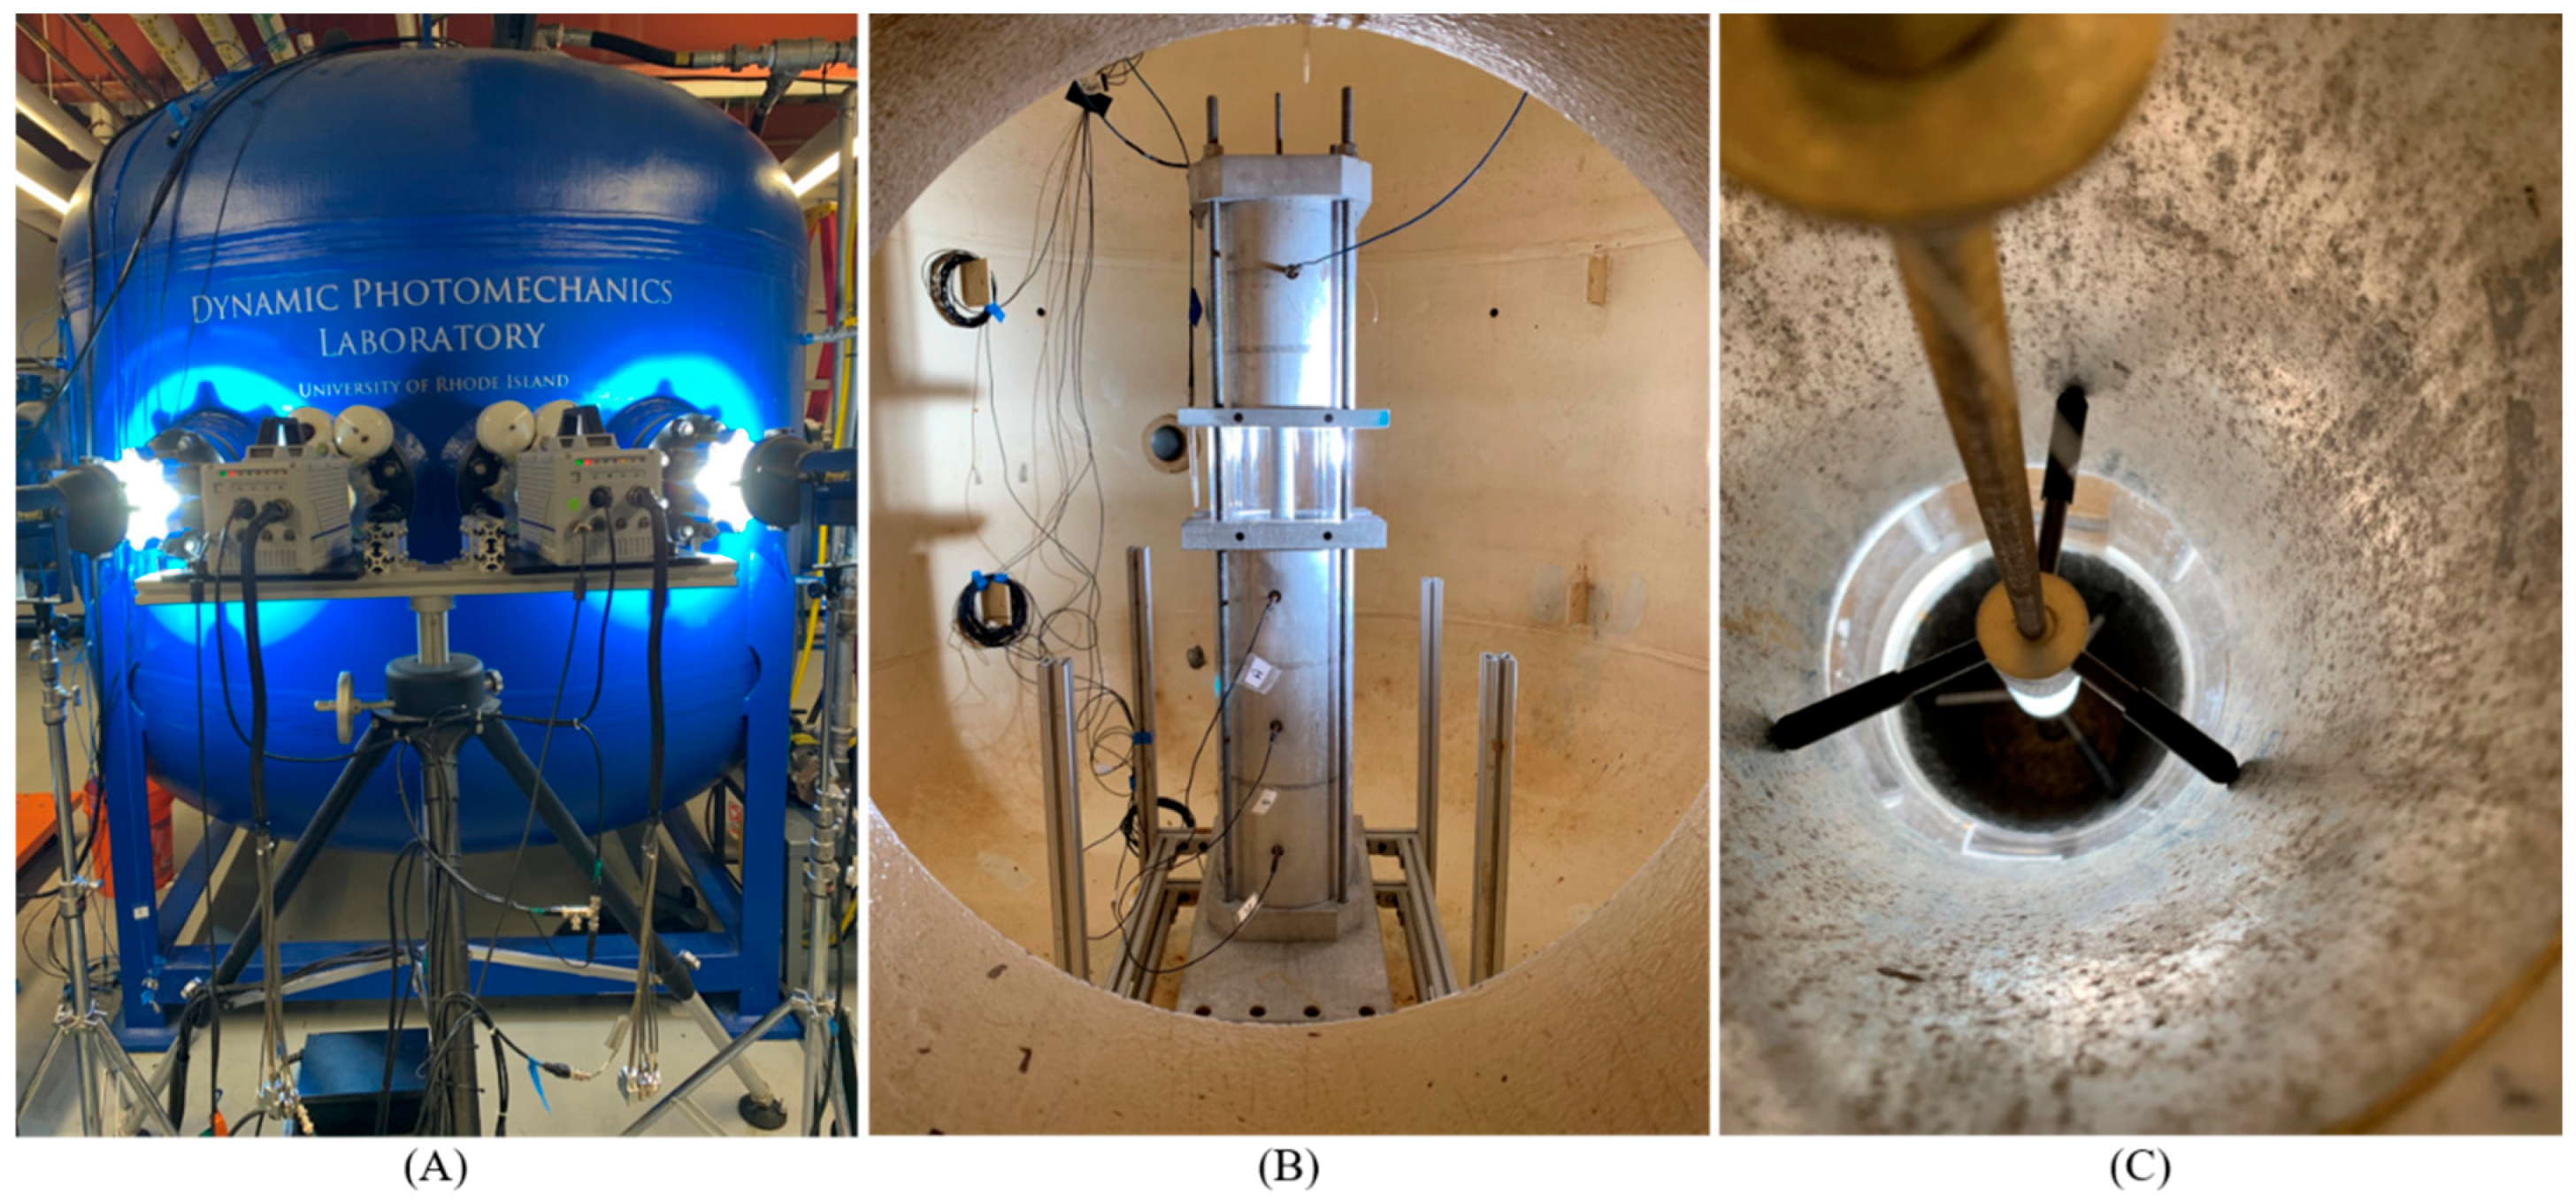
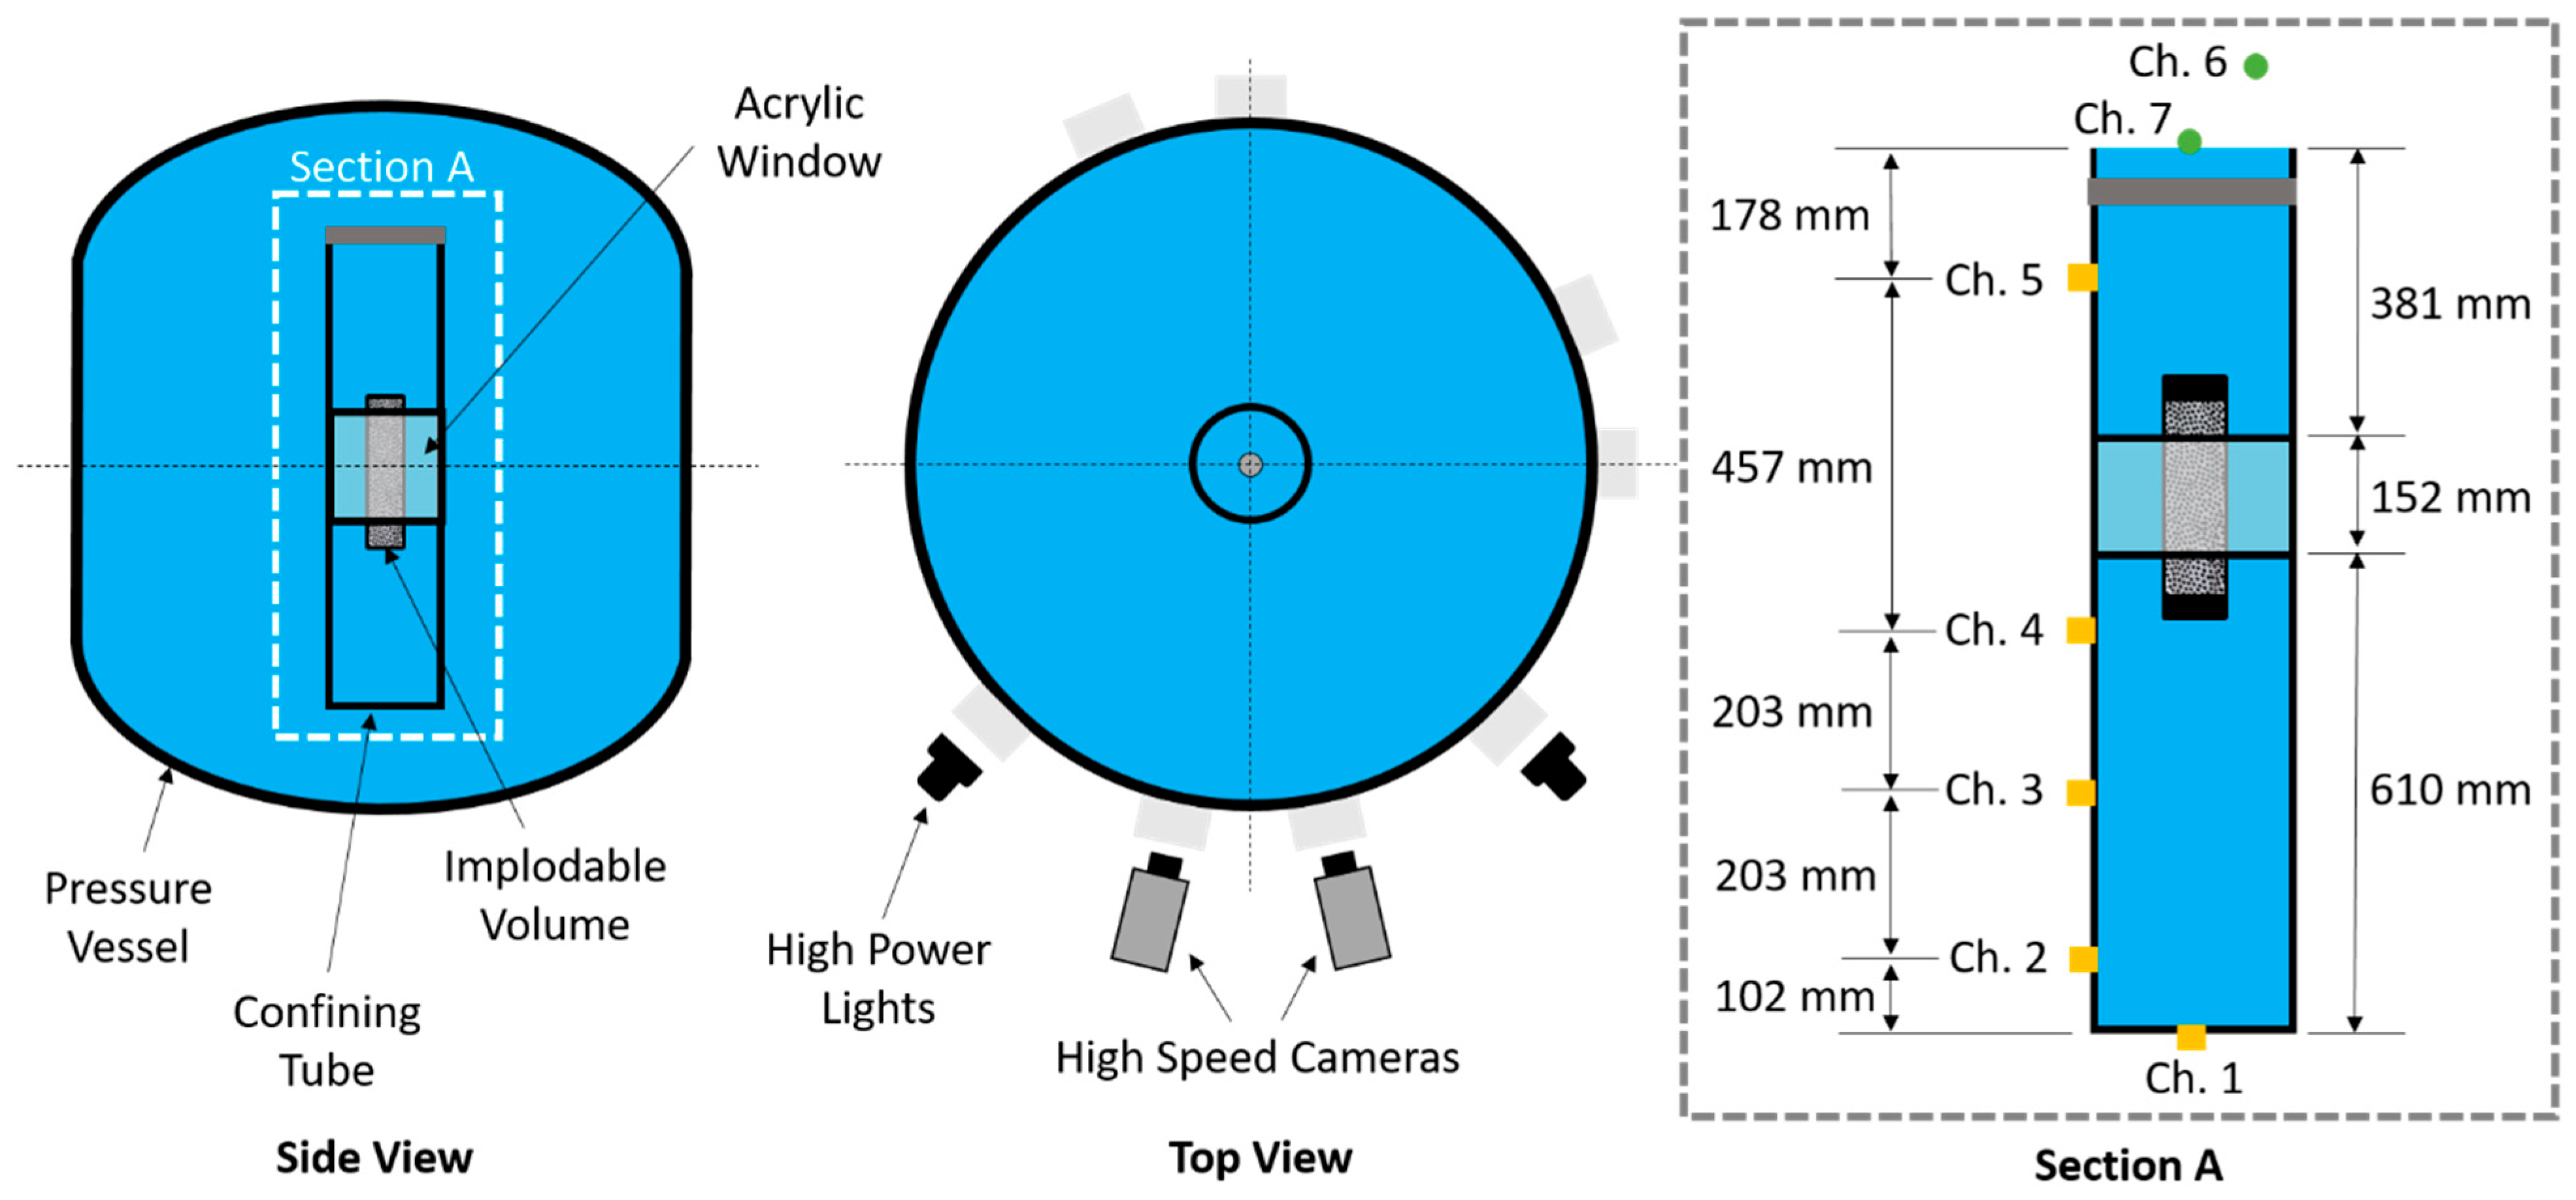
2. Experimental Procedure
3. Results and Discussions
3.1. Fundamentals of In-Tube Implosion
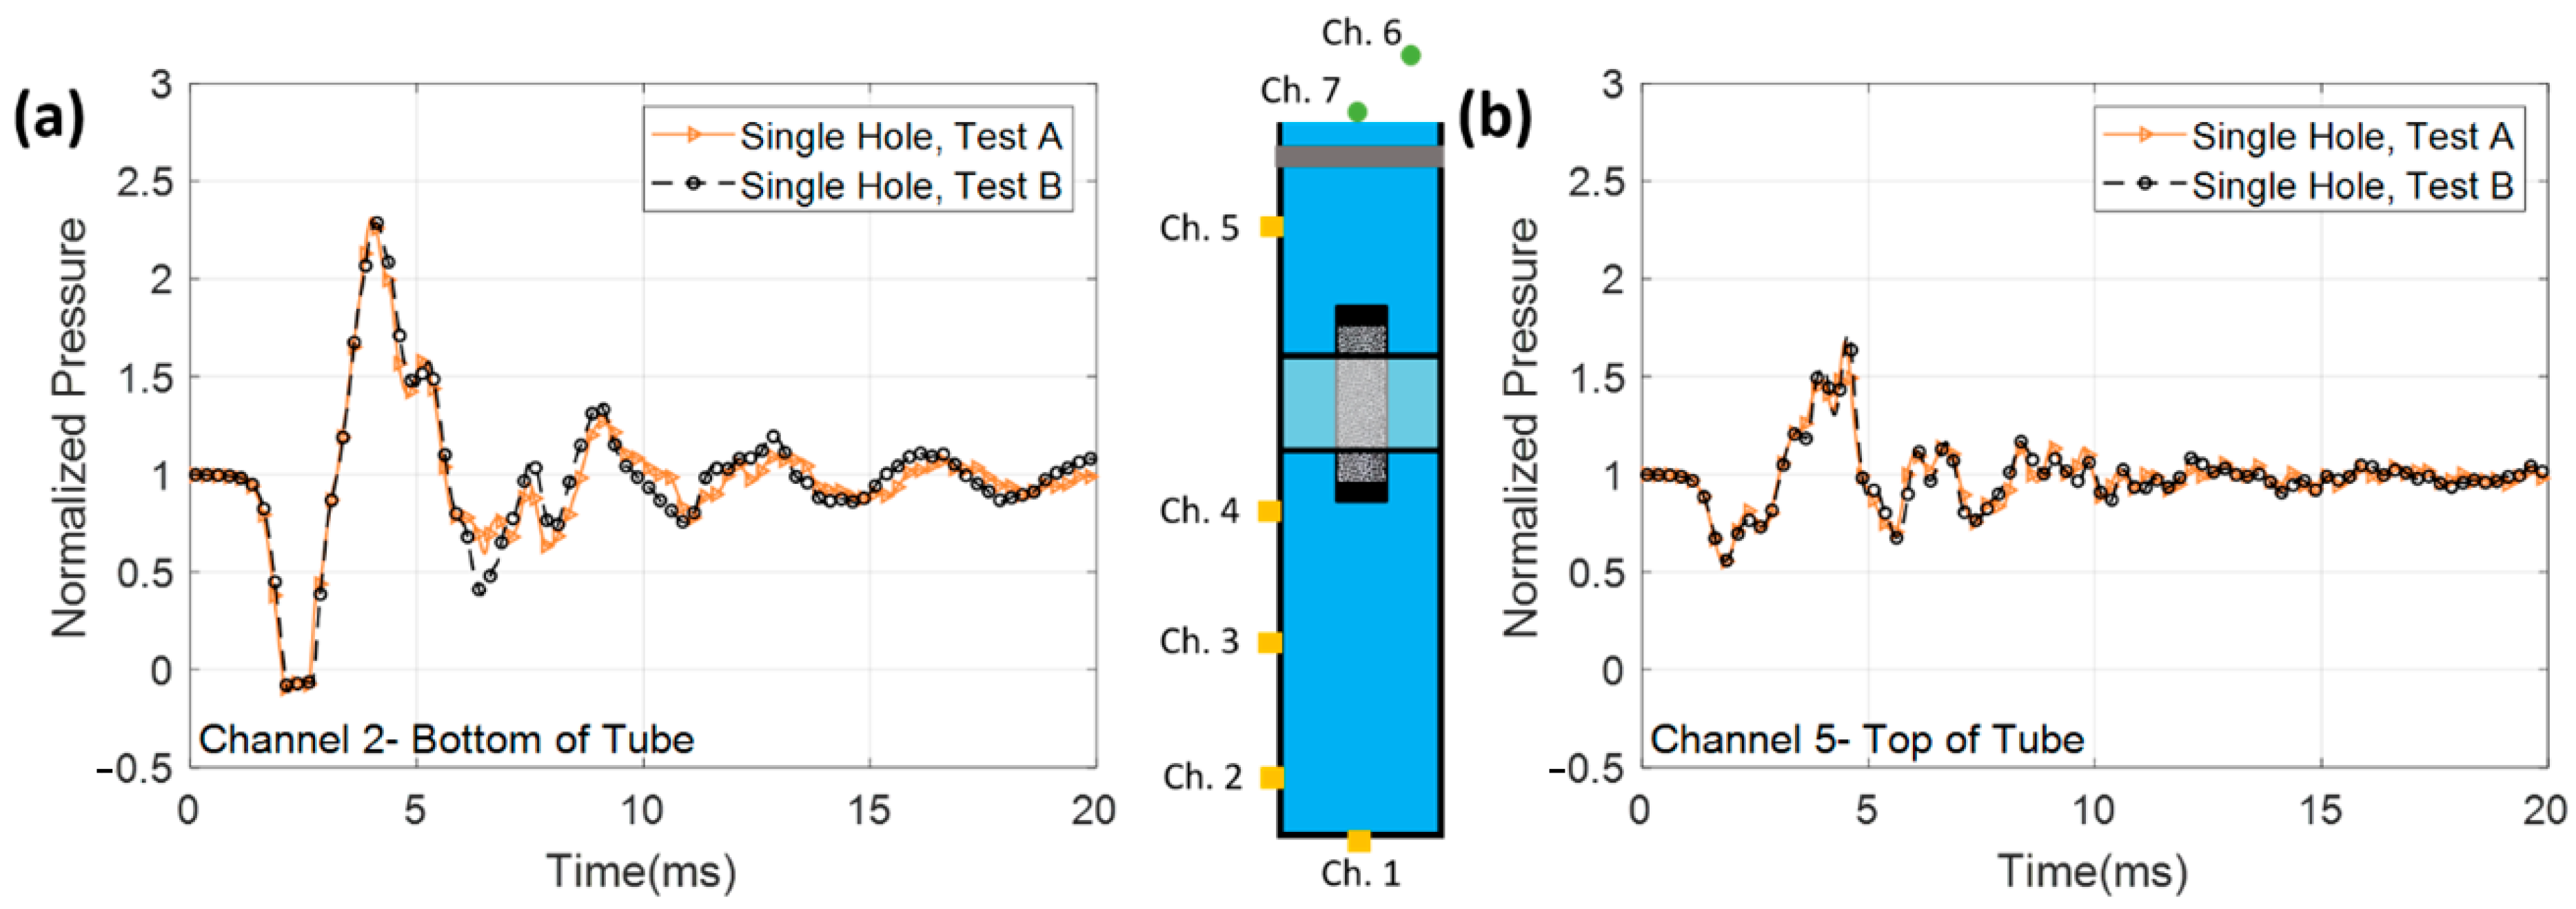
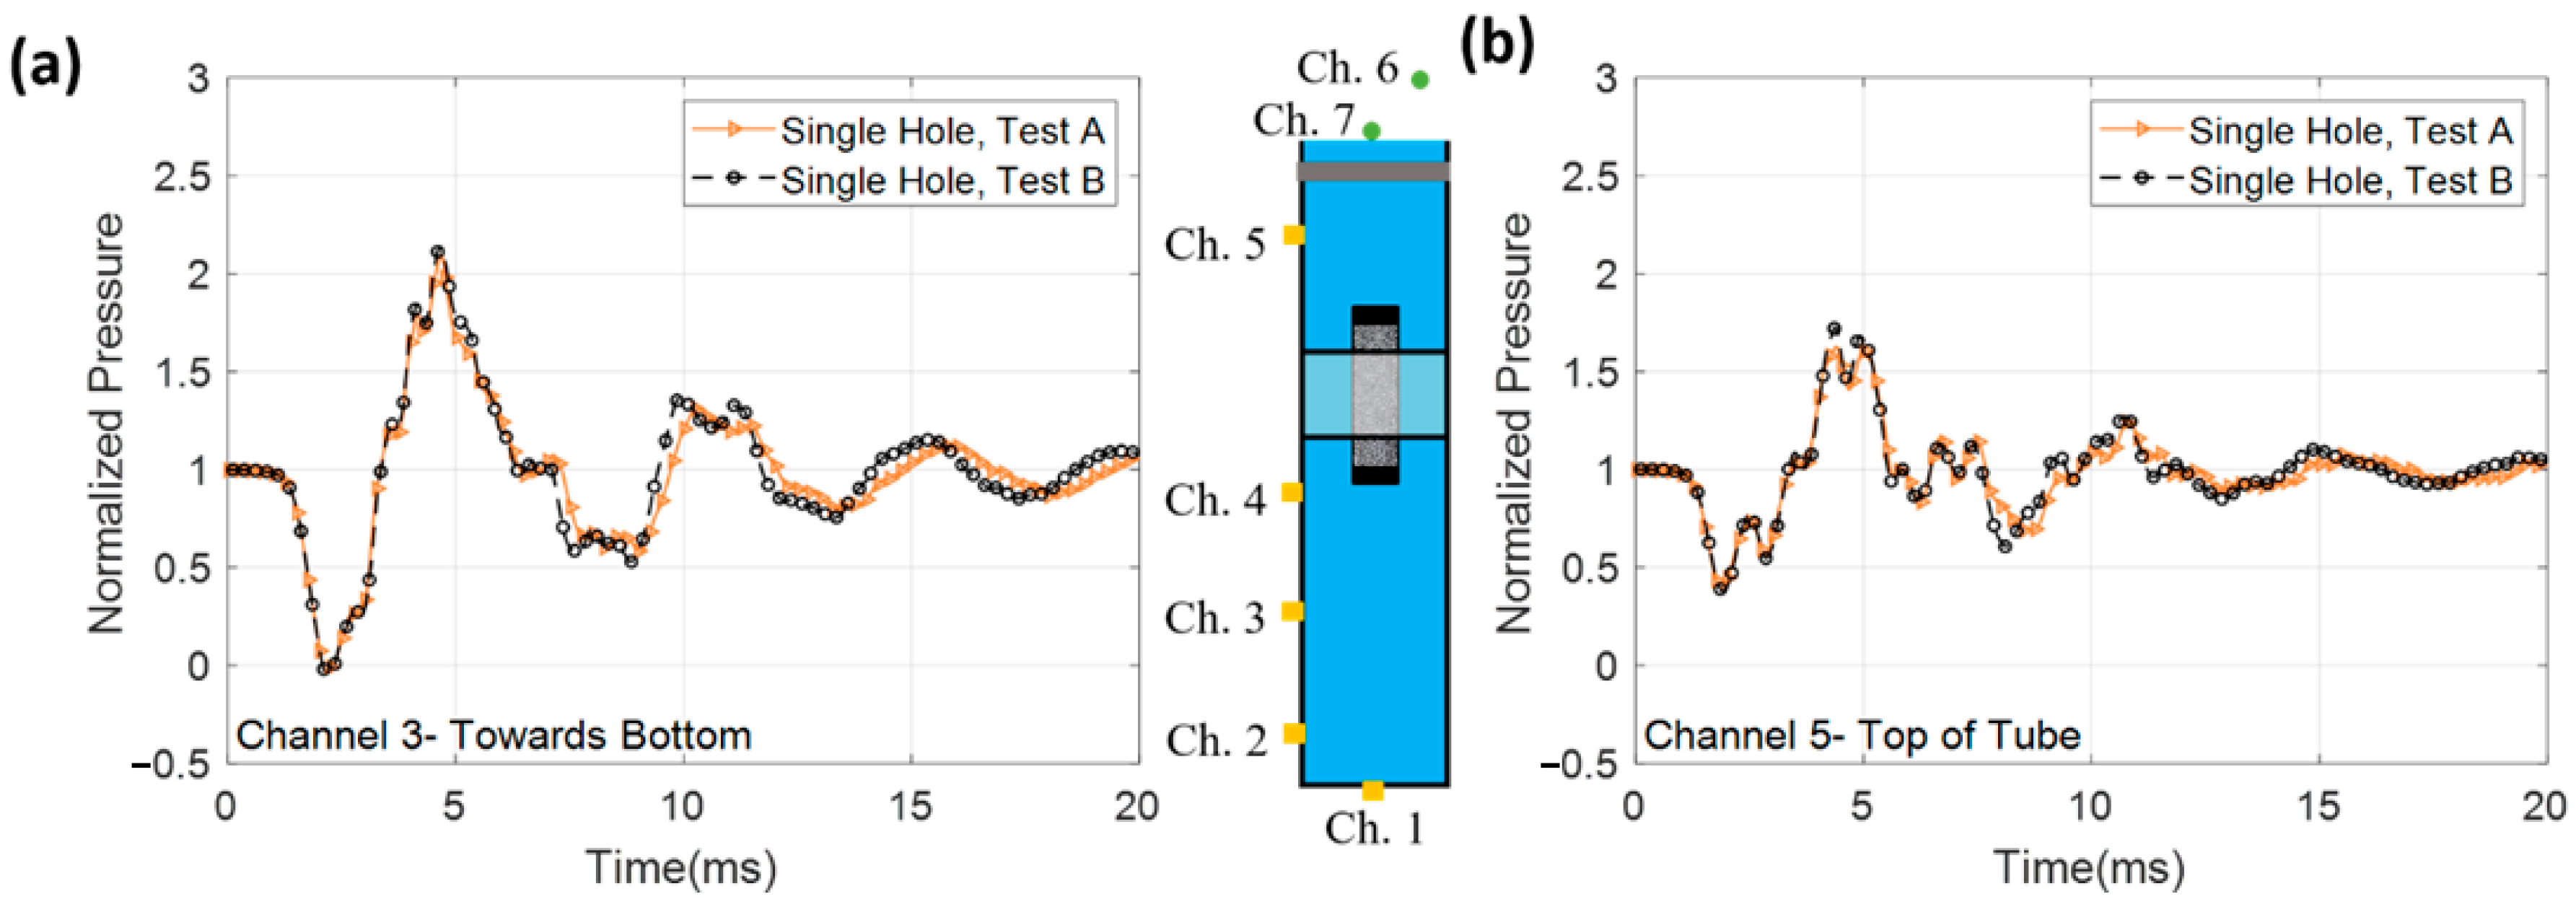
3.2. Repeatability of In-Tube Experiments
3.3. Effect of Flow Restriction
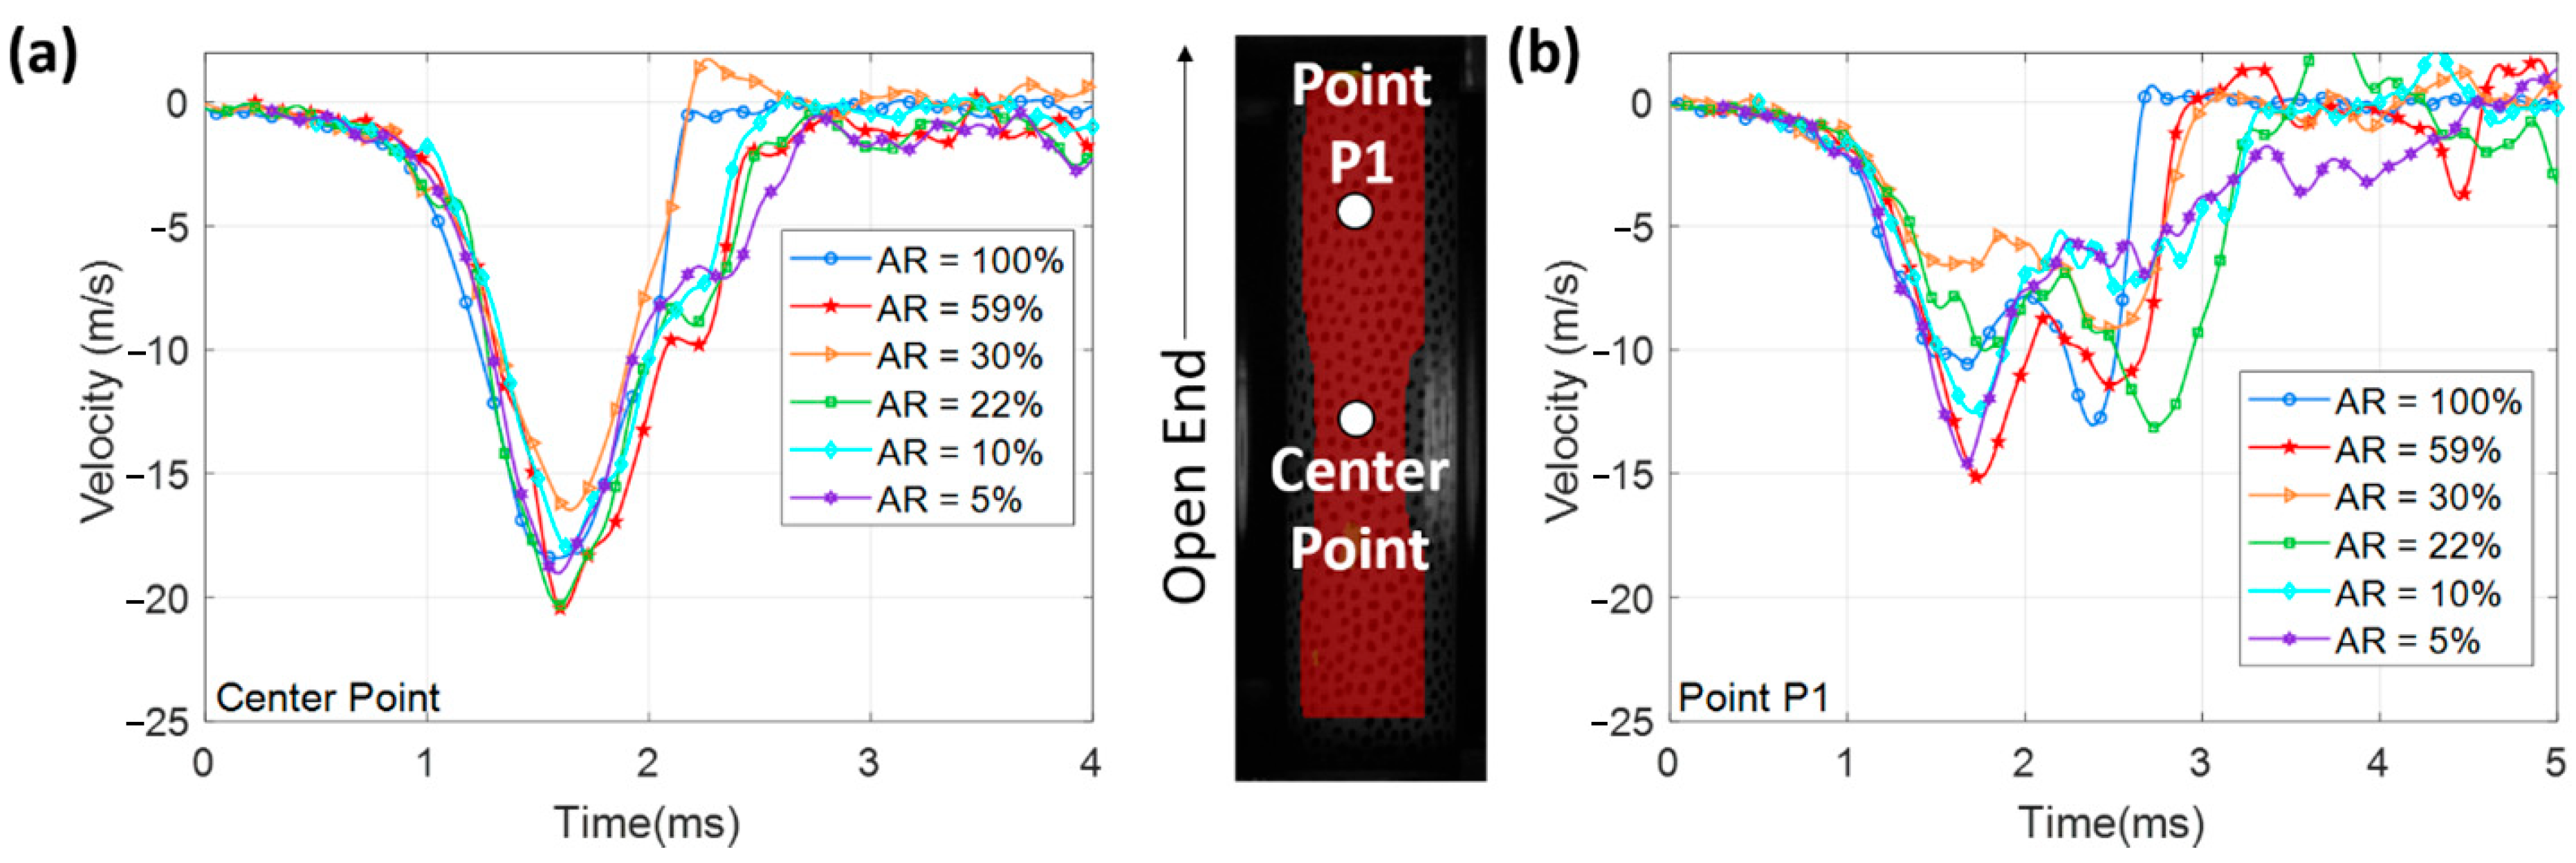
3.3.1. Structural Response
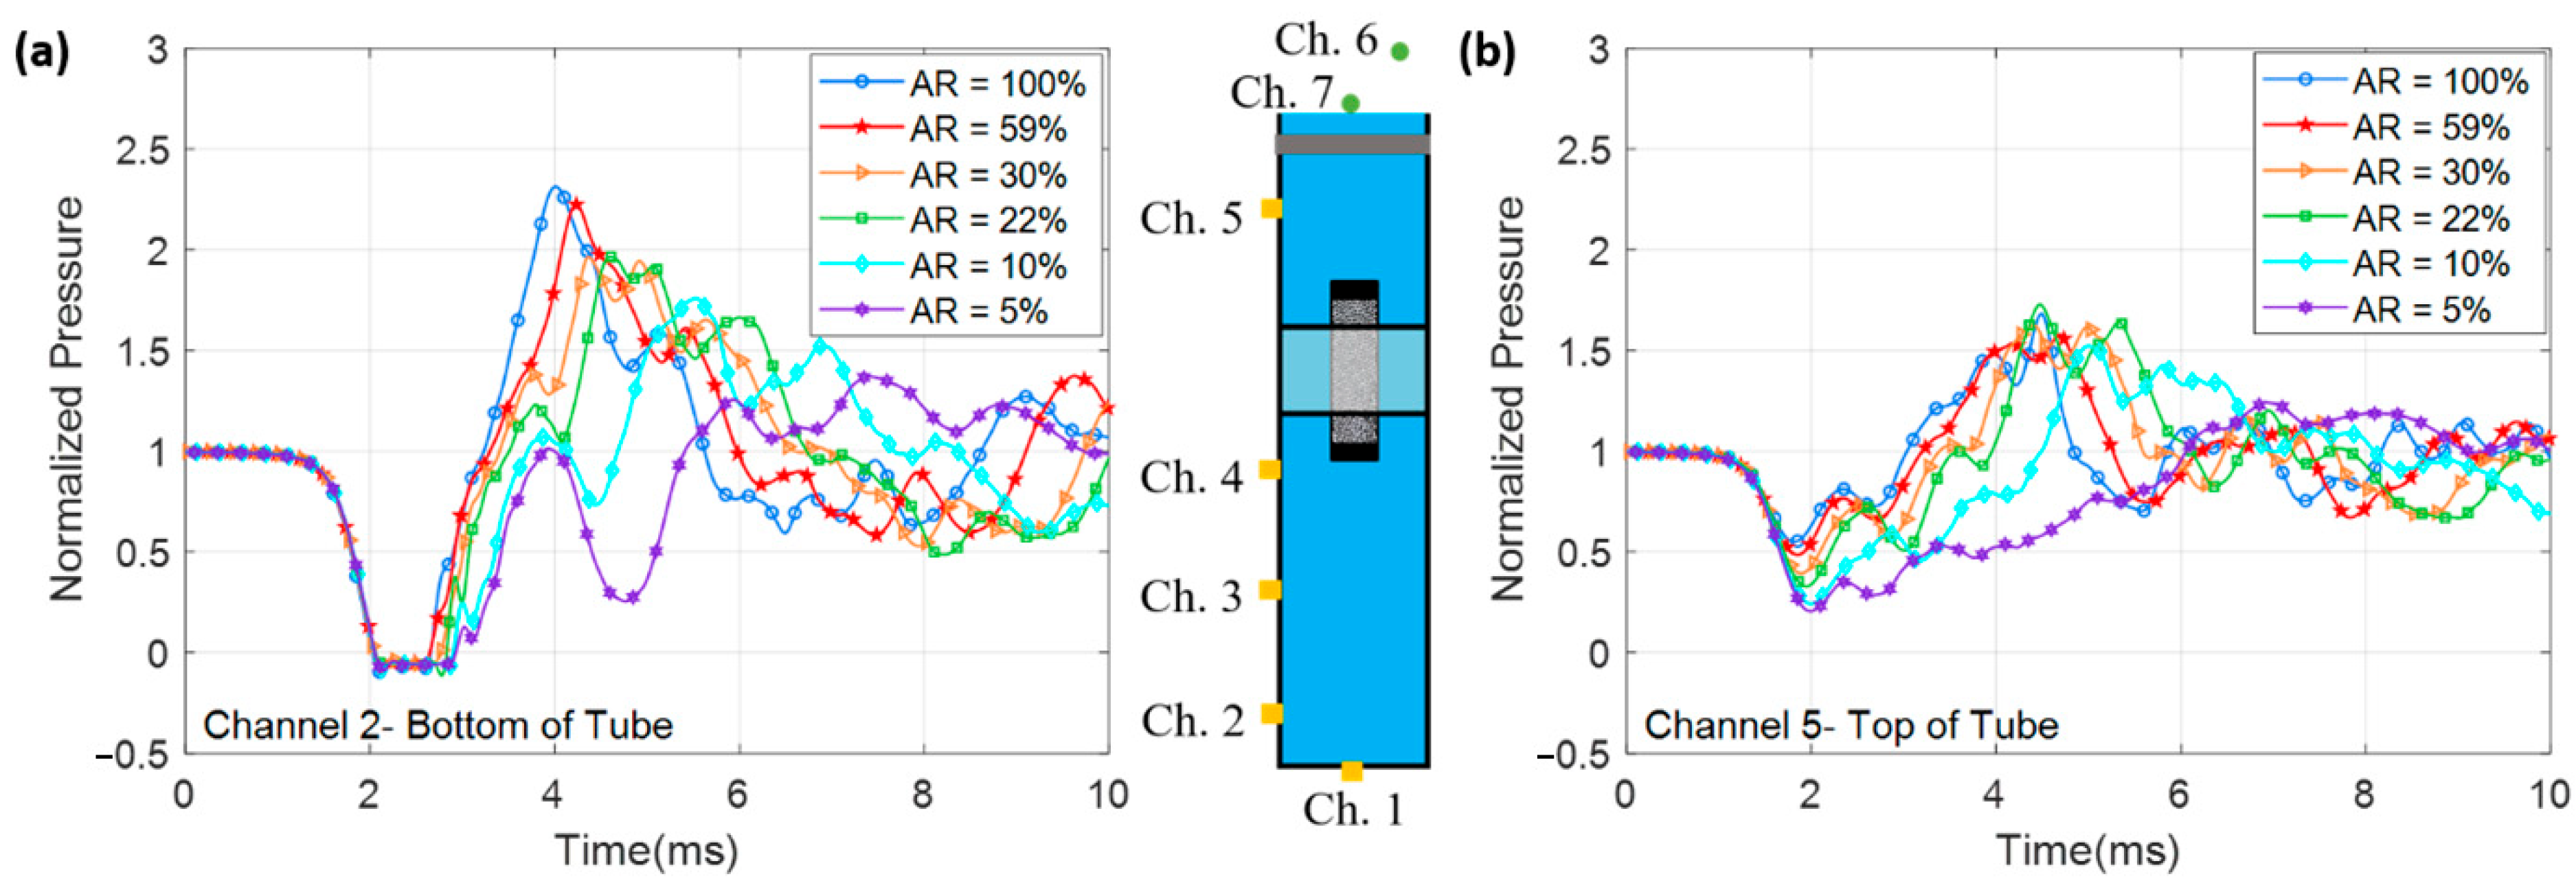
3.3.2. Pressure Response
3.3.3. Post-Experiment Results
3.4. Effect of Hole Configuration
4. Conclusions
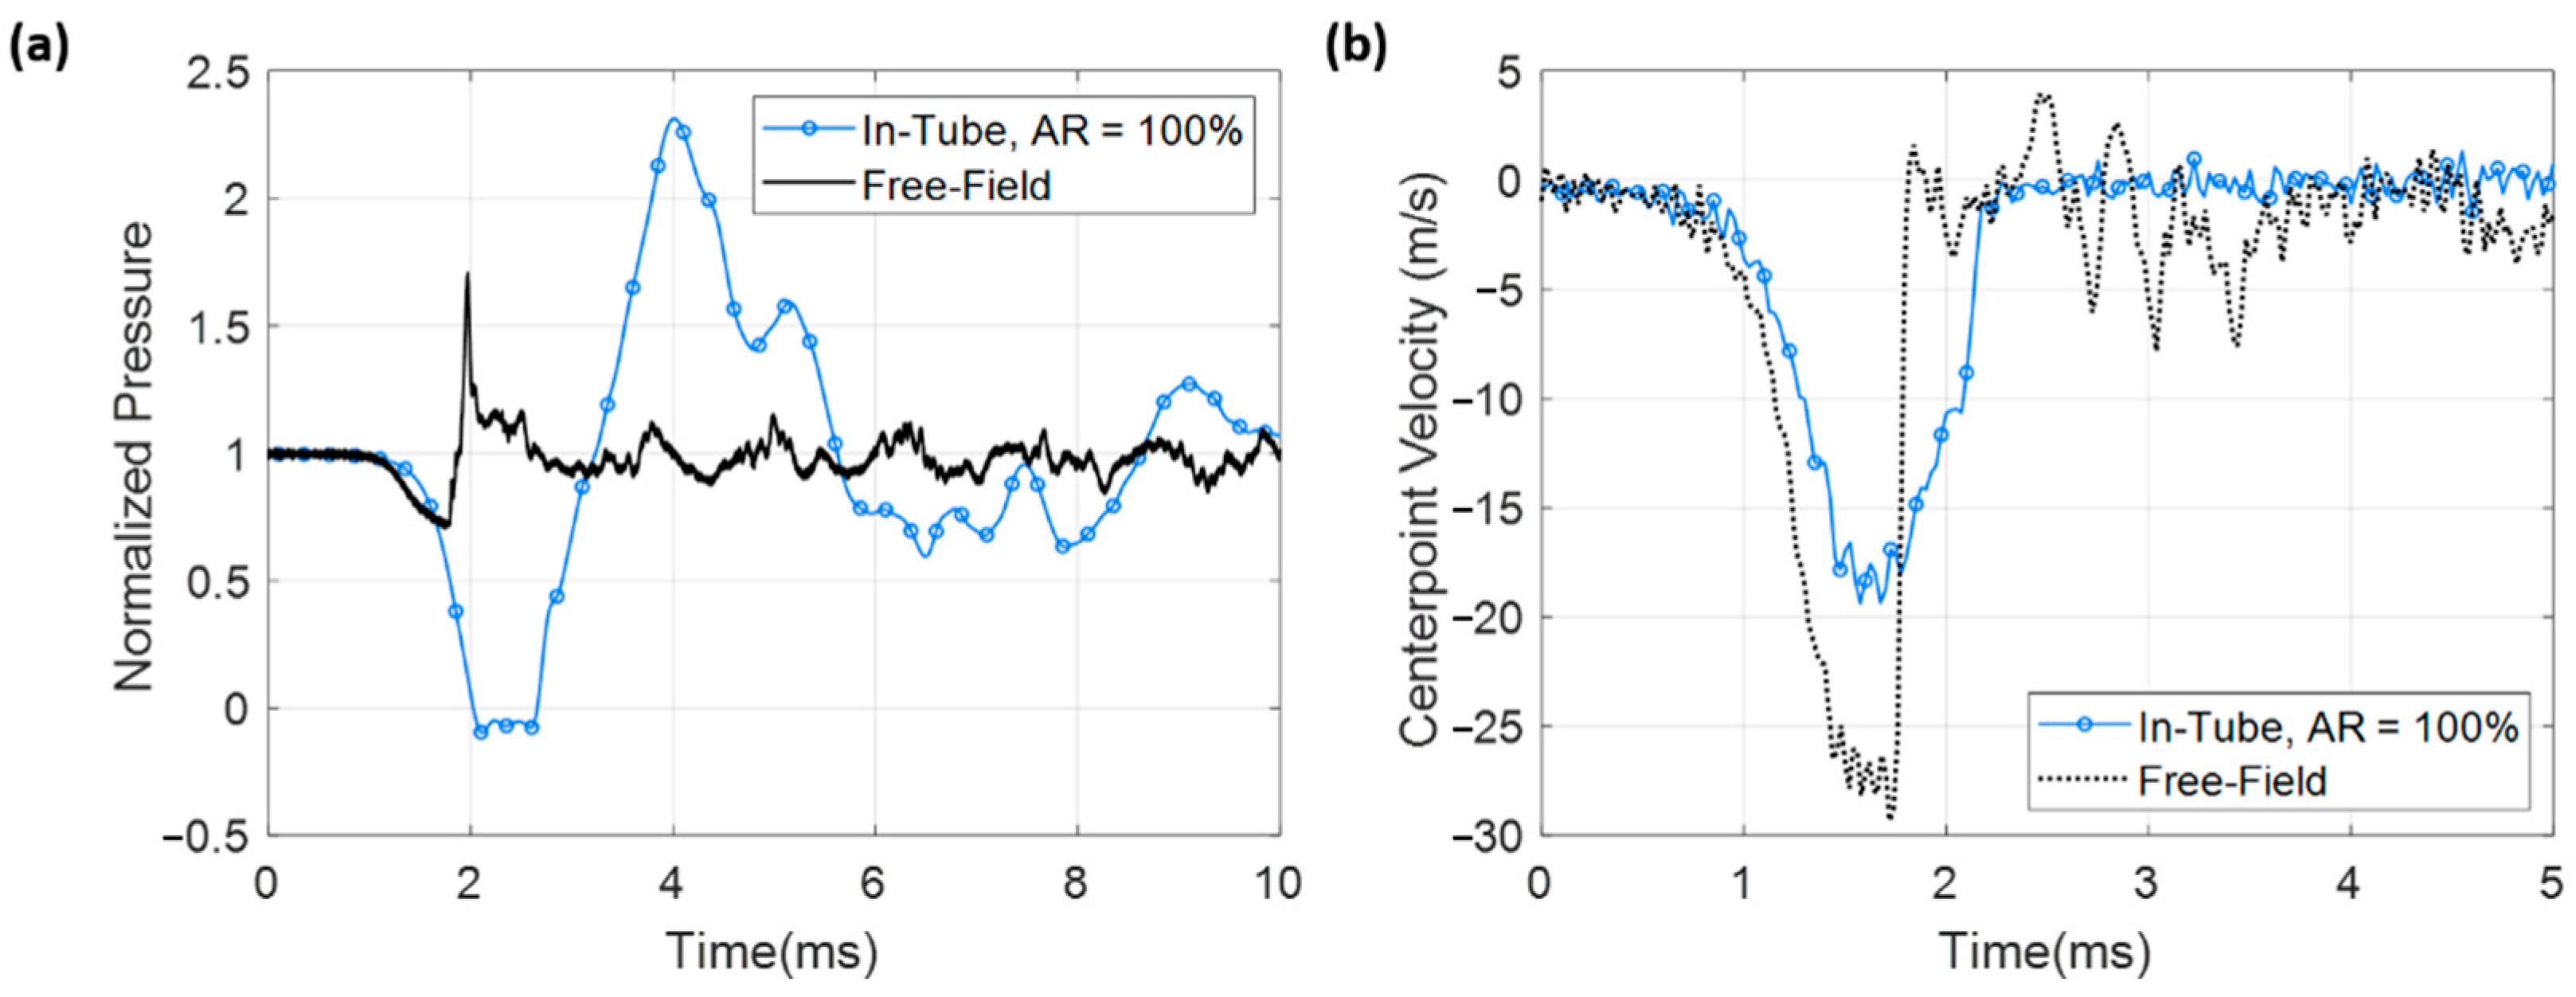
- There is a significant difference in the timing and magnitude of the pressure–time history between free-field and in-tube implosion for all instances of flow restriction. This highlights the differences in the fluid behavior between the two scenarios.
- The consistent nature of the collapse of aluminum implodable volumes correlates to a high level of repeatability for in-tube experiments. Using this metric of repeatability as a relative quantity, it was shown that the configuration of holes has an effect on the pressure at the open end of the confining tube. At the closed end of the confining tube, this effect is lessened, where only the 16-hole ring shows a Russel Comprehensive error larger than the baseline repeatability.
- The area ratio contributes more significantly to the deformation of the implodable volume in later phases of the deformation as the flow of fluid into the confining tube becomes a more important contributor to the implosion dynamics. The maximum difference in peak velocity between flow restriction cases is 20% during the acceleration phase, but the maximum difference in peak velocity between flow restriction cases is 65% during the buckle propagation phase.
- For this combination of implodable volume and confining structure, the effect of area ratio on the severity of an implosion can be estimated by a combination of exponential functions and separated into two regions: a linear region and a decay region.
- In the linear region, which occurs between area ratios of 100% and 22%, there is very little impact on key metrics. The maximum difference between the two points within that region is 16% for peak pressure, 6% for over-pressure impulse, and 4% for total volumetric deformation.
- In the decay region, which occurs between area ratios of 22% and 5%, there is a significant impact on key metrics. The maximum difference between the two points within that region is 32% for peak pressure, 56% for over-pressure impulse, and 18% for total volumetric deformation.
Author Contributions
Funding
Data Availability Statement
Acknowledgments
Conflicts of Interest
References
- NOAA Ocean Exploration. Mission to USS Yorktown: Dive Highlights. 20 April 2025. Available online: https://oceanexplorer.noaa.gov/okeanos/explorations/okeanos-beyond-the-blue/ex2503/features/exploring-yorktown.html (accessed on 7 June 2025).
- Critchley, L. In 2025, People Will Try Living in This Underwater Habitat. 31 December 2024. Available online: https://spectrum.ieee.org/ocean-engineering (accessed on 7 June 2025).
- Keevin, T.M.; Hempen, G.L. The Environmental Effects of Underwater Explosions with Methods to Mitigate Impacts; SDMS Doc ID 550560; U.S. Army Corps of Engineers: St. Louis, MO, USA, 1997. [Google Scholar]
- McKiernan, J. Offshore Wind Firms Told WWII Bomb Disposals Must Be Less Noisy. 21 January 2025. Available online: www.bbc.com/news/articles/c1dgrvww3qeo (accessed on 7 June 2025).
- Feder, T. Accident Cripples Super-Kamiokande Neutrino Observatory. Phys. Today 2002, 55, 22. [Google Scholar] [CrossRef]
- Turner, S.E.; Ambrico, J.M. Underwater Implosion of Cylindrical Metal Tubes. J. Appl. Mech. 2012, 80, 011013. [Google Scholar] [CrossRef]
- Isaacs, J.D.; Maxwell, A.E. The ball-breaker, a deep water signaling device. J. Mar. Res. 1952, 11, 63–68. [Google Scholar]
- Urick, R.J. Implosions as Sources of Underwater Sound. J. Acoust. Soc. Am. 1963, 35, 2026–2027. [Google Scholar] [CrossRef]
- Vanzant, B.; Russel, J.; Schraeder, A.; DeHart, E. Near-Field Pressure Response Due to a Sphere Imploding in Water; Southwest Research Institute: San Antonio, TX, USA, 1967. [Google Scholar]
- Orr, M.; Schoenberg, M. Acoustic signatures from deep water implosions of spherical cavities. J. Acoust. Soc. Am. 1976, 59, 1155–1159. [Google Scholar] [CrossRef]
- Turner, S. Underwater Implosion of Glass Spheres. J. Acoust. Soc. Am. 2007, 121, 844–852. [Google Scholar] [CrossRef]
- Farhat, C.; Wang, K.; Main, A.; Kyriakides, S.; Lee, L.-H.; Ravi-Chandar, K.; Belytschko, T. Dynamic implosion of underwater cylindrical shells: Experiments and Computations. Int. J. Solids Struct. 2013, 50, 2943–2961. [Google Scholar] [CrossRef]
- Ikeda, C.M.; Wilkerling, J.; Duncan, J.H. The implosion of cylindrical shell structures in a high-pressure water environment. Proc. R. Soc. A Math. Phys. Eng. Sci. 2013, 469, 20130443. [Google Scholar] [CrossRef]
- Gish, L.; Wierzbicki, T. Estimation of the underwater implosion pulse from cylindrical metal shells. Int. J. Impact Eng. 2015, 77, 166–175. [Google Scholar] [CrossRef]
- Sun, S.; Chen, F.; Zhao, M. Numerical simulation and analysis of the underwater implosion of spherical hollow ceramic pressure hulls in 11000 m depth. J. Ocean Eng. Sci. 2022, 8, 181–195. [Google Scholar] [CrossRef]
- Cho, S.-R.; Muttaqie, T.; Do, Q.T.; Kim, S.; Kim, S.M.; Han, D.-H. Experimental investigations on the failure modes of ring-stiffened cylinders under external hydrostatic pressure. Int. J. Nav. Arch. Ocean Eng. 2018, 10, 711–729. [Google Scholar] [CrossRef]
- Muttaqie, T.; Park, S.H.; Sohn, J.M.; Cho, S.; Nho, I.S.; Han, S.; Cho, Y.K. Implosion tests of aluminium-alloy ring-stiffened cylinders subjected to external hydrostatic pressure. Mar. Struct. 2021, 78, 102980. [Google Scholar] [CrossRef]
- Chamberlin, R.E.; Guzas, E.L.; Ambrico, J.M. Energy balance during underwater implosion of ductile metallic cylinders. J. Acoust. Soc. Am. 2014, 136, 2489–2496. [Google Scholar] [CrossRef]
- Gupta, S.; Parameswaran, V.; Sutton, M.A.; Shukla, A. Study of dynamic underwater implosion mechanics using digital image correlation. Proc. R. Soc. A 2014, 470, 20140576. [Google Scholar] [CrossRef]
- Pinto, M.; Gupta, S.; Shukla, A. Study of implosion of carbon/epoxy composite hollow cylinders using 3-D Digital Image Correlation. Compos. Struct. 2015, 119, 272–286. [Google Scholar] [CrossRef]
- Kishore, S.; Parrikar, P.N.; Shukla, A. Response of an underwater cylindrical composite shell to a proximal implosion. J. Mech. Phys. Solids 2021, 152, 104414. [Google Scholar] [CrossRef]
- Muttaqie, T.; Park, S.H.; Sohn, J.M.; Cho, S.; Nho, I.S.; Han, S.; Lee, P.; Cho, Y.S. Experimental investigation on the implosion characteristics of thin cylindrical aluminum-alloy tubes. Int. J. Solids Struct. 2020, 200–201, 64–82. [Google Scholar] [CrossRef]
- Wei, C.; Chen, G.; Sergeev, A.; Yeh, J.; Chen, J.; Wang, J.; Ji, S.; Wang, J.; Yang, D.; Xiang, S.; et al. Implosion of the Argentinian submarine ARA San Juan S-42 undersea: Modeling and simulation. Commun. Nonlinear Sci. Numer. Simul. 2020, 91, 105397. [Google Scholar] [CrossRef]
- Gupta, S.; LeBlanc, J.M.; Shukla, A. Mechanics of the implosion of cylindrical shells in a confining tube. Int. J. Solids Struct. 2014, 51, 3996–4014. [Google Scholar] [CrossRef]
- Gupta, S.; LeBlanc, J.M.; Shukla, A. Implosion of Longitudinally Off-Centered Cylindrical Volumes in a Confining Environment. J. Appl. Mech. 2015, 82, 051002. [Google Scholar] [CrossRef]
- Salazar, C.; Shukla, A. Dynamic Instability of Anisotropic Cylinders in a Pressurized Limited-Energy Underwater Environment. J. Dyn. Behav. Mater. 2018, 4, 425–439. [Google Scholar] [CrossRef]
- Matos, H.; Shukla, A. Mitigation of implosion energy from aluminum structures. Int. J. Solids Struct. 2016, 100-101, 566–574. [Google Scholar] [CrossRef]
- Matos, H.; Gupta, S.; Shukla, A. Structural instability and water hammer signatures from shock-initiated implosions in confining environments. Mech. Mater. 2018, 116, 169–179. [Google Scholar] [CrossRef]
- Salazar, C. Dynamic Instability of Composite Cylinders in Underwater Confining Environments. Master’s Thesis, University of Rhode Island, Kingston, RI, USA, 2019. [Google Scholar]
- Gupta, S.; Matos, H.; Shukla, A.; LeBlanc, J.M. Pressure signature and evaluation of hammer pulses during underwater implosion in confining environments. J. Acoust. Soc. Am. 2016, 140, 1012–1022. [Google Scholar] [CrossRef]
- Russell, D.M. Error measures for comparing transient data, Part I: Development Of a comprehensive error measure, Part II: Error measures case study. In Proceedings of the 68th Shock and Vibration Symposium, Hunt Valley, MD, USA, 3–6 November 1997. [Google Scholar]


| Plate No. | No. Holes | Hole Location | Area Ratio | Hole Dia. (mm) | Hole Dia. (in) |
|---|---|---|---|---|---|
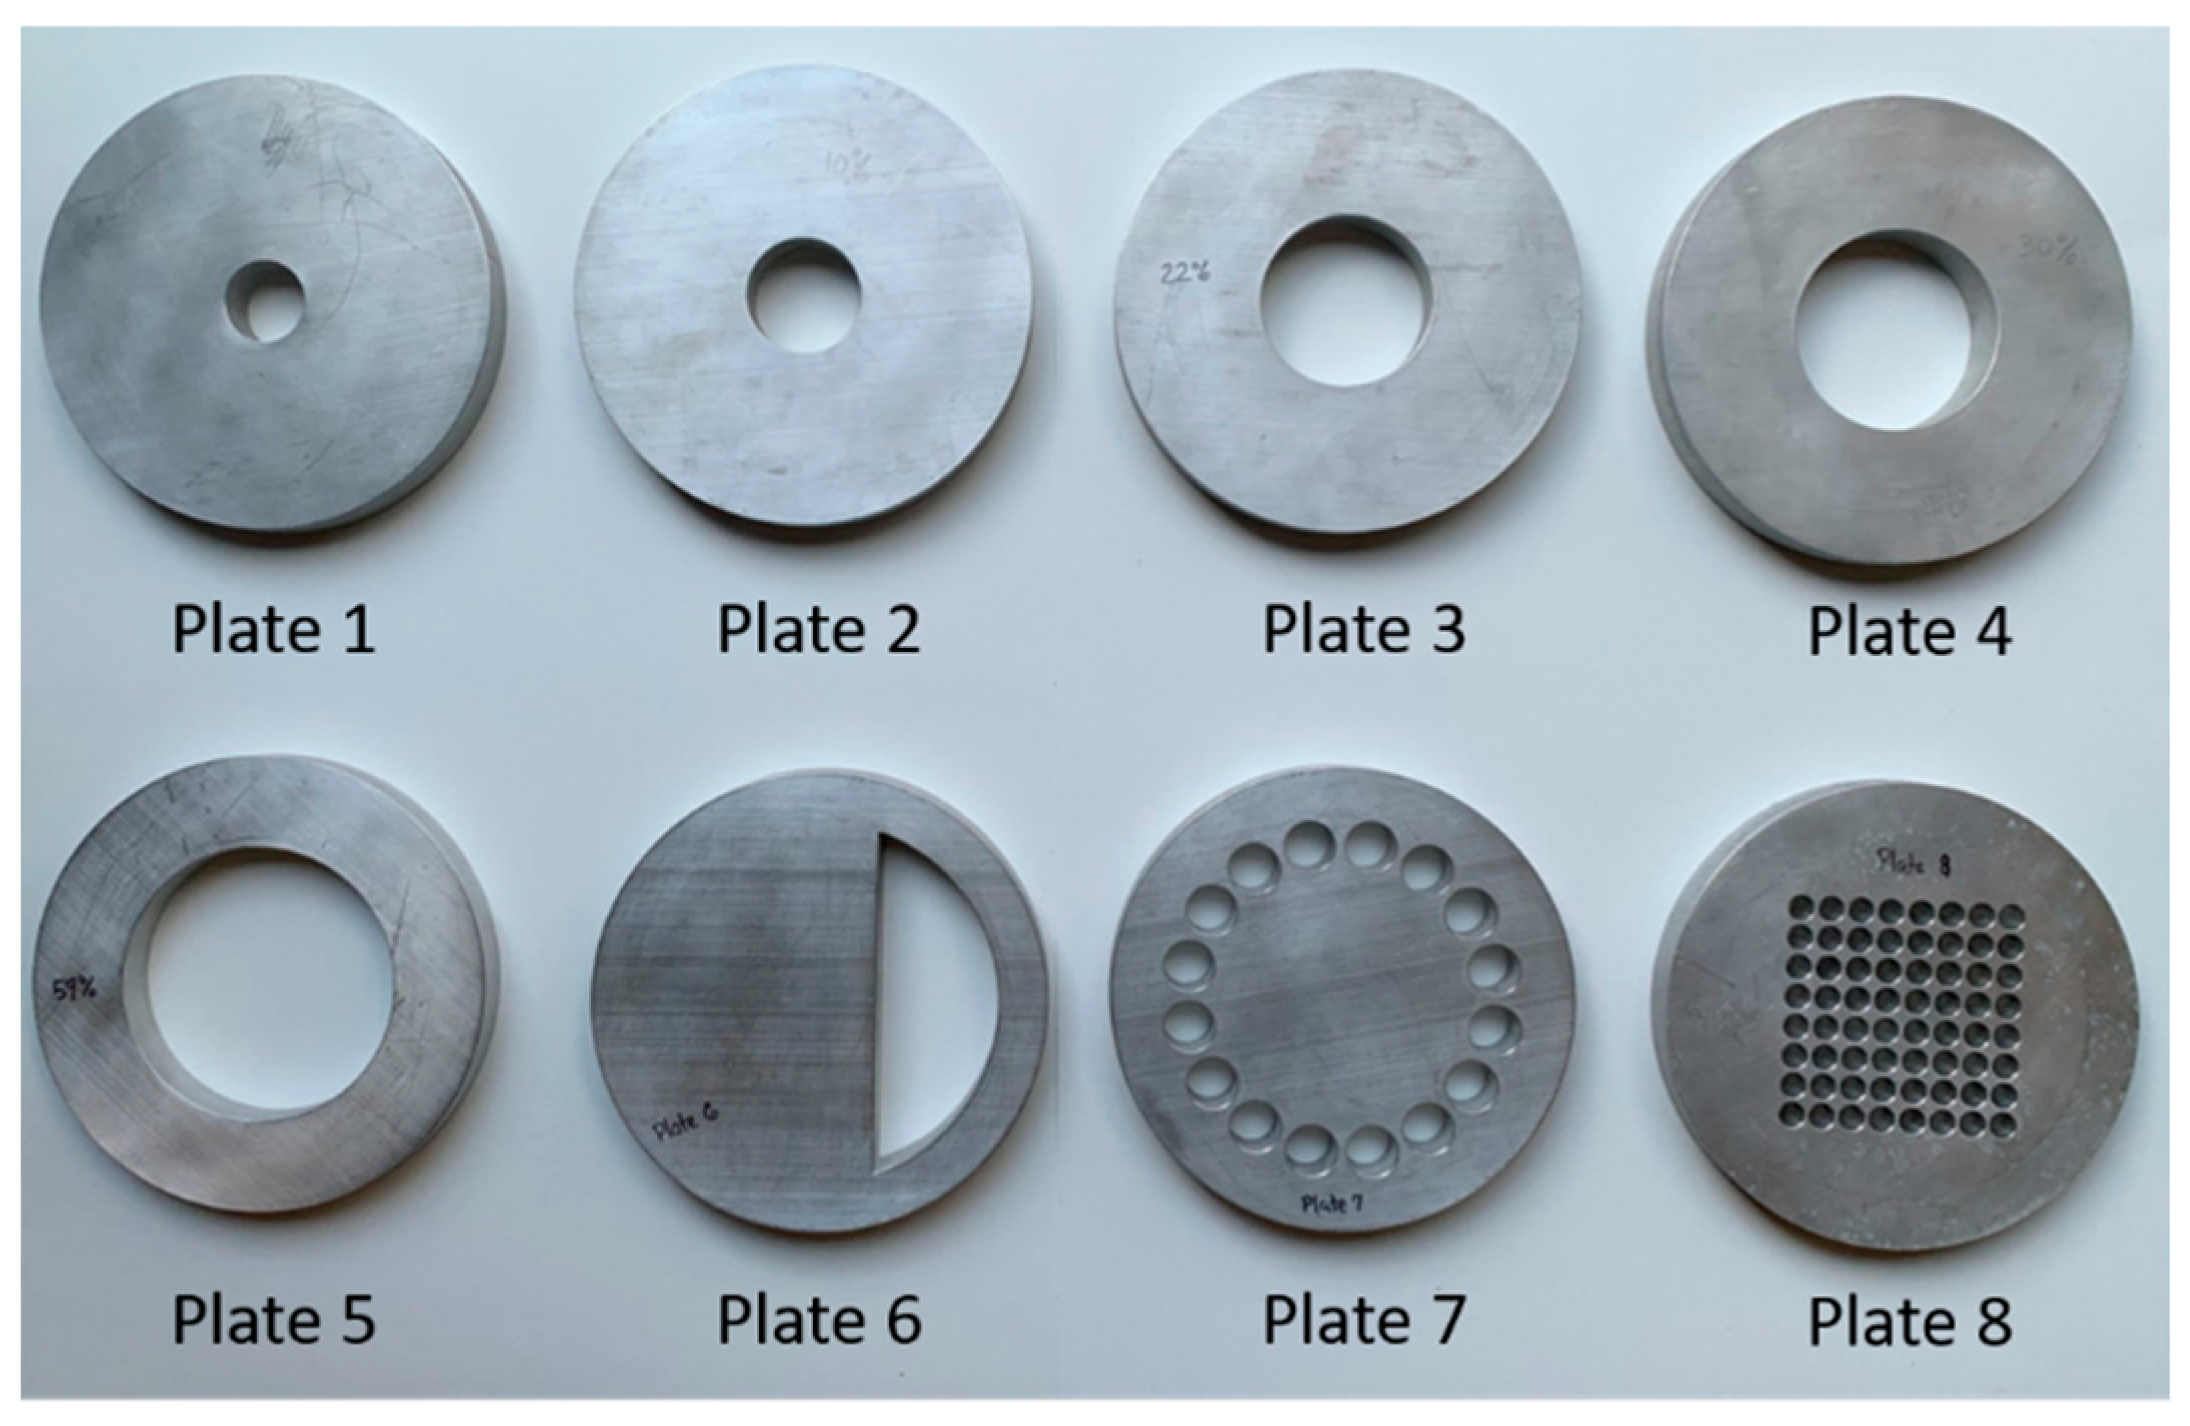
| Plate 1 | 1 | Center | 5% | 39.9 | 1.57 |
| Plate 2 | 1 | Center | 10% | 56.4 | 2.22 |
| Plate 3 | 1 | Center | 22% | 83.3 | 3.28 |
| Plate 4 | 1 | Center | 30% | 97.3 | 3.83 |
| Plate 5 | 1 | Center | 59% | 136.4 | 5.37 |
| Plate 6 | 1 | Edge | 30% | n/a 1 | n/a 1 |
| Plate 7 | 16 | Edge | 30% | 24.4 | 0.96 |
| Plate 8 | 64 | Center | 30% | 12.2 | 0.48 |
| Case | RC Closed End | RC Open End | Peak Pressure | Over-Pressure Impulse | Collapse Pressure |
|---|---|---|---|---|---|
| AR = 100% | 0.105 | 0.095 | 1.2% | 5.0% | 2.7% |
| AR = 30% | 0.126 | 0.132 | 1.4% | 6.1% | 0.5% |
| AR = 5% | 0.076 | 0.036 | 1.5% | 0.8% | 1.3% |
| K1 | K2 | K3 | K4 | R2 | RMSE |
|---|---|---|---|---|---|
| 1.885 | 0.002 | −1.665 | −0.227 | 0.9586 | 0.0692 |
| K5 | K6 | K7 | K8 | R2 | RMSE |
|---|---|---|---|---|---|
| 1.763 | −0.001 | −1.930 | −0.132 | 0.989 | 0.038 |
| Case | Closed End | Open End |
|---|---|---|
| Single-Hole Repeat | 0.126 | 0.132 |
| Off-Center | 0.091 (−) | 0.139 (+) |
| 16-Hole Ring | 0.176 (+) | 0.297 (+) |
| 64-Hole Center | 0.112 (−) | 0.178 (+) |
Disclaimer/Publisher’s Note: The statements, opinions and data contained in all publications are solely those of the individual author(s) and contributor(s) and not of MDPI and/or the editor(s). MDPI and/or the editor(s) disclaim responsibility for any injury to people or property resulting from any ideas, methods, instructions or products referred to in the content. |
© 2025 by the authors. Licensee MDPI, Basel, Switzerland. This article is an open access article distributed under the terms and conditions of the Creative Commons Attribution (CC BY) license (https://creativecommons.org/licenses/by/4.0/).
Share and Cite
Tilton, C.; Shukla, A. The Risk to the Undersea Engineering Ecosystem of Systems: Understanding Implosion in Confined Environments. J. Mar. Sci. Eng. 2025, 13, 1180. https://doi.org/10.3390/jmse13061180
Tilton C, Shukla A. The Risk to the Undersea Engineering Ecosystem of Systems: Understanding Implosion in Confined Environments. Journal of Marine Science and Engineering. 2025; 13(6):1180. https://doi.org/10.3390/jmse13061180
Chicago/Turabian StyleTilton, Craig, and Arun Shukla. 2025. "The Risk to the Undersea Engineering Ecosystem of Systems: Understanding Implosion in Confined Environments" Journal of Marine Science and Engineering 13, no. 6: 1180. https://doi.org/10.3390/jmse13061180
APA StyleTilton, C., & Shukla, A. (2025). The Risk to the Undersea Engineering Ecosystem of Systems: Understanding Implosion in Confined Environments. Journal of Marine Science and Engineering, 13(6), 1180. https://doi.org/10.3390/jmse13061180