Article

Observation of Near-Inertial Oscillation in an Anticyclonic Eddy in the Northern South China Sea

1
CNOOC Research Institute Co., Ltd., Beijing 100028, China
2
School of Marine Sciences, Nanjing University of Information Science & Technology, Nanjing 210044, China
3
State Key Laboratory of Satellite Ocean Environment Dynamics, Second Institute of Oceanography, Ministry of Natural Resources, Hangzou 310012, China
*
Author to whom correspondence should be addressed.
J. Mar. Sci. Eng. 2025, 13(6), 1079; https://doi.org/10.3390/jmse13061079
Submission received: 6 May 2025 / Revised: 26 May 2025 / Accepted: 27 May 2025 / Published: 29 May 2025
(This article belongs to the Special Issue Ocean Internal Waves and Circulation Dynamics in Climate Change)

Abstract

Anticyclonic mesoscale eddies are known to trap and modulate near-inertial kinetic energy (NIKE); however, the spatial distribution of NIKE within the eddy core and periphery, as well as the mechanisms driving its energy cascade to smaller scales, remains inadequately understood. This study analyzed the evolution of NIKE in anticyclonic eddies using satellite altimetry and field observations from four mooring arrays. By extracting near-inertial oscillations (NIOs) and subharmonic wave kinetic energy across mooring stations during the same period, we characterized the spatial structure of NIKE within the eddy field. The results revealed that NIKE was concentrated in the eddy core, where strong NIOs (peak velocity ~0.23 m/s) persisted for ~7 days, with energy primarily distributed at depths of 200–400 m and propagating inward from the periphery. Subharmonic waves fD1 generated by interactions between NIOs and diurnal tides highlighted the role of the vertical nonlinear term in energy transfer. A further analysis indicated that under vorticity confinement, NIKE accumulated in the core of the eddy and dissipated through shear instability and nonlinear wave interactions. The migrating anticyclonic eddy thus acted as a localized energy source, driving mixing and energy dissipation in the ocean interior.

1. Introduction

Near-inertial oscillations (NIOs), with frequencies approaching the local inertial frequency, are one of most energetic waves and recognized as critical contributors to ocean mixing through their intense shear effects, subsequently influencing marine biogeochemical cycles and climatic processes [1,2,3]. The generation mechanism of NIOs is predominantly attributed to resonant forcing by rapidly varying surface winds [4,5]. Following their excitation, these NIOs predominantly manifest within the surface mixed layer before dissipating energy through downward radiation into the ocean interior. Global estimates indicate that the wind-driven energy input to NIOs ranges from 0.3 to 1.5 TW [6,7,8], a magnitude comparable to that of the energy conversion from barotropic tides to internal tides [9].
Background potential vorticity emerges as a governing factor modulating both the energy cascade and vertical propagation characteristics of NIOs. The intrinsic wave frequency experiences a downward spectral shift from the planetary inertial frequency f to the effective frequency f_eff = f + ζ/2, where ζ represents the vertical component of relative vorticity [10,11]. The refraction mechanism (β-refraction for equatorward propagation and ζ-refraction for abyssal penetration) arises from the wave–mean flow interaction governed by the modified dispersion relation [12,13,14]. A fundamental asymmetry in wave–vortex dynamics is revealed: Anticyclonic eddies (negative ζ anomalies) induce sub-inertial frequency regimes (f_eff < f) through vortex stretching, satisfying the wave trapping condition required by the critical layer theorem [15]. Conversely, cyclonic eddies (positive ζ) exhibit wave exclusion due to super-inertial frequency domains. During anticyclonic eddy interactions, NIWs undergo critical layer trapping through two-phase energy transfer: (1) horizontal energy convergence toward eddy cores via turning point reflection and (2) vertical propagation arrest at critical layers where wave amplitude amplification and vertical wavelength contraction occur, a process termed the inertial chimney effect [15,16].
The inertial chimney effect has been robustly validated through both high-resolution numerical simulations [17,18,19,20] and in situ observation [21,22,23]. These studies confirmed that anticyclonic eddies facilitate NIO energy penetration from the surface mixed layer to abyssal depths, with particular efficacy for wind-forced NIOs generated under moderate wind stress conditions [24]. NIO energy dissipation predominantly occurs via vertical shear instability and nonlinear wave–wave interactions [25]. Nonlinear wave–wave interactions among internal ocean waves represent an effective mechanism for transferring energy to smaller scales [26]. When the amplitude of the forced waves is sufficiently large, the strongly nonlinear advection term can directly induce non-resonant wave–wave interactions among internal waves [27].
The South China Sea (SCS) is the largest marginal sea in the western Pacific. It not only frequently experiences typhoons but also serves as an active region for mesoscale eddies [28,29,30,31,32] and internal tides [33]. In particular, in the northern SCS, internal tides excited in the Luzon Strait propagate westward [33,34], and mesoscale eddies generated on the western side of the Luzon Strait also propagate westward along isobaths [28,35]. In recent years, field observations have revealed that NIOs in the northern SCS are primarily excited by wind field variations associated with tropical cyclones [28]. When a tropical cyclone passes, both the energy and shear of the NIOs are significantly enhanced [28,36]. Due to the active internal tides, observations indicate that during tropical cyclone events in the northern SCS, NIOs engage in wave–wave interactions with internal tides [37,38], transferring energy to subharmonic waves fD1 or fD2 (the frequency is the sum of the NIOs and the internal tide).
However, owing to the uncertainties in the trajectories of tropical cyclones and eddies, research on interactions among NIOs, eddies, and internal tides still has few high-spatial-resolution in situ observations. Xu et al. (2022) reported that an anticyclonic eddy in the northern SCS captured near-inertial energy and transported it over long distances [39]. The westward propagation of mesoscale eddies and internal tides in the northern SCS eventually reaches the northwestern part of the sea, yet the combined impact on the propagation and evolution of NIO energy remains insufficiently studied by in situ observations. In particular, during periods of pronounced internal tide activity, current research lacks synchronous observations of the NIO energy characteristics from the periphery to the center of the eddies.
In this study, velocity data acquired from four subsurface mooring stations in the northwestern SCS were used to investigate the evolution of NIOs in an anticyclonic eddy, as well as the subsequent strongly nonlinear interactions with internal tides. During the observation period, an anticyclonic eddy covered the four mooring stations, and a tropical cyclone passed through the nearby area, offering a unique opportunity to study the influence of mesoscale eddies on NIOs. The organization of this paper is as follows: Section 2 describes the data and methods used in this study; Section 3 presents the observational results of NIO energy within the anticyclonic eddy; and Section 4 discusses the evolution of NIO energy within the anticyclonic eddy.

2. Data and Methods

2.1. Data

The spatial characteristics of mesoscale eddies in the study region were investigated using satellite-derived Sea Level Anomaly (SLA) and geostrophic velocity anomaly datasets obtained from the Copernicus Marine Environment Monitoring Service. This Level-4 gridded product, accessible via https://doi.org/10.48670/moi-00148, integrates multi-satellite along-track measurements (Jason-3, Sentinel-3A/B, HY-2B) through an Optimal Interpolation (OI) scheme. The datasets are daily gridded with a spatial resolution of 0.25° × 0.25°. The daily ocean temperature was download from HYCOM (Hybrid Coordinate Ocean Model), https://tds.hycom.org/thredds/catalogs/GLBy0.08/expt_93.0_ts3z.html?dataset=GLBy0.08-expt_93.0-ts3z-2020 (accessed on 23 May 2025).
During the period from 1 June to 30 July 2020, an array of four subsurface moorings was deployed in the northwestern SCS at locations ME (16.80° N, 110.47° E), MC (16.85° N, 110.32° E), MN (17.17° N, 110.07° E), and MS (16.61° N, 110.31° E), with respective water depths of 1390 m, 1250 m, 1050 m, and 1310 m (Figure 1). An upward-looking 300 kHz acoustic Doppler current profiler (ADCP) and downward-looking 75 kHz ADCP were located at 100 m and 101 m depths, respectively, at ME, MC, and MN, providing velocity measurements spanning the 0–660 m water column. At ME and MC, malfunctions of the 300 kHz ADCP resulted in reduced coverage (100–660 m). The 300 kHz ADCP recorded currents in 4 m bins and the 75 kHz ADCP in 16 m bins at 10 min intervals, except at station MS, where an upward-looking 75 kHz ADCP deployed at 550 m recorded currents from 0 to 540 m at hourly intervals. In addition, station MS was equipped with a temperature–salinity string covering the 65–500 m depth range, also sampling hourly. For subsequent analysis, current data from stations ME, MC, and MN were first averaged hourly and then vertically interpolated to a 10 m resolution. Likewise, the temperature, salinity, and current data from station MS were interpolated to a 10 m vertical grid, with the temperature–salinity records being used to estimate the buoyancy frequency.

2.2. Methods

A rotary spectral analysis was performed on the time series of the zonal and meridional velocity components [40]. To characterize the variations in the current signals at different periods, a band-pass and low-pass filter was applied to the velocity time series. Specifically, for extracting the NIO signal, the filter passband was set to 0.85–1.25 f0 (f0 is the local inertial frequency). Moreover, subharmonic waves fD1, which occur at a frequency of f = f0 + D1 (with D1 denoting the diurnal tidal frequency), were extracted using a passband of 0.85–1.25 f. The low-frequency (period greater than 3 days) components of the ocean current were extracted using a low-pass filter.
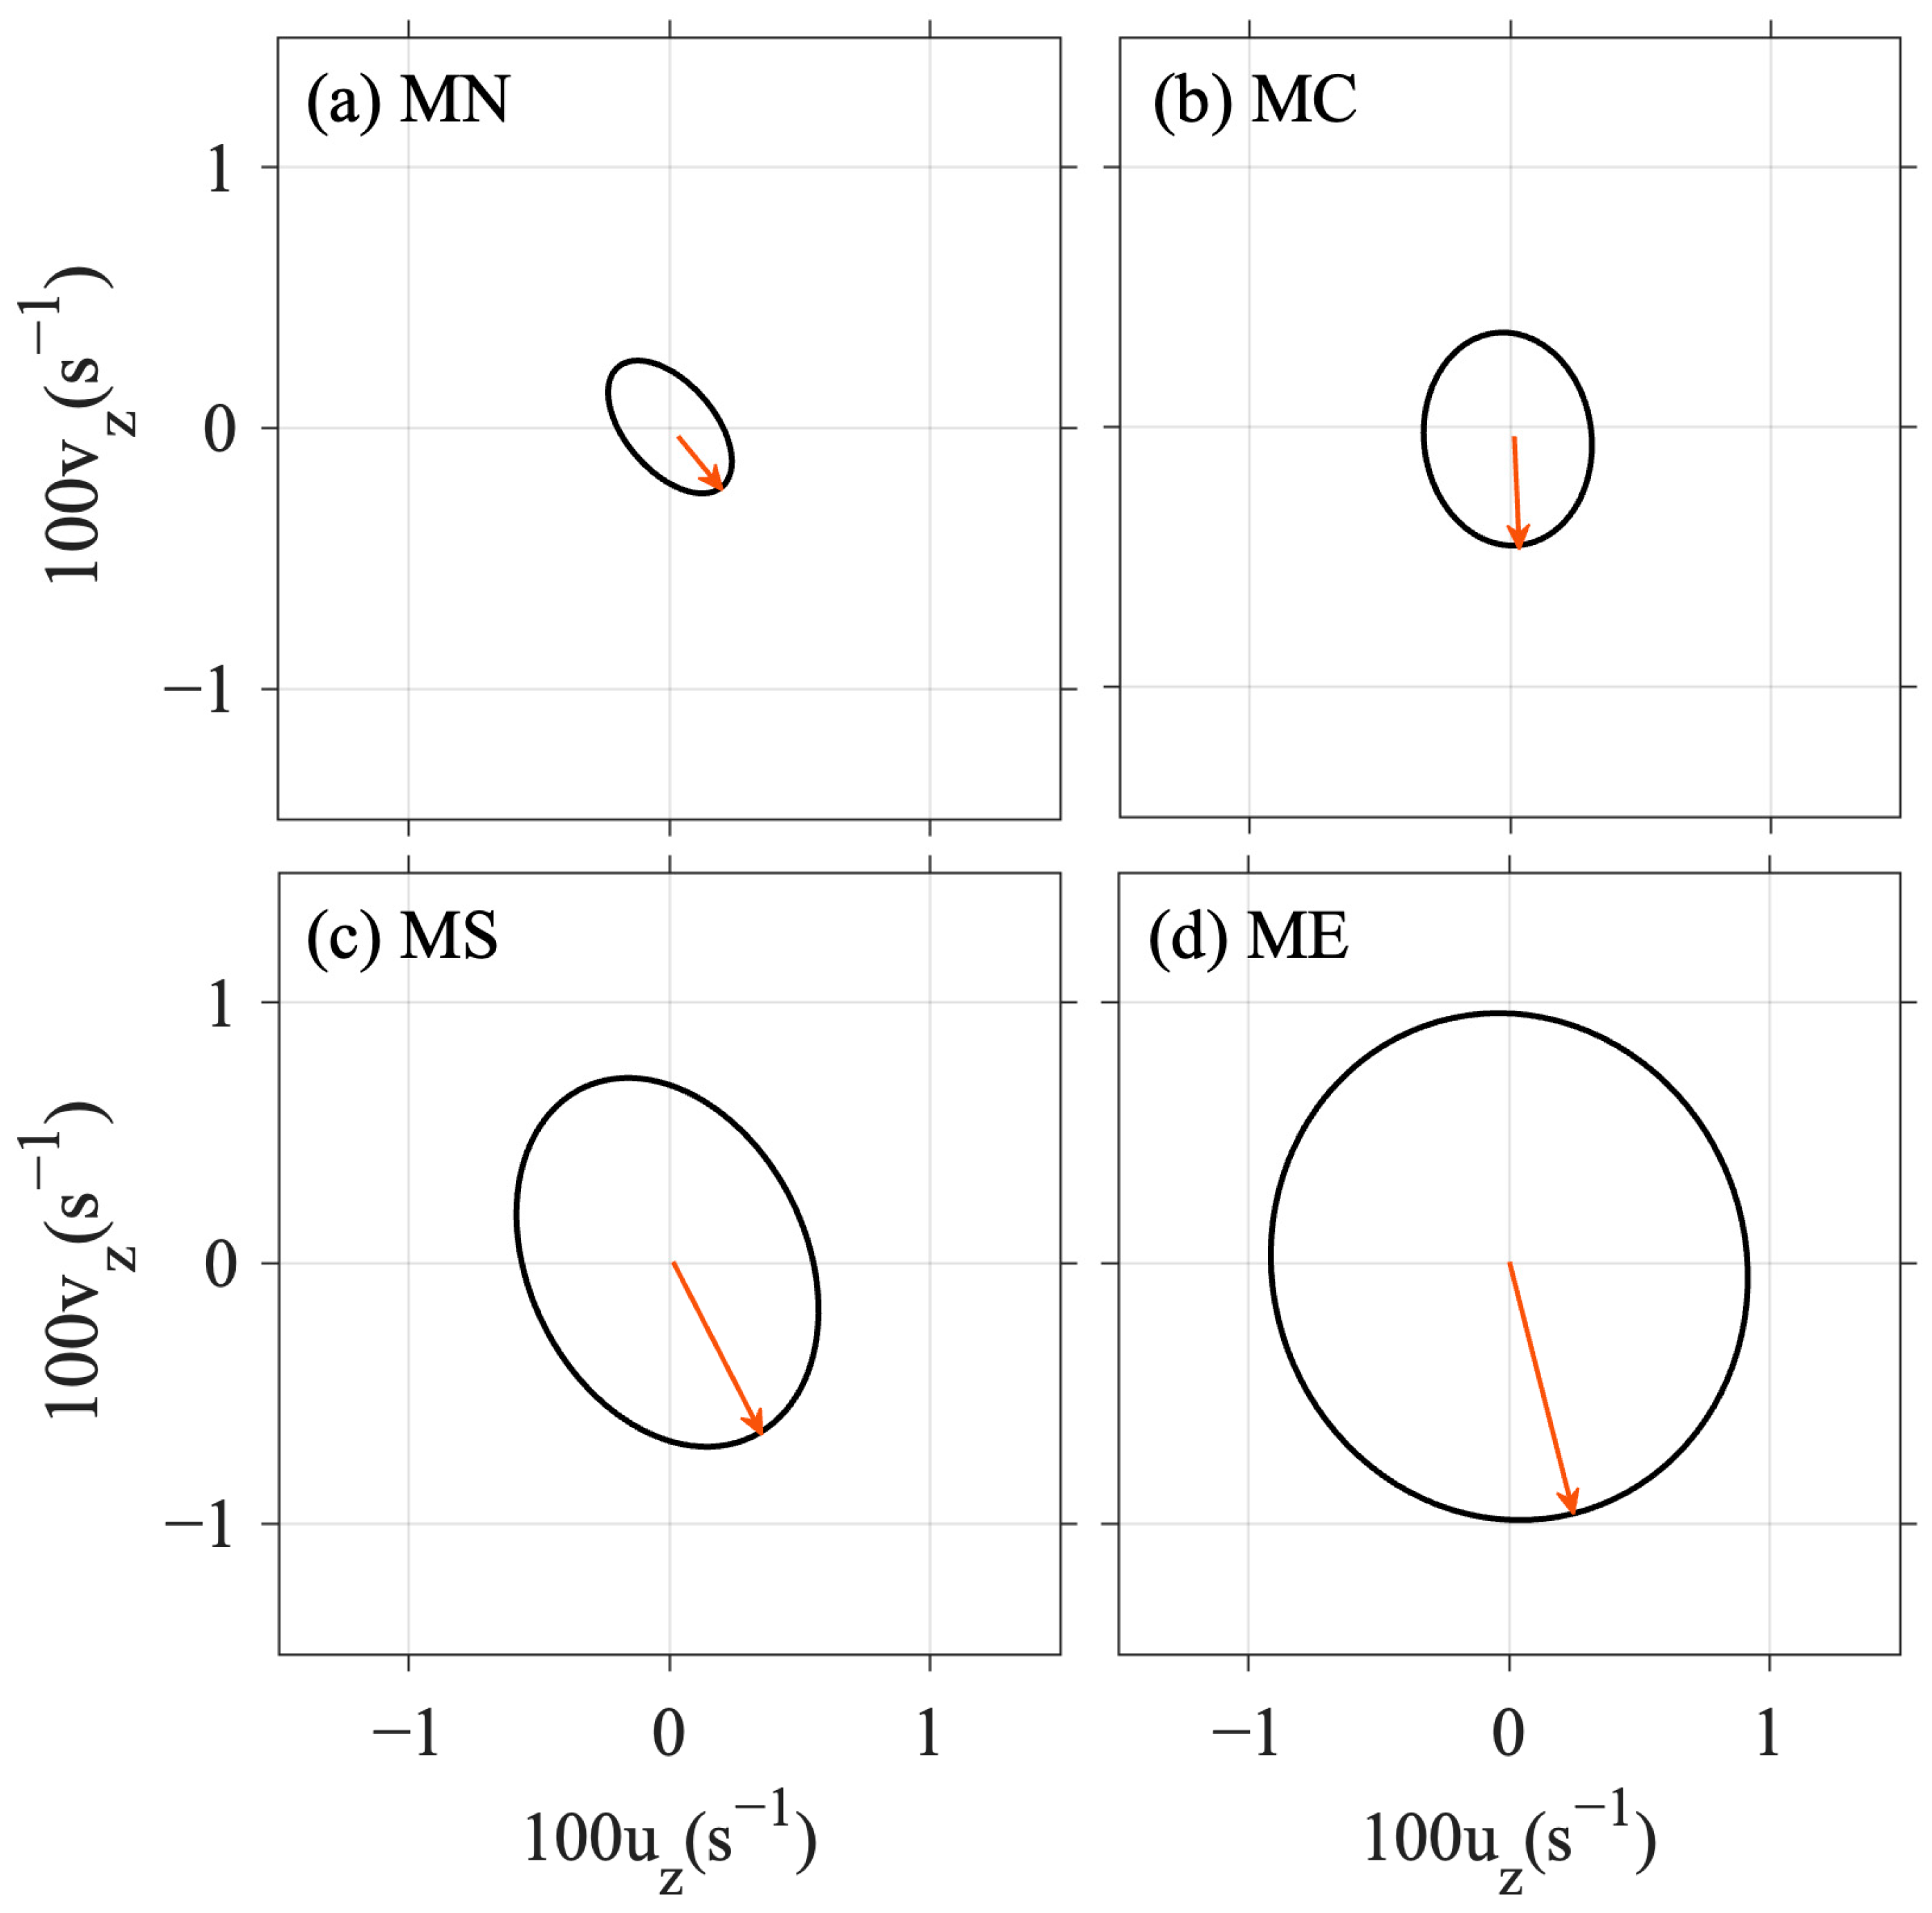
The propagation direction of NIOs can be determined by the orientation of the major axis of the near-inertial current shear ellipse [41]. During the periods when NIOs were strongest, near-inertial current shears at 245 m were selected for stations ME, MC, and MS, while that at 395 m was used for station MN to fit the orientation of the ellipse’s major axis. Kinetic energy associated with NIOs propagates both horizontally and vertically. The velocity components that rotate clockwise (counterclockwise) with increasing depth correspond to upward (downward) propagating energy [42]. By applying two-dimensional Fourier filtering, the near-inertial current field is decomposed into upward and downward propagating components based on their phase characteristics [43,44].
To identify nonlinearly coupled waves, a bicoherence spectral analysis was performed on the velocity data [43,44]. This method normalizes the bispectrum and is defined as
b 2 ω 1 , ω 2 = B ω 1 , ω 2 2 / [ p ( ω 1 ) p ( ω 2 ) p ( ω 1 + ω 2 ) ]  
where B(ω1, ω2) denotes the bispectrum and p(ω) represents the power spectrum. Elevated bicoherence values suggest a strong and consistent phase relationship between fluctuations at frequencies ω1 and ω2, indicating the presence of nonlinear interactions.
The subharmonic waves fD1, which may arise from the nonlinear interactions between NIOs and diurnal internal tides, can be expressed as follows [37,38]:
u f D 1 t u u x f D 1 v u y f D 1 w u z f D 1
v f D 1 t u v x f D 1 v v y f D 1 w v z f D 1
In Equations (2) and (3), the first two terms represent horizontal nonlinear momentum contributions, while the third term denotes vertical nonlinear momentum. Previous investigations have demonstrated that the contribution of vertical nonlinear momentum exceeds that of horizontal nonlinear momentum by more than an order of magnitude [34]. Moreover, the vertical nonlinear flux can be decomposed into two components: −wD1∂uf/∂z (component 1) and −wf ∂uD1/∂z (component 2). This study primarily focuses on the vertical nonlinear momentum, which dominates the right-hand-side terms in Equations (2) and (3). To further elucidate the variations in vertical nonlinear momentum, the contributions of components 1 and 2 were computed separately. To evaluate the influence of NIOs and the subharmonic waves fD1 on vertical mixing, the Richardson number was calculated as R i = N 2 / u z 2 , where N denotes the buoyancy frequency and uz represents the vertical shear of the horizontal velocity. The buoyancy frequency was derived from the temperature and salinity measurements obtained at station MS. The Richardson number is recognized as an important indicator for the onset of shear instability.

3. Results

3.1. An Anticyclonic Eddy

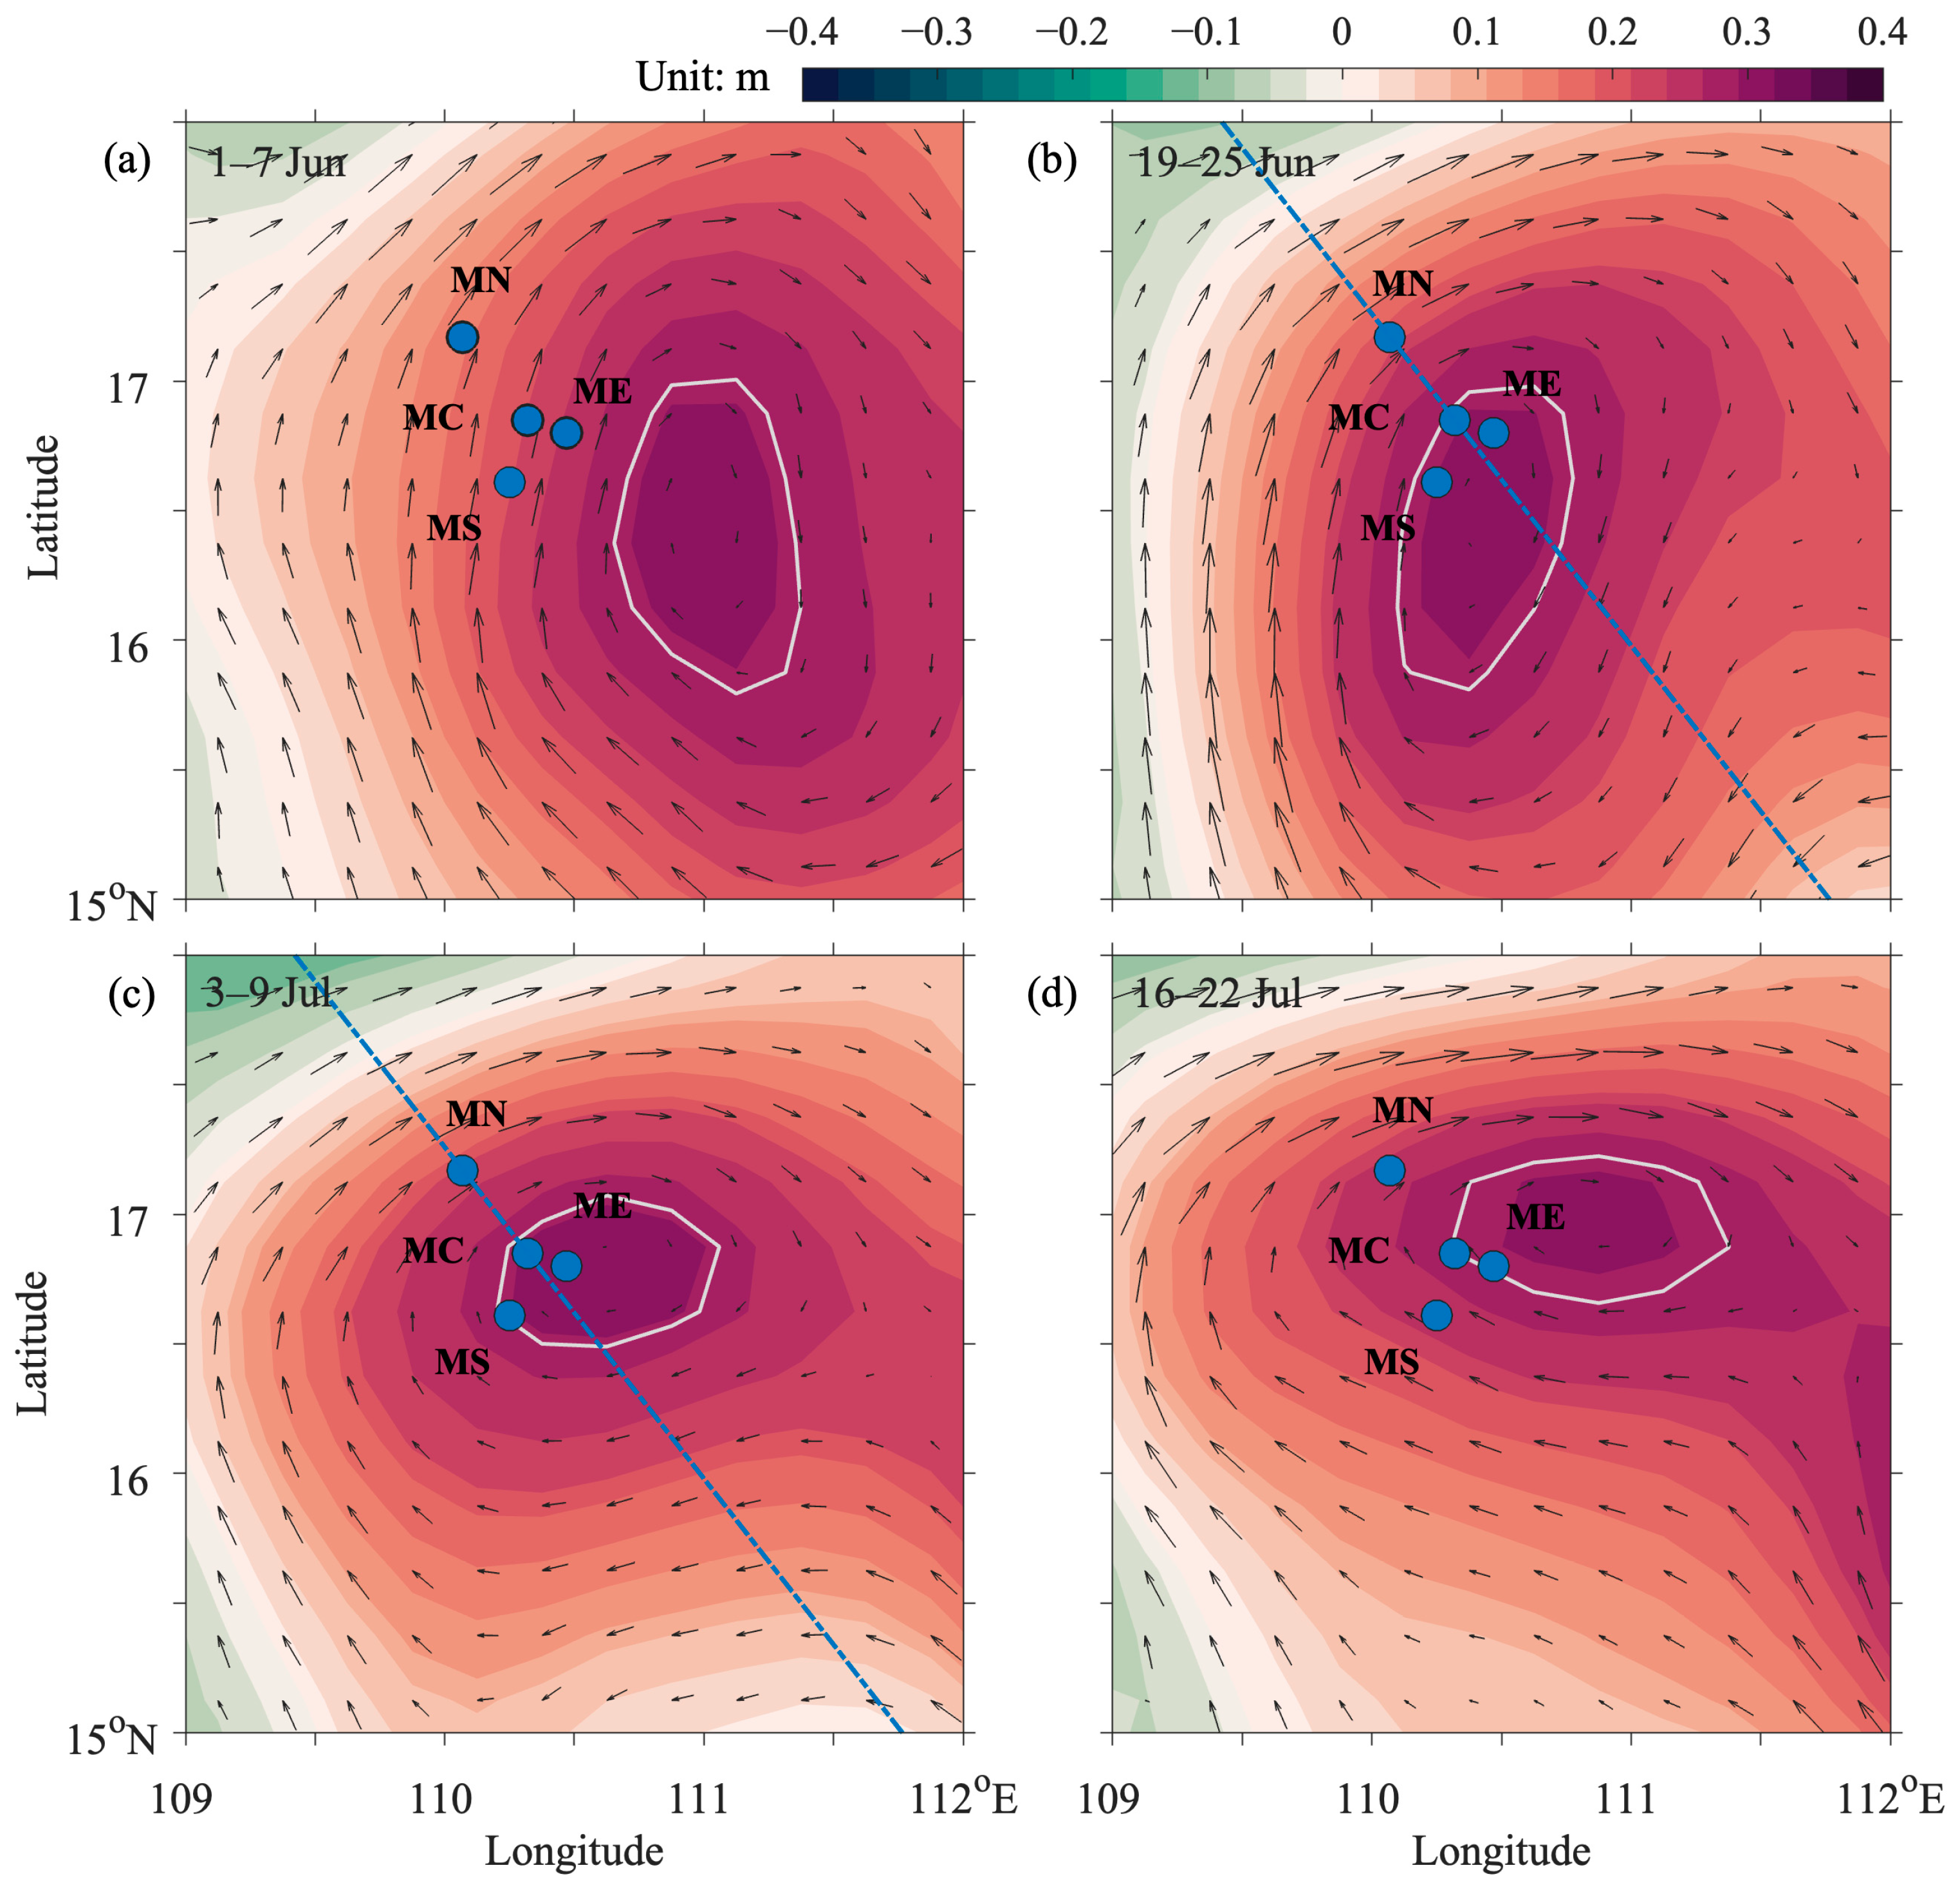
In June–July 2020, a westward-propagating anticyclonic eddy traversed the mooring array, with the sea surface geostrophic current rotating clockwise around the region of positive SLA (Figure 2). In Figure 2, the gray contour line (0.25 m SLA isoline) is used to demarcate the central region of the eddy. From 1 to 7 June, the eddy core exhibited an elliptical shape with its major axis aligned north–south and centered near the position of 16.5° N, 111° E. All four mooring stations lay on its western flank, where northward geostrophic currents dominated (Figure 2a). Between 19 and 25 June, the core’s geometry and position shifted (Figure 2b): the major axis rotated from north–south to southwest–northeast, and the center migrated westward to approximately 16.5° N, 110.5° E. Stations MC, MS, and ME entered the core region—geostrophic velocities weakened and northward currents ceased to dominate—while station MN remained on the periphery, with northeastward currents prevailing. From 3 to 9 July, the core contracted and reoriented as an east–west ellipse (Figure 2c). Station ME lay nearly at its center, MS to the southwest, and MN to the northwest. However, station MN remained closer to the edge and continued to experience northeastward currents. During 16–22 July, the ellipse’s center shifted northwest to around 17° N, 111° E with its major axis realigned east–west (Figure 2d). Station MS exited the central core, while MC and ME sat near its fringe. The surface geostrophic current in Figure 2d indicates a dominant northwestward current at MS and northeastward current at MN.
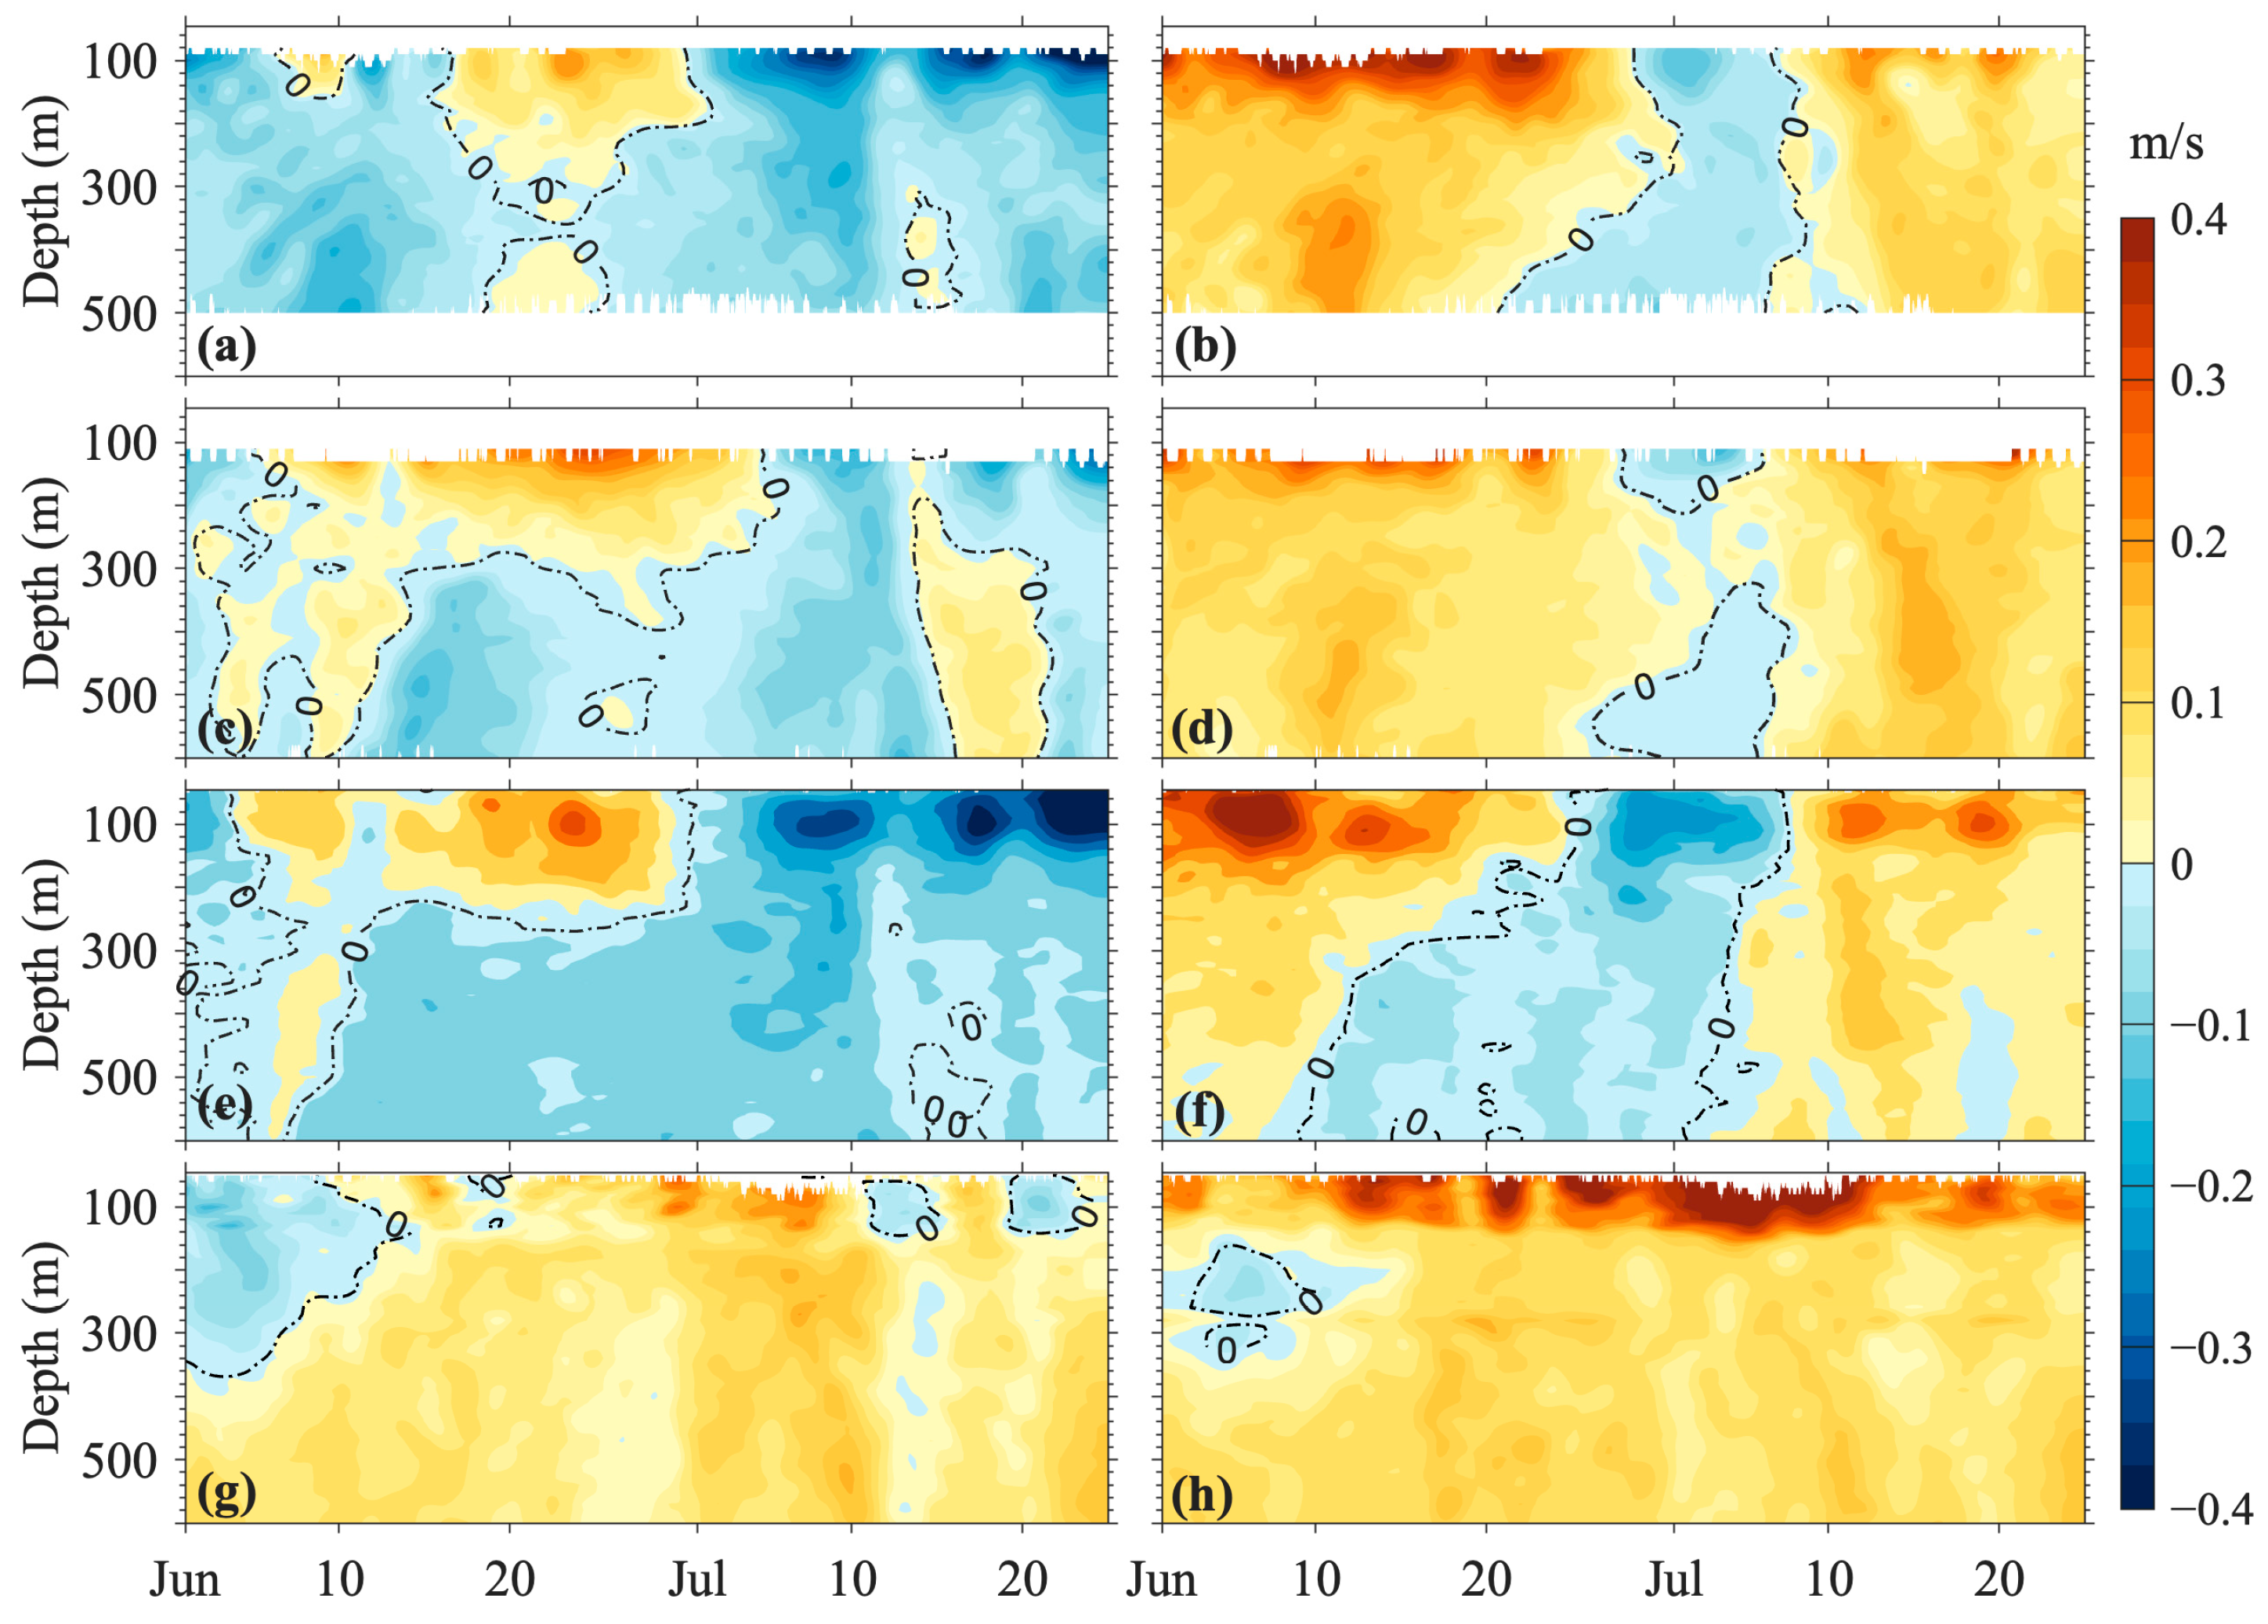
Figure 3 presents the time–depth distributions of low-frequency current velocities at the four mooring stations under the influence of the anticyclonic eddy, with the left and right columns representing zonal and meridional velocity components, respectively. At the ME station, the zonal velocities were eastward (100–300 m depth) from mid-June to early July, followed by a reversal to a westward current after June (Figure 3a). The meridional velocities at ME predominantly displayed a northward orientation (Figure 3b), except during mid-June to 10 July when a southward current prevailed, peaking at −0.2 m/s. The MC station showed eastward zonal velocities (maximum 0.2 m/s) in the 100–300 m layer before 5 July, transitioning to a westward current thereafter (Figure 3c). Its meridional velocity distribution mirrored that of ME (Figure 3d). The MS station encompassed the largest observational depth range among the four moorings. As shown in Figure 3e, the zonal velocity distribution at MS exhibited the same pattern as that at the MC station: approximately 0.3 m/s eastward current prior to July, transitioning to −0.4 m/s westward current thereafter. The meridional velocities displayed alternating polarity throughout the observational period (Figure 3f), with notably prolonged southward current durations at greater depths (persisting for 12 days in the upper 200 m layer and extending to 22 days at 500 m depth). In contrast, the MN station maintained persistent northeastward current orientations with minimal directional variability, reflecting its stable northwestern positioning relative to the anticyclonic eddy core throughout the observation period.
In Figure 3, the alternating positive–negative patterns in meridional (zonal) velocity magnitudes likely originated from the relative movement of the anticyclonic eddy with respect to the mooring stations. To establish a linkage with the surface geostrophic currents presented in Figure 2, the velocity profile at 50 m depth of the MS station in Figure 3 was analyzed. During the period from 20 to 30 June, the MS station recorded a transitional velocity regime as it traversed from the northwestern periphery to the central zone of the eddy. The station reoccupied a southwestern position relative to the eddy core by 10 July. When the MS station was located northwest of the eddy center before July, the currents observed in the mooring were characterized by positive zonal velocities (Figure 3e). When the station shifted to the southern flank of the eddy center after June, the zonal velocities became negative. Meanwhile, the 50 m depth velocity at MS reoriented northwestward after 10 July, aligning directionally with the surface geostrophic currents. The spatial proximity of the ME, MC, and MS stations facilitated consistent observations of time–depth evolution in low-frequency current velocities during the anticyclonic eddy’s passage, as evidenced by their synchronized velocity reversals across the mooring array.
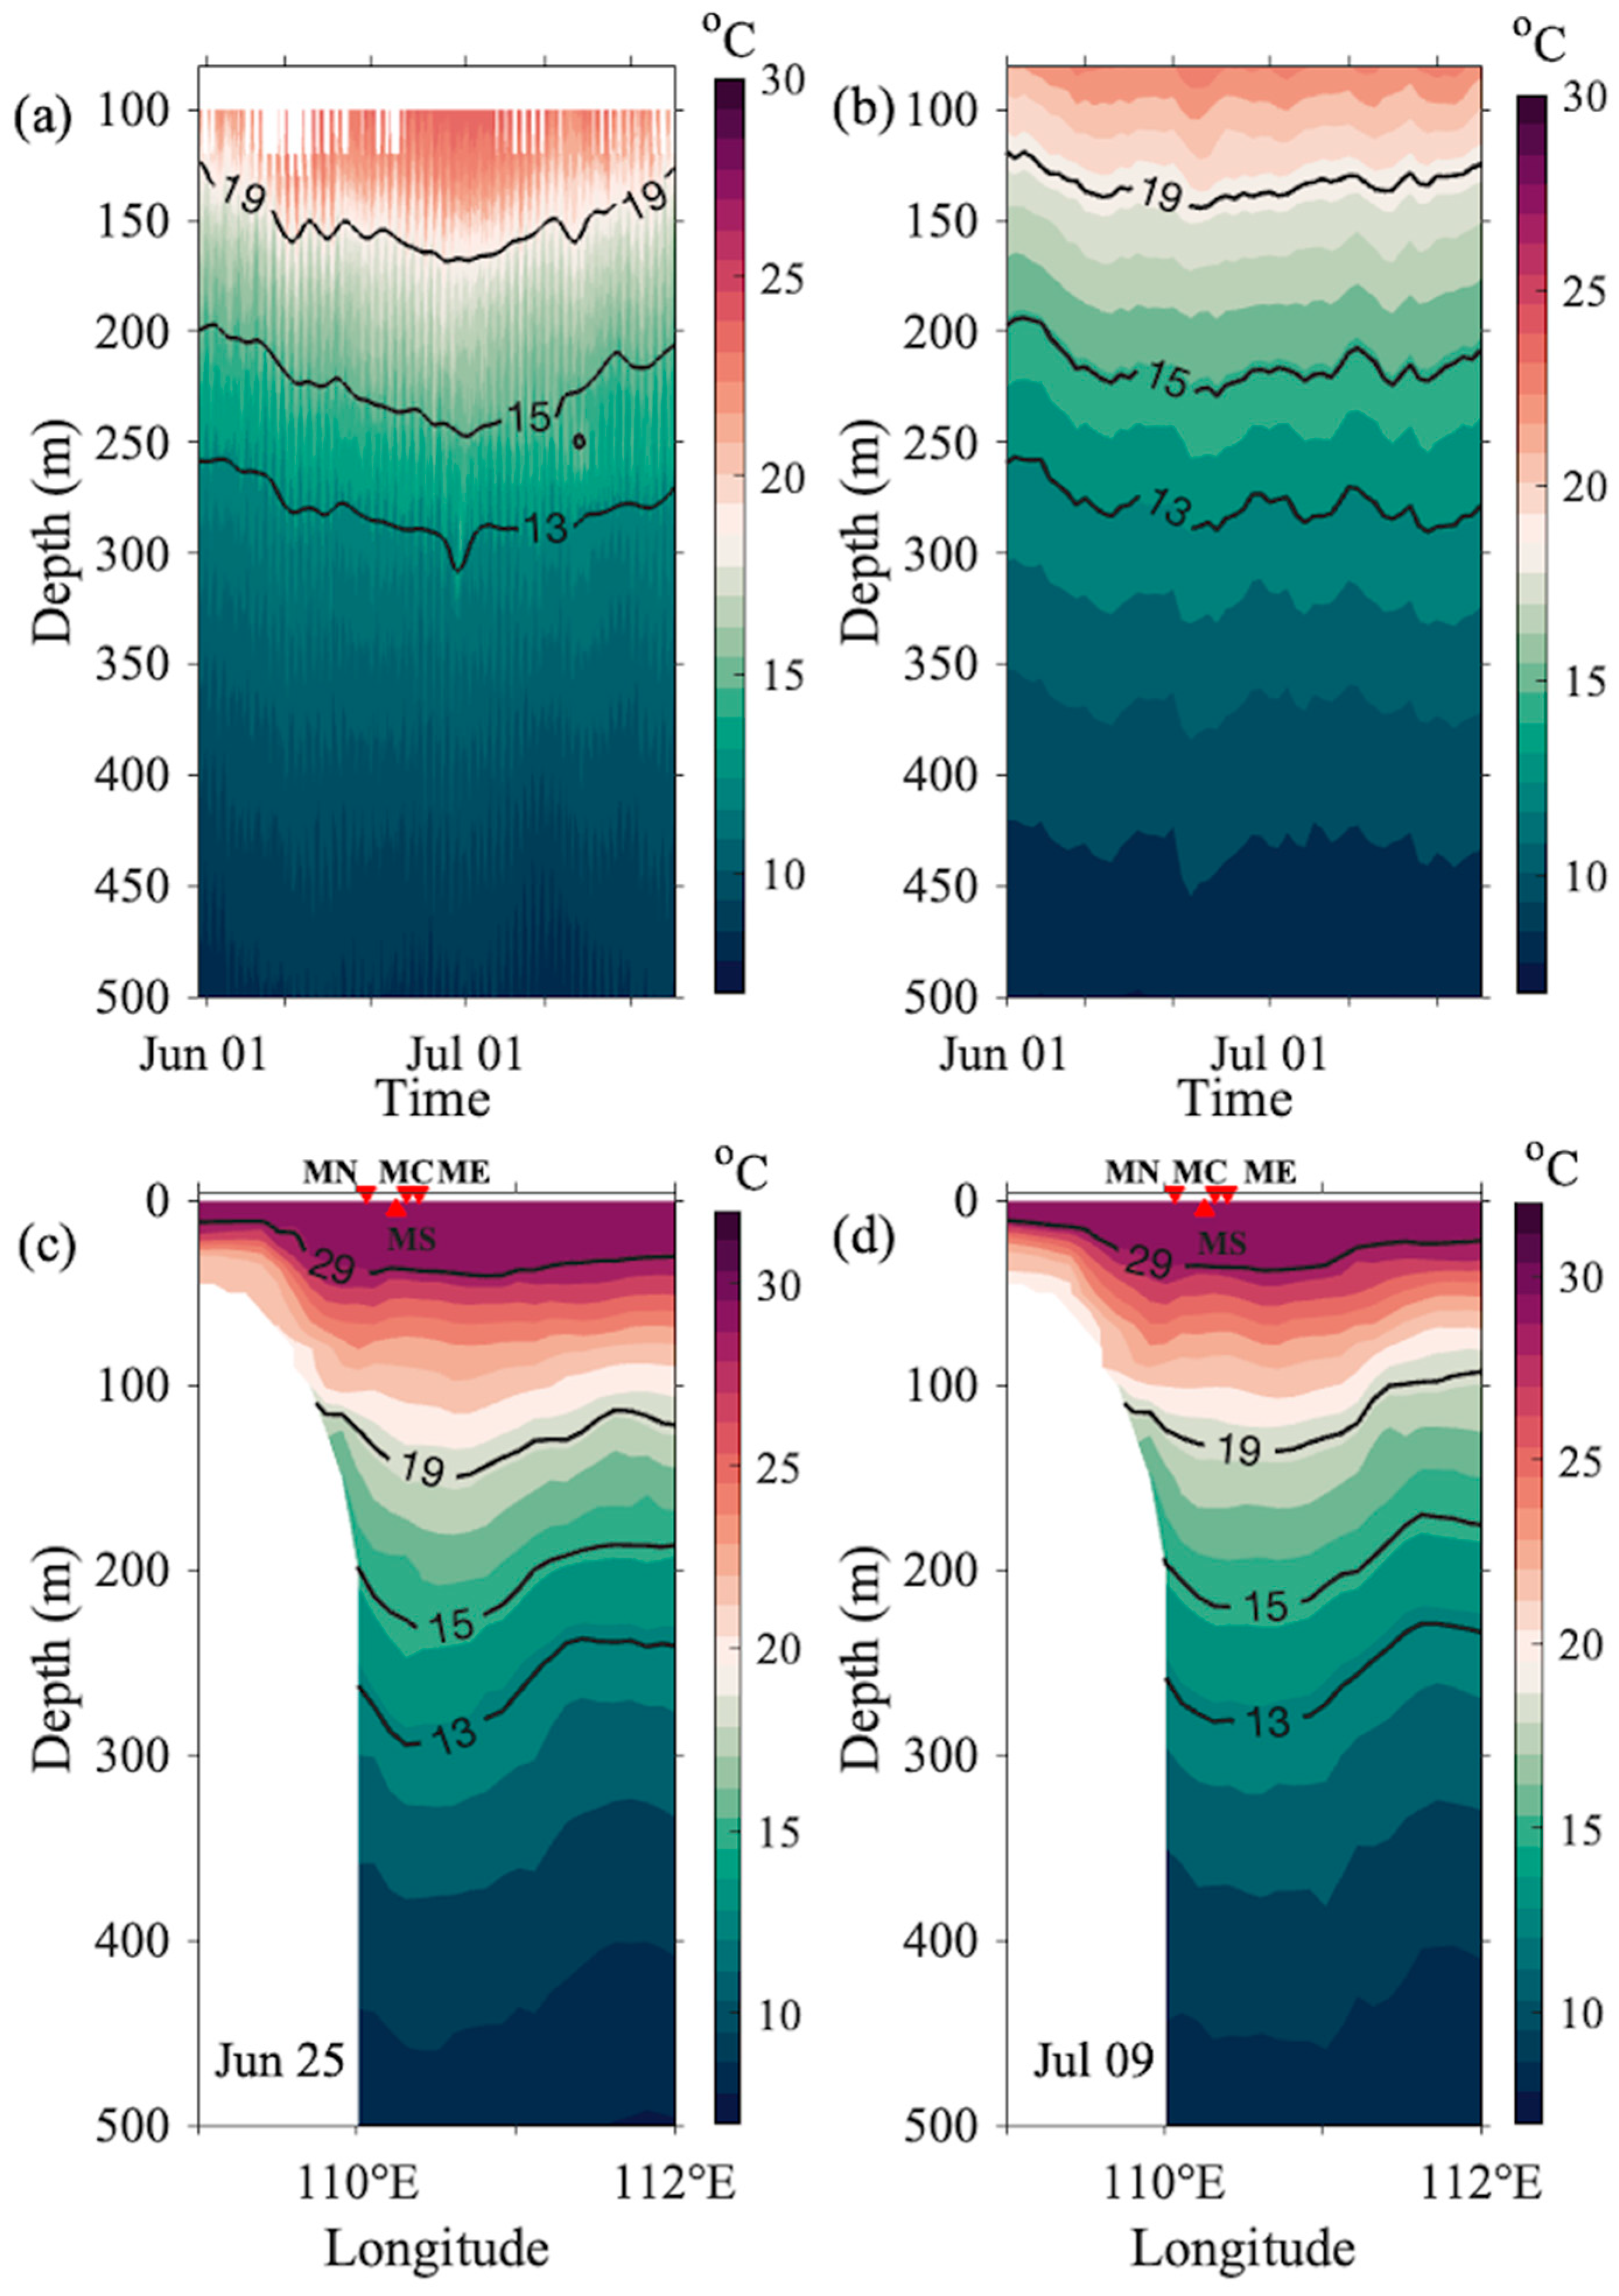
Figure 4a presents the temperature evolution at the MS mooring from 1 June to 25 July. During this interval, the 13 °C, 15 °C, and 19 °C isotherms all exhibit a two-phase response—initial deepening, followed by shoaling. Notably, on 1 July, the 19 °C isotherm descends by over 20 m relative to those on both 1 June and 25 July. The HYCOM dataset at the MS location (Figure 4b) faithfully reproduces this pattern, albeit with slightly reduced isotherm displacements. This agreement, together with Chu et al.’s (2014) [29] demonstration of HYCOM’s skill in simulating anticyclonic eddy-related temperature changes in the same region, underpins our use of HYCOM to characterize the eddy’s spatial structure. Figure 4c,d display temperature cross-sections along the MN–MC transect (blue lines in Figure 2) for 25 June and 9 July, respectively. Prior to 25 June, all four moorings lay on the eddy’s western periphery; by 9 July, stations MC, MS, and ME had migrated into the eddy core.

3.2. NIOs and Subharmonic Waves

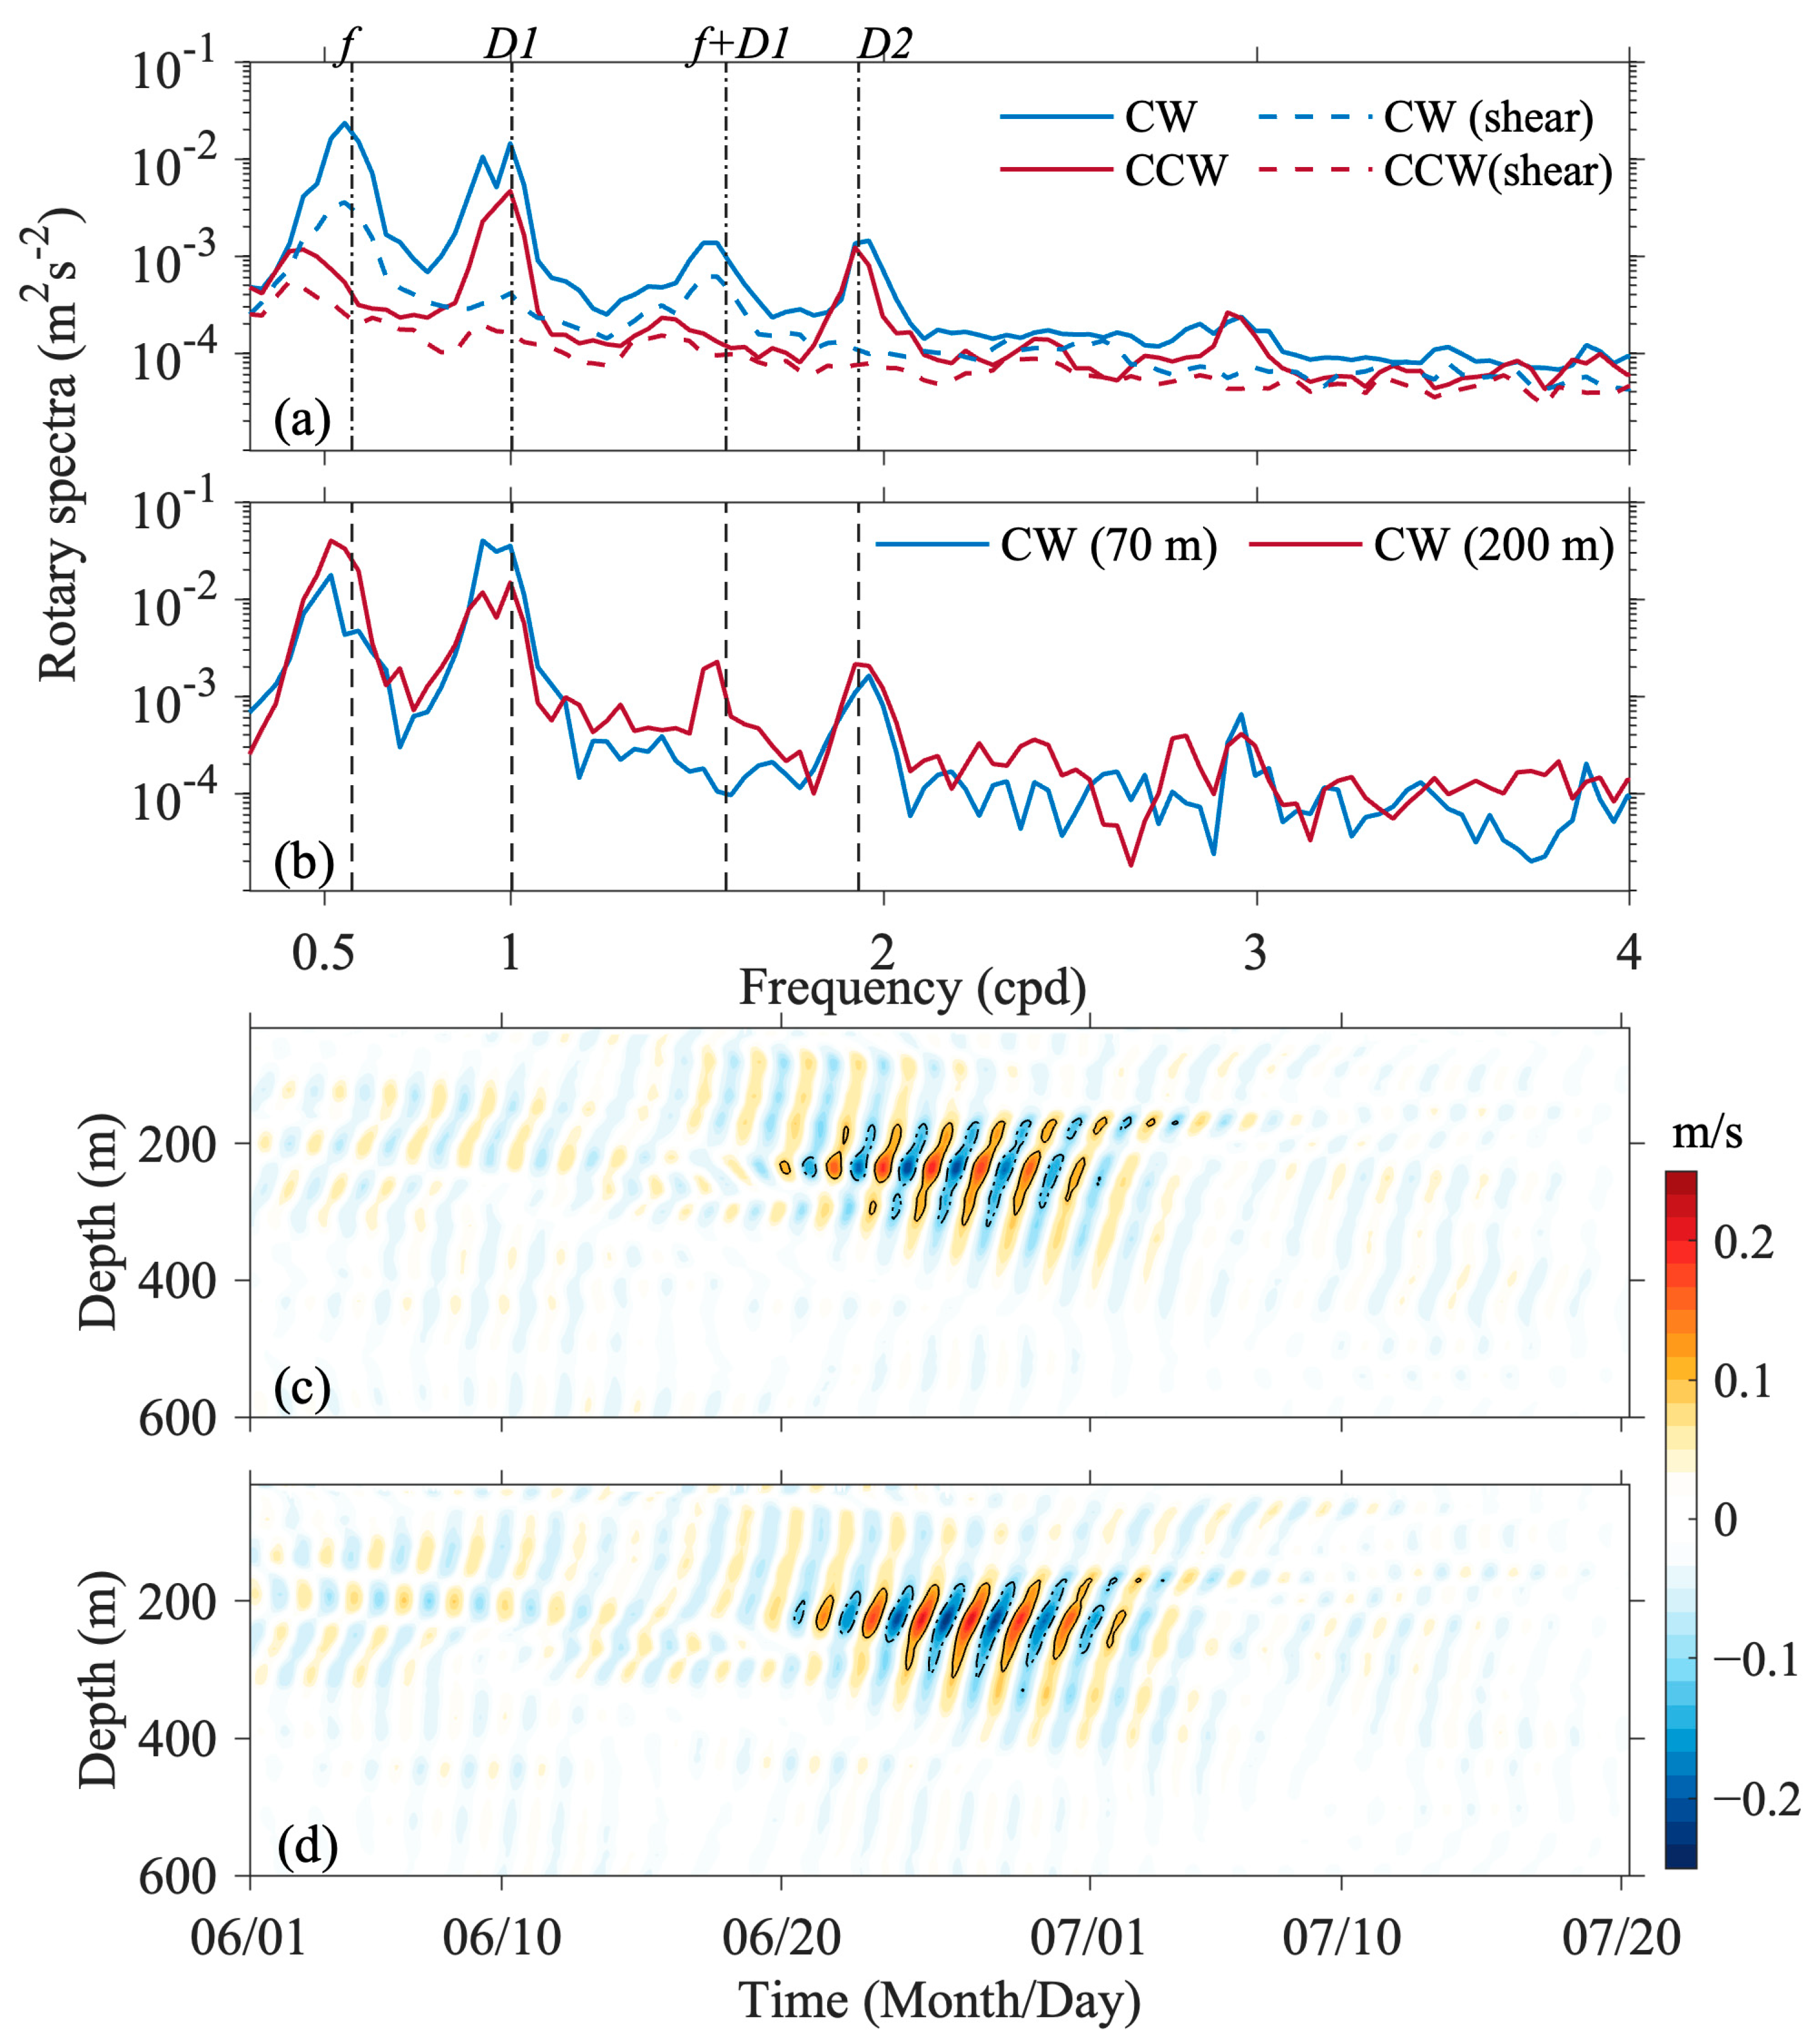
Figure 5 demonstrates the rotary spectra (Figure 5a,b) and near-inertial current (Figure 5c,d) variability observed at the ME station during the anticyclonic eddy event. The depth-averaged rotary spectra were composed of clockwise (CW) and counterclockwise (CCW) rotational components. As shown in Figure 5a, the CW component exhibited significantly enhanced energy in the vicinity of the inertial frequency f, indicating dominant CW rotation in NIOs. The CW component of the horizontal current shear spectrum also showed a pronounced peak near the inertial frequency. Distinct energy peaks were identified at diurnal (D1) and semi-diurnal (D2) tidal frequencies for velocity components, while shear spectra at these frequencies were comparatively weak and statistically insignificant. Notably, spectral peaks for both CW velocity and CW shear emerged synchronously at the f + D1 frequency (subharmonic waves fD1). Figure 5b shows that at 200 m depth, the spectral energy at both f and f + D1 exceeded that measured at 70 m, indicating that NIWs’ energy was concentrated more strongly in the deeper layers. Band-pass-filtered near-inertial currents in the zonal (Figure 4c) and meridional (Figure 5d) components exhibited pronounced NIOs between 20 June and 3 July within the 200–400 m depth range, with peak velocities reaching 0.2 m/s. The meridional velocity component marginally exceeded the zonal component in amplitude throughout this period.
To clarify the propagation direction of pronounced NIOs within the 200–400 m depth layer, Figure 6 displays the near-inertial current shear ellipses at all four mooring sites over the period 20 June–3 July. In each case, the principal axis of the oscillation was oriented southwestward. When viewed against the anticyclonic eddy distribution in Figure 2, these orientations indicate that NIOs propagated roughly from the eddy’s periphery toward its center.
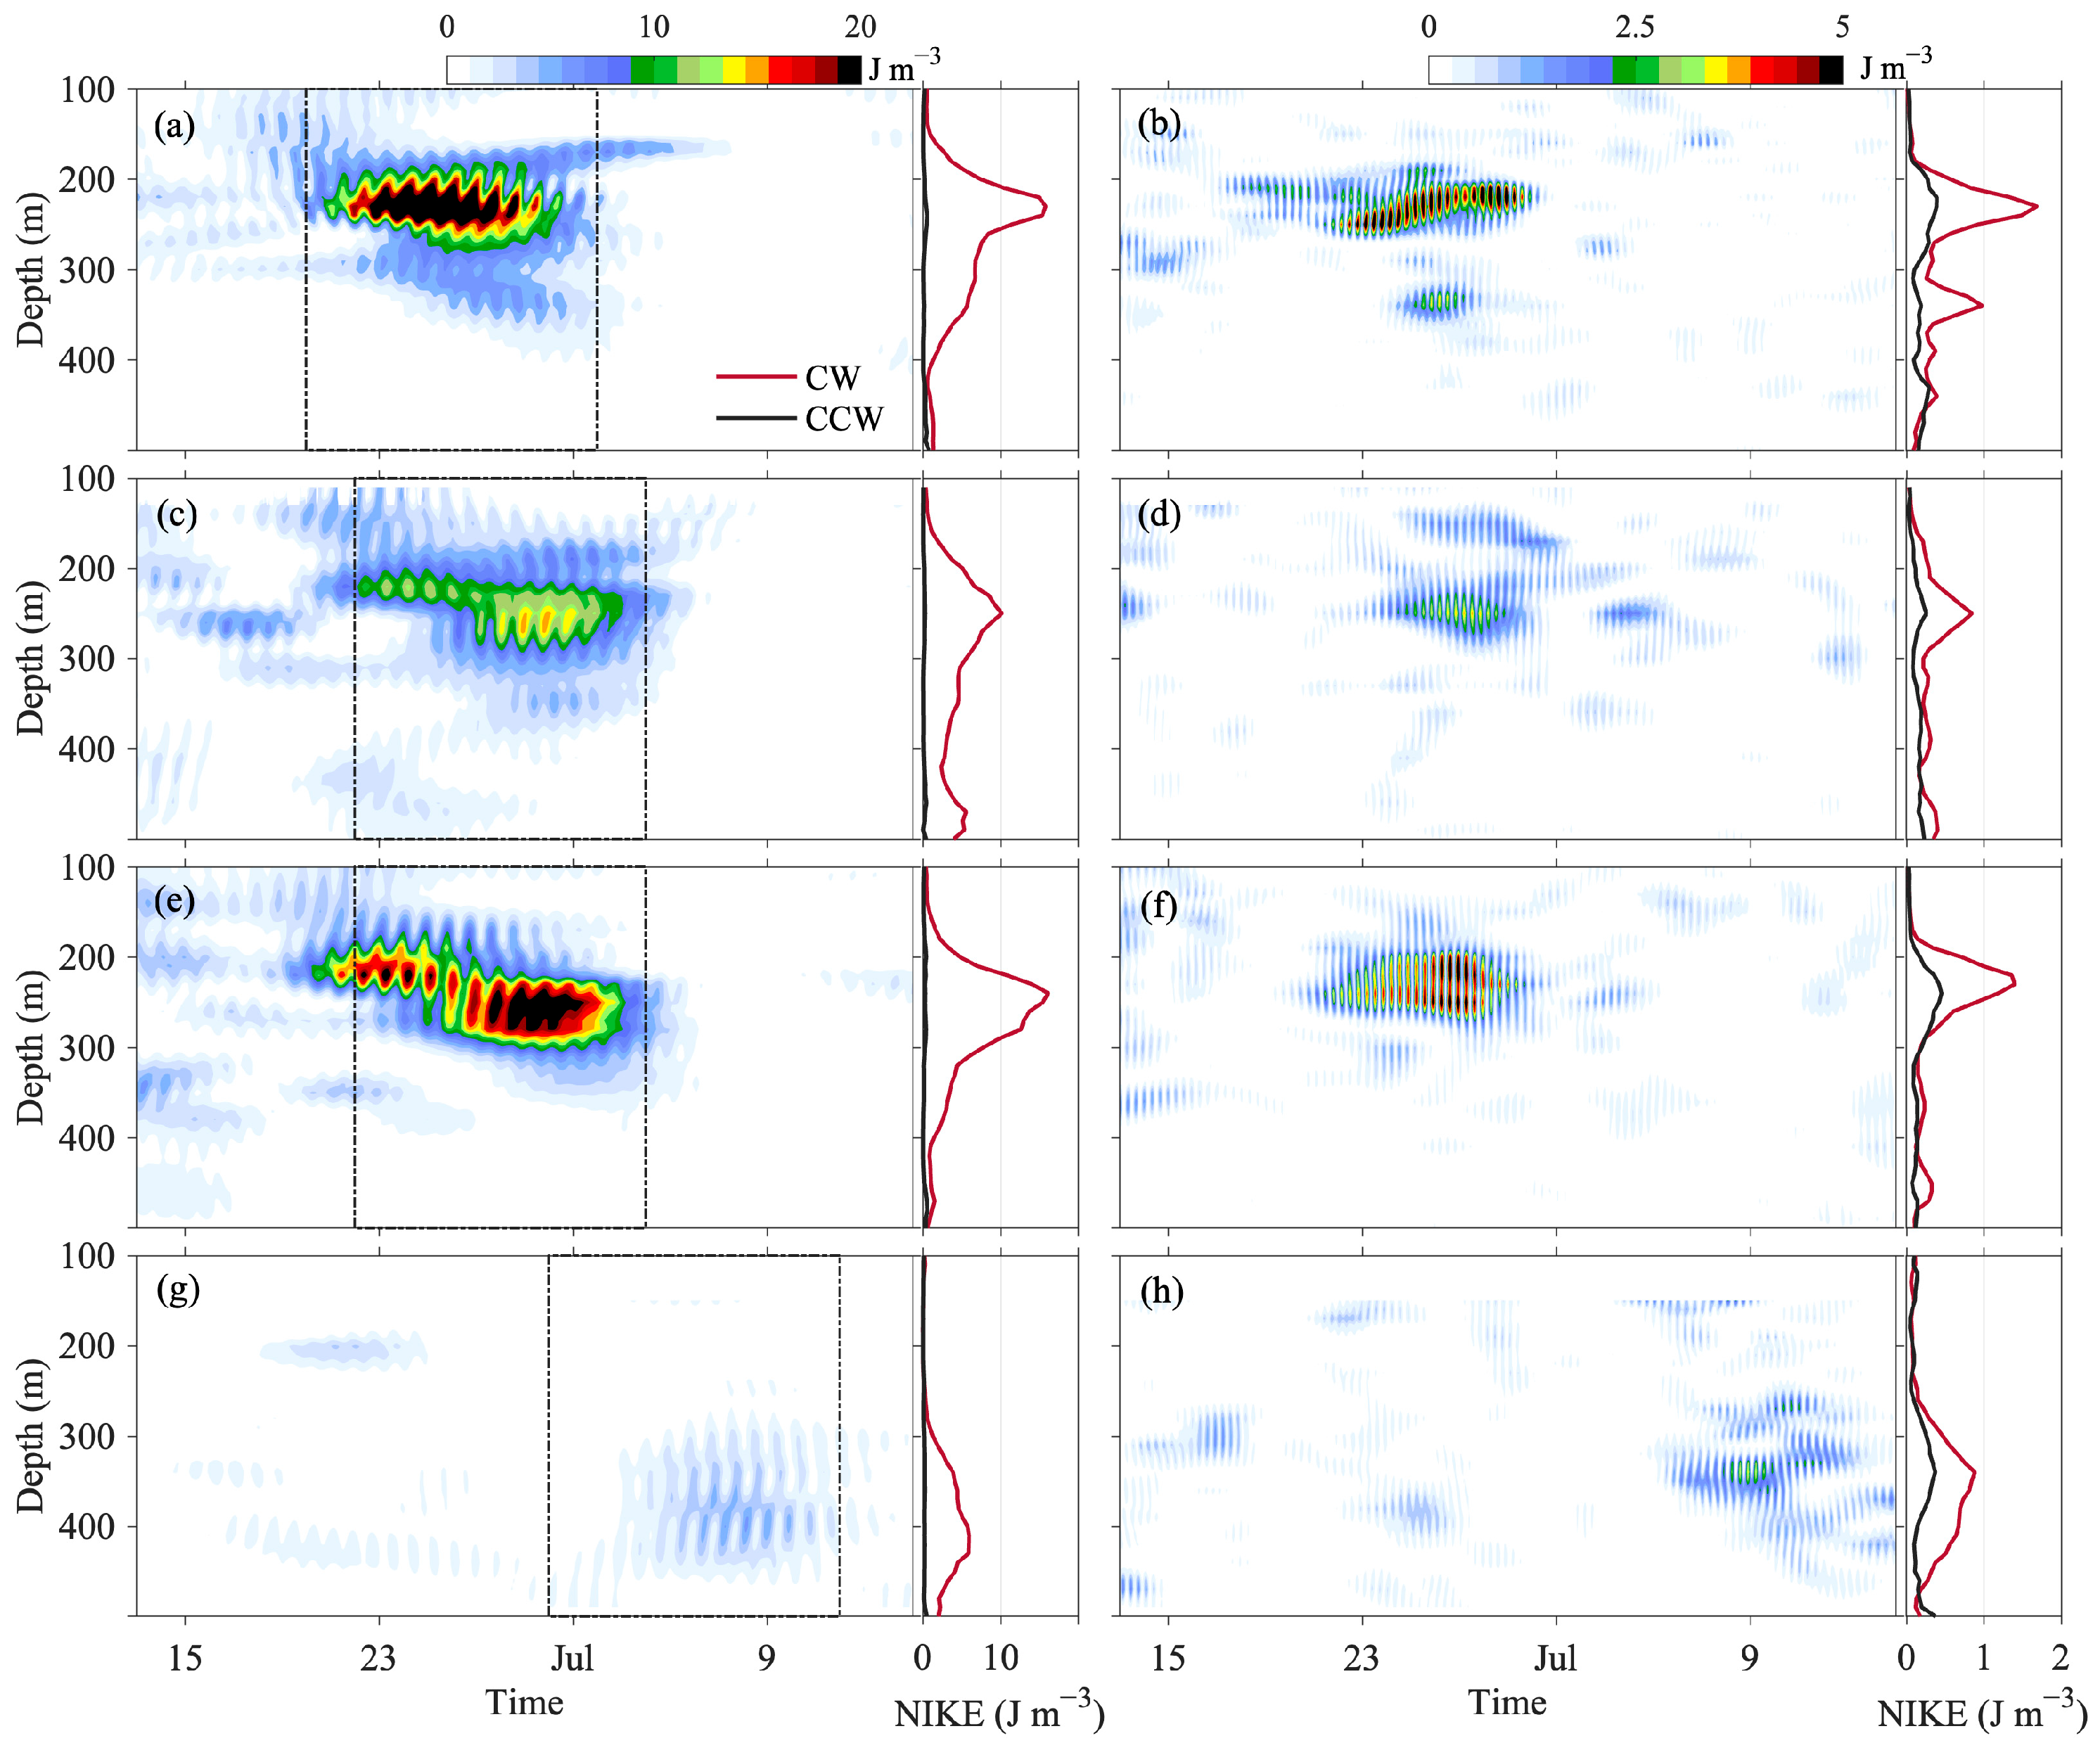
The rotary spectrum analysis indicated that the rotational signatures of NIOs and the subharmonic waves fD1 were consistent. To investigate the linkage between the NIOs and the fD1 waves, as well as the spatial distribution of wave energy within the anticyclonic eddy, we computed the kinetic energy for both NIOs and fD1 waves at all four moorings. Furthermore, through the application of two-dimensional Fourier filtering, we decomposed the velocity field to determine the dominant propagation direction of the kinetic energy. Figure 7 presents these distributions: the near-inertial kinetic energy (NIKE) is shown in the left panels, and the kinetic energy of fD1 waves is shown in the right panels, with the black (CW component) and red (CCW component) curves denoting the time-averaged kinetic energy within the dashed box. Between 21 June and 3 July, stations ME, MC, and MS displayed pronounced kinetic energy peaks, ranked strongest at ME, followed by MS, and weakest at MC.
In Figure 7a (Figure 7b), the near-inertial (fD1) kinetic energy at the ME station was predominantly distributed at 200–320 m (200–280 m) depth, with downward-propagating energy overwhelmingly dominating the vertical flux. The energy density peaked at approximately 17.2 J/m3 (1.8 J/m3) near a depth of 220 m (235 m). Similarly, the MC station exhibited near-inertial (fD1) kinetic energy concentrations within 210–300 m (230–260 m) depth in Figure 7c (Figure 7d), reaching maximum values of ~10 J/m3 (0.9 J/m3) at 245 m (240 m) depth. The MS station demonstrated analogous patterns in Figure 7e (Figure 7f), with near-inertial (fD1) energy spanning 200–310 m (200–280 m) depth and downward energy propagation prevailing throughout the water column, mirroring the ME station’s vertical structure. Conversely, the MN station displayed distinct characteristics. Unlike the three stations discussed above, its kinetic energy was primarily confined to a ~400 m depth. As shown in Figure 7g (Figure 7h), both the NIKE and fD1 energy densities at MN remained comparatively subdued, averaging less than 10 J/m3 (1 J/m3) throughout the observational period.
When the 10 J/m3 contour was used to delineate the onset and dissipation times of NIKE, the sequential order of its appearance at the three stations was MS, MC, and ME (with dissipation occurring in the reverse order: ME, MC, and MS). Notably, at station ME, the distribution of NIKE was confined to a much narrower depth range compared to the other two stations. Correspondingly, the fD1 wave energy observed at ME also exhibited a restricted depth distribution. Finally, at all three stations, the depth at which the maximum fD1 wave energy occurred was shallower than the depth at which the maximum NIKE was observed.
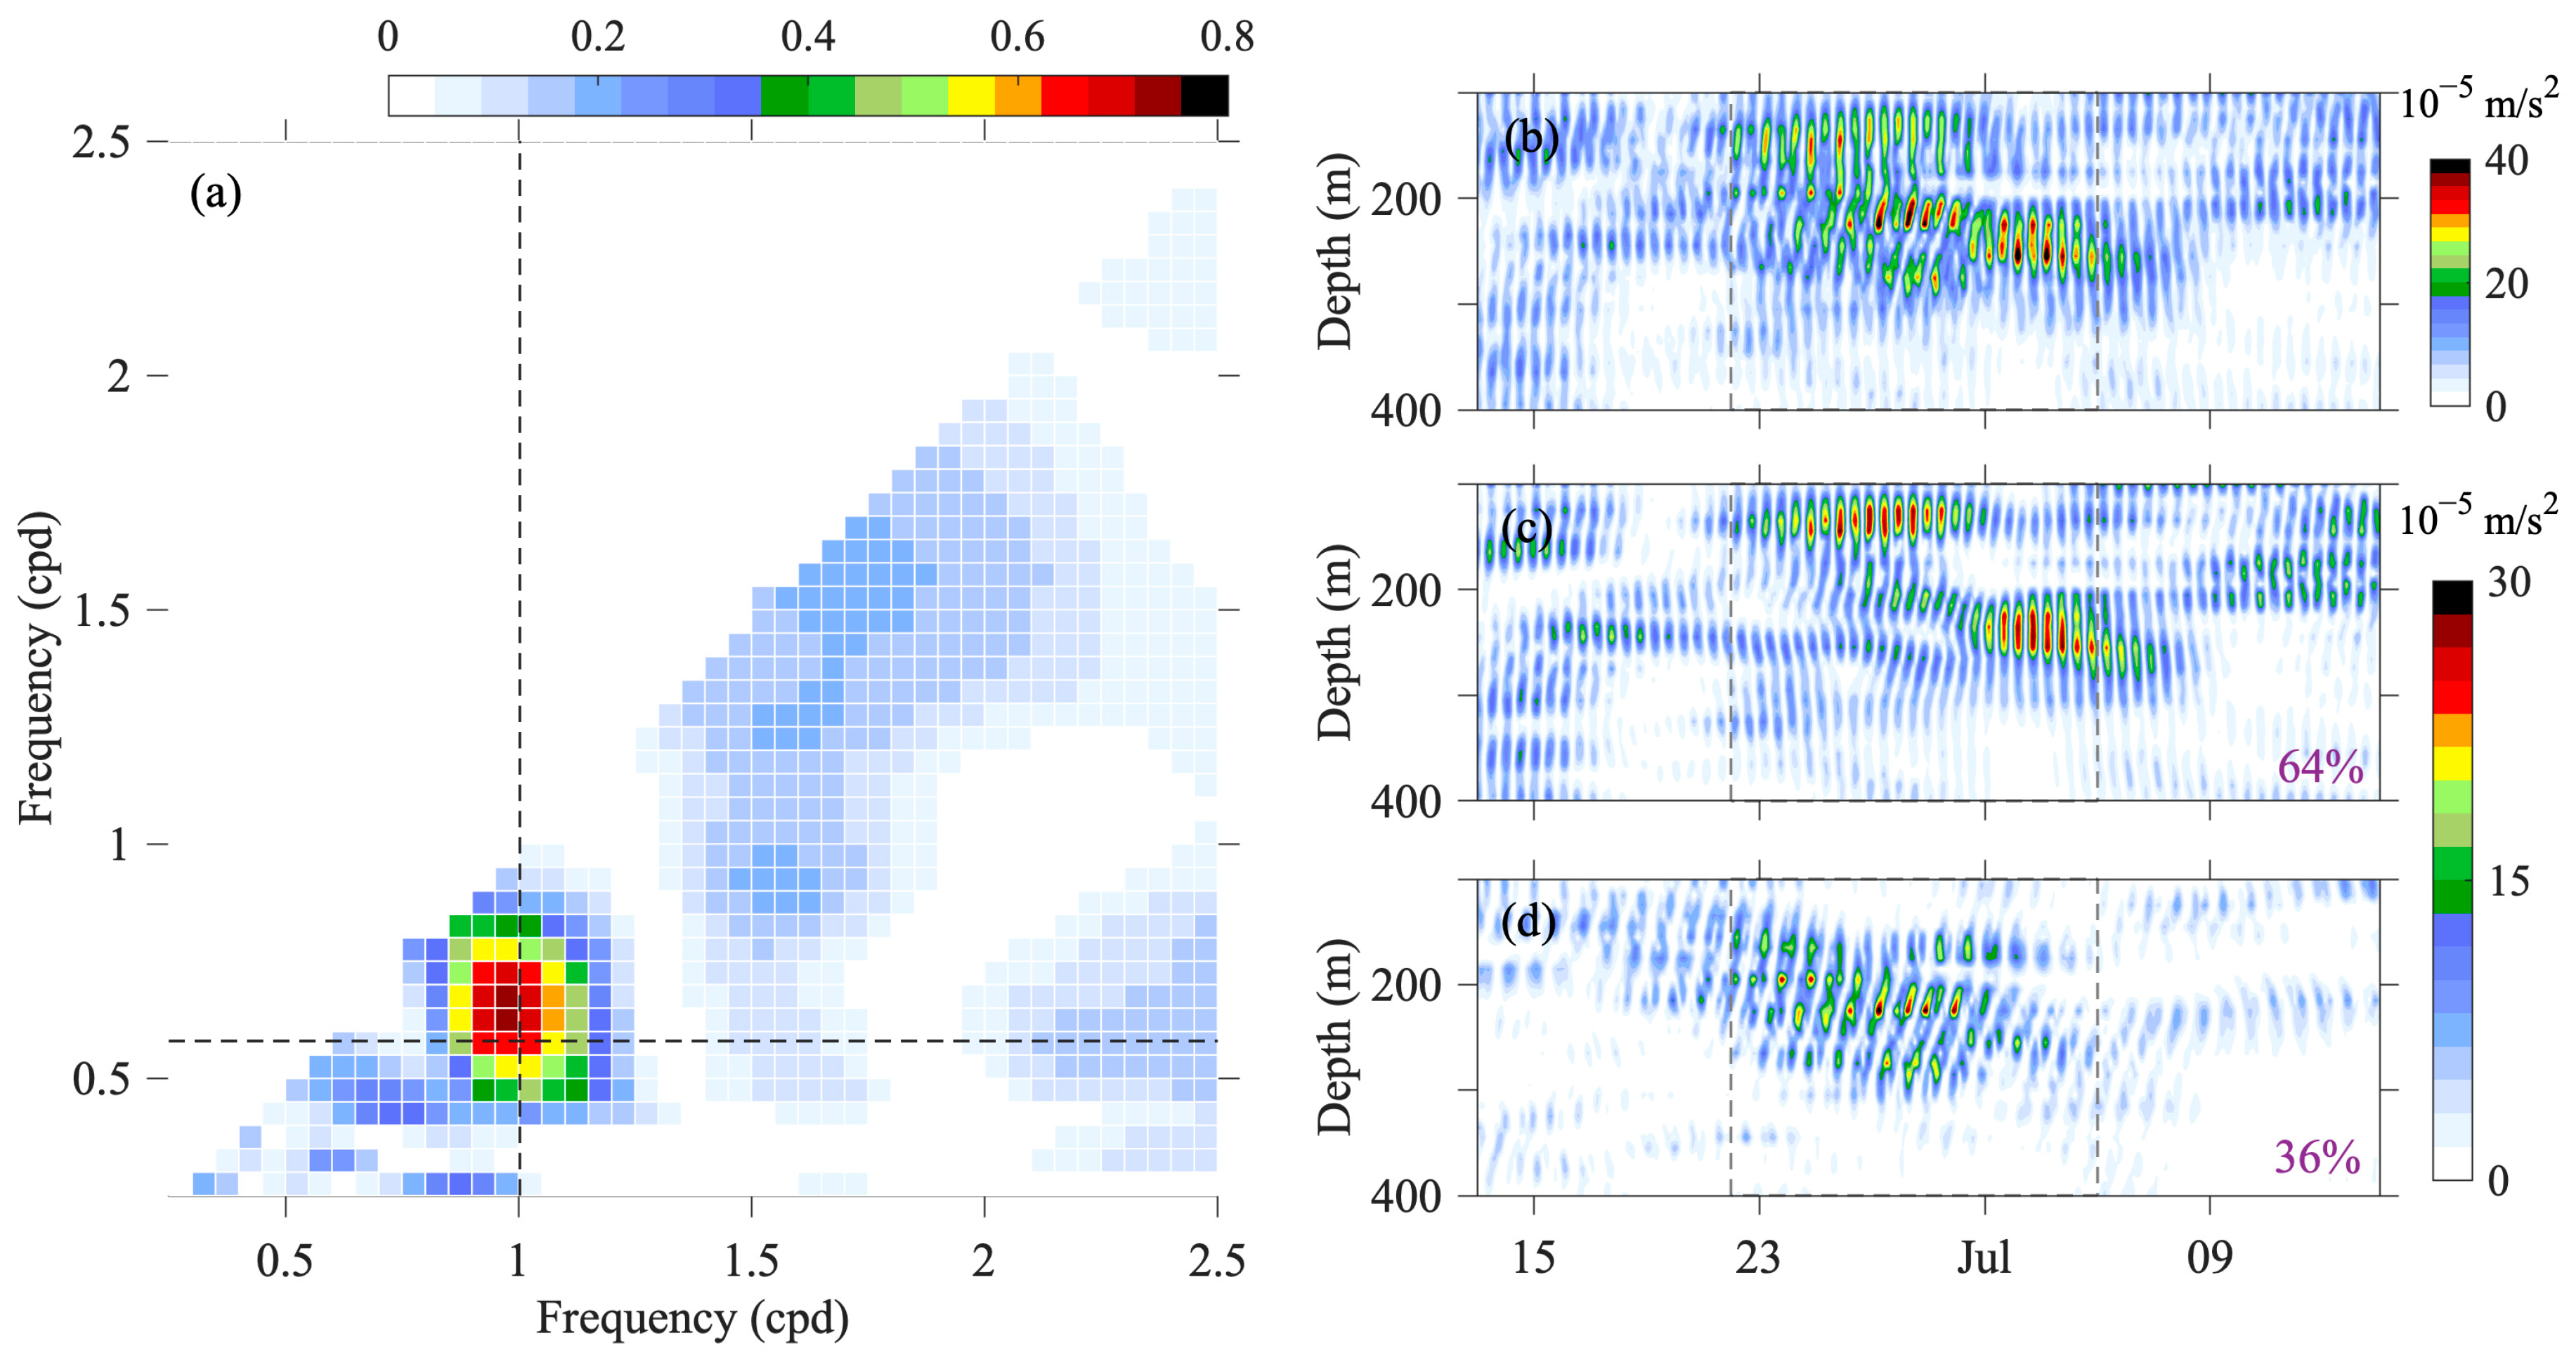
To further confirm the generation mechanism of fD1 waves, a bicoherence spectral analysis of zonal and meridional velocity components at 245 m depth at the MS station is presented in Figure 8a. The coherence at the frequency pair [0.58 cpd, 1 cpd] exceeds 0.6. This phase coupling indicates nonlinear energy transfer from interacting NIOs and diurnal tidal motions, effectively transferring energy to the higher-frequency wave regime at fD1.
To quantify the contributions of individual terms to the generation of fD1 waves, we evaluated the two components of the vertical nonlinear momentum (Figure 8b–d). The total vertical nonlinear momentum was defined as ( w u z ) f D 1 2 + ( w v z ) f D 1 2 , component 1 as ( w D 1 u f z ) 2 + ( w D 1 v f z ) 2 , and component 2 as ( w f u D 1 z ) 2 + ( w f v D 1 z ) 2 . Components 1 and 2 contribute 64% and 36%, respectively, to the total vertical nonlinear momentum. The predominance of component 1 indicates that the vertical shear of the near-inertial current plays the leading role in driving fD1 generation. The depth at which the maximum shear of the near-inertial current occurs is slightly shallower than that of its peak value. Consequently, the fD1 energy is concentrated where the near-inertial energy gradient is maximal, which also explains why the fD1 energy peak occurs slightly shallower than the near-inertial maximum.
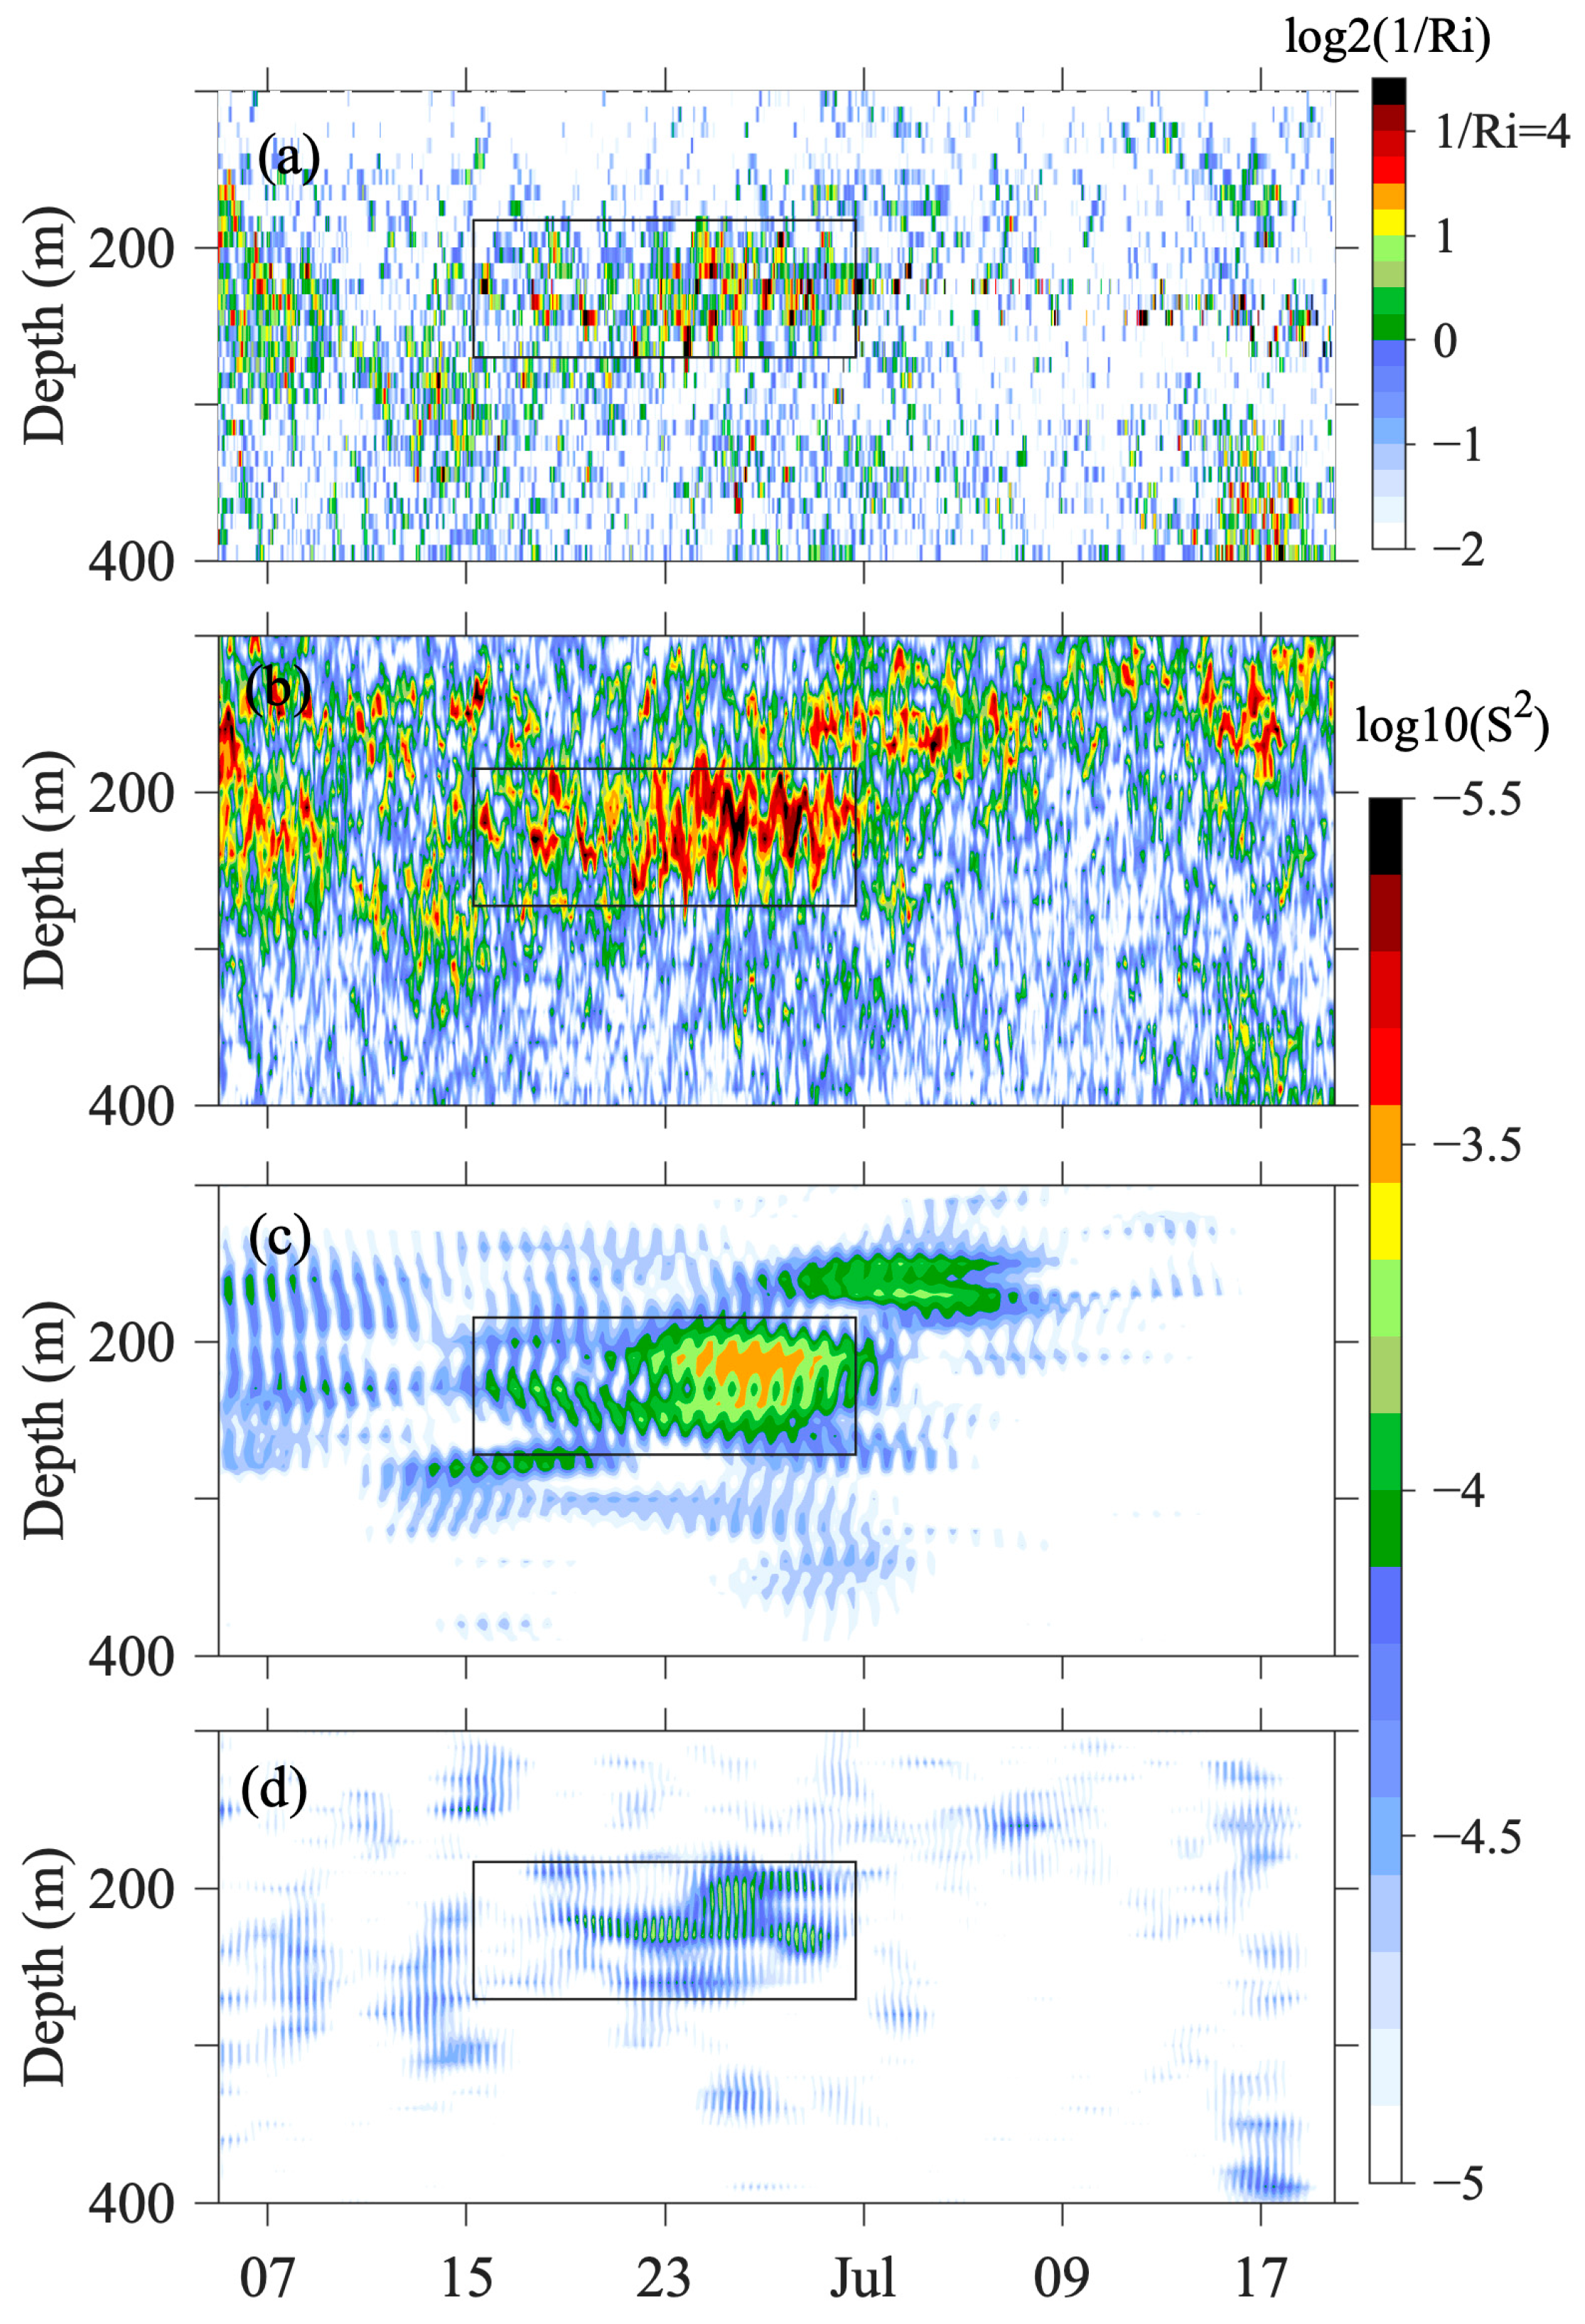
Enhanced vertical mixing can be triggered by strong current shear. The Richardson number (Ri), defined as the ratio of buoyancy frequency squared to the square of the vertical shear of horizontal velocity, is widely used to assess the stability of stratified water columns. At station MS during 15 June–1 July, Ri values dropped below 0.25 between 200 m and 270 m depths (black rectangle in Figure 9a), indicating conditions conducive to vigorous vertical mixing. In the same interval and depth range, the horizontal current shear intensified markedly (Figure 9b), likely due to intensified wave activity. Figure 9c,d reveal that both near-inertial oscillations and the fD1 waves generated significant shear at overlapping times and depths. Their superposition produced the pronounced horizontal shear enclosed by the black rectangle. This pattern suggests that these wave modes may also drive energy transfer to smaller scales via shear instability.

4. Discussion and Conclusions

In this study, four moorings were deployed in the core area of an anticyclonic eddy and used to distinguish the differences in the distribution of NIO energy within the small-scale region of the eddy core (Figure 2 and Figure 3). Our study demonstrates that NIKE is not uniformly distributed within anticyclonic eddies but is instead concentrated in the core, where strong NIOs are observed (Figure 7a,c,e). This energy is propagated from the eddy periphery toward the core (Figure 6), with kinetic energy primarily distributed at depths of 200–400 m (Figure 5 and Figure 7). The observed subharmonic waves fD1, formed by the interaction of NIOs and diurnal tidal waves (Figure 8a), highlight the critical role of the vertical nonlinear component in the energy transfer process (Figure 8b–d). Additionally, the cold-core eddy’s role as an energy conveyor sheds light on its contribution to mid-depth ocean mixing and energy dissipation.
Both numerical and theoretical studies have established that mesoscale eddies facilitate downward propagation of NIO energy [17,20,45]. Our results align with the findings of Chen et al. (2013) [46], who reported that NIKE could reach 30 J/m3 at a depth of about 120 m and become trapped in the core of anticyclonic eddies in the same area. However, the distribution of trapped NIO energy and energy transfer within the region of the eddy core lack observations. Although the intensity of the NIKE was weaker than that observed by Chen et al. (2013) [46], the depth at which the maximum NIKE occurred was 100 m deeper than the observation of Chen et al. (2013) [46]. Furthermore, within the region influenced by the anticyclonic eddy, there were significant spatial variations in the distribution of NIOs and fD1 wave energy. Specifically, there was a lack of NIKE in the outer region of the eddy, while the energy in the core of the eddy was notably enhanced, with pronounced wave–wave interactions observed.
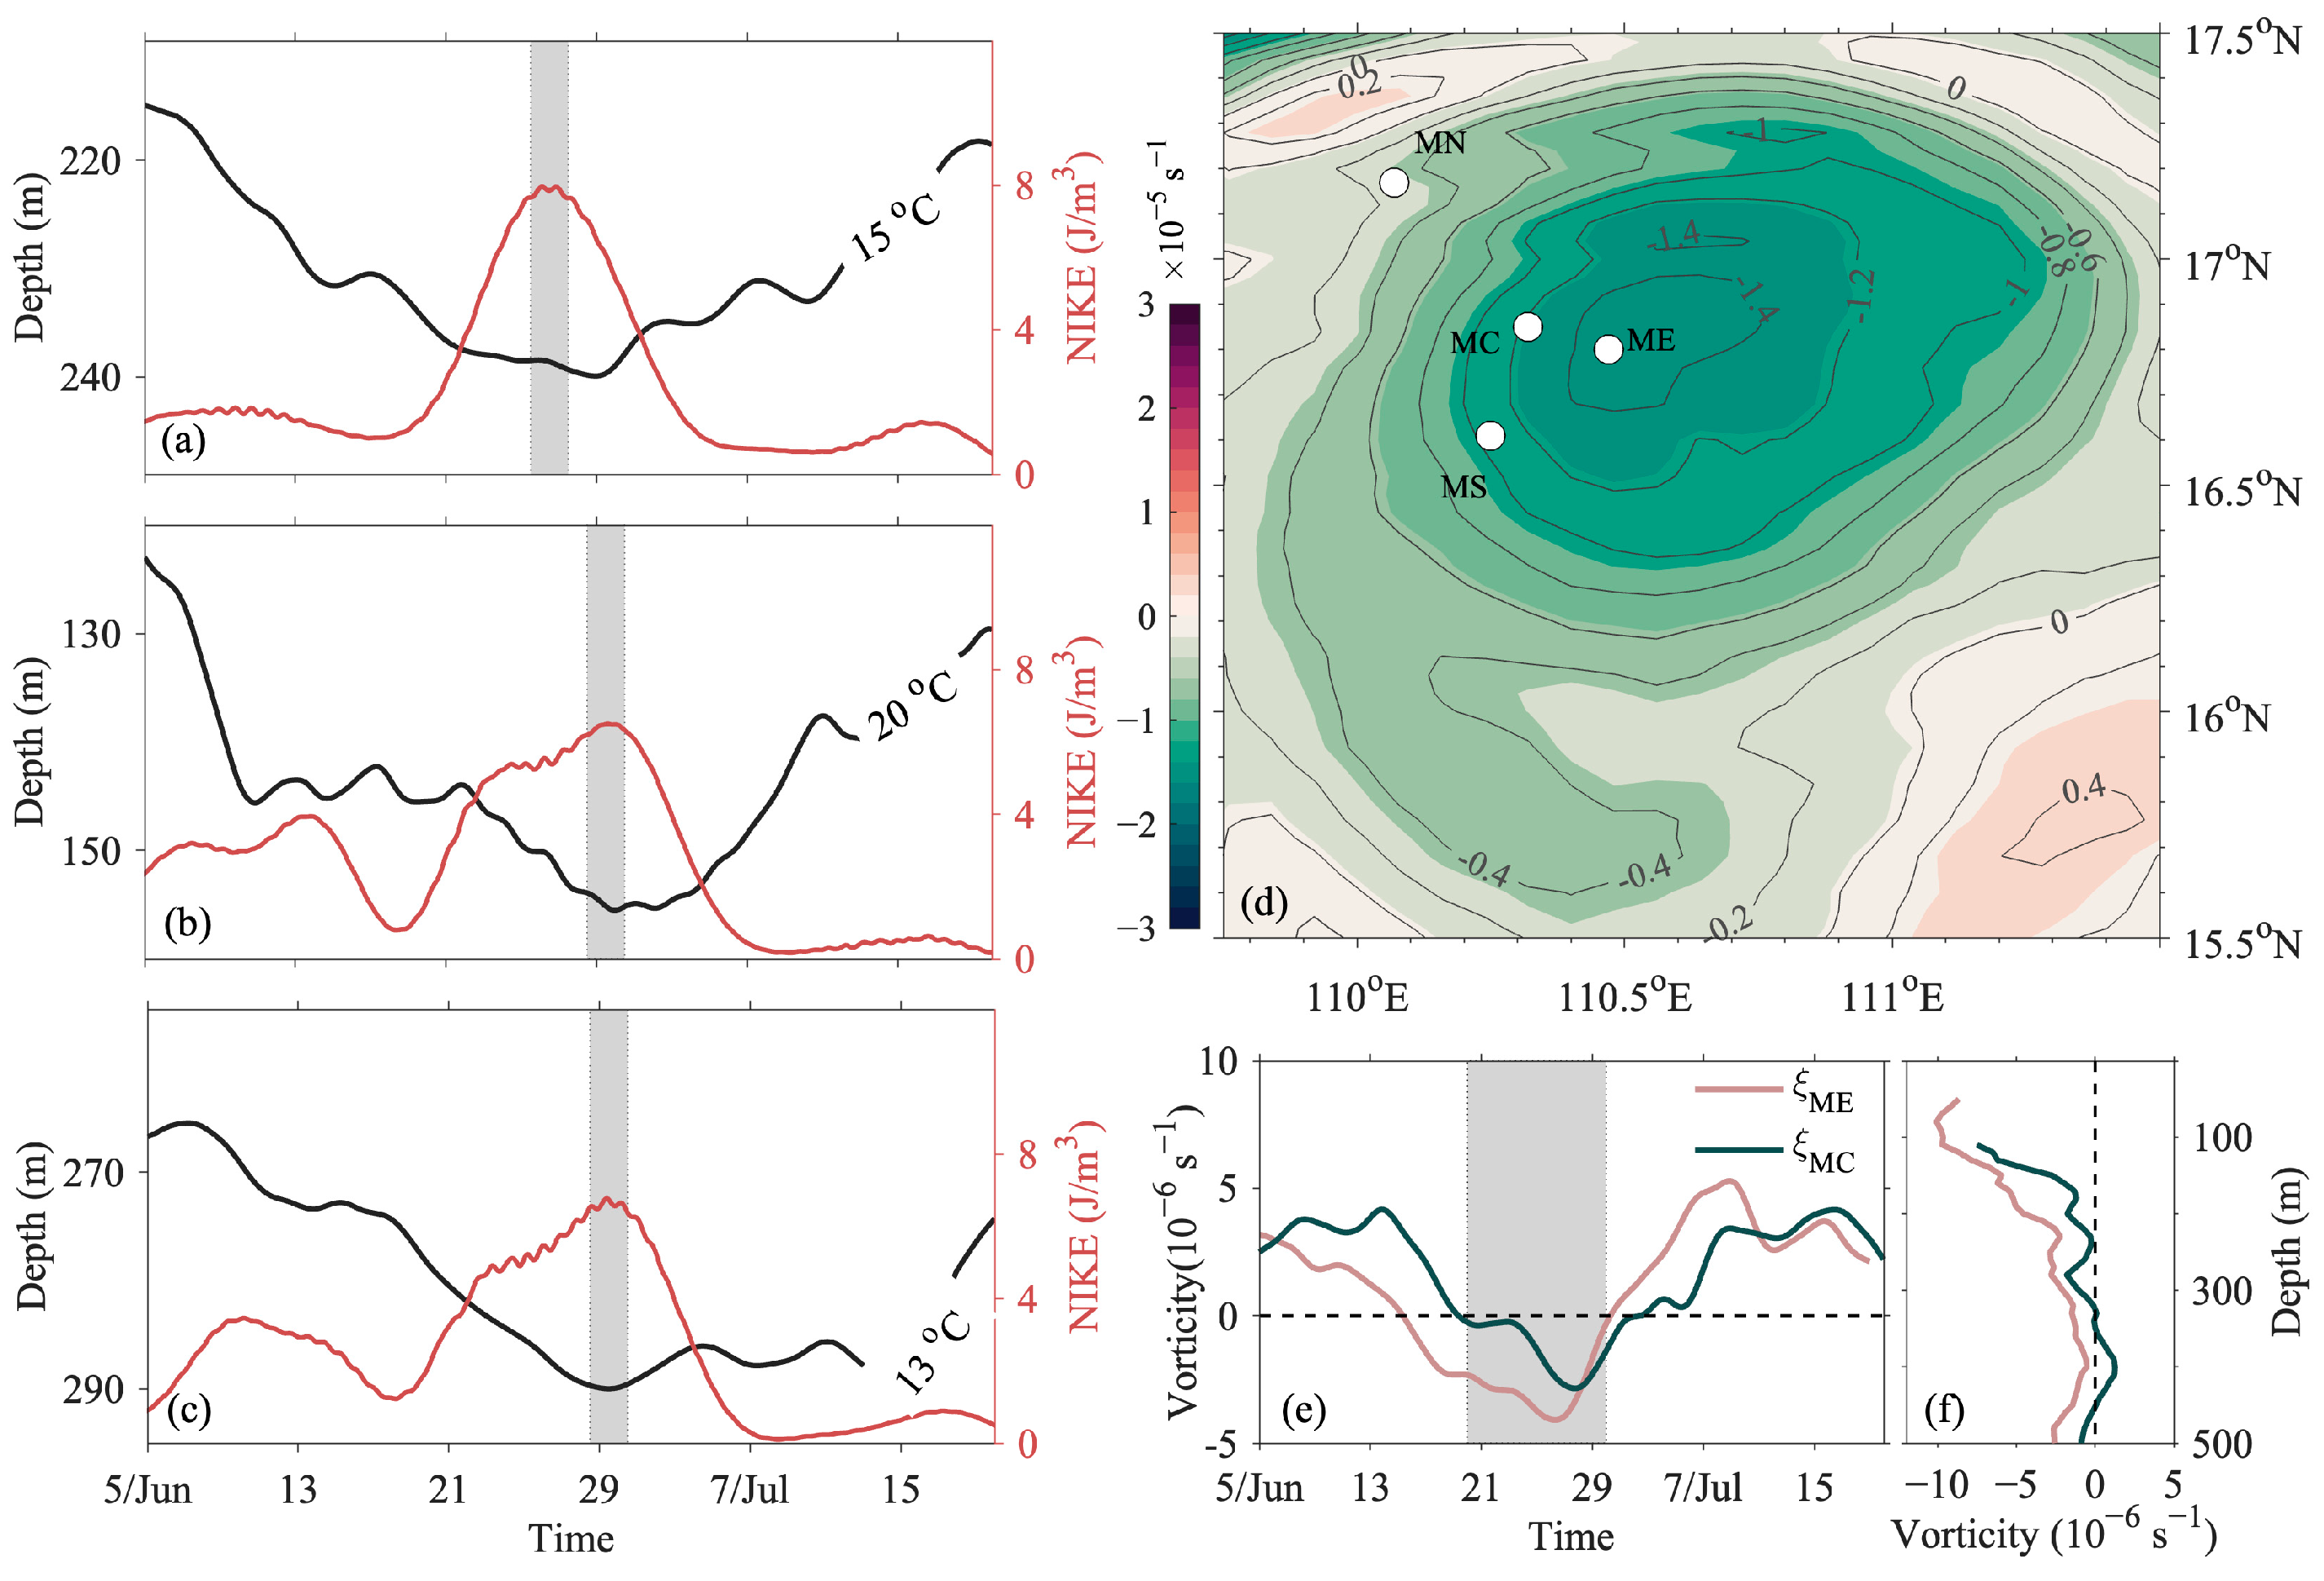
NIOs are predominantly generated through wind stress forcing within the oceanic mixed layer, propagating both horizontally and vertically. The vertical group velocity, which represents the rate at which wave energy propagates vertically, is inversely related to the square of the horizontal wavelength. Negative vorticity within an anticyclonic eddy, coupled with the background current, acts to shorten the horizontal wavelength of NIOs and thus modifies their propagation characteristics. Once these oscillations enter the eddy core, their energy is rapidly funneled downward. Moreover, the interaction between background shear and vorticity gradients refracts the wave field and drives energy transfer, producing an asymmetric distribution of oscillation energy. Meanwhile, anticyclonic eddies constrain horizontal energy dispersion, effectively trapping NIKE within their rotational framework during migration. Figure 10 highlights the three mooring sites most influenced by the eddy; at each site (Figure 10a–c), the onset of elevated NIKE coincides with the maximum downward deflection of the isotherms. The depth of greatest isotherm depression aligns with the eddy center, demonstrating that downward-propagating NIKE preferentially accumulates within the eddy core. A vorticity distribution analysis (Figure 10d) revealed spatial differentiation: the ME station occupied the eddy core and the MN station resided at the periphery, while the MC station was positioned along their transitional axis. The earlier onset of minimum vorticity at ME compared to MC (Figure 10e) corresponds to ME’s precedence in NIKE emergence. Although MC and MS exhibit peak NIKE nearly simultaneously (Figure 10b,c), the maximum at MS occurs at a greater depth. We hypothesize that this phenomenon is likely driven by horizontal shear gradients in the background current induced by strain. However, the absence of deep-layer velocity observations precludes a more detailed analysis.
Considering the exceptionally strong NIO energy observed (Figure 4 and Figure 7), we hypothesize that the intense winds of Typhoon Nuri, which traversed the study area on 13 June (Figure 1), supplied the initial energy for NIO generation. However, the mooring array was located more than 400 km from the typhoon’s track, with local wind speeds and mixed-layer near-inertial energy exhibiting no significant enhancement during the typhoon’s passage (Figure 7a,c,e,g). Moreover, there was a persistent vorticity dipole (positive–negative vortex pair) between the typhoon’s left-of-track region and the observational domain. Under such background vorticity conditions, upper-ocean energy tends to rapidly converge toward negative vorticity zones while propagating downward [15]. This mechanism likely governed the observed energy redistribution, ultimately leading to focused NIO energy accumulation at the core of the anticyclonic eddy (negative vorticity region).
As anticyclonic eddies move, they have the ability to horizontally transport NIKE [39]. During 13 June to 1 July, the core of the anticyclonic eddy (characterized by negative vorticity) migrated southwestward (Figure 2b,c and Figure 10a–c,e), coinciding with a westward propagation of elevated near-inertial energy toward the peripheral mooring stations (Figure 7 and Figure 10). We speculated that the NIKE recorded at our moorings was initially excited by Typhoon Nuri, subsequently captured by the anticyclonic eddy, and transported westward with the migrating core of the eddy into the mooring observation region. Meanwhile, nonlinear interactions between the NIOs and internal tides (Figure 8) facilitated energy transfer to higher-frequency, smaller-scale motions (Figure 7b,d,f). Under the vorticity confinement of the anticyclonic eddy (Figure 10d–f), energy accumulated within the eddy core and underwent dissipation through mechanisms of shear instability and nonlinear wave interactions. This synergistic process demonstrates that anticyclonic eddies act as energy conduits—collecting NIKE from large-scale forcing, redistributing it vertically and horizontally, and ultimately driving cross-scale energy transfer. The resultant small-scale energy dissipation significantly enhances the localized mixing efficiency, thereby supplying sustained energy inputs to oceanic turbulent mixing processes.
The identification of nonlinear components responsible for subharmonic wave generation highlights the importance of wave–wave interactions in energy cascade processes. Our findings underscore the significance of these mesoscale structures in facilitating the vertical and horizontal redistribution of NIKE, thereby influencing small-scale turbulent mixing processes. The observed interactions between NIOs and internal tides, leading to energy transfer to higher-frequency motions, highlight the complex dynamics governing energy cascades in the ocean. These interactions not only enhance local mixing efficiency but also contribute to the broader understanding of oceanic energy dynamics. Future research endeavors should focus on integrating high-resolution observational data with advanced numerical models to further unravel the intricate mechanisms of NIKE redistribution and its impact on oceanic mixing processes.

Author Contributions

Conceptualization, B.X. and F.L.; methodology, T.L.; software, B.H.; validation, F.L., B.X. and T.L.; formal analysis, T.L.; data curation, B.H.; writing—original draft preparation, B.X., C.L. and F.L.; writing—review and editing, B.X., T.L., B.H., C.L. and F.L.; supervision, F.L. All authors have read and agreed to the published version of the manuscript.

Funding

This research was funded by the Scientific Research Fund of the Second Institute of Oceanography, Ministry of Natural Resources, Grant No. SZ2404.

Data Availability Statement

The mooring data analyzed in this study are available on request from the corresponding author.

Conflicts of Interest

Botao Xie, Tao Liu and Bigui Huang were employed by CNOOC Research Institute Co., Ltd. The remaining authors declare that the research was conducted in the absence of any commercial or financial relationships that could be construed as a potential conflict of interest.

References

  1. Jochum, M.; Briegleb, B.P.; Danabasoglu, G.; Large, W.G.; Norton, N.J.; Jayne, S.R.; Alford, M.H.; Bryan, F.O. The Impact of Oceanic Near-Inertial Waves on Climate. J. Clim. 2013, 26, 2833–2844. [Google Scholar] [CrossRef]
  2. Alford, M.H.; MacKinnon, J.A.; Simmons, H.L.; Nash, J.D. Near-Inertial Internal Gravity Waves in the Ocean. Annu. Rev. Mar. Sci. 2016, 8, 95–123. [Google Scholar] [CrossRef] [PubMed]
  3. Li, Y.; Xu, Z.; Lv, X. The Generation and Propagation of Wind- and Tide-Induced Near-Inertial Waves in the Ocean. J. Mar. Sci. Eng. 2024, 12, 1565. [Google Scholar] [CrossRef]
  4. Gill, A.E. On the Behavior of Internal Waves in the Wakes of Storms. J. Phys. Oceanogr. 1984, 14, 1129–1151. [Google Scholar] [CrossRef]
  5. Moehlis, J.; Llewellyn Smith, S.G. Radiation of Mixed Layer Near-Inertial Oscillations into the Ocean Interior. J. Phys. Oceanogr. 2001, 31, 1550–1560. [Google Scholar] [CrossRef]
  6. Alford, M.H. Improved Global Maps and 54-year History of Wind-work on Ocean Inertial Motions. Geophys. Res. Lett. 2003, 30, 2002GL016614. [Google Scholar] [CrossRef]
  7. Jiang, J.; Lu, Y.; Perrie, W. Estimating the Energy Flux from the Wind to Ocean Inertial Motions: The Sensitivity to Surface Wind Fields. Geophys. Res. Lett. 2005, 32, 2005GL023289. [Google Scholar] [CrossRef]
  8. Rimac, A.; von Storch, J.-S.; Eden, C.; Haak, H. The Influence of High-Resolution Wind Stress Field on the Power Input to near-Inertial Motions in the Ocean. Geophys. Res. Lett. 2013, 40, 4882–4886. [Google Scholar] [CrossRef]
  9. Egbert, G.D.; Erofeeva, S.Y. Efficient Inverse Modeling of Barotropic Ocean Tides. J. Atmos. Oceanic Technol. 2002, 19, 183–204. [Google Scholar] [CrossRef]
  10. Mooers, C.N.K. Several Effects of a Baroclinic Current on the Cross-stream Propagation of Inertial-internal Waves. Geophys. Astrophys. Fluid Dyn. 1975, 6, 245–275. [Google Scholar] [CrossRef]
  11. Kunze, E. Near-Inertial Wave Propagation in Geostrophic Shear. J. Phys. Oceanogr. 1985, 15, 544–565. [Google Scholar] [CrossRef]
  12. D’Asaro, E.A. The Decay of Wind-forced Mixed Layer Inertial Oscillations Due to the β Effect. J. Geophys. Res. 1989, 94, 2045–2056. [Google Scholar] [CrossRef]
  13. Garrett, C. What Is the “Near-Inertial” Band and Why Is It Different from the Rest of the Internal Wave Spectrum? J. Phys. Oceanogr. 2001, 31, 962–971. [Google Scholar] [CrossRef]
  14. Thomas, L.N.; Rainville, L.; Asselin, O.; Young, W.R.; Girton, J.; Whalen, C.B.; Centurioni, L.; Hormann, V. Direct Observations of Near-Inertial Wave ζ-Refraction in a Dipole Vortex. Geophys. Res. Lett. 2020, 47, e2020GL090375. [Google Scholar] [CrossRef]
  15. Asselin, O.; Young, W.R. Penetration of Wind-Generated Near-Inertial Waves into a Turbulent Ocean. J. Phys. Oceanogr. 2020, 50, 1699–1716. [Google Scholar] [CrossRef]
  16. Lee, D.; Niiler, P.P. The Inertial Chimney: The Near-inertial Energy Drainage from the Ocean Surface to the Deep Layer. J. Geophys. Res. 1998, 103, 7579–7591. [Google Scholar] [CrossRef]
  17. Zhai, X.; Greatbatch, R.J.; Zhao, J. Enhanced Vertical Propagation of Storm-induced Near-inertial Energy in an Eddying Ocean Channel Model. Geophys. Res. Lett. 2005, 32, 2005GL023643. [Google Scholar] [CrossRef]
  18. Joyce, T.M.; Toole, J.M.; Klein, P.; Thomas, L.N. A Near-inertial Mode Observed within a Gulf Stream Warm-core Ring. J. Geophys. Res. Oceans 2013, 118, 1797–1806. [Google Scholar] [CrossRef]
  19. Whitt, D.B.; Thomas, L.N. Near-Inertial Waves in Strongly Baroclinic Currents. J. Phys. Oceanogr. 2013, 43, 706–725. [Google Scholar] [CrossRef]
  20. Danioux, E.; Vanneste, J.; Bühler, O. On the Concentration of Near-Inertial Waves in Anticyclones. J. Fluid Mech. 2015, 773, R2. [Google Scholar] [CrossRef]
  21. Alford, M.H.; Whitmont, M. Seasonal and Spatial Variability of Near-Inertial Kinetic Energy from Historical Moored Velocity Records. J. Phys. Oceanogr. 2007, 37, 2022–2037. [Google Scholar] [CrossRef]
  22. Yu, X.; Naveira Garabato, A.C.; Vic, C.; Gula, J.; Savage, A.C.; Wang, J.; Waterhouse, A.F.; MacKinnon, J.A. Observed Equatorward Propagation and Chimney Effect of Near-Inertial Waves in the Midlatitude Ocean. Geophys. Res. Lett. 2022, 49, e2022GL098522. [Google Scholar] [CrossRef]
  23. Li, Q.; Chen, Z.; Guan, S.; Yang, H.; Jing, Z.; Liu, Y.; Sun, B.; Wu, L. Enhanced Near-Inertial Waves and Turbulent Diapycnal Mixing Observed in a Cold- and Warm-Core Eddy in the Kuroshio Extension Region. J. Phys. Oceanogr. 2022, 52, 1849–1866. [Google Scholar] [CrossRef]
  24. Martínez-Marrero, A.; Barceló-Llull, B.; Pallàs-Sanz, E.; Aguiar-González, B.; Estrada-Allis, S.N.; Gordo, C.; Grisolía, D.; Rodríguez-Santana, A.; Arístegui, J. Near-Inertial Wave Trapping Near the Base of an Anticyclonic Mesoscale Eddy Under Normal Atmospheric Conditions. J. Geophys. Res. Oceans 2019, 124, 8455–8467. [Google Scholar] [CrossRef]
  25. Kunze, E.; Schmitt, R.W.; Toole, J.M. The Energy Balance in a Warm-Core Ring’s Near-Inertial Critical Layer. J. Phys. Oceanogr. 1995, 25, 942–957. [Google Scholar] [CrossRef]
  26. Simmons, H.L. Spectral Modification and Geographic Redistribution of the Semi-Diurnal Internal Tide. Ocean Modell. 2008, 21, 126–138. [Google Scholar] [CrossRef]
  27. Xing, J.; Davies, A.M. Processes Influencing the Non-linear Interaction between Inertial Oscillations, Near Inertial Internal Waves and Internal Tides. Geophys. Res. Lett. 2002, 29, 11-1–11-4. [Google Scholar] [CrossRef]
  28. Chen, G.; Hou, Y.; Chu, X.; Qi, P. Vertical Structure and Evolution of the Luzon Warm Eddy. Chin. J. Ocean. Limnol. 2010, 28, 955–961. [Google Scholar] [CrossRef]
  29. Chu, X.; Xue, H.; Qi, Y.; Chen, G.; Mao, Q.; Wang, D.; Chai, F. An Exceptional Anticyclonic Eddy in the South China Sea in 2010. JGR Oceans 2014, 119, 881–897. [Google Scholar] [CrossRef]
  30. Wang, D.; Xu, H.; Lin, J.; Hu, J. Anticyclonic Eddies in the Northeastern South China Sea during Winter 2003/2004. J. Oceanogr. 2008, 64, 925–935. [Google Scholar] [CrossRef]
  31. Zhang, Z.; Zhao, W.; Qiu, B.; Tian, J. Anticyclonic Eddy Sheddings from Kuroshio Loop and the Accompanying Cyclonic Eddy in the Northeastern South China Sea. J. Phys. Oceanogr. 2017, 47, 1243–1259. [Google Scholar] [CrossRef]
  32. Li, L.; Nowlin, W.D.; Jilan, S. Anticyclonic Rings from the Kuroshio in the South China Sea. Deep Sea Res. Part I Oceanogr. Res. Pap. 1998, 45, 1469–1482. [Google Scholar] [CrossRef]
  33. Li, B.; Du, L.; Peng, S.; Yuan, Y.; Meng, X.; Lv, X. Modulation of Internal Tides by Turbulent Mixing in the South China Sea. Front. Mar. Sci. 2021, 8, 772979. [Google Scholar] [CrossRef]
  34. Wang, W.; Li, J.; Huang, X. Semidiurnal Internal Tide Interference in the Northern South China Sea. J. Mar. Sci. Eng. 2024, 12, 811. [Google Scholar] [CrossRef]
  35. Chen, G.; Hou, Y.; Chu, X. Mesoscale Eddies in the South China Sea: Mean Properties, Spatiotemporal Variability, and Impact on Thermohaline Structure. J. Geophys. Res. 2011, 116, C06018. [Google Scholar] [CrossRef]
  36. Lin, F.; Zhu, L.; Zhou, B.; Ding, T.; Jin, W.; Liang, C. Observations of Strong Near-Inertial Currents Induced by the Reflection of Tropical Cyclone-Induced Near-Inertial Waves on the Continental Slope of the Northern South China Sea. Deep Sea Res. Part I Oceanogr. Res. Pap. 2022, 190, 103893. [Google Scholar] [CrossRef]
  37. Liu, J.; He, Y.; Li, J.; Cai, S.; Wang, D.; Huang, Y. Cases Study of Nonlinear Interaction Between Near-Inertial Waves Induced by Typhoon and Diurnal Tides Near the Xisha Islands. J. Geophys. Res. Oceans 2018, 123, 2768–2784. [Google Scholar] [CrossRef]
  38. Guan, S.; Zhao, W.; Huthnance, J.; Tian, J.; Wang, J. Observed Upper Ocean Response to Typhoon Megi (2010) in the Northern South China Sea. J. Geophys. Res. Oceans 2014, 119, 3134–3157. [Google Scholar] [CrossRef]
  39. Xu, X.; Zhao, W.; Huang, X.; Hu, Q.; Guan, S.; Zhou, C.; Tian, J. Observed Near-Inertial Waves Trapped in a Propagating Anticyclonic Eddy. J. Phys. Oceanogr. 2022, 52, 2029–2047. [Google Scholar] [CrossRef]
  40. Gonella, J. A Rotary-Component Method for Analysing Meteorological and Oceanographic Vector Time Series. Deep Sea Res. Abstr. 1972, 19, 833–846. [Google Scholar] [CrossRef]
  41. Alford, M.H.; Gregg, M.C. Near-inertial Mixing: Modulation of Shear, Strain and Microstructure at Low Latitude. J. Geophys. Res. 2001, 106, 16947–16968. [Google Scholar] [CrossRef]
  42. Leaman, K.D. Observations on the Vertical Polarization and Energy Flux of Near-Inertial Waves. J. Phys. Oceanogr. 1976, 6, 894–908. [Google Scholar] [CrossRef]
  43. Xie, X.; Chen, G.; Shang, X.; Fang, W. Evolution of the Semidiurnal (M2) Internal Tide on the Continental Slope of the Northern South China Sea. Geophys. Res. Lett. 2008, 35, 2008GL034179. [Google Scholar] [CrossRef]
  44. Xie, X.; Shang, X.; Van Haren, H.; Chen, G. Observations of Enhanced Nonlinear Instability in the Surface Reflection of Internal Tides. Geophys. Res. Lett. 2013, 40, 1580–1586. [Google Scholar] [CrossRef]
  45. Young, W.R.; Jelloul, M.B. Propagation of Near-Inertial Oscillations through a Geostrophic Flow. J. Mar. Res. 1997, 55, 735–766. [Google Scholar] [CrossRef]
  46. Chen, G.; Xue, H.; Wang, D.; Xie, Q. Observed Near-Inertial Kinetic Energy in the Northwestern South China Sea. J. Geophys. Res. Oceans 2013, 118, 4965–4977. [Google Scholar] [CrossRef]
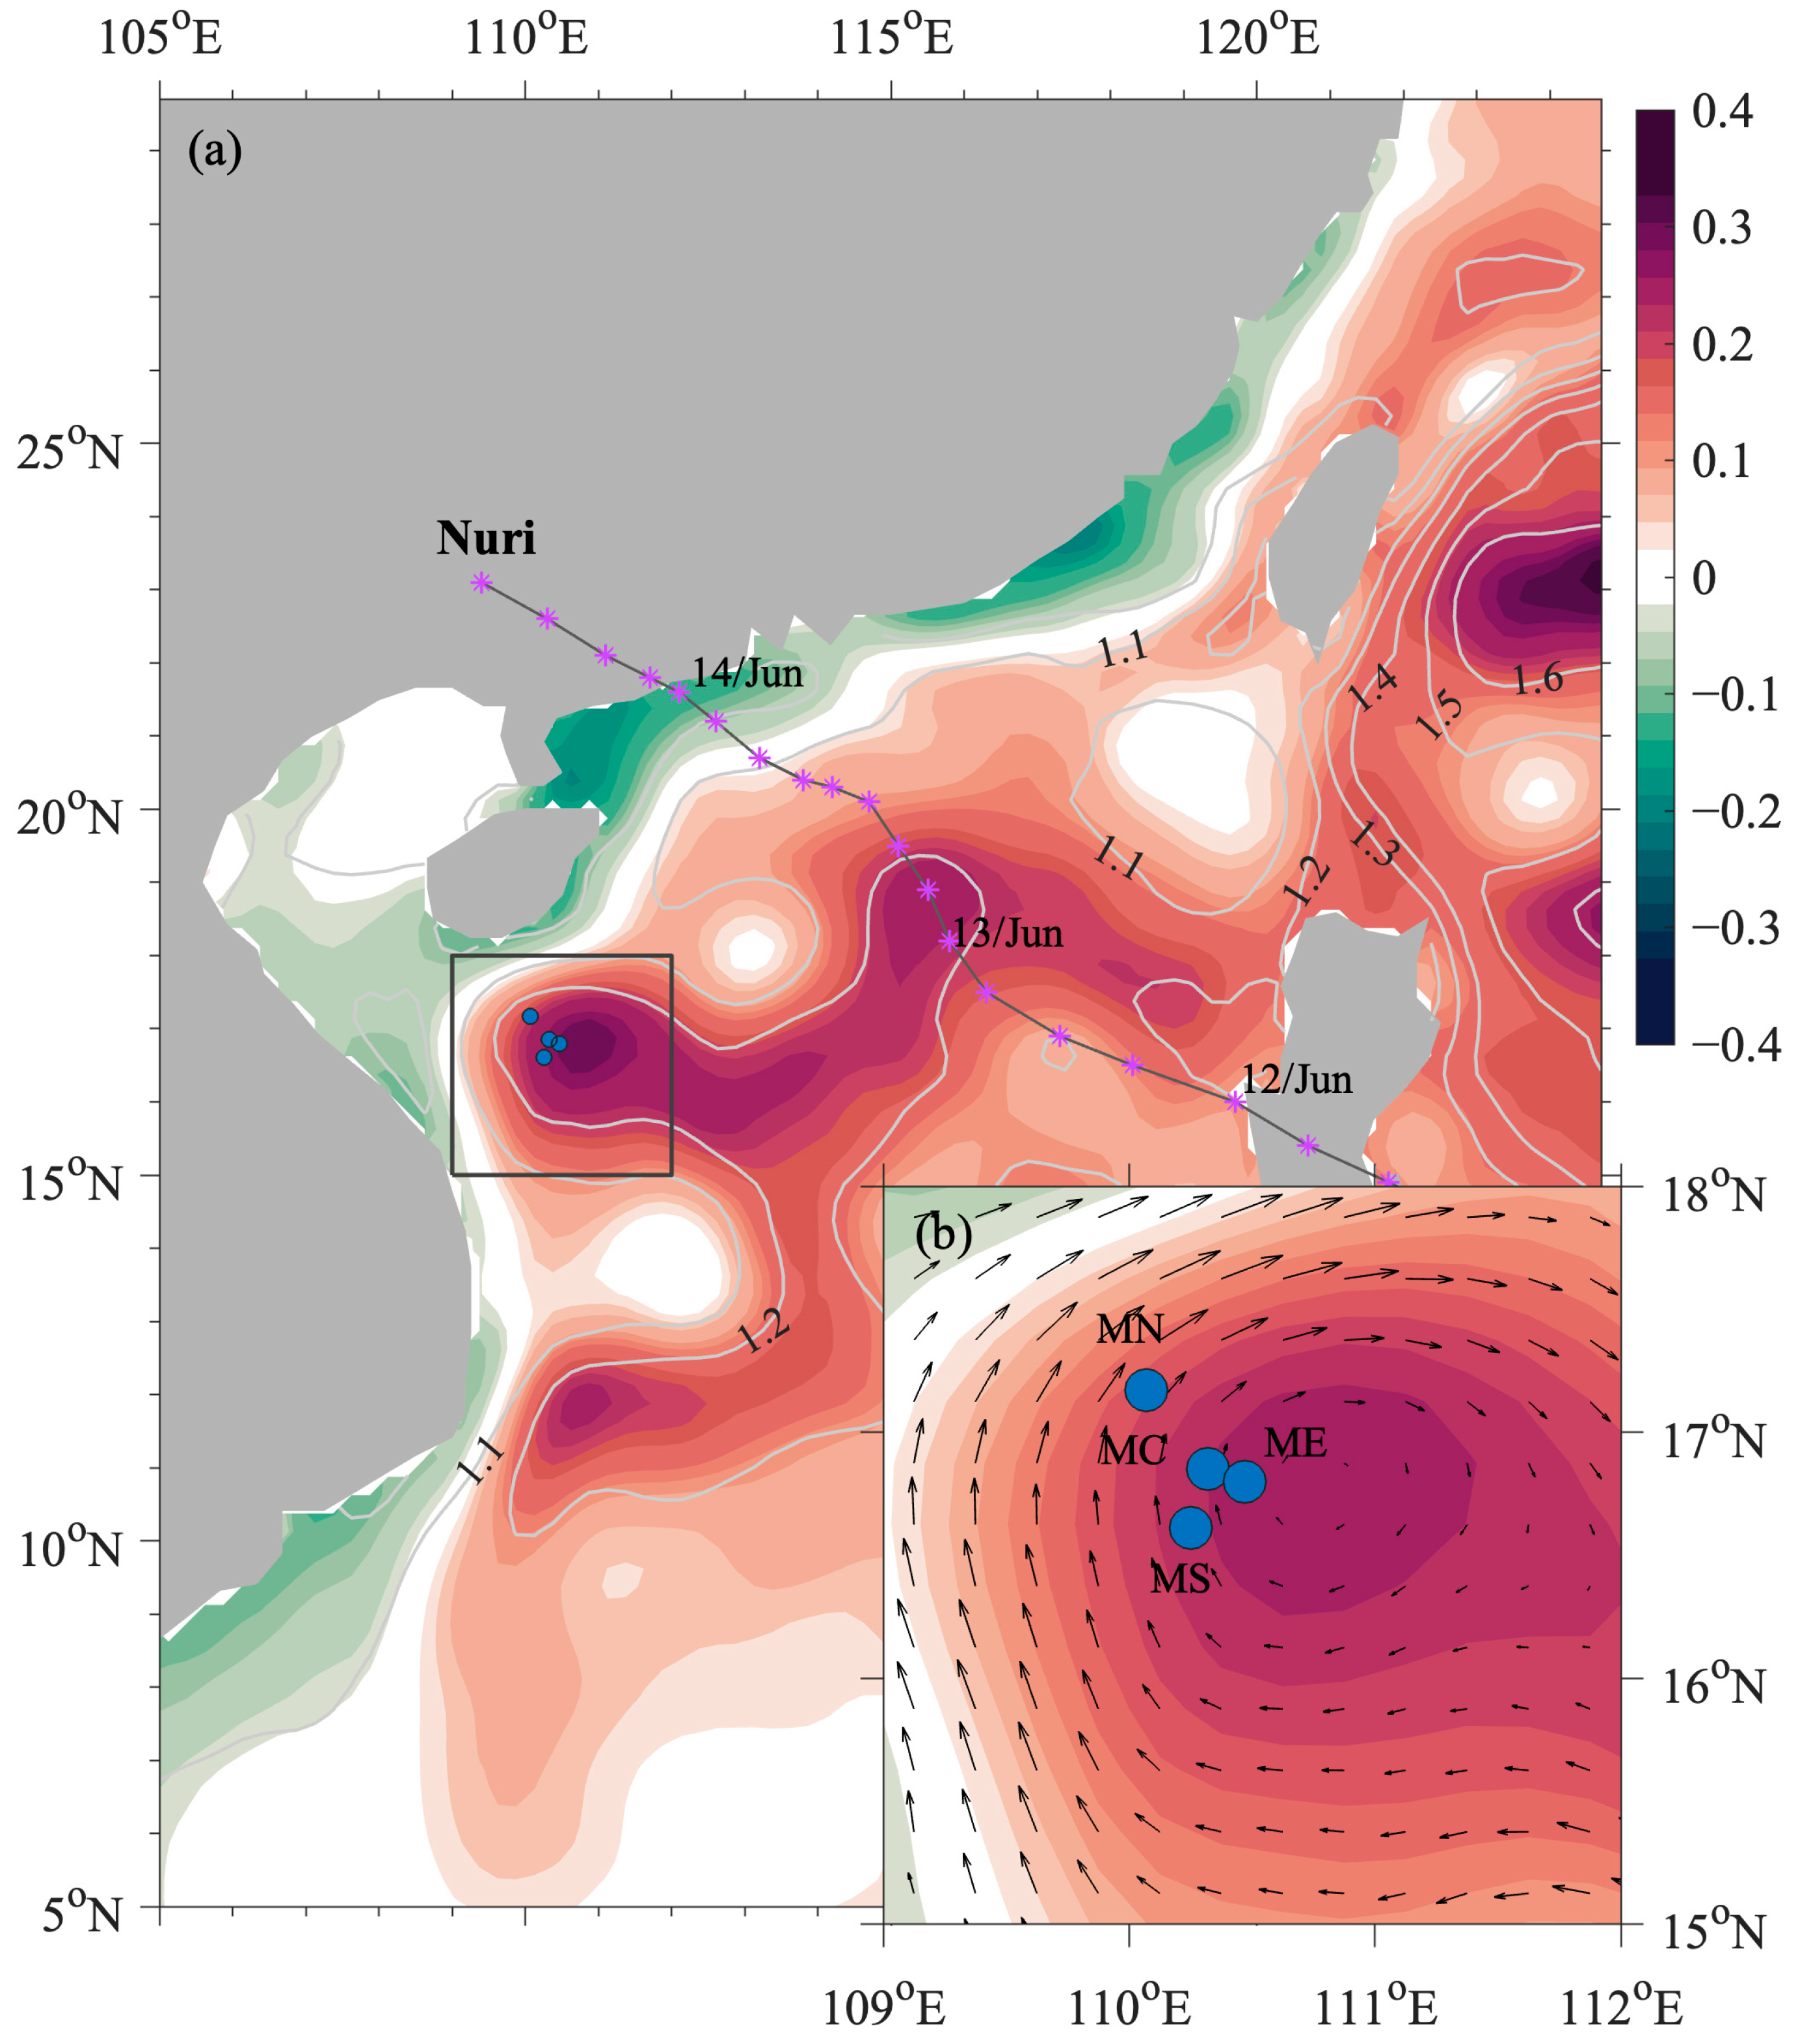
Figure 1. (a) Study area and mooring sites and (b) an enlarged view of the black box region in (a). White contours denote the sea surface height, with color shading representing sea level anomalies. The purple starred line delineates the trajectory of Typhoon Nuri. Arrows indicate geostrophic current anomalies, and blue dots correspond to mooring station locations in (b).
Jmse 13 01079 g001
Figure 2. Spatial distributions of the mean SLA (color shading) and geostrophic currents (arrows) during (a) 1–7 June, (b) 19–25 June, (c) 3–9 July, and (d) 16–22 July. White contours indicate the 0.25 m sea level anomaly isoline. The blue line indicates a transect that crossed the anticyclone and connects stations MN and MC.
Jmse 13 01079 g002
Figure 3. Low-frequency currents observed at stations (a,b) ME, (c,d) MC, (e,f) MS, and (g,h) MN from 1 June to 25 July. In each panel, the left and right columns represent the zonal and meridional velocity components, respectively (positive values indicate eastward and northward currents). Black dashed lines indicate zero-velocity contours (0 m/s).
Jmse 13 01079 g003
Figure 4. Depth–time distributions of temperature at the MS station from (a) in situ observations and (b) HYCOM. Sectional distributions of temperature on (c) 25 Jun and (d) 9 Jul along the blue line in Figure 2c. The red triangles indicate the positions of the moorings along the cross-section.
Jmse 13 01079 g004
Figure 5. Spectral and near-inertial current velocities at station ME: (a) depth-averaged rotary spectra, (b) CW components of rotary spectra at 70 m and 200 m depths, and (c) zonal and (d) meridional components of near-inertial current velocities.
Jmse 13 01079 g005
Figure 6. Near-inertial current shear ellipses at stations (a) MN, (b) MC, (c) MS, and (d) ME. Red arrows denote the propagation directions of NIOs.
Jmse 13 01079 g006
Figure 7. Depth–time distributions of NIKE and fD1 wave kinetic energy at the (a,b) ME station, (c,d) MC station, (e,f) MS station, and (g,h) MN station. Red lines denote vertical profiles of downward-propagating NIKE and fD1 wave kinetic energy time-averaged within the black dashed box, while black lines indicate upward-propagating counterparts.
Jmse 13 01079 g007
Figure 8. (a) Bicoherence spectral distribution at station MS. Depth–time distributions of (b) total vertical nonlinear momentum, (c) component 1, and (d) component 2.
Jmse 13 01079 g008
Figure 9. (a) Richardson number distribution at station MS. Vertical shear distributions of (b) total horizontal currents, (c) currents at near-inertial frequency, and (d) currents at fD1 frequency.
Jmse 13 01079 g009
Figure 10. Temporal variations in isopycnal depths and depth-averaged NIKE for (a) ME, (b) MC, and (c) MS. (d) Sea surface vorticity distribution. (e) Temporal variations in relative vorticity for ME (red line) and MC (black line), calculated with respect to MN. (f) Depth profiles of average relative vorticity during shaded time period in (e).
Jmse 13 01079 g010
Disclaimer/Publisher’s Note: The statements, opinions and data contained in all publications are solely those of the individual author(s) and contributor(s) and not of MDPI and/or the editor(s). MDPI and/or the editor(s) disclaim responsibility for any injury to people or property resulting from any ideas, methods, instructions or products referred to in the content.