Article

Astronomical Forcing of Fine-Grained Sedimentary Rocks and Its Implications for Shale Oil and Gas Exploration: The BONAN Sag, Bohai Bay Basin, China

1
State Key Laboratory of Shale Oil and Gas Enrichment Mechanisms and Efficient Development, Beijing 102206, China
2
Sinopec Key Laboratory of Shale Oil/Gas Exploration and Production Technology, Beijing 102206, China
3
School of Energy Resources, China University of Geosciences, Beijing 100083, China
4
Petroleum Exploration and Production Research Institute, Sinopec, Beijing 102206, China
5
Exploration and Production Research Institute, Liaohe Oilfield of CNPC, Panjin 124010, China
*
Author to whom correspondence should be addressed.
J. Mar. Sci. Eng. 2025, 13(6), 1080; https://doi.org/10.3390/jmse13061080
Submission received: 26 April 2025 / Revised: 23 May 2025 / Accepted: 27 May 2025 / Published: 29 May 2025

Abstract

Fine-grained sedimentary rocks are ideal carriers for astronomical cycle analysis as they can record and preserve significant astronomical cycle signals. Spectral analysis using the Multi-taper Method (MTM) and Evolutionary Harmonic Analysis (EHA) using the Fast Fourier Transform (FFT) were conducted on natural gamma data from key wells in the Es3l sub-member in the Bonan Sag, Bohai Bay Basin, China. Gaussian bandpass filtering was applied using a short eccentricity cycle of 100 ka, and a “floating” astronomical time scale for the Es3l sub-member (Lower 3rd sub-member of Shahejie Formation in Eocene) was established using magnetic stratigraphic ages as boundaries. Stratigraphic divisions were made for single wells in the Es3l of the Bonan Sag, and a stratigraphic framework was established based on correlations between key wells. The research results indicate the following: Firstly, the Es3l of the Bonan Sag records significant astronomical cycle signals, with an optimal sedimentation rate of 8.39 cm/ka identified. Secondly, the cyclical thicknesses corresponding to long eccentricity, short eccentricity, obliquity, and precession cycles are 38.9 m, 9.7 m, 4.6–3.4 m, and 1.96–1.66 m, respectively. Thirdly, the Es3l sub-member stably records 6 long eccentricity cycles and 26 short eccentricity cycles, and the short eccentricity curve is used as a basis for stratigraphic division for high-precision stratigraphic correlations. Fourthly, the quality of sandstone-interbedded mudrock is jointly controlled by the short eccentricity and precession. Eccentricity maximum values result in thicker sandstone interlayers, while minimum precession values promote the thickness of sandstone interlayers. Through astronomical cycle analysis, the depositional evolution mechanism of sandstone-interbedded mudrock is revealed. Combined with the results of high-precision stratigraphic division, this can provide a basis for fine evaluation and “sweet spot” prediction of lacustrine shale oil reservoirs.

1. Introduction

Fine-grained sedimentary rocks refer to sedimentary rocks composed of particles with a diameter of less than 0.0625 mm [1,2], which have undergone consolidation and lithification [3], specifically mudrock in this context. Recently, shale oil and gas exploration have gained significant momentum [4,5,6], and the Bonan Sag of the Bohai Bay Basin in China exhibits substantial potential for shale oil exploration in the Es3l sub-member. However, a lack of understanding of lithofacies types and their distribution patterns has hindered breakthroughs in shale oil exploration [7], necessitating more in-depth research on mudrock strata. Traditional stratigraphic division methods offer limited precision for fine-grained sedimentary rocks [8]. Due to their continuity in deposition and ability to record significant astronomical cycle signals, fine-grained sedimentary rocks are ideal for astronomical cycle analysis [9].
Milankovitch proposed the theory of Milankovitch cycles in 1941 [10] (referred to as an astronomical cycle in this article), which suggests that variations in Earth’s orbital parameters (eccentricity, obliquity, and precession) drive Quaternary glacial–interglacial cycles [11], resulting in sedimentary cyclicity [12,13,14]. This theory has gained widespread recognition and application in studying sedimentary records throughout geological history. Scholars have identified astronomical cycle signals in various sedimentary materials, including fine-grained sediments [15,16,17]. Meanwhile, some international studies have focused on marine deposits, arguing that lacustrine deposits are significantly influenced by terrestrial inputs and tectonic activities [18,19]. With the deepening of shale oil and gas exploration, many scholars have identified astronomical cycle signals in lacustrine fine-grained sedimentary rocks, such as the Teruel Basin in Spain [20,21], the Mudurnu-Göynük Basin in Turkey [22], the Upper Cretaceous strata of the Songliao Basin in China [23], and the Paleogene strata of the Bohai Bay Basin [7,9,24,25]. However, the majority of research undertaken by these scholars has concentrated on utilising the astronomical cycle theory to elucidate the palaeoclimatic characteristics, organic matter-enrichment factors, and the stratigraphic division of single wells within lacustrine deposits. These studies remain largely focused on individual “points” and are insufficient to support predictions of lithofacies development types or to ascertain the spatial relationships between lithofacies. Astronomical cycles influence climate change and, subsequently, sedimentary processes by modulating the amount of sunlight received on Earth’s surface through variations in its orbital parameters. Research has demonstrated that Earth’s orbital parameters can impact climate variations on both local and global scales [24], spanning timescales from tens of thousands to millions of years. Consequently, by identifying astronomical cycle signals within strata, it is feasible to establish an astronomical timescale with a resolution of tens of thousands of years [26]. The crux of identifying astronomical cycle signals lies in comprehending fluctuations in sedimentation rates. The temporal implications inherent in astronomical cycle theory form the cornerstone for high-precision stratigraphic division and correlation. By harnessing the relationship between orbital cycles and sedimentation, the author addresses the challenges of astronomical cycle stratigraphic division and correlation, sandstone-interbedded mudrock to quality prediction, and deposition mechanisms from a sedimentary genesis perspective, offering a novel methodology for precise shale oil and gas exploration. This approach holds considerable significance for guiding the precise exploration of shale oil and gas resources [27].
This study focuses on stratigraphic correlation by selecting representative key wells from the Bonan Sag within the Jiyang Depression of the Bohai Bay Basin. Some scholars have used GR logging curves to identify sedimentary cycles, namely the gamma deviation logging (GDL) method [28]. Since Natural Gamma (GR) data from well logs serve as an ideal palaeoclimatic proxy for cyclostratigraphic analysis [29], GR is adopted as the proxy for astronomical cycle analysis. Spectral analysis, evolutionary harmonic analysis, and correlation coefficient (“COCO”) analysis are employed to constrain vertical variations in sedimentation rates, identify astronomical cycle signals, and determine the optimal sedimentation rate for the Es3l sub-member. Signal validation is conducted, and astronomical cycle signals are extracted from the Es3l sub-member strata. Through filtering and tuning, the cyclical curves are derived, and a “floating” astronomical timescale is established using the 100 ka short eccentricity cycle. This allows for the calculation of sedimentation rates at different depths. The extracted astronomical cycle-filtered curves are then utilized for stratigraphic division and correlation. The 100 ka short eccentricity cycle curve is applied to the stratigraphic division of individual wells, and the results are integrated into well-tie stratigraphic correlations to establish a stratigraphic framework. The well JYC-1, characterized by the most exemplary features of sandstone-interbedded mudrock within the study region, is designated as the primary focus of the research. This well serves as a crucial subject for analyzing astronomical cycles, predicting sandstone-interbedded mudrock quality, and elucidating the mechanisms of depositional evolution. This study applies astronomical cycle theory to cyclostratigraphic analysis, using filtered curves as a basis for high-precision stratigraphic division and correlation, thereby facilitating an intuitive understanding of lithofacies development patterns and predictions of lithofacies types.

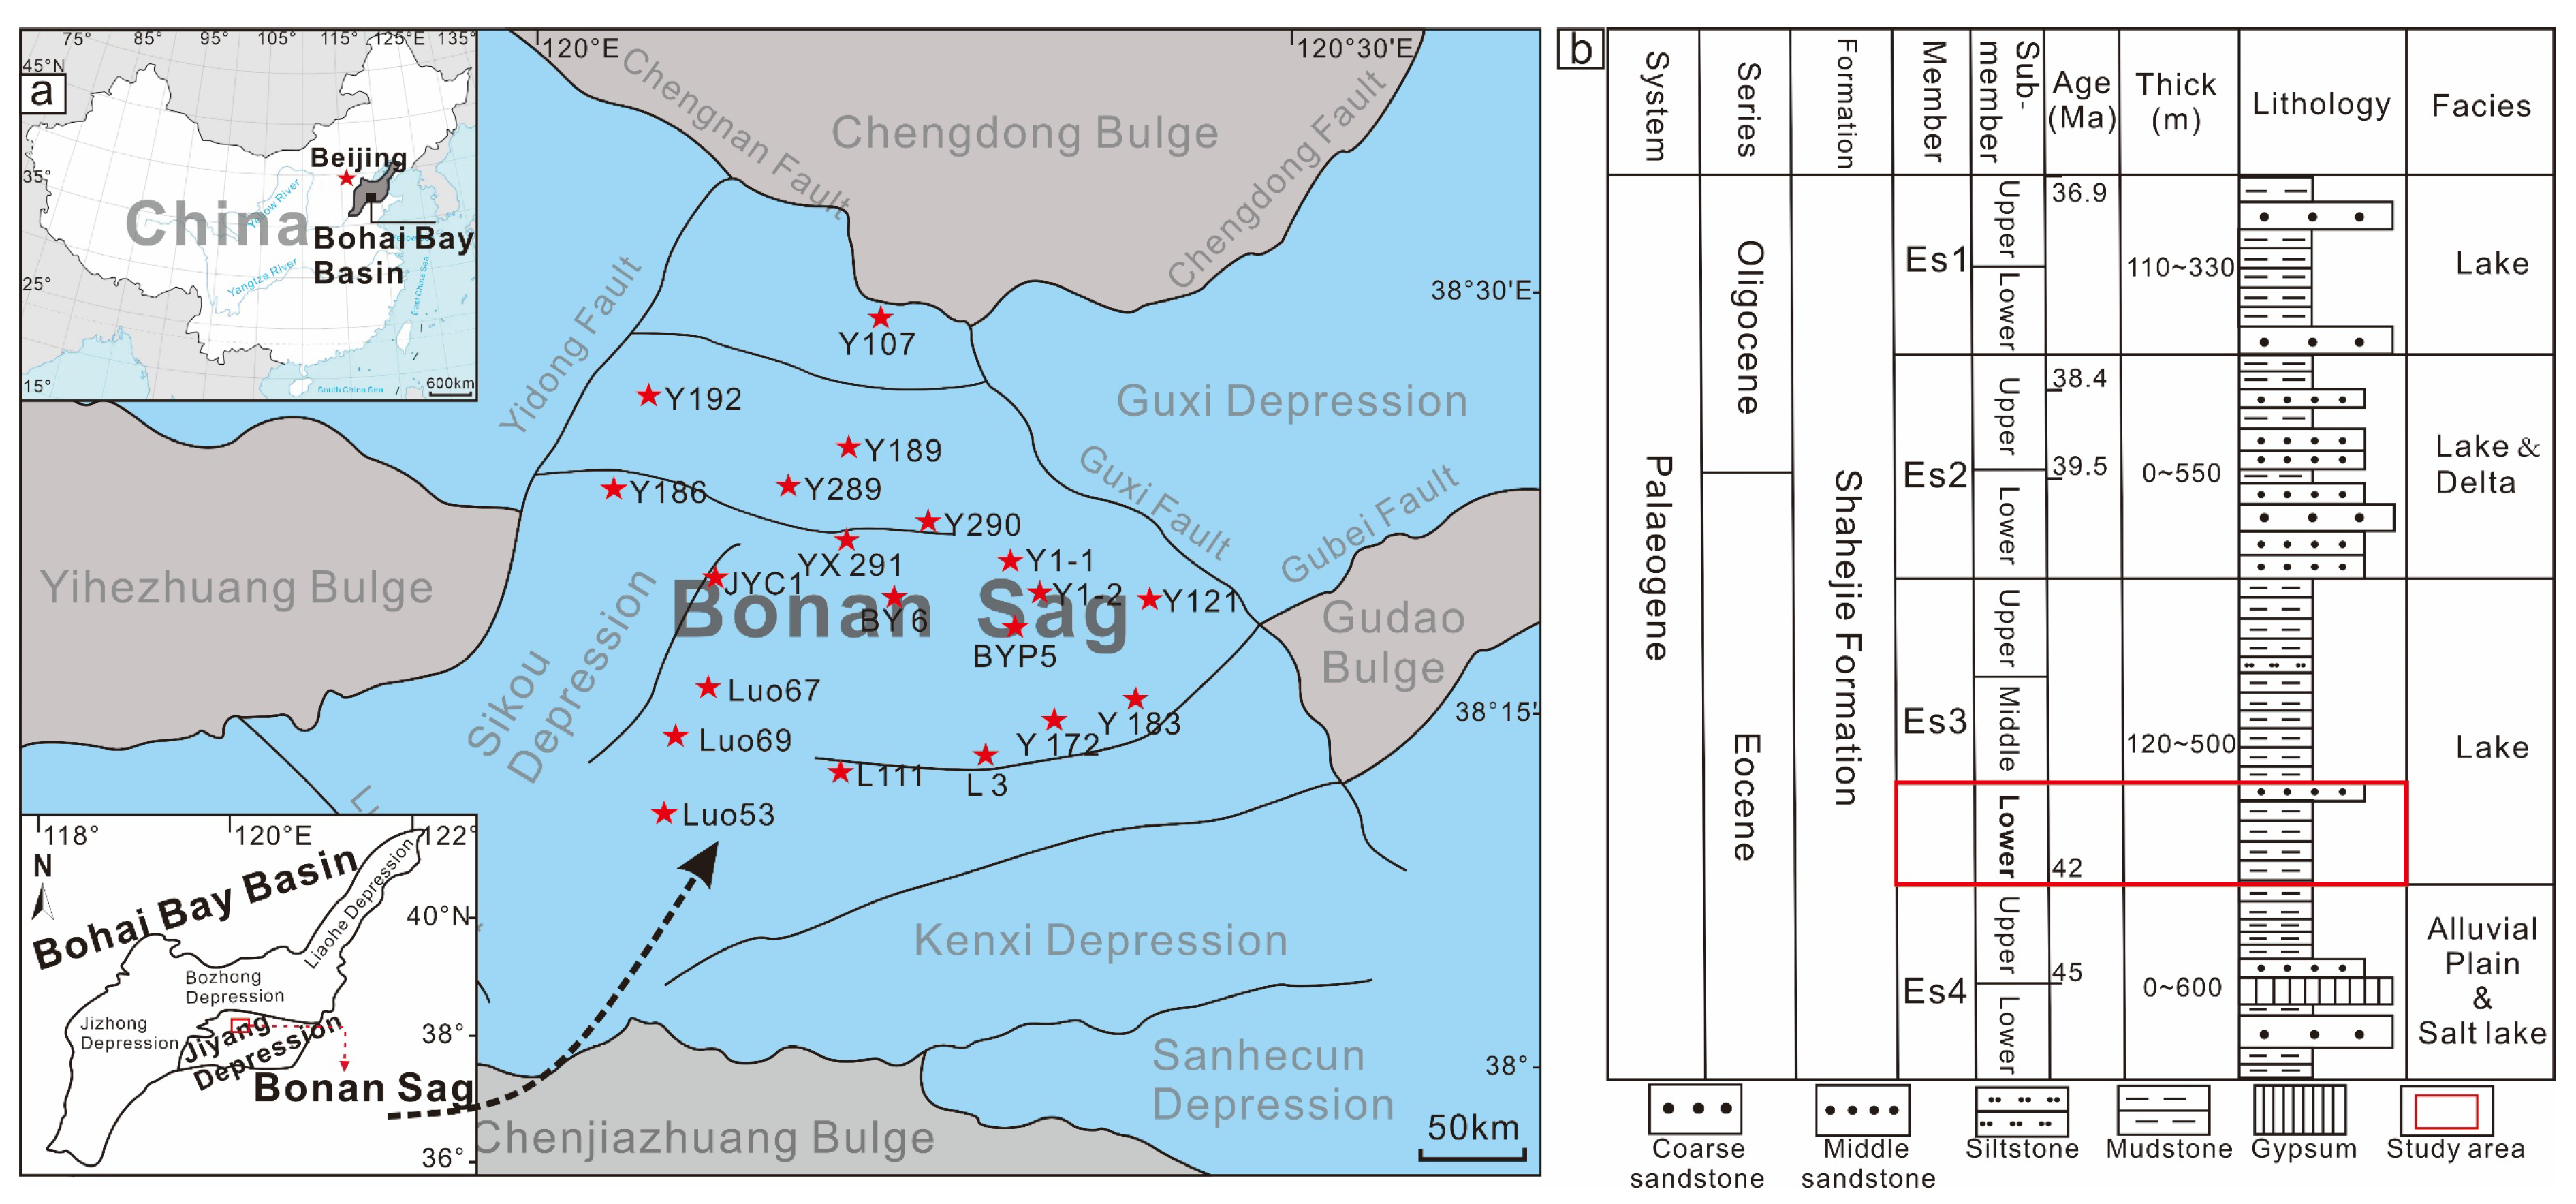
2. Regional Geological Overview

The Bonan Sag, situated in the northeastern part of the Jiyang Depression within the Bohai Bay Basin (Figure 1a), is a secondary tectonic unit of the Jiyang Depression, characterized by a structural pattern of “northern faulting and southern overthrusting, with steep slopes in the north and gentle slopes in the south”, covering an area of approximately 2800 km2 [30]. It is bounded by the Chengdong Bulge in the north, the Guxi Fault, the Gudao Bulge to the southeast, the Chenjiazhuang Bulge in the south, and the Yidong Fault in the west, adjacent to the Yihezhuang Bulge [31]. These surrounding uplifts constitute the primary source areas for the Bonan Sag, where the parent rocks are dominated by granite from the Archean–Proterozoic, carbonate rocks from the Lower Paleozoic, and clastic rocks from the Upper Paleozoic [32]. The third member of the Shahejie Formation in the Paleogene can be subdivided into the lower (Es3l), middle (Es3m), and upper (Es3u) sub-members (Figure 1b) [17]. During the deposition of the Es3l sub-member, the climate was humid, promoting a stable and persistent deep-to-semi-deep lake sedimentary environment. This led to the formation of approximately 200–400 m of thick, dark-grey mudstone interbedded with marl deposits. The target interval in the study area is the Es3l submember, comprising primarily endogenic marl and mixed-source mudstone deposits within the deep-to-semi-deep lake environment (Figure 1b).

3. Data and Methods

3.1. Data Selection

This study selected seven key wells in the steep slope zone and deep sag zone of the Bonan Sag in the Bohai Bay Basin for astronomical cycle analysis, including wells Luo 53, Luo 69, Luo 67, JYC-1, Y289, Y189, and Y107. The main analyzed intervals of these wells are the Es3l of the Shahejie Formation, with thicknesses ranging from 150 to 570 m. Natural Gamma Ray (abbreviated as GR) logging data can serve as a proxy indicator for paleoclimate analysis, with a sampling interval of 0.125 m, meeting the precision requirements for astronomical cycle analysis. The GR values range from 10 to 100 API, where low values correspond to marl, while high values are associated with mudrocks, exhibiting distinct cyclical patterns (Figure 2). For this study, wells dominated by lacustrine deep-water fine-grained sedimentary rocks in the Es3l sub-member in the Bonan Sag were selected for astronomical cycle analysis.
The software utilized for data analysis in this research is Acycle v2.2 [33], built on the MATLAB v2019a platform, where all data analyses were conducted. The data analysis procedures encompass Multi-Taper Method (MTM) spectral analysis, Evolutionary Harmonic Analysis based on Fast Fourier Transform (FFT), filtering analysis, and COCO/eCOCO correlation analysis.
Prior to these operations, data preprocessing is essential, which primarily involves: (1) extreme value removal to eliminate outliers from the dataset. (2) Interpolation, where linear interpolation is applied to the GR data to ensure a uniform sampling interval of 0.125 m. (3) Detrending, achieved through a 35% weighted moving average process [34] (Figure 2), to mitigate the influence of trends in the GR data.

3.2. Astronomical Cycle Solutions

Laskar et al. (2011) have refined and improved the initial computational conditions for the La2004 calculation parameters by adopting the new astronomical ephemeris [35], INPOP08 [36], resulting in the La2010 solution that offers a more precise depiction of the eccentricity variation over the past 250 million years (Ma). Notably, La2010 achieves remarkable accuracy in calculating Earth’s orbital parameters (eccentricity, obliquity, and precession) since 250 Ma, particularly within the last 50 Ma, thereby providing a theoretical foundation for astronomical cyclicity analysis. Building upon this, Liu et al. (2018) conducted an astronomical cyclicity analysis of the Shahejie Formation in the Bohai Bay Basin [37], establishing a high-resolution astronomical timescale spanning from 22 to 66 Ma. Within this framework, the age of the Es3l Submember in the Jiyang Depression was anchored at 40.2 to 42.47 Ma, a viewpoint that has been cited by several researchers to conduct related studies [25,26,27,28,29,30,31,32,33,34,35,36,37,38].
This study employs the La2010a astronomical solution [35] (Laskar et al., 2011) within the Acycle v2.4 software to calculate the summer insolation curves for the period 40.2 to 42.47 Ma [33], corresponding to the formation of the Es3l sub-member in the Jiyang Depression. The sampling interval is set at 1 ka.

4. Results

4.1. Cyclostratigraphic Analysis

4.1.1. Theoretical Astronomical Period

Spectral analysis of these insolation curves reveals theoretical values for eccentricity, obliquity, and precession cycles (Figure 3a). The dominant astronomical cycles identified in the Es3l sub-member of Bonan Sag (40.2–42.47 Ma) include 405 ka (long eccentricity, E), 125 ka and 100 ka (short eccentricity, e), 51 ka, 40 ka, and 38 ka (obliquity, O), and 23 ka, 22 ka, and 19 ka (precession, P). The ratio of these cycles, 405: 125-100: 51-38: 23-19, approximates 21.3: 5.1: 2: 1. By comparing this ratio with the peak ratios obtained from spectral analysis of GR data, we preliminarily assess whether astronomical cyclicity signals are recorded in the strata. A close correspondence between these ratios suggests the presence of astronomical cyclicity signals.

4.1.2. Deep-Domain Spectrum Analysis

Conducting an MTM spectral analysis on the preprocessed GR data series (Figure 3b–d) of the Es3l sub-member from selected wells (taking JYC1 as an example) within the Bonan Sag in the depth domain reveals intriguing insights. The results showcase 15 dominant frequency peaks exceeding the 95% confidence curve (Figure 3c), with all peaks validated by the AR1 confidence curve. In this spectral plot, the vertical axis represents energy intensity, while the horizontal axis denotes the frequency corresponding to the depth series. By inverting the frequency values (i.e., 1/frequency), we can derive the cyclic thicknesses associated with the spectral peaks: 38.9, 9.7, 3.7, 3.4, 1.96, and 1.66 m. The overall spectral structure exhibits four prominent frequency bands: 38.9 m, 9.7 m, 3.7–3.4 m, and 1.96–1.66 m. These bands are interpreted as representing the long eccentricity (E), short eccentricity (e), obliquity (O), and precession (P) of Earth’s orbit, respectively. The ratio of the spectral peak values within these four bands, taking the maximum within each band, is approximately 20.47:5.1:1.95:1. This closely aligns with the theoretical astronomical cycle ratio of 21.3:5.1:2.1:1. This analysis not only validates the presence of astronomical forcing in shaping the stratigraphic record but also underscores the significance of these orbital parameters in modulating sedimentary processes and patterns in the Bonan Sag.
To assess the stability of the overall data sequence and analyze the primary frequency characteristics varying with depth in the sedimentary record, an Evolutionary Harmonic Analysis (EHA) of the GR curve is necessary. This method performs Fourier transforms on moving depth segments with different windows, enabling the detection of stability in depth data and the analysis of variations in sedimentation rates across depths. After multiple iterations of tuning, the optimal parameter configuration for this EHA was determined as follows: a sliding window size of 46 m, a window step size of 0.351 m, and a maximum frequency of 1.0, yielding the Evolutionary Spectrum plot (Figure 3b). The peaks in the Evolutionary Spectrum plot align well with those in the MTM spectrum, indicating the preservation of eccentricity, obliquity, and precession signals across various depth segments. Three distinct depth intervals at 3382 m, 3478 m, and 3500 m in the Evolutionary Spectrum plot exhibit notable changes in spectral peak values, suggesting significant variations in sedimentation rates at these locations. The discontinuous peaks observed at 3382 m and 3478 m may be attributed to enhanced terrestrial input at these depths, leading to changes in sedimentation rates and consequently altering the spectral periodicity [39]. For operational convenience and technical feasibility, the JYC1 well was segmented into three intervals: 3289–3382 m, 3382–3478 m, and 3478–3600 m, based on the pronounced fluctuations at 3382 m and 3478 m. The labels E, e, O, and P within the white circles in Figure 3b represent long eccentricity, short eccentricity, obliquity, and precession, respectively. Due to the varying sedimentary environments across different stratigraphic horizons in the study area, separate spectral analyses were conducted on the GR sequences of the aforementioned three depth intervals to mitigate errors arising from differing sedimentation rates in different depositional settings (Figure 3d). In the first interval (3289–3382 m), the four dominant frequency peaks are 35.8, 8.46, 3.55, and 1.99 m, with a ratio close to 405:100:38:19. In the second interval (3382–3478 m), the peaks are 37.0, 8.74, 3.93, and 1.98 m, approximating a ratio of 405:100:40:19. Lastly, in the third interval (3478–3600 m), the peaks are 38.2, 10.52, 3.77, and 1.98 m, with a ratio similar to 405:125:40:19. These findings underscore the influence of varying sedimentary conditions on the spectral signatures and sedimentation rates within the study area.

4.1.3. Optimal Sedimentation Rate Estimation

The selected GR logging sequence is depth-based. Although periodicity in power has been detected above the 95% confidence curve, no estimation has been made regarding the temporal range represented by the depth cycles. Consequently, relying solely on the traditional “ratio method” for astronomical cycle identification yields relatively crude results, necessitating the adoption of additional methodologies to enhance the reliability of cycle recognition. The approach employed in this study involves utilizing Monte Carlo simulation-based COCO/eCOCO (Correlation Coefficient/evolutionary Correlation Coefficient) analysis to test for non-astronomical cycle signals [33]. This is complemented by a significance level test of the null hypothesis (H0) to validate the results [40]. The significance level in this test represents the probability of falsely rejecting the null hypothesis in the stratigraphic record [41], implying that a lower H0 value corresponds to a more reliable analysis outcome. For instance, a significance level of 0.001 indicates that 99.9% of the spectral components are detected, with only 0.1% of astronomical cycle signals being erroneously rejected, because the smaller the H0 in the test, the more reliable the results obtained from the analysis [33]. The sedimentation rate derived from such a rigorous null hypothesis testing is closest to the true sedimentation rate and is designated as the optimal sedimentation rate.
Based on previous estimates of the sedimentation rate for the Es3l sub-member in the Bonan Sag and the COCO parameter settings [38], the COCO calculation parameters used in this study were configured as follows: minimum frequency of 0, maximum frequency of 4, maximum sedimentation rate of 54 cm/ka, and 2000 Monte Carlo simulations. The COCO analysis yielded an average sedimentation rate of 8.39 cm/ka for the Es3l submember in Well JYC-1 (Figure 4a), both exceeding the 0.001 significance level (Figure 4b). Moreover, the confidence level for the involvement of all seven astronomical parameters was below 0.05% (Figure 4c), allowing us to reject the null hypothesis of no astronomical cycle signals.

4.1.4. Filtering and Tuning

Based on the outcomes of spectral analysis, sedimentary cycles representing astronomical orbital parameters were extracted through Gaussian bandpass filtering. Specifically, for the long eccentricity (E, 405 ka) cycle, the sedimentary cycle (38.9 m) was filtered at a frequency of (0.024 ± 0.008) cycles/m, revealing approximately six long eccentricity cycles recorded in the Es3l sub-member (Figure 5). For the short eccentricity (e, 100 ka) cycle, the sedimentary cycle (9.7 m) was filtered at a frequency of (0.110 ± 0.01) cycles/m, indicating the presence of roughly 26 short eccentricity cycles in the same Es3l sub-member (Figure 5). The obliquity (O, 40 ka) cycle, with a sedimentary cycle of 3.7 m, was filtered at a frequency of (0.25 ± 0.01) cycles/m, revealing approximately 56 obliquity cycles in the Es3l sub-member (Figure 5). Lastly, the precession (P, 22 ka) cycle, manifested as a sedimentary cycle of 1.96 m, was filtered at a frequency of (0.48 ± 0.04) cycles/m, demonstrating the recording of approximately 105 precession cycles within the Es3l sub-member (Figure 5).

4.2. Astronomical Cycle Stratigraphic Division

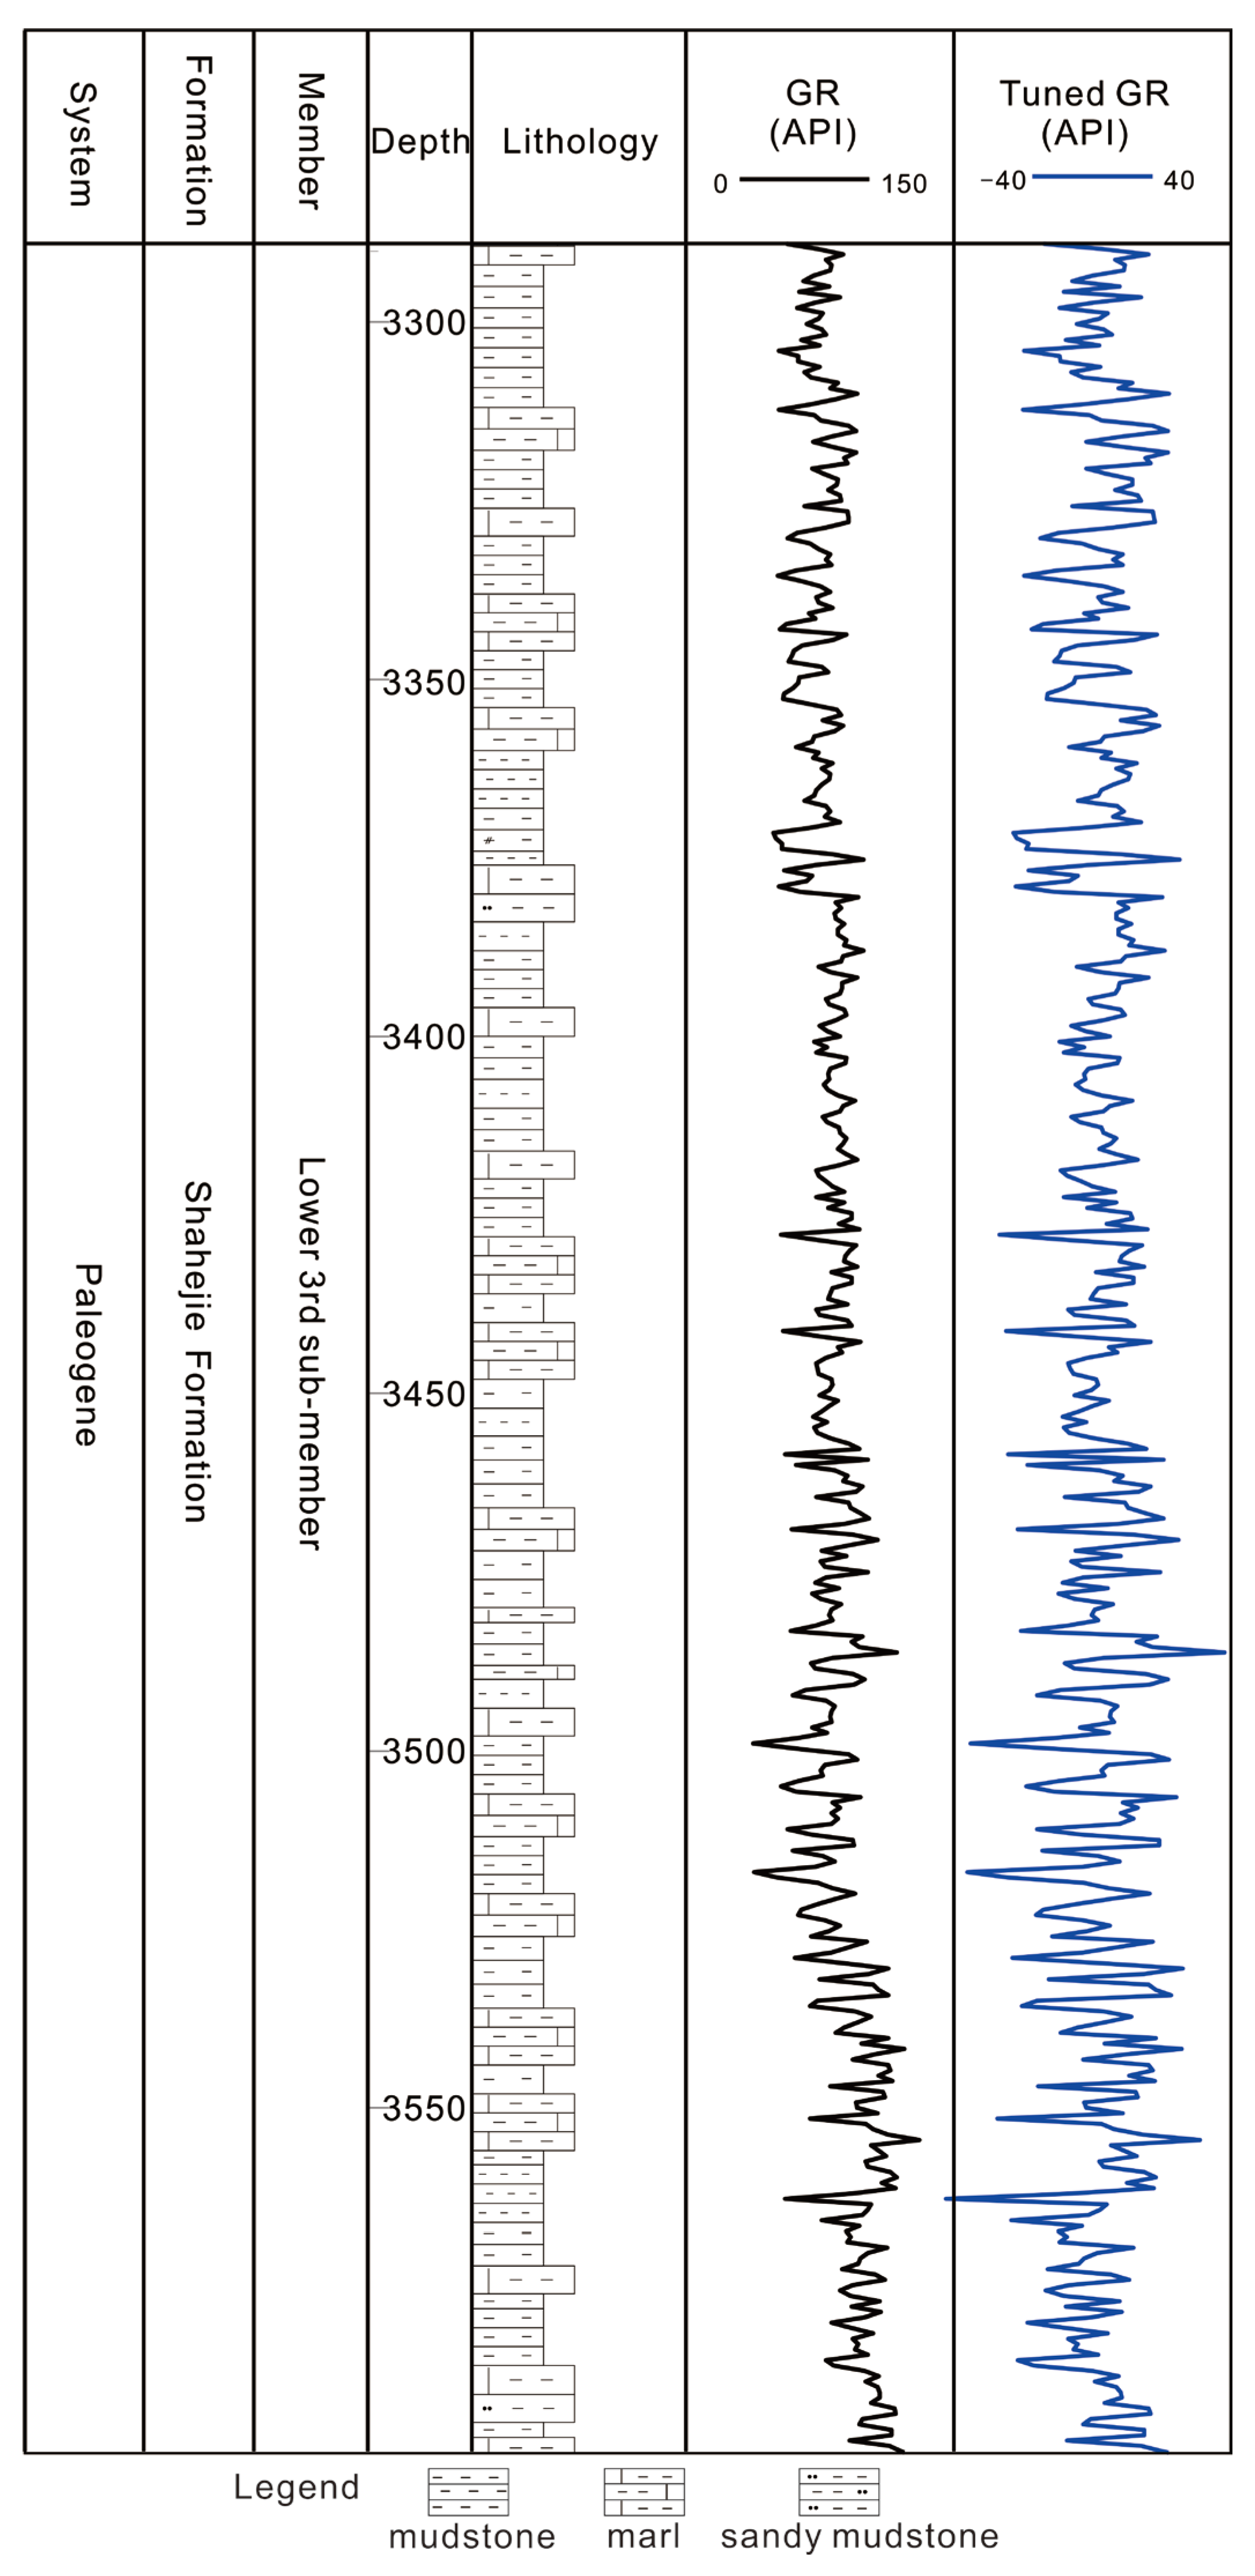
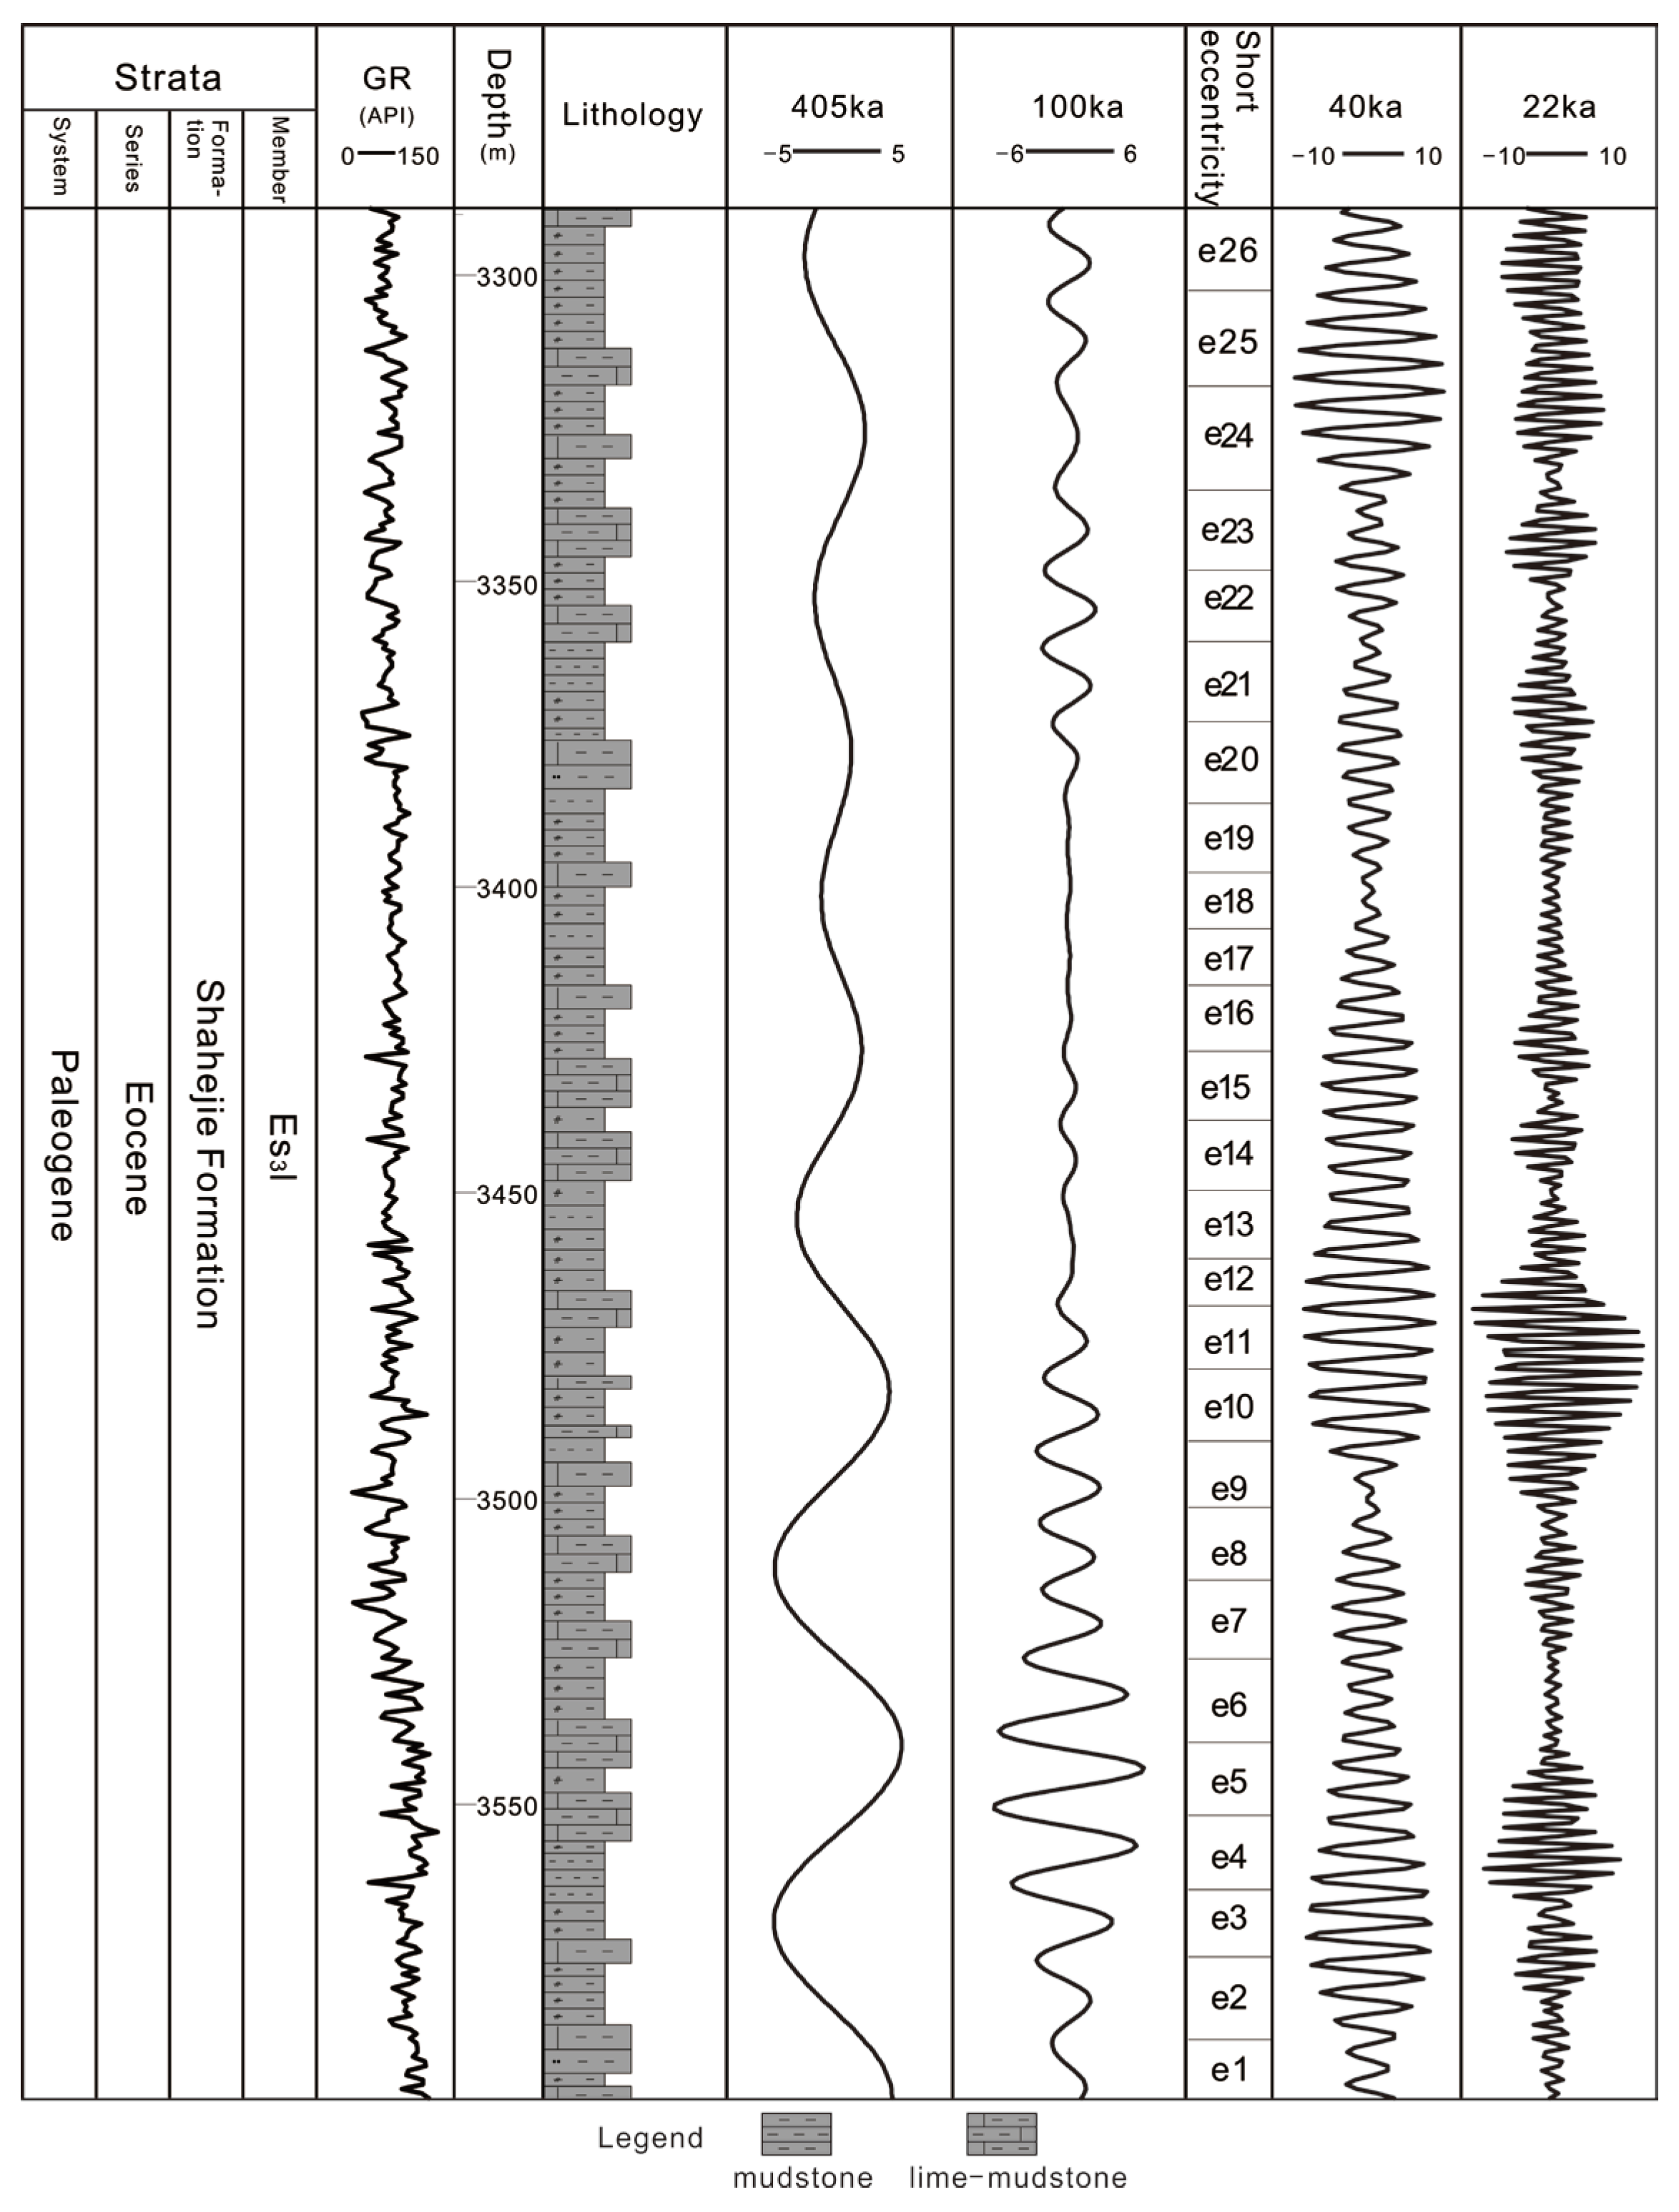
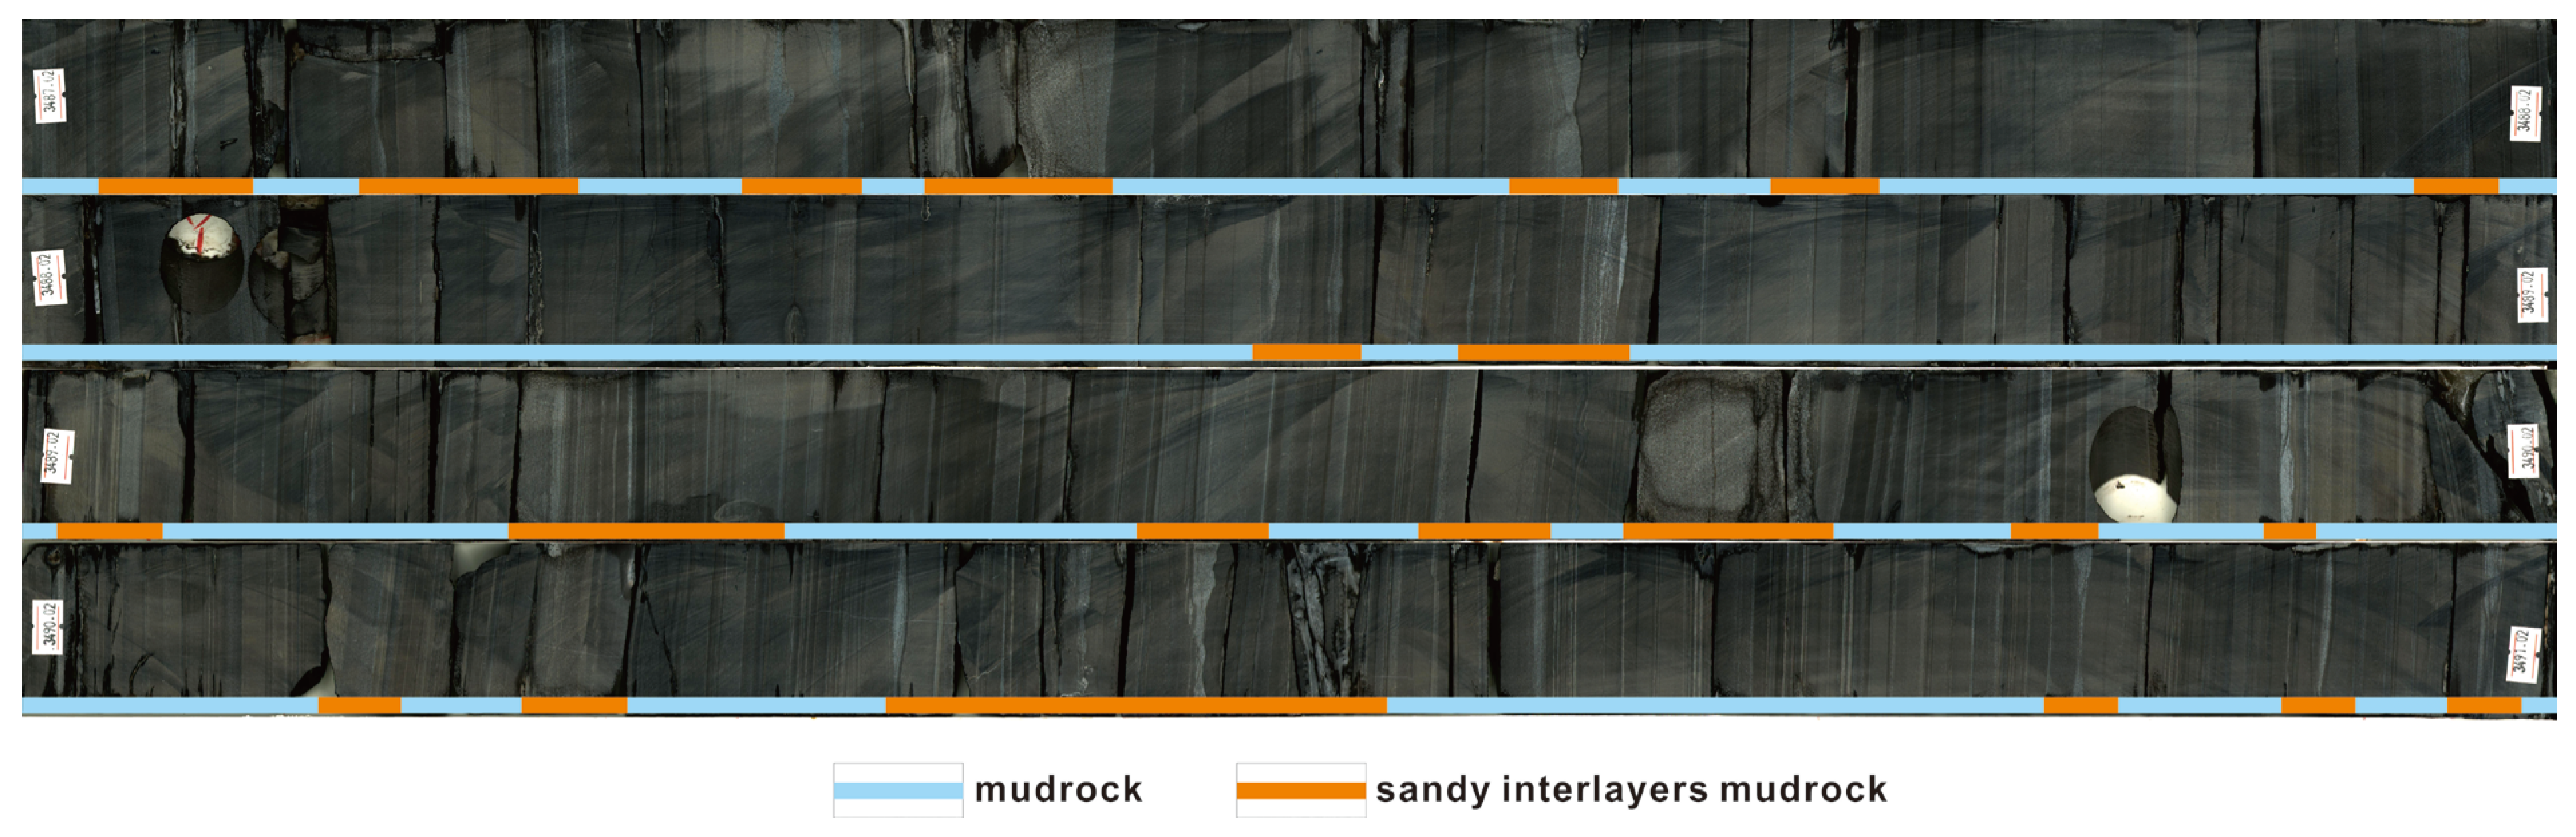
4.2.1. GR Curve and Lithological Characteristics

The GR data of the selected key wells in the Bonan Sag, such as Luo53, Luo69, Luo 67, JYC-1, Y289, Y189, and Y107 in the Es3l submember, display significant cyclical characteristics. The GR values range from 5 to 150 API, with low values (<40 API) corresponding to lime–mudstone or sandy interbeds, and high values (>60 API) associated with mudstone. There are notable differences in the average GR values across the wells: the average GR value for JYC-1 is 52.3 API (standard deviation ±18.5); for Luo 53, it is 48.7 API (±16.8); and for Y107, due to its proximity to the source area, the average GR value is higher (63.2 API, ±21.3), reflecting spatial differentiation in the sedimentary environment (Figure 6).
In terms of lithology, the Es3l submember of the JYC–1 well is mainly composed of dark-grey mudstone in deep-lake facies, interspersed with thin layers of lime–mudstone (single-layer thickness 0.5–3 m), with occasional sandy mudstone (Figure 5). The mudstone layers have a low GR value (30–45 API), reflecting endogenous carbonate deposition, while the mudstone corresponds to higher GR values (60–80 API). The lower part of the Luo53 well is primarily interbedded mud lime–mudstone and mudstone, with the upper part transitioning into mudstone interbedded with thin layers of limestone, showing a stepped increase in the GR curve. The Luo 69 well exhibits relatively uniform lithology, mainly rhythmic layers of mudstone and mud limestone, with the GR curve showing significant periodic fluctuations (±15 API), indicating a stable endogenous sedimentary environment. Additionally, in the Y189 well, located at the edge of the lake basin slope, the Es3l submember has multiple sets of sandstone interbeds (single-layer thickness 0.1–0.3 m), which correspond to a sharp drop in GR values (<40 API), reflecting the periodic transport of terrigenous clastic material (Figure 6).

4.2.2. Single Well Astronomical Cycle Stratigraphic Division

The periodic variations in Earth’s and Sun’s orbits allow for fluctuations in the insolation, thereby influencing climate change. Considering the sedimentary environmental implications of GR data indices [29], we utilize the astronomical cycle curves as a datum plane, serving as interfaces for high-resolution stratigraphic subdivision. The filtered astronomical cycle curves from selected single wells are employed for this purpose.
In the stratigraphic subdivision based on astronomical cycles within single wells, the Well L53 Es3l sub-member comprises six long eccentricity cycles and 25 short eccentricity cycles. Similarly, the Well L69 Es3l sub-member contains six long eccentricity cycles, 25 short eccentricity cycles, 56 obliquity cycles, and 104 precession cycles (Figure 6). Wells L67, JYC1, Y289, Y189, and Y107 each also exhibit six long eccentricity cycles and approximately 25 short eccentricity cycles in their respective Es3l sub-member. This stratigraphic subdivision reveals a relatively stable stratigraphic development across the region, characterized by the consistent presence of roughly six long eccentricity cycles and approximately 25 short eccentricity cycles. Drawing upon the results of astronomical cycle analysis from single wells, we employ the short eccentricity curve as the benchmark for well-to-well stratigraphic correlation, thereby establishing a high-resolution stratigraphic framework for deep-water areas. This framework, based on short eccentricity curves, facilitates detailed stratigraphic subdivision, essential for exploration and development. Additionally, it enables the prediction of lithofacies, as horizontal well fracturing often involves intervals spanning tens of meters. By leveraging the high-resolution stratigraphic framework, fracturing can be targeted within specific sub-cycles, while the extensive horizontal radius of the fracturing (reaching kilometers) necessitates rapid lateral lithofacies changes, which can be anticipated and constrained through the stratigraphic framework.

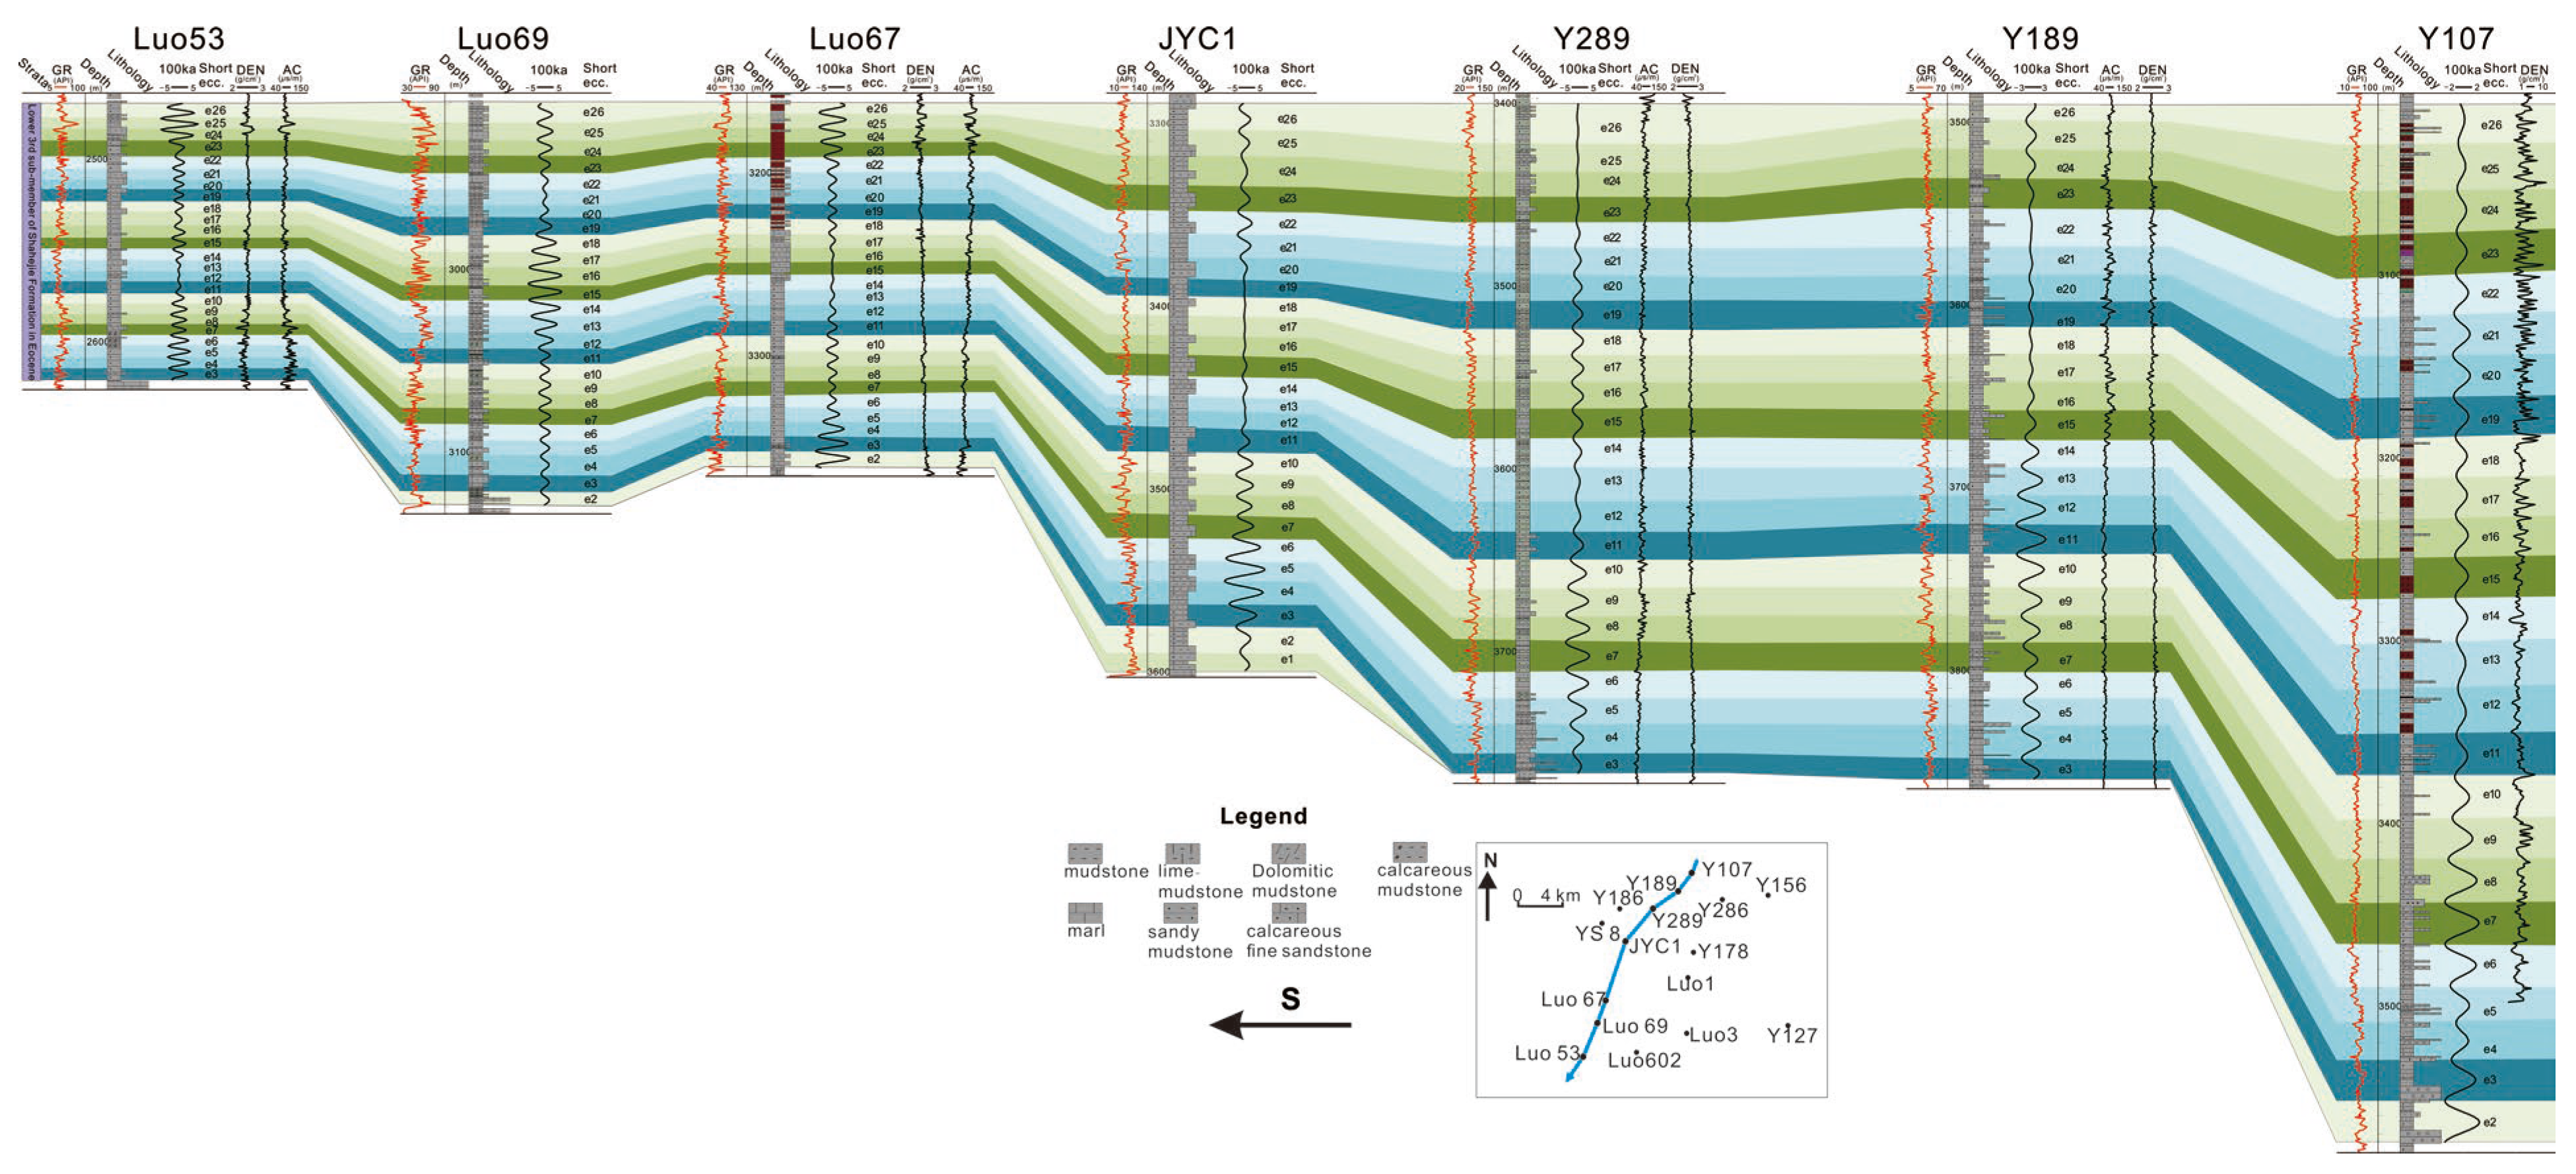
4.2.3. Stratigraphic Correlation of Connected Wells

By conducting high-precision stratigraphic subdivision based on astronomical cycles from single wells, we anchored the boundaries of the top and bottom of the Es3l sub-member in the Bonan Sag using magnetic stratigraphic ages as reference points [37]. Within this sub-member, the short eccentricity cycles were employed as stratigraphic correlation interfaces. The comparison revealed that the l Es3l sub-member in the Bonna Sag comprises approximately six long eccentricity cycles, numbered sequentially from the base to the top as the 1–6 long eccentricity cycles. Additionally, the number of short eccentricity cycles within this submember remains stable at 25 (Figure 6).
In the well-tie sections (Figure 6), Wells Luo53 Es3l sub-member displays marl and lime–mudstone predominantly in long eccentricity cycles 1–2, indicative of endogenic sedimentation in shallow water environments (dominated by autochthonous algae and carbonate deposition in lake basins) [17]. In contrast, long eccentricity cycles 3–6 are characterized by dark-gray mudstones with intermittent limestone intervals. Well Luo69 exhibits a well-correlated succession of mudstones and marl throughout the Es3l sub-member, dominated by endogenic sedimentation. Well Luo67, the lower half of the Es3l sub-member, comprises mainly mudstones in long eccentricity cycles 1–3, with limited marl development, suggesting mixed-source deposition (a blend of autochthonous and allochthonous components). However, the upper half features abundant marl, particularly in long eccentricity cycle 4, while cycles 5 and 6 alternate between mudstones, likely resulting from mixed-source depositional events [42]. Well JYC1 exhibits a regular succession of mudstones and marl, with a brief interval of sandy mudstone in long eccentricity cycle 5. Well Y289, the lowermost part, long eccentricity cycle 1, is dominated by marl and some dolomite, while cycles 2–6 are dominated by mudstones with scattered marl intervals. The Well Y189 Es3l sub-member primarily comprises mudstones and marl, interspersed with sandstone and siltstone within each long eccentricity cycle, possibly due to its location on the slope margin of the lake basin [7]. Well Y107, being proximal to a provenance area, displays conglomerate at the base and mudstones and shales in the mid-to-upper sections.
There exists an indirect control relationship between long eccentricity and various sedimentary processes (whereby long eccentricity governs precession, which in turn influences the intensity of terrestrial input and ultimately controls lithofacies development). Therefore, by analyzing the lithofacies types within the corresponding sub-intervals of each cycle, we can further leverage the stratigraphic framework to predict lithofacies types.

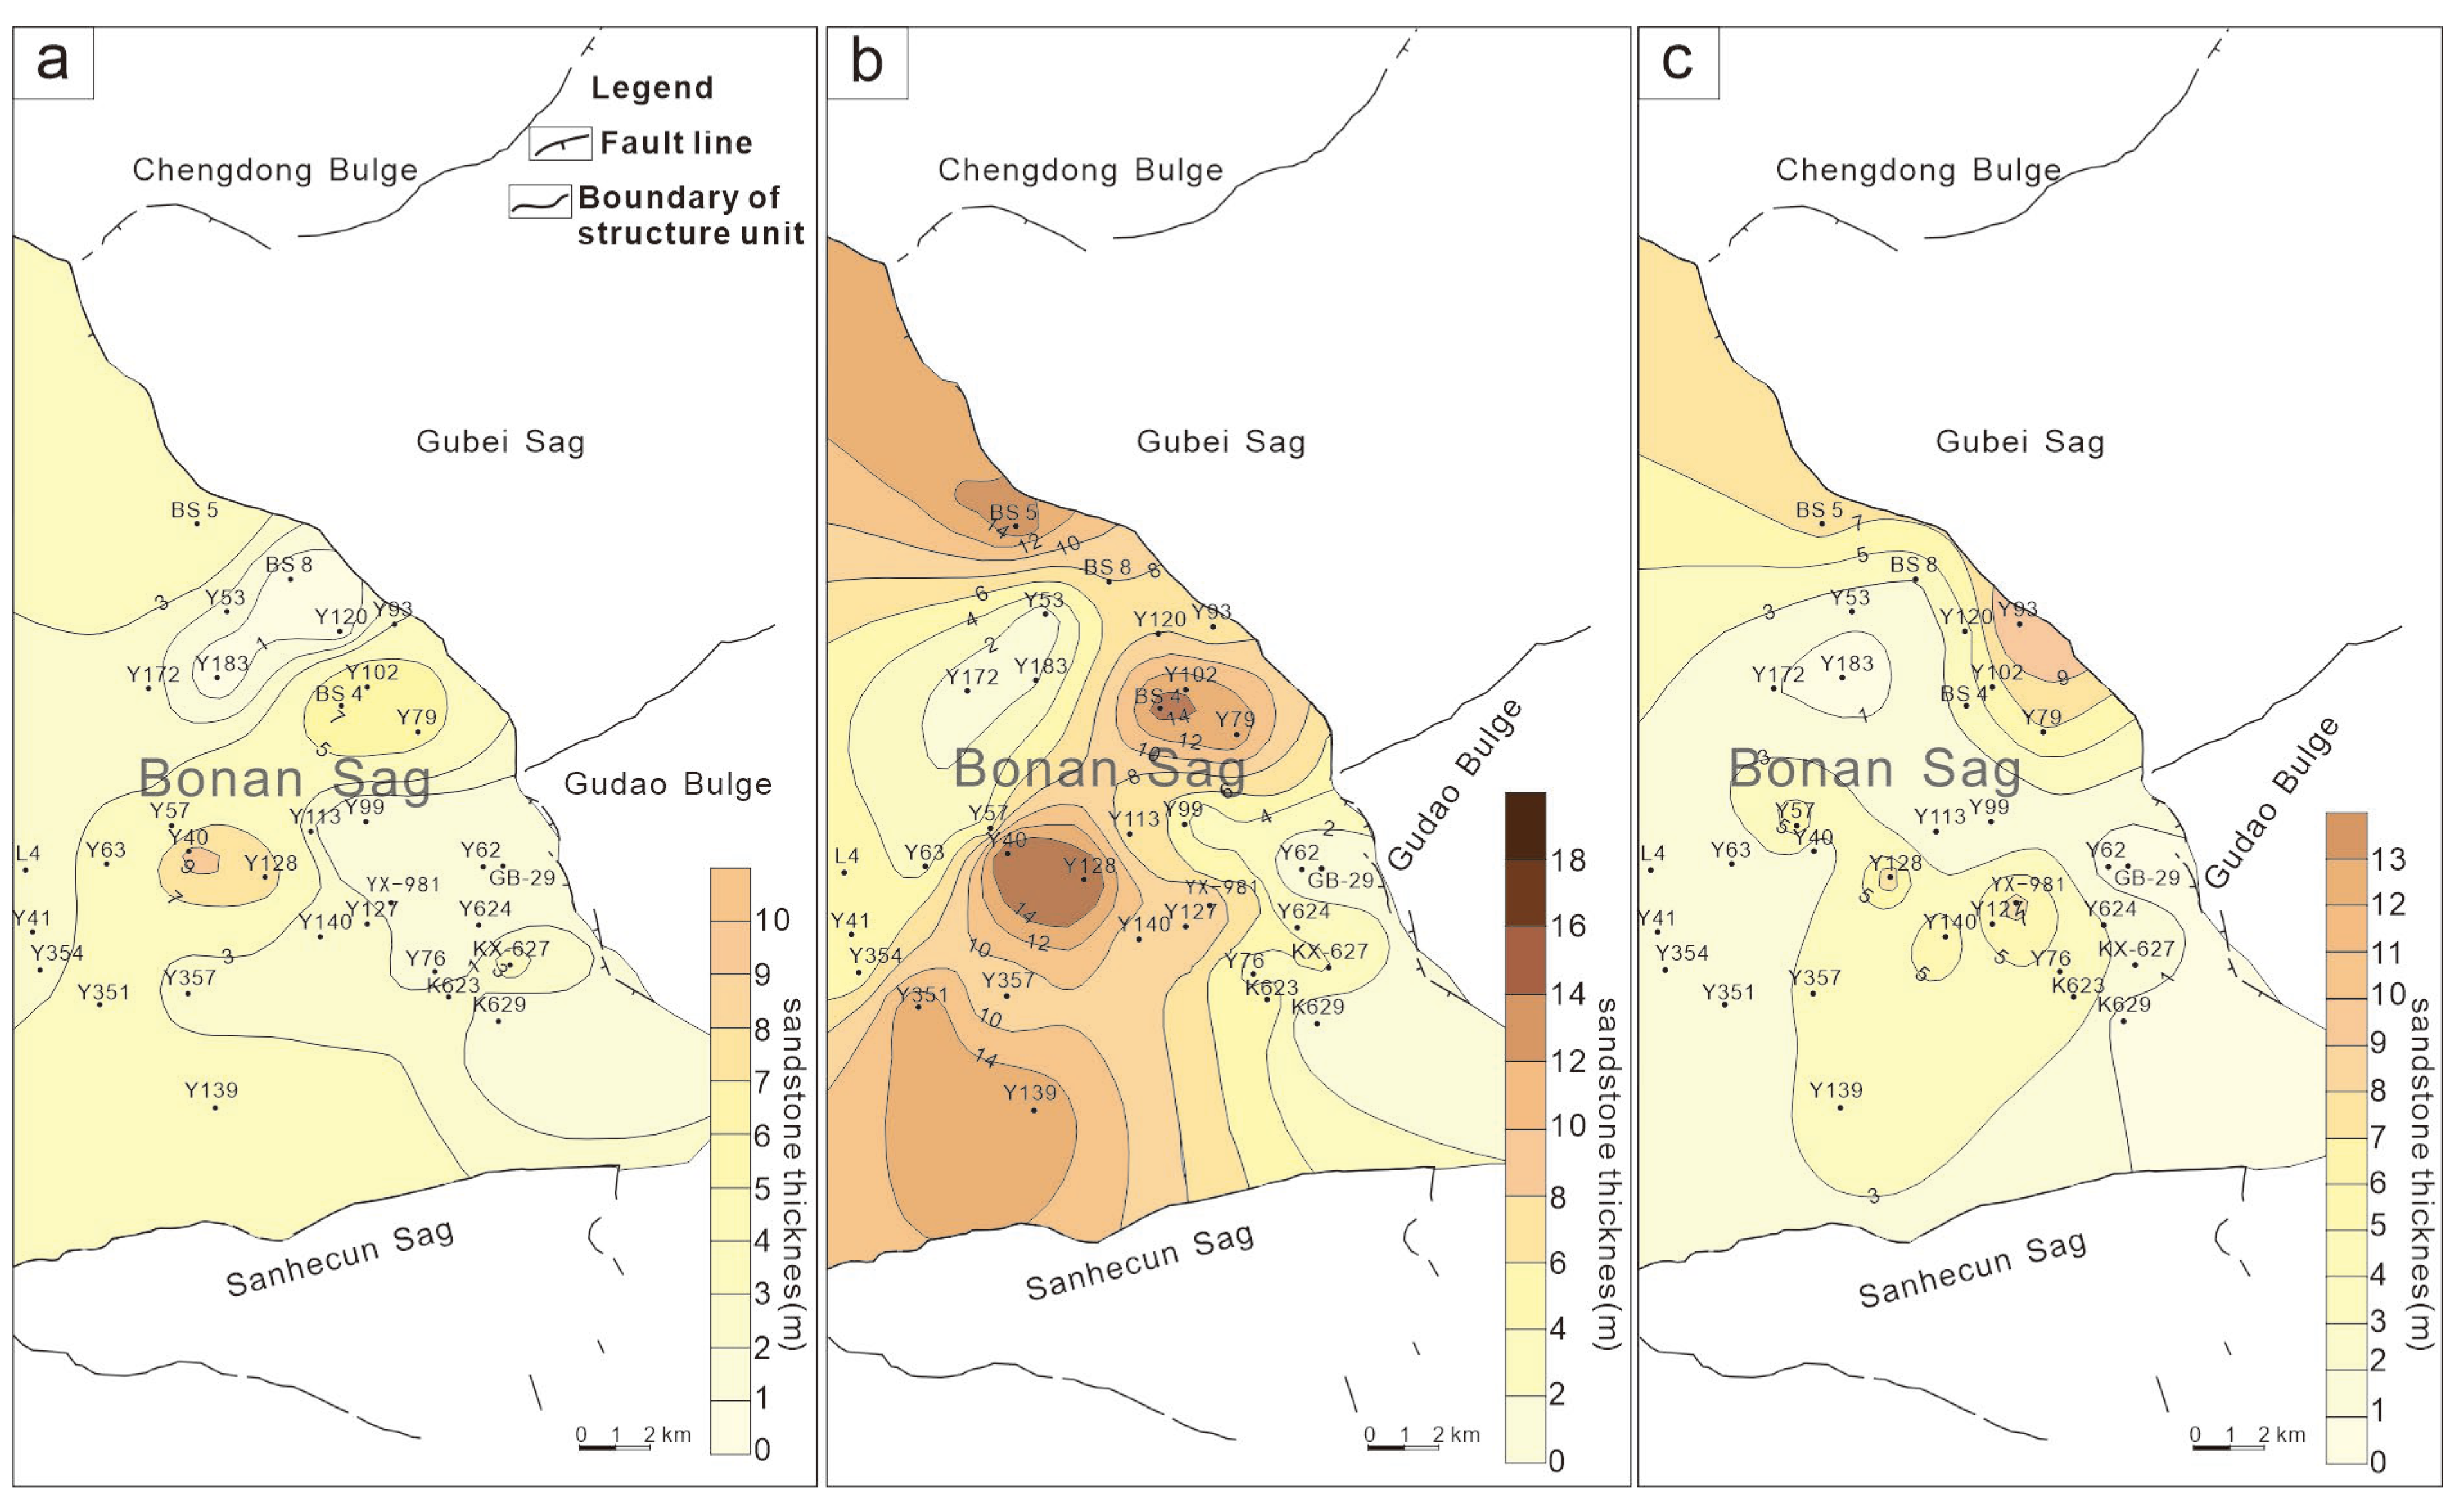
4.2.4. Depositional Evolution of Sandstone Interbedded Mudrock Reservoirs

Sandy interlayer shale oil represents a significantly important type of shale oil. Its reservoirs are characterized by the development of numerous centimeter- to decimeter-scale thin sandstone layers (Figure 7), which exert a crucial influence on the quality of the “sweet spots”. However, vertical lithological distributions and evolutionary features are often indistinguishable in seismic and well logging data. Due to the abundance of sandy interlayer shale reservoirs within the study area, the precise prediction of these thin sandstone layers is imperative to enhance exploration efficiency for this type of shale oil. Therefore, achieving integrated prediction of sandstone and shale quality within interlayered shale oil reservoirs, as well as exploring the depositional and evolutionary patterns of thin sandstone interlayers, holds great significance for the exploration and development of this type of shale oil.
The sandstone thicknesses within the three 100 ka cycles (Cycle A, Cycle B, and Cycle C) contained within a single 405 ka cycle in the Es3l of Bonan Sag were individually measured and statistically analyzed. Using well coordinates, points were plotted on a plan view, and contour maps were created to represent the sandstone thickness within each 100 ka cycle (Figure 8). The contour maps revealed that Cycle A had a maximum total thickness of centimeter-to-decimeter-scale sandstone of 8 m, with a common range of 1 to 3 m (Figure 8a). Cycle B showed a maximum total thickness of 18 m, commonly distributed between 8 and 18 m (Figure 8b). For Cycle C, the maximum total thickness was 10 m, with a common range of 1 to 4 m (Figure 8c). Cycle B corresponds to the maximum phase of the 405 ka long eccentricity cycle, while both Cycle B and Cycle C correspond to the minimum phase of the same 405 ka cycle (Figure 9). It is evident that more centimeter-to-decimeter-scale sandstone developed during the maximum phase of the 405 ka long eccentricity cycle, while it was less developed during the minimum phase.
Within the 405 ka long eccentricity cycle, the short eccentricity cycle with a period of 100 ka and the precession cycle with a period of 22 ka jointly regulate the deposition frequency and thickness of sandstone, as well as the mineral content and organic carbon content variations in mudrock. Specifically, during the high-value phase of the 100 ka short eccentricity cycle, sandstone layers develop frequently and accumulate to a significant thickness, while the felsic mineral content in mudrock is high, and the organic carbon content is low. The 22 ka precession cycle further controls the intricate changes within the depositional internal structure of sandstone-bearing shale. During its low-value phase, the development frequency of sandstone layers is high, with greater thickness, and the felsic mineral content in sandstone-bearing shale is high, while the organic carbon content is low (Figure 9, Table 1).

5. Discussion

5.1. Analysis of the Depositional Evolution of Sandstone-Interbedded Mudrock Driven by Astronomical Force

By conducting stratigraphic correlation across wells based on astronomical cycles, it was found that the development of sandstone-interbedded mudrock and its thin sandstone interlayers is driven by astronomical cycles, and the development law of sandstone-interbedded mudrock was identified. The process of deposition constrained by astronomical cycles influences climate change by altering the amount of solar radiation received at the Earth’s surface through changes in orbital parameters, which in turn drives deposition [43]. During periods of high value eccentricity, the Earth’s orbit approaches an ellipse, resulting in increased solar radiation [44]. Under the influence of the southeast monsoon climate in the Northern Hemisphere, the climate becomes hot and humid with increased rainfall, and the lake basin expands, enhancing the terrigenous input received by the lake basin. Conversely, during periods of low value eccentricity, the Earth’s orbit approaches a circle, leading to decreased solar radiation [44]. During these cold and arid times, rainfall decreases, lake levels fall, and the lake basin shrinks, weakening the terrigenous input received by the lake basin. Additionally, variations in the amplitude of precession also affect the strength of terrigenous input, with weakening or enhancement of terrigenous input received by the lake basin at both the maximum and minimum values of precession.
During the variation of the precession’s amplitude, when the Northern Hemisphere is at perihelion, it experiences a short and hot summer followed by a long and cold winter at aphelion, indicating enhanced seasonality, whereas at aphelion, it experiences a long and hot summer followed by a short and warm winter, indicating weakened seasonality [14,45]. At the maximum value of the precession curve, the Northern Hemisphere experiences maximum sunshine during summer and minimum sunshine during winter, meaning that the winter solstice occurs at aphelion, while the summer solstice occurs at perihelion, resulting in a brief warm summer and a long, cold winter, during which the lake basin is in a period of contraction, and the deep-water areas of the lake basin receive less terrigenous input (Figure 10a,c). At the minimum value of the precession curve, the precession parameters are opposite to those at the maximum value, meaning that the Northern Hemisphere experiences a long, hot summer followed by a short, warm winter at aphelion (orbital schematic in Figure 10b,d). During this time, the lake basin is in a period of lake level expansion, with enhanced terrigenous input and more sandstone development.
Eccentricity itself cannot directly influence sedimentary evolution. Rather, it requires the combined action of eccentricity and precession to alter the distribution of solar energy [15]. At high eccentricity values, the Earth’s orbital path approaches an ellipse, resulting in increased solar radiation (Figure 10a,b), whereas at low eccentricity values, the Earth’s orbital path approaches a circle, leading to decreased solar radiation (Figure 10c,d) [44]. Eccentricity influences climate change by modulating the amplitude of precession [46,47], specifically by affecting the amplitude of precession variations [37]. This changes the amount of solar radiation received at the Earth’s surface, thereby influencing climate change and terrigenous input and, ultimately, constraining lake basin sedimentary evolution. Therefore, within the 100 ka short eccentricity cycle, sandstone layers in sandstone-interbedded mudrock are thicker during high eccentricity periods and thinner during low eccentricity periods. Moreover, the 100 ka short eccentricity cycle modulates the amplitude of precession, leading to an enhanced climatic constraint on the 100 ka cycle during low precession values, resulting in the thickest sandstone layers in sandstone-interbedded mudrock (Figure 10a). Conversely, during high precession values, the climatic constraint on the 100 ka cycle is weakened, resulting in thinner sandstone layers in sandstone-interbedded shale (Figure 10b).

5.2. The Petroleum Geological Significance of Astronomical Cycle Analysis

The deposition of fine-grained sedimentary rocks is characterized by continuity, which often leads to inconspicuous responses in well logging and seismic data, as well as subtle lithofacies variations. This limitation poses challenges to the application of sequence stratigraphy in the stratigraphic subdivision of fine-grained sedimentary rocks [9], thereby restricting the exploration potential for shale oil in the Es3l sub-member in the Bonan Sag. Nevertheless, fine-grained sedimentary rocks serve as an ideal medium for astronomical cycle analysis, as the periodic variations in Earth’s orbital parameters govern the deposition of lacustrine fine-grained sedimentary rocks. Hence, the temporal significance inherent in astronomical cycle theory can be harnessed for high-precision stratigraphic subdivision and correlation.
Through stratigraphic correlation of connected wells, a more detailed and intuitive understanding of the lithofacies development patterns and spatial distribution relationships within each sub-interval can be achieved. For instance, Zhang et al. (2022) have applied astronomical cycles to perform stratigraphic correlation of connected wells in fine-grained sedimentary rocks of the Dongying Depression, revealing a lithofacies development pattern where the coupling of mudstone–marl is constrained by the precession half cycle under astronomical cycle constraints [17]. This approach also facilitated predictions of lithofacies types in the central part of the lake basin. For the Bonan Sag, the next step involves utilizing astronomical cycle theory to investigate lithofacies development patterns and spatial configuration relationships. Based on the stratigraphic framework established by astronomical cycle curves, and leveraging the temporal characteristics of astronomical cycles [9] and the climate-controlling properties of Earth’s orbital periods [18], we aim to genetically interpret and predict lithofacies types. Ultimately, this will enable the prediction of geological “sweet spots” for shale oil and gas in the Bonan Sag, thereby providing valuable insights for the precise exploration of shale oil and gas resources in this region.

6. Conclusions

(1)
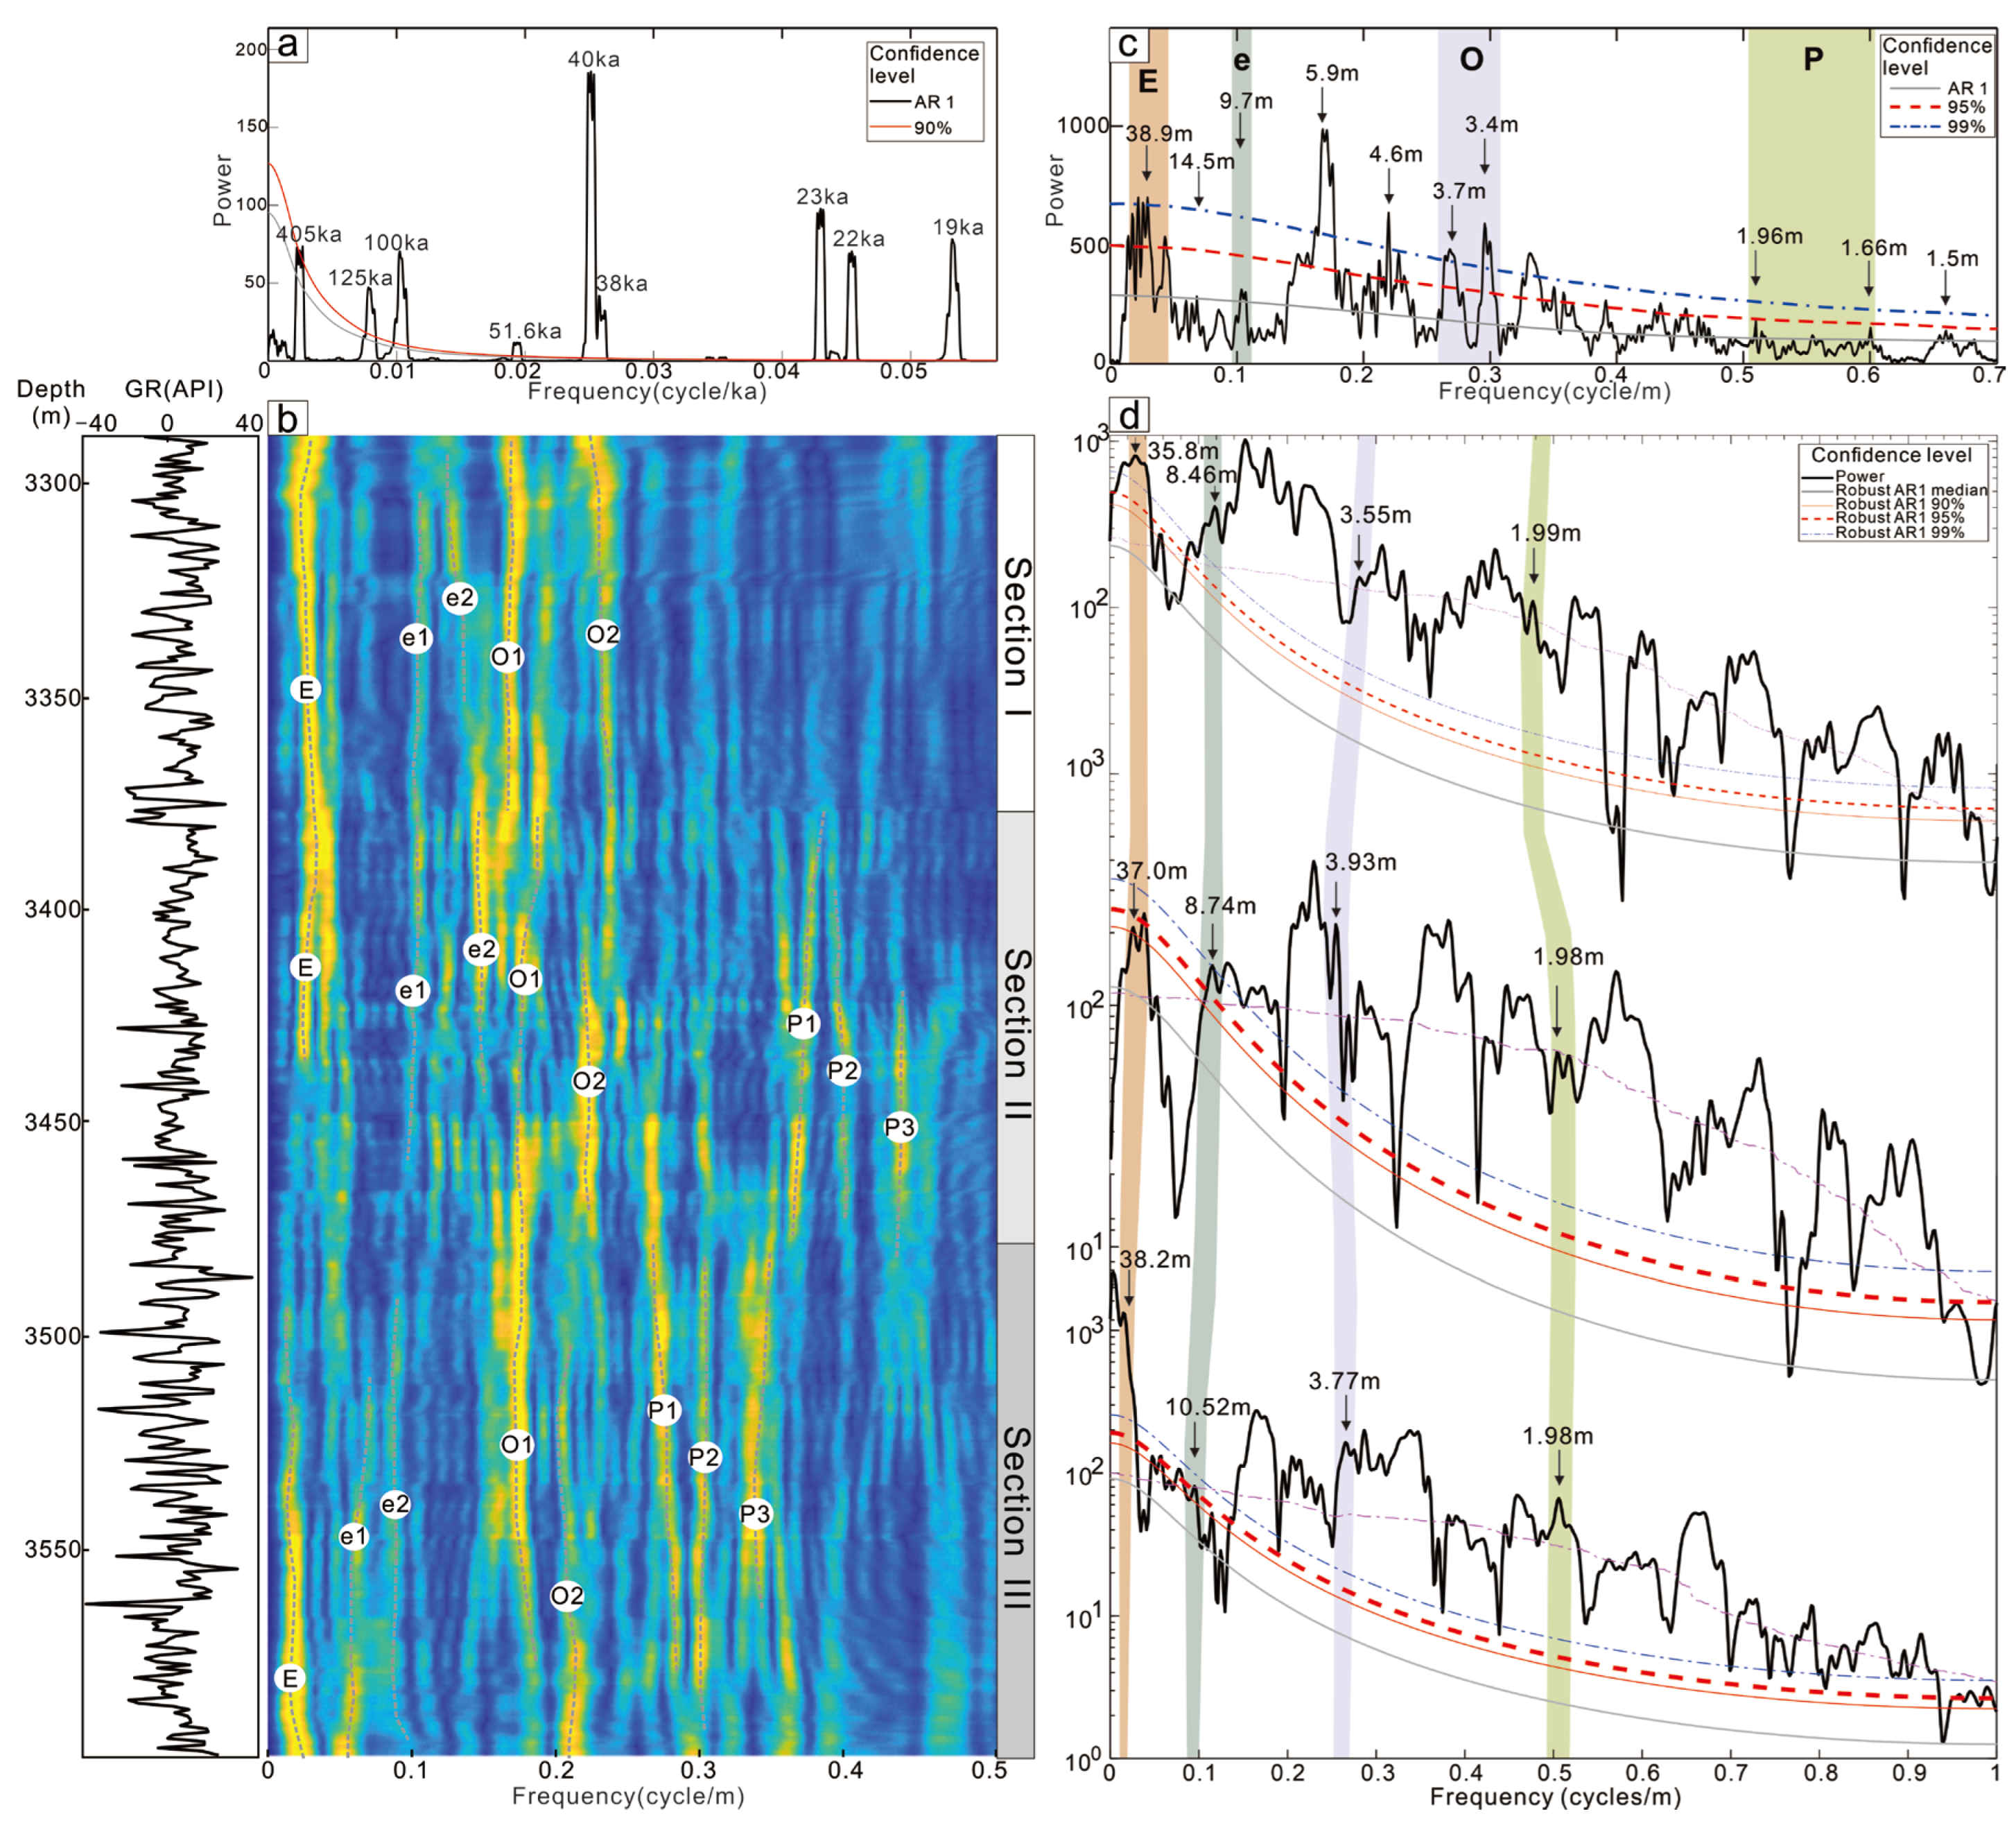
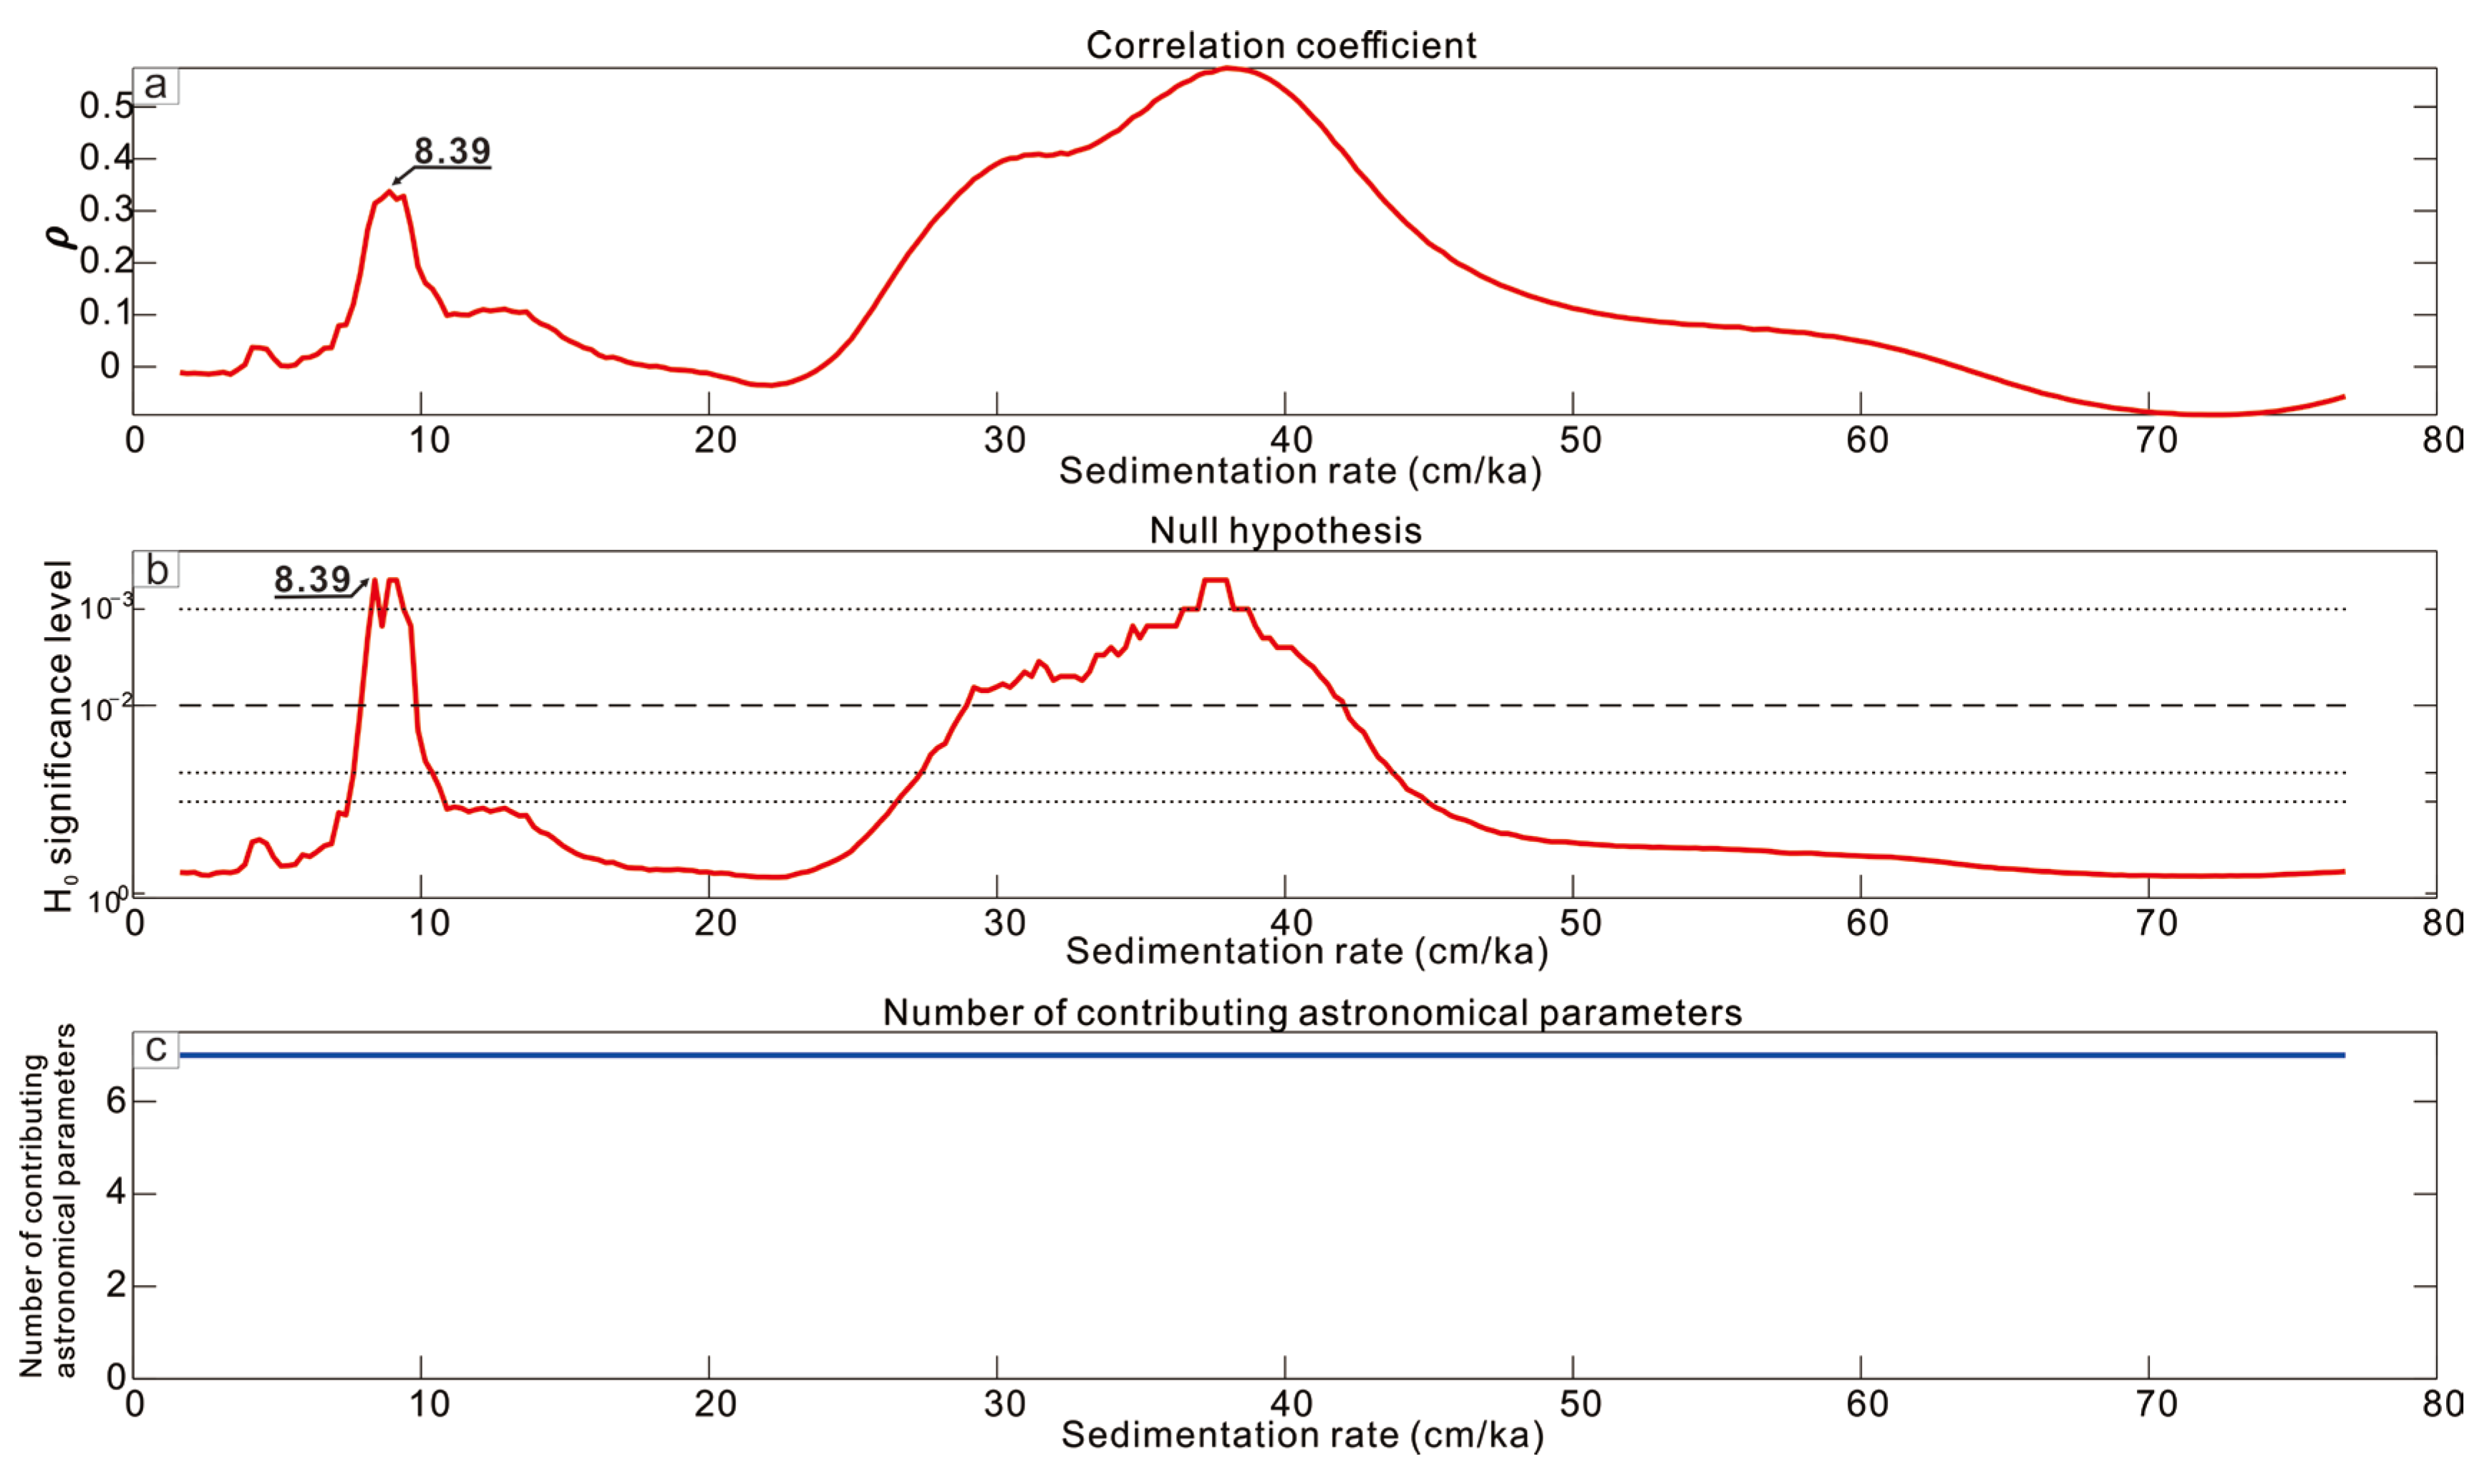
The sedimentary cycle periods and optimal sedimentation rates were obtained. Utilizing GR as a proxy, spectral analysis has illuminated the intricate sedimentary cycles within the Es3l sub-member in the Bonan Sag. These cycles encompass periods of 405, 100, 51, 40, 22, and 19 ka. Notably, the stratigraphic thickness modulated by the 405 ka long eccentricity reaches approximately 38.9 m, whereas the 97 ka short eccentricity governs a thickness of roughly 9.7 m. The 51 ka and 40 ka obliquity constrain the thickness to a range of 3.7 to 3.4 m, and the 22 ka and 19 ka precessions further limit it to 1.96 to 1.66 m. Through the application of the “COCO” (Correlation Coefficient) method, the optimal deposition rate for the Es3l sub-member has been calculated to be 8.39 cm/ka. Leveraging magnetic stratigraphic data, we have anchored the ages of the top and bottom boundaries at 40.20 Ma and 42.47 Ma, respectively, and subsequently constructed a “floating” astronomical timescale for Well JYC1, utilizing the 100 ka long eccentricity filtered curve as a reference.
(2)
Different cycles, including long-eccentricity, obliquity, and precession cycles, were delineated, serving as the basis for stratigraphic division. When conducting astronomical cycle stratigraphic division for single wells in the Es3l of the Bonan Sag, it was found that there were consistently 6 long-eccentricity cycles, 25 short-eccentricity cycles with a slope of approximately 56, and about 104 precession cycles. During well-to-well stratigraphic correlation, within the 405 ka long-eccentricity cycle, stratigraphic division was conducted using a 100 ka short-eccentricity filtered curve, resulting in the identification of approximately 25 short-eccentricity cycles. This approach achieved high-precision stratigraphic division and correlation.
(3)
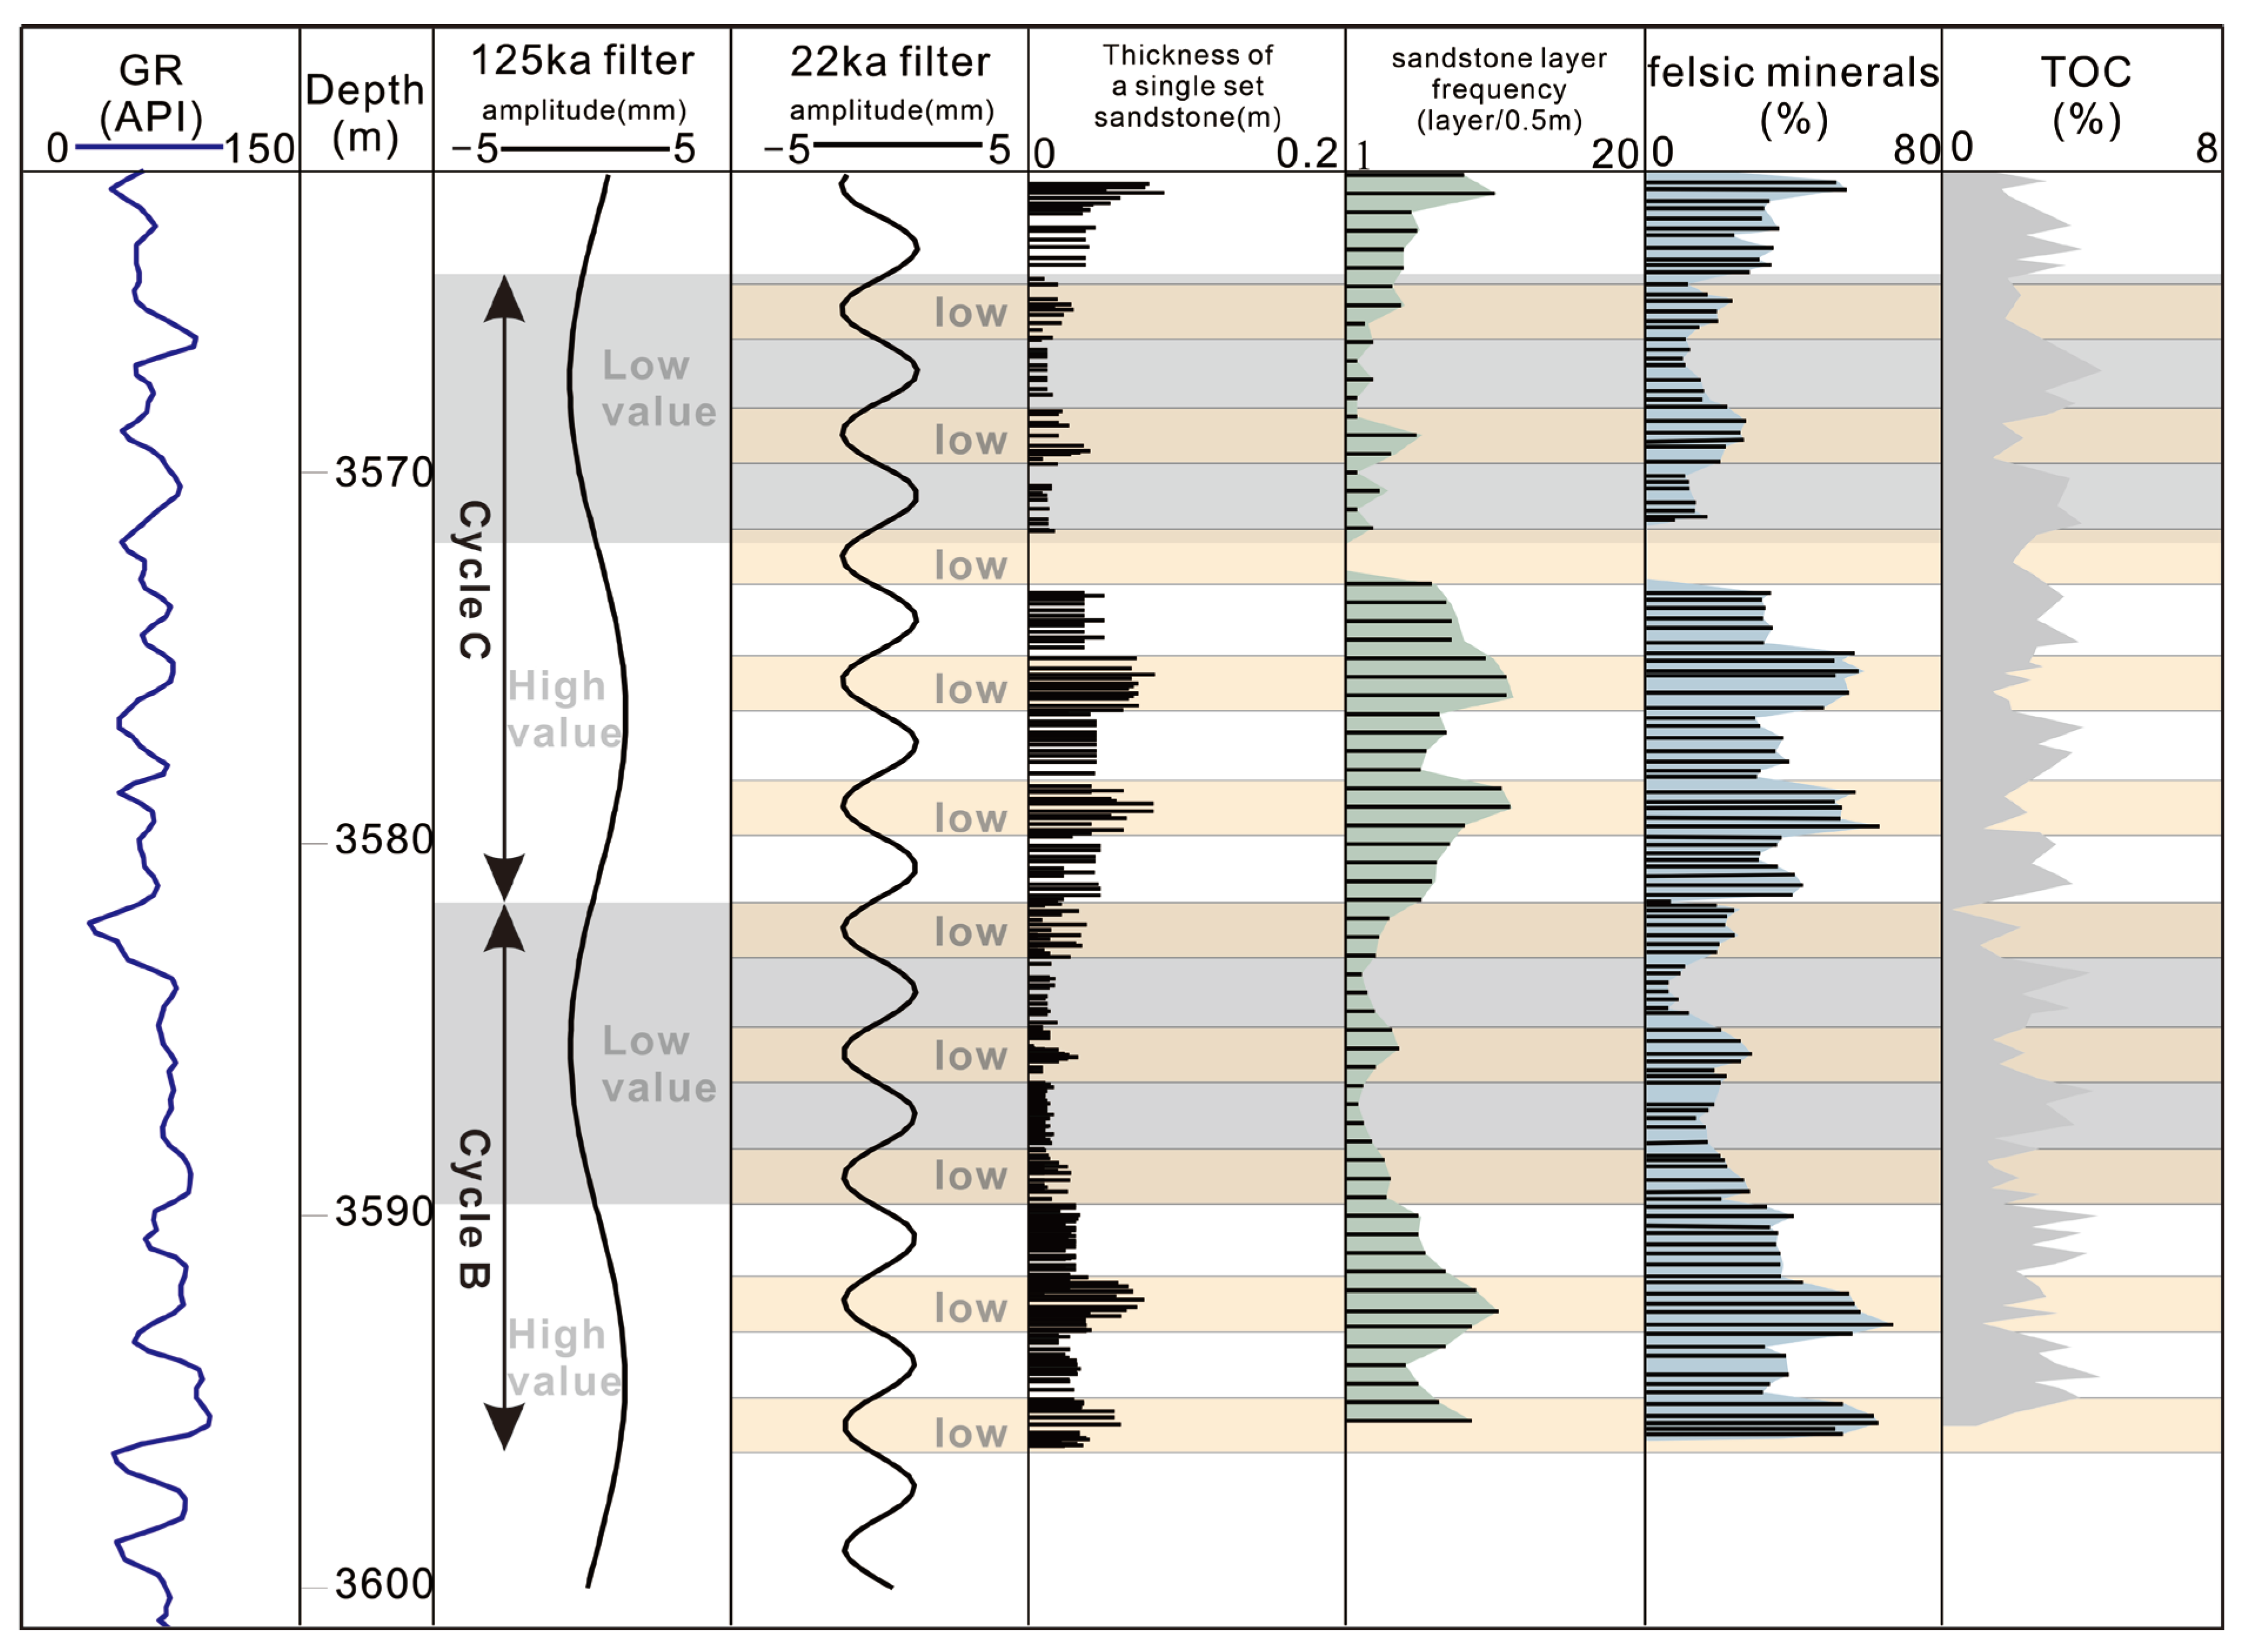
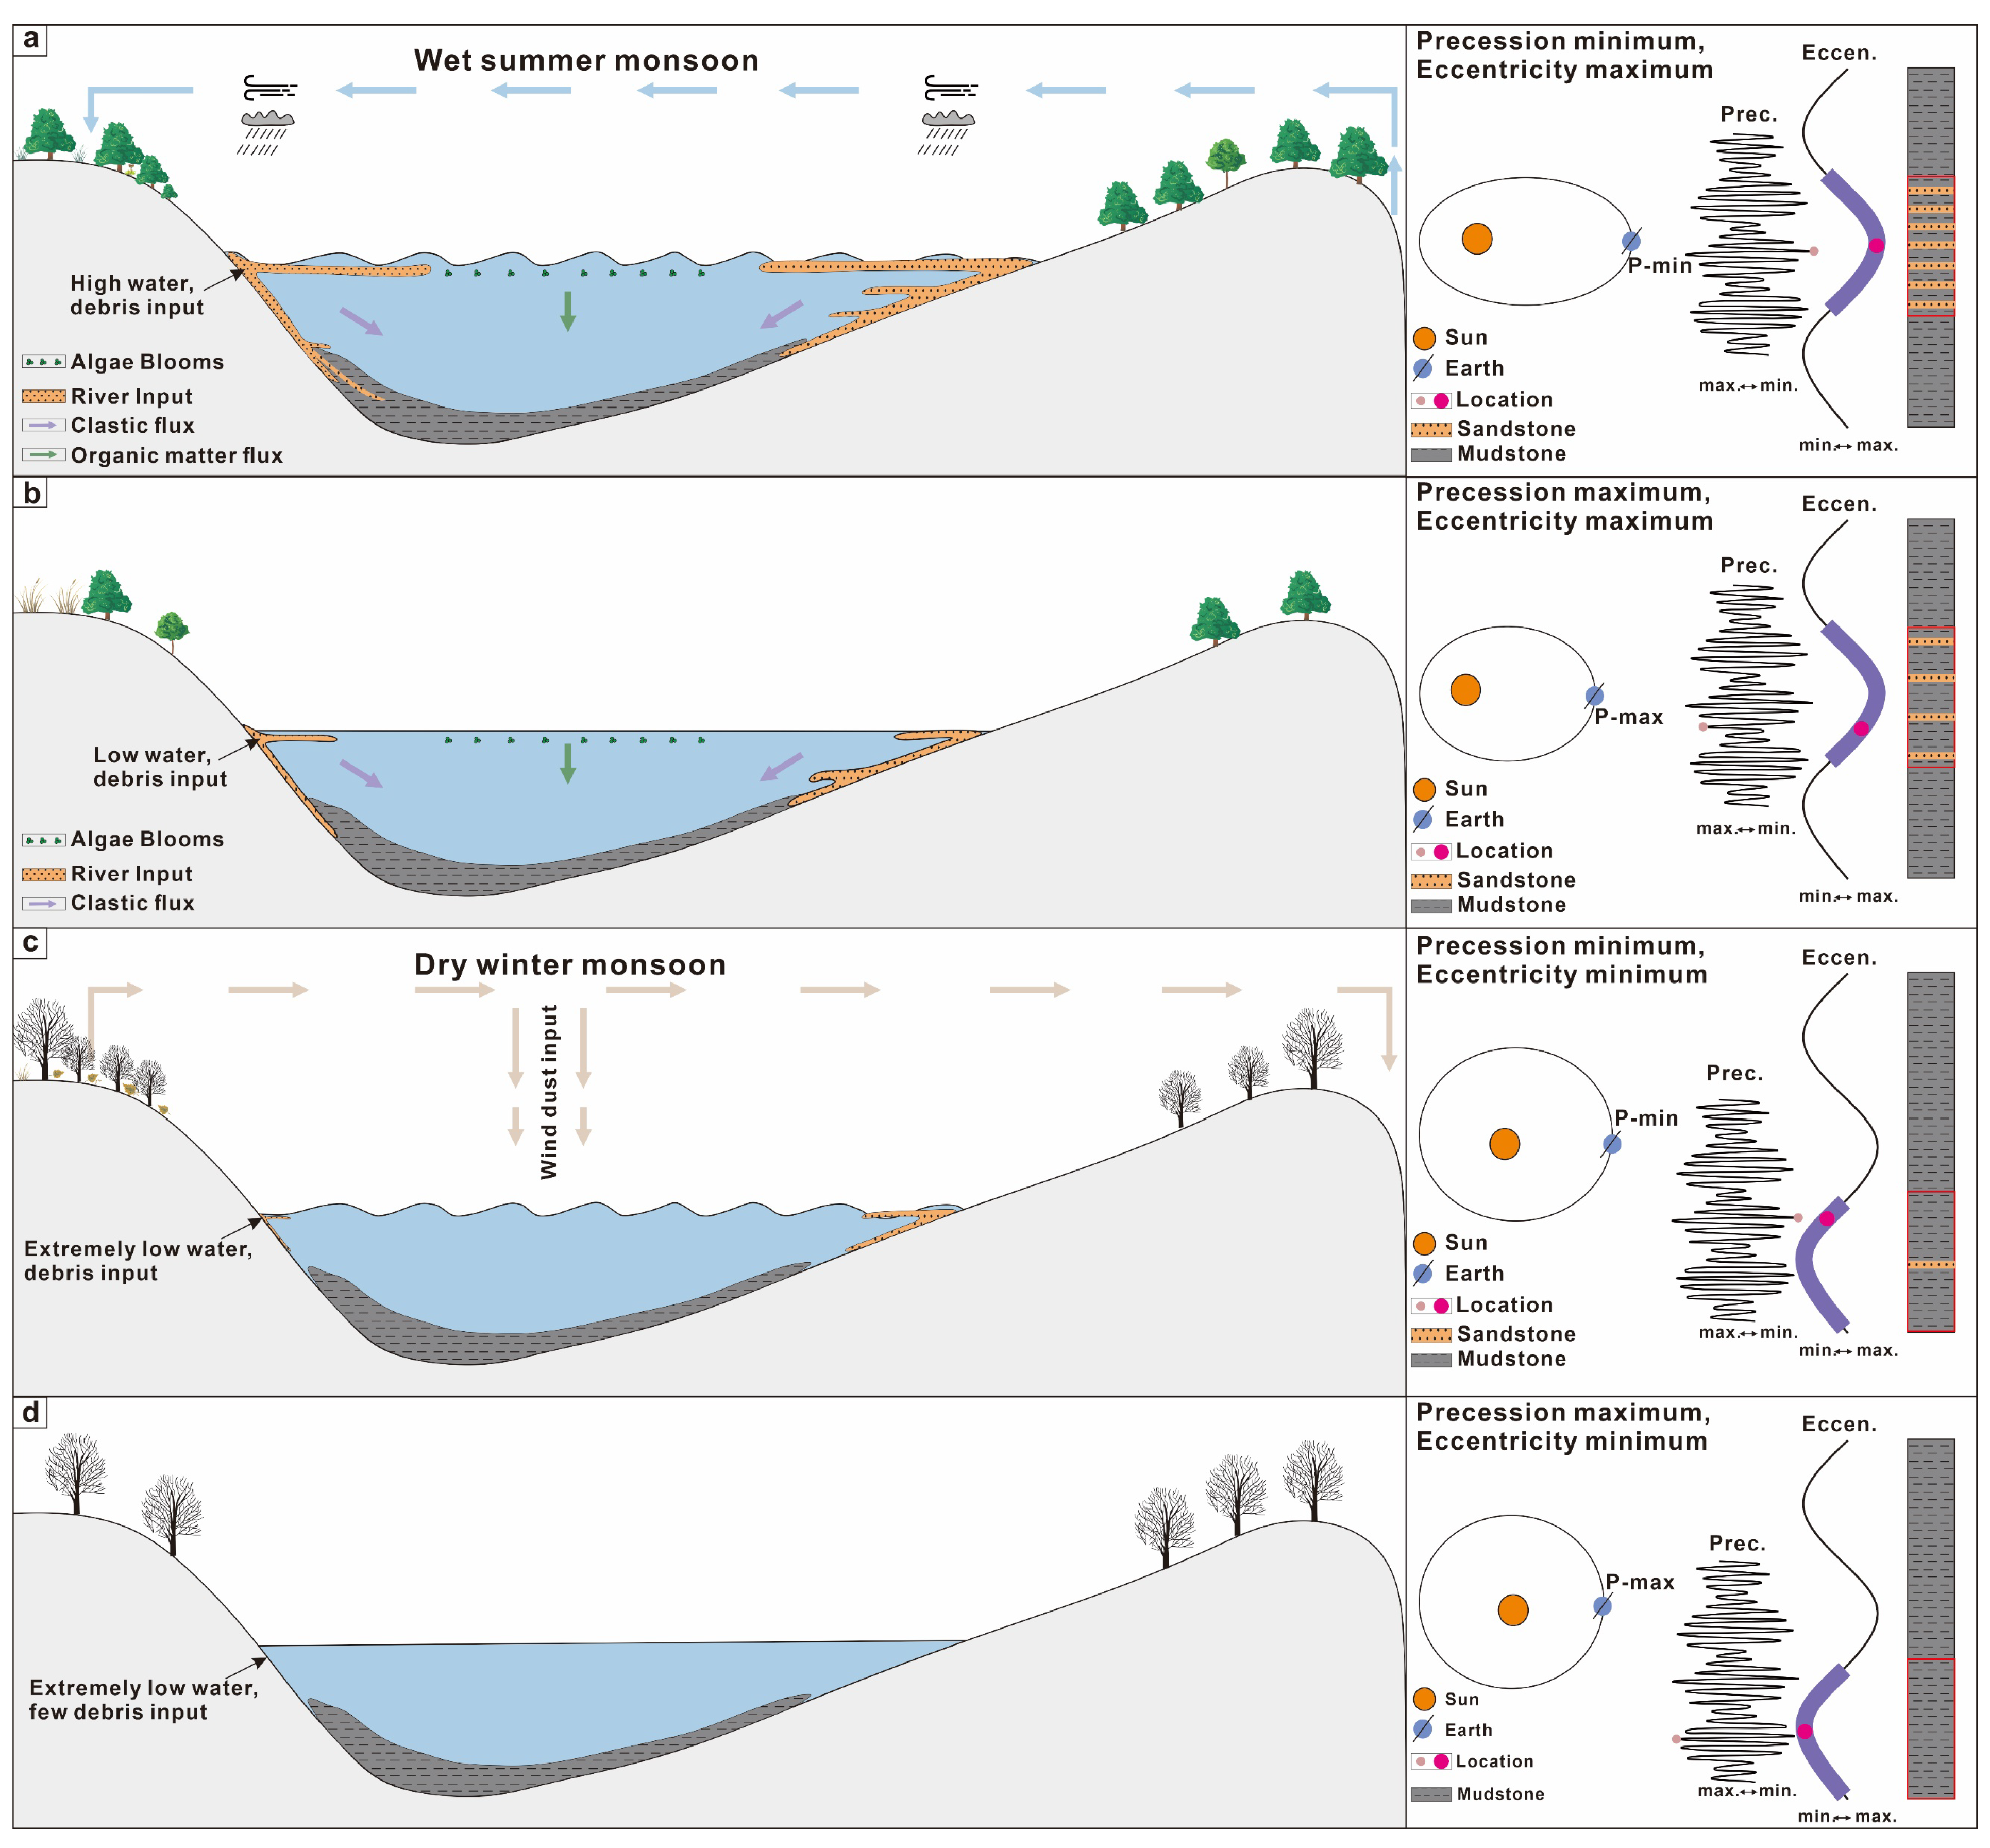
It has been discovered that the synergistic effect of short eccentricity and precession controls the quality of sandstone-interbedded mudrock. Specifically, higher eccentricity values are associated with the development of thicker sandstone interbeds, while minimal precession values tend to enhance the thickness of these sandstone interbeds. Through astronomical cycle analysis, the depositional evolution mechanisms of sandstone-interbedded mudrock have been unveiled. Combining these insights with high-precision stratigraphic classification results provides a basis for detailed evaluation of lacustrine shale oil reservoirs and prediction of “sweet spots”.

Author Contributions

Conceptualization, J.Z., Q.Z., W.L., Y.L. and P.L. (Peng Li); Methodology, J.Z., Q.Z., W.L., Y.L. and P.L. (Peng Li); Software, Q.Z., P.L. (Pinxie Li) and S.P.; Validation, J.Z., Q.Z., W.L., Y.L. and P.L. (Peng Li); Formal analysis, Q.Z., P.L. (Peng Li), P.L. (Pinxie Li), S.P. and X.Y.; Investigation, Q.Z., P.L. (Peng Li), P.L. (Pinxie Li) and S.P.; Resources, W.L., Y.L. and P.L. (Peng Li); Data curation, W.L., Y.L. and P.L. (Peng Li); Writing—original draft, J.Z., Q.Z., W.L., Y.L., P.L. (Peng Li), P.L. (Pinxie Li) and S.P.; Writing—review & editing, Q.Z., X.Y.; Visualization, J.Z., Q.Z., W.L., Y.L., P.L. (Peng Li), P.L. (Pinxie Li), S.P. and X.Y.; Supervision, J.Z., Q.Z., W.L., Y.L., P.L. (Peng Li), P.L. (Pinxie Li), S.P. and X.Y.; Project administration, J.Z. and W.L.; Funding acquisition, J.Z., W.L., Y.L. and P.L. (Peng Li). All authors have read and agreed to the published version of the manuscript.

Funding

This article was supported by the Open Fund Project Fine characterization and reservoir formation mechanism of thick and high-quality massive shale oil reservoirs in the Bonan Sag [Grant No. 33550000-24-ZC0613-0022] of [Sinopec Key Laboratory of Shale Oil/Gas Exploration and Production Technology]. Funder: Sinopec Key Laboratory of Shale Oil/Gas Exploration and Production Technology. Funder number: 33550000-24-ZC0613-0022. The second funding support item for this project comes from the National Key R&D Program of China. Project name: Interaction Among Different Spheres, Hydrocarbon Resources, and Environmental Effects in the Cenozoic Plate Subduction Zone in Eastern China [Grant No.: 2023YFF0804302].

Data Availability Statement

The original contributions presented in this study are included in the article. Further inquiries can be directed to the corresponding author.

Conflicts of Interest

Author Wangpeng Li, Yali Liu, and Peng Li were employed by the company Sinopec. The remaining authors declare that the research was conducted in the absence of any commercial or financial relationships that could be construed as a potential conflict of interest.

References

  1. Aplin, A.C.; Macquaker, J.H.S. Mudstone diversity: Origin and implications for source, seal, and reservoir properties in petroleum systems. AAPG Bull. 2011, 95, 2031–2059. [Google Scholar] [CrossRef]
  2. Jiang, Z.; Liang, C.; Wu, J.; Zhang, J.G.; Zhang, W.Z.; Wang, Y.S.; Liu, H.M.; Chen, X. Several problems in the study of fine-grained sedimentary rocks containing oil and gas. Acta Pet. Sin. 2013, 34, 1031–1039, (In Chinese with English abstract). [Google Scholar]
  3. Yan, J.; Yan, Y.; Peng, J.; Li, Z.; Geng, B.; Lai, F. Relationship between astrostratigraphy and cycle stratigraphy, research progress and significance. Lithol. Reserv. 2017, 29, 147–156, (In Chinese with English abstract). [Google Scholar]
  4. Zou, C.; Zhu, R.; Wu, S.; Yang, Z.; Tao, S.; Yuan, X.; Hou, L.; Yang, H.; Yang, C.; Li, D.; et al. Conventional and unconventional oil and gas accumulation types, characteristics, mechanisms and Prospects—A case study of tight oil and tight gas in China. Acta Pet. Sin. 2012, 33, 173–187, (In Chinese with English abstract). [Google Scholar]
  5. Yan, J.P.; Liang, Q.; Geng, B.; Feng, C.Z.; Kou, X.P.; Hu, Y. Well logging calculation method and application of geochemical parameters of lacustrine shale—Taking the lower member of Es3 in Bonan sag of Zhanhua sag as an example. Lithol. Reserv. 2017, 29, 108–116, (In Chinese with English abstract). [Google Scholar]
  6. Zhao, X.Z.; Zhou, L.H.; Pu, X.G.; Jin, M.F.; Shi, Z.N.; Xiao, D.Q.; Han, W.Z.; Jiang, W.Y.; Zhang, W.; Wang, H. Favorable Conditions for Formation and Enrichment of Lacustrine Shale Oil in Faulted Lake Basin: A Case Study of the Second Member of Kongdian Formation in Cangdong Sag, Bohai Bay Basin. Acta Pet. Sin. 2019, 40, 1013–1029, (In Chinese with English abstract). [Google Scholar]
  7. Zhang, J.G.; Jiang, Z.X.; Liu, L.A.; Yuan, F.; Feng, L.Y.; Li, C.S. Lithofacies and depositional evolution of fine grained sedimentary rocks in the lower submember of the Member 3 of Shahejie Formation in Zhanhua sag, Bohai Bay Basin. Acta Pet. Sin. 2021, 42, 293–306, (In Chinese with English abstract). [Google Scholar]
  8. Boulila, S.; Galbrun, B.; Huret, E.; Hinnov, L.A.; Rouget, I.; Gardin, S.; Bartolini, A. Astronomical calibration of the Toarcian Stage: Implications for sequence stratigraphy and duration of the early Toarcian OAE. Earth Planet. Sci. Lett. 2014, 386, 98–111. [Google Scholar] [CrossRef]
  9. Shi, J.; Jin, Z.; Liu, Q.; Huang, Z. Depositional process and astronomical forcing model of lacustrine fine-grained sedimentary rocks: A case study of the early Paleogene in the Dongying Sag, Bohai Bay Basin. Mar. Pet. Geol. 2020, 113, 103995. [Google Scholar] [CrossRef]
  10. Berger, A. Milankovitch, the father of paleoclimate modeling. Clim. Past 2021, 17, 1727–1733. [Google Scholar] [CrossRef]
  11. Berger, A. Milankovitch theory and climate. Rev. Geophys. 1988, 26, 624–657. [Google Scholar] [CrossRef]
  12. Weedon, G.P. Time-Series Analysis and Cyclostratigraphy; Cambridge University Press: Cambridge, UK, 2003; pp. 10–14. [Google Scholar]
  13. Strasser, A.H.; Heckel, P.H. Cyclostratigraphy concepts, definitions, and applications. Newsl. Stratigr. 2007, 42, 75–114. [Google Scholar] [CrossRef]
  14. Huang, C.J. The current status of cyclostratigraphy and astrochronology in the Mesozoic. Geosci. Front. 2014, 21, 48–66. [Google Scholar]
  15. Wu, H.C.; Zhang, S.H.; Feng, Q.L.; Fang, N.Q.; Yang, T.S.; Li, H.Y. Theoretical Basis, Research Progress and Prospect of Cycle Stratigraphy. J. Earth Sci. (J. China Univ. Geosci.) 2011, 36, 409–428, (In Chinese with English abstract). [Google Scholar]
  16. Jin, Z.H.; Jiang, Z.X.; Zhang, J.G.; Liu, S.Q.; Chen, J.; Zhao, L.J.; Lei, H.R. Study on cycle stratigraphy of the upper Es4 member in Dongying depression—Taking well Fanye 1 as an example. Sci. Technol. Eng. 2017, 17, 21–28, (In Chinese with English abstract). [Google Scholar]
  17. Zhang, J.; Jiang, Z.; Liang, C.; Baars, T.F.; Wang, Y.; Abels, H.A. Astronomical forcing of meter-scale organic-rich mudstone–limestone cyclicity in the Eocene Dongying sag, China: Implications for shale reservoir exploration. AAPG Bull. 2022, 106, 1557–1579. [Google Scholar] [CrossRef]
  18. Kietzmann, D.A.; Palma, R.M.; Iglesia Llanos, M.P. Cyclostratigraphy of an orbitally-driven Tithonian–Valanginian carbonate ramp succession, Southern Mendoza, Argentina: Implications for the Jurassic–Cretaceous boundary in the Neuquén. Basin. Sediment. Geol. 2015, 315, 29–46. [Google Scholar] [CrossRef]
  19. Fang, Q.; Wu, H.; Hinnov, L.A.; Wang, X.; Yang, T.; Li, H.; Zhang, S. A record of astronomically forced climate change in a late Ordovician (Sandbian) deep marine sequence, Ordos Basin, North China. Sediment. Geol. 2016, 341, 163–174. [Google Scholar] [CrossRef]
  20. Abels, H.A.; Abdul Aziz, H.; Calvo, J.P.; Tuenter, E. Shallow lacustrine carbonate microfacies document orbitally paced lake-level history in the Miocene Teruel Basin (North-East Spain). Sedimentology 2009, 56, 399–419. [Google Scholar] [CrossRef]
  21. Abels, H.A.; Aziz, H.A.; Ventra, D.; Hilgen, F.J. Orbital Climate Forcing in Mudflat to Marginal Lacustrine Deposits in the Miocene Teruel Basin (Northeast Spain). J. Sediment. Res. 2009, 79, 831–847. [Google Scholar] [CrossRef]
  22. Ocakoğlu, F.; Açıkalın, S.; Yılmaz, İ.Ö.; Şafak, Ü.; Gökçeoğlu, C. Evidence of orbital forcing in lake-level fluctuations in the Middle Eocene oil shale-bearing lacustrine successions in the Mudurnu-Göynük Basin, NW Anatolia (Turkey). J. Asian Earth Sci. 2012, 56, 54–71. [Google Scholar] [CrossRef]
  23. Wu, H.; Zhang, S.; Jiang, G.; Hinnov, L.; Yang, T.; Li, H.; Wan, X.; Wang, C. Astrochronology of the Early Turonian–Early Campanian terrestrial succession in the Songliao Basin, northeastern China and its implication for long-period behavior of the Solar System. Palaeogeogr. Palaeoclimatol. Palaeoecol. 2013, 385, 55–70. [Google Scholar] [CrossRef]
  24. Yang, Y.; Miall, A.D. Migration and stratigraphic fill of an underfilled foreland basin: Middle–Late Cenomanian Belle Fourche Formation in southern Alberta, Canada. Sediment. Geol. 2010, 227, 51–64. [Google Scholar] [CrossRef]
  25. Zhao, K.; Du, X.; Lu, Y.; Xiong, S.; Wang, Y. Are light-dark coupled laminae in lacustrine shale seasonally controlled? A case study using astronomical tuning from 42.2 to 45.4 Ma in the Dongying Depression, Bohai Bay Basin, eastern China. Palaeogeogr. Palaeoclimatol. Palaeoecol. 2019, 528, 35–49. [Google Scholar] [CrossRef]
  26. Zhao, X.X.; Yan, J.P.; Wang, M.; He, X.; Zhong, G.H.; Wang, J.; Geng, B.; Hu, Q.H.; Li, Z.P. Characteristics of lacustrine shale intercalation in Shahejie Formation of Zhanhua Depression and logging identification method. Lithol. Reserv. 2022, 34, 118–129, (In Chinese with English abstract). [Google Scholar]
  27. Zhou, L.H.; Pu, X.G.; Deng, Y.; Chen, S.Y.; Yan, J.H.; Han, W.Z. Several noteworthy problems in the study of fine-grained sedimentary rocks. Lithol. Reserv. 2016, 28, 6–15, (In Chinese with English abstract). [Google Scholar]
  28. Tavakoli, V. Application of gamma deviation log (GDL) in sequence stratigraphy of carbonate strata, an example from offshore Persian Gulf, Iran. J. Pet. Sci. Eng. 2017, 156, 868–876. [Google Scholar] [CrossRef]
  29. Prokoph, A.; Villeneuve, M.; Agterberg, F.P.; Rachold, V. Geochronology and calibration of global Milankovitch cyclicity at the Cenomanian-Turonian boundary. Geology 2001, 29, 523–526. [Google Scholar] [CrossRef]
  30. Jia, S.; Jiang, Z.X.; Zhang, W.Z. Characteristics and controlling factors of shale oil reservoir in Zhanhua Depression. Mar. Geol. Front. 2018, 34, 29–38, (In Chinese with English abstract). [Google Scholar]
  31. Liu, H.; Yuan, F.F.; Jiang, Y.L.; Hao, X.F.; Fang, X.Q. Overpressure characteristics and genetic mechanism of Paleogene in Zhanhua Depression. J. China Univ. Pet. (Ed. Nat. Sci.) 2021, 45, 23–32, (In Chinese with English abstract). [Google Scholar]
  32. Li, C.; Zhu, X.M.; Zhu, S.F.; Geng, M.Y.; Bi, Y.Q.; Shu, Q.L.; Xu, F.G. Characteristics of shale reservoirs in the lower Es3 formation in Luojia area of Zhanhua Depression. Acta Sedimentol. Sin. 2015, 33, 795–808, (In Chinese with English abstract). [Google Scholar]
  33. Li, M.; Hinnov, L.; Kump, L. Acycle: Time-series analysis software for paleoclimate research and education. Comput. Geosci. 2019, 127, 12–22. [Google Scholar] [CrossRef]
  34. Cleveland, W.S. Robust locally weighted regression and smoothing scatterplots. J. Am. Stat. Assoc. 1979, 74, 829–836. [Google Scholar] [CrossRef]
  35. Laskar, J.; Fienga, A.; Gastineau, M.; Manche, H. A new orbital solution for the long-term motion of the Earth. Astron. Astrophys. 2011, 532, 77–89. [Google Scholar] [CrossRef]
  36. Fienga, A.; Laskar, J.; Morley, T.; Manche, H.; Kuchynka, P.; Poncin-Lafitte, C.L.; Budnik, F.; Gastineau, M.; Somenzi, L. INPOP08, a 4-D planetary ephemeris: From asteroid and time-scale computations to ESA mars express and venus express contributions. Astron. Astrophys. 2009, 507, 1675–1686. [Google Scholar] [CrossRef]
  37. Liu, Z.; Huang, C.; Algeo, T.J.; Liu, H.; Hao, Y.; Du, X.; Lu, Y.; Chen, P.; Guo, L.; Peng, L. High-resolution astrochronological record for the Paleocene-Oligocene (66–23 Ma) from the rapidly subsiding Bohai Bay Basin, northeastern China. Palaeogeogr. Palaeoclimatol. Palaeoecol. 2018, 510, 78–92. [Google Scholar] [CrossRef]
  38. Zhang, R.L.; Jin, S.D. Cycle stratigraphy of the lower Es3 member in well Luo 69 in Zhanhua sag, Bohai Bay Basin. J. Cent. South Univ. (Sci. Technol.) 2021, 52, 1516–1531, (In Chinese with English abstract). [Google Scholar]
  39. Meyers, S.R.; Sageman, B.B.; Hinnov, L.A. Integrated quantitative stratigraphy of the cenomanian-turonian bridge creek limestone member using evolutive harmonic analysis and stratigraphic modeling. J. Sediment. Res. 2001, 71, 628–644. [Google Scholar] [CrossRef]
  40. Meyers, S.R. Seeing red in cyclic stratigraphy: Spectral noise estimation for astrochronology. Paleoceanography 2012, 27, PA3228. [Google Scholar] [CrossRef]
  41. Ma, C.; Meyers, S.R.; Sageman, B.B.; Singer, B.S.; Jicha, B.R. Testing the astronomical time scale for oceanic anoxic event 2, and its extension into Cenomanian strata of the Western Interior Basin (USA). Geol. Soc. Am. Bull. 2014, 126, 974–989. [Google Scholar] [CrossRef]
  42. Zhang, J.G.; Jiang, Z.X.; Liu, P.; Kong, X.X.; Ge, Y.J. Deposition mechanism and geological assessment of continentaultrafine grained shale oil reservoirs. Acta Pet. Sin. 2022, 43, 234–249, (In Chinese with English abstract). [Google Scholar]
  43. Tuenter, E.; Weber, S.L.; Hilgen, F.J.; Lourens, L.J. The response of the African summer monsoon to remote and local forcing due to precession and obliquity. Glob. Planet. Change 2003, 36, 219–235. [Google Scholar] [CrossRef]
  44. Abels, H.A.; Kraus, M.J.; Gingerich, P.D.; Sheldon, N. Precession-scale cyclicity in the fluvial lower Eocene Willwood Formation of the Bighorn Basin, Wyoming (USA). Sedimentology 2013, 60, 1467–1483. [Google Scholar] [CrossRef]
  45. Huang, C.; Hinnov, L.; Fischer, A.G.; Grippo, A.; Herbert, T. Astronomical tuning of the Aptian Stage from Italian reference sections. Geology 2010, 38, 899–902. [Google Scholar] [CrossRef]
  46. Zachos, J.; Pagani, M.; Sloan, L.; Thomas, E.; Billups, K. Trends, Rhythms, and Aberrations in Global Climate 65 Ma to Present. Science 2001, 292, 686–693. [Google Scholar] [CrossRef]
  47. Valero, L.; Garcés, M.; Cabrera, L.; Costa, E.; Sáez, A. 20 Myr of eccentricity paced lacustrine cycles in the Cenozoic Ebro Basin. Earth Planet. Sci. Lett. 2014, 408, 183–193. [Google Scholar] [CrossRef]
Figure 1. Regional geological background of Bonan Sag [modified from ref. [7]]. (a) The Bonan Sag, situated in the northeastern part of the Jiyang Depression within the Bohai Bay Basin, the red pentagram marks the well location; (b) the target interval in the study area is the Lower Es3 submember (the red box marked).
Jmse 13 01080 g001
Figure 2. The detrended GR curve for well JYC-1 (presentation of detrended GR data).
Jmse 13 01080 g002
Figure 3. MTM Spectrum Analysis of GR curve in Es3l sub-member of well JYC1. (a) MTM spectra analysis of astronomical solutions for 40.2–42.47 Ma. (b) Evolutionary Harmonic Analysis in the Es3l sub-member of well JYC1. (c) MTM spectra analysis of depth domain in Es3l sub-member of well JYC-1. E = Long Eccentricity (orange band), e = Short Eccentricity (dark green band), O = Obliquity (purple band), P = Precession (light green). (d) MTM spectra analysis of segmented GR depth domain in Es3l sub-member of well JYC-1. Orange line: Long Eccentricity; Dark green line: Short Eccentricity; Purple line: Obliquity, Light green: Precession.
Jmse 13 01080 g003
Figure 4. Correlation coefficient analysis results of GR curve “COCO” in the Es3l of well JYC-1. (a) Correlation coefficient. (b) H0 significance level. (c) Number of orbital parameters.
Jmse 13 01080 g004
Figure 5. Stratigraphic division in Es3l sub-member of single Well JYC-1.
Jmse 13 01080 g005
Figure 6. Comparison of well-connected strata with 100 ka short eccentricity cycle.
Jmse 13 01080 g006
Figure 7. The mudrock core from Well JYC-1, featuring thin sandy interlayers on the centimeter-to-decimeter scale.
Jmse 13 01080 g007
Figure 8. Thickness distribution characteristics of sandstone in the Es3l sub-member in Bonan Sag with the 100 ka short eccentricity cycle. (a) Cycle A: the top 100 ka cycle of a 405 ka cycle. (b) Cycle B: the central 100 ka cycle of a 405 ka cycle. (c) Cycle C: the bottom 100 ka cycle of a 405 ka cycle.
Jmse 13 01080 g008
Figure 9. High-frequency evolution characteristics of sandstone–mudrock integration in well JYC-1 of Bonan Sag under the control of the 100 ka short eccentricity cycle and 22 ka precession cycle.
Jmse 13 01080 g009
Figure 10. Terrigenous input models driven by astronomical cycle orbits and corresponding Earth orbits. The left side of this figure displays depositional model, while the right side presents the corresponding Earth orbits and astronomical cycle curves. (a) When eccentricity reaches its maximum value and precession is at its minimum, terrigenous input is strongest. (b) As eccentricity decreases but remains at a relatively high level, and precession is at its maximum, terrigenous input is still strong but weaker than in stage A. (c) As eccentricity continues to decrease and precession reaches its minimum, there is some terrigenous input, but it is weaker than in stage B. (d) When eccentricity is at its minimum and precession is at its maximum, terrigenous input is minimal. The evolution of terrestrial input is controlled by the synergy of short eccentricity and precession, and the influence of obliquity is almost non-existent. Therefore, only precession and short eccentricity are listed in the Earth orbits and astronomical cycle curves on the right.
Jmse 13 01080 g010
Table 1. Relationship between short eccentricity cycle, precession cycle, and high-frequency evolution of sandstone–mudrock integration in the Es3l submember of Bonan Sag. The data statistics are based on the data presented in Figure 9.
100 ka Short Eccentricity22 ka PrecessionThickness of Single-Layer SandstoneFrequency of Sandstone DevelopmentFelsic Minerals ContentTOC Content
Low valueLow valueThinLowLowRelatively high
High valueExtremely thinExtremely lowExtremely lowHigh
High valueLow valueExtremely thickExtremely highExtremely highLow
High valueThickHighHighRelatively low
Disclaimer/Publisher’s Note: The statements, opinions and data contained in all publications are solely those of the individual author(s) and contributor(s) and not of MDPI and/or the editor(s). MDPI and/or the editor(s) disclaim responsibility for any injury to people or property resulting from any ideas, methods, instructions or products referred to in the content.

