Review

Review of Research Progress on the Impact of Submarine Groundwater Discharge on Pockmark Formation and Evolution

1
Shandong Provincial Key Laboratory of Marine Environment and Geological Engineering, Key Laboratory of Submarine Geosciences and Prospecting Techniques (MOE), Frontiers Science Center for Deep Ocean Multispheres and Earth System, College of Environmental Science and Engineering, Ocean University of China, Qingdao 266100, China
2
Laboratory for Marine Geology, Qingdao Marine Science and Technology Center, Qingdao 266237, China
*
Authors to whom correspondence should be addressed.
J. Mar. Sci. Eng. 2025, 13(6), 1070; https://doi.org/10.3390/jmse13061070
Submission received: 8 May 2025 / Revised: 26 May 2025 / Accepted: 26 May 2025 / Published: 28 May 2025
(This article belongs to the Special Issue Marine Geohazards: Characterization to Prediction)

Abstract

:
Pockmarks are globally distributed geomorphic features exhibiting diverse morphologies. Their geometric characteristics are commonly quantified by the radius-to-depth ratio. The evolutionary process of these features typically follows a cyclical pattern comprising initiation, expansion, stabilization, and decline. Submarine groundwater discharge (SGD), a seasonally modulated land–sea exchange process, exerts a significant influence on the formation and evolution of pockmarks. This influence is mediated through hydrodynamic forcing effects, sediment redistribution, and coupled chemical–biological interactions. This review systematically examines the formation mechanisms, evolutionary patterns, and primary controlling factors of pockmarks induced by SGD. It integrates recent research developments and global case studies to elucidate the dynamic interplay of multiple influencing factors. This study emphasizes the significance of interdisciplinary approaches in marine geological research and identifies key areas for future investigation. These insights aim to enhance risk assessment frameworks for marine hazards and inform marine spatial planning strategies.

1. Introduction

Submarine groundwater discharge (SGD) refers to the seaward flux that occurs after freshwater and seawater mix within coastal or nearshore aquifers; it comprises both submarine fresh groundwater discharge (SFGD) and recirculated saline groundwater discharge (RSGD) [1]. In many settings, SGD fluxes rival—and in some cases exceed—riverine inputs [2]. Beyond mediating material exchange, SGD continuously injects substantial dissolved constituents into the ocean, exerting strong control over the delivery of both nutrients and contaminants to nearshore waters [3,4]. Acting as a concealed conduit between land and sea, SGD supplies bio-reactive substances that are fundamental for the construction and maintenance of coastal ecological networks [5,6,7]. The magnitude of SGD varies across climatic zones: tropical coasts contribute more than 56% of global SFGD, whereas mid-latitude arid regions supply only about 10% [8]. A growing body of evidence indicates that this pervasive yet often overlooked land–sea interaction can destabilize sediments by elevating pore-water pressure, promoting chemical dissolution, and entraining fine particles [9,10], ultimately leading to the formation of collapse-related pockmarks on the seabed.
In studies of sedimentary basins on the Nova Scotia shelf in Canada, King and MacLean et al. first discovered the phenomenon of pockmarks, revealing the genetic relationship between submarine fluid migration and micro-geomorphological features [11]. This phenomenon, widely distributed across nearshore and oceanic negative landforms, can indicate fluid migration patterns [12,13,14] and holds significant importance in the field of marine geology.
SGD permeates seabed aquifers, transporting fine sediment particles and inducing sediment collapse, which leads to the formation of seabed pockmarks. In the Tyrrhenian Sea, Nardelli et al. showed that the combined influence of submarine springs and buoyant plumes destabilizes the seabed, forming pockmarks [15]. Moreover, Jakobsson et al. in the Baltic Sea discovered that groundwater discharges along permeable glacial clay layers, generating a series of submarine terraces and semi-circular depressions. These findings demonstrate that SGD-driven erosion can trigger sediment failure and create pockmark geomorphology [16].
In addition to influencing the initial formation of seabed collapse pits, submarine groundwater discharge also affects their long-term evolutionary processes. In coastal volcanic regions, SGD interacts with hydrothermal venting, leading to the dissolution, transportation, and redeposition of sediments, thereby influencing the morphological evolution of the pockmarks [17].
In the early stages of research, scholars commonly believed that the formation of pockmarks was associated with earthquakes, tsunamis, glacial impacts from large debris striking the seabed, and human activities [18,19,20,21]. Current studies tend to focus on single factors such as gas seepage and tectonic activity that influence the mechanisms of seabed pockmarks [22,23], with a systematic overview of the multi-scale dynamic processes driven by SGD still lacking. Therefore, investigating the multi-process coupling mechanisms driven by SGD in the formation of pockmarks is of significant scientific value and practical importance for enhancing theories of seabed geomorphological evolution and implementing predictions of marine disasters.
This article first summarizes the current domestic and international research on the impact of SGD on the formation and evolution of pockmarks. Subsequently, it delves into the effects of submarine groundwater discharge on pockmark formation and evolution from multiple perspectives, including physical mechanisms and chemobiological coupling mechanisms, using global case studies. It also outlines how isotopic models and radioactive element tracing methods can be used to quantitatively study these mechanisms. Finally, this paper provides recommendations for key research directions that warrant future exploration.

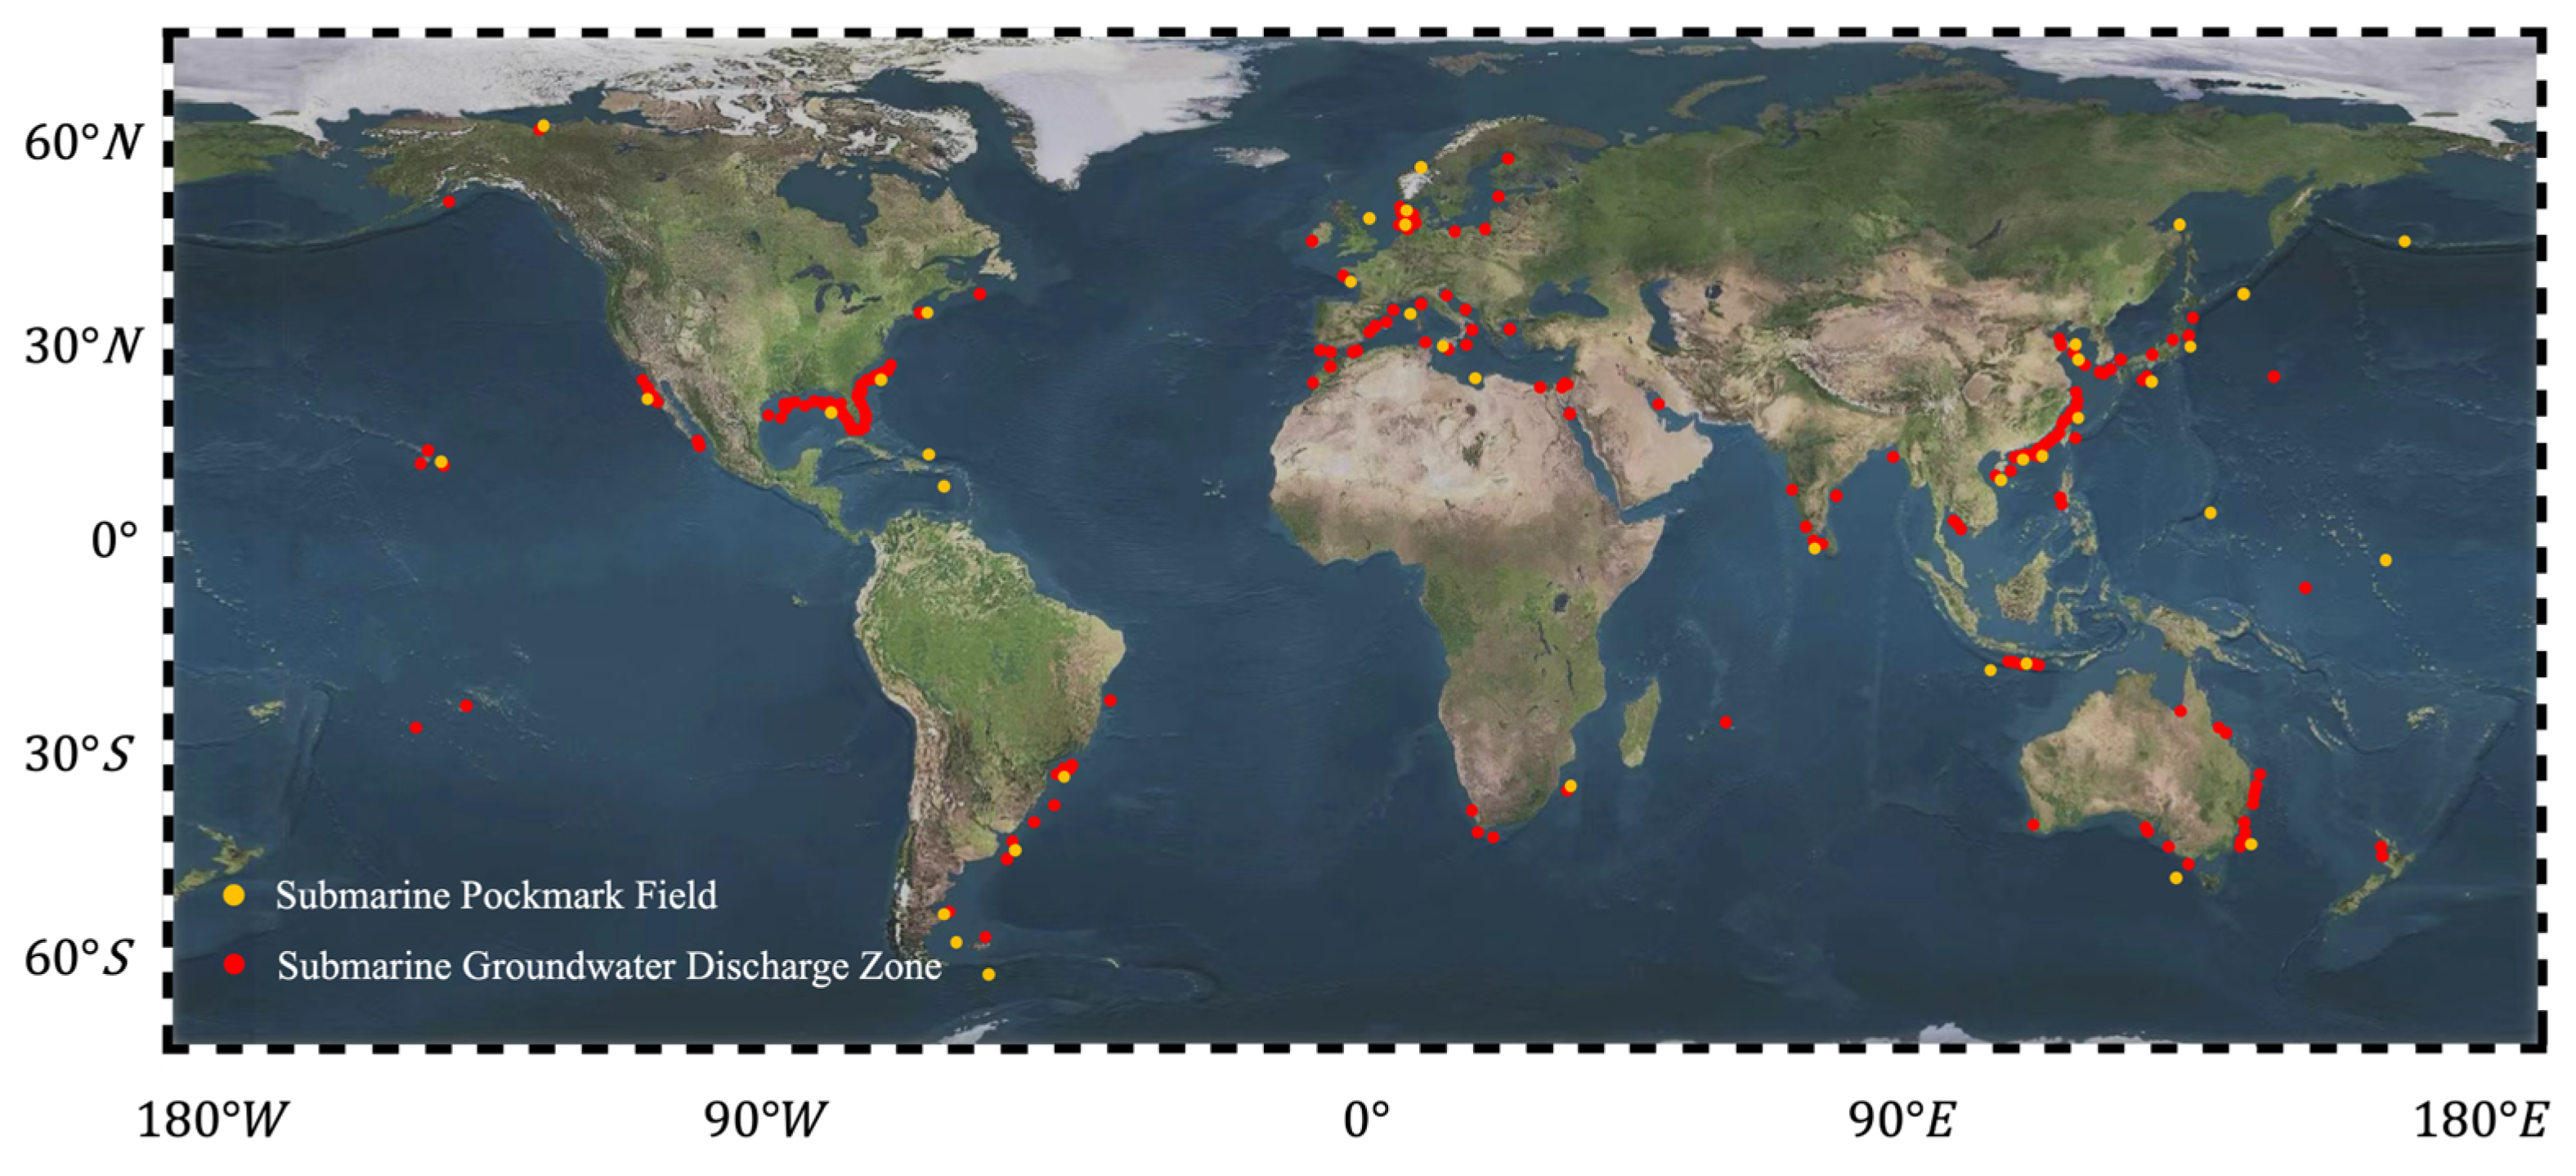
2. Global Distribution Characteristics

Pockmarks are widely distributed around the world (Figure 1), developing in regions such as the northern Norwegian continental slope [24], the equatorial West African slope [25], the Bering Sea [26], the North Sea [27], the western Canadian shelf [28], the Gulf of Mexico [29], the Black Sea [30], and the coastal waters of China [31]. They are commonly found along continental margins including bays [32], shelves [33], and slopes [34] and other margin settings [35,36], with their habitats ranging from shallow waters of 10 m to deep-sea environments up to 5000 m [37,38]. Furthermore, they exhibit a diverse range of geometric shapes across different marine regions globally.
SGD flux exhibits significant spatial heterogeneity and is widely distributed along global continental margins and island regions, overlapping with the global distribution of pockmarks [39,40]. Different geological backgrounds, such as carbonate rocks and clastic rocks, as well as various climatic zones like the tropics and arid regions, significantly influence the magnitude and mode of SGD flux. In the East China Sea, SGD contributes approximately 47% of the total riverine input, becoming a crucial conduit for coastal material cycling [41]. In volcanic island regions like Jeju Island in Korea, SGD is enriched with rare earth elements, further affecting the marine chemical conditions of the area [42]. Additionally, SGD has been extensively observed in the Yellow Sea, the Baltic Sea, and the Mediterranean [43]. Radioisotope tracing methods (such as 226Ra and 222Rn) combined with numerical modeling are typically used to estimate SGD flux. Research indicates that the global SGD flux is approximately (12 ± 3) × 1013 m3/year, equivalent to three–four times the riverine flux to the oceans, with about 70% flowing into the Indo-Pacific region, significantly affecting the global distribution of chemical elements [44]. SGD is also a major component of the global carbon flux, with its transported inorganic carbon amount nearing that of river emissions [45].

3. Morphology and Evolutionary Characteristics of Pockmarks

3.1. Morphological Structure

Pockmarks can be grouped into several distinctive morphological classes (Table 1):
  • Linear or elongated pockmarks are formed by the escape of submarine fluids, exhibit a chain-like depressed morphology, and appear as ordered arrays of non-randomly distributed pockmark clusters along the continental slope. In their mature stage, these pockmarks may merge to form gullies, which can exceed 1.5 km in width and extend longitudinally for 10 km to 25 km, composed of alternating steep slopes and pockmarks, reflecting the cumulative effect of multiple fluid escape events [25].
  • Circular pockmarks typically have a symmetrical shape, usually with diameters of 10–50 m and depths between 1 and 20 m [46].
  • Elliptical and also asymmetrical pockmarks have been found in the Santos Basin in Brazil (Atlantic Ocean) due to the influence of the SGD. Research indicates that high-speed water currents continuously erode one side of a pockmark while causing sediment to accumulate on the opposite side, ultimately leading to pronounced directional and asymmetrical characteristics of the pockmarks [47].
  • In the South China Sea, crescent-shaped pockmarks have been found and, in this region, these morphologies show that the openings of crescent-shaped pockmarks mostly face NW-NNW, aligning with local bottom current directions, suggesting that after fluid eruption, the collaborative effects of bottom currents and gravity flows can further shape the morphological evolution of pockmarks [48]. This directionality provides strong evidence for using pockmark morphology as an indicator of submarine flow fields.
  • Composite and irregular pockmarks are due to multiple fluid emissions and changes in fluid sources; there may be multiple small pockmarks adjacent to each other or complex transitional areas forming between pockmark edges and deep sediments, termed compound pockmarks [49], commonly found in areas affected by both SGD and frequent gas leakage [50].
The size of pockmarks varies significantly across different marine areas, ranging from small pockmarks with diameters less than 5 m to gigantic pockmarks exceeding one kilometer in diameter [24]. Those with diameters greater than 250 m are referred to as “large pockmarks” [51], while those exceeding 1000 m are called “gigantic pockmarks” [11]. The slope of the pockmark edges is controlled by hydrodynamic conditions and the mechanical properties of the sediments, with steeper pockmarks potentially associated with high-velocity submarine groundwater discharge.
The size parameters of pockmarks, including diameter, depth, and area, as well as the proportional relationships between these parameters, are crucial quantitative indicators for studying the mechanisms of pockmark formation and evolution. Lundine et al. utilized deep learning models to analyze pockmark data from various marine areas and found that the relationship between pockmark diameter and depth is either linear or follows a power law [52]. This quantitative relationship can be measured by the diameter-depth ratio, ψ :
ψ = r h
where r   represents the radius of pockmarks and h   represents the depth of pockmarks.
This relationship is more stable in larger pockmarks and shows deviations at smaller scales, indicating the presence of a necessary lower limit for morphological stability [52]. Böttner et al. in their study of pockmarks in the sandy areas of the North Sea observed that pockmarks in sandy sediments typically possess a larger surface area but are shallower in depth. Conversely, pockmarks in muddy sediments not only have a larger area but also exhibit more pronounced vertical erosion. This contrast underscores the influence of sediment physical properties on the morphological characteristics of pockmarks [53].

3.2. Evolutionary Characteristics

Pockmarks generated by SGD commonly occur in clusters or linear trains, rather than as randomly dispersed features. Yu et al. showed that pockmark swarms on the western margin of the South China Sea elongate and coalesce under the combined influence of SGD and sedimentation, ultimately evolving into fully developed seabed gullies [54]. Riera et al. found that pockmarks tend to cluster above submarine landslide areas or near unstable sediment regions on the northwest shelf of Australia [55]. In New Zealand, Hillman et al. found that pockmarks form oriented clusters along structural weakness zones, thereby providing direct evidence of tectonic control on subsurface fluid pathways, providing clear indicators of regional tectonic activity and subsurface fluid transport [56]. Li et al. observed that crescent-shaped and strip-clustered pockmarks are widespread in the Xisha Uplift area, a morphology considered to be the result of further erosion by bottom currents on existing pockmarks [57]. Such hydrodynamic forcing significantly enhances the complexity and variability of pockmark morphological evolution. Within the Makran accretionary wedge (northern Arabian Sea), Zhang et al. ascribed the diverse pockmark assemblages to the combined action of Localized Tectonic Faulting and SGD-induced sediment redeposition [58]. Cojean et al. identified diverse pockmark morphologies of varying sizes in Lake Thun, Switzerland, including isolated depressions, clustered pockmark groups, and composite depressions, through lacustrine geomorphic studies [59]. All these findings indicate that in different sedimentary dynamic environments, the initially more regular pockmark morphologies formed by fluid escape can evolve into a variety of complex shapes through subsequent interactions of multiple factors.
The morphological evolution of pockmarks generally follows a cyclical pattern. During the initiation phase, SGD induces localized instabilities within sediment layers, initiating the formation of small depressions. In the expansion phase, the pockmarks’ depth and diameter notably increase, with phenomena such as margin slumping and coalescence occurring. During the stabilization phase, the pockmark morphology approaches equilibrium, potentially with partial sediment infill. Should external forces such as tectonic or climatic influences persist, the pockmarks may expand further, eventually coalescing into extensive collapse zones. In the senescence phase, the pockmarks are ultimately obscured by marine sediments and vanish, completing a full developmental cycle until external dynamical forces trigger new pockmark formation.

4. Mechanisms of SGD-Driven Pockmark Formation and Evolution

The formation and evolution of pockmarks are driven by the synergistic interaction of multiple factors. SGD serves as a critical dynamical source, directly inducing localized sediment liquefaction and structural instability. Additionally, SGD interacts with other geological processes such as gas escape, chemical dissolution, and mineral restructuring, collectively shaping the spatiotemporal characteristics of pockmarks. The impact mechanisms of SGD vary depending on the groundwater dynamics, geological environmental factors, and variations in the biological communities.
Different isotopes, due to their sensitivity to the mixing of groundwater and seawater, are commonly used to reveal the processes of SGD. For example, isotopes such as 87Sr/86Sr, δ 7 L i , and δ 34 S are extensively used to trace the origins and dynamic processes of groundwater, revealing the contributions of SGD to the biogeochemical processes on Earth and providing quantitative methods for studying the formation and evolutionary mechanisms of pockmarks [60].
Global studies support the mechanism by which SGD influences the formation and evolution of pockmarks. For instance, in Puck Bay in the Baltic Sea, Matciak et al. found that the flow of submarine groundwater affects the distribution of salinity in the seabed and by analyzing the chloride concentrations in seabed pore water, the SGD rates were estimated to vary among pockmarks of different morphologies and were found to be closely associated with the types of seabed sediments [61]. Research in the Bay of Bengal has demonstrated the influence of SGD in tropical seas, especially how changes in the monsoon and tidal cycles alter groundwater composition and flow, significantly affecting the seabed morphology [62].

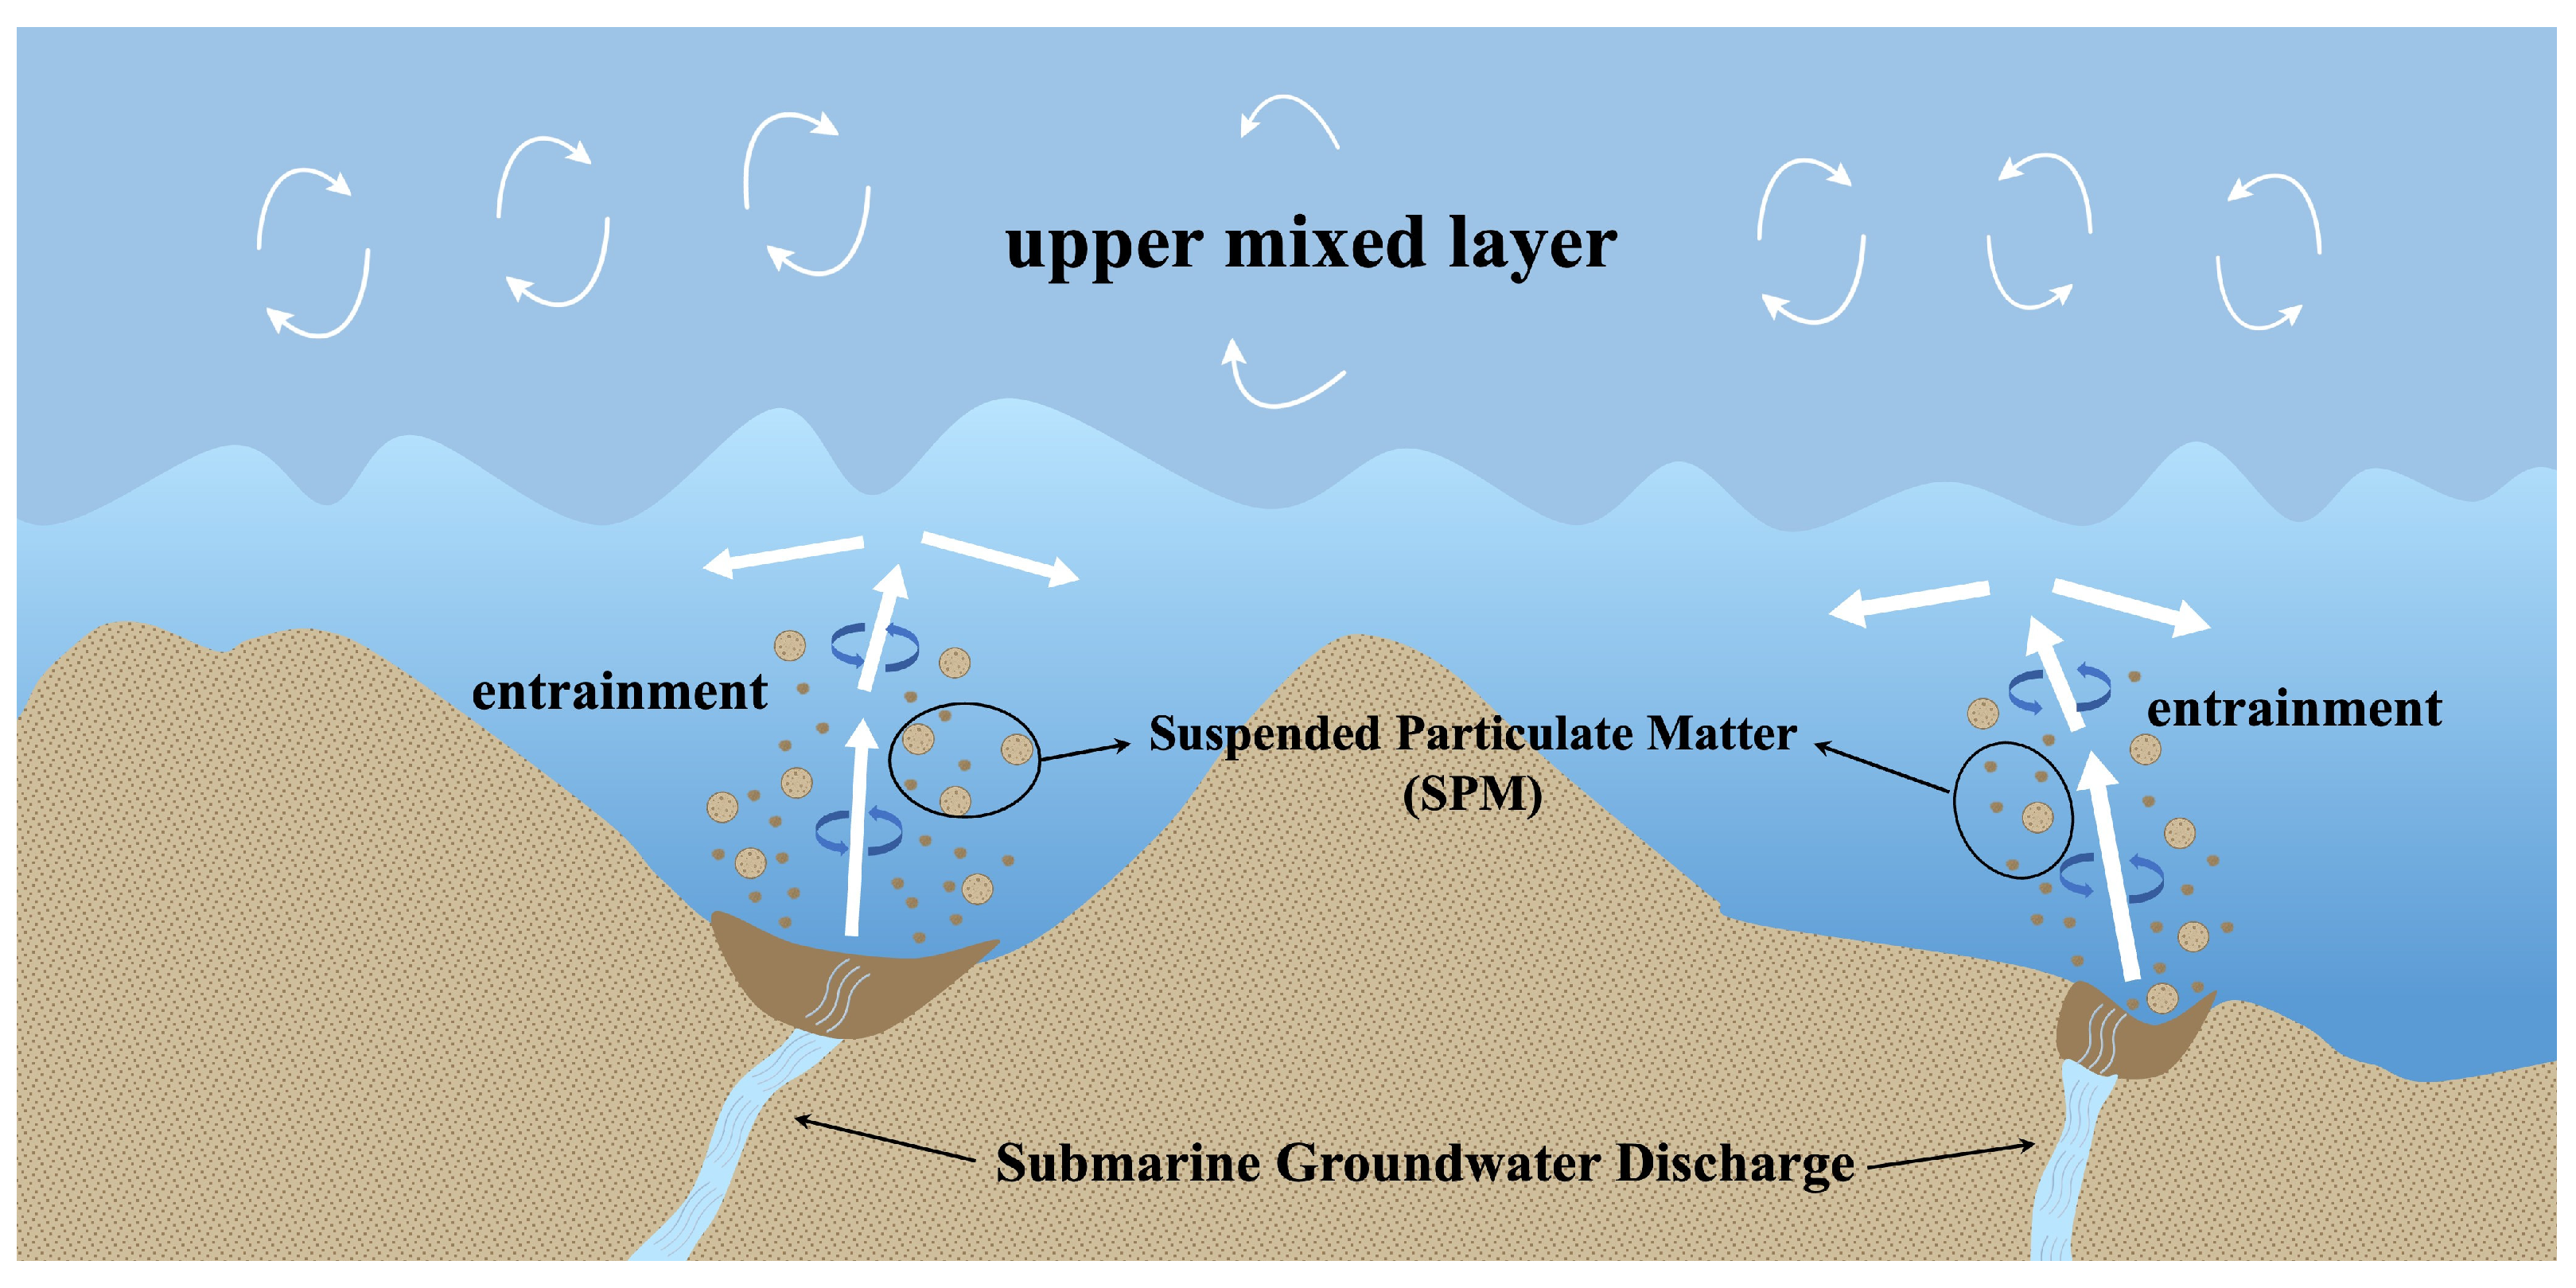
4.1. Turbulent Mixing and Sediment Impact Mechanisms

4.1.1. Plume Impact Mechanism

Studies in the southern Mediterranean have shown that SGD expels rapidly through narrow permeable pathways, forming vertical turbulent plumes strong enough to disturb the marine water stratification. This disturbance causes sediment particles to suspend and form sediment plumes near pockmarks, with these turbulence-induced plumes persisting from several hours to days [9].
As the plume rises, it mixes with the surrounding seawater, particularly at the plume boundaries where intense turbulent mixing occurs [63]. This mixing not only rapidly dilutes the substances within the plume but also induces local momentum dissipation, leading to a sharp decrease in plume velocity, thereby forming a relatively concentrated mixing layer above. This layer enhances local sediment shear, facilitating the transport and redistribution of fine particles and causing erosion, which provides the dynamic conditions necessary for the initial formation of pockmarks [64]. Particularly in low-flow seabed environments, turbulent plumes are strongly influenced by the surrounding still water. Coupled hydrodynamic–geomechanical models in COMSOL Multiphysics 5.0 (COMSOL Inc., Burlington, MA, USA) and FLAC 3D 5.0 (Itasca Consulting Group Inc., Minneapolis, MN, USA) can further simulate how sediment layers collapse into pockmarks in high-permeability zones or fracture zones [65].
Based on classical buoyant plume theory, Equation (2) was proposed to describe the buoyant flux of plumes, quantitatively illustrating how density differences caused by SGD drive the ascent of plumes and provide initial conditions for subsequent turbulent mixing [15].
B = g ρ ρ 0 Q
where B   represents buoyancy flux, g   represents gravitational acceleration, ρ ρ 0   represents the relative density contrast between fluid and seawater, and Q   represents SGD flux.
Turbulence directly controls chemical mixing processes and impacts reaction rates, making the concentration and isotopic fractionation behaviors within plumes serve as crucial indicators of SGD processes [66]. The turbulent plume model connects SGD-induced dynamical and chemical mixing processes, utilizing quantitative chemical tracer data to validate these interactions. This model elucidates why localized SGD can still trigger sediment redistribution and lead to the formation of pockmarks, even under conditions of low surface flow velocities.
Turbulent mixing enhances the suspension capacity of sediment particles, entraining sediments initially accumulated along the margins of pockmarks into the water column continuously (Figure 2). These suspended particles resettle in areas of lower turbulence, gradually expanding the edges of the pockmarks and potentially forming new small pockmarks downstream [67,68]. Studies have shown that pockmarks influenced by SGD exhibit steeper edge slopes and more pronounced sediment redistribution characteristics compared to those not influenced by SGD [69].

4.1.2. Sediment Property Control Mechanism

Different sedimentary environments exhibit varied fluid migration modes and associated pockmark formation and evolution patterns. Properties of sediments, including permeability, porosity, stratification, and mineral composition, are critical considerations. In high-permeability sandy facies, SGD rates are high and flow speeds are rapid; in contrast, clay or muddy areas, despite low permeability, can also experience strong localized seepage due to fractures or a thin sand interlayer.
  • Sandy/Gravelly Sedimentary Environments
In sandy and gravelly areas, high permeability allows SGD to form high-velocity seepage zones at the seafloor. Studies like those by da Rocha in Brazil’s Ubatuba coast and southern sandy regions have used radon activity experiments to find that SGD fluxes can reach 0.46 m/d in sandy areas, compared to only 0.03 m/d to 0.04 m/d in clay areas, indicating more active salt–freshwater exchange processes in sandy environments [70]. In the Hanko region of Finland, researchers using seismic profiles and high-resolution acoustic detection techniques determined that pockmarks predominantly distributed in sandy sediment layers, with clay layers less affected [71]. This is attributed to the high-permeability zones providing extensive flow paths for SGD, leading to localized leakage points where water flow erodes the sediment, making the loosely bound particles or weakly cemented structures prone to deformation and collapse, subsequently resulting in pockmark phenomena [72].
  • Clay/Silt Sedimentary Environments
In clay or silt layers, low permeability generally results in slower groundwater flow speeds, making widespread dispersal difficult. However, acoustic observations and hydrochemical signals indicate that pockmarks can still occur in these settings [73]. For instance, if well-developed fractures or sandy layers are present within the mud, they can promote the formation of localized high-permeability channels where deep fluids concentrate and surge upward, easily forming point-like pockmarks on the overlying mud layer [10]. Additionally, studies by Andresen have shown that in cohesive sediment environments, pockmarks at freshwater discharge points harbor long-active microbial processes that facilitate solute transformations and mineral precipitation, processes that influence sediment dissolution and further drive pockmark evolution [74].
  • Influence of Sedimentary bedding Characteristics
In regions like the Baltic Sea and along the Atlantic coast with multi-period sedimentary backgrounds, interlayering of sand and mud forms small-scale interlayer lenses or water-bearing zones. When groundwater flows through these thin layers, local “jets” can form even if overall permeability is low [75]. In polar regions, till clay often contains microfractures and cleavage structures that provide ample pathways for vertical fluid migration, promoting intermittent distributions of pockmarks [73].

4.2. Coupling Mechanisms of SGD and Gas Hydrate Dissociation

High-flux SGD can increase pore fluid pressures within sediments, resulting in the formation of overpressure zones due to the presence of gas-bearing fluids. Such overpressure and fluid escape not only compromise sediment structural integrity but also, through gas expansion and hydrodynamic forces, induce localized erosion, initiating the formation of pockmarks [76,77].
Furthermore, disturbances from SGD can trigger the decomposition and desorption of gas hydrates, resulting in upward gas migration and localized fluidization effects. This process facilitates mineral dissolution and precipitation within seafloor sediments. Notably, the interaction between methane and freshwater can create reducing conditions in the depositional environment [78], thereby decreasing sediment density and mechanical stability and promoting further sediment removal. When combined with external hydrodynamic forces such as tides or storm waves, these processes can accelerate the evolution of pockmarks and expand their spatial extent [79].
Eckernförde Bay in the Baltic Sea exemplifies such impacts. In this region, SGD has been observed to enhance the decomposition of methane hydrates within sediments, leading to rapid gas release. The resultant buoyancy effects reduce sediment density, making the seafloor more susceptible to pockmark formation and further facilitating gas escape [80].
The cyclic feedback mechanisms are particularly pronounced in regions with abundant gas hydrate reserves. In the Gulf of Guinea in Nigeria, the use of seafloor drilling, Infrared Thermography (IRT), and pore water Cl concentration monitoring allowed the discovery of a cyclical mechanism in the evolution of pockmarks involving gas hydrates [81]:
  • Stage A—fluids rich in methane migrate upwards, beginning to crystallize within the stability zone of the hydrates. These hydrates accumulate along existing fractures or weak planes in the sediments and rapidly block fluid channels.
  • Stage B—as fluid flow diminishes, hydrates at the top dissolve, leading to sediment volume contraction or structural instability, resulting in pockmark formation.
  • Stage C—when fluid flow intensifies or changes direction, new channels are formed. Hydrates rapidly crystallize within these fractures, accompanied by localized uplift of the seafloor.
  • Stage D—if fluid flow further emerges at surrounding locations, it can cause multiple small pockmarks to merge or evolve simultaneously, forming more complex groups of pockmarks.
Temperature probes have revealed that the heat flow values at the center of the pockmarks can reach up to 258 °C/km, three to five times the background value, indicating that fluid upwelling leads to enhanced thermal convection and the formation and decomposition of hydrates [82,83,84]. This further regulates the sediment structural characteristics and the spatial morphology of pockmarks.

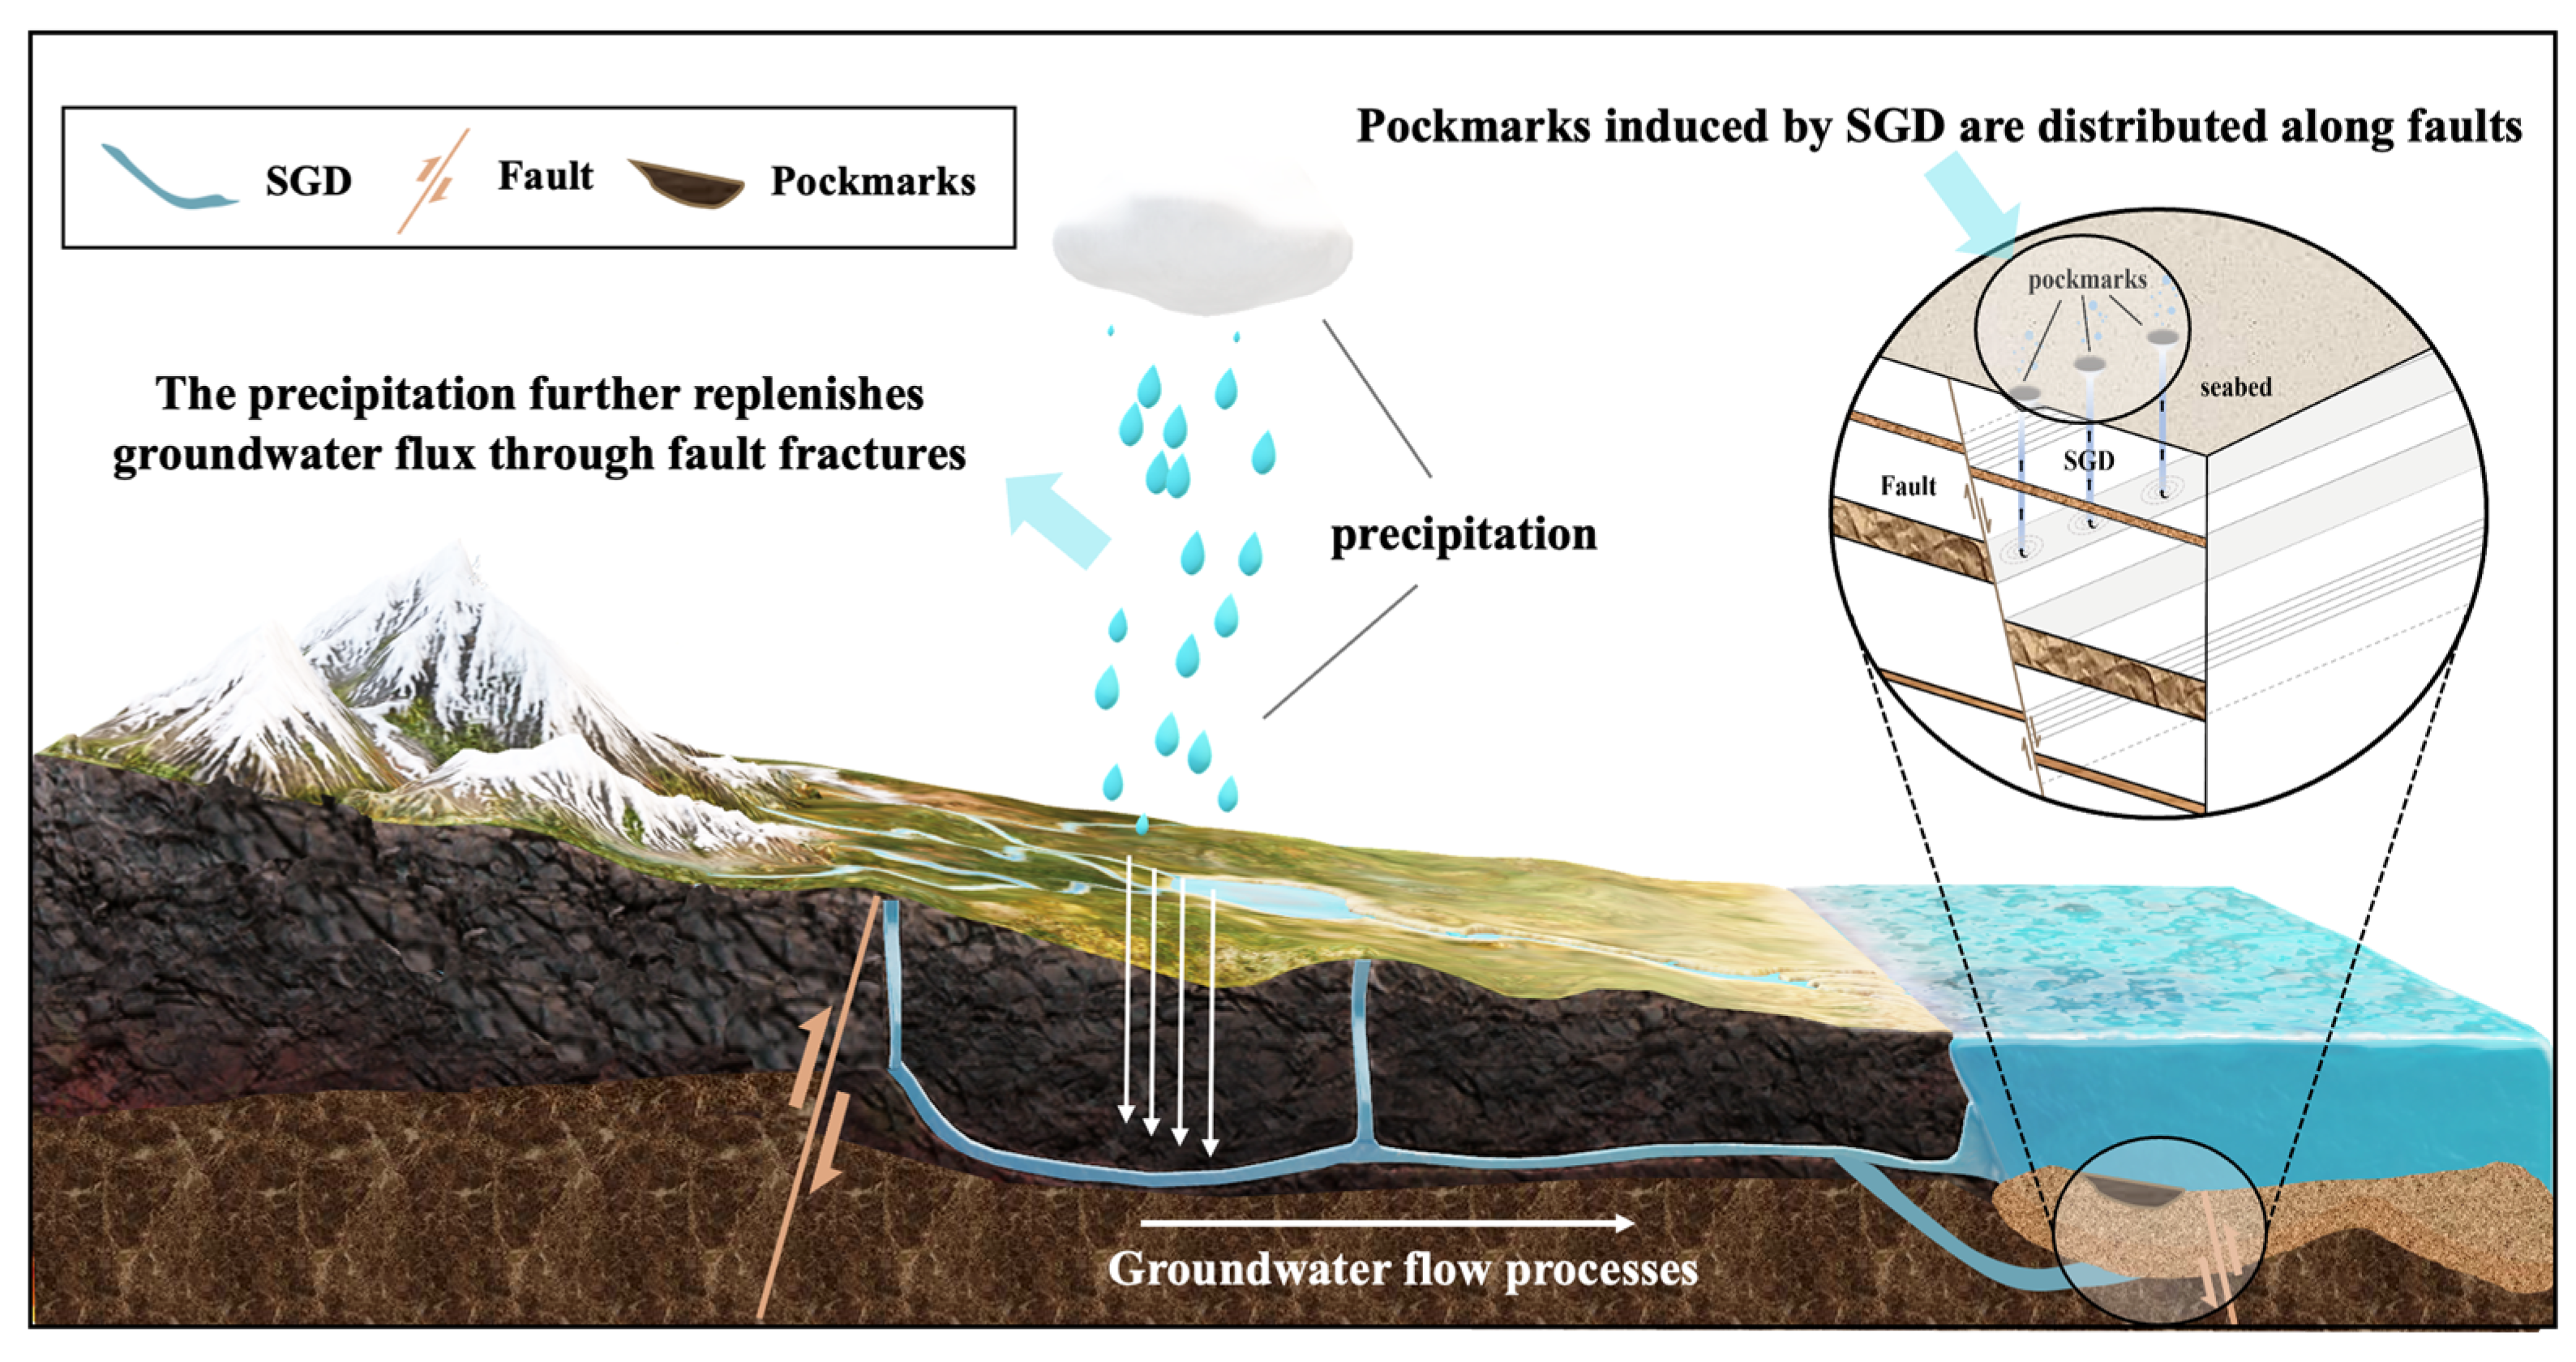
4.3. Coupling Mechanisms of SGD and Tectonic Activity

During crustal movements, the dynamics of fault activity, hydrothermal processes, and tectonic uplift not only define the geomorphology of terrestrial and marine boundaries but also influence the spatial and temporal distribution of SGD. These geological processes consequently play a crucial role in regulating the formation and evolution of pockmarks [85,86].
Zhou et al. estimated groundwater recharge using parameters such as precipitation, evaporation, and surface infiltration. They defined coastal recharge zones and employed a water balance model to quantitatively assess SGD flux, uncovering the synergistic effects of tectonic movements and climatic conditions on submarine groundwater discharge. Their findings indicate that SGD fluxes in active margin areas are approximately twice those in passive margin areas [8]. In a parallel study, Andrews et al. utilized high-resolution bathymetric data from Belfast Bay, ME, USA, to identify 1767 pockmarks, about half of which are linearly aligned in patterns that coincide with the gradients of Holocene sediment thickness and the orientations of tectonic faults [87]. Furthermore, research by Cardenas et al. in the volcanic tectonically active Calumpan Peninsula, Philippines, employed δ 2 , H δ 18 O , and 222Rn tracers and chemical ion analyses. Their studies highlighted pronounced SGD sites along fault zones associated with volcanic hydrothermal activities, resulting in complex interactions between groundwater and seawater [17].
This research method was also applied by Ikonen et al. in the Hanko SGD zone along the southern coast of Finland, where they utilized measurements of δ 2 H and δ 18 O in groundwater ( δ g w ) and seawater ( δ s w ) to establish a mass balance model for the observed δ values ( δ o b s ) under ideal mixing conditions (Equation (3)). This model was used to investigate the water mixing characteristics within different pockmarks, further validated using Cl concentrations to ascertain the water mixing ratio [60].
δ o b s = f δ g w + 1 f δ s w
where   δ o b s   represents the Isotopic Observed Value. δ g w   represents the Groundwater Endmember Isotopic Value. δ s w   represents the Seawater Endmember Isotopic Value. f represents the Groundwater Contribution Ratio.
To further quantify the groundwater discharge flux, Schlüter et al. developed a mass balance-based model for estimating groundwater discharge in Eckernförde Bay by measuring the concentration of 222Rn, a radioactive tracer, in both the seabed sediments and the water column [69]. This approach is predicated on the higher concentrations of 222Rn in groundwater, which decrease in seawater due to decay and mixing effects. The model is represented by Equation (4).
Q = λ A I c
where Q   represents SGD flux. λ   represents the Decay Constant of 222Rn. A represents the area of the bay. I   is the mean excess 222Rn inventory computed from water column profiles. c   represents 222Rn concentration in groundwater.
Due to the barrier effect of seabed sediments on the release of 222Rn, the concentrations measured directly in the water body can be skewed by adsorption and re-release from the sediments. To adjust for these discrepancies, parameters including sediment porosity α and a sediment release coefficient E   have been introduced [69]. The correction formula (Equation (5)) is structured as follows:
C p w = r g E 1 α α
where C p w represents the Corrected Pore Water 222Rn Concentration. α represents porosity. r g represents grain density. E   represents the emanation rate. α   represents porosity.
From a mechanistic perspective, tectonic uplift and fault activity in active margin regions induce pronounced coastal topographic variations, establishing elevated hydraulic gradients that drive sustained, high-velocity SGD (Figure 3). This process significantly alters local seabed hydrodynamic conditions, thereby intensifying the accumulation of pore water pressure within sediment layers [88,89]. When this pressure exceeds the effective stress between sediment particles, sediment liquefaction occurs, leading to instability and the subsequent formation of pockmarks. Additionally, in regions with active tectonic movements characterized by high precipitation and rapid weathering rates, SGD rates are generally higher [8]. This indicates that tectonic movements facilitate the development of weathering and erosion phenomena on the surface, providing efficient pathways for precipitation to infiltrate underground. This further enhances groundwater recharge, driving groundwater to flow rapidly towards the ocean along shorter paths [90]. Conversely, arid mid-latitude regions exhibit significantly lower SGD fluxes due to sparse precipitation and gentle topography.

4.4. Seasonal Influences on SGD-Induced Pockmark Mechanisms

Variations in precipitation and tidal dynamics across different seasons lead to differentiated development in the processes and fluxes of SGD. Matciak et al. observed seasonal fluctuations in SGD by measuring chloride concentrations in pore water collected during different seasons at the same site [61]. Specifically, the rainy season brings substantial precipitation, elevating the groundwater head and thereby increasing the flux of FSGD to about 30% of the total; in contrast, during the dry season, the freshwater supply is relatively insufficient, dropping to as low as 1% [91]. These seasonal variations in hydraulic gradients are key factors causing significant fluctuations in SGD across different seasons [92].
Tidal processes are also intertwined with seasonal variations in SGD. This is because the variability in tidal amplitude is intricately linked to the lunar phases and seasonal meteorological conditions, including monsoons, which significantly influence the volume of seawater circulation. When tidal ranges are large, the infiltration of seawater into the terrestrial aquifer significantly increases, and when combined with abundant precipitation during the rainy season, it can further enhance the SGD flux [90]. During the dry season, tides can drive a considerable amount of seawater to repeatedly infiltrate shallow sediments, thus maintaining RSGD [93].
Furthermore, seasonal differences in water temperature can also affect the density and viscosity of seawater and freshwater within aquifers [94], thereby influencing their mixing and flow. In high-latitude areas, submarine seepage activities have a unique mechanism—ice rafting. Paull et al. found that the spatial distribution of continental shelf pockmarks at high latitudes corresponds to areas where the seabed water temperature is below 0 °C. Here, upward-moving freshwater freezes into ice lenses at the sediment–water interface. Under the influence of buoyancy, these ice bodies encapsulate surface sediments, detaching from the seabed and being transported by bottom currents to form pockmarks [95].
Overall, seasonal rainfall influences underground aquifer pressures, inducing periodic pressure pulses in SGD. Notably, when SGD flux reaches its peak, there is an intensified erosion and transport of fine-grained sediments. This process, coupled with tidal actions and storm surges, amplifies the formation of pockmarks through cumulative geomorphic feedbacks. Conversely, during periods of reduced flow, pockmarks are more prone to sediment infill, resulting in a gradual decrease in their dimensions.

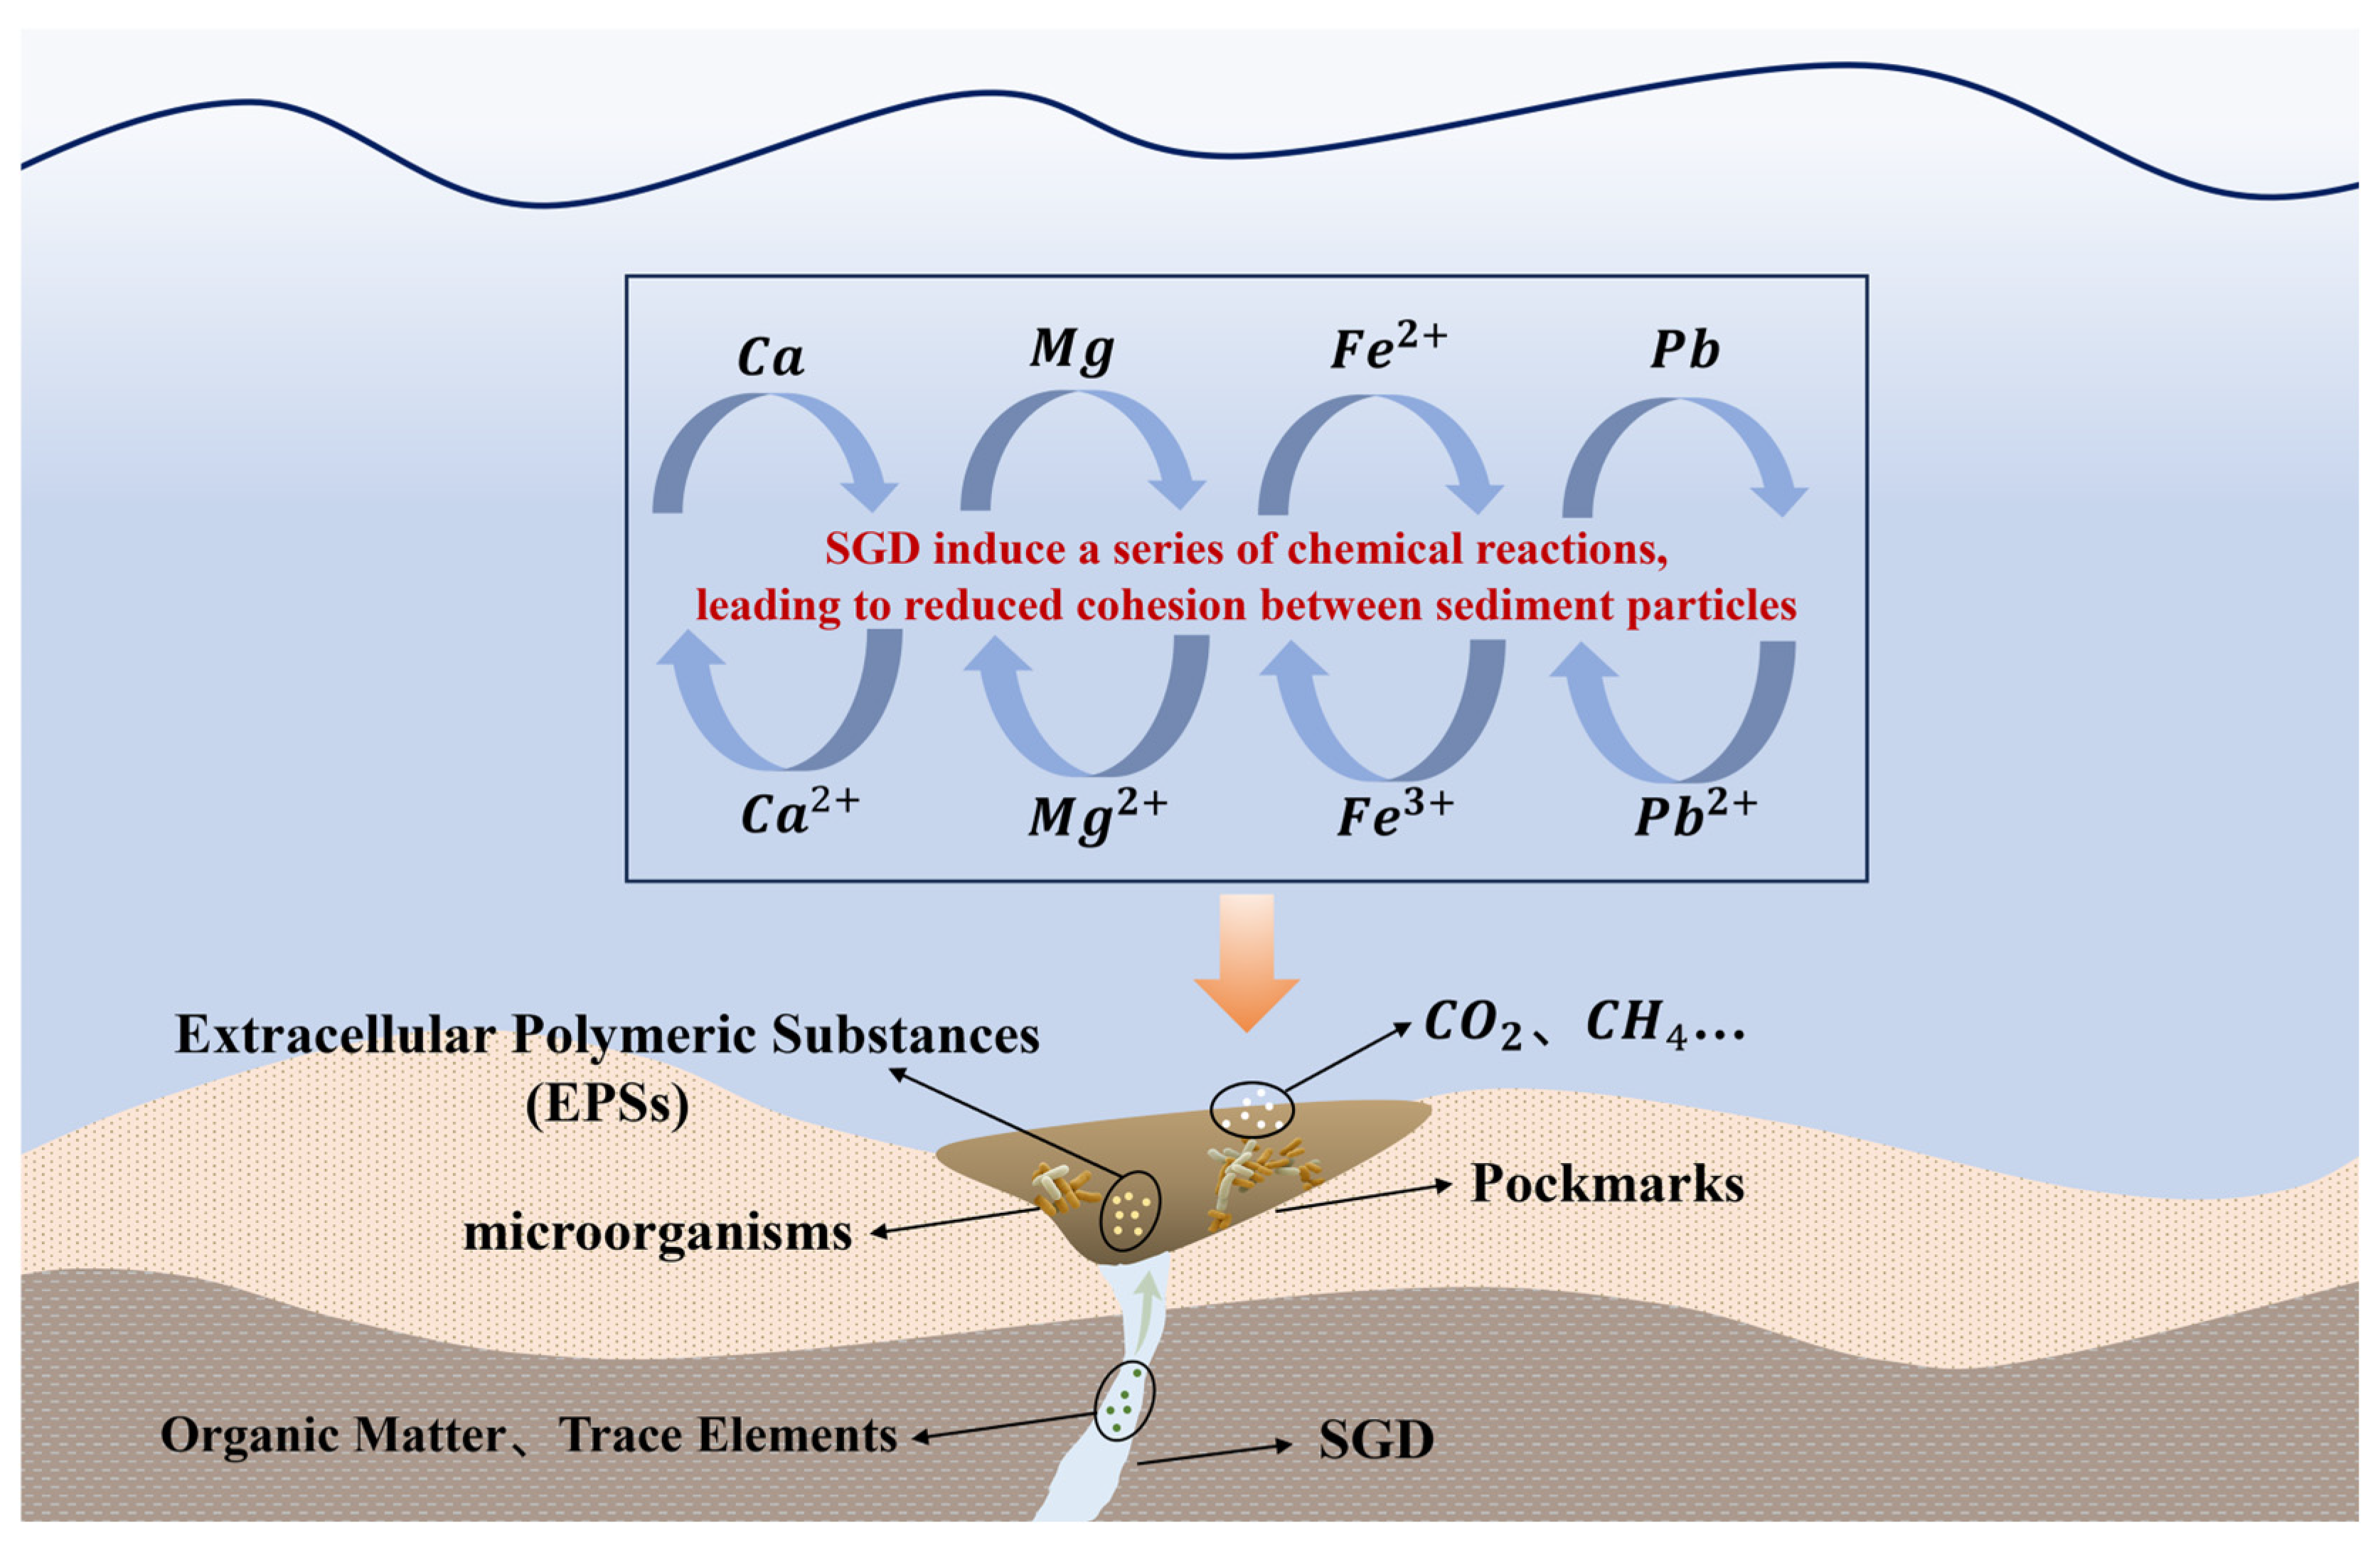
4.5. SGD-Driven Biogeochemical Coupling Mechanisms

4.5.1. Chemical Dissolution Mechanisms

In submarine groundwater discharge areas, when FSGD enters the high-salinity marine environment, a distinct salinity gradient is formed, leading to significant ion exchange and chemical precipitation [96]. Moreover, the high concentrations of dissolved inorganic carbon (DIC) it carries cause a localized decrease in pH levels upon entering the ocean. This process, by promoting the dissolution of carbonate rocks and cementing minerals, weakens the cohesion among sediment particles, reducing the mechanical strength of the sediment layers. This degradation of sediment structure makes it more susceptible to destabilization by fluid disturbances, thereby facilitating the initial formation of pockmarks [97,98]. Evans and Lizarralde et al. identified areas of pronounced karstification and high porosity along the seabed off the coast of North Carolina [99]. The passage of groundwater through these calcareous layers activated karst processes, consequently increasing pore volumes, which led to the development of interconnected fractures and dissolution channels. This augmentation in fluid flux establishes a positive feedback mechanism, potentially supporting the progressive enlargement of pockmarks.
Research in the SGD area of Eckernförde Bay in the Baltic Sea found that the Cl concentration in sediment pore water is 10–30% lower than in the surrounding seawater, and the spatial distribution of pockmarks in this area corresponds precisely with the regions of low chloride ion concentrations [69,100]. This indicates that the submarine groundwater discharge process carries a higher proportion of freshwater, thereby altering the chemical environment of the sediment pore water, leading to changes in sediment layer minerals and promoting the formation of pockmarks. The 87Sr/86Sr isotopic ratio is commonly used to distinguish between freshwater and seawater. In pockmarks dominated by groundwater, the 87Sr/86Sr ratios are often higher than in marine environments [69,100].
Studies of the groundwater–seawater mixing zone in Waquoit Bay have shown that groundwater in low-salinity areas contains relatively low concentrations of dissolved inorganic carbon (DIC). However, as groundwater mixes with seawater, the DIC concentrations in medium-to-high-salinity areas exhibit non-conservative mixing characteristics and significantly increase in high-salinity regions. This phenomenon indicates that during the process of submarine groundwater discharge, biogeochemical reactions such as aerobic respiration and nitrate reduction promote the further decomposition of organic matter in sediments and release CO2, thereby increasing the DIC flux. Research by Liu et al. points out that the DIC flux brought about by SGD is approximately 40% to 50% higher in summer than in winter and consistently exceeds the corresponding total alkalinity flux. This not only reduces the CO2 buffering capacity of seawater but also alters the carbonate balance in coastal areas [97]. A study in Hainan Chaoxi, China, utilizing the 222Rn tracing technique to quantify the SGD flux, reveals that the proportion of dissolved inorganic carbon discharged through submarine groundwater discharge accounts for up to 98% of the total dissolved carbon, with an average flux of approximately 0.107 kg m−4 d−1 [101]. These data further indicate that SGD plays a significant role in regulating the acid–base balance of the marine environment.
The aforementioned mechanisms not only lead to the dissolution of carbonate cement in sediments, reducing interparticle cohesion, but also cause significant changes in porosity and permeability within hydrocarbon reservoirs. For example, research by Luo et al. found that CO2-enriched fluids caused the dissolution of carbonate cements, increasing porosity from an initial value of about 3% to 28% and multiplying permeability several times [98]. This phenomenon is particularly pronounced in deep, high-temperature, high-pressure reservoirs. Although this mechanism has a positive impact on enhancing hydrocarbon production rates, it also increases local instability under fluid dynamic effects.
Comparative analyses across different regions and seasons reveal that the chemical characteristics of SGD and its associated reaction processes play a crucial regulatory role in the carbonate balance of the ocean’s surface layer. This regulation creates a favorable chemical environment for the formation and evolution of pockmarks.

4.5.2. Biological Activity Effects

SGD transports nutrients, organic matter, and trace elements into the ocean, leading to a relatively eutrophic environment in the coastal aquifer regions. This enrichment affects the structure and metabolic processes of microbial communities in the sediments and provides favorable conditions for microbial growth [102]. Microbial life activities not only regulate SGD flux but also influence the geological medium, causing changes in pore water pressure that indirectly affect the formation and evolution of pockmarks [74]. Specifically, heterotrophic microbes in coastal aquifers mediate redox reactions through the microbial respiration effect, impacting the sediment pore structure through the microbial clogging effect (Table 2).
Research conducted by Idczak et al. demonstrates that within a pockmark located in the deep-water area of the Gulf of Gdańsk (SE Baltic Sea, Europe), there is an unusual microbial community structure, and the gas components detected within the pockmarks are primarily composed of methane; the isotopic characteristics suggest that it is predominantly produced by microbial activity [100]. This observation indicates that SGD influences various aspects of the microbial environment, including the distribution of electron acceptors for microbial metabolism, ion balance, and the decomposition rates of organic material [103,104]. In response to these environmental shifts, microbial communities initiate anaerobic reactions that produce gas. The gas accumulation then further reduces the sediment’s cohesive strength, indirectly impacting the formation of pockmarks [74].
The heightened microbial activity results in the secretion of extracellular polymeric substances (EPSs), which occupy sediment pores, thereby reducing both porosity and permeability and consequently initiating a bioclogging effect (Figure 4). This effect significantly alters the flow paths of fluids [105]. Specifically, when biological adhesives obstruct permeation pathways, groundwater may redirect to other channels that offer the path of least energy dissipation. This redirection forms localized high-velocity zones on the seabed, concentrating flow and increasing velocity in these areas. If geological weak zones are present, this dynamic can lead to the erosion of seabed sediments and the subsequent formation of pockmarks [71,87]. From a mechanistic perspective, the localized surging of groundwater not only dissolves soluble components such as carbonates and silicates but also reduces the effective stress between sediment particles, exposing the previously stable sediment structure to higher hydrostatic pressure and more intense chemical erosion, thereby facilitating the formation of pockmarks.
During the process of SGD, the aforementioned biogeochemical activities can result in non-conservative isotopic mixing. Consequently, when employing isotopic models for quantitative analysis of SGD, the isotope ratios no longer conform to a linear mixing relationship, necessitating the formulation of a corrective model [66]. For example, in the Hanko SGD area, researchers noted significant deviations in δ 7 L i and δ 34 S during the groundwater–seawater mixing process. To accommodate these changes, a correction model (Equation (6)) was employed to further refine calculation accuracy [60].
δ = δ o b s δ m i x
where δ represents the isotopic deviation. δ o b s represents the observed isotope composition.   δ m i x   represents the conservative mixing (theoretical) value.
Submarine groundwater discharge influences the chemical characteristics of pore water within sediments and alters the stability of sedimentary layers through processes of dissolution, mineral precipitation, and biological activity. Consequently, these changes indirectly affect the formation and evolution of pockmarks.

5. Conclusions and Prospects

5.1. Conclusions

  • The evolution of pockmarks follows a cyclical pattern characterized by phases of initiation, expansion, stabilization, and decline. Their varied geometric forms can be more effectively quantified using the diameter/depth ratio as a descriptive indicator.
  • SGD drives both the turbulent mixing mechanisms and the cyclical activities of gas hydrates, furnishing the dynamic conditions essential for the initial formation and progressive expansion of pockmarks. Tectonic activity facilitates this process by inducing crustal uplift and fault dynamics, and by accelerating the weathering and erosion of surface rocks. These geological processes create efficient pathways for precipitation infiltration into the subsurface, thereby catalyzing the development of pockmarks.
  • SGD drives the formation and evolution of pockmarks through interconnected chemical and biological mechanisms. Chemically, the influx of dissolved inorganic carbon reduces the pH of pore water, which accelerates mineral dissolution. Biologically, SGD facilitates microbial activity by supplying essential nutrients, initiating a cascade of biochemical reactions. These coupled mechanisms collectively destabilize the sediment, thereby shaping the formation and evolution of submarine pockmark topography.

5.2. Prospects

  • In the context of global climate change, it is imperative to further investigate whether the correlation between sea level rise and variations in SGD flux, driven by climatic change, could heighten the risk of pockmark formation in coastal areas.
  • Analyses of microbial community structures should be conducted to identify biologically driven corrosion and methanogenesis processes. Machine learning models should be utilized to perform long-term time-series analyses, investigating potential anomalous patterns and triggering mechanisms within multi-source data. This approach aims to elucidate the microbial coupling mechanisms involved in the formation process of SGD-induced pockmarks.
  • It is recommended to incorporate the mechanism of pockmarks induced by SGD into risk assessments for marine spatial planning, coastal zone management, and offshore engineering projects. Additionally, international marine organizations are encouraged to advance global cooperative projects for monitoring SGD along coastlines and continental shelves.

Author Contributions

Conceptualization, H.S. and X.F.; supervision, C.Z. and X.F.; writing—original draft, Z.Z.; writing—review and editing, Z.Z., X.F., Z.J., L.J., S.W. and C.Z. All authors have read and agreed to the published version of the manuscript.

Funding

This research was funded by the project of National Natural Science Foundation of China (NO. 42277137), the project of National Natural Science Foundation of China (NO. 42207173), the Shandong Provincial Natural Science Foundation (NO. ZR2022QD002), and the Shandong Provincial Youth Innovation Team Program (NO. 2024KJH183).

Data Availability Statement

Not applicable.

Conflicts of Interest

The authors declare no conflicts of interest.

References

  1. Burnett, W.C.; Bokuniewicz, H.; Huettel, M.; Moore, W.S.; Taniguchi, M. Groundwater and Pore Water Inputs to the Coastal Zone. Biogeochemistry 2003, 66, 3–33. [Google Scholar] [CrossRef]
  2. Santos, I.R.; Chen, X.; Lecher, A.L.; Sawyer, A.H.; Moosdorf, N.; Rodellas, V.; Tamborski, J.; Cho, H.-M.; Dimova, N.; Sugimoto, R.; et al. Submarine Groundwater Discharge Impacts on Coastal Nutrient Biogeochemistry. Nat. Rev. Earth Environ. 2021, 2, 307–323. [Google Scholar] [CrossRef]
  3. Lee, Y.-W.; Hwang, D.-W.; Kim, G.; Lee, W.-C.; Oh, H.-T. Nutrient Inputs from Submarine Groundwater Discharge (SGD) in Masan Bay, an Embayment Surrounded by Heavily Industrialized Cities, Korea. Sci. Total Environ. 2009, 407, 3181–3188. [Google Scholar] [CrossRef]
  4. Knee, K.L.; Paytan, A. 4.08—Submarine Groundwater Discharge: A Source of Nutrients, Metals, and Pollutants to the Coastal Ocean. In Treatise on Estuarine and Coastal Science; Wolanski, E., McLusky, D., Eds.; Academic Press: Waltham, MA, USA, 2011; pp. 205–233. ISBN 978-0-08-087885-0. [Google Scholar]
  5. Tait, D.R.; Sippo, J.Z.; Jeffrey, L.C.; Maher, D.T.; Mukherjee, A.; Ralph, C.; Das, K. Groundwater Discharge and Bank Overtopping Drive Large Carbon Exports from Indian Sundarban Mangroves. Sci. Total Environ. 2024, 955, 176463. [Google Scholar] [CrossRef]
  6. Moody, A.; Moore, W.S.; Pierce, T.; Shiller, A.M. The Effects of Submarine Groundwater Discharge and the Bonnet Carré Spillway on Nutrient Dynamics in the Western Mississippi Sound. Sci. Total Environ. 2024, 953, 176080. [Google Scholar] [CrossRef]
  7. Xue, Y.; Zhang, Y.; Zhang, M.; Wang, X.; Xiao, K.; Luo, M.; Li, H. Submarine Groundwater Discharge and Associated Metal Elements into an Urbanized Bay. Mar. Pollut. Bull. 2023, 192, 115092. [Google Scholar] [CrossRef]
  8. Zhou, Y.; Sawyer, A.H.; David, C.H.; Famiglietti, J.S. Fresh Submarine Groundwater Discharge to the Near-Global Coast. Geophys. Res. Lett. 2019, 46, 5855–5863. [Google Scholar] [CrossRef]
  9. Oehler, T.; Mogollón, J.M.; Moosdorf, N.; Winkler, A.; Kopf, A.; Pichler, T. Submarine Groundwater Discharge within a Landslide Scar at the French Mediterranean Coast. Estuar. Coast. Shelf Sci. 2017, 198, 128–137. [Google Scholar] [CrossRef]
  10. Ehlert Von Ahn, C.M.; Dellwig, O.; Szymczycha, B.; Kotwicki, L.; Rooze, J.; Endler, R.; Escher, P.; Schmiedinger, I.; Sültenfuß, J.; Diak, M.; et al. Submarine Groundwater Discharge into a Semi-Enclosed Coastal Bay of the Southern Baltic Sea: A Multi-Method Approach. Oceanologia 2024, 66, 111–138. [Google Scholar] [CrossRef]
  11. King, L.H.; MacLean, B. Pockmarks on the Scotian Shelf. GSA Bull. 1970, 81, 3141–3148. [Google Scholar] [CrossRef]
  12. Hovland, M.; Talbot, M.R.; Qvale, H.; Olaussen, S.; Aasberg, L. Methane-Related Carbonate Cements in Pockmarks of the North Sea. J. Sediment. Res. 1987, 57, 881–892. [Google Scholar]
  13. Webb, K.E.; Hammer, Ø.; Lepland, A.; Gray, J.S. Pockmarks in the Inner Oslofjord, Norway. Geo-Mar. Lett. 2009, 29, 111–124. [Google Scholar] [CrossRef]
  14. Ramos, R.B.; Dos Santos, R.F.; Schattner, U.; Figueira, R.C.L.; Bícego, M.C.; Lobo, F.J.; De Mahiques, M.M. Deep Pockmarks as Natural Sediment Traps: A Case Study from Southern Santos Basin (SW Atlantic Upper Slope). Geo-Mar. Lett. 2020, 40, 989–999. [Google Scholar] [CrossRef]
  15. Nardelli, B.B.; Budillon, F.; Watteaux, R.; Ciccone, F.; Conforti, A.; De Falco, G.; Di Martino, G.; Innangi, S.; Tonielli, R.; Iudicone, D. Pockmark Morphology and Turbulent Buoyant Plumes at a Submarine Spring. Cont. Shelf Res. 2017, 148, 19–36. [Google Scholar] [CrossRef]
  16. Jakobsson, M.; O’Regan, M.; Mörth, C.-M.; Stranne, C.; Weidner, E.; Hansson, J.; Gyllencreutz, R.; Humborg, C.; Elfwing, T.; Norkko, A.; et al. Links between Baltic Sea Submarine Terraces and Groundwater Sapping. Earth Surf. Dyn. 2019, 8, 2020. [Google Scholar]
  17. Cardenas, M.B.; Rodolfo, R.S.; Lapus, M.R.; Cabria, H.B.; Fullon, J.; Gojunco, G.R.; Breecker, D.O.; Cantarero, D.M.; Evaristo, J.; Siringan, F.P.; et al. Submarine Groundwater and Vent Discharge in a Volcanic Area Associated with Coastal Acidification. Geophys. Res. Lett. 2020, 47, e2019GL085730. [Google Scholar] [CrossRef]
  18. Nelson, C.S.; Healy, T.R. Pockmark-like Structures on the Poverty Bay Sea Bed—Possible Evidence for Submarine Mud Volcanism. N. Z. J. Geol. Geophys. 1984, 27, 225–230. [Google Scholar] [CrossRef]
  19. Hasiotis, T.; Papatheodorou, G.; Kastanos, N. A Pockmark Field in the Patras Gulf (Greece) and Its Activation during the 14/7/93 Seismic Event. Mar. Geol. 1996, 130, 333–344. [Google Scholar] [CrossRef]
  20. Soter, S. Macroscopic Seismic Anomalies and Submarine Pockmarks in the Corinth–Patras Rift, Greece. Tectonophysics 1999, 308, 275–290. [Google Scholar] [CrossRef]
  21. Baraza, J.; Ercilla, G.; Nelson, C.H. Potential Geologic Hazards on the Eastern Gulf of Cadiz Slope (SW Spain). Mar. Geol. 1999, 155, 191–215. [Google Scholar] [CrossRef]
  22. Singhroha, S.; Schramm, B.; Plaza-Faverola, A.; Domel, P.; Dannowski, A.; Cooke, F.; Bünz, S. Stress Constraints from Shear-Wave Analysis in Shallow Sediments at an Actively Seeping Pockmark on the W-Svalbard Margin. Earth Space Sci. 2023, 10, e2023EA003068. [Google Scholar] [CrossRef]
  23. Vaknin, I.; Aharonov, E.; Holtzman, R.; Katz, O. Gas Seepage and Pockmark Formation from Subsurface Reservoirs: Insights from Table-Top Experiments. J. Geophys. Res. Solid Earth 2024, 129, e2023JB028255. [Google Scholar] [CrossRef]
  24. Hovland, M.; Svensen, H.; Forsberg, C.F.; Johansen, H.; Fichler, C.; Fosså, J.H.; Jonsson, R.; Rueslåtten, H. Complex Pockmarks with Carbonate-Ridges off Mid-Norway: Products of Sediment Degassing. Mar. Geol. 2005, 218, 191–206. [Google Scholar] [CrossRef]
  25. Pilcher, R.; Argent, J. Mega-Pockmarks and Linear Pockmark Trains on the West African Continental Margin. Mar. Geol. 2007, 244, 15–32. [Google Scholar] [CrossRef]
  26. Nelson, H.; Thor, D.R.; Sandstrom, M.W.; Kvenvolden, K.A. Modern Biogenic Gas-Generated Craters (Sea-Floor “Pockmarks”) on the Bering Shelf, Alaska. GSA Bull. 1979, 90, 1144–1152. [Google Scholar] [CrossRef]
  27. Hovland, M.; Judd, A.G.; King, L.H. Characteristic Features of Pockmarks on the North Sea Floor and Scotian Shelf. Sedimentology 1984, 31, 471–480. [Google Scholar] [CrossRef]
  28. Fader, G.B.J. Gas-Related Sedimentary Features from the Eastern Canadian Continental Shelf. Cont. Shelf Res. 1991, 11, 1123–1153. [Google Scholar] [CrossRef]
  29. Practical Application of Offshore Site Hazard Surveys. Available online: https://www.researchgate.net/publication/255062453_practical_application_of_offshore_site_hazard_surveys (accessed on 21 April 2025).
  30. Çifçi, G.; Dondurur, D.; Ergün, M. Deep and Shallow Structures of Large Pockmarks in the Turkish Shelf, Eastern Black Sea. Geo-Mar. Lett. 2003, 23, 311–322. [Google Scholar] [CrossRef]
  31. Sun, Q.; Wu, S.; Hovland, M.; Luo, P.; Lu, Y.; Qu, T. The Morphologies and Genesis of Mega-Pockmarks near the Xisha Uplift, South China Sea. Mar. Pet. Geol. 2011, 28, 1146–1156. [Google Scholar] [CrossRef]
  32. León, R.; Somoza, L.; Medialdea, T.; Hernández-Molina, F.J.; Vázquez, J.T.; Díaz-del-Rio, V.; González, F.J. Pockmarks, Collapses and Blind Valleys in the Gulf of Cádiz. Geo-Mar. Lett. 2010, 30, 231–247. [Google Scholar] [CrossRef]
  33. Szpak, M.T.; Monteys, X.; O’Reilly, S.; Simpson, A.J.; Garcia, X.; Evans, R.L.; Allen, C.C.R.; McNally, D.J.; Courtier-Murias, D.; Kelleher, B.P. Geophysical and Geochemical Survey of a Large Marine Pockmark on the Malin Shelf, Ireland. Geochem. Geophys. Geosyst. 2012, 13, 2011GC003787. [Google Scholar] [CrossRef]
  34. Xu, C.; Xu, G.; Xing, J.; Sun, Z.; Wu, N. Research Progress of Seafloor Pockmarks in Spatio-Temporal Distribution and Classification. J. Ocean Univ. China 2020, 19, 69–80. [Google Scholar] [CrossRef]
  35. Dandapath, S.; Chakraborty, B.; Karisiddaiah, S.M.; Menezes, A.; Ranade, G.; Fernandes, W.; Naik, D.K.; Prudhvi Raju, K.N. Morphology of Pockmarks along the Western Continental Margin of India: Employing Multibeam Bathymetry and Backscatter Data. Mar. Pet. Geol. 2010, 27, 2107–2117. [Google Scholar] [CrossRef]
  36. Kvenvolden, K.A. Seafloor Discoveries: Seabed Pockmarks and Seepages. Impact on Geology, Biology and the Marine Environment. M. Hovland and A. G. Judd. Graham and Trotman, London, 1988 (U.S. Distributor, Kluwer, Norwell, MA). Xii, 293 pp., Illus. $117. Science 1989, 244, 590–591. [Google Scholar] [CrossRef]
  37. Gay, A.; Lopez, M.; Ondreas, H.; Charlou, J.L.; Sermondadaz, G.; Cochonat, P. Seafloor Facies Related to Upward Methane Flux within a Giant Pockmark of the Lower Congo Basin. Mar. Geol. 2006, 226, 81–95. [Google Scholar] [CrossRef]
  38. Rise, L.; Bellec, V.K.; Chand, S.; Bøe, R. Pockmarks in the Southwestern Barents Sea and Finnmark Fjords. Nor. J. Geol. 2014, 94, 4. [Google Scholar] [CrossRef]
  39. Asner, G.P.; Vaughn, N.R.; Heckler, J. Operational Mapping of Submarine Groundwater Discharge into Coral Reefs: Application to West Hawai‘i Island. Oceans 2024, 5, 547–559. [Google Scholar] [CrossRef]
  40. Bratton, J.F. The Three Scales of Submarine Groundwater Flow and Discharge across Passive Continental Margins. J. Geol. 2010, 118, 565–575. [Google Scholar] [CrossRef]
  41. Wang, X.; Baskaran, M.; Su, K.; Du, J. The Important Role of Submarine Groundwater Discharge (SGD) to Derive Nutrient Fluxes into River Dominated Ocean Margins—The East China Sea. Mar. Chem. 2018, 204, 121–132. [Google Scholar] [CrossRef]
  42. Kim, I.; Kim, G. Large Fluxes of Rare Earth Elements through Submarine Groundwater Discharge (SGD) from a Volcanic Island, Jeju, Korea. Mar. Chem. 2011, 127, 12–19. [Google Scholar] [CrossRef]
  43. Kim, G.; Ryu, J.-W.; Yang, H.-S.; Yun, S.-T. Submarine Groundwater Discharge (SGD) into the Yellow Sea Revealed by 228Ra and 226Ra Isotopes: Implications for Global Silicate Fluxes. Earth Planet. Sci. Lett. 2005, 237, 156–166. [Google Scholar] [CrossRef]
  44. Kwon, E.Y.; Kim, G.; Primeau, F.; Moore, W.S.; Cho, H.; DeVries, T.; Sarmiento, J.L.; Charette, M.A.; Cho, Y. Global Estimate of Submarine Groundwater Discharge Based on an Observationally Constrained Radium Isotope Model. Geophys. Res. Lett. 2014, 41, 8438–8444. [Google Scholar] [CrossRef]
  45. Zhang, Y.; Santos, I.R.; Li, H.; Wang, Q.; Xiao, K.; Guo, H.; Wang, X. Submarine Groundwater Discharge Drives Coastal Water Quality and Nutrient Budgets at Small and Large Scales. Geochim. Cosmochim. Acta 2020, 290, 201–215. [Google Scholar] [CrossRef]
  46. Abdelmaksoud, A.; Al-Suwaidi, A.H.; Ali, M.; Shah, A.; Almehairbi, S.S.; Al Ali, L.M.; Ali, M.Y. Evidence of Pockmarks and Seafloor Gas Venting in the Northwestern Arabian Sea. Commun. Earth Environ. 2025, 6, 41. [Google Scholar] [CrossRef]
  47. Schattner, U.; Lazar, M.; Souza, L.A.P.; Ten Brink, U.; Mahiques, M.M. Pockmark Asymmetry and Seafloor Currents in the Santos Basin Offshore Brazil. Geo-Mar. Lett. 2016, 36, 457–464. [Google Scholar] [CrossRef]
  48. Wang, L.; Zhao, F.; Miramontes, E. Origin and Evolution of Widespread Crescentic Pockmarks on the Western South China Sea Margin. Mar. Pet. Geol. 2024, 170, 107091. [Google Scholar] [CrossRef]
  49. Chao, C.; Pan, X.; Cai, F.; Chen, Q.; Zheng, Y.; Wu, C.; Song, Z.; Lu, H.; Bao, J. Characteristics of Pockmark Geomorphology in Gas Hydrate Occurrence Area and Its Geological Hazards Significance. Ocean Dev. Manag. 2018, 35, 52–55. [Google Scholar]
  50. Zhu, S.; Li, X.; Zhang, H.; Sha, Z.; Sun, Z. Types, Characteristics, Distribution, and Genesis of Pockmarks in the South China Sea: Insights from High-Resolution Multibeam Bathymetric and Multichannel Seismic Data. Int. Geol. Rev. 2021, 63, 1682–1702. [Google Scholar] [CrossRef]
  51. PG, J.L.R.; Pallister, B.J. Abstract: Characteristics and Significance of a Large Pockmark Field, Northern Offshore Trinidad; Geological Society of Trinidad and Tobago: Couva, Trinidad and Tobago, 2007. [Google Scholar]
  52. Lundine, M.A.; Brothers, L.L.; Trembanis, A.C. Deep Learning for Pockmark Detection: Implications for Quantitative Seafloor Characterization. Geomorphology 2023, 421, 108524. [Google Scholar] [CrossRef]
  53. Böttner, C.; Hoffmann, J.J.L.; Unverricht, D.; Schmidt, M.; Spiegel, T.; Geersen, J.; Müller, T.H.; Karstens, J.; Andresen, K.J.; Sander, L.; et al. The Enigmatic Pockmarks of the Sandy Southeastern North Sea. Geochem. Geophys. Geosyst. 2024, 25, e2024GC011837. [Google Scholar] [CrossRef]
  54. Yu, K.; Miramontes, E.; Alves, T.M.; Li, W.; Liang, L.; Li, S.; Zhan, W.; Wu, S. Incision of Submarine Channels over Pockmark Trains in the South China Sea. Geophys. Res. Lett. 2021, 48, e2021GL092861. [Google Scholar] [CrossRef]
  55. Riera, R.; Paumard, V.; De Gail, M.; Saqab, M.M.; Lebrec, U.; Lang, S.C.; Lane, A. Origin of Seafloor Pockmarks Overlying Submarine Landslides: Insights from Semi-Automated Mapping of 3D Seismic Horizons (North West Shelf, Australia). Mar. Pet. Geol. 2022, 136, 105453. [Google Scholar] [CrossRef]
  56. Hillman, J.I.T.; Watson, S.J.; Maier, K.L.; Hoffmann, J.J.L.; Bland, K.J.; Warnke, F.; Pecher, I.A.; Gorman, A.R.; Davy, B.; Bull, S.; et al. The Diverse Morphology of Pockmarks around Aotearoa New Zealand. Front. Mar. Sci. 2023, 10, 1235928. [Google Scholar] [CrossRef]
  57. Li, X.; Guo, X.; Tian, F.; Fang, X. The Effects of Controlling Gas Escape and Bottom Current Activity on the Evolution of Pockmarks in the Northwest of the Xisha Uplift, South China Sea. J. Mar. Sci. Eng. 2024, 12, 1505. [Google Scholar] [CrossRef]
  58. Zhang, Z.; Deng, X.; Yao, H.; Yu, M.; Wang, H.; He, G.; Liu, B.; Wu, T.; Kahkashan, S.; Haider, S.W.; et al. A Preliminary Study on Geomorphological Characteristics and Genetic Mechanism of Pockmarks in the Makran Accretionary Prism, Northern Arabian Sea. Geo-Mar. Lett. 2021, 41, 27. [Google Scholar] [CrossRef]
  59. Cojean, A.N.Y.; Kremer, K.; Bartosiewicz, M.; Fabbri, S.C.; Lehmann, M.F.; Wirth, S.B. Morphology, Formation, and Activity of Three Different Pockmark Systems in Peri-Alpine Lake Thun, Switzerland. Front. Water 2021, 3, 666641. [Google Scholar] [CrossRef]
  60. Ikonen, J.; Hendriksson, N.; Luoma, S.; Lahaye, Y.; Virtasalo, J.J. Behavior of Li, S and Sr Isotopes in the Subterranean Estuary and Seafloor Pockmarks of the Hanko Submarine Groundwater Discharge Site in Finland, Northern Baltic Sea. Appl. Geochem. 2022, 147, 105471. [Google Scholar] [CrossRef]
  61. Matciak, M.; Misiewicz, M.M.; Szymczycha, B.; Idczak, J.; Tęgowski, J.; Diak, M. Pockmarks and Associated Fresh Submarine Groundwater Discharge in the Seafloor of Puck Bay, Southern Baltic Sea. Sci. Total Environ. 2024, 942, 173617. [Google Scholar] [CrossRef]
  62. Debnath, P.; Das, K.; Mukherjee, A.; Ghosh, N.C.; Rao, S.; Kumar, S.; Krishan, G.; Joshi, G. Seasonal-to-Diurnal Scale Isotopic Signatures of Tidally-Influenced Submarine Groundwater Discharge to the Bay of Bengal: Control of Hydrological Cycle on Tropical Oceans. J. Hydrol. 2019, 571, 697–710. [Google Scholar] [CrossRef]
  63. Chen, F.; MacDonald, D.G. Role of Mixing in the Structure and Evolution of a Buoyant Discharge Plume. J. Geophys. Res. Oceans 2006, 111, 2006JC003563. [Google Scholar] [CrossRef]
  64. Zhang, T.; Wu, Z.; Zhao, D.; Li, S.; Shang, J.; Gao, J.; Zhou, J.; Liu, Y.; Zhu, C.; Lu, H. Analysis of Seafloor Pockmark Morphology and Genesis in the Liyue Basin, South China Sea. Acta Oceanol. Sinica. 2019, 41, 106–120. [Google Scholar]
  65. Lee, C.; Lee, J.; Kim, M.; Kim, G.Y. Implementation of Barcelona Basic Model into TOUGH2-MP/FLAC3D. Tunn. Undergr. Space 2020, 30, 39–62. [Google Scholar]
  66. Purkamo, L.; Von Ahn, C.M.E.; Jilbert, T.; Muniruzzaman, M.; Bange, H.W.; Jenner, A.-K.; Böttcher, M.E.; Virtasalo, J.J. Impact of Submarine Groundwater Discharge on Biogeochemistry and Microbial Communities in Pockmarks. Geochim. Cosmochim. Acta 2022, 334, 14–44. [Google Scholar] [CrossRef]
  67. Nielsen, P.; Teakle, I.A.L. Turbulent Diffusion of Momentum and Suspended Particles: A Finite-Mixing-Length Theory. Phys. Fluids 2004, 16, 2342–2348. [Google Scholar] [CrossRef]
  68. Rastello, M.; Michallet, H.; Marié, J.L. Sediment Erosion in Zero-Mean-Shear Turbulence. Phys. Fluids 2020, 32, 036601. [Google Scholar] [CrossRef]
  69. Schlüter, M.; Sauter, E.J.; Andersen, C.E.; Dahlgaard, H.; Dando, P.R. Spatial Distribution and Budget for Submarine Groundwater Discharge in Eckernförde Bay (Western Baltic Sea). Limnol. Oceanogr. 2004, 49, 157–167. [Google Scholar] [CrossRef]
  70. Da Rocha, C.M.; Barboza, E.G.; Niencheski, L.F.H. Radon Activity and Submarine Groundwater Discharge in Different Geological Regions of a Coastal Barrier in Southern Brazil. Environ. Earth Sci. 2018, 77, 527. [Google Scholar] [CrossRef]
  71. Luoma, S.; Majaniemi, J.; Pullinen, A.; Mursu, J.; Virtasalo, J.J. Geological and Groundwater Flow Model of a Submarine Groundwater Discharge Site at Hanko (Finland), Northern Baltic Sea. Hydrogeol. J. 2021, 29, 1279–1297. [Google Scholar] [CrossRef]
  72. Virtasalo, J.J.; Schröder, J.F.; Luoma, S.; Majaniemi, J.; Mursu, J.; Scholten, J. Submarine Groundwater Discharge Site in the First Salpausselkä Ice-Marginal Formation, South Finland. Solid Earth 2019, 10, 405–423. [Google Scholar] [CrossRef]
  73. Chen, N.-C.; O’Regan, M.; Hong, W.-L.; Andrén, T.; Rodellas, V.; Roth, F.; Mörth, C.-M.; Regnéll, C.; Marxen, H.S.; Ten Hietbrink, S.; et al. Investigation of Submarine Groundwater Discharge into the Baltic Sea through Varved Glacial Clays. Cont. Shelf Res. 2024, 282, 105337. [Google Scholar] [CrossRef]
  74. Andresen, K.J.; Dahlin, A.; Kjeldsen, K.U.; Røy, H.; Bennike, O.; Nørgaard-Pedersen, N.; Seidenkrantz, M.-S. The Longevity of Pockmarks—A Case Study from a Shallow Water Body in Northern Denmark. Mar. Geol. 2021, 434, 106440. [Google Scholar] [CrossRef]
  75. Kaleris, V.; Lagas, G.; Marczinek, S.; Piotrowski, J.A. Modelling Submarine Groundwater Discharge: An Example from the Western Baltic Sea. J. Hydrol. 2002, 265, 76–99. [Google Scholar] [CrossRef]
  76. Sultan, N.; Marsset, B.; Ker, S.; Marsset, T.; Voisset, M.; Vernant, A.M.; Bayon, G.; Cauquil, E.; Adamy, J.; Colliat, J.L.; et al. Hydrate Dissolution as a Potential Mechanism for Pockmark Formation in the Niger Delta. J. Geophys. Res. Solid Earth 2010, 115, 2010JB007453. [Google Scholar] [CrossRef]
  77. Nakajima, T.; Kakuwa, Y.; Yasudomi, Y.; Itaki, T.; Motoyama, I.; Tomiyama, T.; Machiyama, H.; Katayama, H.; Okitsu, O.; Morita, S.; et al. Formation of Pockmarks and Submarine Canyons Associated with Dissociation of Gas Hydrates on the Joetsu Knoll, Eastern Margin of the Sea of Japan. J. Asian Earth Sci. 2014, 90, 228–242. [Google Scholar] [CrossRef]
  78. Whiticar, M.J.; Werner, F. Pockmarks: Submarine Vents of Natural Gas or Freshwater Seeps? Geo-Mar. Lett. 1981, 1, 193–199. [Google Scholar] [CrossRef]
  79. Santos, I.R.; Burnett, W.C.; Dittmar, T.; Suryaputra, I.G.N.A.; Chanton, J. Tidal Pumping Drives Nutrient and Dissolved Organic Matter Dynamics in a Gulf of Mexico Subterranean Estuary. Geochim. Cosmochim. Acta 2009, 73, 1325–1339. [Google Scholar] [CrossRef]
  80. Idczak, J.; Brodecka-Goluch, A.; Łukawska-Matuszewska, K.; Graca, B.; Gorska, N.; Klusek, Z.; Pezacki, P.D.; Bolałek, J. A Geophysical, Geochemical and Microbiological Study of a Newly Discovered Pockmark with Active Gas Seepage and Submarine Groundwater Discharge (MET1-BH, Central Gulf of Gdańsk, Southern Baltic Sea). Sci. Total Environ. 2020, 742, 140306. [Google Scholar] [CrossRef]
  81. Wei, J.; Pape, T.; Sultan, N.; Colliat, J.-L.; Himmler, T.; Ruffine, L.; De Prunelé, A.; Dennielou, B.; Garziglia, S.; Marsset, T.; et al. Gas Hydrate Distributions in Sediments of Pockmarks from the Nigerian Margin—Results and Interpretation from Shallow Drilling. Mar. Pet. Geol. 2015, 59, 359–370. [Google Scholar] [CrossRef]
  82. Liu, X.; Qu, Z.; Guo, T.; Sun, Y.; Rabiei, M.; Liao, H. A Coupled Thermo-Hydrologic-Mechanical (THM) Model to Study the Impact of Hydrate Phase Transition on Reservoir Damage. Energy 2021, 216, 119222. [Google Scholar] [CrossRef]
  83. Li, K.; Li, M.; Chen, B.; Wang, S.; Yang, M.; Song, Y. Methane Hydrate Decomposition in Fluid Flow Environment: Insights from Molecular Dynamics Simulations. Int. J. Heat Mass Transf. 2025, 241, 126731. [Google Scholar] [CrossRef]
  84. Chen, B.; Liu, Z.; Sun, H.; Zhao, G.; Sun, X.; Yang, M. The Synthetic Effect of Traditional-Thermodynamic-Factors (Temperature, Salinity, Pressure) and Fluid Flow on Natural Gas Hydrate Recovery Behaviors. Energy 2021, 233, 121147. [Google Scholar] [CrossRef]
  85. Chand, S.; Rise, L.; Ottesen, D.; Dolan, M.F.J.; Bellec, V.; Bøe, R. Pockmark-like Depressions near the Goliat Hydrocarbon Field, Barents Sea: Morphology and Genesis. Mar. Pet. Geol. 2009, 26, 1035–1042. [Google Scholar] [CrossRef]
  86. Dimitrov, L.; Woodside, J. Deep Sea Pockmark Environments in the Eastern Mediterranean. Mar. Geol. 2003, 195, 263–276. [Google Scholar] [CrossRef]
  87. Andrews, B.D.; Brothers, L.L.; Barnhardt, W.A. Automated Feature Extraction and Spatial Organization of Seafloor Pockmarks, Belfast Bay, Maine, USA. Geomorphology 2010, 124, 55–64. [Google Scholar] [CrossRef]
  88. Clementi, V.J.; Rosenthal, Y.; Bova, S.C.; Thomas, E.K.; Wright, J.D.; Mortlock, R.A.; Cowling, O.C.; Godfrey, L.V.; Childress, L.B.; Expedition 379T Scientists. Deep Submarine Infiltration of Altered Geothermal Groundwater on the South Chilean Margin. Commun. Earth Environ. 2022, 3, 218. [Google Scholar] [CrossRef]
  89. Russoniello, C.J.; Fernandez, C.; Bratton, J.F.; Banaszak, J.F.; Krantz, D.E.; Andres, A.S.; Konikow, L.F.; Michael, H.A. Geologic Effects on Groundwater Salinity and Discharge into an Estuary. J. Hydrol. 2013, 498, 1–12. [Google Scholar] [CrossRef]
  90. Ceccato, A.; Viola, G.; Tartaglia, G.; Antonellini, M. In–Situ Quantification of Mechanical and Permeability Properties on Outcrop Analogues of Offshore Fractured and Weathered Crystalline Basement: Examples from the Rolvsnes Granodiorite, Bømlo, Norway. Mar. Pet. Geol. 2021, 124, 104859. [Google Scholar] [CrossRef]
  91. Lino, Y.; Udayashankar, H.N.; Suresh Babu, D.S.; Ramasamy, M.; Balakrishna, K. Large Submarine Groundwater Discharges to the Arabian Sea from Tropical Southwestern Indian Coast: Measurements from Seepage Meters Deployed during the Low Tide. J. Hydrol. 2023, 620, 129394. [Google Scholar] [CrossRef]
  92. Lin, X.; Chen, X.; Chen, F.; Jin, G.; Wang, C.; Mayakrishnan, M.; Shi, Z.; Si, X. Seasonal Dynamics of Submarine Groundwater Discharge in Zhanjiang Bay: An Investigative Study Utilizing 222Rn as a Tracer. Front. Mar. Sci. 2024, 11, 1451533. [Google Scholar] [CrossRef]
  93. Hsu, F.-H.; Su, C.-C.; Wang, P.-L.; Lin, I.-T. Temporal Variations of Submarine Groundwater Discharge into a Tide-Dominated Coastal Wetland (Gaomei Wetland, Western Taiwan) Indicated by Radon and Radium Isotopes. Water 2020, 12, 1806. [Google Scholar] [CrossRef]
  94. Ono, T.; Amezawa, R.; Igarashi, A.; Ota, M.; Sato, Y.; Inomata, H. Measurements and Correlations of Density and Viscosity for Short Chain (C1–C3) n-Alcohol–Water Mixtures in the Temperature Range from 350.7 K to 476.2 K at Pressures up to 40 MPa. Fluid Phase Equilibria 2016, 407, 198–208. [Google Scholar] [CrossRef]
  95. Paull, C.K.; Ussler, W.; Borowski, W.S.; Spiess, F.N. Methane-Rich Plumes on the Carolina Continental Rise: Associations with Gas Hydrates. Geology 1995, 23, 89. [Google Scholar] [CrossRef]
  96. Gonneea, M.E.; Mulligan, A.E.; Charette, M.A. Seasonal Cycles in Radium and Barium within a Subterranean Estuary: Implications for Groundwater Derived Chemical Fluxes to Surface Waters. Geochim. Cosmochim. Acta 2013, 119, 164–177. [Google Scholar] [CrossRef]
  97. Liu, Q.; Charette, M.A.; Breier, C.F.; Henderson, P.B.; McCorkle, D.C.; Martin, W.; Dai, M. Carbonate System Biogeochemistry in a Subterranean Estuary—Waquoit Bay, USA. Geochim. Cosmochim. Acta 2017, 203, 422–439. [Google Scholar] [CrossRef]
  98. Luo, C.; Chen, X.; Shi, Z.; Chen, J.; Wu, T.; Shi, C.; Huang, X.; Qiao, D.; Yang, T. Effects of Precipitation and Dissolution of Carbonate Cements on the Quality of Deeply Buried High-Temperature and Overpressured Clastic Reservoirs: XD 10 Block, Yinggehai Basin, South China Sea. Mar. Pet. Geol. 2022, 139, 105591. [Google Scholar] [CrossRef]
  99. Evans, R.L.; Lizarralde, D. Geophysical Evidence for Karst Formation Associated with Offshore Groundwater Transport: An Example from North Carolina. Geochem. Geophys. Geosyst. 2003, 4, 2003GC000510. [Google Scholar] [CrossRef]
  100. Liu, S.; Zhang, J.; Liu, X.; Cao, J.; Zhang, Y.; Sun, L.; Song, X.; Xing, C. Coastal Wetland Degradation and Ecological Problems in the Yellow River Delta during 2005–2021. J. Mar. Environ. Eng. 2024, 11, 255–274. [Google Scholar]
  101. Wu, Z.; Zhu, H.; Tang, D.; Wang, Y.; Zidan, A.; Cui, Z. Submarine Groundwater Discharge as a Significant Export of Dissolved Inorganic Carbon from a Mangrove Tidal Creek to Qinglan Bay (Hainan Island, China). Cont. Shelf Res. 2021, 223, 104451. [Google Scholar] [CrossRef]
  102. Arévalo-Martínez, D.L.; Haroon, A.; Bange, H.W.; Erkul, E.; Jegen, M.; Moosdorf, N.; Schneider Von Deimling, J.; Berndt, C.; Böttcher, M.E.; Hoffmann, J.; et al. Ideas and Perspectives: Land–Ocean Connectivity through Groundwater. Biogeosciences 2023, 20, 647–662. [Google Scholar] [CrossRef]
  103. Ruiz-González, C.; Rodellas, V.; Garcia-Orellana, J. The Microbial Dimension of Submarine Groundwater Discharge: Current Challenges and Future Directions. FEMS Microbiol. Rev. 2021, 45, fuab010. [Google Scholar] [CrossRef]
  104. Prakash, R.; Srinivasamoorthy, K.; Gopinath, S.; Saravanan, K. Submarine Groundwater Discharge as Sources for Dissolved Nutrient Fluxes in Coleroon River Estuary, Bay of Bengal, India. J. Contam. Hydrol. 2020, 233, 103660. [Google Scholar] [CrossRef] [PubMed]
  105. Yao, Y.; Kong, J.; Zhang, C.; Tang, Z.; Shen, C.; Luo, Z.; Lu, C.; Feng, X.; Sun, Y. Zonations and Oscillations via Heterotrophic Processes in Tidal Unvegetated Aquifers. Hydrol. Process. 2022, 36, e14654. [Google Scholar] [CrossRef]
Figure 1. Global distribution of SGD and pockmark geomorphology [24,25,26,27,28,29,30,31,32,33,34,35,36,37,38,39,40,41,42,43].
Jmse 13 01070 g001
Figure 2. Turbulent mixing and SPM [9,63,64].
Jmse 13 01070 g002
Figure 3. Mechanisms of tectonic control on SGD-driven pockmark formation [88,89,90].
Jmse 13 01070 g003
Figure 4. SGD-driven coupled biogeochemical processes [74,96,97,98,100,105].
Jmse 13 01070 g004
Table 1. Morphological characteristics of pockmarks.
Types of PockmarksMorphology of PockmarksReference
Elongated pockmarksJmse 13 01070 i001[25]
Circular pockmarksJmse 13 01070 i002[46]
Elliptical pockmarksJmse 13 01070 i003[47]
Crescentic pockmarksJmse 13 01070 i004[48]
Irregular pockmarksJmse 13 01070 i005[49]
Table 2. Biological impact effects.
Impact MechanismsMechanisms of ActionRegulatory Factors
Microbial Clogging
Effect
Proliferation of heterotrophic bacteria clogs pore spaces, reduces local permeability, diverting and concentrating water flowOrganic matter supply
Microbial growth rate
Microbial Respiration EffectOxygen consumption induces localized hypoxia and generates CO2, acidifies pore water, accelerating substrate dissolutionOrganic carbon concentration Biocommunity structure
Disclaimer/Publisher’s Note: The statements, opinions and data contained in all publications are solely those of the individual author(s) and contributor(s) and not of MDPI and/or the editor(s). MDPI and/or the editor(s) disclaim responsibility for any injury to people or property resulting from any ideas, methods, instructions or products referred to in the content.

