Article

Numerical Dynamic Response Analysis of a Ship Engine Room Explosion Simulation Using OpenFOAM

Navigation College, Dalian Maritime University, Dalian 116026, China
*
Author to whom correspondence should be addressed.
J. Mar. Sci. Eng. 2025, 13(6), 1051; https://doi.org/10.3390/jmse13061051
Submission received: 25 April 2025 / Revised: 21 May 2025 / Accepted: 22 May 2025 / Published: 27 May 2025
(This article belongs to the Special Issue Marine Technology: Latest Advancements and Prospects)

Abstract

:
Maritime safety is crucial as vessels underpin global trade, but engine room explosions threaten crew safety, the environment, and assets. With modern ship designs growing more complex, numerical simulation has become vital for analyzing and preventing such events. This study examines safety risks from alternative fuel explosions in ship engine rooms, using the Trinitrotoluene (TNT)-equivalent method. A finite element model of a double-layer cabin explosion is developed, and simulations using blastFOAM in OpenFOAM v9 analyze shock wave propagation and stress distribution. Four explosion locations and five scales were tested, revealing that explosion scale is the most influential factor on shock wave intensity and structural stress, followed by equipment layout, with location having the least—though still notable—impact. Near the control room, an initial explosion caused a peak overpressure of 2.4 × 10⁶ Pa. Increasing the charge mass from 10 kg to 50 kg raised overpressure to 3.9 × 10⁶ Pa, showing strong dependence of blast intensity on explosive mass. Equipment absorbs and reflects shock waves, amplifying localized stresses. The findings aid in optimizing engine room layouts and improving explosion resistance, particularly for alternative fuels like liquefied natural gas (LNG), enhancing maritime safety and sustainability.

1. Introduction

In today’s rapidly developing maritime domain, ships play an essential role as the main means of global trade and transportation. However, according to data from the International Maritime Organization (2019), among the 1400 incidents reported from 2000 to 2017, 270 were related to fires and explosions, accounting for 19.2% of the reported incidents [1]. And reinforced the critical importance of marine fire safety during its March 2024 meeting [2]. As global trade expands, ships grow larger, and technology advances [3], ship design improves safety, performance, environmental protection and renewable energy [4]. The design and construction of large ship engine rooms confront more complex challenges, among which safety is a primary consideration [5].
An explosion in the ship’s engine room is an accident that can have catastrophic consequences, endangering the lives of crew members and causing economic losses and serious environmental pollution. Maritime explosions most frequently originate in cargo storage areas and engine spaces. The primary causes within cargo holds involve the transport of flammable substances and explosive materials, along with human operational failures. Furthermore, vessel structural degradation accounts for certain cases of such accidents [6]. Additionally, explosions in the engine room can occur for various reasons, the most important of which is the explosion caused by the ignition in the engine crankcase caused by high-speed operation. A crankcase explosion accident in a marine diesel engine will have fatal and catastrophic consequences [7]. Even with this technology in place, crankcase explosions are still a common failure on commercial ships [8]. Secondly, incidents such as naphtha leaks, detonation by heat sources, and engine failures could have caused explosions [9]. In this context, with the increasing growth of numerical simulation technology and the improvement of computing power, in order to better understand and prevent this type of accident, the simulation-based study of marine engine space explosions has developed into a significant approach for examining incident origins, improve the internal design of engine rooms, and strengthen ship personnel.
Fires and explosions are the most serious consequences of ship accidents [10] and often occur on large ships such as cruise ships and cargo ships [11]. In 2005, a steam explosion in the boiler room of a cruise ship caused mass casualties [12]. Talley’s study revealed that the risk of casualties from fire and explosion is the highest in cruise ship accidents [13], and Baalisampang et al. comprehensively examined fire and explosion incidents within the maritime sector over a 25-year period (1990–2015), providing systematic insights into these accidents [14].
The application of numerical simulation to the problem of engine room explosions can help us to better understand the impact of the explosion on the ship’s structural systems [15]. Early research predominantly idealized explosion-loaded structures as fundamental components like beams and plates to analyze their nonlinear large-deformation behavior [16]. Weibull’s findings demonstrated that the peak quasi-static pressure exerts negligible effects on venting areas, with pressure relief characteristics primarily dependent on the explosive charge-to-enclosure volume ratio [17]. Commonly, detonation is regarded as a strong discontinuity problem and its numerical simulation puts forward higher requirements on the shock wave capture format [18]. Liu established a weighted essentially non-oscillation (WENO) method [19]. Subsequently, Shu and colleagues enhanced the WENO algorithm and broadened its implementation scope [20,21]. To minimize explosive usage, Stewart innovatively developed a conical shock tube configuration capable of simulating large-scale free-field blast conditions [22]. Liu et al. utilized a nonlinear coupled numerical simulation approach to develop a fluid–structure interaction model that can simulate the interaction between fluids and solids and conduct research on the dynamic response of explosions to ship structures [23]. Li developed a fiber-based approach to simulate the progressive failure of cylindrical shells under combined axial compression and bending, demonstrating its effectiveness [24]. Shin utilized a coupled ship–fluid interaction model based on finite element methodology to assess blast effects on marine structures [25]. Chemical tankers transporting perilous substances should strengthen protective safeguards throughout operational processes—including cargo transfer, equipment upkeep, and standard workflows—to reduce potential ignition and blast occurrences [26]. Numerical simulation plays an indispensable role in accident analysis and prevention within maritime safety studies [27]. Numerical modeling of engine compartment explosions enables the simulation of diverse blast scenarios, structural response analysis, risk assessment, and the development of targeted preventive strategies [28]. Yang proposed a model for evaluating the longitudinal strength of hull beams [29]. Kong experimentally investigated the mitigation effects of water mist on blast loads and corresponding structural dynamic behavior [30]. Nubli constructed a realistic liquified natural gas fuel ship model, simulated a steam cloud explosion overpressure test, and determined the design unexpected load subjected to vapor cloud explosion [31]. The causes of explosions include deflagration and, in some cases, transition from deflagration to detonation. Smirnov presented the results of computational research from deflagration to explosion of combustible gas mixtures [32]. Kim et al. proposed a practical formula for predicting the ultimate strength of plates under longitudinal compression, which is intended to aid in the design and improve safety of non-stiffened plate elements used in shipbuilding and the oil and gas industry [33]. Yang used the open source computational fluid dynamics program OpenFOAM to analyze the gas explosion characteristics of uneven gas distribution with concentration gradients in mine tunnels [34]. Li proposes that the application of digital twin technology represents a promising approach for enhancing offshore structural safety through advanced marine structural integrity management [35].
There are several analysis and evaluation methods for the comprehensive assessment of fire and explosion in ports and ships [36]. Uğurlu and Cicek utilized the fault tree analysis (FTA) approach to assess the risk assessment of tanker collision and grounding accidents [37]. The type of cargo carried on tankers is also a factor that affects the risk of fire [38]. The risk factors for leakage in offshore oil and gas wells were revealed via fuzzy fault tree analysis (FFTA) approaches in the scope of drilling operations. These include accidents caused by improper packaging of the cargo and lack of protection required for filling [39]. Cao proposed a rapid response-based ship port vulnerability assessment framework that enables the quantification of port vulnerability [40]. Kim developed an empirical formula to predict the ultimate compressive strength of unstiffened cylindrical curved panels [41]. Wu developed an accident-cause model and suitably verified it to solve the relevant accident-cause mechanism based on the IF [42]. Zhang compared “human factors analysis and classification system”, “AcciMap”, and “systems theory accident modeling and process” to identify the influencing factors and relationships in accidents and usage [43]. Bhardwaj utilized a risk matrix methodology to conduct comprehensive hazard assessments, systematically evaluating and prioritizing critical incidents in Floating Production Storage and Offloading (FPSO) operations [44]. Kang et al. developed an assessment framework for LNG leakage risk prediction by integrating LNG leakage simulation with a deep spatiotemporal series model. The results demonstrated both the predictive accuracy of the model and the practical applicability of the framework, establishing a significant foundation for risk management and accident prevention in offshore LNG transshipment operations [45].
In conclusion, computational modeling of machinery space detonations constitutes a critical component in maritime engineering investigations. While significant research has been conducted globally on vessel machinery space explosions, several important research gaps remain in certain areas that would benefit from further study. This paper simulates engine room parameters of real ships to explore the engine room interior. Numerical analysis of high-risk explosions in closed environments, and the study analyzed five explosion scales based on four detonation locations, fully considering the impact of the explosion on mechanical equipment, ship design and the safety of personnel on board. The main goal of the present investigation is to discuss the application of numerical simulations in the study of ship engine room explosions in the current conditions of ship development and to analyze in depth its potential value in enhancing ship safety. Using blastFOAM, a simulated explosion solver in OpenFOAM v9 software and use the blastFOAM tutorial as a research template [46], a specific numerical study of ship engine fires is performed, through in-depth research on the application of numerical simulation technology in the field of ship engine room explosions, can provide stronger support for future ship design, construction and operation [47,48,49,50,51,52], which is expected to contribute more to the safety and sustainable development of the shipbuilding industry.

2. Materials and Methods

2.1. Theory

2.1.1. Explosion Process Equation

Within the OpenFOAM v9 framework, BlastFoam serves as an open-source solver specifically designed for explosion simulations, where the explosive detonation process is governed by the Jones–Wilkins–Lee equation of state (JWL-EOS) [46]. The JWL equation of state, frequently utilized for modeling energetic materials, expresses pressure as follows:
p i * = A i e R 1 , i V 1.0 Γ 0 R 1 , i V + B i e R 2 , i V 1.0 Γ 0 R 2 , i V + Γ 0 , i Q + e ρ i V ,
where V = ρ 0 , i / ρ i . This equation describes the modified pressure response of explosive materials under shock loading and is an improved form of the JWL state equation, which includes reaction heat terms and compression effects. p i * is the corrected pressure; unit is pa. A i and B i are the JWL state equation coefficients; R 1 , i and R 2 , i are the JWL state equation exponential coefficients; Γ 0 is the initial value of the Grüneisen coefficient; V is the relative volume; and the above parameters are dimensionless.
Γ i = Γ 0 , i + 1 ,
Π i = Γ 0 , i ρ i A i R 1 , i ρ 0 , i e R 1 , i ρ 0 , i ρ i + B i R 2 , i ρ 0 , i e R 2 , i ρ 0 , i ρ i Γ 0 , i Q ρ i ρ 0 , i p ref , i ,
δ i = A i e R 1 , i ρ 0 , i ρ i Γ 0 , i 1 R 1 , i ρ 0 , i + 1 ρ i R 1 , i ρ 0 , i ρ i 2 1 Γ 0 , i
+ B i e R 2 , i ρ 0 , i ρ i Γ 0 , i 1 R 2 , i ρ 0 , i + 1 ρ i R 2 , i ρ 0 , i ρ i 2 1 Γ 0 , i Q ρ 0 , i ,
Equation (3) is the pressure offset equation, which is used to calculate the pressure offset for reactive flow simulation and includes the JWL state equation term and the reference pressure correction. A simplified activation model for JWL-based explosives employs the detonation wave speed to determine material initiation. Equation (4) is used to control the reaction rate. This model utilizes a scalar field, λ a , to indicate whether a given computational cell has been activated. The value of λ a is set to 0 if the product of the detonation velocity v det t and time t is less than the distance from the ignition point to the cell center; otherwise, it is assigned a value of 1. In the above formula, ρ 0 , i is the initial density, unit is kg/m³; ρ i is the current density, unit is kg/m³; Q is the heat of reaction, unit is J/kg; and e is the specific internal energy, unit is J/kg.

2.1.2. Simulation Method

The energy yield of the target explosive can be determined by scaling its specific energy relative to TNT using appropriate conversion coefficients. Table 1 [53,54,55] provides established conversion parameters for typical marine explosives. For unconfined detonation scenarios, the equivalent explosive charge is computed based on TNT mass equivalence, as formulated in Equation (5).
W = Q X Q T N T W X ,
In the context where W denotes the effective charge weight in terms of TNT, with W X representing the weight of the explosive and Q X signifying the mass-specific energy of the explosive, whereas Q T N T stands for the mass-specific energy of TNT, and the ratio Q X / Q T N T signifies the TNT equivalent based on detonation heat [56].
The explosion load mainly depends on the explosion output energy of the explosive. Due to the various causes of the explosion inside the cabin, in order to facilitate the subsequent numerical simulation, in the explosion method, different amounts of TNT with the same explosion energy and air contact explosion are used, without considering the products and effects of the explosion. Movement of mechanical equipment location. By simplifying the simulation process, we can better understand and anticipate the force of an explosion, leading to better safety measures and interventions. Additionally, the viscosity of the explosive reactants in computational fluid dynamics is set equal to zero.
From this table, it can be seen that the mass specific energy of common explosives in ship engine rooms is about 10 times that of TNT. Hence, we set the scale and mass of TNT to 10, 15, 25, 35, and 50 kg to observe the explosion scale for the effects of the explosion. The energy release of explosive substances is commonly standardized by referencing their mass-specific energy relative to TNT, employing TNT equivalence ratios. This approach establishes a uniform basis for evaluating and comparing the detonation energy of diverse explosive compounds. This approach normalizes blast energy by referencing all explosive yields to the well-characterized detonation properties of TNT, a widely accepted benchmark in explosive mechanics. By focusing on the total energy release during detonation while neglecting secondary complexities, the analysis is significantly simplified without compromising the validity of cross-material comparisons. The TNT-equivalent method ensures comparability across diverse explosive materials by decoupling energy metrics from reaction pathways or transient phenomena, thereby isolating the fundamental shockwave and overpressure effects critical for structural impact assessments.

2.2. Validation of Explosion Simulation

To check whether the blastFOAM solver is suitable for closed space explosion experiments, we herein choose a closed space with the same aspect ratio and shell as the spacecraft cabin explosion. The explosion process is simulated via blastFOAM, and the simulation results accuracy is assessed by comparing it with the experimental data [57],which was conducted by Wu et al. [58]. As depicted in Figure 1, the experimental setup consists of a cuboid chamber, with detailed schematics illustrating its spatial dimensions and the precise locations of measurement points. In the experimental configuration, the internal space of the enclosed room is 3.4 m long, 2.4 m wide, and 2.2 m high, and the thickness of the wall is ignored in the simulation. The mass of TNT is 0.4 kg. Two pressure sensors are located 1.2 m and 1.6 m from the explosion position, as shown in P1 and P2 in Figure 1. To minimize interference from uncontrolled factors, including variations in simulation model materials, we completely matched the model inner size, explosion position, type, and number of explosives to the conditions of the experiment.
To mitigate potential errors arising from grid resolution, a grid sensitivity analysis was conducted. Three distinct grid sizes—75 mm, 150 mm, and 200 mm—were evaluated in the simulation. Figure 2 presents the simulated pressure curves at measurement point P1 for each grid resolution. The results demonstrate that the 75 mm and 150 mm grids yield nearly identical temperature profiles, whereas the 200 mm grid produces marginally divergent outcomes. To balance computational efficiency with result accuracy, a grid resolution of 150 mm was selected for subsequent simulations.
Figure 3 shows the explosion simulation perspective from the side of the model. The simulated overpressure distribution in the room domain at various times has been presented. When the explosion occurs 1 ms, the blast wave reaches the ground for the first time, which is close to the experimental results in the original literature. The analysis demonstrates a rapid surge in local overpressure following detonation, with the high-pressure zone propagating upward through the enclosed space. Pressure wave propagation exhibits distinct fan-shaped dispersion patterns upon wall interaction, while the explosive core region progressively constrains further pressure expansion over time.
Figure 4a presents a comparison between the experimental and simulated overpressure data recorded by the P1 pressure sensor. As shown, the two curves exhibit similar trends, both peaking at approximately 1.4 ms. Figure 4b displays the corresponding comparison for the P2 pressure sensor, where the simulated data demonstrate greater stability than the experimental measurements, which exhibit higher fluctuations. For sensor P1, the simulated results show excellent agreement with experimental data, particularly in capturing the pronounced negative pressure phase following explosion. These discrepancies are reasonable, as the simulation inherently simplifies real-world conditions, such as sensor noise, material imperfections, and boundary effects not fully accounted for in the model.

2.3. Configuration Settings

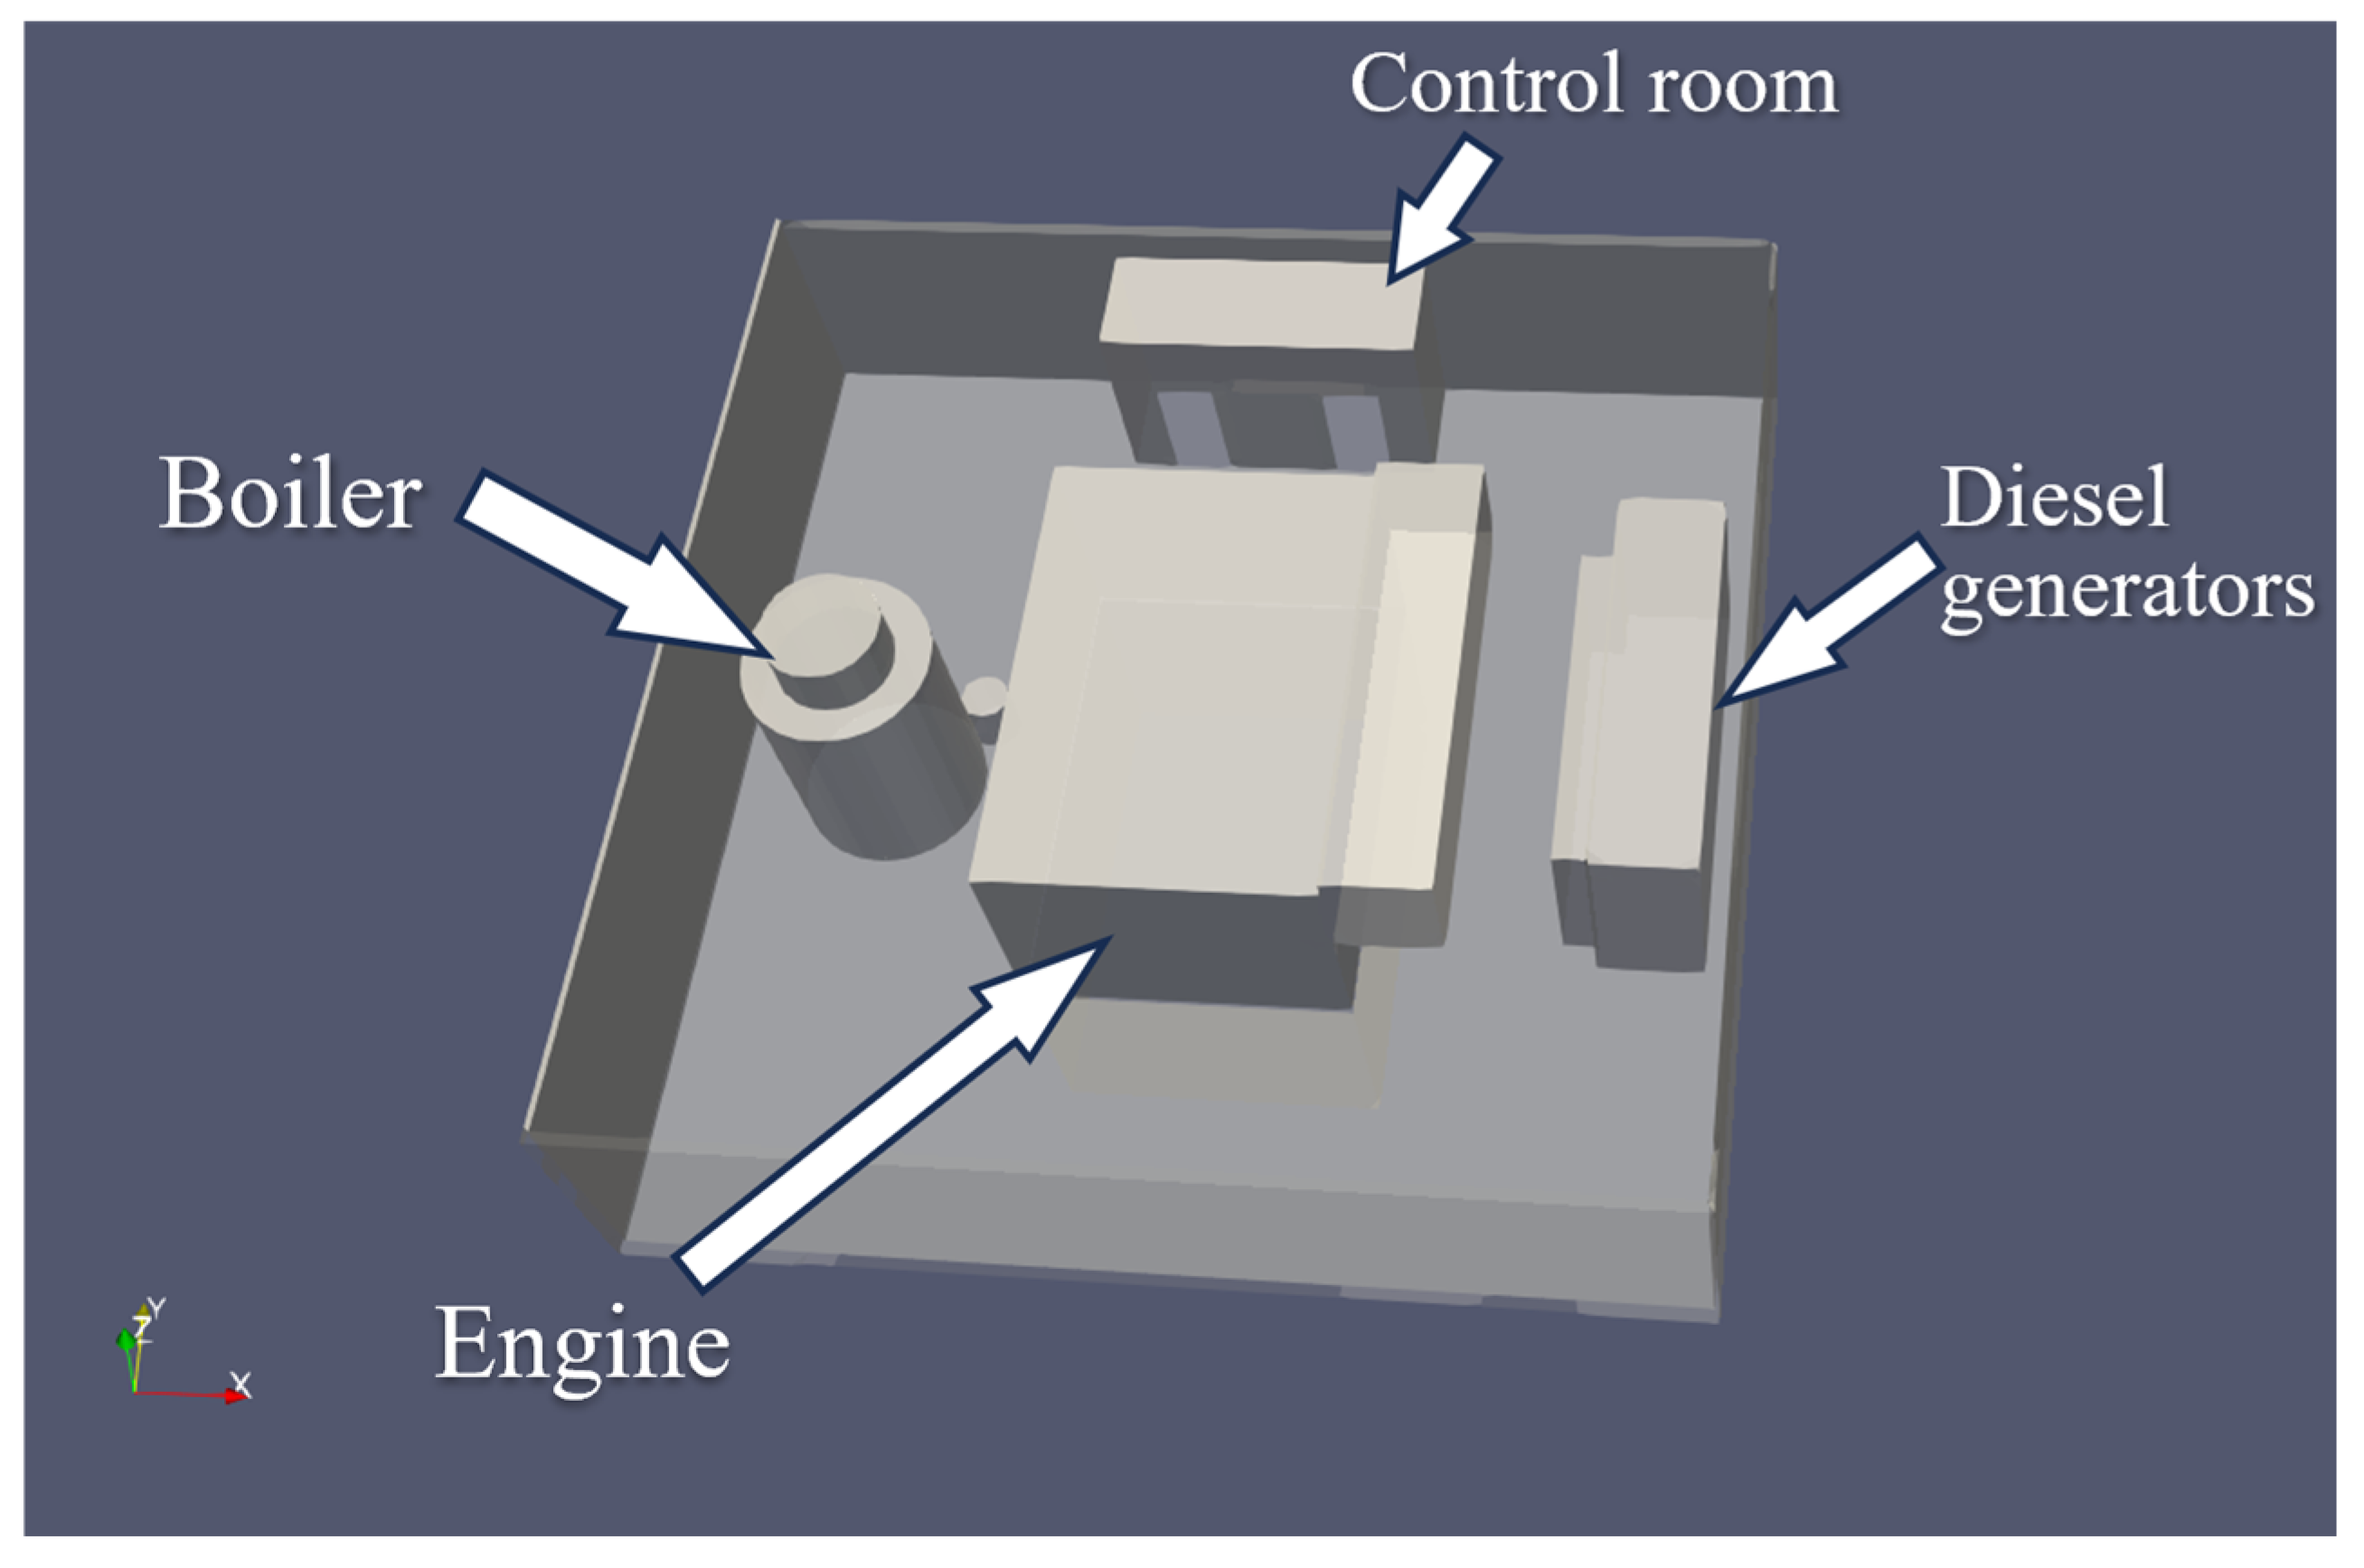
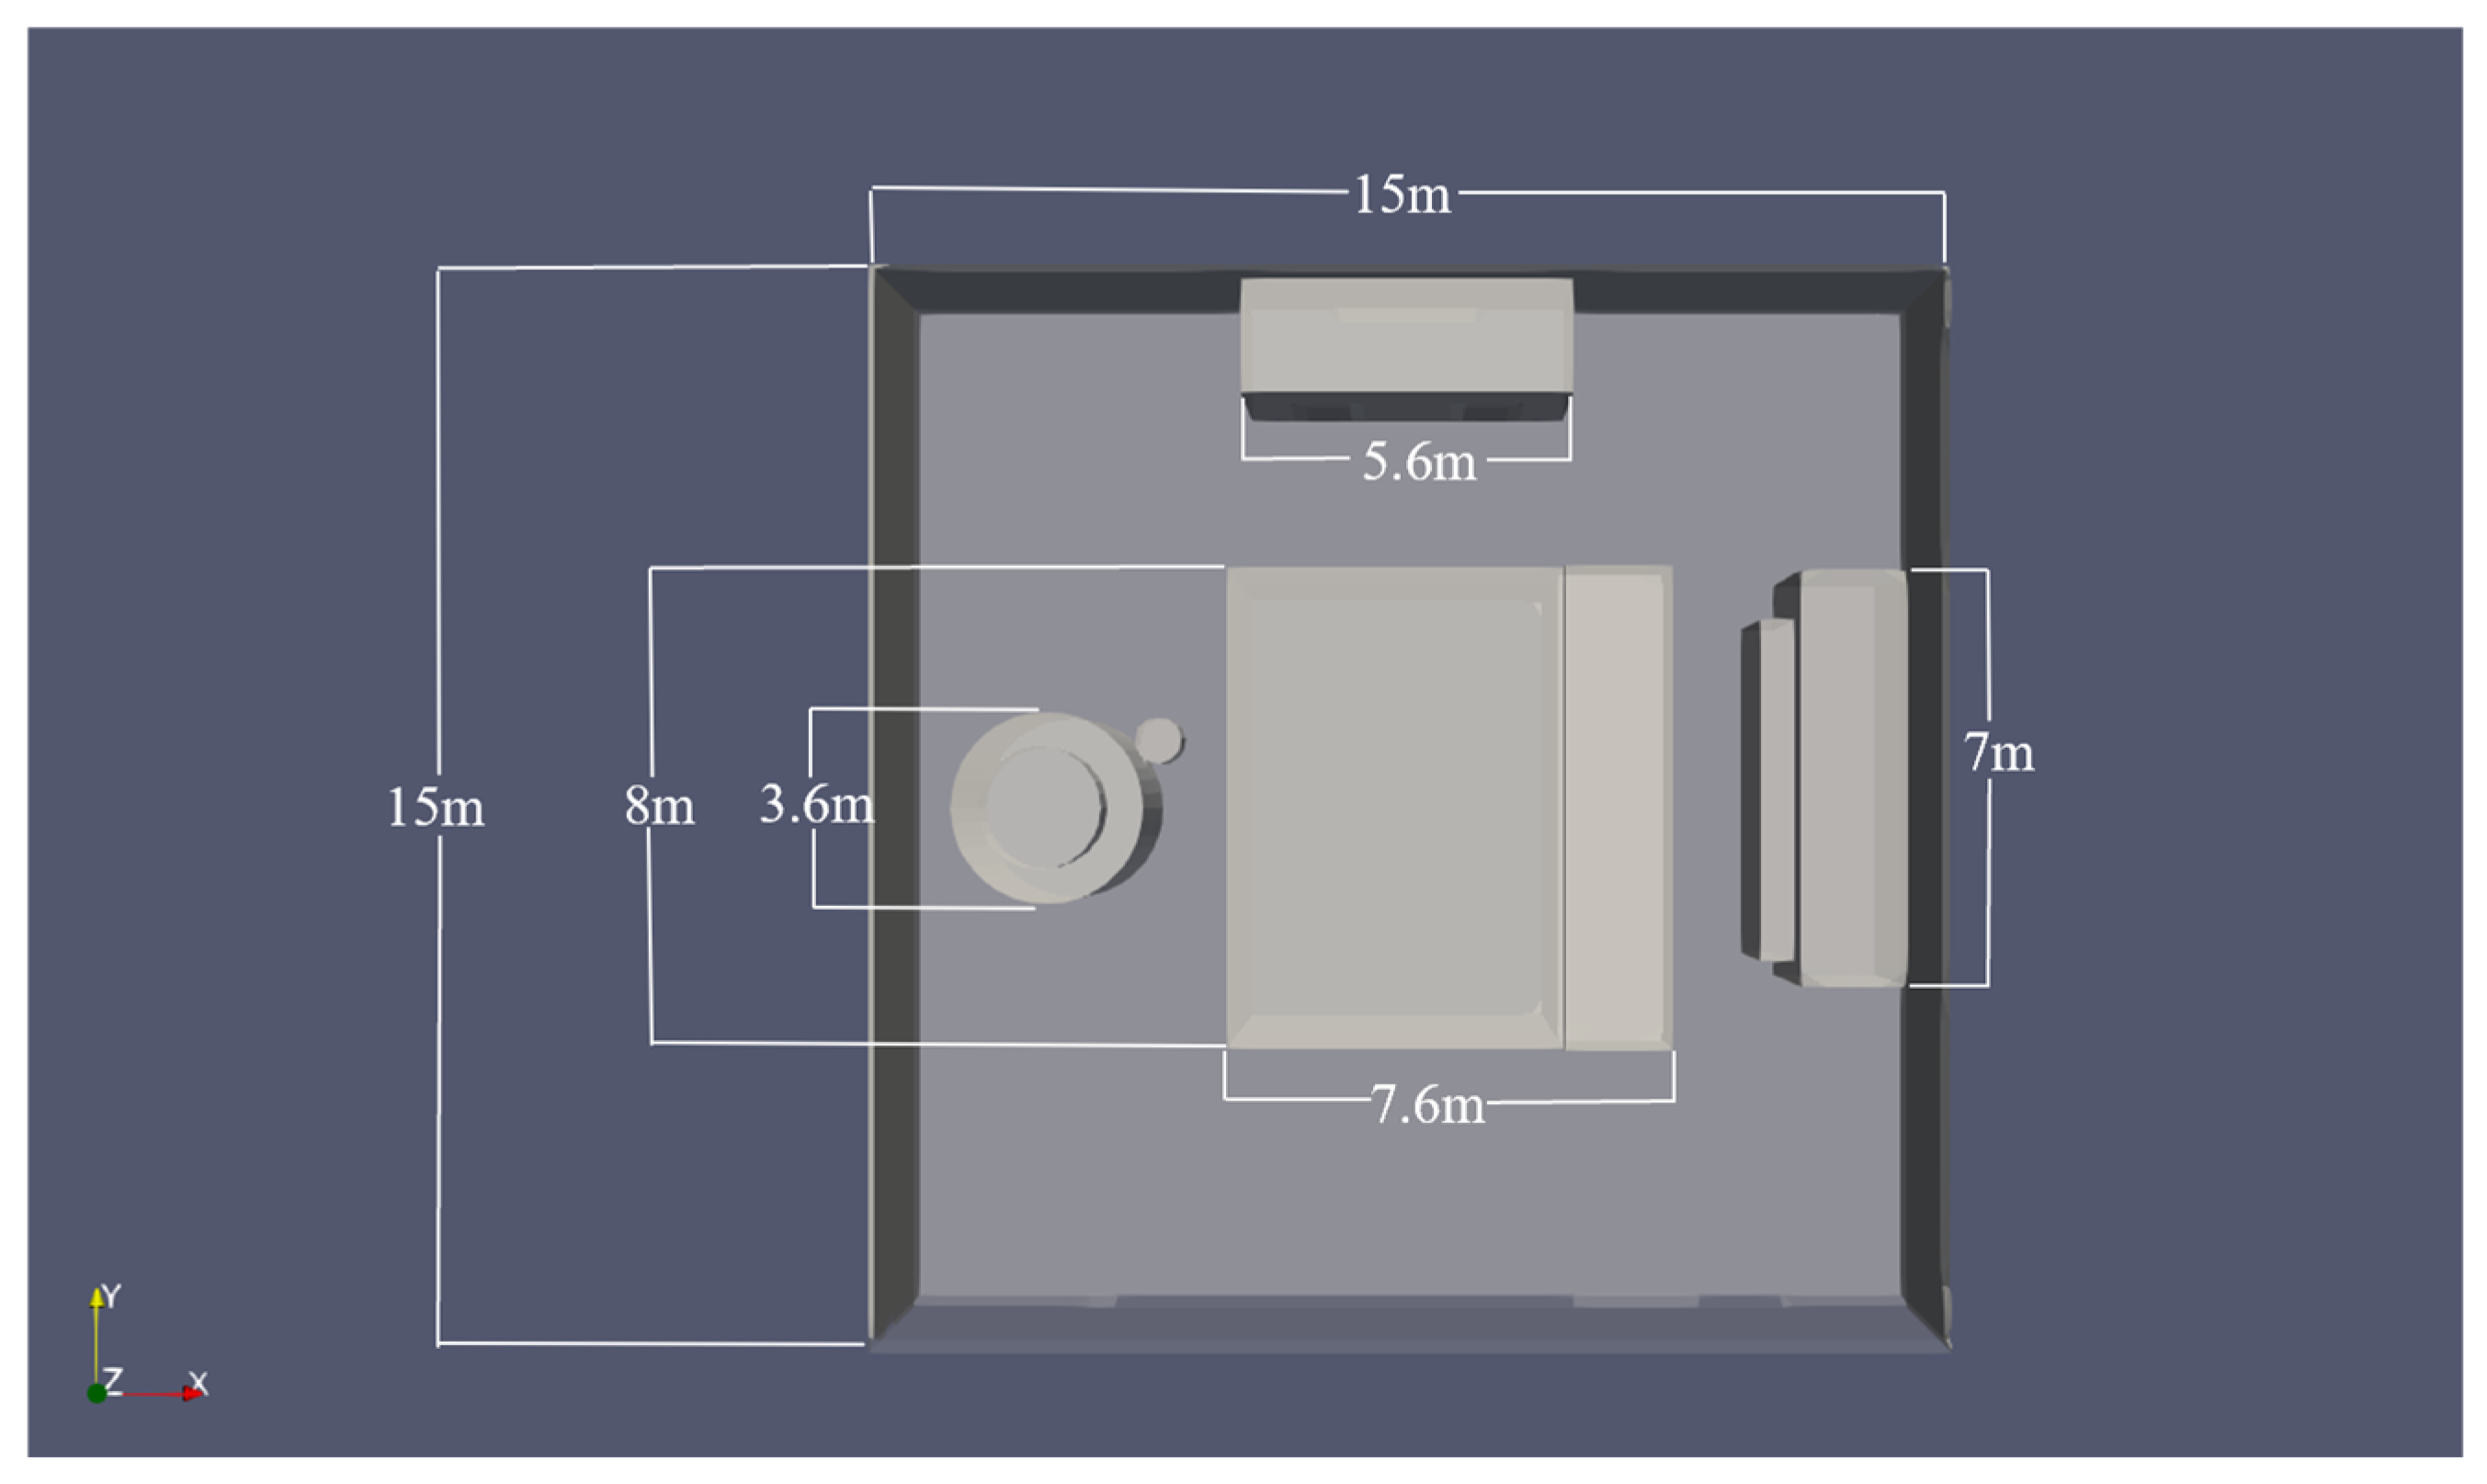
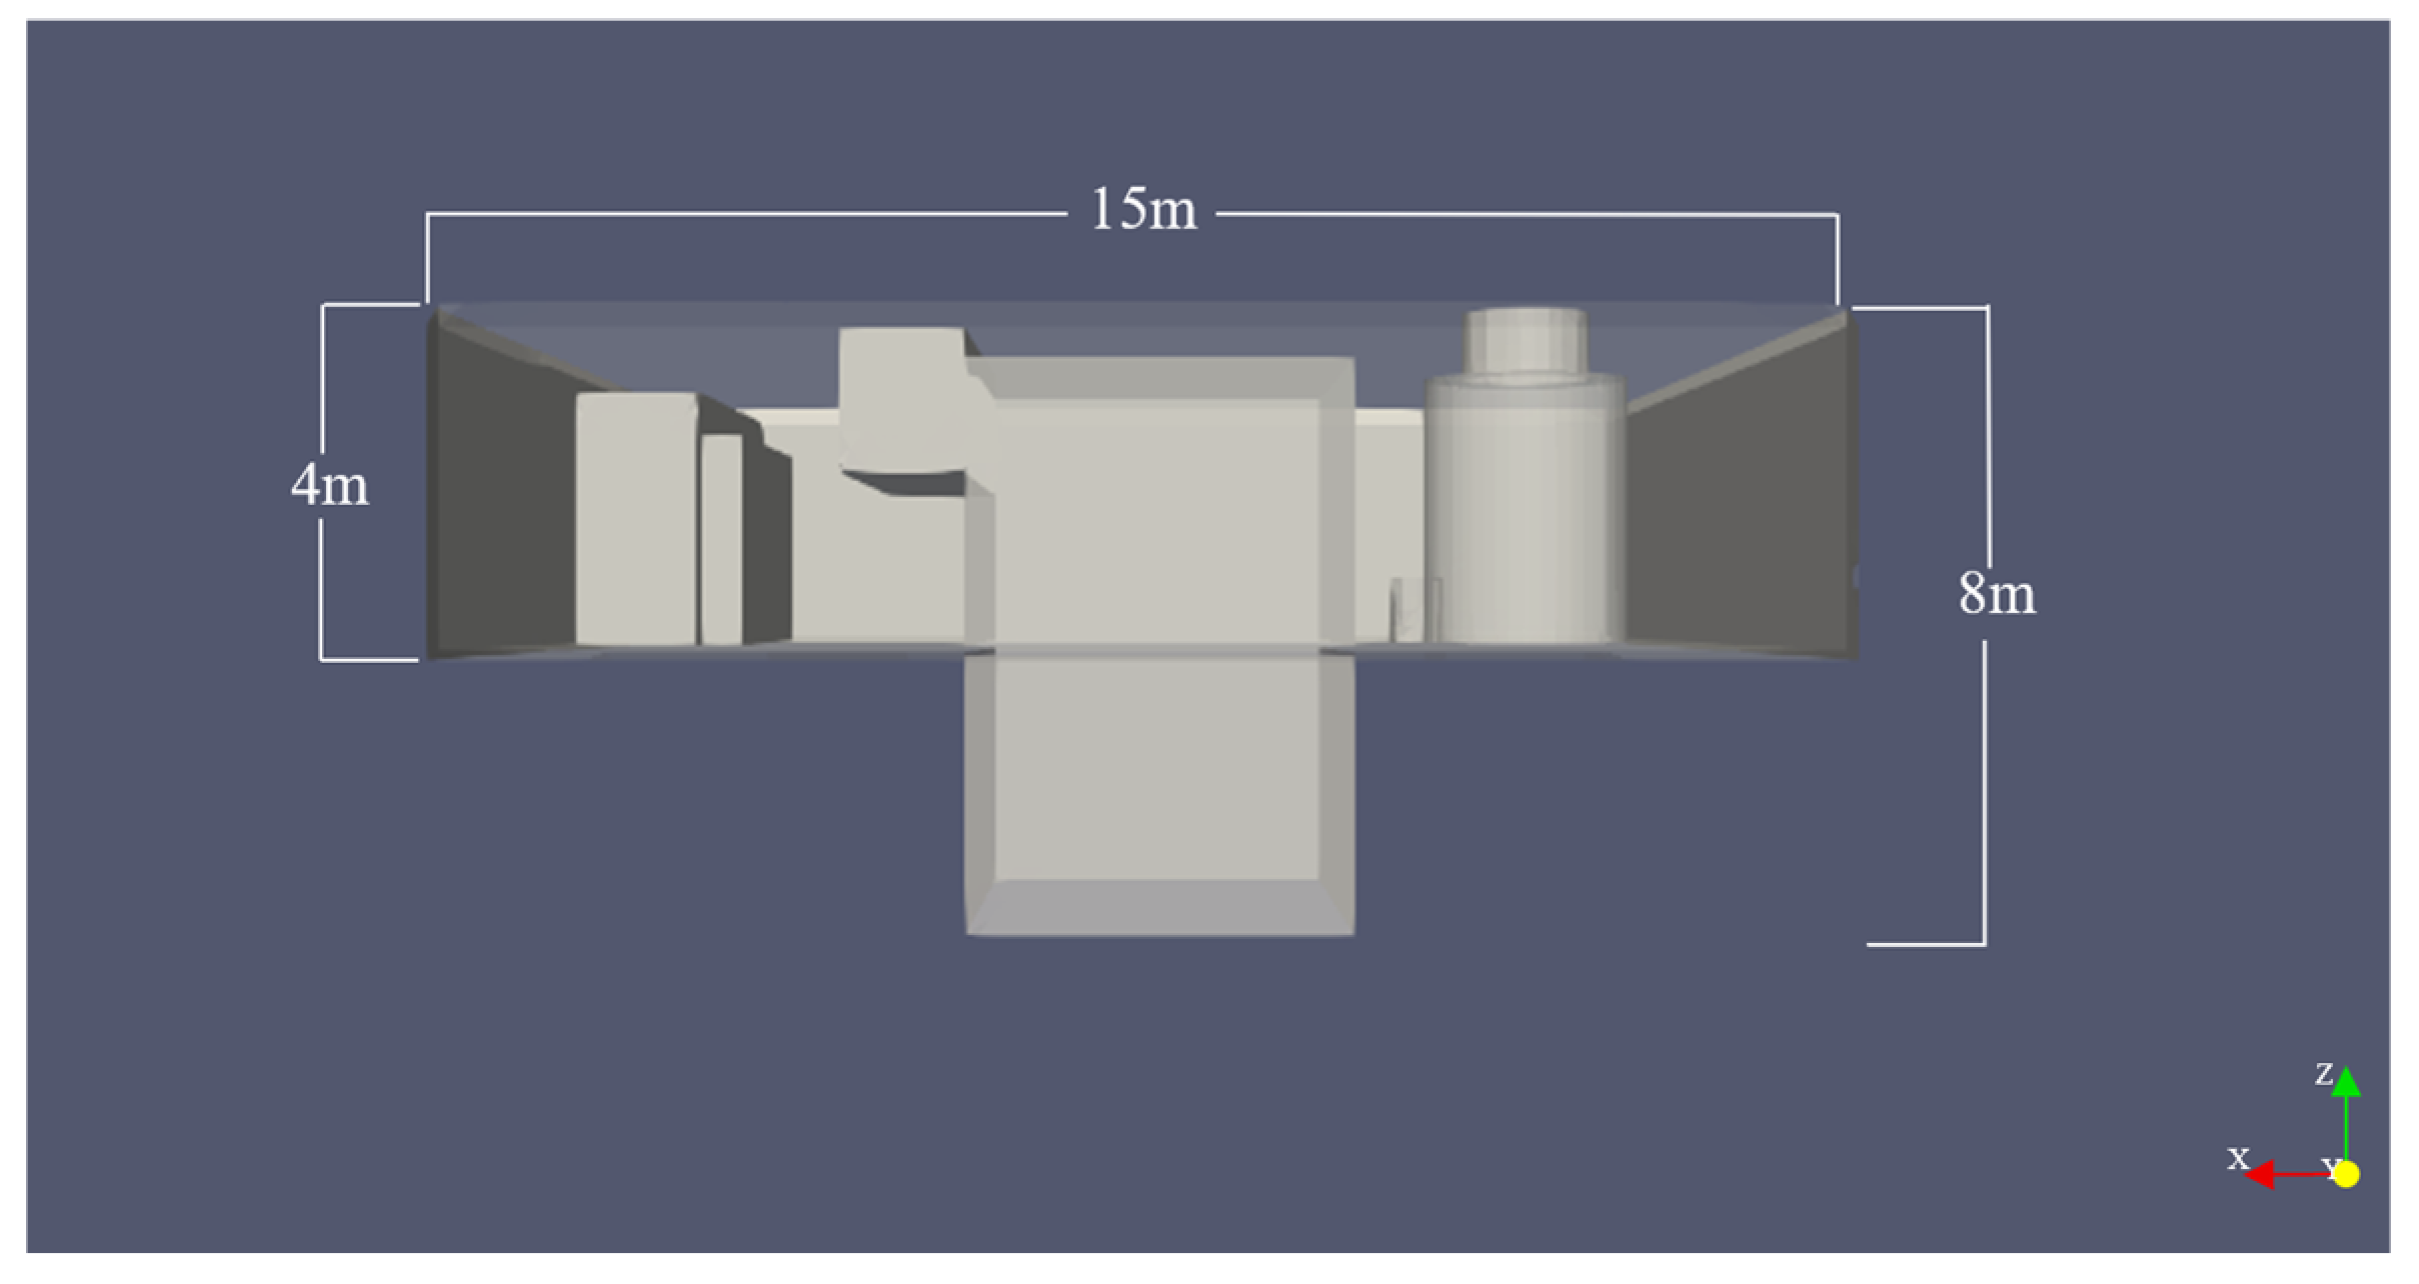
2.3.1. Ship Parameters

Among the current types of large ships, the engine rooms of cargo ships and tankers are located in the stern of the hull, and the engine room structures are generally very similar and have various internal functions, including but not limited to functional cabins such as main engine room, auxiliary engine room, control room, and electrical studio. However, some functional compartments have relatively little relation to the engine room explosion of the ship studied in this article. This study presents a three-dimensional structural model of the engine room, developed using the layout schematics and technical specifications of a 3100-TEU container vessel. The computational model accurately replicates the actual compartment dimensions, structural components, and spatial arrangements of the selected marine power plant configuration [59]. The main focus is on the analysis and control of the centralized control room, and combined boiler installations, as well as the main engine and diesel generator for power generation. To facilitate the calculations, the corresponding layout is illustrated in Figure 5. The overall design of the interior of the cabin has eliminated some complex scattered parts. The engine room shown in Figure 6 has two floors. The length of the upper engine room is 15 m and its width is 15 m. The centralized control room is located on top of the engine in the bird’s eye view of Figure 6. It is 5.6 m long, 2.4 m wide, and 3 m high. There are two openings of the same size on the side, which are used to simulate the escape door of the control room. The engine is generally composed of several components. Only the outer framework of the engine block is retained here. The engine block passes through two floors of the cabin, the total height of which is 8 m, the upper and lower floors are 4 m each, and the upper floor is 7.6 m long and 6 m wide. From Figure 7 and Figure 8, it can be seen that the left side of the engine is a combination boiler. The body of the boiler is designed in two sections with a height of 4 m and 1 m, a total height of 5 m, and a radius of 1.8 m, which is mainly located on the right side of the engine of the generator set. The generator is also a combination of several generators, so the general layout of the generator is also preserved. The main body of the generator is 7 m long, 1.8 m wide, and 3.6 m high. The internal generator auxiliary device represents a rectangular box shape whose length, width, and height are 5.8 m, 0.6 m, and 2 m, respectively.
Herein, we design four detection points as Figure 9. The first primary pressure sensor is strategically installed in the control room to monitor blast-induced overpressure levels, enabling evaluation of potential hazards to operating personnel during explosive scenarios. For this purpose, the position of the explosion point is altered three times. The second point is on the lower level of the engine room, close to the lower engine shell, which simulates the shock response of the lower-level personnel and equipment. The third point is located at the top of two important mechanical equipment. The reflection of the shock wave is also a hazard. The fourth point is located at the side angle of the boiler and simulates the damage absorbed by the boiler group when the explosion and the impact are caused. In addition, its position is different depending on the point of explosion. The four probes are all fixed points, and their relative positions are the same for different explosion points. These four detection probes are specified by Probe 1, Probe 2, Probe 3, and Probe 4, which are utilized to measure the pressure, temperature, and gradient velocity of the measuring point. In this simulation, each discrete segment of the model’s walls is assumed to experience uniform loading. These pressures lead to a uniform distribution of stress inside the constructed model so that the surface pressure can be used as an approximate representation of the overall force of the object [60].
Four explosion points simulate four explosion situations. The first tipping point is set next to the engine because of the impact of a crankcase explosion. The second explosion point is located close to the generator, which can simulate the generator explosion better. The third type of boiler explosion, this explosion point is located next to the boiler group, which is placed between the engine and the boiler. The fourth explosion point is located between the centralized control room and the engine, and the explosion directly affects the monitoring area where the personnel are stationed. The four explosion points considered are demonstrated in Figure 10, and their positions are specified by positions 1, 2, 3, and 4.

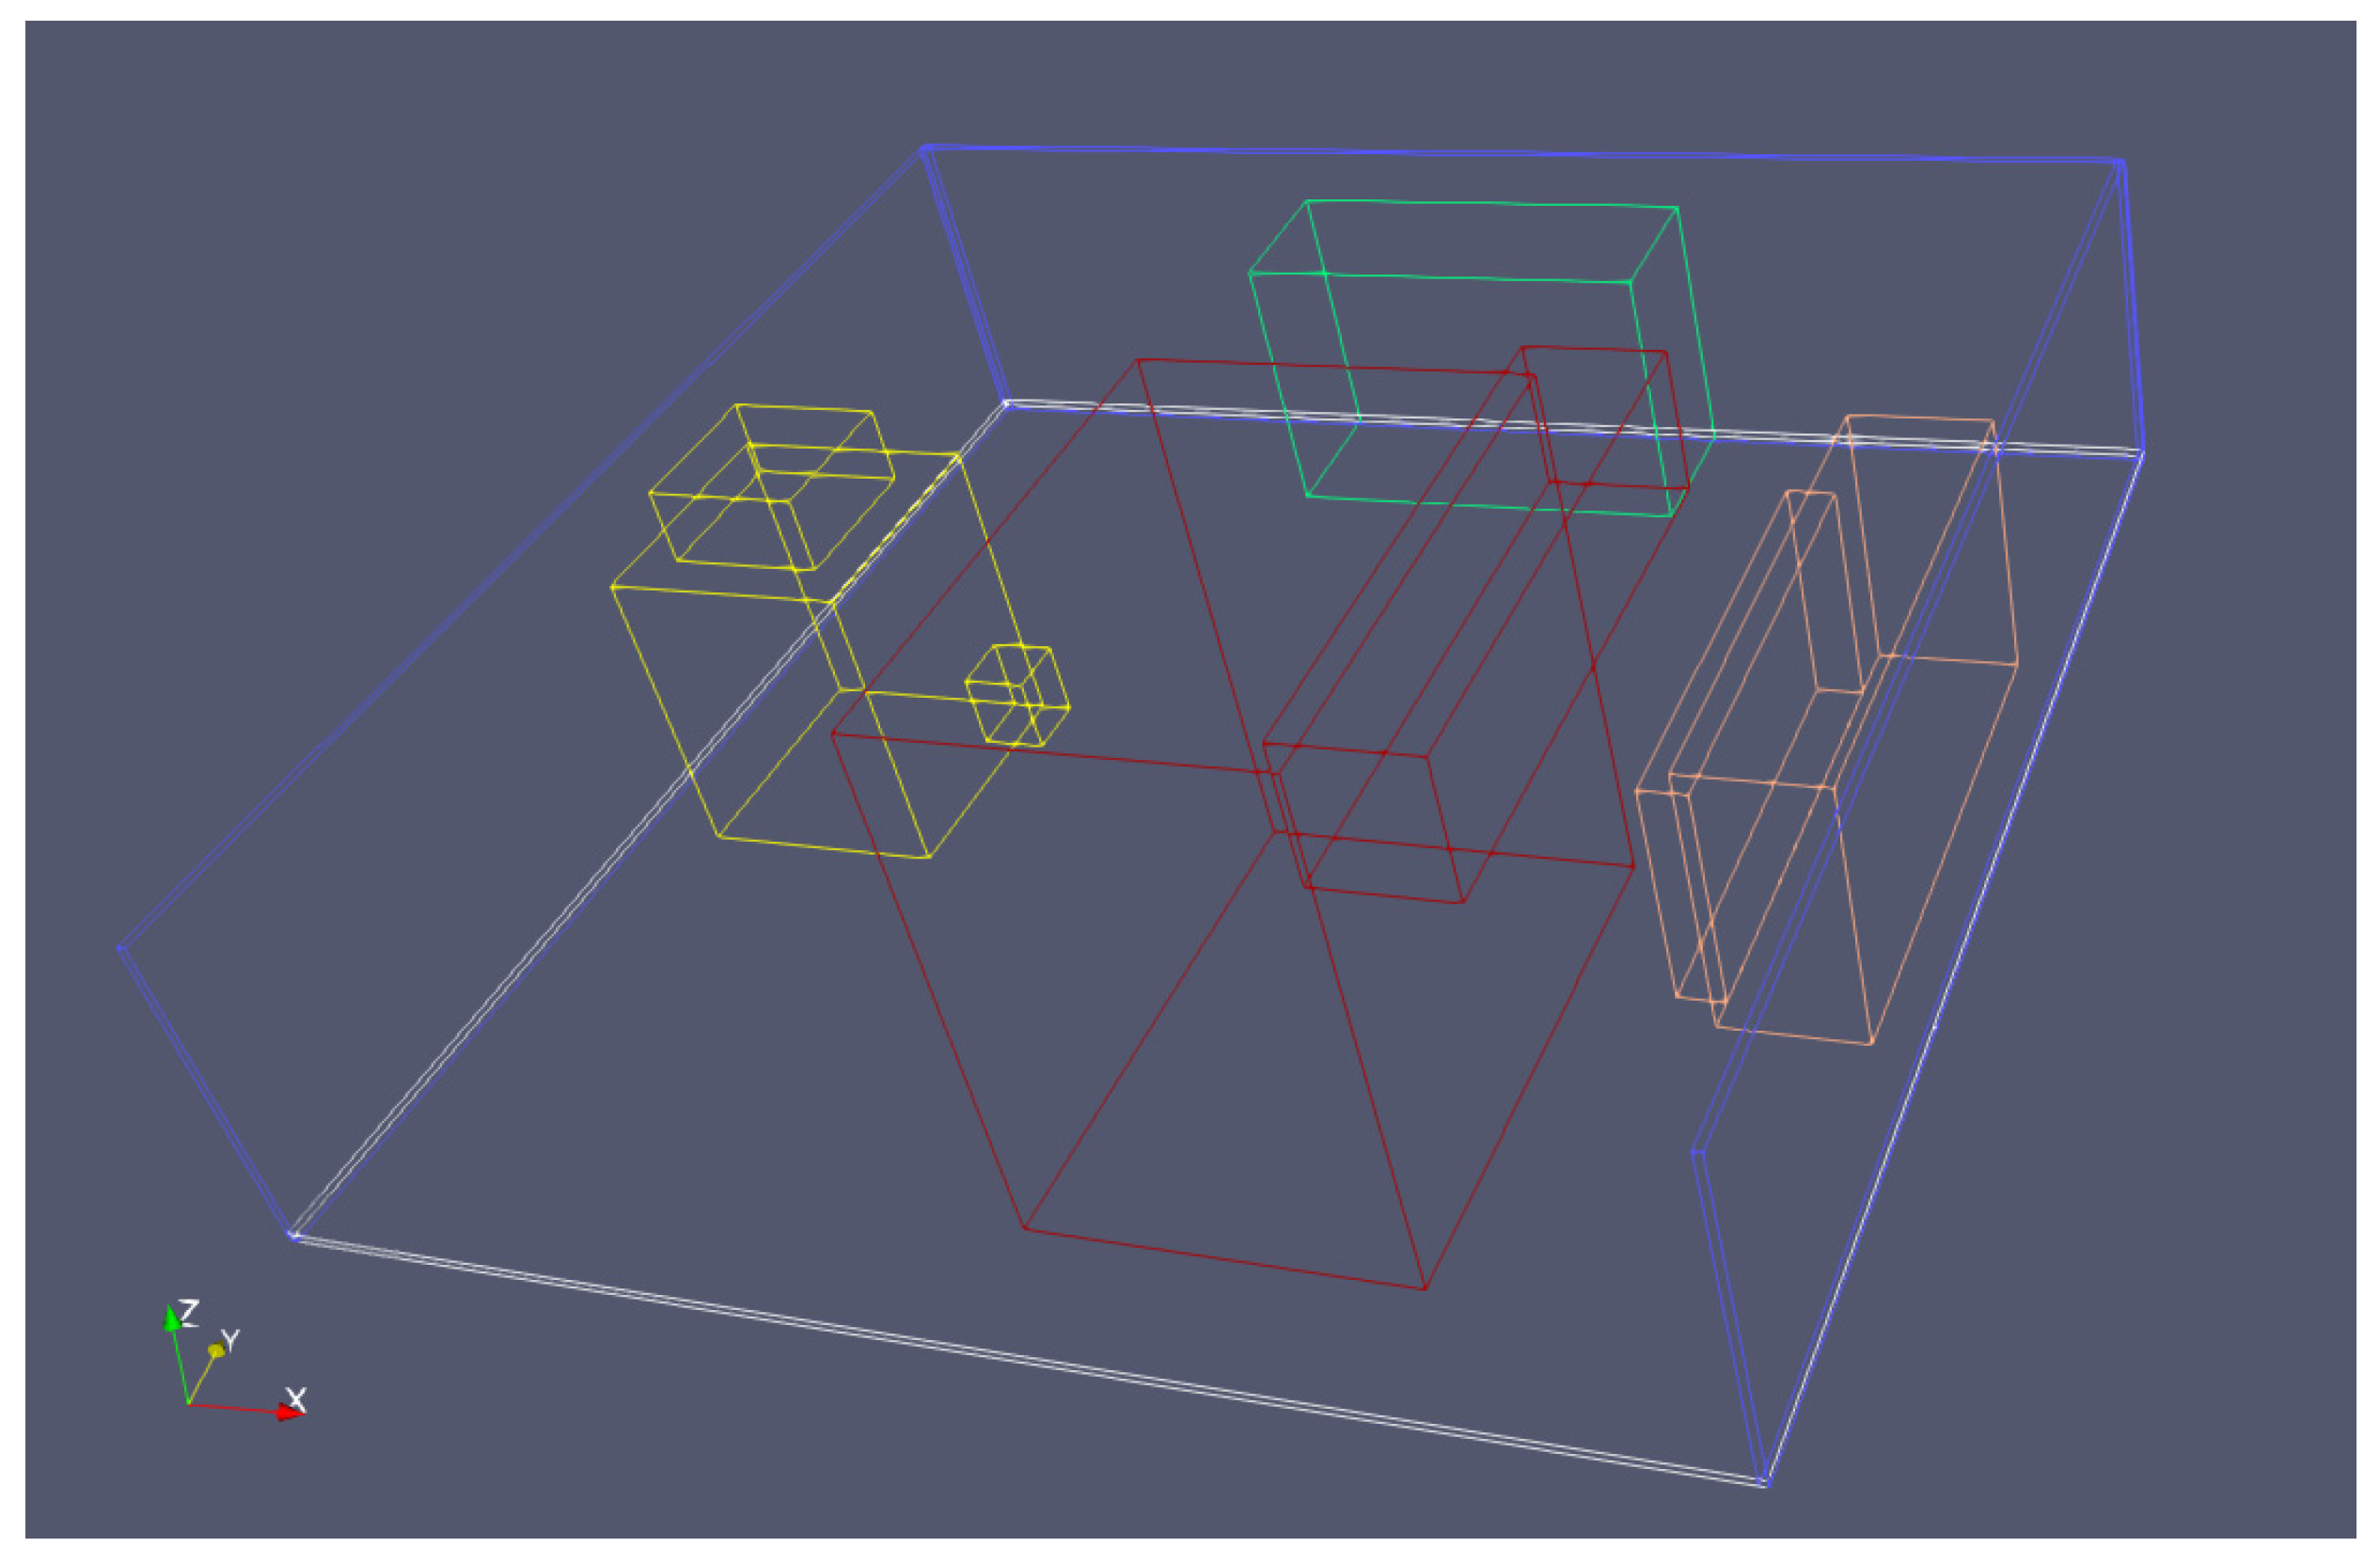
2.3.2. Boundary Conditions

The computational model comprises 675,455 structural elements. Both the vessel structure and explosive charge utilize dynamic meshing, with adaptive refinement occurring during detonation events as illustrated in Figure 11 and Figure 12. Detailed mesh parameters are provided in Table 2. Based on the characteristics of the blastFOAM solver, our tests demonstrate that a time step size of 1 × 10⁻⁷ s provides the optimal balance between explosion simulation accuracy and computational cost constraints [61,62,63,64,65].
At the beginning of the simulation, the temperature in the cabin is 26 °C, the pressure is one standard atmospheric pressure, and the air density is maintained at normal. The specific energy of TNT is 4.184 MJ/kg, and the initial mass of the explosion is 25 KG, so the initial explosion energy is about 104.6 MJ. These four different explosion points have the same conditions except for their locations in Figure 10.

3. Results

3.1. Effect of Explosion Location

Confined space explosion analysis serves two primary objectives: (1) quantifying pressure loads on enclosure surfaces, and (2) evaluating structural component responses to predict failure modes and damage extent. The containment effect significantly amplifies destructive potential compared to open-air detonations of equivalent yield [66].

3.1.1. Boiler

There is a serious risk of explosion when a ship’s engine room boilers are subjected to excessive pressure and temperature. As the main means of supplying energy to the ship, the boiler is responsible for producing steam to drive the ship’s engine and supply hot water inside the ship. However, serious safety issues arise if the boiler loses control during operation, causing pressure and temperature to exceed design limits.
First, overpressure may cause the boiler wall thickness to be overwhelmed and burst, thereby releasing a large amount of high-temperature and high-pressure steam. In this case, it may not only cause serious damage to the boiler equipment but also may be a danger to the safety of the ship itself and the crew as well. Especially if the boiler is located inside a closed engine room, the pressure waves and debris generated by the explosion may cause further serious damage.
Secondly, explosions can cause serious consequences, particularly at high temperatures as Figure 13 and Figure 14. When a boiler is running, it is exposed to high-temperature steam and fuel combustion. If the temperature exceeds the endurance limit of the boiler material, an explosion may occur. This explosion can not only damage the boiler but can also cause a fire or release harmful gases that put the safety of the ship and crew at risk [67].
We also proceed with measuring explosion characteristics at explosion points 3 and 4, which are closer to the boiler. The impact pressure and maximum boiler temperature can be explained and discussed as follows. Since explosion point 4 is located next to the boiler, its direct influence on the boiler will cause a large pressure, causing the maximum stress after the explosion to reach 2.268 Mpa in 0.0012 s after the explosion in Figure 15. At the same time, the heat that spreads around gathers next to the boiler. For surrounding equipment, this level of stress exceeds the yield strength of common structural steels, risking catastrophic deformation of pipe supports and safety valves. At this moment, it reaches 2589 K, which is much higher than the temperature of the engine room. Basically, the temperature inside the boiler is very high and dangerous. The extreme impact pressure of 2.268 MPa at explosion point 4 poses an immediate threat to personnel near the boiler, likely causing severe blunt-force trauma or fatal injuries from flying debris.
The heat and energy accumulation after the instantaneous explosion will not be considered in the subsequent analysis and will not affect the simulation results. Therefore, the negative pressure phase caused by the explosion will not be considered.
At explosion point 4 adjacent to the boiler, our simulation records a peak overpressure of 2.268 MPa within 1.2 ms post-detonation. This aligns with the Brode equation for spherical explosions in confined spaces [68,69], which predicts the following:
P p e a k = 1.067 · E 1 / 3 R ,
where E is energy release and R is the distance between the measuring point and the explosion center. According to the empirical models, the explosion pressure at probe 4 should be 2.18 MPa. Our result deviates by <5% from this empirical model, due to wave reflections and confinement effects unique to the complex engine room geometry.
T ( r ) = T C J ( R 0 R ) 3 ( γ 1 ) ,
where R 0 is the characteristic radius of the charge, which is related to the equivalent of about 0.23 m for 25 kg TNT; γ is the specific heat ratio of the gas. Likewise, the simulated temperature of 2589 K significantly exceeds the 2450 K predicted by standard detonation theory, as the confined space prevents rapid heat dissipation and allows heat to accumulate near the boundaries of the structure. These differences highlight how simplified models systematically underestimate the mechanical and thermal loads in real marine environments.

3.1.2. Centralized Control Room

The pressure in four explosion points located in different positions of the cabin changes over time after the explosion. As a general rule, the further away from the explosion point, the lower the pressure and the stress as well. It can be seen from Figure 16 and Figure 17 that when the explosion detection point is located in the centralized control room, the explosion point exhibits a great relationship with the distance from the centralized control room. When facing the centralized control room, the stress generated by the explosion reaches its peak value in a specific instant, and the pressure touches 2.5 MPa in 7 × 10⁴ s. At this time, the personnel in the centralized control room can be greatly affected by the explosion consequences in Figure 18 and Figure 19. As illustrated in Figure 20, when the explosion occurs at Probe point 3 for 7 × 10⁴ s, the velocity field in the cabin would be expanding outward. At this time, Probe 3 received the highest velocity gradient in all directions and the strongest impact force. Probe point 1 only produces a sudden peak value at the moment of explosion. Due to the transmissibility and movement of the wave, the plot generally follows a decreasing trend until the end of the simulation. At the same time, Probe 4 is effectively blocked by the engine due to the detonation, so there would be no apparent shock response at 2.7 × 10⁴ s after detonation. According to the current data, we observe that the explosion occurs between the engine and the generator. In this scenario, it should be noted that Probe 3 exhibits the maximum point in the pressure graph in the time interval of 1.7 × 10⁴ s–6.5 × 10⁴ s. The appearance of these maximum points deserves our thorough analysis.
First, we notice that the first peak appears at the time point 6.5 × 10⁻⁴ s, which is most likely due to the first impact of the explosion. The pressure at this time reaches 4.55 MPa. This phenomenon shows that the initial stage of the explosion causes impact and significant pressure changes on the mechanical system. This sudden increase in pressure may have caused vibration and stress concentration in the mechanical structure, which in turn leads to severe pressure at detection point 3. The second maximum point appears at the time point of 1.6 × 10⁴ s. The occurrence of this maximum pressure point may be related to the rebound of mechanical equipment and the interaction of shock waves. At this time, the pressure was 1.26 MPa. The extreme overpressure peaks observed—particularly the 4.55 MPa initial blast wave at Probe 3—pose a lethal threat to personnel in the centralized control room, as pressures above 0.2–0.3 MPa are typically fatal due to lung rupture and traumatic brain injury. After detonation, the mechanical system may have experienced a rebound process, leading to the appearance of a second maximum point on the pressure-time plot. In addition, the shock wave propagation mode in the mechanical structure may also affect the pressure change at detection point 3. Overall, current data indicate that explosive events occurring between the engine and the generator have noticeable effects on the surrounding mechanical systems. The subsequent 1.26 MPa rebound wave could further endanger survivors by collapsing weakened structures or triggering secondary equipment failures. These effects include the sudden increase in pressure caused by the initial explosion, as well as the rebound of mechanical equipment and the effects of shock waves. In-depth analysis of these data can provide important clues to better understand the impact of explosive events on mechanical systems.
For critical machinery, such as the engine and generator, the sudden stress concentrations, peaking at 2.5 MPa in the control room, risk cracking welded joints, rupturing pipelines, or deforming support structures. The shock wave rebound effect suggests cyclic loading, which may fatigue metal components, increasing the likelihood of catastrophic failure post-explosion. Additionally, the velocity field expansion indicates high-speed debris hazards, with probe 3’s gradient implying fragmentation risks for nearby electrical systems and fuel lines. The lack of shock response at probe 4 highlights shielding benefits, but trapped energy could exacerbate localized damage, such as bearing misalignment or turbine blade deformation.

3.1.3. Lower Level of the Engine Compartment

First of all, we noticed that the cloud images produced by the explosion at the four locations are essentially the same because, although the explosion is not there, it is still in the first layer and separate from the second layer in Figure 21, Figure 22, Figure 23 and Figure 24. The shapes of explosion point 4 and the other three explosion points are different because explosion point 4 is located directly above this measuring point, it reaches the highest temperature in only 2.2 × 10⁻⁴ s. When the explosion of the generator is transmitted, the maximum pressure is reached, and the pressure waveform at this time is larger than at other points. Figure 25 displays that new wave peaks are generated when the time reaches 2.1 × 10⁻³ s. At this time, it can be considered that the reflection, especially the reflection in the lower part of the lower cabin, has occurred. Since the temperature change is more obvious, it may be offset somewhat. The explosion at point 4 generates significantly higher temperatures and pressures than other locations due to its direct vertical alignment, reaching 2589 K in just 0.22 ms, which poses severe burn risks to nearby personnel. Pressure wave reflections in the lower cabin create secondary peaks at 2.1 ms, potentially causing structural fatigue in engine support components and piping systems. The thermal radiation from point 4’s rapid temperature rise could ignite surrounding fuel lines, compounding the initial blast damage with secondary fire hazards.

3.1.4. Intermediate

The explosion impact damage measured when the measuring points are located between the engine, centralized control room, and generator is a waveform with two obvious peaks, because the superimposed pressure received at this time is the highest, and the explosions in all four positions are first quickly increased to maximum pressure due to the shock waves and brought high temperature. For the time larger than 1 × 10⁻³ s, they spread around, and the impact of the explosion point 1 quickly rises to a new wave peak of magnitude 1.21 MPa, it can be seen that the shock caused by the rebound of the damage is still significant. According to Figure 26, it can be seen that the impact of the boiler on explosion point 3 did not have a strong impact on this probe point compared to other points. At this time, the plotted results in Figure 27 and Figure 28 reveal that the impacts here are relatively similar, and Figure 29 displays that this is also reflected positively. The two curves are extremely consistent, except for the prominent crest. Figure 30 illustrates that the explosion at explosion point 4 not only severely impacts the centralized control room but also raises the space around the centralized control room to a high pressure. Therefore, precautions should be taken into account when facing a response from the front of the centralized control room. The double-peak pressure waveform poses extreme risks to personnel, with the initial 4.55 MPa blast causing fatal trauma and the 1.21 MPa rebound wave collapsing weakened structures.
For this simulation, the subsequent processes involving negative pressure development in the confined space and the gradual temperature variations over time fall outside the scope of our study; therefore, these results are not presented in this paper.
Based on the OpenFOAM software analysis results, the effect of the dynamic response of the ship’s engine room explosion is also of concern to us in the present investigations. Nevertheless, this investigation presents several limitations that warrant consideration: (i) The current simulation simplifies the complex physicochemical processes involved in liquid fuel explosions, particularly neglecting the coupled combustion dynamics and fuel dispersion mechanisms. This omission of ground-level combustible fluid flow may introduce discrepancies between simulated and actual fire development patterns. (ii) The progressive escalation from fuel leakage to full-scale explosion in marine engine compartments represents a critical phenomenon not captured in the present modeling framework. The transitional phase between initial ignition and explosive combustion requires further examination to improve predictive accuracy. The current numerical model exhibits limitations in accurately simulating liquid fuel explosion dynamics, particularly in capturing the complex multiphase combustion processes and transient fuel-air mixing behavior characteristic of maritime fuel explosions; (iii) In this simulation, the explosion simulation may be more sensitive to model parameters and initial conditions. The parameter sensitivity analysis commonly requires huge computational efforts to determine the response of simulation results to parameter changes. Therefore, subsequent simulation with a longer duration and a more comprehensive consideration of the explosion location can be conducted.

3.2. Impact of Explosion Size

3.2.1. Boiler

The monitoring data reveal a characteristic pressure profile at boiler locations, exhibiting an initial sharp pressure peak that scales with explosive mass, followed by rapid decay. The obtained results reveal that as the explosion spreads to other places, the temperature also exhibits the same effect as Figure 31. There will be changes, a slight increase after 2 × 10⁻³ s in the late explosion period, especially the temperature in Figure 32. It can be clearly seen that when the amount of explosive materials is set as TNT = 50 kg, a maximum temperature is produced and the deviation from the maximum value is less than 800 K, which is smaller than the minimum value of the simulated explosion process (temperature = 1200 K). The explosion trends of the five levels of mass of explosive materials show the same pattern and basically, the explosion reaches the maximum value at the same moment. At 0 s–7.5 × 10⁻⁴ s time interval, the more mass, the more damage the boiler suffers; the pressure is no longer the same, especially the pressure at 2.7 × 10⁻³ s–4 × 10⁻³ s with a mass of 25 kg is stronger than the impact of the explosion of other masses, and other pressure lines change alternately as shown Figure 33.

3.2.2. Centralized Control Room

The pressures at the four explosion positions measured in the centralized control room all showed an ascending and then a descending trend. In addition, it follows the rule that the closer the distance, the greater the pressure, but at the same time, the attenuation after reaching the maximum value leads to a different situation. At explosion point 1 in Figure 33, it first drastically decreases and then reaches a maximum value again, but it varies with the shocks of different scales suffered by the boiler. When it reaches the maximum value, the time when the explosion reaches the highest point is different due to different masses, and the peaks of the wave are staggered. The maximum impact on the personnel in the centralized control room is predicted to be 2.35 MPa, which occurs when the explosion point of the generator explodes. At this time, the centralized control room could not withstand the explosion pressure and is most likely completely destroyed. Based on this, further research should be conducted to more comprehensively realize all mechanical mechanisms that are interconnected with the understudied problem. However, a very strange fact is observable. In Figure 33 and Figure 34, the explosion positions of explosion points 1 and 2 are similar, but the maximum values produced are very different, and their pressure and temperature curves are almost completely distinct. This is because the engine blocks the explosion, its explosion wave is more absorbed and the wave reflected by the massive engine is much smaller than the stress wave it absorbs as shown Figure 35 and Figure 36. Therefore, the safety of the explosion point 1 to the centralized control room makes it less risky.

3.2.3. Lower Level of the Engine Compartment

The simulation results indicate that the lower cabin pressure conditions are basically similar. Since all the explosion points are located in the complex upper layer, the explosion waves form the same curve when they travel to the lower layer as shown Figure 37 and Figure 38. In addition, the lower layer has a simple structure, and its structure is not taken into account here, and as a result, the temperature changes are essentially the same. The peak of the first wave is the reflected wave that is transmitted directly, and the peak of the second wave is reflected after bouncing to the ground. This is superimposed with the wave reflected from the upper mechanical structure and forms a secondary fluctuation in Figure 39. This phenomenon is among five very similar explosive masses, all with the same characteristics. Additionally, since the explosion location is the determining factor, the rhythm of the waveform fluctuations is quite different. The detonation point 1, that is, the wave generated by the detonation of the engine, is smooth, complete, and has no inflection point for the time and temperature linear coordinate axes as shown Figure 37. However, for explosion point 4 of the centralized control operating room, the waveform increases sharply and drastically decreases with a turning point, a minimum value is formed in the middle and lasts from 9 × 10⁻⁴ s to 1.1 × 10⁻³ s. The reason for this is due to the refraction and polygon of the lower engine in Figure 40. This is essentially caused by secondary reflection, so although the secondary detection point is directly below the detonation point compared to the others, the results are quite different.

3.2.4. Intermediate

This explosion point is located in the middle of the engine, centralized control room, and generator. Therefore, the situation here is the most complex and the impact is the most extensive. It will be affected by waves bouncing from three parties and even the cabin wall, so the waveform is also the most irregular circular.
First, the wave generated by explosion point 1 first reaches the detection point and moves outward, and then quickly reflects to form a small climax-like waveform. Compared to the smooth curve and the maximum value, it is only slightly convex. This is a common phenomenon, the so-called reflected wave. The line of explosion point 2 is very different from the pressure curve of explosion point 1 in Figure 41 and Figure 42. At the instant of 7.2 × 10⁻⁴ s, the green curve with a mass of 50 kg goes directly to the lowest pressure, which roughly represents half the general atmospheric pressure in the cabin. This is because the heavy, high-mass shape of the engine and generator allows the wave to withstand a maximum, so the stress generated at 2.2 × 10⁻⁴ s also exhibits a maximum as Figure 43. The curve shown in the diagram of the explosion point 3 first increases and then decreases in Figure 44, gradually decreases, and gradually transforms as the mass decreases. Such a variation trend can be detected from the linear graph of temperature.
To quantitatively assess the explosion hazards of alternative fuels under various scenarios, a standardized classification system was established based on TNT equivalence. Five distinct explosion magnitudes were systematically defined along an ascending scale (10, 15, 25, 35, and 50 kg TNT equivalent), representing progressively severe detonation events. This hierarchical classification enables consistent benchmarking of explosion intensities while specifically focusing on evaluating shockwave propagation effects within marine engine compartment configurations. The tiered approach facilitates comparative analysis of structural response to blast loading across different fuel types while maintaining controlled experimental parameters.

4. Discussion

Explosive gases form compression waves when they compress the surrounding air. These waves form the explosion wave and are at the heart of the explosion phenomenon. The effects of high explosives include the release of large amounts of heat energy and strong detonation waves [70]. The reflection of the explosion wave amplifies the incident wave due to the merging effect of the incident and reflected waves. The geometry of the structure and its components also plays a pivotal role in the strength of the explosion pressure.
In general, near the source of the explosion, the temperature rises sharply, possibly reaching levels of thousands of degrees Celsius or even higher. This is because the energy released by the explosion is enormously large, the detonation rapidly elevates ambient temperatures, subjecting proximal materials to intense thermal loading that exceeds their design thresholds. However, as the distance from the explosion source increases, the temperature decreases rapidly since the energy gradually dissipates in space. The effect of the surrounding environment could also have a crucial influence on the temperature distribution. Inside the cabin, the presence of convection and absorption of heat or reflection of surrounding objects may affect temperature changes. Additionally, the gas or flame produced by the explosion reaction also affects the temperature distribution, and in turn, this also impacts the temperature of the surrounding environment. Therefore, the temperature distribution pattern in explosions would be generally a complex process and multiple factors must be taken into account to fully understand its characteristics [71,72].
First, we selected common explosion locations as explosion points and measured the changes in pressure and temperature during the explosion through multiple detection points, and the overpressure and temperature are verified by comparing with existing experiments and simulations [73]. The boiler area represents a high-risk hazard source where explosions may trigger severe chain reactions. The control room requires special attention due to its high personnel density, making explosion simulations crucial for crew safety. The dual-arranged engine-generator set allows examination of both equipment spacing effects on shockwave superposition and spatial heterogeneity of explosion loads in confined spaces. This configuration effectively addresses typical hazard distributions and critical exposure points for personnel and equipment in engine rooms.
The results revealed that when the explosion is located in heavy machinery, it does not affect the amount of stress and impact response at the explosion point. The greater the mass of the explosive, the pressure measured at the four detection points does not increase linearly. Such a crucial fact is mainly attributed to the fact that the damage absorbed in the cabin also increases with mass. In the coupling field of multiple mechanical structures, secondary damage was essentially caused by the superposition of multiple waves produced by the shock wave. In the initial stage of the explosion, the mechanical system was exposed to strong shocks and pressure changes. This sudden increase in pressure may cause vibration and concentration of stress in the mechanical structure, which in turn triggers changes in the surrounding environment. Second, we observed that the shock wave and the reflected wave generated by the explosion propagated inside the mechanical equipment and exhibited a substantial impact on the surrounding environment. These fluctuations not only altered the temperature and speed distribution inside the cabin but may also cause vibration and deformation of the mechanical structure. Especially near the point of explosion, sudden changes in pressure and temperature demonstrated a remarkable effect on mechanical equipment, which may cause damage or even failure of the equipment.
However, we also recognize that this study has limitations. First, the combustion process and the liquid fuel flow before the explosion were not considered in the simulation process, the simulation model did not yet consider the fuel explosion scenario, and thereby this can be regarded as a crucial direction for future works. Second, the model did not take that the computational resources required to simulate an explosion in a ship’s engine room may be large, especially when multi-physics coupling and complex geometries are considered. The existing limitations in computational resources may restrict the resolution and accuracy of simulations, thereby affecting the reliability of the results, which may produce certain differences in results in real-world situations. Finally, the effect of pressure on detonation during the explosion was not taken into account. Further study could focus on the impact of detonation pressure in the vacuum state. At the same time, we also recognized the shortcomings of the simulation model and looked forward to upcoming research works to further improve the model and consider more practical factors to more accurately evaluate the safety and impact resistance of mechanical systems under fire scenarios.

5. Conclusions

This study employed the blastFOAM solver in the open-source software OpenFOAM to examine the effect of an explosion inside the cabin. The three explosion points and data used for analysis were utilized in extensive case studies and numerical analyses, along with the equation of state to accurately calculate the required data at the moment of the explosion and predict potential outcomes.
The study conducted a comprehensive analysis of five distinct explosion scales, each evaluated across four strategically selected detonation locations within the ship’s structure. This multidimensional approach was designed to thoroughly assess the complex effects of explosions on three critical aspects: mechanical equipment integrity, structural design resilience, and onboard personnel safety. The research methodology incorporated advanced computational modeling and empirical data to simulate various blast scenarios, ranging from localized detonations to full-scale explosions. Particular attention was given to pressure wave propagation, structural deformation patterns, and the potential for secondary damage to vital systems.
Boiler Proximity Hazards: Explosions adjacent to the boiler at point 4 generated 2.268 MPa peak pressure within 1.2 ms, exceeding the yield strength of structural steel. Temperatures reached 2589 K, 139 K higher than theoretical predictions of 2450 K due to confined-space heat accumulation. Peak pressure and temperature scaled with explosive mass, with 50 kg TNT producing the most severe effects. Reached 2.35 MPa at the boiler location at probe 4, exceeding structural tolerance. Remained within 800 K of the peak 1200 K baseline during late-stage explosions after 2 × 10⁻³ s. Pressure trends diverged at 2.7 × 10⁻³–4 × 10⁻³ s, with 25 kg TNT unexpectedly exerting stronger localized impact than larger masses.
Centralized Control Room Hazards: The initial blast wave at probe 3 (engine–generator junction) produced 4.55 MPa pressure at 6.5 × 10⁻⁴ s—15× higher than the lethal threshold 0.3 MPa for humans. Secondary rebound waves 1.26 MPa at 1.6 × 10⁻⁴ s risked structural fatigue in welded joints and pipelines. Proximity to the explosion source dictated damage severity. The generator explosion at position 4 generated 2.35 MPa—sufficient to completely destroy the control room. Asymmetric wave propagation was observed: Explosion point 1 engine block showed 50% lower peak pressure than point 2 due to wave absorption by the engine in Figure 33 and Figure 34.
Lower Compartment Dynamics: Explosion point 4 caused rapid temperature spikes with 2589 K in 0.22 ms and secondary pressure peaks with 2.1 MPa at 2.1 ms from floor reflections. Reflected waves caused secondary pressure fluctuations at 9 × 10⁻⁴–1.1 × 10⁻³ s for position 4, with amplitudes varying by explosion location as Figure 40. Temperature curves were nearly identical across masses, highlighting the dominance of structural simplicity in wave attenuation.
Intermediate Zone Complexity: Superimposed shockwaves created dual-peak pressures—an initial 4.55 MPa blast followed by a 1.21 MPa rebound wave, compounding structural damage risks. Waves from three directions created irregular waveforms. For 50 kg TNT, pressure dropped to 50 kPa half of cabin atmospheric pressure at 7.2 × 10⁻⁴ s due to interference in Figure 42.
In summary, this study could provide an important reference for better understanding the impact of explosions on mechanical systems through an in-depth analysis of the dynamic response to ship engine room explosion events. This test offers a specific database to enhance the engine room safety for crew members inside the engine room and also helps marine architects optimize the layout of the internal mechanical structure. Enhancing vessel safety systems through such analyses is critical for protecting maritime assets and ensuring crew survivability during explosive events.

Author Contributions

Conceptualization, Y.Z. and Z.M.; methodology, Z.M.; software, Z.M.; validation, Y.Z., Z.M. and B.Y.; formal analysis, Z.M.; investigation, W.C.; resources, Y.Z.; data curation, Z.M.; writing—original draft preparation, Z.M.; writing—review and editing, Z.M.; visualization, Z.M.; supervision, W.C. and B.Y.; project administration, Y.Z.; funding acquisition, Y.Z. All authors have read and agreed to the published version of the manuscript.

Funding

This research was funded by the Fundamental Research Funds for the Central Universities, grant number 3132024141, and the Shenzhen Science and Technology Program, China (ZDSYS20210929115800001), and the National Natural Science Foundation of China, grant number 52004292.

Data Availability Statement

Data are provided in this article.

Conflicts of Interest

The authors declare no conflicts of interest.

Abbreviations

The following abbreviations are used in this manuscript:
OpenFOAMOpen Field Operation and Manipulation
IMOInternational Maritime Organization
WENOWeighted Essentially Non-Oscillatory
JWLJones–Wilkins–Lee
TNTTrinitrotoluene
LNGLiquefied Natural Gas

References

  1. International Maritime Organization (IMO). Global Integrated Shipping Information System (GISIS); IMO: London, UK, 2019. [Google Scholar]
  2. Sub-Committee on Ship Systems and Equipment, 10th Session (SSE 10), 4–8 March 2024. Available online: https://www.imo.org/en/MediaCentre/MeetingSummaries/Pages/SSE-10th-session.aspx (accessed on 1 April 2025).
  3. Wang, Y.; Bai, W.; Zhang, W.; Chen, S.; Zhao, Y. Optimal Course Tracking Control of USV with Input Dead Zone Based on Adaptive Fuzzy Dynamic Programing. Proc. Inst. Mech. Eng. Part I J. Syst. Control Eng. 2024, 09596518241272850. [Google Scholar] [CrossRef]
  4. Rodríguez Castillo, C.A.; Yeter, B.; Li, S.; Brennan, F.; Collu, M. A Critical Review of Challenges and Opportunities for the Design and Operation of Offshore Structures Supporting Renewable Hydrogen Production, Storage, and Transport. Wind Energy Sci. 2024, 9, 533–554. [Google Scholar] [CrossRef]
  5. Talley, W.K. The Safety of Ferries: An Accident Injury Perspective. Marit. Policy Manag. 2002, 29, 331–338. [Google Scholar] [CrossRef]
  6. Wang, L.; Yang, Z. Bayesian Network Modelling and Analysis of Accident Severity in Waterborne Transportation: A Case Study in China. Reliab. Eng. Syst. Saf. 2018, 180, 277–289. [Google Scholar] [CrossRef]
  7. Franceschini, F.; Rossetto, S. Design for Quality: Selecting a Product’s Technical Features. Qual. Eng. 1997, 9, 681–688. [Google Scholar] [CrossRef]
  8. Cicek, K.; Celik, M. Application of Failure Modes and Effects Analysis to Main Engine Crankcase Explosion Failure On-Board Ship. Saf. Sci. 2013, 51, 6–10. [Google Scholar] [CrossRef]
  9. Chen, J.; Zhang, W.; Li, S.; Zhang, F.; Zhu, Y.; Huang, X. Identifying Critical Factors of Oil Spill in the Tanker Shipping Industry Worldwide. J. Clean. Prod. 2018, 180, 1–10. [Google Scholar] [CrossRef]
  10. Salem, A. Fire Engineering Tools Used in Consequence Analysis. Ships Offshore Struct. 2010, 5, 155–187. [Google Scholar] [CrossRef]
  11. Ugurlu, O.; Yildirim, U.; Yuksekyildiz, E. Marine Accident Analysis with GIS. In Proceedings of the NAV 2012 17th International Conference on Ships and Shipping Research, Naples, Italy, 17–19 October 2012. [Google Scholar]
  12. Tekin, A.; Namias, N.; O’Keeffe, T.; Pizano, L.; Lynn, M.; Prater-Varas, R.; Quintana, O.D.; Borges, L.; Ishii, M.; Lee, S.; et al. A Burn Mass Casualty Event Due to Boiler Room Explosion on a Cruise Ship: Preparedness and Outcomes. Am. Surg. 2005, 71, 210–215. [Google Scholar] [CrossRef]
  13. Talley, W.K.; Jin, D.; Kite-Powell, H. Determinants of the Severity of Cruise Vessel Accidents. Transp. Res. Part D Transp. Environ. 2008, 13, 86–94. [Google Scholar] [CrossRef]
  14. Baalisampang, T.; Abbassi, R.; Garaniya, V.; Khan, F.; Dadashzadeh, M. Review and Analysis of Fire and Explosion Accidents in Maritime Transportation. Ocean Eng. 2018, 158, 350–366. [Google Scholar] [CrossRef]
  15. Ming, F.R.; Zhang, A.M.; Xue, Y.Z.; Wang, S.P. Damage Characteristics of Ship Structures Subjected to Shockwaves of Underwater Contact Explosions. Ocean Eng. 2016, 117, 359–382. [Google Scholar] [CrossRef]
  16. Nurick, G.N.; Martin, J.B. Deformation of Thin Plates Subjected to Impulsive Loading—A Review: Part I: Theoretical Considerations. Int. J. Impact Eng. 1989, 8, 159–170. [Google Scholar] [CrossRef]
  17. Weibull, H.R.W. Pressures Recorded in Partially Closed Chambers at Explosion of Tnt Charges. Ann. N. Y. Acad. Sci. 1968, 152, 357–361. [Google Scholar] [CrossRef]
  18. Chen, Z.; Ren, H.; Ning, H.; Zhou, S.; Long, Z.; Huang, K. Analysis of Flow Field in a Blast Simulator Combined-Driven by Explosive Charge and Compressed Gas. Front. Earth Sci. 2023, 10, 1094415. [Google Scholar] [CrossRef]
  19. Liu, X.-D.; Osher, S.; Chan, T. Weighted Essentially Non-Oscillatory Schemes. J. Comput. Phys. 1994, 115, 200–212. [Google Scholar] [CrossRef]
  20. Jiang, G.-S.; Shu, C.-W. Efficient Implementation of Weighted ENO Schemes. J. Comput. Phys. 1996, 126, 202–228. [Google Scholar] [CrossRef]
  21. Shi, J.; Zhang, Y.-T.; Shu, C.-W. Resolution of High Order WENO Schemes for Complicated Flow Structures. J. Comput. Phys. 2003, 186, 690–696. [Google Scholar] [CrossRef]
  22. Stewart, J.B. Approximating a Free-Field Blast Environment in the Test Section of an Explosively Driven Conical Shock Tube. Shock Waves 2019, 29, 355–360. [Google Scholar] [CrossRef]
  23. Liu, Y.L.; Zhang, A.M.; Tian, Z.L.; Wang, S.P. Numerical Investigation on Global Responses of Surface Ship Subjected to Underwater Explosion in Waves. Ocean Eng. 2018, 161, 277–290. [Google Scholar] [CrossRef]
  24. Li, S.; Liang, Q.Q. Fibre-Based Modelling for Predicting the Progressive Collapse of Cylindrical Shells under Combined Axial Compression and Bending Moment. Eng. Struct. 2022, 272, 114988. [Google Scholar] [CrossRef]
  25. Shin, Y.S. Ship Shock Modeling and Simulation for Far-Field Underwater Explosion. Comput. Struct. 2004, 82, 2211–2219. [Google Scholar] [CrossRef]
  26. Kar, A.R.; Dutta, B.B. Risk Analysis Techniques for Improving Fire Safety Onboard Ships. In Proceedings of the 30th International Conference on Offshore Mechanics and Arctic Engineering, Rotterdam, The Netherlands, 19–24 June 2011; American Society of Mechanical Engineers Digital Collection, 31 October 2011. pp. 1–6. [Google Scholar]
  27. Li, J.; Huang, Z. Fire and Explosion Risk Analysis and Evaluation for LNG Ships. Procedia Eng. 2012, 45, 70–76. [Google Scholar] [CrossRef]
  28. Lutfi Tunçel, A.; Bal Beşikçi, E.; Akyuz, E.; Arslan, O. Safety Analysis of Fire and Explosion (F&E) Accidents Risk in Bulk Carrier Ships under Fuzzy Fault Tree Approach. Saf. Sci. 2023, 158, 105972. [Google Scholar] [CrossRef]
  29. Yang, H.Y.; Kim, D.K.; Cho, N.K.; Li, S. A Study on Hull Girder Longitudinal Strength Prediction by Adopting the Accurate Plate-Combination Model Based on Load-Shortening Curve; American Society of Mechanical Engineers: New York, NY, USA, 2024; Volume 87790, p. V002T02A064. [Google Scholar]
  30. Kong, X.; Zhou, H.; Zheng, C.; Liu, H.; Wu, W.; Guan, Z.; Dear, J.P. An Experimental Study on the Mitigation Effects of Fine Water Mist on Confined-Blast Loading and Dynamic Response of Steel Plates. Int. J. Impact Eng. 2019, 134, 103370. [Google Scholar] [CrossRef]
  31. Nubli, H.; Sohn, J.M. Procedure for Determining Design Accidental Loads in Liquified-Natural-Gas-Fuelled Ships under Explosion Using a Computational-Fluid-Dynamics-Based Simulation Approach. Ships Offshore Struct. 2022, 17, 2254–2271. [Google Scholar] [CrossRef]
  32. Smirnov, N.N.; Panfilov, I.I. Deflagration to Detonation Transition in Combustible Gas Mixtures. Combust. Flame 1995, 101, 91–100. [Google Scholar] [CrossRef]
  33. Kim, D.K.; Yang, H.Y.; Li, S.; Kim, S. An Updated Design Formula for Predicting the Compressive Strength of Plate: Elastic Buckling and Ultimate Compressive Strength. J. Mar. Sci. Eng. 2025, 13, 113. [Google Scholar] [CrossRef]
  34. Yang, A.; Liu, Y.; Gao, K.; Li, R.; Li, Q.; Li, S. Numerical Simulation of Gas Explosion with Non-Uniform Concentration Distribution by Using OpenFOAM. ACS Omega 2023, 8, 48798–48812. [Google Scholar] [CrossRef]
  35. Li, S.; Brennan, F. Digital Twin Enabled Structural Integrity Management: Critical Review and Framework Development. Proc. Inst. Mech. Eng. Part M J. Eng. Marit. Environ. 2024, 238, 707–727. [Google Scholar] [CrossRef]
  36. Khan, R.U.; Yin, J.; Mustafa, F.S.; Liu, H. Risk Assessment and Decision Support for Sustainable Traffic Safety in Hong Kong Waters. IEEE Access 2020, 8, 72893–72909. [Google Scholar] [CrossRef]
  37. Uğurlu, Ö.; Köse, E.; Yıldırım, U.; Yüksekyıldız, E. Marine Accident Analysis for Collision and Grounding in Oil Tanker Using FTA Method. Marit. Policy Manag. 2015, 42, 163–185. [Google Scholar] [CrossRef]
  38. Arslan, O.; Er, I.D. SWOT Analysis for Safer Carriage of Bulk Liquid Chemicals in Tankers. J. Hazard. Mater. 2008, 154, 901–913. [Google Scholar] [CrossRef] [PubMed]
  39. Ellis, J. Analysis of Accidents and Incidents Occurring during Transport of Packaged Dangerous Goods by Sea. Saf. Sci. 2011, 49, 1231–1237. [Google Scholar] [CrossRef]
  40. Cao, X.; Lam, J.S.L. A Fast Reaction-Based Port Vulnerability Assessment: Case of Tianjin Port Explosion. Transp. Res. Part A Policy Pract. 2019, 128, 11–33. [Google Scholar] [CrossRef]
  41. Kim, D.K.; Wong, A.M.K.; Hwang, J.; Li, S.; Cho, N.-K. A Novel Formula for Predicting the Ultimate Compressive Strength of the Cylindrically Curved Plates. Int. J. Nav. Archit. Ocean Eng. 2024, 16, 100562. [Google Scholar] [CrossRef]
  42. Wu, C.; Huang, L. A New Accident Causation Model Based on Information Flow and Its Application in Tianjin Port Fire and Explosion Accident. Reliab. Eng. Syst. Saf. 2019, 182, 73–85. [Google Scholar] [CrossRef]
  43. Zhang, Y.; Jing, L.; Sun, C. Systems-Based Analysis of China-Tianjin Port Fire and Explosion: A Comparison of HFACS, AcciMap, and STAMP. J. Fail. Anal. Preven. 2018, 18, 1386–1400. [Google Scholar] [CrossRef]
  44. Bhardwaj, U.; Teixeira, A.P.; Guedes Soares, C.; Ariffin, A.K.; Singh, S.S. Evidence Based Risk Analysis of Fire and Explosion Accident Scenarios in FPSOs. Reliab. Eng. Syst. Saf. 2021, 215, 107904. [Google Scholar] [CrossRef]
  45. Kang, J.; Lv, K.; Sun, Y.; Li, M. Predictive Risk Assessment Framework for Leakage Accident of Offshore LNG Transfer System. Expert Syst. Appl. 2025, 271, 126580. [Google Scholar] [CrossRef]
  46. Heylmun, J.; Vonk, P.; Brewer, T. Blastfoam Theory and User Guide; Synthetik Applied Technologies: Austin, TX, USA, 2019. [Google Scholar]
  47. Gao, Y.; Yang, B.; Zhu, H.; Peng, G.; Zhang, Z.; Pan, G. Numerical Simulation of Flow Induced Vibration of Two Rigidly Connected Cylinders in Different Arrangements. Ships Offshore Struct. 2022, 17, 1142–1158. [Google Scholar] [CrossRef]
  48. Li, G.; Shi, D.; Wang, L.; Zhao, K.; Helal, W.M.K. Numerical Study on Structural Damage Characteristics under Long Pulse Width of Underwater Nuclear Explosions. Ships Offshore Struct. 2023, 18, 1746–1754. [Google Scholar] [CrossRef]
  49. Liu, K.; Lu, Y.; Wang, Z.; Wang, G. An Experimental, Numerical and Analytical Study on Deformation Mechanisms of Web Girders in a Collision or Grounding Incident. Ships Offshore Struct. 2019, 14, 839–852. [Google Scholar] [CrossRef]
  50. Zhang, S.; Guo, X.; Gan, X.; Gong, C.; Yang, W.; Li, C. Numerical study of detonation shock with partitioned fluid-structure interaction simulations. kqdlxxb 2022, 40, 163–172. [Google Scholar] [CrossRef]
  51. Shehu, E.; Lomazzi, L.; Giglio, M.; Manes, A. Computational Modeling of Confined Blast Waves with Focus on Interaction with Structures. IOP Conf. Ser. Mater. Sci. Eng. 2023, 1275, 012028. [Google Scholar] [CrossRef]
  52. Wu, J.; Sun, Z.; Jiang, Y.; Zhang, G.; Sun, T. Experimental and Numerical Study of Slamming Problem for a Trimaran Hull. Ships Offshore Struct. 2021, 16, 46–53. [Google Scholar] [CrossRef]
  53. Jeremić, R.; Bajić, Z. An Approach to Determining the TNT Equivalent of High Explosives. Sci. Tech. Rev. 2006, 56, 58–62. [Google Scholar]
  54. Shakor, Z.M.; AbdulRazak, A.A.; Sukkar, K.A. A Detailed Reaction Kinetic Model of Heavy Naphtha Reforming. Arab. J. Sci. Eng. 2020, 45, 7361–7370. [Google Scholar] [CrossRef]
  55. Salakhi, M.; Eghtesad, A.; Afshin, H. Heat and Mass Transfer Analysis and Optimization of Freeze Desalination Utilizing Cold Energy of LNG Leaving a Power Generation Cycle. Desalination 2022, 527, 115595. [Google Scholar] [CrossRef]
  56. UFC 3-340-02; Structures to Resist the Effects of Accidental Explosions. U.S. Department of Defense: Washington, DC, USA, 2008.
  57. Li, S.; Hu, Z.; Benson, S. Progressive Collapse Analysis of Ship Hull Girders Subjected to Extreme Cyclic Bending. Mar. Struct. 2020, 73, 102803. [Google Scholar] [CrossRef]
  58. Wu, C.; Zhang, G.; He, Y.; Liu, L.; Liu, J.; Yang, X. Dynamic Response of Blast Doors Enhanced by Enclosed-Space TNT Explosions: Experimental and Numerical Study. Def. Technol. 2025. [Google Scholar] [CrossRef]
  59. Yang, B.; Wang, D. Dynamic Ultimate Hull Girder Strength Analysis on a Container Ship under Impact Bending Moments. Int. J. Offshore Polar Eng. 2018, 28, 105–111. [Google Scholar] [CrossRef]
  60. Liu, H.-H.; Rutqvist, J.; Berryman, J.G. On the Relationship between Stress and Elastic Strain for Porous and Fractured Rock. Int. J. Rock Mech. Min. Sci. 2009, 46, 289–296. [Google Scholar] [CrossRef]
  61. Mohotti, D.; Wijesooriya, K.; Weckert, S. A Simplified Approach to Modelling Blasts in Computational Fluid Dynamics (CFD). Def. Technol. 2023, 23, 19–34. [Google Scholar] [CrossRef]
  62. Sun, J.; Wang, Y.; Tian, B.; Chen, Z. detonationFoam: An Open-Source Solver for Simulation of Gaseous Detonation Based on OpenFOAM. Comput. Phys. Commun. 2023, 292, 108859. [Google Scholar] [CrossRef]
  63. Gnedin, N.Y.; Semenov, V.A.; Kravtsov, A.V. Enforcing the Courant–Friedrichs–Lewy Condition in Explicitly Conservative Local Time Stepping Schemes. J. Comput. Phys. 2018, 359, 93–105. [Google Scholar] [CrossRef]
  64. Weng, Z.; Mével, R. Implementation of an OpenFOAM Solver for Shock and Detonation Simulation at High Pressure. Comput. Fluids 2023, 265, 106012. [Google Scholar] [CrossRef]
  65. De Moura, C.A.; Kubrusly, C.S. The Courant–Friedrichs–Lewy (Cfl) Condition. AMC 2013, 10, 45–90. [Google Scholar]
  66. Edri, I.; Savir, Z.; Feldgun, V.R.; Karinski, Y.S.; Yankelevsky, D.Z. On Blast Pressure Analysis Due to a Partially Confined Explosion: I. Experimental Studies. Int. J. Prot. Struct. 2011, 2, 1–20. [Google Scholar] [CrossRef]
  67. Kim, E.S. Fracture Analysis of Tube Boiler for Physical Explosion Accident. Forensic Sci. Int. 2017, 278, e1–e7. [Google Scholar] [CrossRef]
  68. Brode, H.L. Numerical Solutions of Spherical Blast Waves. J. Appl. Phys. 1955, 26, 766–775. [Google Scholar] [CrossRef]
  69. Brode, H.L. Blast Wave from a Spherical Charge. Phys. Fluids 1959, 2, 217–229. [Google Scholar] [CrossRef]
  70. Remennikov, A.M. Blast Resistant Consulting: A New Challenge for Structural Engineers. Aust. J. Struct. Eng. 2002, 4, 121–134. [Google Scholar] [CrossRef]
  71. Lee Perry, W.; Clements, B.; Ma, X.; Mang, J.T. Relating Microstructure, Temperature, and Chemistry to Explosive Ignition and Shock Sensitivity. Combust. Flame 2018, 190, 171–176. [Google Scholar] [CrossRef]
  72. Luo, Z.; Li, R.; Wang, T.; Cheng, F.; Liu, Y.; Yu, Z.; Fan, S.; Zhu, X. Explosion Pressure and Flame Characteristics of CO/CH4/Air Mixtures at Elevated Initial Temperatures. Fuel 2020, 268, 117377. [Google Scholar] [CrossRef]
  73. Jeong, B.; Lee, B.S.; Zhou, P. Quantitative Risk Assessment of Fuel Preparation Room Having High-Pressure Fuel Gas Supply System for LNG Fuelled Ship. Ocean Eng. 2017, 137, 450–468. [Google Scholar] [CrossRef]
Figure 1. The geometry of the validation.
Jmse 13 01051 g001
Figure 2. Pressure at point P1 for three mesh sizes.
Jmse 13 01051 g002
Figure 3. Pressure distribution at different times of the simulation.
Jmse 13 01051 g003
Figure 4. Comparison of overpressure curves for experiment and simulation data: (a) P1; (b) P2.
Jmse 13 01051 g004
Figure 5. Cabin oblique view from above.
Jmse 13 01051 g005
Figure 6. Cabin top view.
Jmse 13 01051 g006
Figure 7. Cabin right view.
Jmse 13 01051 g007
Figure 8. Frame line drawing.
Jmse 13 01051 g008
Figure 9. All detection probes.
Jmse 13 01051 g009
Figure 10. Distribution map of four explosion points in the simulation.
Jmse 13 01051 g010
Figure 11. Right view grid diagram (generator surface).
Jmse 13 01051 g011
Figure 12. Grid diagram of detonation points.
Jmse 13 01051 g012
Figure 13. Explosion point 3 detected by the boiler (probe 4): (a) pressure; (b) temperature.
Jmse 13 01051 g013
Figure 14. Explosion point 4 detected by the boiler (probe 4): (a) pressure; (b) temperature.
Jmse 13 01051 g014
Figure 15. Numerical variations at two explosion locations measured at the boiler location (probe 4): (a) pressure; (b) temperature.
Jmse 13 01051 g015
Figure 16. Explosion point 1 centralized control room (probe 1): (a) pressure; (b) temperature.
Jmse 13 01051 g016
Figure 17. Explosion point 2 centralized control room (probe 1): (a) pressure; (b) temperature.
Jmse 13 01051 g017
Figure 18. Explosion point 3 centralized control room (probe 1): (a) pressure; (b) temperature.
Jmse 13 01051 g018
Figure 19. Explosion point 3 centralized control room (probe 1): (a) pressure; (b) temperature.
Jmse 13 01051 g019
Figure 20. Numerical change at four explosion locations measured in the centralized control room (probe 1): (a) pressure; (b) temperature.
Jmse 13 01051 g020
Figure 21. Lower level of the engine compartment (probe 2) at explosion point 1: (a) pressure; (b) temperature.
Jmse 13 01051 g021
Figure 22. Lower level of the engine compartment (probe 2) at explosion point 2: (a) pressure; (b) temperature.
Jmse 13 01051 g022
Figure 23. Lower level of the engine compartment (probe 2) at explosion point 3: (a) pressure; (b) temperature.
Jmse 13 01051 g023
Figure 24. Lower level of the engine compartment (probe 2) at explosion point 4: (a) pressure; (b) temperature.
Jmse 13 01051 g024
Figure 25. Numerical change at four explosion locations measured at the lower level of the cabin (probe 2): (a) pressure; (b) temperature.
Jmse 13 01051 g025
Figure 26. The intermediate position (probe 3) at explosion point 1: (a) pressure; (b) temperature.
Jmse 13 01051 g026
Figure 27. The intermediate position (probe 3) at explosion point 2: (a) pressure; (b) temperature.
Jmse 13 01051 g027
Figure 28. The intermediate position (probe 3) at explosion point 3: (a) pressure; (b) temperature.
Jmse 13 01051 g028
Figure 29. The intermediate position (probe 3) at explosion point 4: (a) pressure; (b) temperature.
Jmse 13 01051 g029
Figure 30. Numerical change at four explosion positions measured at the intermediate position (probe 3): (a) pressure; (b) temperature.
Jmse 13 01051 g030
Figure 31. Explosion data at position 3 measured by boiler position probe (probe 4): (a) pressure; (b) temperature.
Jmse 13 01051 g031
Figure 32. Explosion data at position 4 measured by the boiler position probe (probe 4): (a) pressure; (b) temperature.
Jmse 13 01051 g032
Figure 33. Explosion data at position 1 measured by the centralized control room (probe 1): (a) pressure; (b) temperature.
Jmse 13 01051 g033
Figure 34. Explosion data at position 2 measured by the centralized control room (probe 1): (a) pressure; (b) temperature.
Jmse 13 01051 g034
Figure 35. Explosion data at position 3 measured by the centralized control room probe (probe 1): (a) pressure; (b) temperature.
Jmse 13 01051 g035
Figure 36. Explosion data at position 4 measured by the centralized control room probe (probe 1): (a) pressure; (b) temperature.
Jmse 13 01051 g036
Figure 37. Explosion data at position 1 measured by the lower level of the engine compartment (probe 2): (a) pressure; (b) temperature.
Jmse 13 01051 g037
Figure 38. Explosion data at position 2 measured by the lower level of the engine compartment (probe 2): (a) pressure; (b) temperature.
Jmse 13 01051 g038
Figure 39. Explosion data at position 3 measured by the lower level of the engine compartment probe: (a) pressure; (b) temperature.
Jmse 13 01051 g039
Figure 40. Explosion temperature at position four measured by the lower level of the engine compartment (probe 2): (a) pressure; (b) temperature.
Jmse 13 01051 g040
Figure 41. Explosion temperature at the position 1 measured by the probe in the intermediate of the cabin (probe 3): (a) pressure; (b) temperature.
Jmse 13 01051 g041
Figure 42. Explosion temperature at the position 2 measured by the probe in the intermediate of the cabin (probe 3): (a) pressure; (b) temperature.
Jmse 13 01051 g042
Figure 43. Explosion temperature at the position 3 measured by the probe in the intermediate of the cabin (probe 3): (a) pressure; (b) temperature.
Jmse 13 01051 g043
Figure 44. Explosion temperature at the position 4 measured by the probe in the intermediate of the cabin (probe 3): (a) pressure; (b) temperature.
Jmse 13 01051 g044
Table 1. Explosives on board and their equivalent in TNT [53,54,55].
Explosive Type Mass   Specific   Energy   Q X  (kJ/kg) TNT   Equivalent   Q X / Q T N T
LPG46,10010.199
Naphtha42,8009.469
Diesel fuel42,7009.447
LNG55,50012.279
TNT45201.000
Table 2. Mesh characteristics.
Mesh SizePointsFacesCellsBoundary PatchesMeshing Method
0.15 m154,591392,979119,33818BlockMesh; SnappyHexMesh; DynamicMesh
Disclaimer/Publisher’s Note: The statements, opinions and data contained in all publications are solely those of the individual author(s) and contributor(s) and not of MDPI and/or the editor(s). MDPI and/or the editor(s) disclaim responsibility for any injury to people or property resulting from any ideas, methods, instructions or products referred to in the content.

