1. Introduction
Methane hydrate is a solid crystalline compound where methane (CH4) is trapped within a water lattice under high-pressure, low-temperature conditions. It is commonly found in permafrost and deep-sea sediments at depths between 400 and 1000 m, where temperatures range from 1.5 to 5.0 °C [
1,
2,
3]. With a density of approximately 0.9 g/cm
3 [
4] and a nominal chemical formula of C
4H
62O
23 [
5], methane hydrate occupies pore spaces within sediments and represents one of the largest natural methane reservoirs on Earth.
The estimated global methane hydrate reserves range from (1–5) × 10
15 m
3 containing roughly twice the amount of carbon found in all known conventional fossil fuel deposits. Under standard conditions, one cubic meter of methane hydrate releases approximately 170 m
3 of methane gas upon dissociation. If effectively extracted, methane hydrate could serve as an alternative hydrocarbon energy source, offering a lower carbon footprint compared to coal and oil—burning methane produces about 32% less CO
2 than diesel and 42% less than coal [
6]. However, hydrate production from marine and permafrost reservoirs poses substantial technical challenges, including wellhead instability due to sediment weakening [
7] and the need for advanced stimulation methods, such as CO
2 fracturing in tight formations, to improve the recovery efficiency while preserving reservoir integrity [
8]. Additionally, methane is a potent greenhouse gas, with a global warming potential that is approximately 20 times greater than CO
2 [
9]. The release of methane from destabilized hydrates is of significant concern, as it could accelerate climate change through a feedback loop of rising temperatures and increased methane emissions. This scenario is thought to have contributed to past climate events, such as the Paleocene–Eocene Thermal Maximum (PETM) 55 million years ago, when global temperatures rose abruptly due to a large-scale methane release from subduction zones [
10].
The release of methane from ocean floor formations can negatively impact benthic ecosystems [
11]. Once released, methane undergoes both anaerobic and aerobic oxidation [
12], primarily mediated by methanotrophic microorganisms [
13,
14]. These processes consume dissolved oxygen and may lead to hypoxic or even anoxic conditions, causing stress or mortality among benthic species such as worms, mollusks, and crustaceans. In severe cases, prolonged oxygen depletion can lead to so-called “dead zones”, where aerobic life is unsustainable [
15]. Additionally, the dissociation of 1 m
3 of methane hydrate releases about 0.8 m
3 of water [
16] and approximately 164 m
3 of methane gas [
17], which can destabilize sediments and lead to submarine landslides. Such events pose geohazard risks, including tsunami generation [
18], as shown by the Storegga Slides near Norway [
19,
20].
Thus, understanding methane hydrate saturation—defined as the fraction of pore space occupied by methane hydrate—is crucial for both resource assessment and environmental monitoring. Saturation levels vary widely, typically ranging from 5% to 40% [
21]. In some locations, such as the Black Ridge near the South Carolina coast, saturations as low as 2–3% have been reported [
22], while deposits at Mount Elbert, Alaska, have reached 50–54% [
23]. Conventional methods for detecting methane hydrate—such as seismic velocity analysis and electrical resistivity logging—rely on changes in physical properties rather than the direct identification of hydrate. For example, hydrate increases the stiffness of the sediment matrix, resulting in higher seismic velocities, and acts as an electrical insulator, which increases the bulk resistivity [
24]. These methods typically use semi-empirical models, such as Archie’s law, to estimate hydrate saturation, but are limited by the lack of robust calibration data and the variability of subsurface conditions [
25]. In permafrost environments, gas hydrate and ice exhibit similar acoustic responses, which complicates their distinction using seismic techniques [
26]. Even in recent coupled geophysical–geothermal frameworks, the accurate quantification of hydrate saturation remains highly dependent on the precision of measured thermal conductivity and elastic wave velocities [
27].
In contrast, the AAP technique provides direct elemental sensitivity by detecting prompt gamma rays from inelastic neutron scattering on 12C nuclei. This approach allows for the specific, in situ identification of methane hydrate based on its carbon content, without relying on secondary geophysical signatures or assumptions about local formation properties.
In this study, the associated alpha particle (AAP) technique was applied to detect methane hydrate and determine the minimum detection limit (MDL) in one-hour measurements. The AAP technique, which utilizes neutron time-of-flight (t-o-f) measurements, provides precise neutron tagging, significantly reducing background noise when compared to the conventional fast neutron activation analysis method. Successfully used in contraband detection [
28,
29,
30,
31,
32,
33], this method was lately implemented in the development of a neutron probe for C/O logging [
34,
35,
36]. There, it was shown that the background noise in the C/O ratio determination was substantially reduced, as conventional fast neutron activation activates all surrounding material, while the AAP method effectively confines the neutron interrogation volume by tagging only those neutrons emitted in coincidence with the detected alpha particle. By leveraging the improved signal-to-noise ratio offered by AAP-based neutron interactions, this study aims to evaluate the feasibility of methane hydrate detection and establish its MDL under controlled experimental conditions. To the best of our knowledge, this is the first application of the AAP technique for the quantification of methane hydrates using the prompt gamma detection of inelastic scattering on carbon.
2. Materials and Methods
The AAP technique utilizes an electronically collimated neutron beam, achieved through neutron time-of-flight (t-o-f) measurements [
31,
33]. Neutrons are produced through the deuterium–tritium (D-T) fusion reaction, which generates a 14 MeV neutron and a 3.5 MeV alpha particle. Due to momentum conservation, these particles are emitted in opposite directions in the center-of-mass frame. The t-o-f measurement tags the neutron using the alpha particle detection as the start signal and the gamma-ray, emitted from inelastic neutron scattering A(n,n′
)A′, as the stop signal. This electronic collimation method defines a cone of tagged neutrons, whose angle is determined by the size of the alpha detector and its distance from the D-T reaction. The full timing and signal-processing chain of the AAP-based detection system is illustrated in
Figure 1.
In this experiment, the AAP technique was used to irradiate four samples consisting of quartz sand (SiO2), water, and a methane hydrate simulant. The methane hydrate simulant was mixed with quartz sand (from Semmelrock, Otok Oštarijski, Croatia) to simulate hydrate-bearing sediments, with hydrate occupying the pore spaces between sand grains. The outcome of the measurement was the net number of gamma-ray counts in the 4.04–4.63 MeV energy window, corresponding to the 4.44 MeV peak from inelastic scattering on carbon. These net counts were calibrated against methane hydrate saturation, defined as the volumetric fraction of the total pore space occupied by hydrate simulant, expressed in percent.
The setup included an API-120 neutron generator (from Thermo Fischer Scientific, Waltham, MA, USA) with an integrated YAP:Ce alpha detector, while gamma-ray detection was performed using a 7.62 cm × 7.62 cm LaBr
3 detector (from Saint-Gobain, Paris, France). Both detectors, along with their power supplies, were positioned in the lower section of a Kevlar submarine [
32] with approximate dimensions of 105 cm × 112 cm × 48 cm (
Figure 2).
A motorized rotation system was attached to the neutron generator, allowing the neutron cone to be adjusted in 1° increments. To minimize interference from unwanted gamma radiation, a lead shield in the form of a truncated cone was positioned between the neutron source and gamma detector. The LaBr
3 detector was mounted on an aluminum plate, which acted as a neutron-transparent window while reducing the influence of carbon from the submarine walls. The entire system was raised by 10 cm using lead bricks, positioning it above an iron stand that served as the base for sample placement (
Figure 3). The experimental setup, including detector arrangement, mechanical assembly, shielding, and electronic signal processing, was fully designed and assembled by the authors.
As our laboratory does not possess the equipment necessary to synthesize methane hydrate under high-pressure and low-temperature conditions, an alternative approach was adopted. Consequently, a simulant was prepared following the method described in [
3]. The mixture consisted of water and sucrose sugar (C
12H
22O
11, from Viro, Virovitica, Croatia) in a 3:1 mass ratio, resulting in a final density of 1.08 g/cm
3, slightly exceeding the nominal density of natural methane hydrate (0.9 g/cm
3). Since the detection signal in our method arises from prompt gamma-rays produced by the inelastic scattering of fast neutrons on
12C nuclei, the number of carbon atoms within the neutron interaction volume directly determines the observed count rate. Matching the density therefore ensures that the simulant yields a similar volumetric carbon concentration to that of natural methane hydrate systems.
The components were thoroughly mixed until the sugar was fully dissolved, which was visually confirmed by the disappearance of any solid sugar crystals and the formation of a clear, homogeneous solution. The total amount of simulant prepared for each measurement corresponded to the desired volumetric occupancy of the pore space in the sand. The simulant was poured slowly into the sand matrix to ensure even distribution, and no heating or pressurization was applied at any stage of preparation.
Each sample was composed of 7.7 kg of quartz sand, evenly distributed within an inox plate (IKEA, Delft, The Netherlands) measuring . The sand granule size ranged from 0.1 mm to 1.3 mm, with a total pore volume of 2.4 L. This volume was determined by fully saturating the sand with water until a thin layer covered the surface, ensuring 100% saturation.
The methane hydrate saturation of each sample was varied by adjusting the ratio of water to simulant within the available pore volume. The four selected saturation levels were 100%, 80%, 60%, and 0%. In this context, “100% methane hydrate saturation” refers to the complete filling of the available pore space with the methane hydrate simulant. It does not imply a physical phase conversion of water into real hydrate, but rather denotes a volumetric occupancy of the porous matrix by the simulant material. The 0% methane hydrate case, representing complete water saturation, was used as a baseline for background correction in detection limit calculations.
The neutron source angle and optimal target placement were determined prior to the sample measurements. Due to the excess carbon in the methane hydrate simulant, optimization focused on maximizing the intensity of the 4.44 MeV gamma-ray peak from inelastic neutron scattering. A 10 cm × 10 cm × 10 cm carbon brick was irradiated along the x axis at seven positions, spaced 5 cm apart, with the first position farthest from the neutron source (
Figure 4). At each position, the source angle
was varied from 27° to 34° relative to the initial neutron beam angle of
.
Each calibration step recorded
detected alpha particles. The 4.44 MeV peak intensity was analyzed across different target positions and angles (
Figure 5), and a Gaussian fit was applied to determine the optimal neutron source angle (
Figure 6). The highest amplitude was observed at
, which was then selected as the optimal source angle. The corresponding x axis target position was also determined from the centroid of the Gaussian fit.
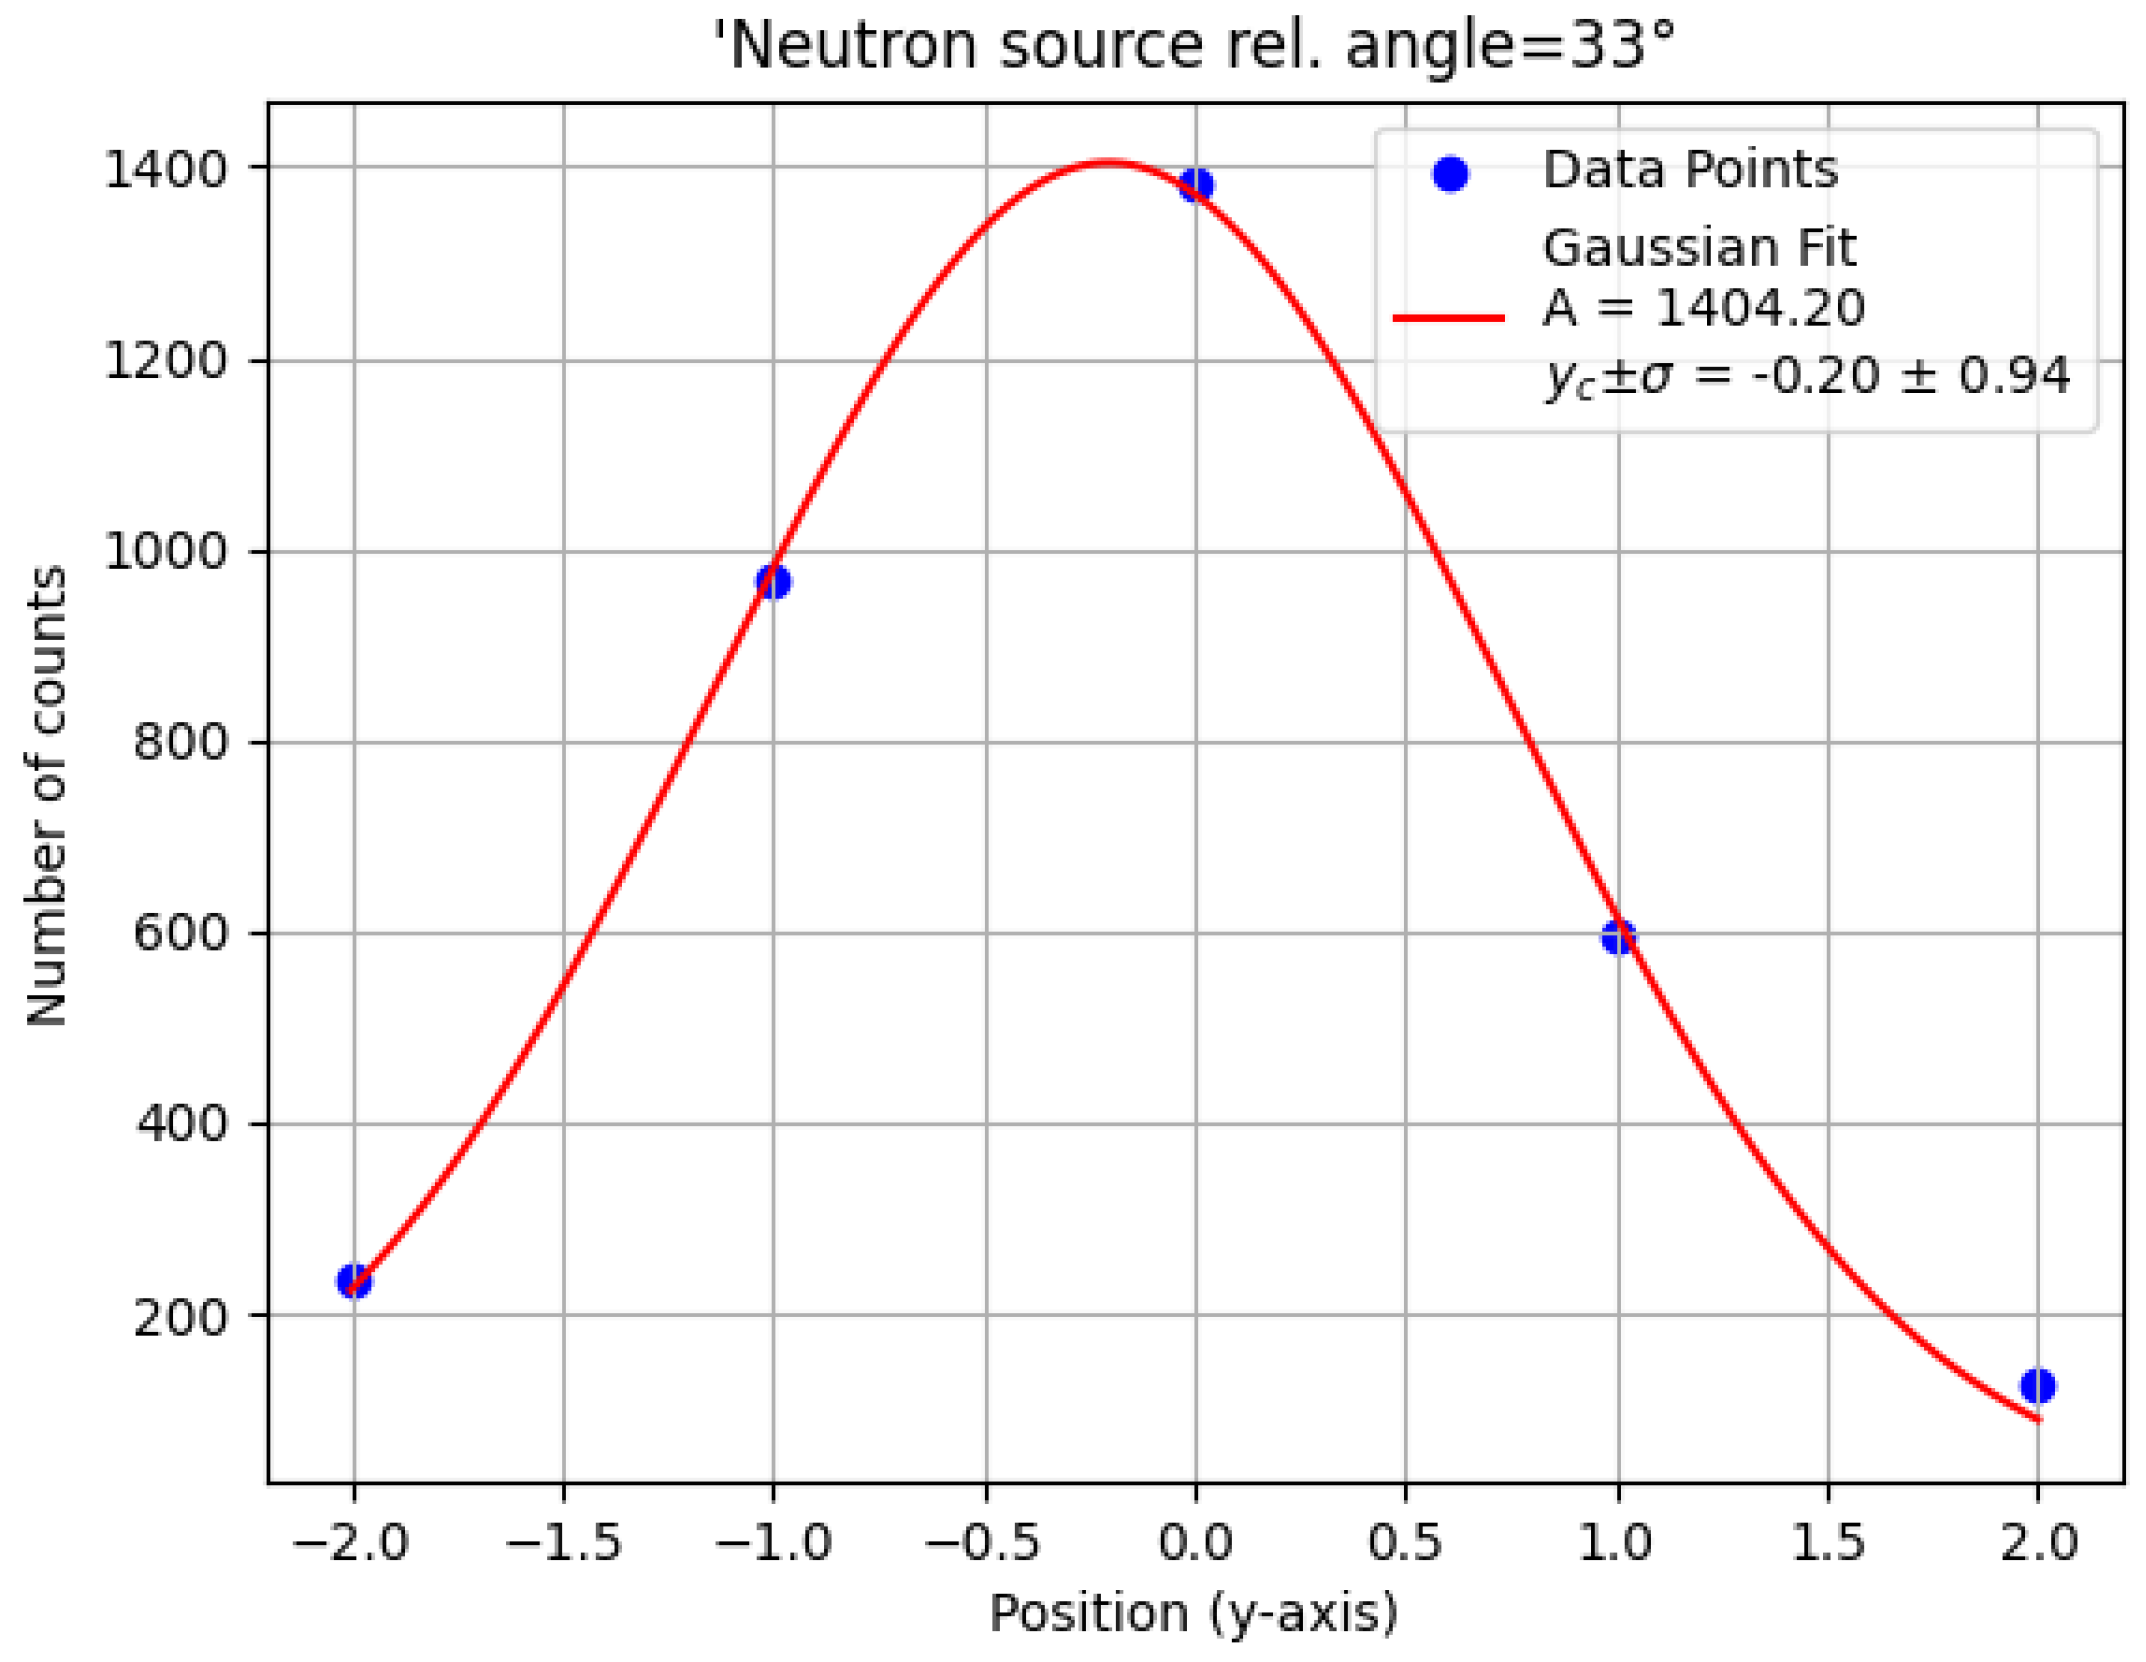
With
and an optimized x coordinate, the carbon brick was repositioned along the y axis at five locations. The counts within the carbon energy window were again fitted to a Gaussian distribution (
Figure 7), and the centroid provided the optimal y-coordinate for target placement. The final target position
was aligned with the center of the inox plate.
Following calibration, four targets were irradiated for one hour each, with all measurements normalized to detected alpha particles. The irradiation time was limited to prevent API-120 neutron generator malfunctions. The gamma spectra were analyzed to extract counts within the carbon window, from which the critical limit, detection limit, and MDL were determined.
Monte Carlo Simulations
The Monte Carlo simulations using MCNP6.2 [
37] were designed to reproduce the experimental conditions and validate the calibration line by comparing simulated and experimental results. To simplify computations while maintaining accuracy, only the essential components of the experimental setup were modeled (
Figure 8). The neutron probe was represented as a hollow stainless steel cylinder, while the LaBr
3 detector was modeled as a solid cylinder. The lower half of the submarine structure was approximated as an open rectangular Kevlar box, assuming a nominal chemical composition of C
14H
14N
2O
4 [
38]. Other structural components included a truncated conical lead shield, an aluminum plate, and an iron stand, modeled as rectangular parallelepipeds.
Both neutrons and photons were explicitly tracked within a spherical simulation environment of 1 m radius, inside which all the essential components of the experimental setup were positioned. Neutron interactions were modeled using the ENDF/B-VII.1 continuous-energy library, while photon interactions relied on the MCNPLIB04 dataset. The default physics settings in MCNP6.2 were applied, which include inelastic and elastic scattering, capture, and photon generation for neutrons, as well as the photoelectric effect, Compton scattering, and pair production for photons. Although secondary electrons were not tracked as individual particles, their production was enabled to allow the accurate modeling of Bremsstrahlung photons. Neutrons were tracked down to thermal energies (0 eV), while the photon transport cutoff energy was set to 1 keV.
An importance value of 1 was assigned to both neutrons and photons within a spherical region of 1 m radius. All cells outside this boundary were assigned an importance of 0 (vacuum), effectively terminating the particle histories at the simulation edge. Each simulation run was executed with particle histories (nps = ) to ensure high statistical precision in the recorded tallies.
The neutron source was simulated as a 14 MeV neutron cone, directed at a 45-degree angle with respect to the z axis, identical to the experimental setup. The sample placement was optimized to reflect the experimental conditions, ensuring correct positioning on the iron stand. The target materials were defined as homogeneous mixtures of SiO2, water, and sugar in the same volume ratios as used experimentally. Material properties were specified using weight fractions on the MCNP material card.
To improve statistical accuracy, each simulation was performed in two steps. In the first step, f4 tallies were used to record gamma flux as a function of energy and time bins. A 5 ns time window was selected, centered around the main peak of the time spectrum. In the second step, the recorded f4 pulse was converted into a histogram-discrete (H-D) photon energy distribution, which served as the source in a subsequent simulation. This method allowed MCNP to sample photon energies directly from the collected spectrum, preserving the energy distribution.
For this step, only the LaBr3 detector was included in the geometry. A circular disc source, matching the detector base area (45.6 cm2), was placed directly in front of the detector. The f8 tally was then used to record energy deposition within the detector for accurate spectral reconstruction. To incorporate detector resolution effects, Gaussian energy broadening (GEB) was applied, ensuring realistic spectral broadening in the simulated results.
3. Results and Discussion
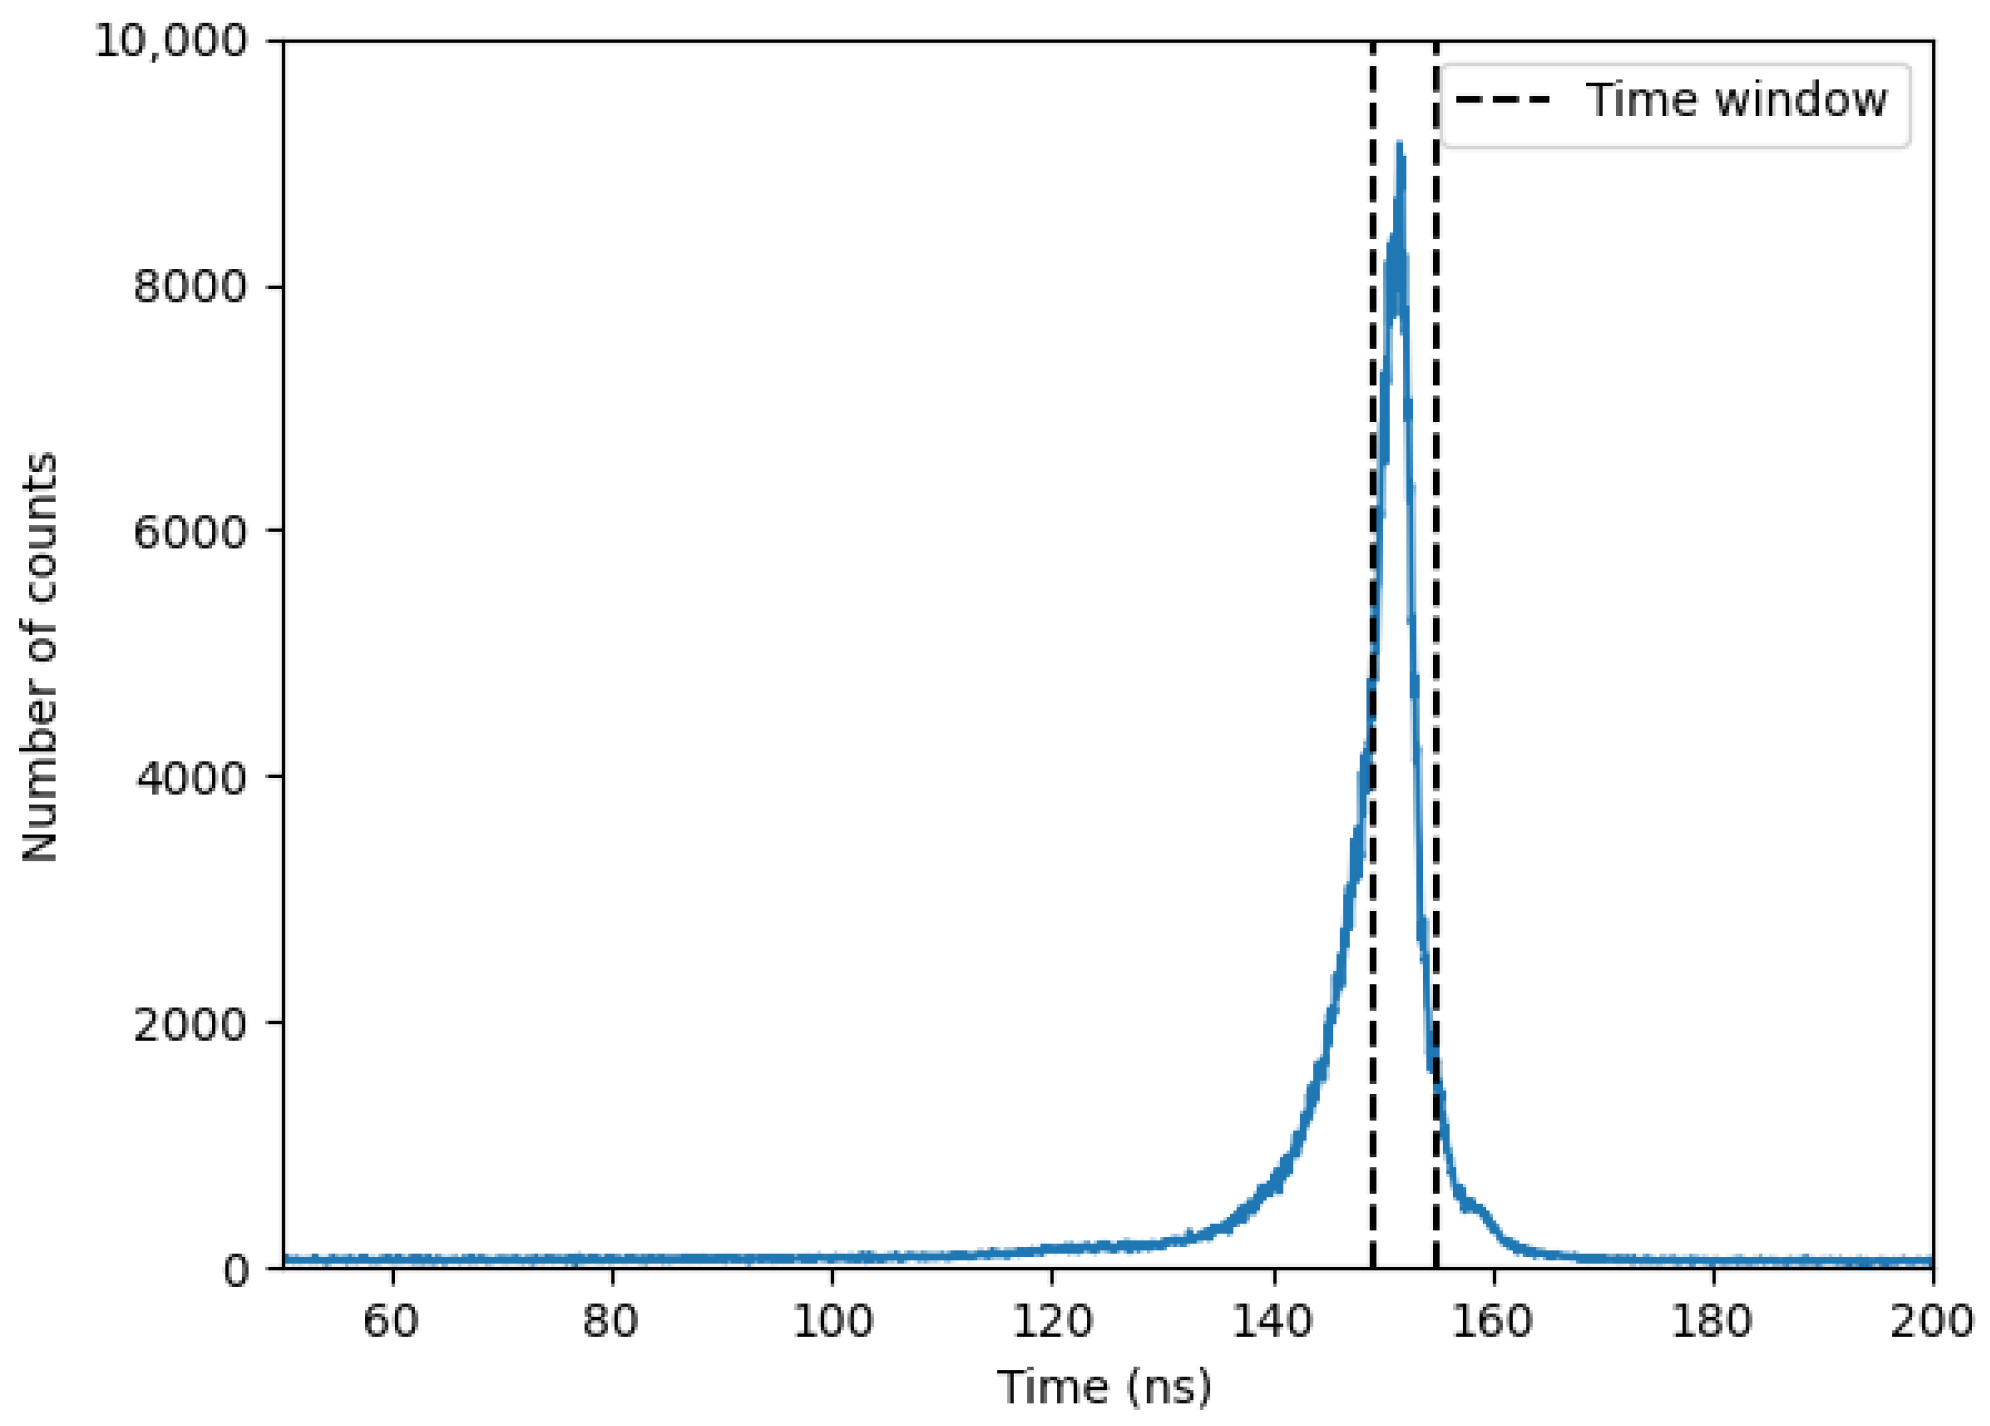
Figure 9 presents a typical time-of-flight (t-o-f) spectrum recorded by the time-to-amplitude converter (TAC), with a 200 ns time gate. A well-defined peak is observed above a background of random coincidences. Unlike the spectrum in [
34], the observed peak here cannot be solely attributed to gamma rays from the target. Due to the experimental configuration, where the neutron beam passes through structural components such as the aluminum window, iron stand, and the walls of the Kevlar submarine, the time-correlated background is inevitably present within the same timing window. A 5 ns time window was chosen to enhance the visibility of the carbon peak of interest at 4.44 MeV.
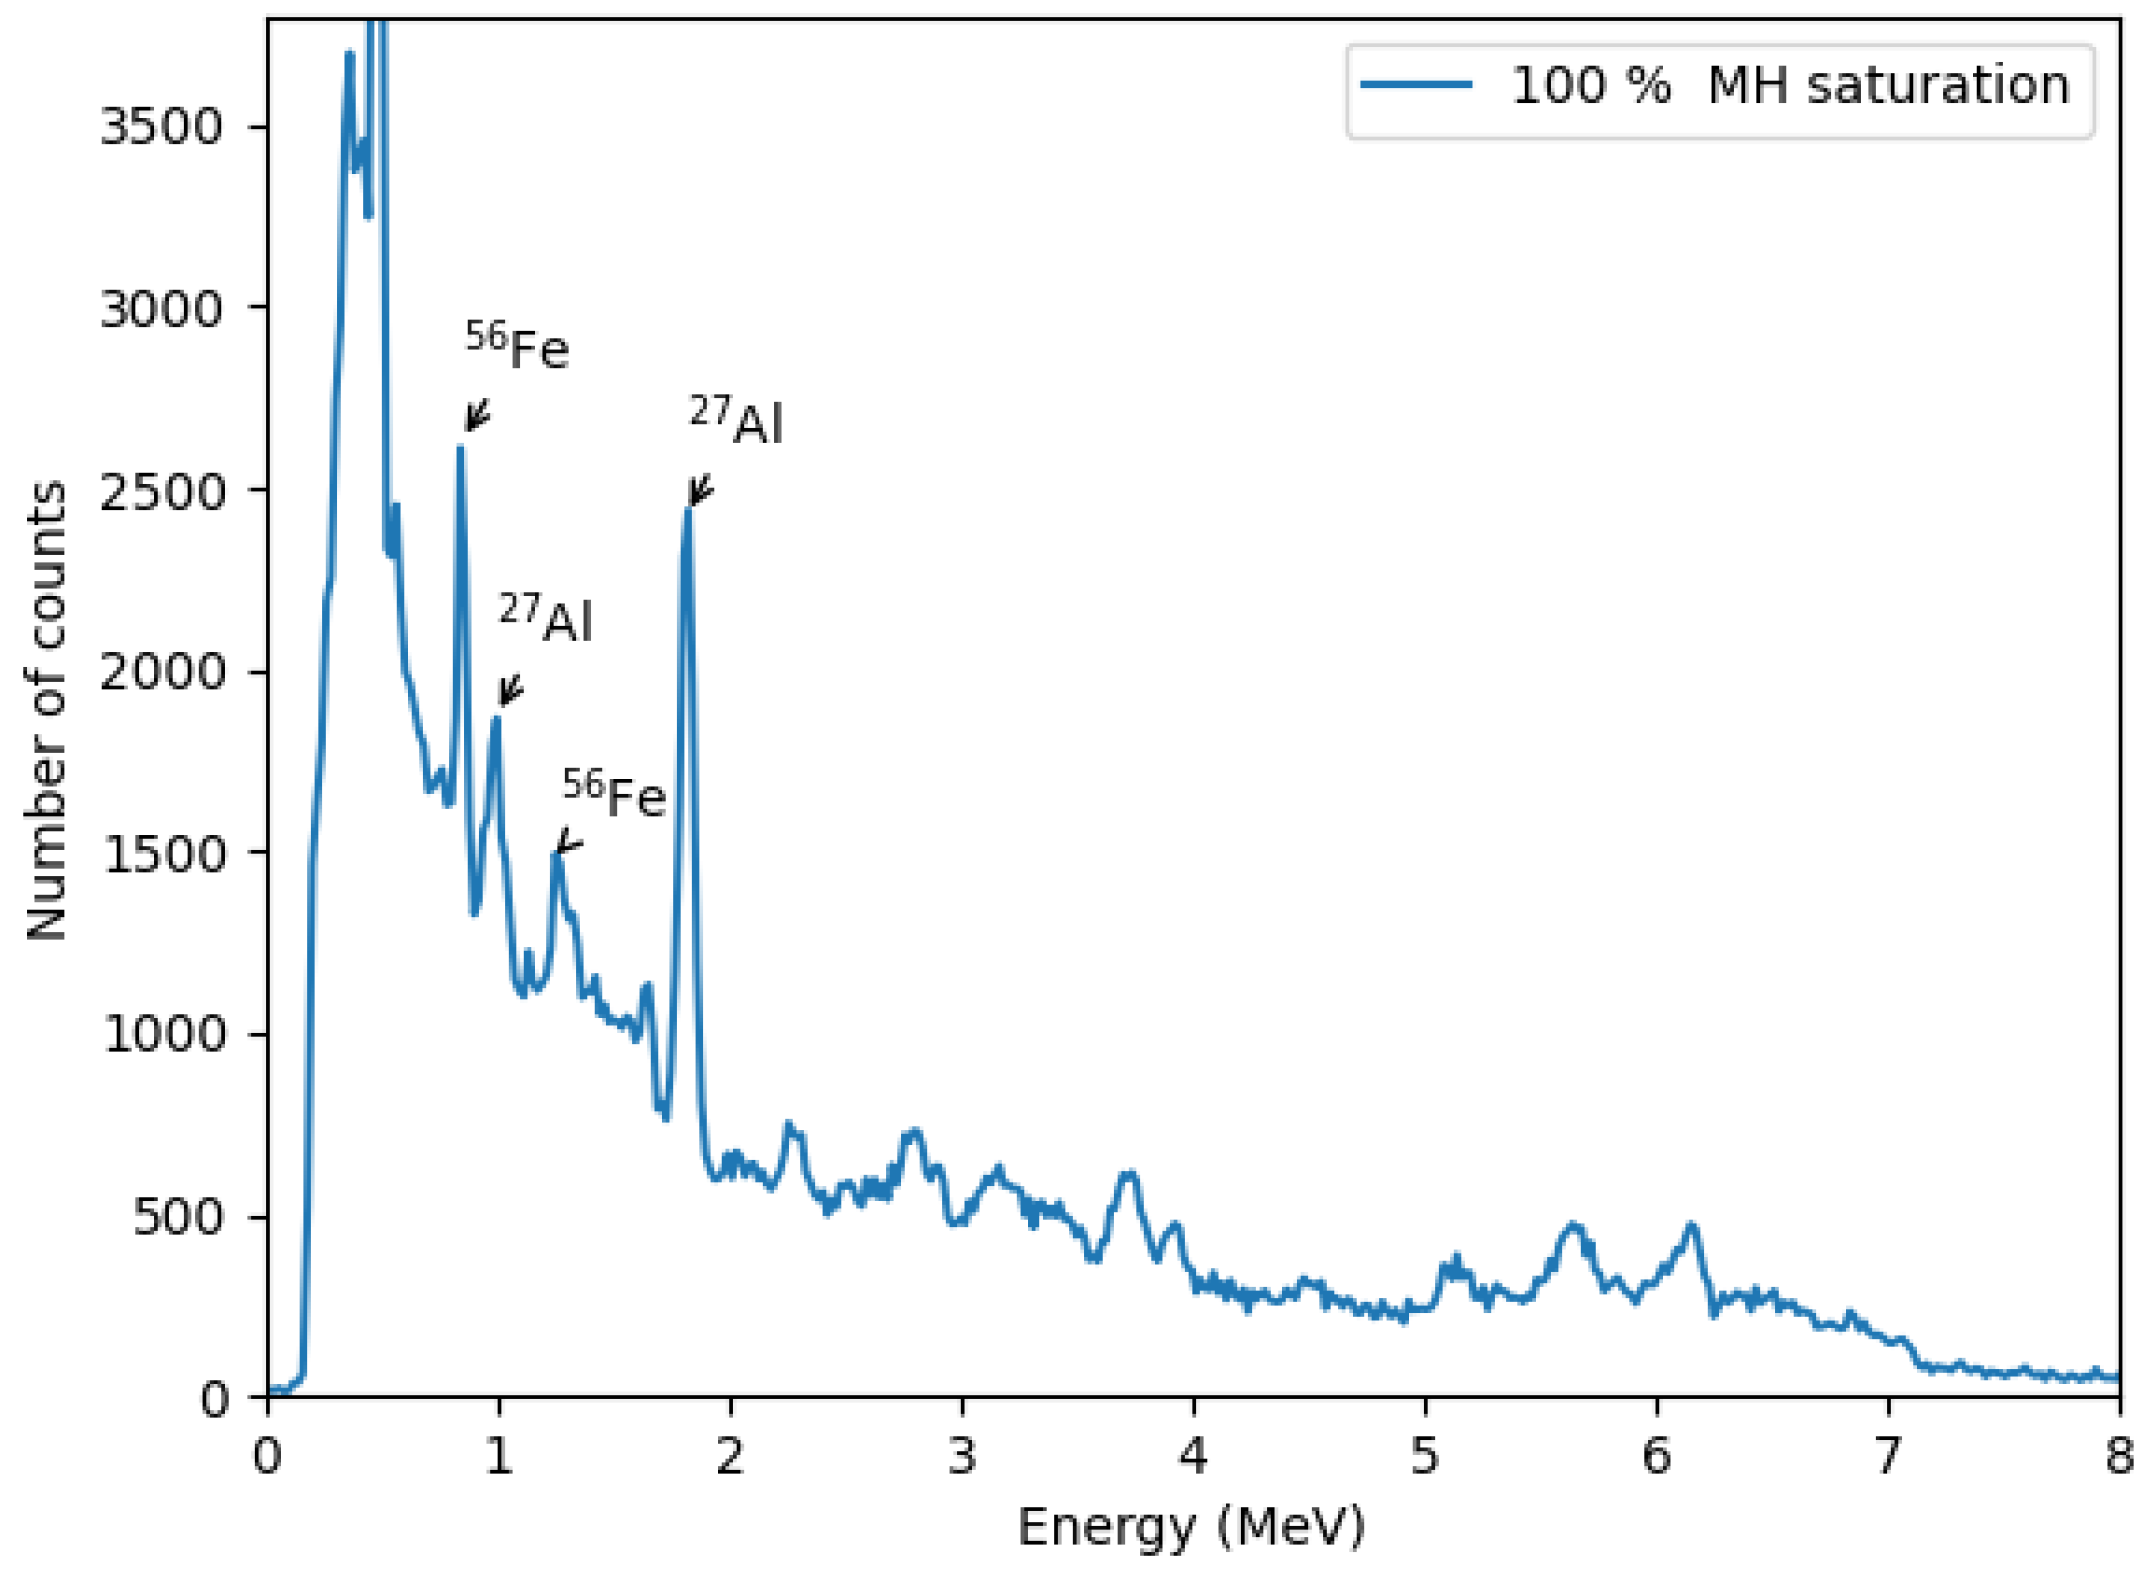
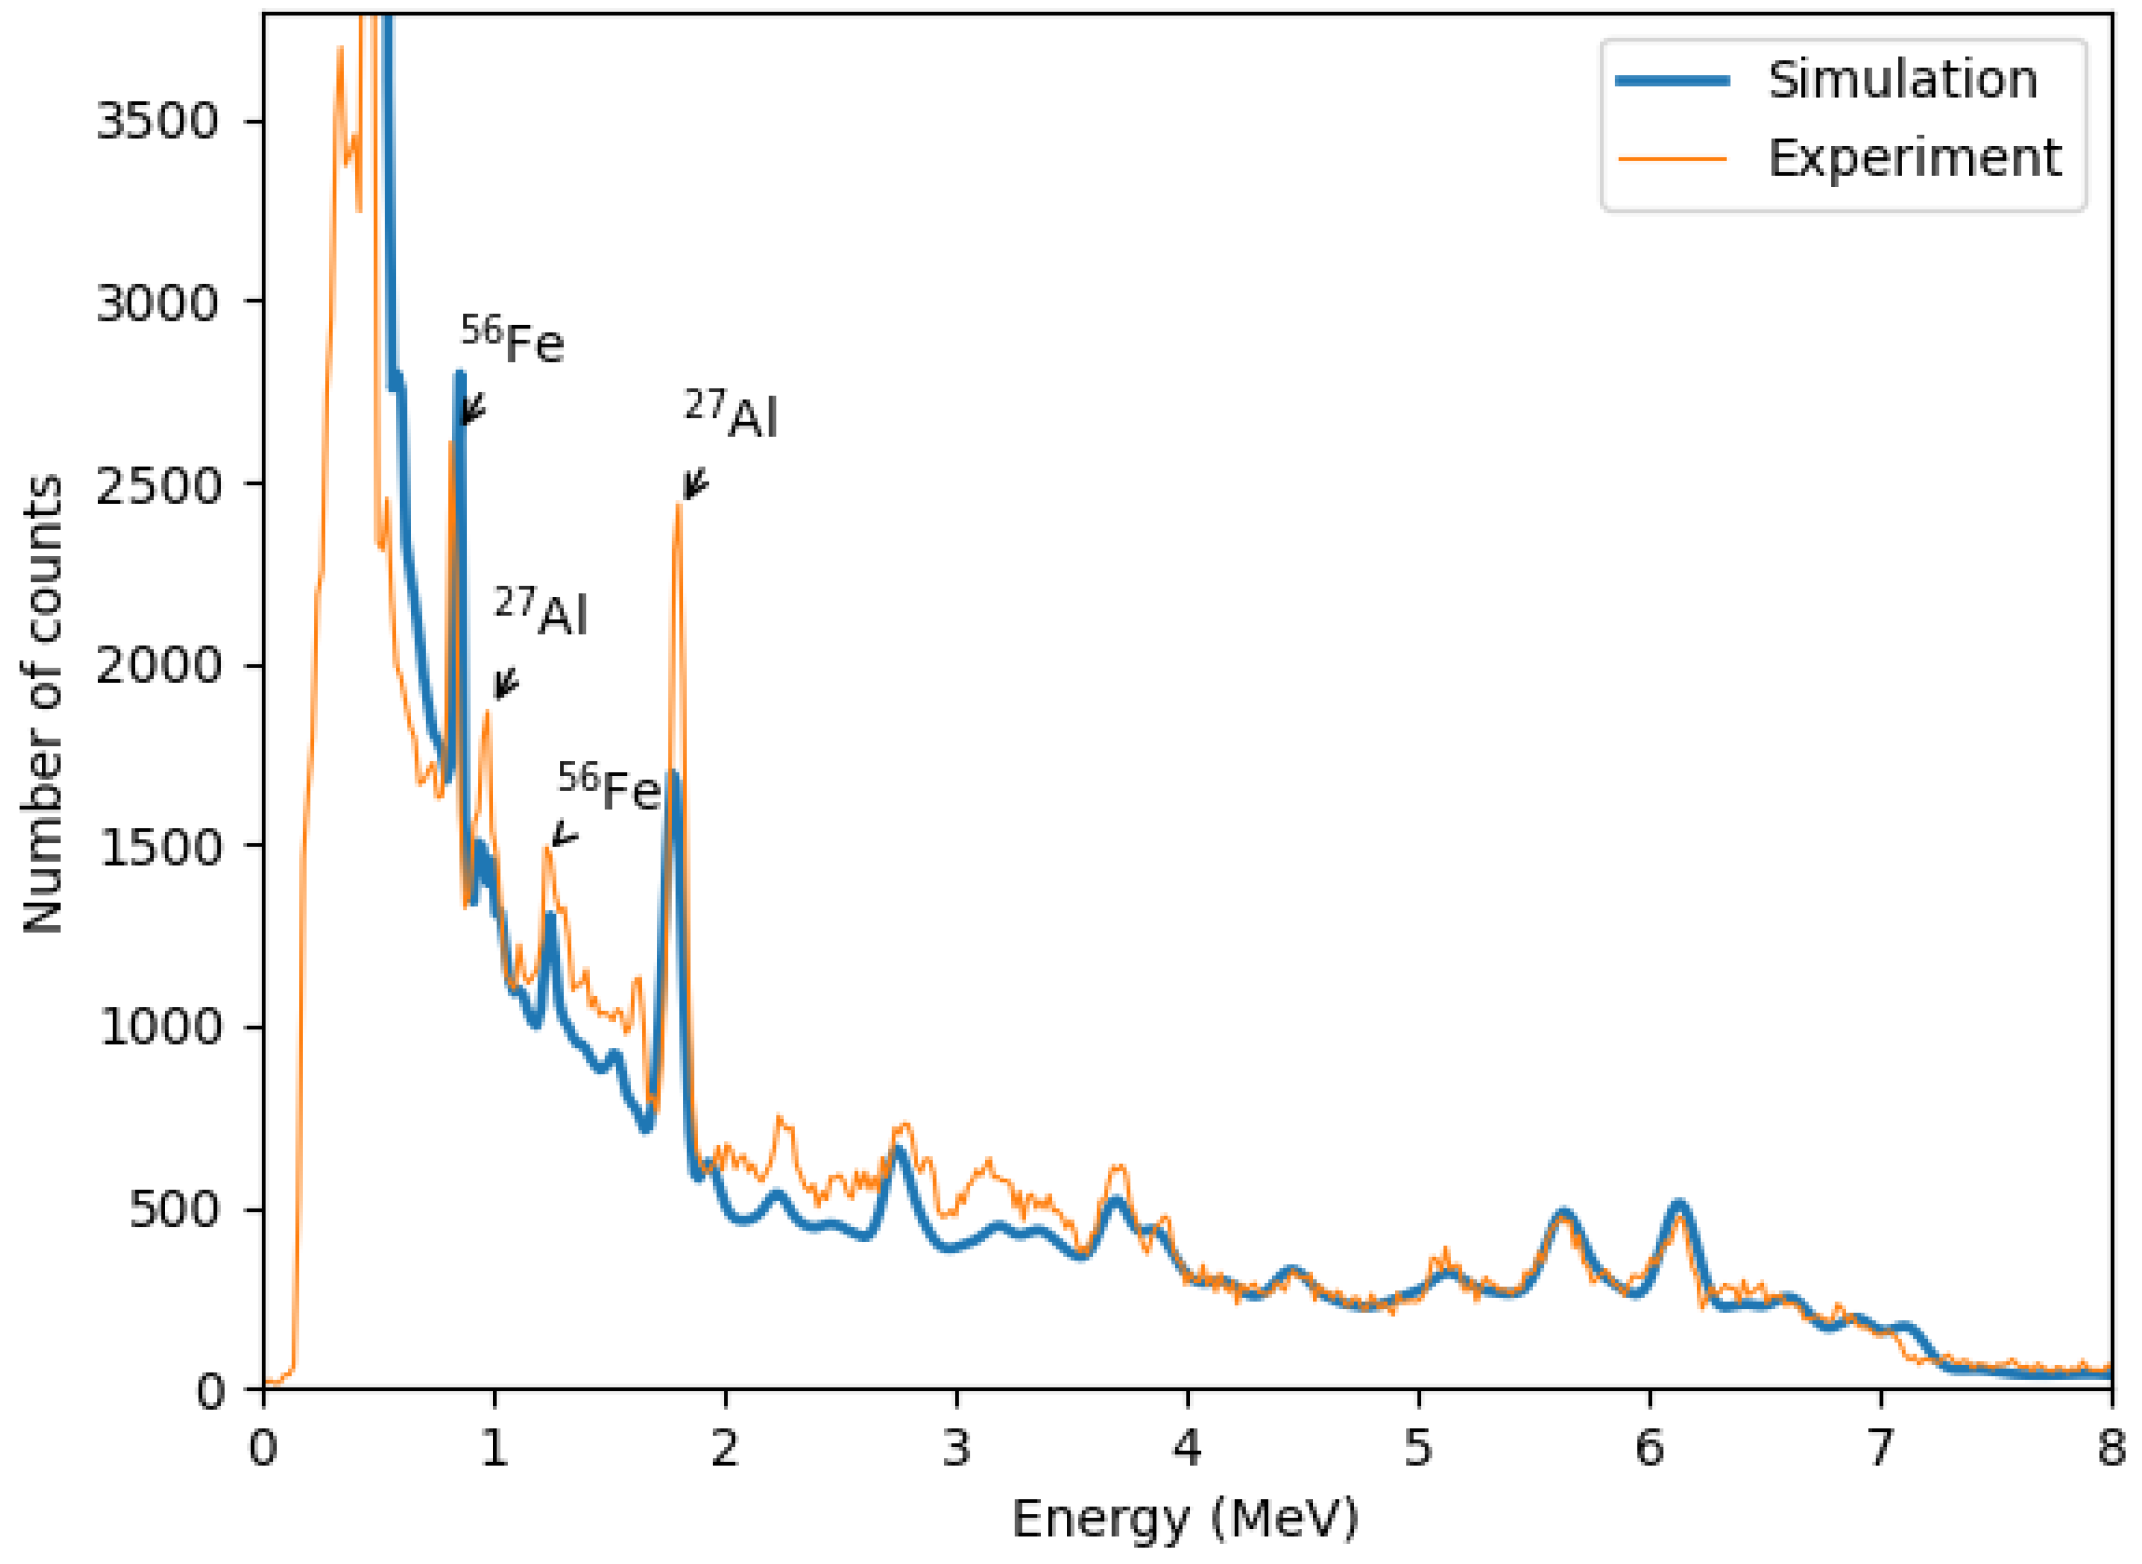
Figure 10 shows a zoomed-out gamma spectrum for a 100% methane hydrate saturation sample within the selected time window. The spectrum is dominated by iron and aluminum peaks, primarily originating from the iron stand, inox plate, and neutron probe casing. Identified gamma lines include 0.84 MeV and 1.24 MeV from
56Fe(
)
56Fe reactions and 0.99 MeV and 1.81 MeV from
27Al(
)
27Mg and
27Al(
)
26Mg reactions, respectively [
39].
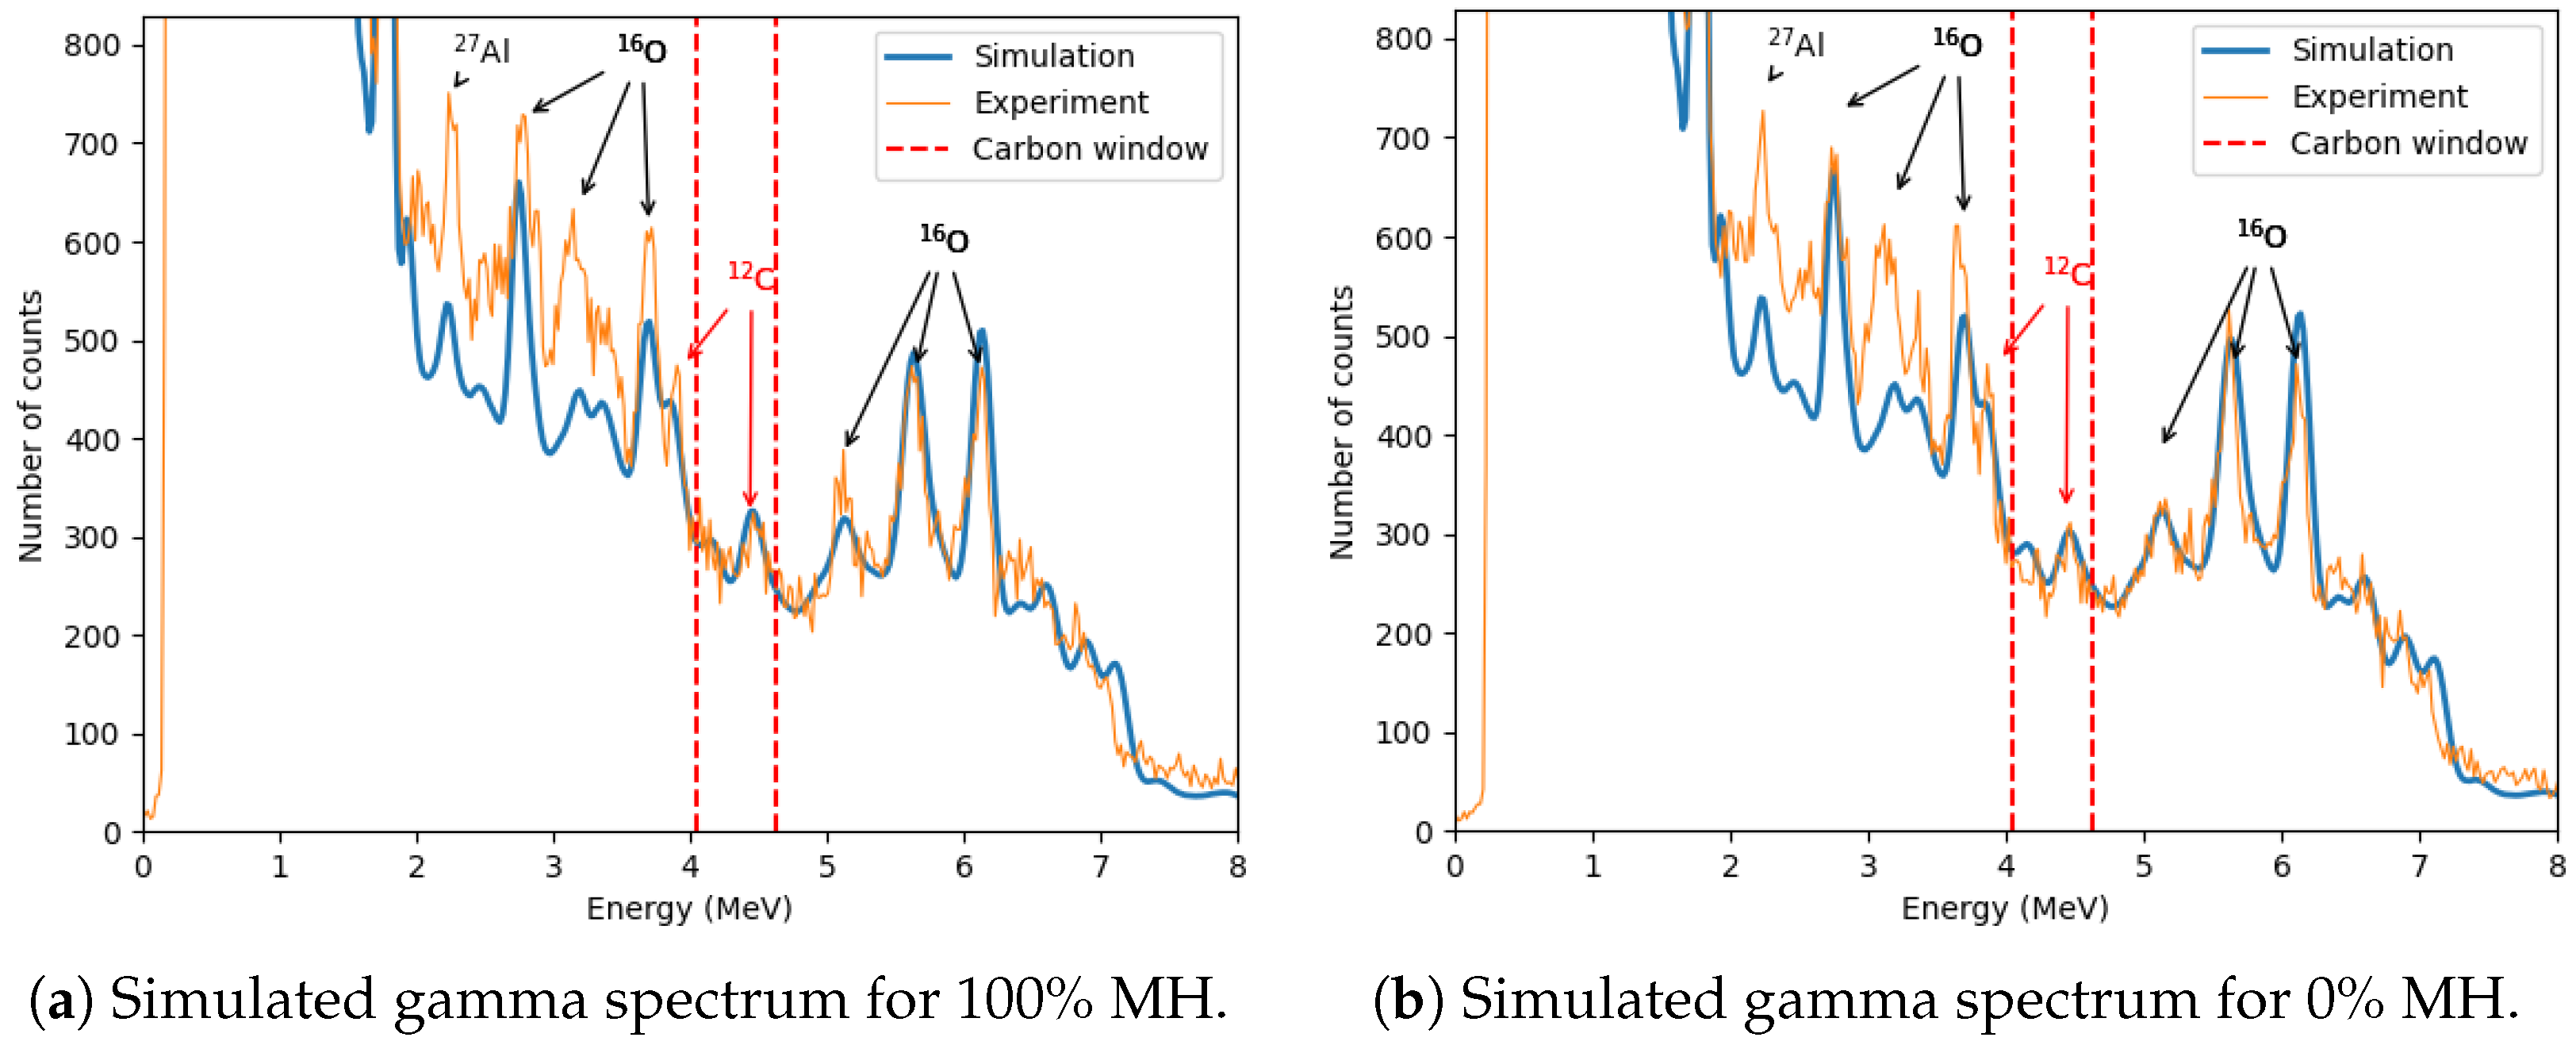
The zoomed-in spectrum in
Figure 11 compares samples with 100% and 0% methane hydrate saturation. Additional aluminum and oxygen peaks are observed, including 2.21 MeV from
27Al(
)
27Al, and 2.71 MeV, 3.09 MeV, 3.68 MeV, and 6.13 MeV from
16O(
)
16O. The 4.44 MeV peak from the
12C(
)
12C reaction and its first escape peak (3.93 MeV) are also visible.
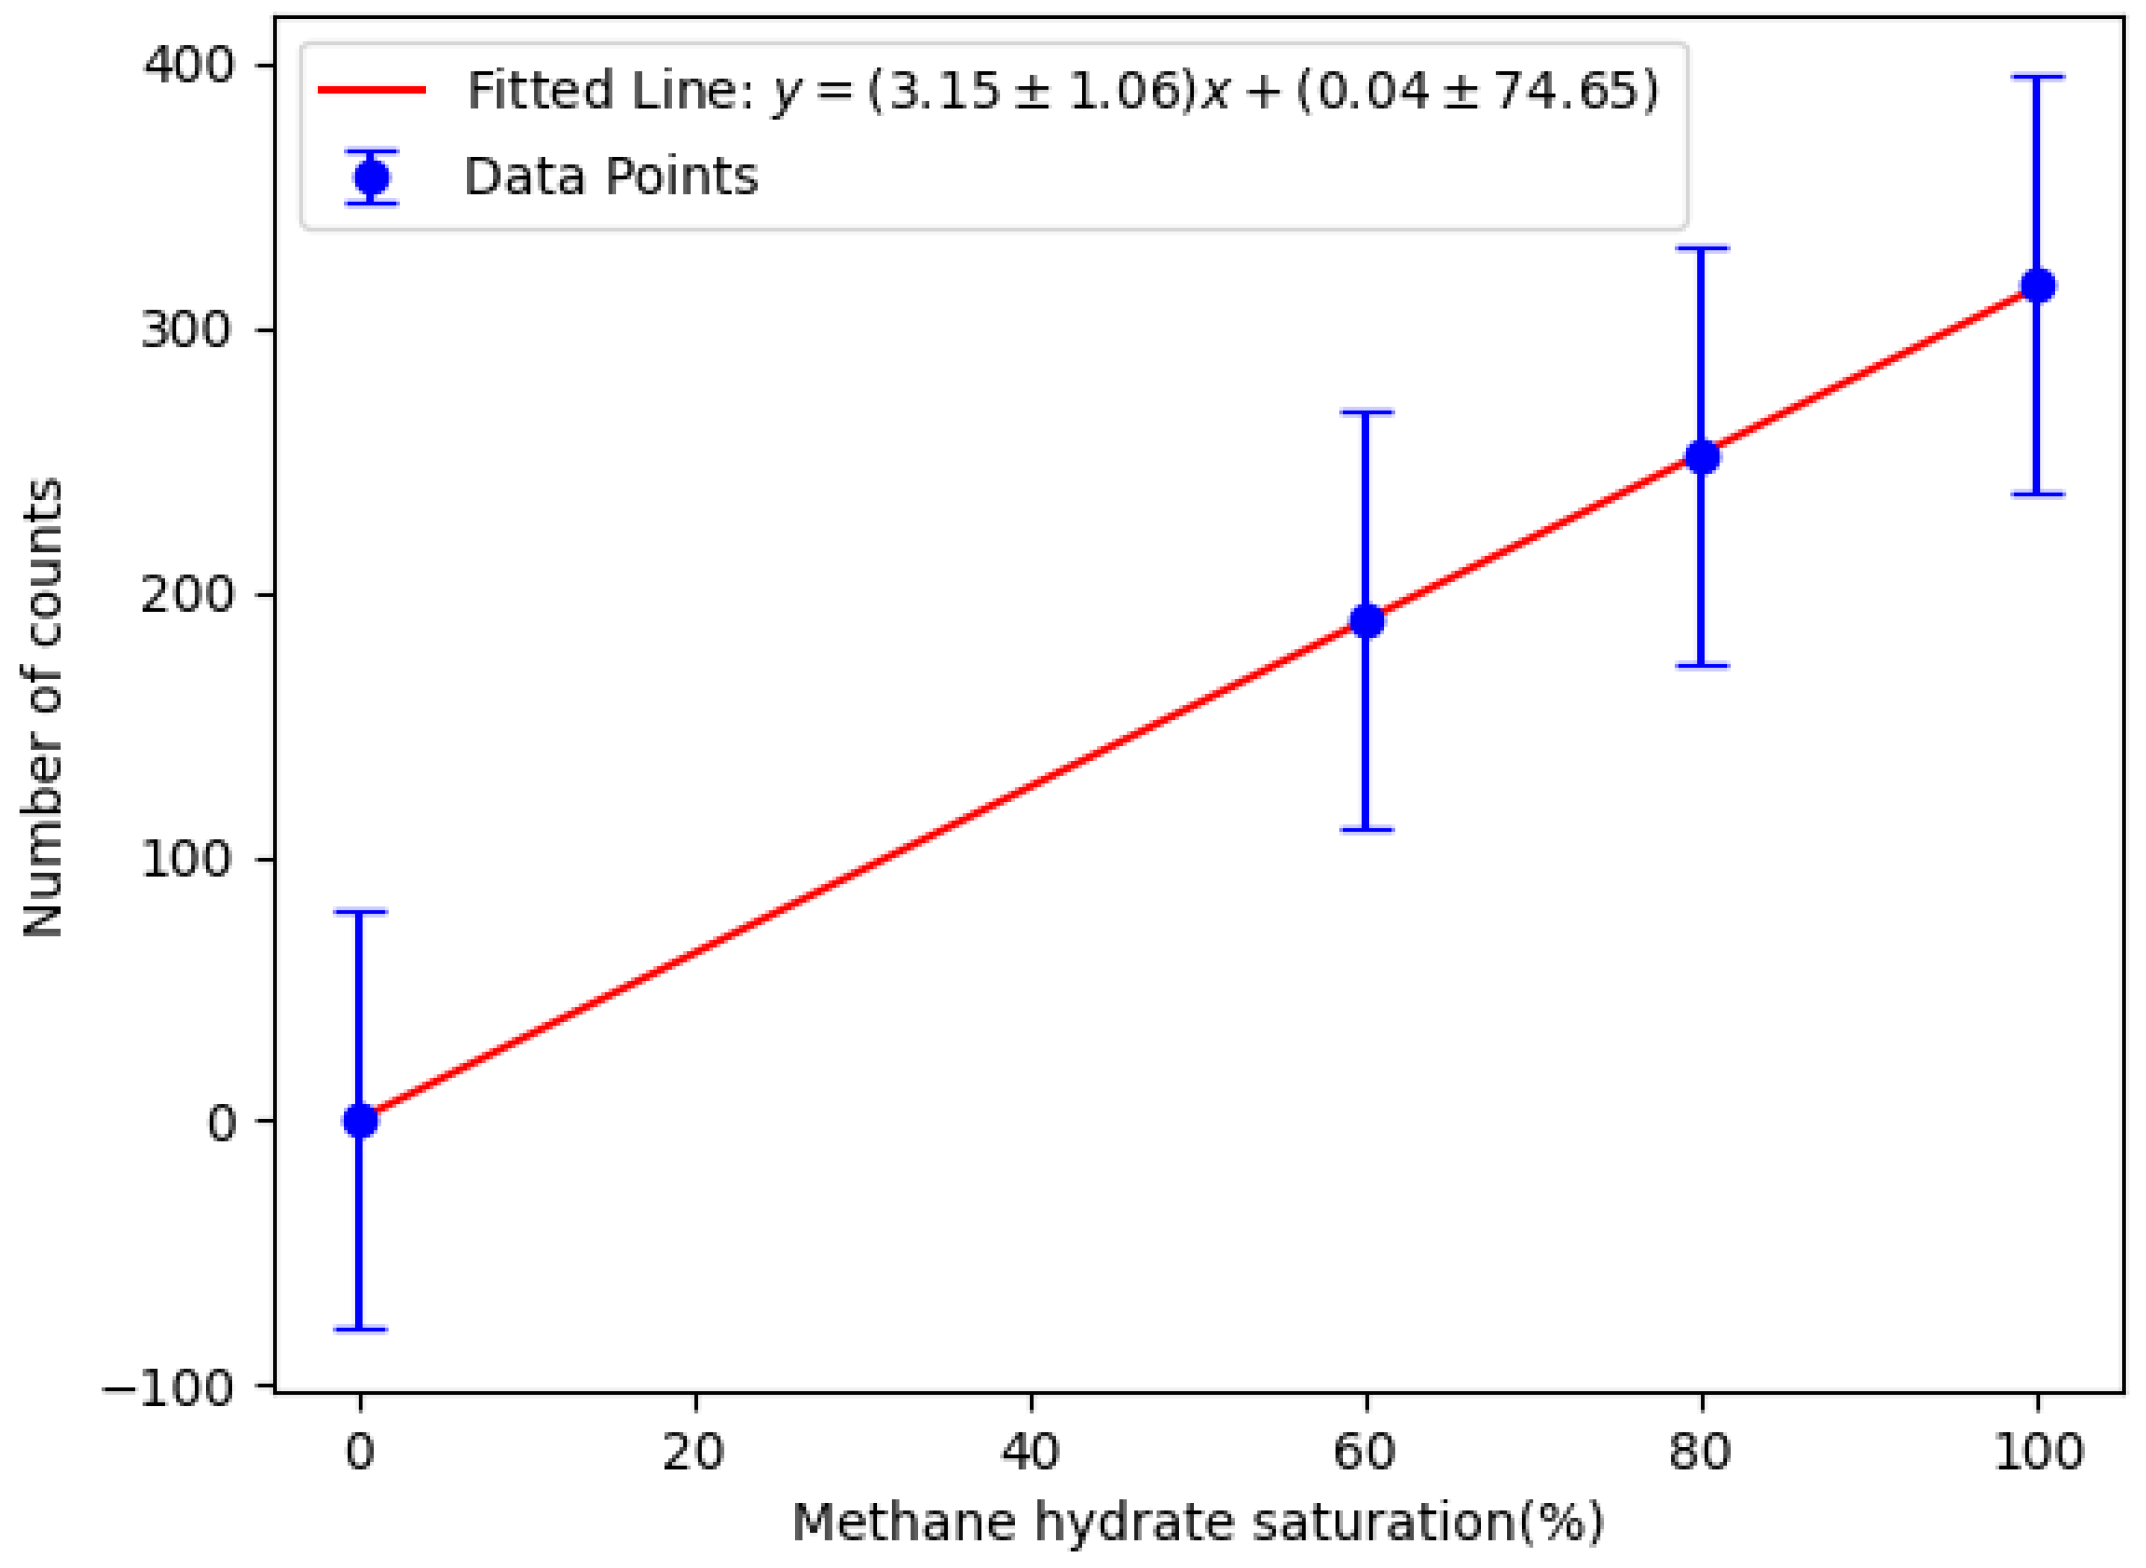
To quantify the methane hydrate content, the net number of counts in the carbon window (4.04 MeV–4.63 MeV) was calculated relative to the 0% methane hydrate saturation (100% water case). The carbon window was chosen to maximize the difference between the net number of counts in the 4.44 MeV peak. While the differences between spectra appear minor due to background carbon sources (e.g., the inox plate, probe casing, and SiO
2), the calculated net counts reveal a measurable effect (
Table 1).
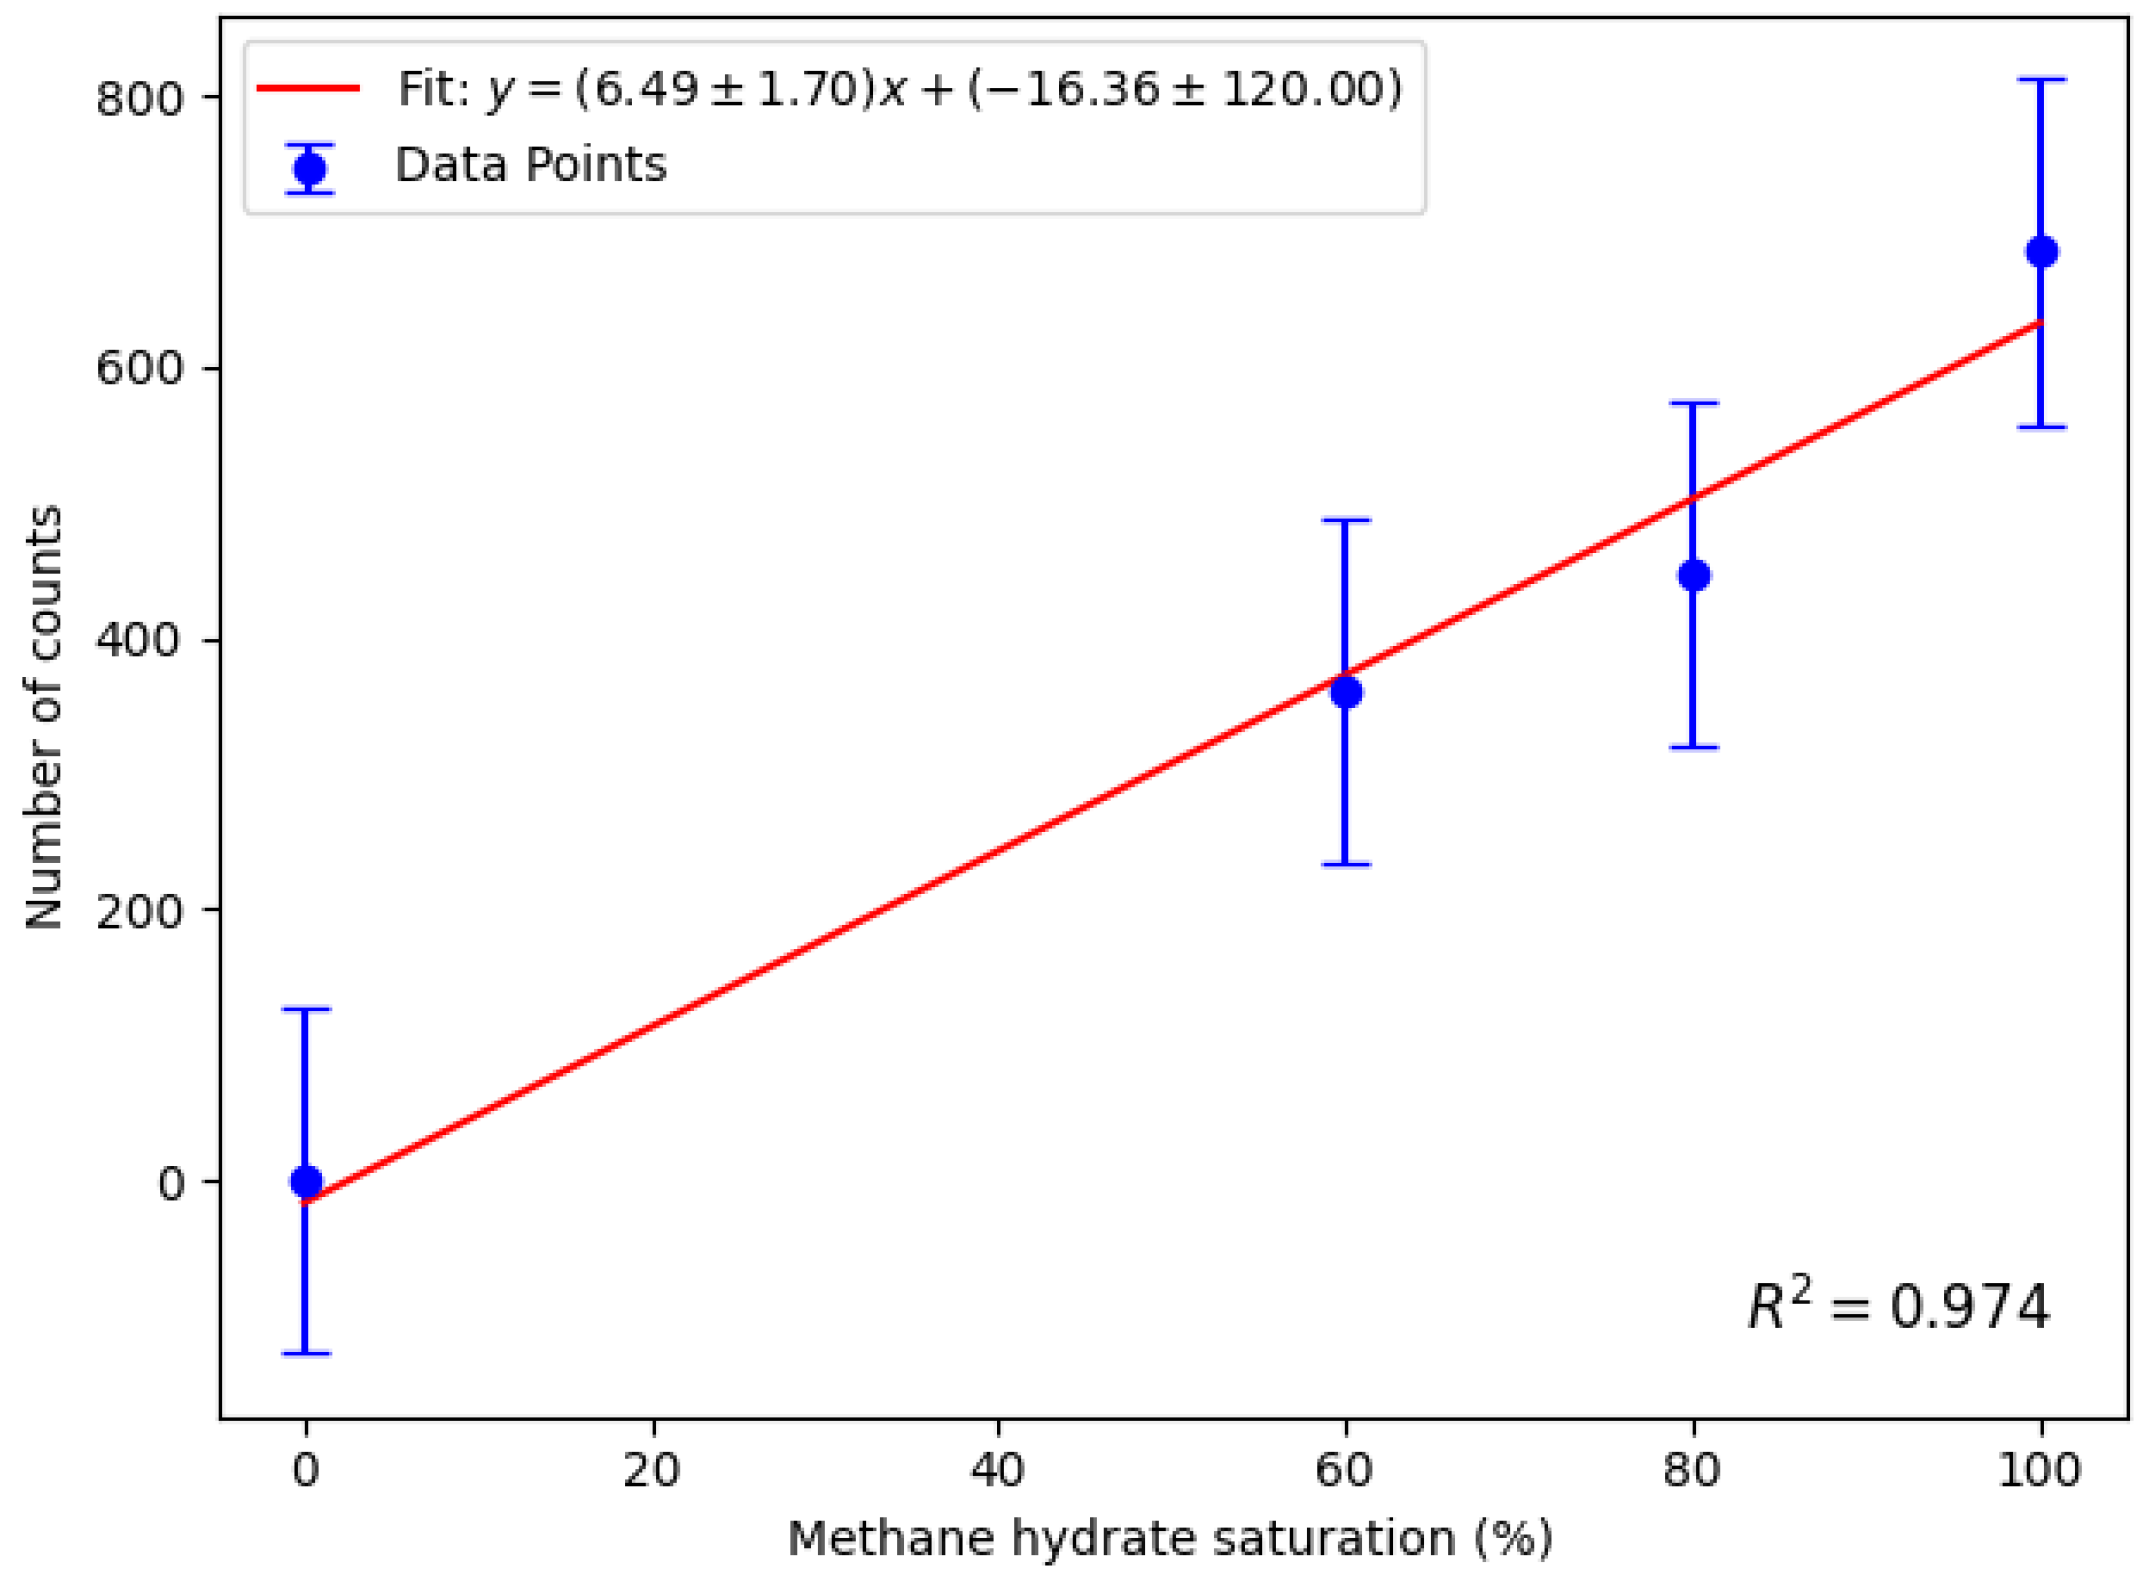
Figure 12 shows the linear calibration of net counts as a function of methane hydrate saturation, confirming a direct correlation between the two. The critical limit
and detection limit
are defined using [
40]:
where
is the measured background count rate, and
is its standard deviation (highlighted red in
Table 1). Parameters
and
are the statistical factors, linked to a chosen confidence level. In this work, a 95 % confidence level was chosen, so
. The standard deviation of the total detected counts
was taken to be the same as the standard deviation of the background count rate, so
. The calculated
was substituted into the calibration line, yielding an MDL of (67 ± 25)%. This value represents the methane hydrate saturation—defined as the percentage of pore volume filled by the simulant—required to produce a statistically significant net count above background. The uncertainty in the MDL was derived by propagating the standard deviation of the calibration curve parameters obtained from the linear fit.
Figure 13 shows the time spectrum obtained by the simulations. The time window in the simulation was set to match the experimental conditions; however, in this case, it fully encapsulates the peak in the spectrum. The simulated time peak appears sharper due to the nature of neutron emission and detection. In the experimental setup, the cone of tagged neutrons is determined by the time gate of the TAC, which selects a subset of neutrons from a broader emission profile. Since the neutron generator continuously emits neutrons in all directions, a portion of these neutrons scatter off surrounding materials or reach the detector via slightly altered trajectories, introducing additional coincidences that broaden the measured time peak. In contrast, the Monte Carlo (MC) simulations define the cone of tagged neutrons as a fixed parameter, meaning that the neutron source does not emit neutrons outside this predefined cone. This eliminates contributions from scattered neutrons outside the intended path, significantly reducing unwanted coincidences. As a result, the simulated time peak remains narrower, providing a more controlled representation of the neutron time-of-flight behavior under idealized conditions.
The simulated zoomed-out gamma spectrum (
Figure 14) closely resembles the experimental data, though minor discrepancies exist, primarily due to uncertainties in the simulated geometry and material specifications.
The zoomed-in spectra presented in
Figure 15 demonstrate that the carbon peak at 4.44 MeV in the MC simulations closely aligns with the experimentally observed peak. Additionally, a notable difference is observed in the background within the energy range (≈2–3.83 MeV), where the experimental data exhibit significantly higher counts compared to the simulation results. This discrepancy likely arises from the fact that the simulations include only the essential components of the experimental setup, whereas the physical experiment also involves additional elements, such as structural components and surrounding laboratory materials, which contain oxygen. The presence of these materials in the experimental environment contributes to an increased background signal, particularly in the oxygen-dominated energy region.
The calibration line derived from the MC simulations is displayed in
Figure 16. The mean slope of this calibration line (
) is lower than the experimentally determined slope (
), yet both values remain within 2
agreement. The most probable reasons for this difference is the geometrical mismatch between the simulated and actual experimental setup, as well as potential inaccuracies in the modeling of prompt gamma-ray production within the surrounding environment.
4. Conclusions
To conclude, the relatively high uncertainty in the experimentally obtained minimum detection limit (MDL) of ()% is primarily attributed to statistical fluctuations in net gamma-ray counts and the propagated uncertainty in the slope of the calibration line. Additional contributing factors include carbon background from structural components such as the inox plate and submarine casing, short-term fluctuations in the neutron flux from the API-120 generator, and the intrinsic resolution limitations of the LaBr3 detector.
While this level of uncertainty poses a limitation, the MDL value itself still provides a meaningful benchmark for assessing the feasibility of methane hydrate detection. Specifically, it is unclear whether the sensitivity is sufficient for detecting moderate-to-high saturation deposits, such as those found near Mount Elbert, Alaska (50–54%).
The MDL of 67% exceeds the methane hydrate saturation at Mount Elbert, highlighting the limitations of the API-120 neutron generator, which operates at a relatively low neutron flux of n/4s. Higher-flux neutron sources could significantly improve the detection limit. For instance, increasing the neutron generator flux by a factor of 10 would proportionally enhance the carbon peak counts and calibration slope k, while the uncertainty in background counts would increase by a factor of . From the calibration equation, it is clear that this improvement would reduce the MDL from 67% to approximately 21%, making the technique viable for high-saturation deposits.
Further increasing the neutron flux by another order of magnitude could enable methane hydrate detection at an MDL of 21% within a 5–10 min measurement time, significantly enhancing the method’s practicality. However, the current study was conducted in an air environment, whereas in underwater conditions, neutron thermalization in water would reduce the number of available fast neutrons for inelastic scattering with carbon. Future work will incorporate realistic submarine simulations to evaluate these effects and refine the methodology accordingly.
To improve the applicability of this technique, ongoing research should focus on deploying neutron sources with higher flux, expanding sample measurements, and conducting submerged experiments to better simulate field conditions for methane hydrate detection.
These results demonstrate the potential of the AAP technique as a field-deployable method for direct carbon detection in marine sediments. Its elemental specificity offers a valuable complement to conventional geophysical surveys, particularly in hydrate-bearing zones where acoustic and resistivity signals may be ambiguous. With further system miniaturization and integration into remotely operated vehicles, the technique could be applied for the seafloor exploration of high-saturation hydrate deposits using real-time gamma-ray spectroscopy.


 ,
, 


