Article

Historical Trends of Trace Metals in the Sepetiba Bay Sediments: Pollution Indexes, Fluxes and Inventories

by
Sarah Karoline Rodrigues
1,2,*,
Wilson Thadeu Valle Machado
1,
João Barreira
1,3 and
Susana Beatriz Vinzón
2
1
Departamento de Geoquímica, Universidade Federal Fluminense, Outeiro São João Baptista s/n, centro, Niterói 24020-141, RJ, Brazil
2
Laboratório de Sedimentos Coesivos—LDSC, Departamento de Engenharia Naval e Oceânica, Universidade Federal do Rio de Janeiro, Rio de Janeiro 21941-909, RJ, Brazil
3
Laboratoire de Planétologie et Géosciences, Université d’Angers, Nantes Université, Le Mans Univ, CNRS, UMR 6112, 49000 Angers, France
*
Author to whom correspondence should be addressed.
J. Mar. Sci. Eng. 2025, 13(6), 1033; https://doi.org/10.3390/jmse13061033
Submission received: 7 April 2025 / Revised: 10 May 2025 / Accepted: 21 May 2025 / Published: 24 May 2025
(This article belongs to the Special Issue Ecological Risk Assessments in Marine Pollutants)

Abstract

:
The environmental condition of surface sediments in Sepetiba Bay is influenced by trace metals derived from human activities. Four sediment cores were collected from both the inner (Coroa Grande and Enseada das Garças) and outer (Guaratiba and Marambaia) areas of the bay. Trace metals content varied considerably, with the highest values recorded at Enseada das Garças (e.g., Cd: 2.4 mg kg−1; Zn: 393 mg kg−1), and lowest at Marambaia Barrier Island (e.g., Cd: <0.001 mg kg−1; Zn: 3.35 mg kg−1). Mean annual metal fluxes have increased since the 1950s, especially for Cd (from 8 × 10⁻⁵ to 0.4 g m−5 y−1) and Zn (from 4.0 to 68.7 g m−2 y−1). However, a decreasing trend has been observed since the 2000s. Pollution indexes indicated that Cd poses the highest contamination and ecological risk in recent layers of the inner bay, and moderate risk at the Marambaia Barrier Island (maximum values of Cd: 0.67 mg kg−1 and Zn: 94.9 mg kg−1). Metal distribution patterns are influenced by mineral phases and sediment dynamics. Findings emphasize the need to monitor other metals like Cu and Pb, besides the historical heavy loadings of Cd and Zn, considering recent industrial and port expansions in the Sepetiba Bay region.

1. Introduction

Anthropogenic activities are responsible for driving changes in the physical, mineralogical, and biogeochemical constitutions of sediments [1,2,3]. In turn, interventions in both the quantity and quality of sediments impact aquatic ecosystems, disturbing natural processes [1,4,5]. Therefore, the geochemical composition of sediments is one of the most important records of geochemical processes occurring across watershed systems [2,6].
Human interventions such as deforestation, river channel rectification, and watershed diversion influence weathering and erosion, altering sediment load, grain size, and mineral and elemental composition [2,7]. Moreover, agriculture, industry, and urbanization introduce a wide range of organic and inorganic substances that, in the best case, are passively incorporated into the natural environment, but more commonly produce distinct and often negative impacts on the environment.
Sepetiba Bay, a coastal environment in the Southeast of Brazil (Figure 1), is recognized for its economic and ecological importance, but also for its legacy of industrial waste accumulated over the last century and associated environmental problems [8,9,10,11,12,13,14,15,16,17]. Currently, extreme amounts of trace metals, mostly Cd and Zn, are found in sediments from the inner part of the bay [9,10,12,18,19,20] and multiple recent studies have revealed concerning trends [9,21,22,23,24,25,26]. A regional assessment of surface sediments between 2009 and 2022 showed a general increase in contamination by Zn, Cd, Pb, Ni, and Hg, with evidence that dredging activities and inadequate disposal of dredged material are transferring pollution to the bay’s outer sectors [22,23]. Paleoecological analyses based on sediment cores revealed a significant deterioration in ecological status since the 1990s, likely linked to the deposition of contaminated dredged sediments and the introduction of invasive species via ballast water [24]. Damasceno et al. [21] found that Ilha Grande Bay, located south of Sepetiba Bay, out of the bay system, presented moderate to severe pollution levels by metals such as Hg, Cd, As, and Cu were observed, associated with urban and industrial effluents and fossil fuel residues, indicating high ecological risks at over 60% of the sampled stations.
According to Rodrigues et al. [9], the spatiotemporal distribution of cadmium (Cd) and zinc (Zn) in Sepetiba Bay sediments reflects the lasting impact of historical industrial activities, particularly from the electroplating sector. The study compared sediment data from before and after the closure of a major Zn electroplating facility in the late 1990s and found that metal concentrations remained high in many areas of the bay. Despite the end of direct emissions from point sources, contamination persists. The authors note that diffuse sources—such as urban runoff, resuspension, and remobilization of legacy pollutants—now play a growing role in maintaining elevated metal levels. This situation complicates source identification and highlights the need for integrated monitoring that accounts for both past and ongoing pressures on the system.
These recent studies support the present research by emphasizing the importance of integrated approaches to understanding the temporal and spatial evolution of contamination in complex coastal environments like Sepetiba Bay. To improve understanding of metal behavior in the bay, it is essential to analyze sediment characteristics across different sectors. Physical, chemical, and mineralogical properties influence metal speciation and partitioning, shape ecological responses [2,27] and provide insight into contaminant sources and transport dynamics.
Given the region’s rapid urban and industrial expansion since the 1970s, trace metal concentrations in sediment cores are expected to have increased over time, reflecting shifts in land use and anthropogenic influence. Vertical profiles likely record distinct phases of contamination, with higher concentrations of Zn, Pb, and Cu in more recent layers. Additionally, geochemical indices and metal fluxes are anticipated to reveal not only intensified contamination in recent decades, but also spatial variability linked to proximity to industrial and urban zones.
In this study, four sediment cores were analyzed to investigate historical trends in trace metal (Cd, Cu, Ni, Pb, and Zn) contamination in Sepetiba Bay. Geochemical parameters (TOC, TP, grain size, and mineralogy), contamination indices (EF, CF, CD, and SQG-Q), and metal fluxes were applied to assess pollution intensity and distribution. The results enhance our understanding of the evolution of anthropogenic impacts in the bay and provide valuable information for environmental management and monitoring. Based on these findings, we update priority areas, identify associated metallic contaminants, and address emerging environmental concerns in Sepetiba Bay.

2. Materials and Methods

2.1. Study Area

The Sepetiba Bay is a partially enclosed estuarine lagoon covering an area of about 519 km2 with a mean surface area of 427 km2. It has a volume of 2.56 × 10⁹ m3 and a mean depth of 6 m [28]. The geological structure of the Sepetiba watershed consists of Quaternary sediments and igneous and metamorphic crystalline basement rocks [29]. Sediments in the bay are influenced by fluvial (terrestrial), marine, and biogenic sources [30]. The majority of the freshwater inflow and sediment discharge into Sepetiba Bay, approximately 94%, comes from the Guandú River. Due to the clockwise trajectory of surface currents within the bay, fine clay particles and/or organically enriched terrigenous sediments tend to disperse towards the eastern region, gradually accumulating in shallow and sheltered zones. Conversely, coarser sediment particles are transported towards the exposed western part of the bay, closer to the Atlantic Ocean [28].
The Sepetiba Bay watershed has a population of around 1.4 million inhabitants, mainly from the metropolitan Rio de Janeiro area, which is about 60 km away to the west. There are three harbors operating on the shore, and the region also has an expansive industrial complex with various economic sectors, including ore transportation, metallurgical operations, rubber manufacturing, and food processing. Importantly, it hosts the largest steel industry complex in Brazil.
The northeast part of the bay hosts the most important sources of contaminants to the system: (1) fluvial waters from the São Francisco, Guarda, Guandú-Mirim and Itá Channels carrying continental material and effluents from industrial and domestic origin; (2) The Santa Cruz industrial district with metallurgical and chemical industrial facilities, a Municipal Water Treatment Plant and the Santa Cruz Thermoelectric Power Plant; (3) Port activities, such as the Itaguaí Port, the Porto Sudeste, the Brazilian Navy Nuclear-powered Submarines Shipyard, Valles S/A and Ternium mooring benches; (4) Environmental liability from the Ingá Metallurgical Cia. (Ingá Cia.) at Madeira Island, near Saco do Engenho Creek (SEC); and (5) since 2022, the Karpowership barge-mounted thermoelectric power plants operation (Figure 1).
The Madeira Island hosts industrial wastes from the Ingá Cia, which produced metallic alloys of Zn from calamine (Zn2SiO3(OH)2) and willemite (Zn2SiO4) [30,31], from the 1950s to 1998. From its inception until 1984, the waste stemming from the ore refining procedure underwent storage in an exposed, open-air environment, susceptible to weathering, erosion, and leaching during periods of precipitation. Moreover, there were overflows of the dam that held these industrial wastes enriched with trace metals to the SEC. The pollution loading continued until remediation measures were performed to treat the waste piles in 2010 [32]. Sediments showing elevated metal concentrations were dredged and subsequently deposited within a confined disposal facility underwater as a component of this remedial endeavor. The point source resulted in extremely high inputs of Cd and Zn for nearly 50 years, which were dispersed in the northern and northeastern regions of this system, as recorded in dated sediment cores [8,13,33,34,35,36,37,38] and bivalve mollusks [11].
Patchineelam et al. [37] observations show that trace metal contamination spreads to the farthest areas. The authors found high levels of Cd and Zn (~0.3 and 1700 mg. Kg−1, respectively) in the upper layers of sediment cores at Marambaia Bay. In the last years, Sepetiba Bay has been experiencing a large expansion of harboring activities, therefore, water and sediment quality can be decreasing due to dredging activities and shipping traffic [8,9,39]. Environments surrounding Sepetiba Bay, such as the marine reserves of Ilha Grande and Marambaia, may be exposed to contaminants from Sepetiba Bay and its watershed, through events of resuspension and transport of contaminated sediments [8,9,39].

2.2. Sampling and Analysis

Four sediment cores were collected from Sepetiba Bay in August 2015 (see Figure 1) using a gravity corer. The cores were split and sub-sampled at 5-cm intervals. Grain size analysis was conducted using laser diffraction with the Mastersizer 2000 (Malvern Instruments Ltd., United Kingdom, MAN0384 Issue 1.0). The sediment samples were disaggregated using ultrasonic energy, and the results were analyzed using the equations proposed by Folk and Ward [40] on the Sysgran 3.0 (Sysgran.software.informer.com/3.0/, accessed on 20 May 2025) [41].
Mineralogy analyses were performed on the fine fractions (<63 µm) of sediments from the top, middle, and bottom sections of each core using X-ray diffraction analysis (XRD). The <63 µm fraction was selected as it concentrates clay minerals and fine particles where trace metals tend to accumulate, enhancing the detection of mineral phases relevant to geochemical processes. The analyses were performed at the Macromolecules Institute by Professor Eloisa Mano at the Federal University of Rio de Janeiro, using Rigaku Ultima IV diffractometer (Rigaku Corporation, Tokyo, Japan). The diffractograms were analyzed using Match! software, version 3 (2023), developed by Crystal Impact (Bonn, Germany).a software for phase analysis that utilizes databases to identify minerals and their common peaks.
Total Organic Carbon (TOC), Total Phosphorous (TP), Major elements, and trace elements were analyzed in sediment samples from all four cores. Total phosphorous was obtained according to Aspila et al. [42]. Total organic carbon was estimated using a Shimadzu analyzer, with a module for solid samples. The TOC contents were determined after carbonate removal with acidification, which was achieved by agitation for 16 h in a 0.1 mol L−1 HCl solution (Sigma-Aldrich, Darmstadt, Germany).
To obtain the pseudo-total metal content, 500 mg of dried and homogenized sediments were used, without prior sieving. The sediments were digested according to the 3050b U.S. Environmental Protection Agency (EPA) method [43], and the quantification for all metals was performed using ICP-OES spectrometer (Optima 8300, PerkinElmer Inc., Waltham, MA, USA)).
The adopted QA/QC procedures included the use of replicates and repeatability tests, as well as the use of blanks and analysis of certified standards. For metals, the blanks and standard certified sediment (BSCC-1 marine sediments) were treated like samples during the extractions. The respective detection limits are available in Supplementary Information (Table S1).

2.3. Mass Accumulation Rates (MAR) and Metal Fluxes

The mass accumulation rate (MAR) was calculated as follows:
MAR = SAR   * ρ
where ρ is bulk sediment density averaged over depth and SAR is the Sediment Accumulation Rate based on literature (Table 1).
Excess metal inventory (Mex) was determined by Equation (2):
M e x = i   C i C b a c k   *   ρ i * X i .
where Ci is the metal concentration at depth i, Cback is the baseline value in the bottom layers, ρi is the density at depth i and Xi is the depth increment. Metal Fluxes (Mflux) were calculated according to the Equation (3)
M f l u x i = ( C i )   *   M A R i  
where MARi is mass accumulation rate at depth i (Table S3).

2.4. Pollution Indexes

Three pollution indexes were calculated: Enrichment Factor (EF), Contamination Factor/Degree (CF), and Sediment Quality Guideline Quotient (SQGQ). Table 2 shows the adapted classification of three classes for each index. It was chosen to make it easier to cross-check them along with the text.
Enrichment Factor is an index used to assess the anthropogenic contribution to sediments and soils [44,47]. The EF index is calculated by normalization of metal content in the samples with respect to the concentration of a reference metal, such as Fe or Al, assuming that the reference metal content in samples originates almost exclusively from the Earth’s Crust [47,48,49]. Baseline values (bottom layers contents) were used as background to EFs calculation. The EFs were determined according to Equation (4).
E F = C i C i r e f s a m p l e C i C i r e f b a c k g r o u n d
where Ci is an element of interest and Cref is the concentration of chosen normalizer, Aluminum.
The contamination factor ( C f i ) considers single elements [43,44], and is calculated by
C f i = C 0 1 i C n i
where C 0 1 i is the content of a given substance in the samples and C n i is the background value considered for the environment. Different from the EF, the CF is the direct ratio between the content of the element in samples and the background reference, without normalization. Wedepohl [50] reports of upper continental crust used for CF calculations for Cu, Ni, and Pb, while [13] background values were used for Cd and Zn.
The Sediment Quality Guidelines Quotients (SQGQs) were calculated based on Farey et al. [46], where a classification index is generated for risk of environmental impact according to the following equation:
S Q G Q s = n = 1 5 C d L 2 C d + C u L 2 C u + N i L 2 N i + P b L 2 P b + Z n L 2 Z n 5
where L2 represents the concentration where the highest probability of adverse effect to biota is expected, and it was considered as being level 2 in CONAMA 454/2012 guidelines [51] for each trace metal. CONAMA 454/2012 [51] is the Brazilian legislation for sediment dredging and sediment quality for dredged material damping. It establishes two limits, for low and high probability of biota damage (Level 1 and Level 2), depicted in Table 2 for the trace metals discussed in this work. The classification criterion was adapted from Farey et al. [46].

2.5. Data Analysis

To explore the relationships among geochemical, granulometric, and elemental parameters, Spearman correlation analyses were performed, considering a confidence level of p < 0.05 due to the non-parametric nature of the data. Additionally, Principal Component Analysis (PCA) was applied separately to each core after data standardization to reduce dimensionality and identify dominant geochemical patterns. This multivariate approach enabled the discrimination of groups of variables associated with natural processes (e.g., sediment texture and mineral composition) versus anthropogenic contributions (e.g., trace metal enrichment). The first two principal components explained a substantial proportion of the total variance (see Table S2), highlighting the influence of fine particles, Fe and Mn oxides, and organic matter on the distribution of trace metals, particularly Zn, Cd, and Pb. These associations support the hypothesis that sediment composition plays a key role in the retention and mobility of contaminants. All statistical analyses and visualizations were conducted in R [52] and R Studio [53].

3. Results

3.1. Granulometry, Total Organic Carbon, Phosphorous and Mineralogy

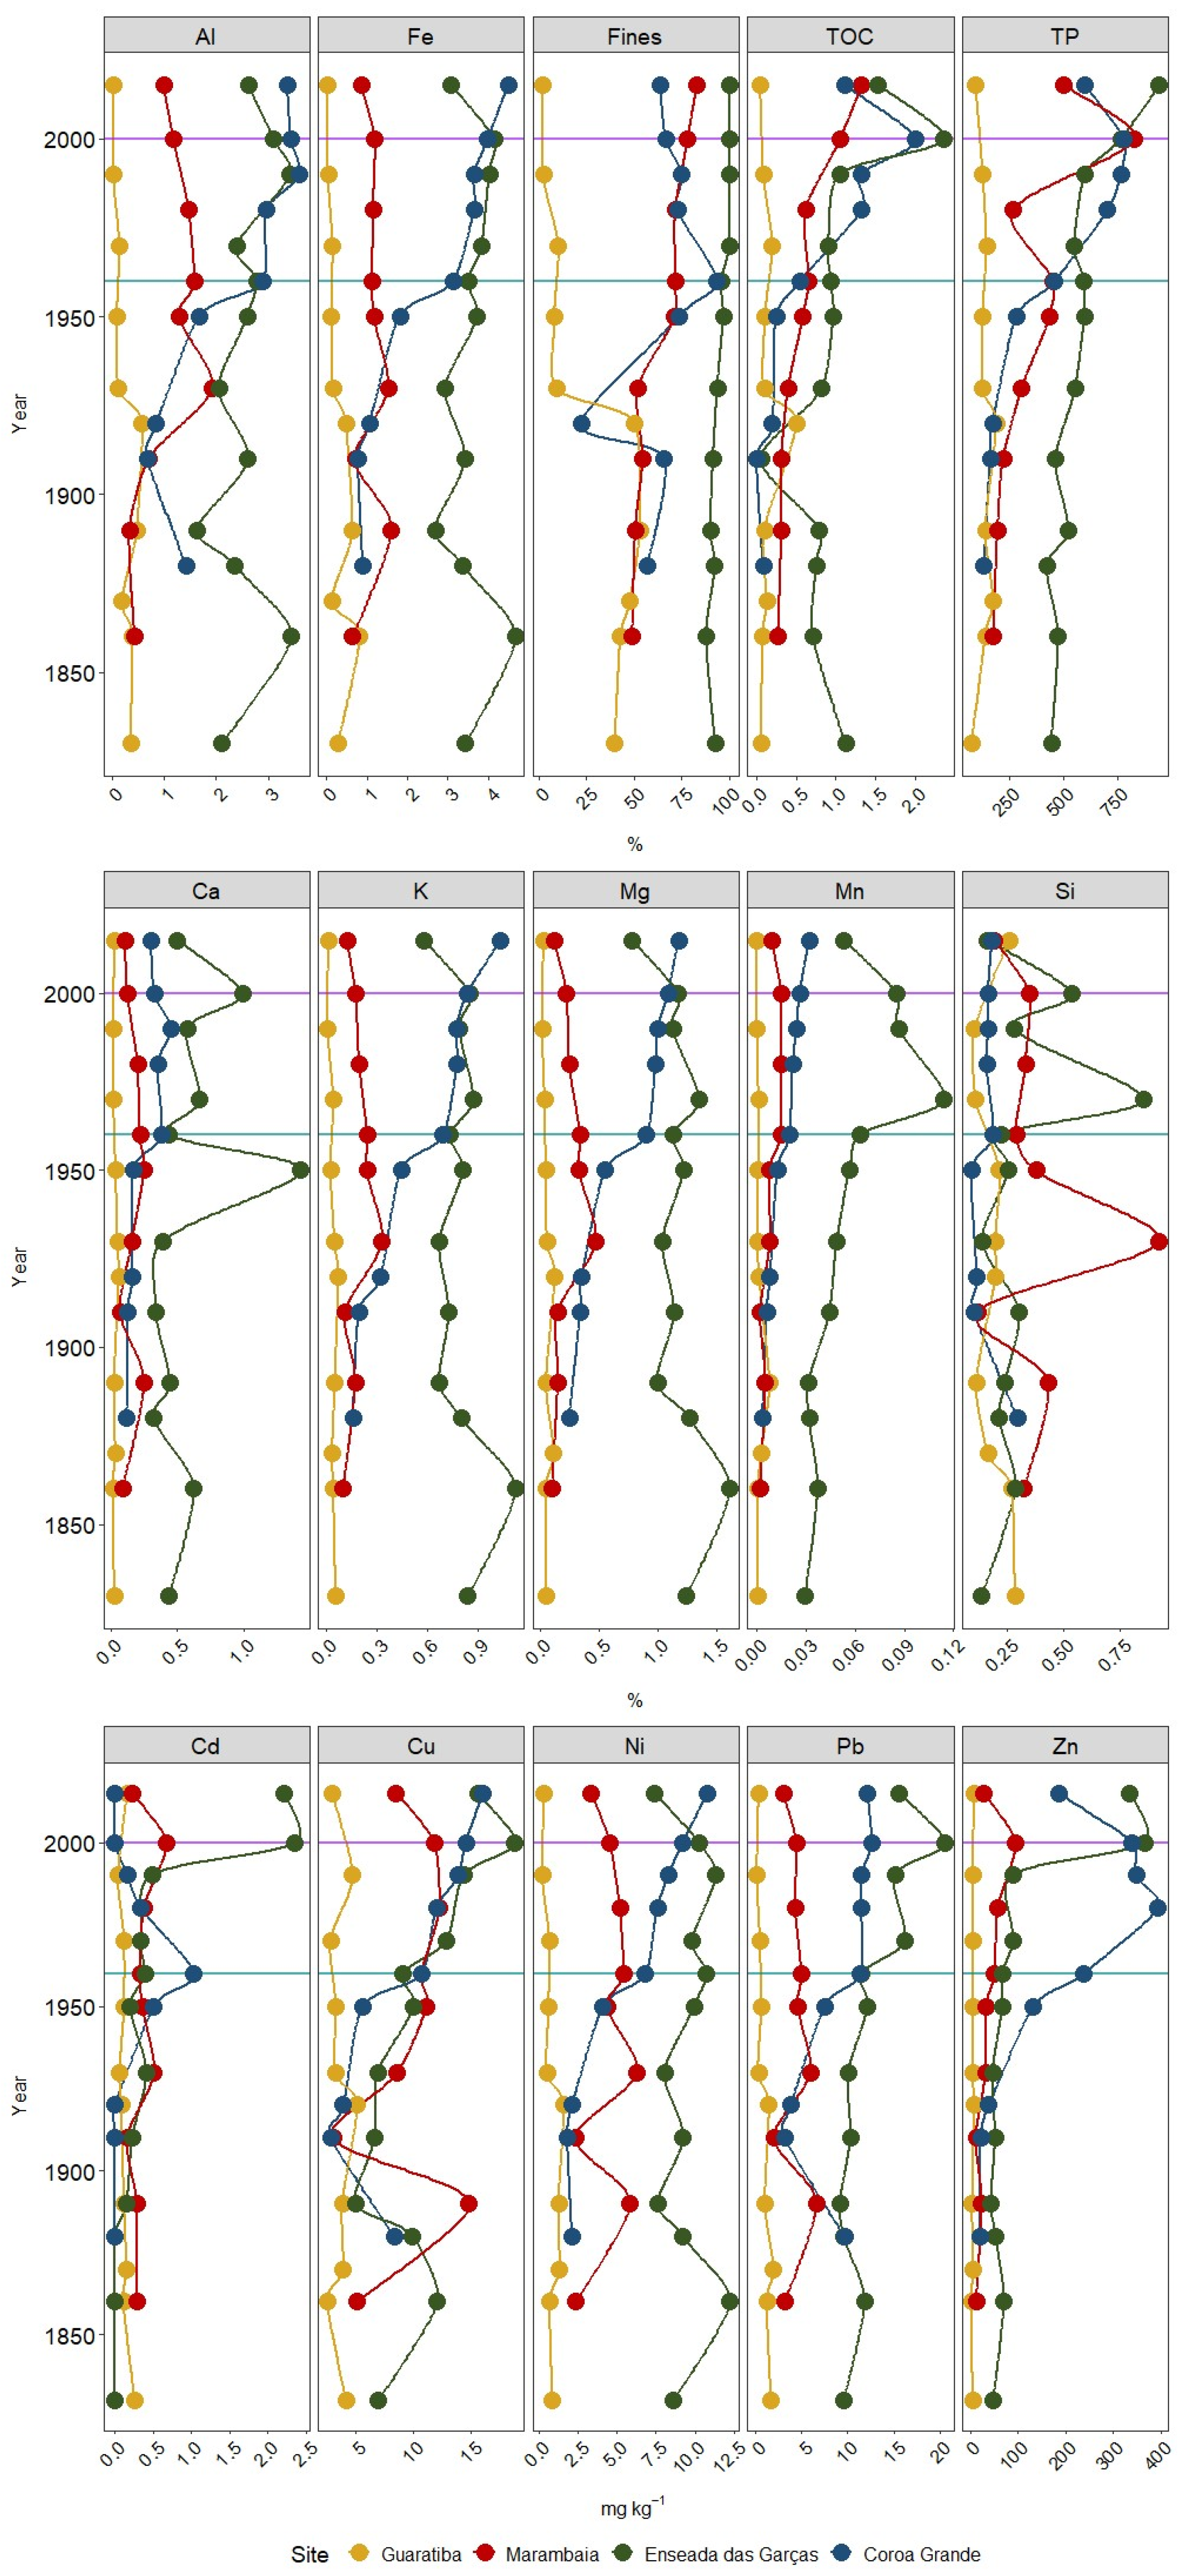
The sediments in the core from Guaratiba (GUA) are sandy in the upper 40 cm, with a higher content of fines below 40 cm (Figure 2). In the core from Marambaia (MAR), there is a dominance of silt in the upper 45 cm, while sand is the predominant grain size further down. Fine sediment prevails in the core from Enseada das Garças (EG), with the absence of sand in the upper 50 cm. The core from Coroa Grande (CG) is dominated by silt in the upper 85 cm, and below this depth, there is a significant contribution of sand (~40%).
The contents of TOC vary considerably in all cores (Figure 2), with the highest values recorded in the EG core and the lowest in the GUA core. The sediments dominated by silt in the inner part of the bay (EG and CG) were relatively rich in TOC compared to the coarser-grained sediments from the Marambaia Barrier Island (GUA and MAR). Phosphorous content as well as TOC, presented the highest values at EG, followed by MAR.
For the Marambaia Barrier Island area (MAR and GUA), quartz was the main constituent of the sediments, with minor contributions of biotite, goethite, anorthite, chloritoid, and magnetite. Pyrite was only found in the bottom layer of the GUA core, as shown in Table 3.
In the northeast part of the bay (EG and CG), kaolinite was the main clay mineral present in the cores, followed by quartz, chloritoid, biotite, and magnetite. Aragonite was present at all depths in CG. Pyrite was observed at all depths in samples from EG and in the superficial layer of the CG core.

3.2. Trace Metals Concentrations Fluxes and Inventories

The highest contents of Cu were found in the more recent sediment of EG (18.8 mg kg−1), while GUA (2.6–5.2 mg kg−1) showed the lowest. The highest contents of Pb were found in the inner part of the bay at 15 cm core from EG (20.4 mg kg−1). Near the Marambaia Barrier Island, much lower Pb contents from 0.2 to 6.6 mg kg−1 were found. Ni concentrations were also highest in the inner part of the bay at EG with values reaching 12.2 mg kg−1. Lower concentrations were found at the Marambaia barrier Island, ranging from 0.2 mg kg−1 (GUA) to 6.25 mg kg−1 (MAR). The highest concentrations of Cd were consistently found in the inner bay area, with maximum content at EG (2.4 mg kg−1) and CG (1 mg kg−1). The Cd concentration in the superficial layer from EG was twice higher than the threshold level 1 (1.2 mg Kg−1) of CONAMA 424/2012 [51], the limit above which adverse effects on biota are likely. Cd concentrations at the Marambaia Barrier Island (GUA and MAR) were lower, from non-detected to 0.7 mg kg−1. For Zn, the same pattern was observed, with highest concentrations at EG (364.7 mg kg−1) and CG (393 mg kg−1) and lowest contents in the marine area near the Marambaia Barrier Island (3.35 to 94.9 mg kg−1). At EG and CG the concentrations of Zn in recent sediment layers are well above the threshold level 1 from CONAMA 424/2012 [51] (150 mg kg−1).
Table 4 shows the maximum and minimum contents of trace metals found in the cores, also in some locations of the Brazilian southeast coast, as a comparison, and the guidelines values of CONAMA 454/2012 [51]. Gomes et al. [13] and Silva et al. [8] found higher Cu (42.5 and 38 mg kg−1, respectively), Pb (55 and 77 mg kg−1, respectively), Ni (27.1 and 35 mg kg−1, respectively), Cd (4.9 and 4.9 mg kg−1, respectively) and Zn (779 and 1067 mg kg−1, respectively) contents near the São Francisco Channel area. Copper and Pb contents vary widely across studies, where maximum values (167.2 and 204.75 mg kg−1) are found in the São Paulo State Coast [54]. Moreira et al. [54] also found higher Ni (44.2 mg kg−1), Cd (8.84 mg kg−1), and Zn (1077.33 mg kg−1) contents in comparison to the present study, mostly near Santos and the São Vicente Estuary, two ecosystems highly impacted by industrial and domestic sewage. Aguiar et al. [55] found a higher content of Ni (52.4 mg kg−1) in the Doce River Mouth, where in 2015 a mud wave arrived due to the biggest environmental disaster in Brazil, the rupture of the Fundão Dam, which released almost 40 million cubic meters of mining waste in the Doce river basin.
Maximum Cd concentrations in the present study (up to 2.4 mg kg−1 at EG) are higher than those found by Rodrigues et al. [12] and Marques Jr. et al. [37] in Sepetiba Bay. The first found Cd concentrations in surficial sediments near CG between 0.48 and 0.61 mg kg−1, while the last found Cd content between 0 and 33 cm (sediment depth) from 0.5 to 1.5 mg kg−1. Maximum Zn concentrations (up to 393 mg kg−1 at CG) in the present study are up to one order of magnitude higher than the estimated background values for bay sediments next to fluvial sources (54 mg kg−1 [13]) and pre-industrial values (from 69 to 103 mg kg−1 at CG [38]).
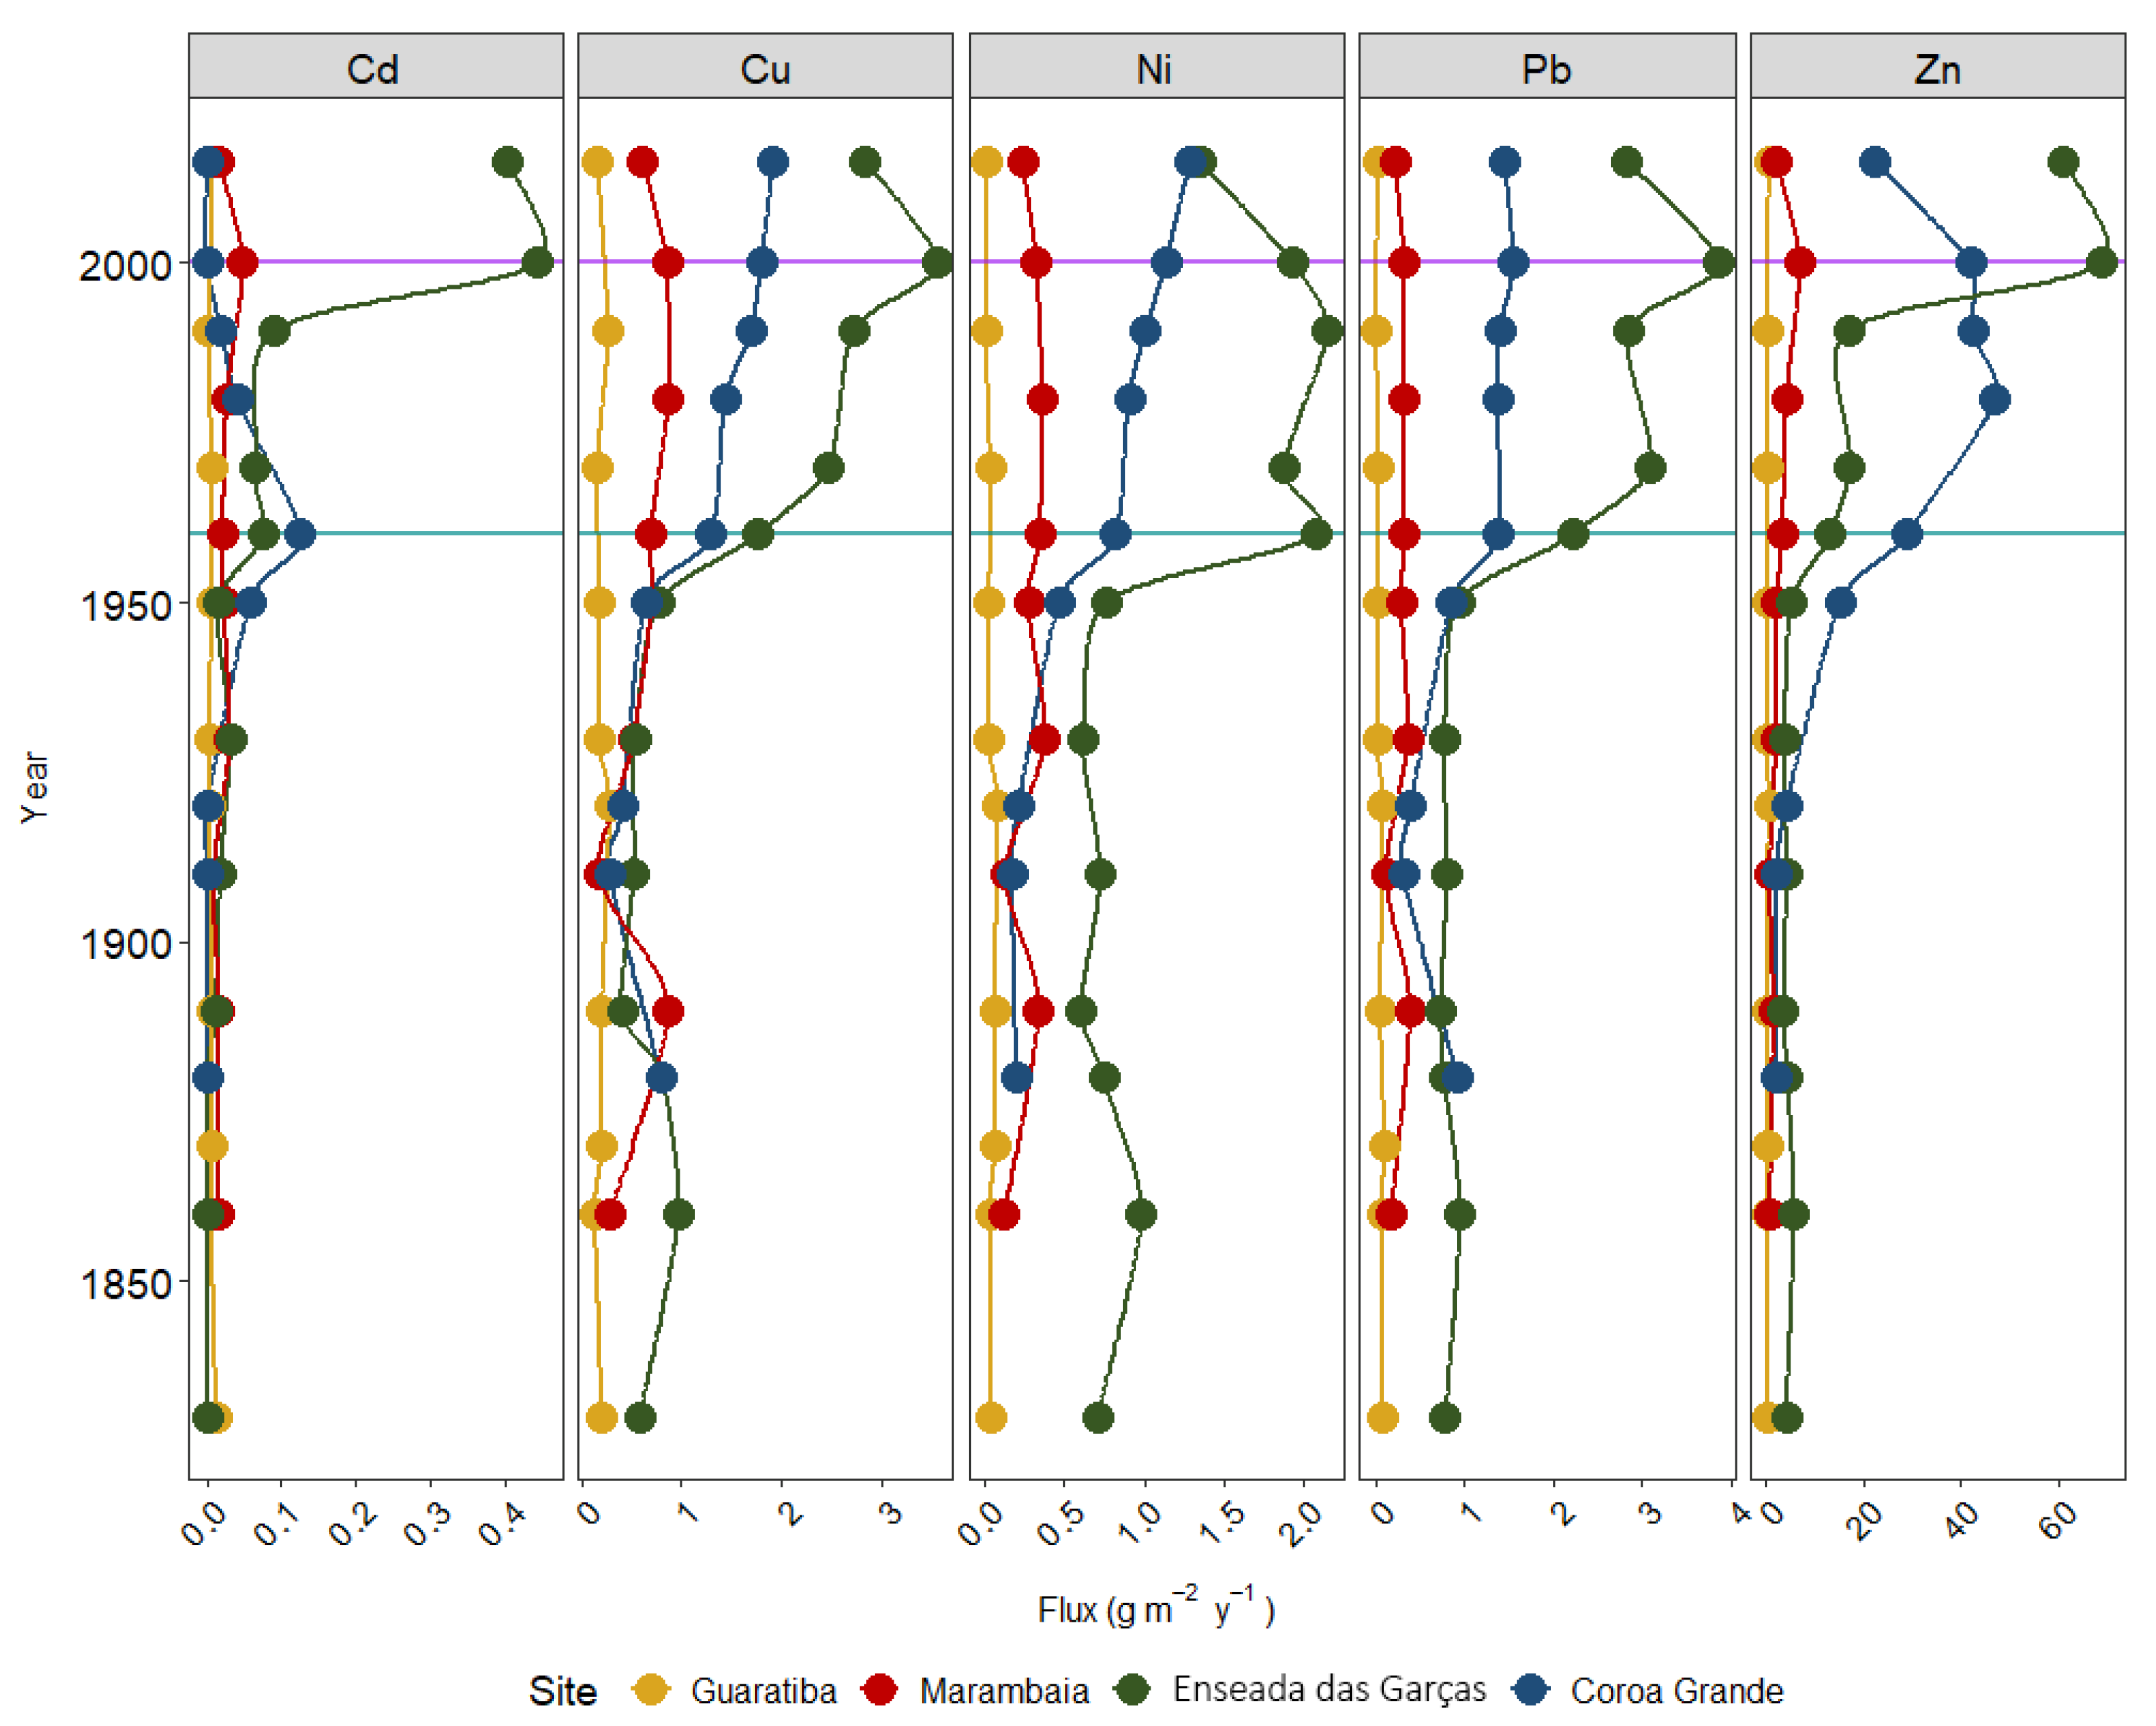
Mean annual fluxes of trace metals in recent years (>1990’s) were calculated and compared with bottom fluxes (<1900’s) (Table 5). In Sepetiba Bay, fluxes of Cd, Cu, Ni, Pb, and Zn had a general tendency to increase from the 1950s until 2010 (Figure 3). For MAR and GUA, trace metal fluxes are generally low, while high fluxes of metals occur in the inner part of the bay. EG and CG showed increasing fluxes of all five trace metals after the 1950s, especially for Cd (8 × 10⁻⁵ to 0.4 g m−2 y−1) and Zn (4.0 to 60.9 g m−2 y−1) in EG. Decreasing patterns towards the surface have occurred for all elements since the 2000’s.
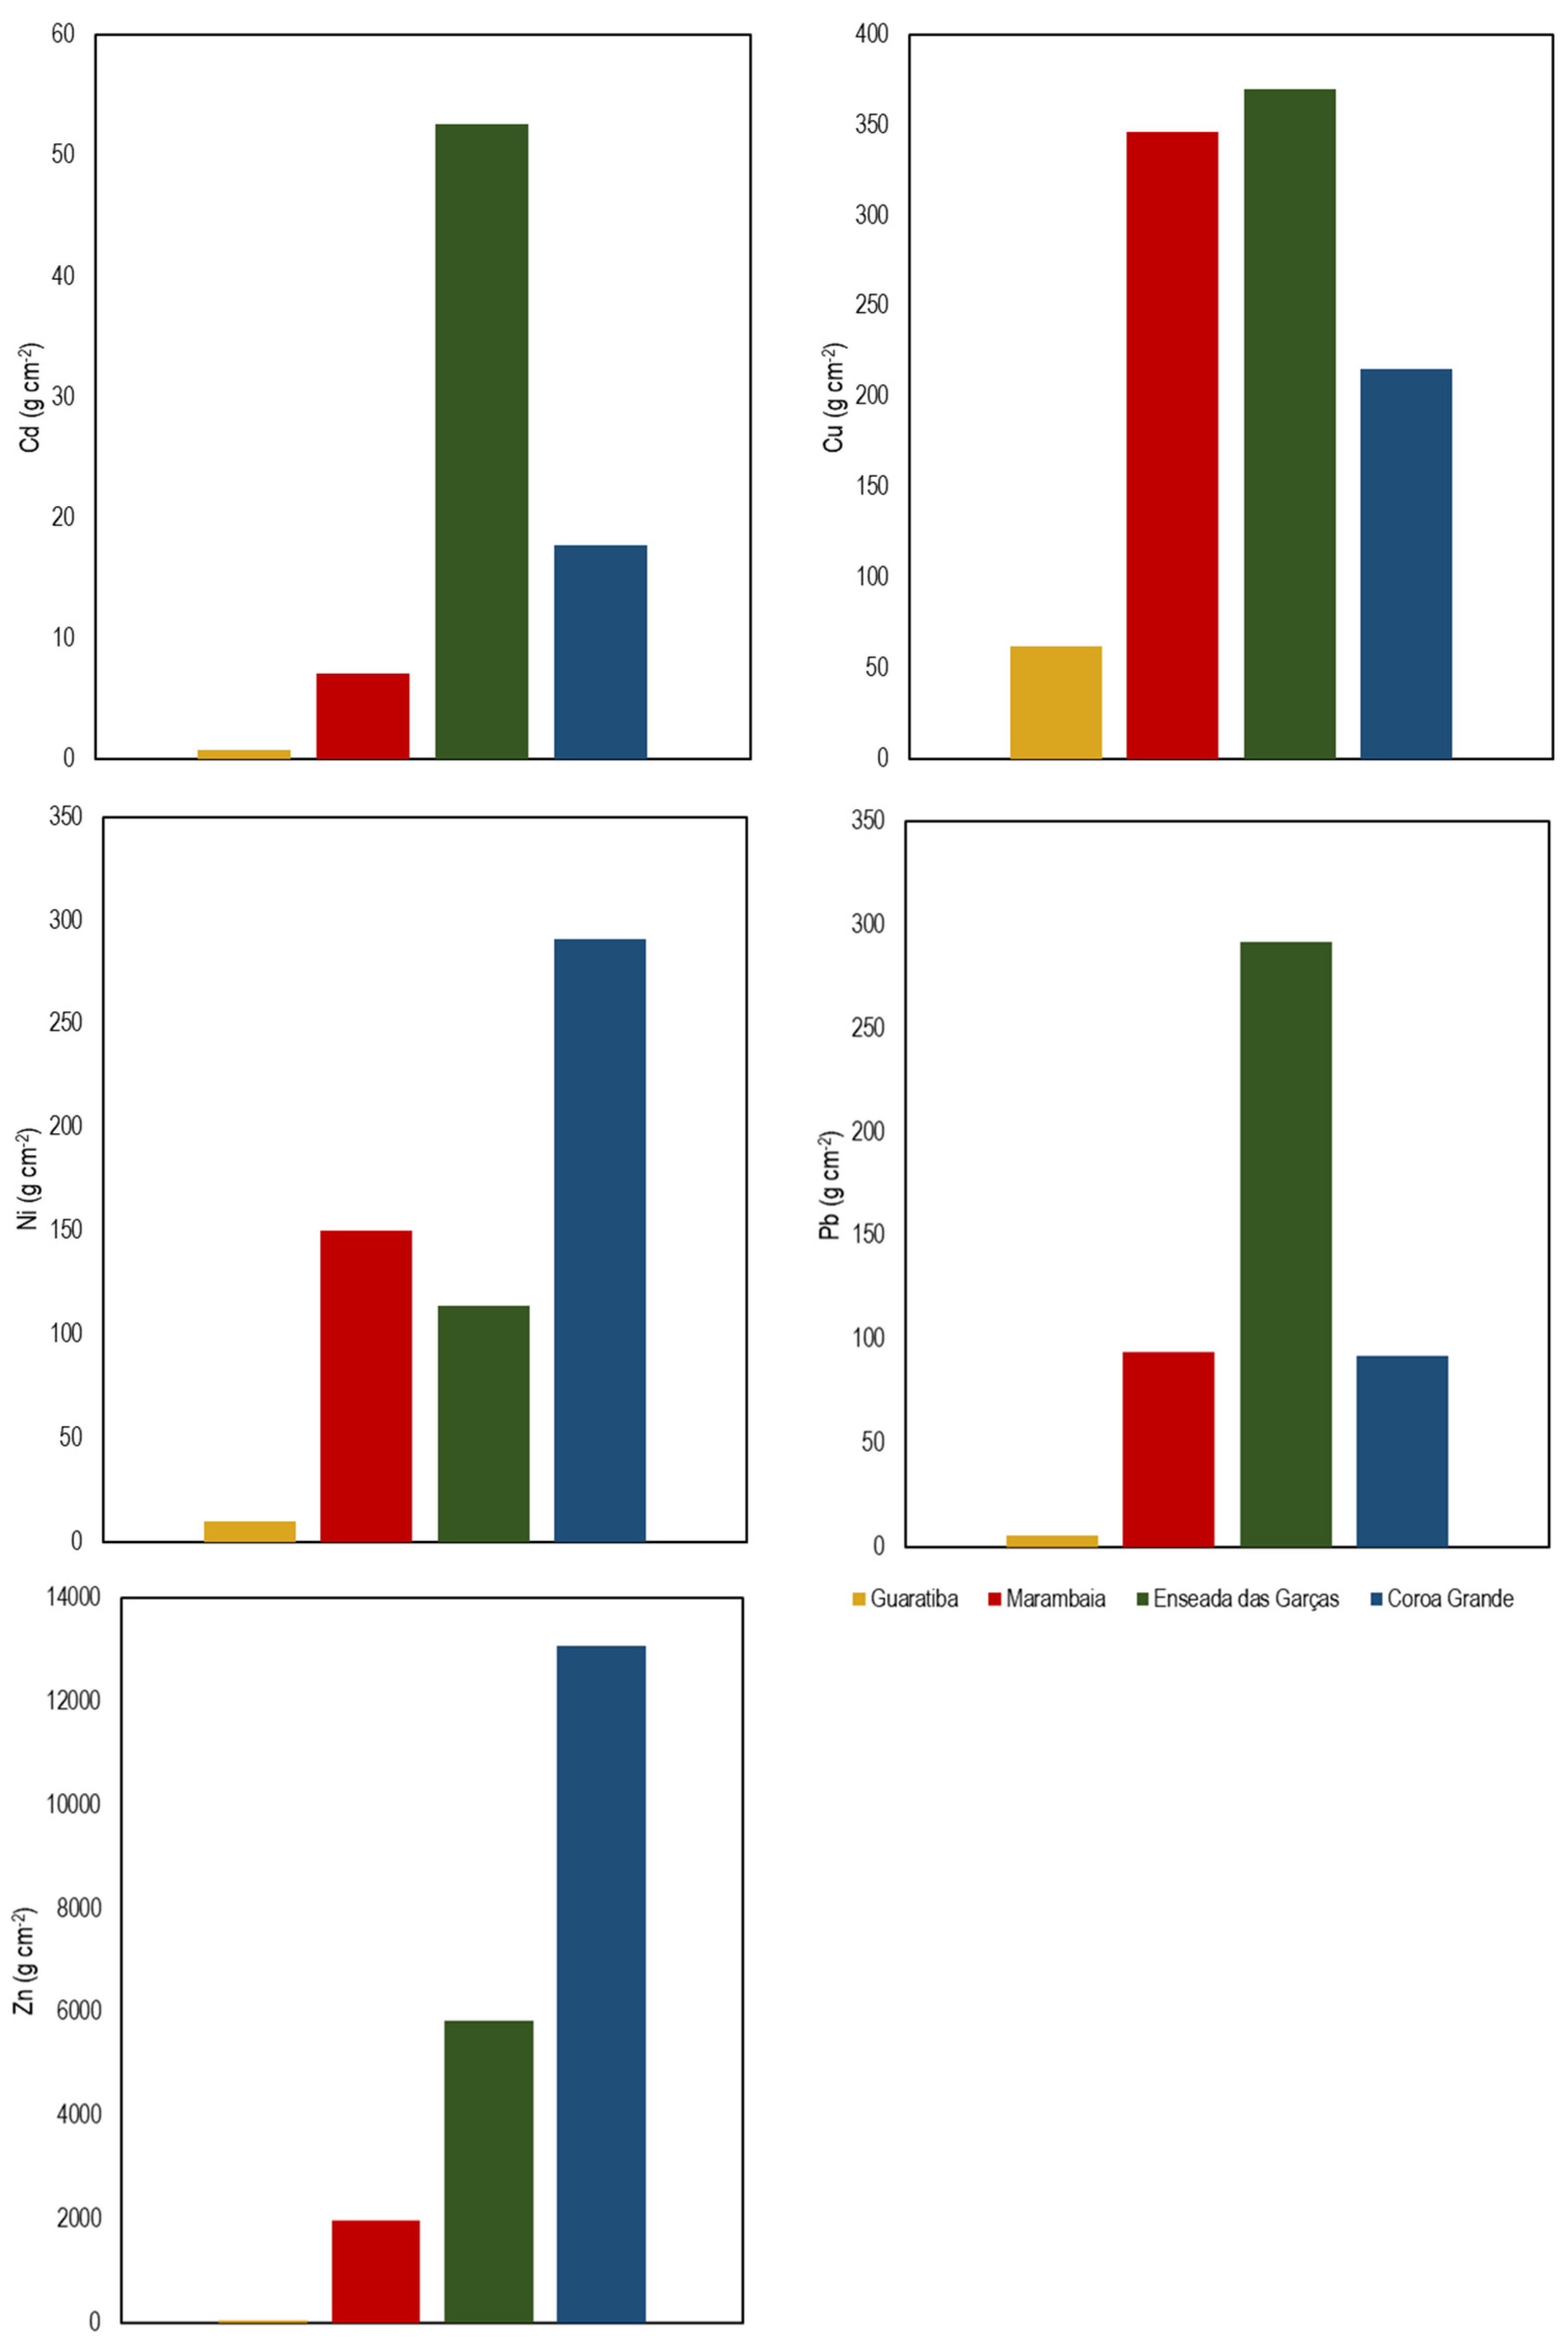
EG presents distinctly the highest excess inventories of Ni, Cu, Pb, Cd, and Zn, followed by CG (Table 5; Figure 4). While inventories in the Marambaia Barrier Island were plainly lower than in the inner bay area, the middle part of Marambaia Barrier Island, (MAR) showed higher accumulation than at GUA, especially for Ni and Cu.

3.3. Pollution Indexes Results

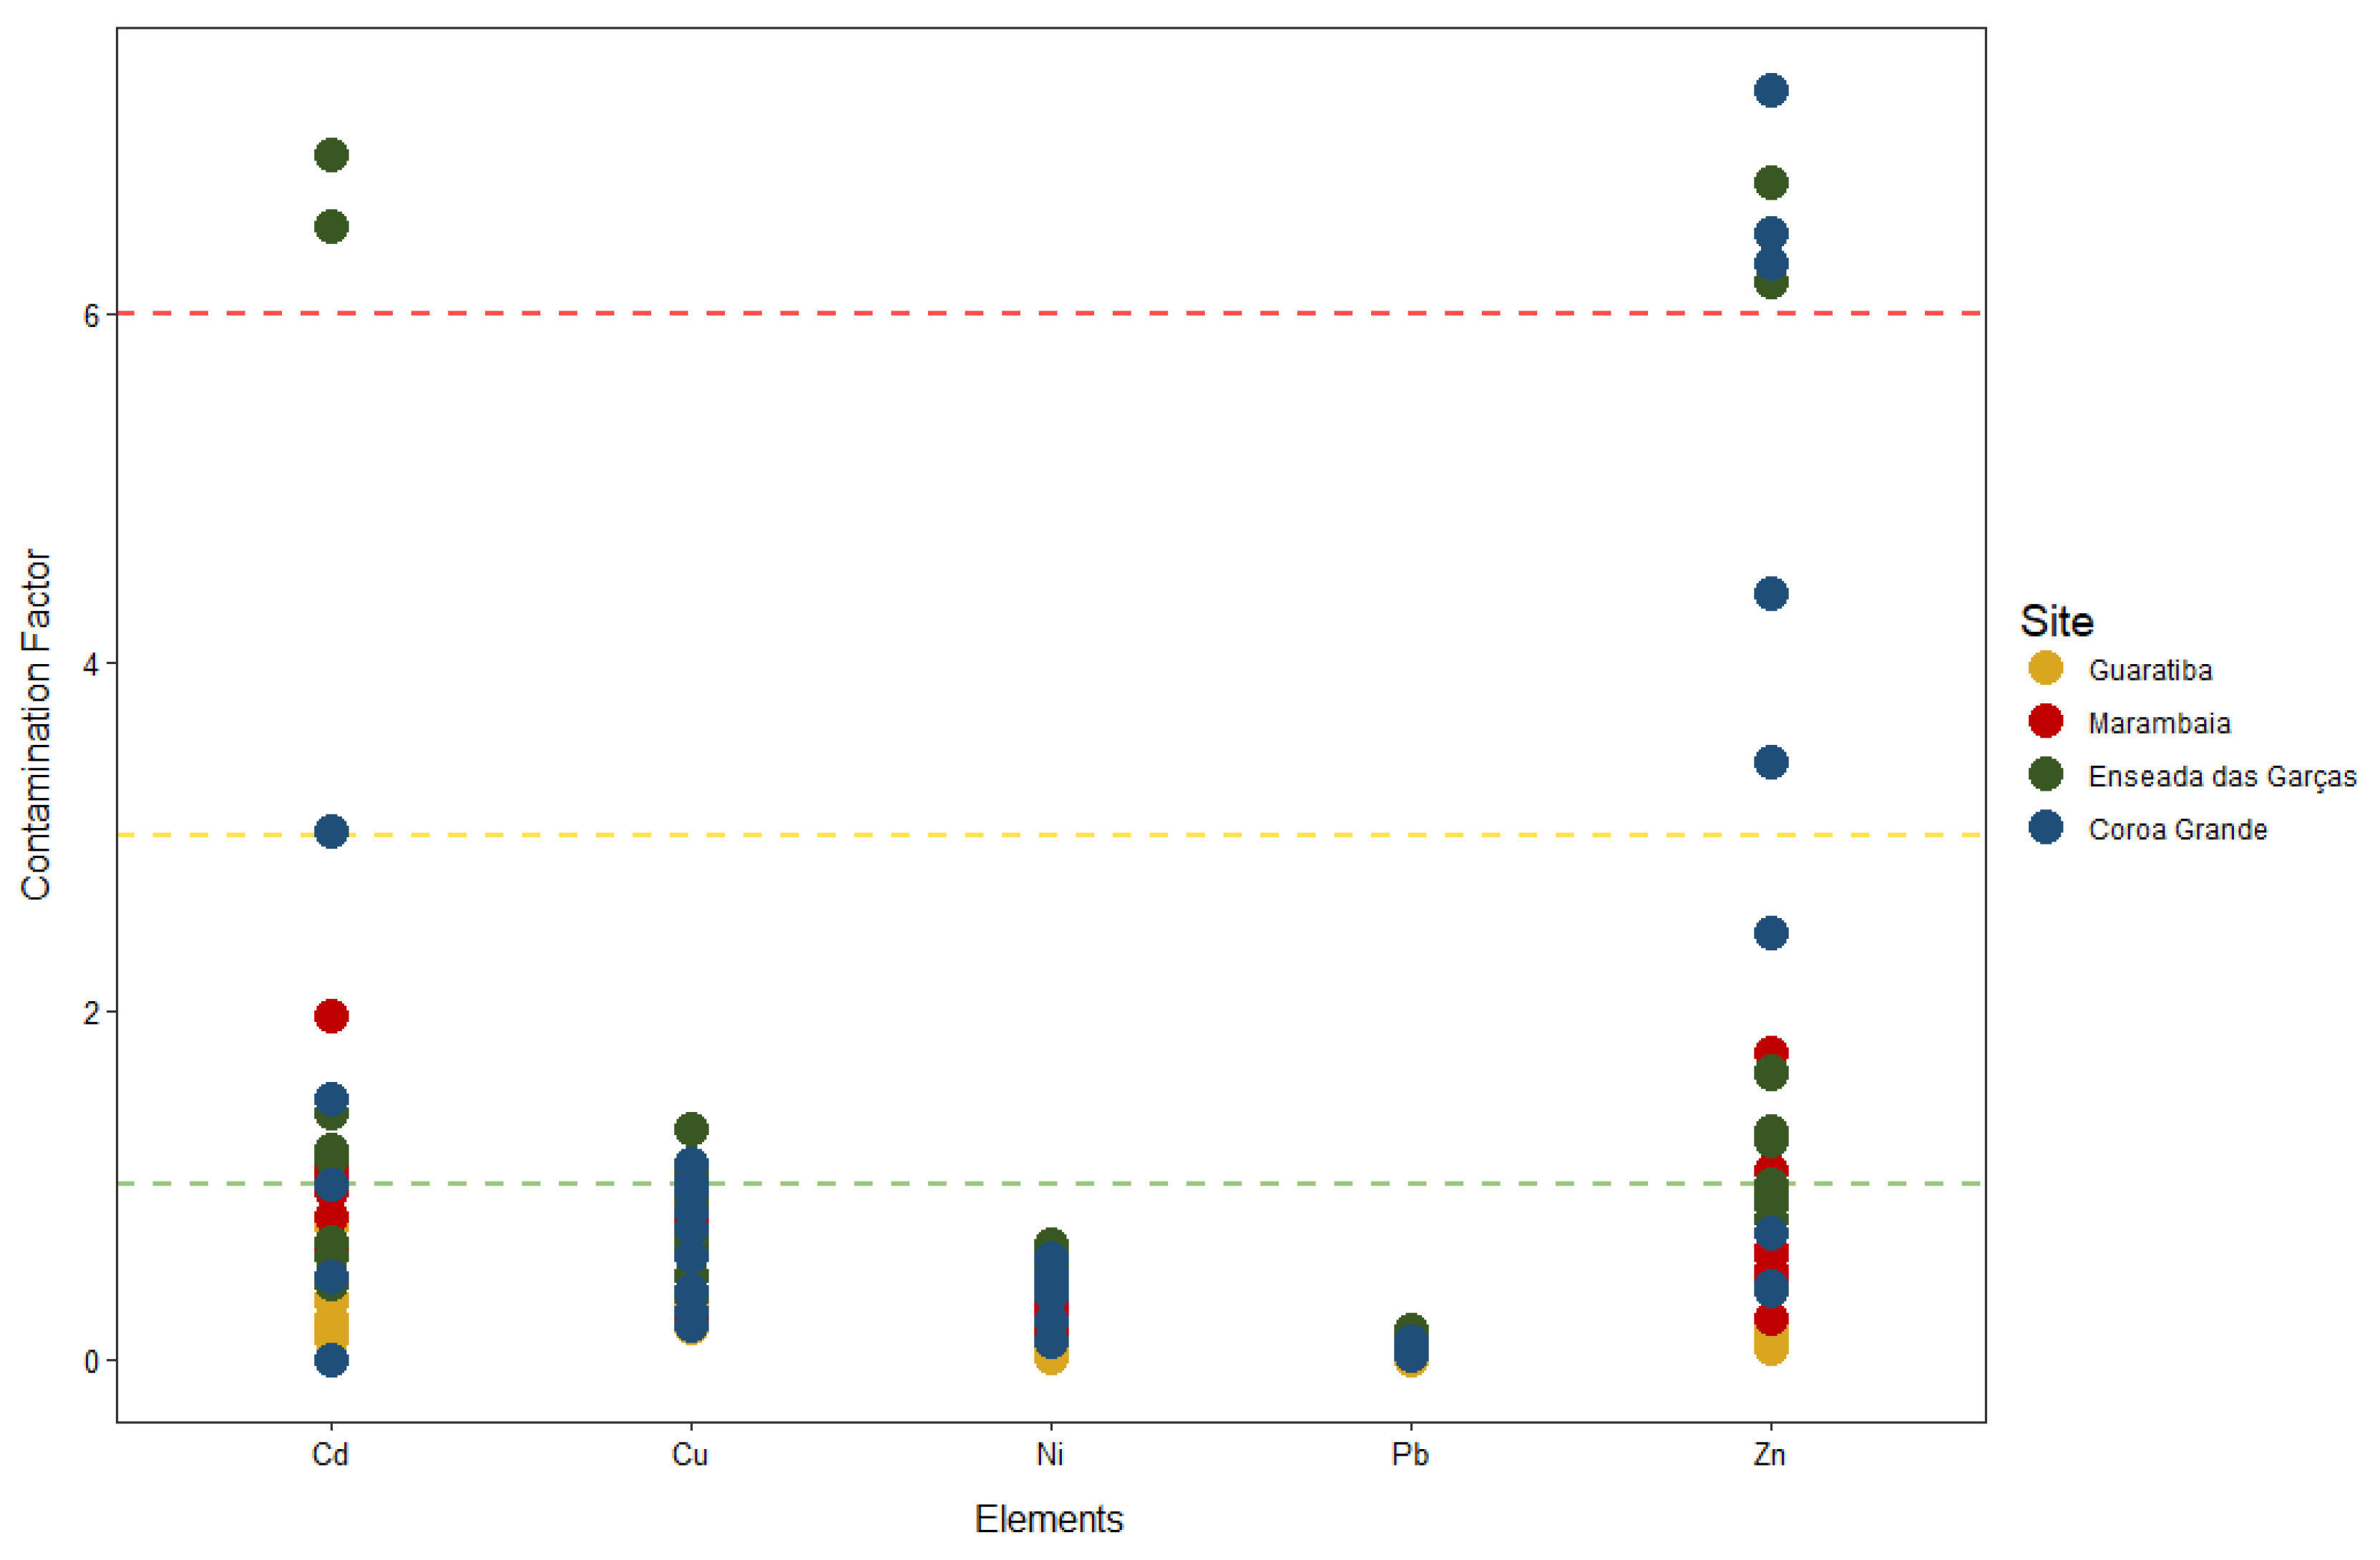
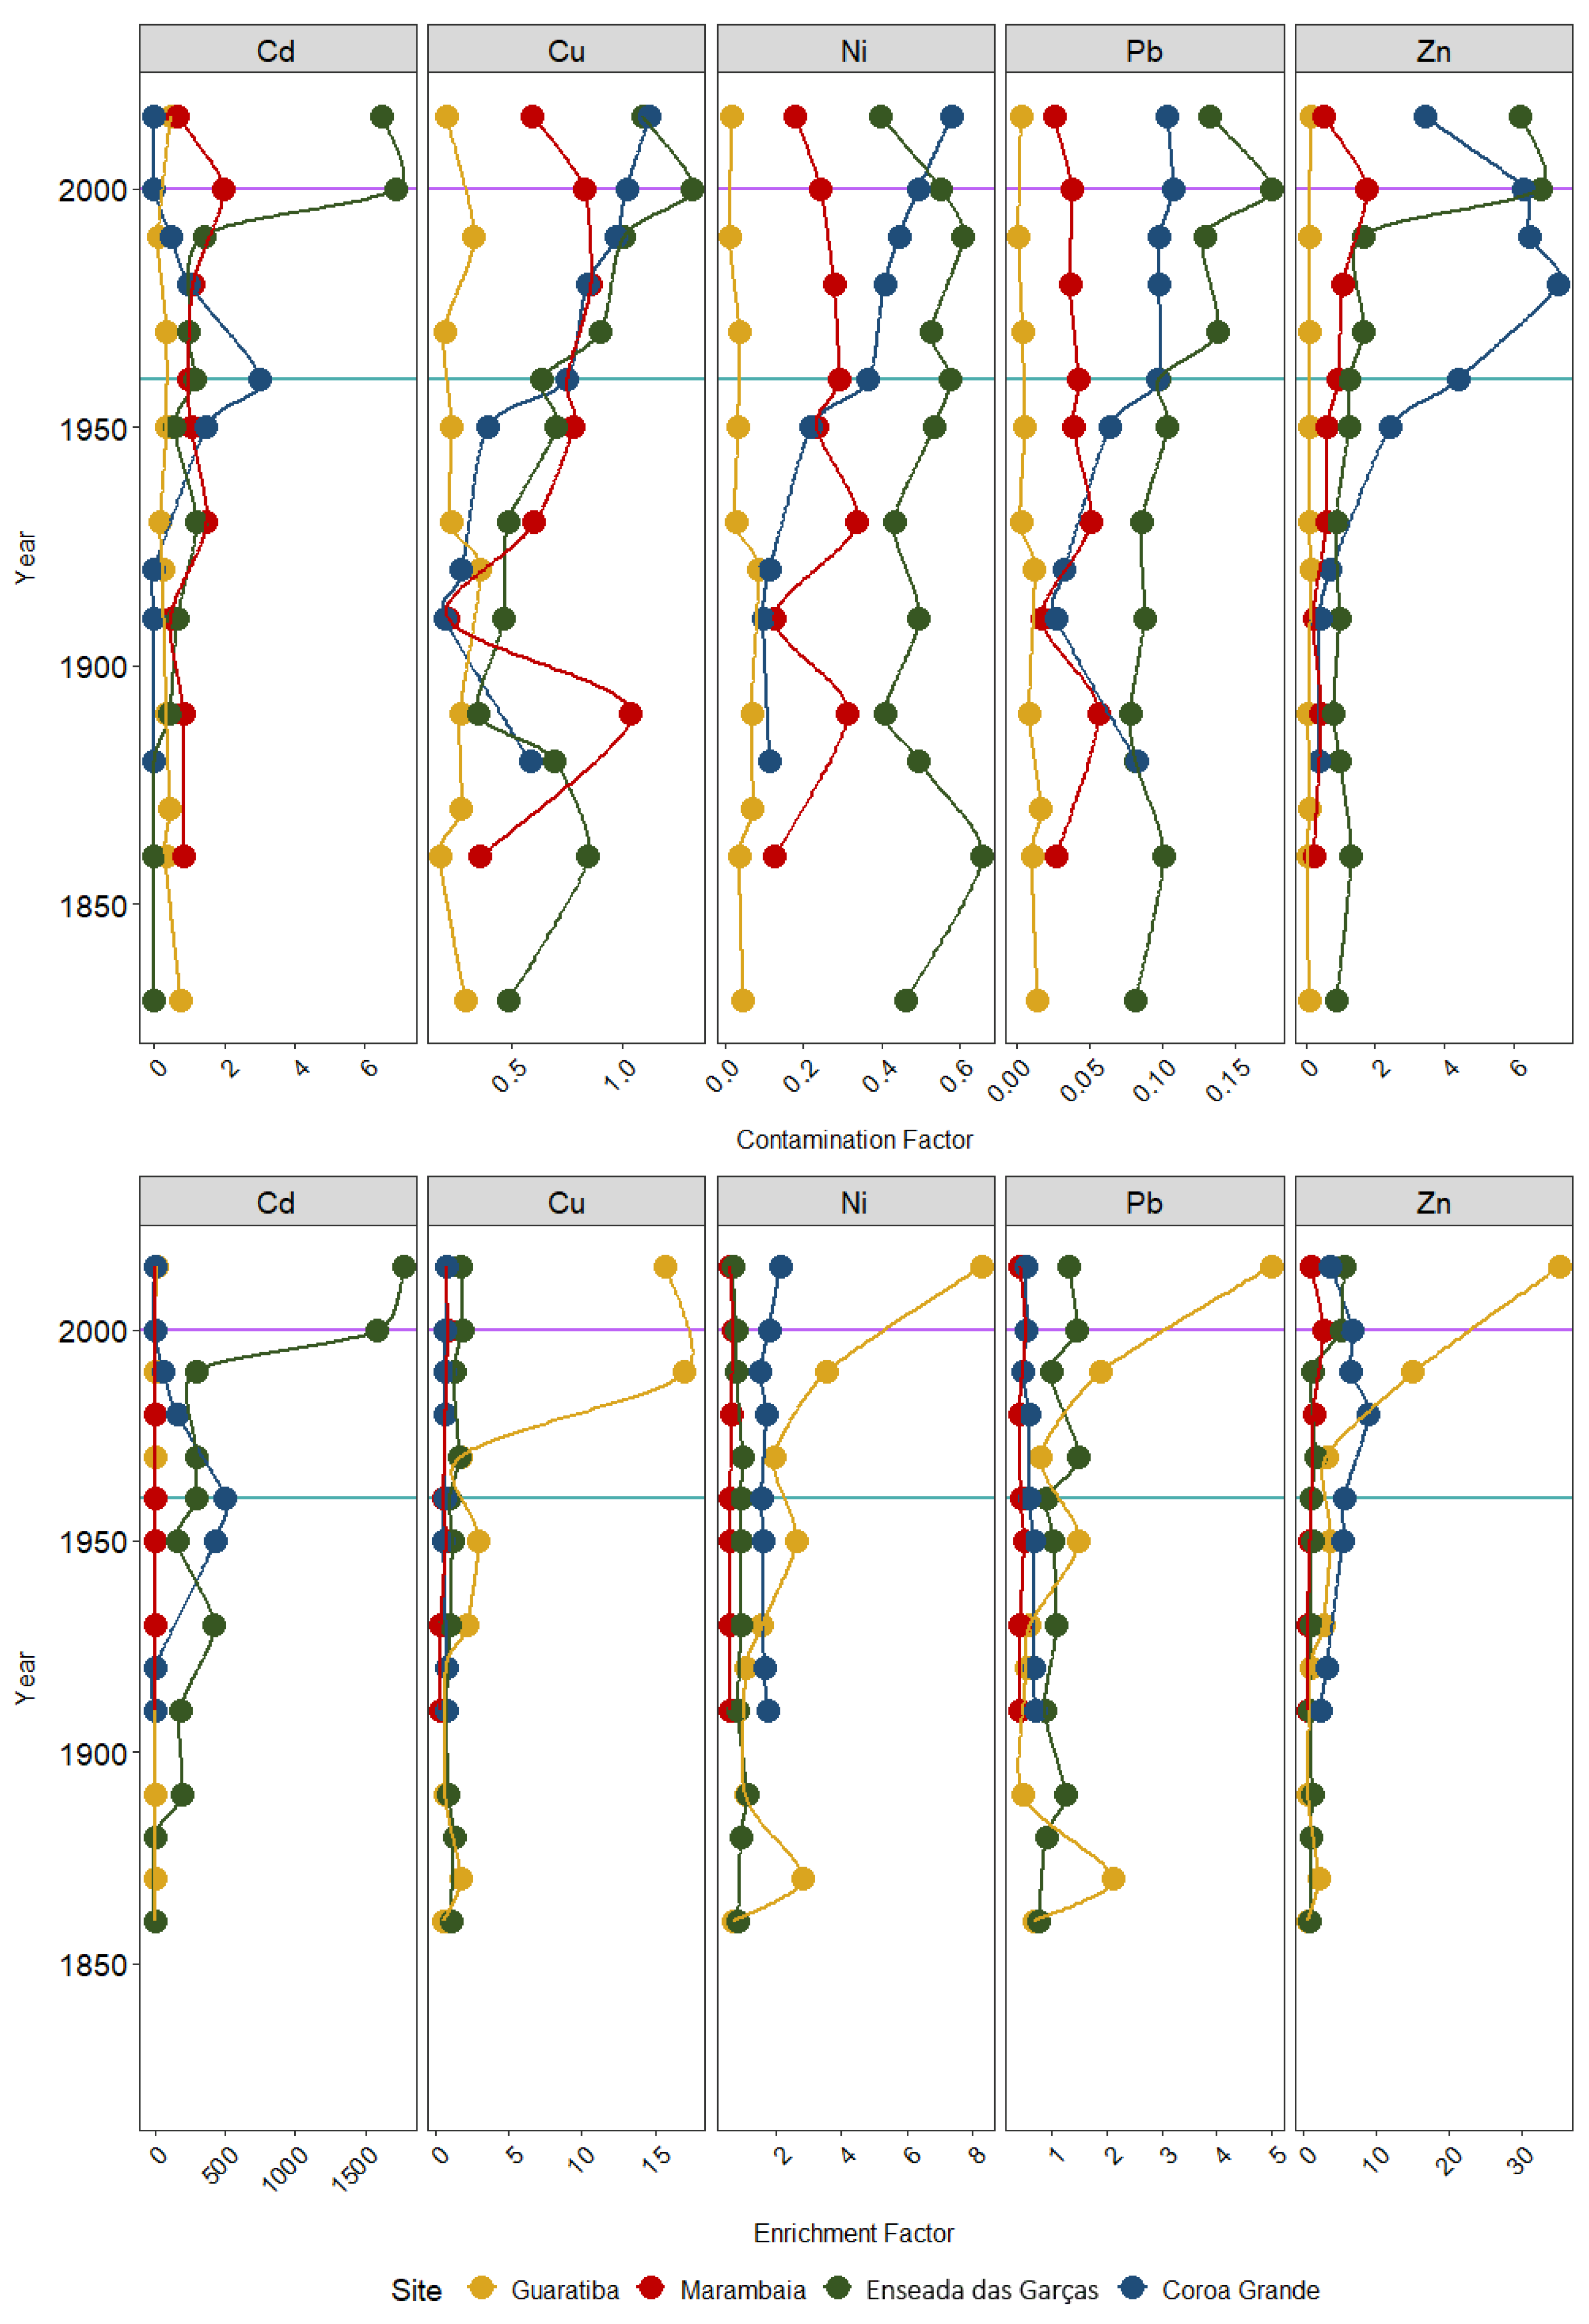
The contamination factors (CFs) of Ni and Pb did not exceed background values. The highest calculated CFs were, in descending order, Zn > Cd > Cu. CFs for Ni and Pb indicate “low contamination” for all sites (Figure 5 and Figure 6). Cu values in recent layers from EG and CG indicate “moderate contamination”, and are near this classification in MAR, reinforcing the increase of Cu contamination in the bay, notably in the last years. Cd and Zn are in the range of “moderate contamination” in recent layers from MAR (>15 cm ~2000s), in older layers from EG (75 cm ~1950 to 30 cm ~1990s) and CG (75 cm ~1950). CFs for Cd and Zn indicate “high contamination” of sediments in recent layers from EG (>15 cm ~2000’s) and for Zn in CG (>45 ~1980’s).
In general, Cd was the element that presented the highest EFs (Figure 6), reaching maximum contamination levels (“high enrichment”) at almost all EG layers (>100 cm: 1900s) (Figure 7). Zn EFs in the EG recent layers (>30 cm ~1990’s) show “moderate enrichment”. At CG, “high enrichment” was observed for Cd between 75 and 30 cm (1950–1990), while Cu showed “moderate enrichment” in recent layers (2000s) and Zn was moderately enriched in all layers. At Marambaia Barrier Island, all five metals were “moderately enriched” at Gua from the 1950s, while low enrichment was observed in MAR for all cases.
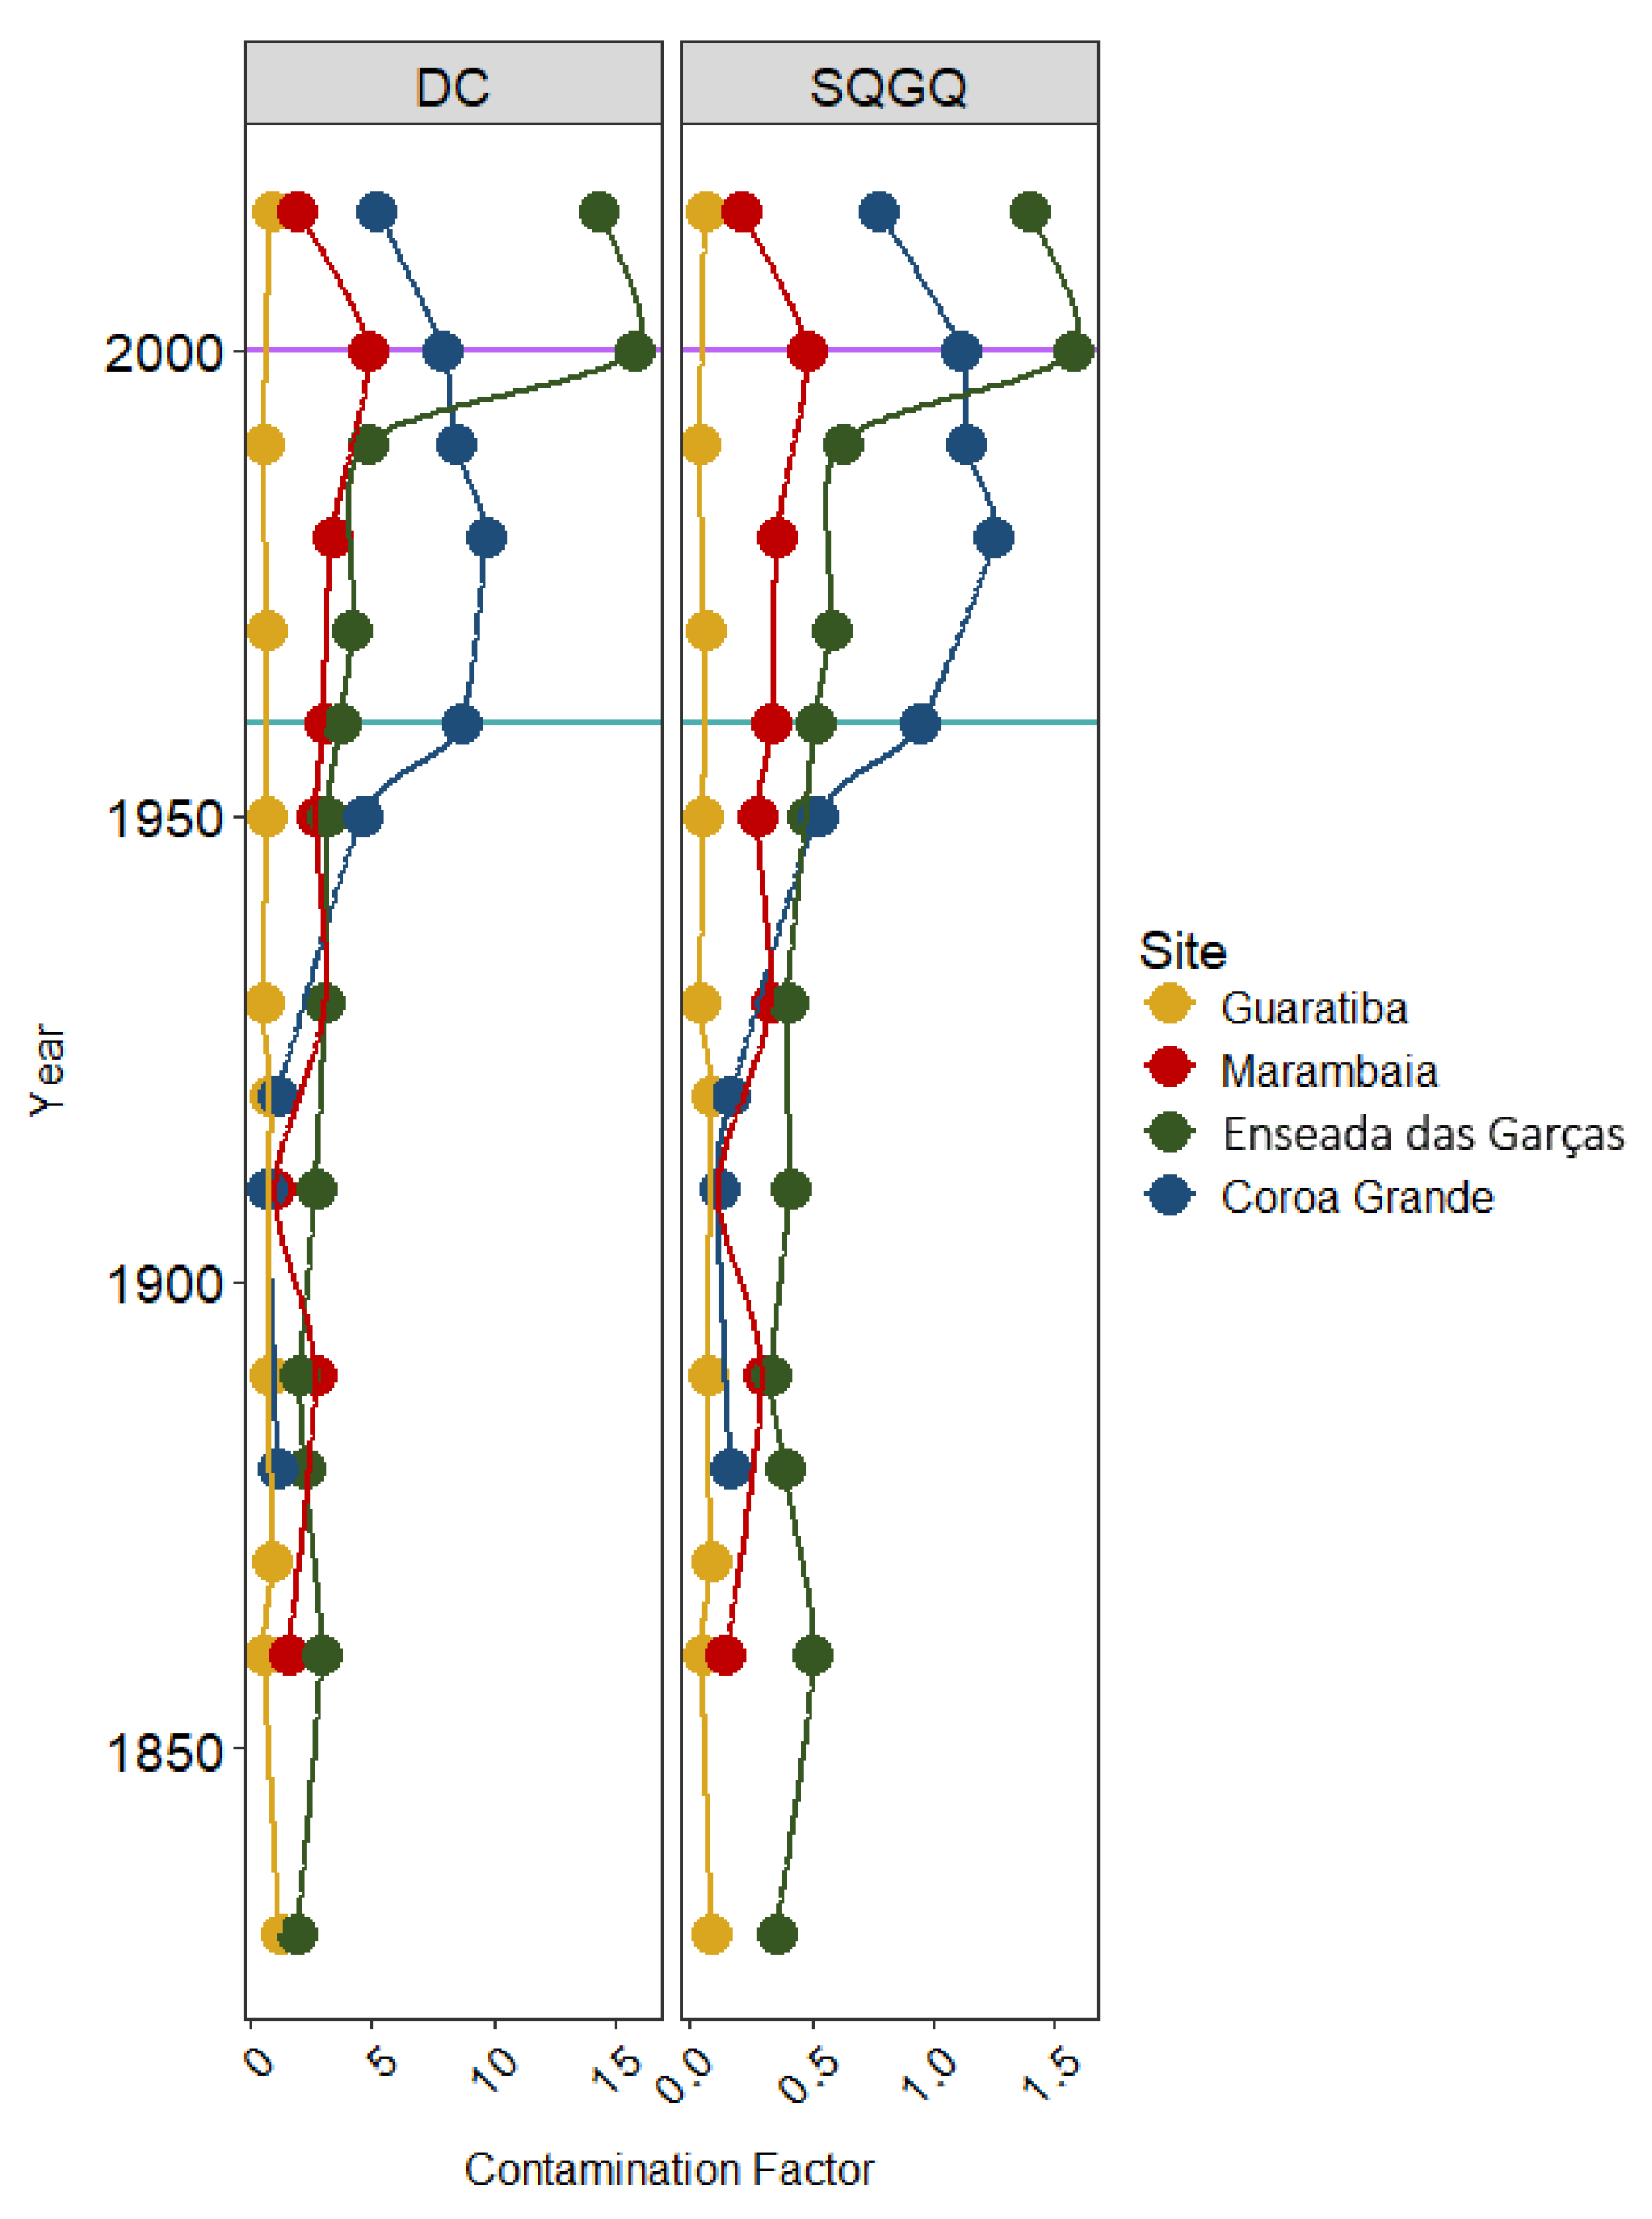
The degrees of contamination (DC) (Figure 7), which are the sum of the five metals CFs, indicate “low contamination” in the entire GUA core. For MAR, the DC classified all samples as “moderate contamination”. The DC of EG classified the samples below 30 cm (1990’s) as “moderately contaminated” and samples above 15 cm (2000s) with “high contamination”. Sediment Quality Guidelines Quotients (SQGQs) are presented in Figure 7. The GUA core presented values below 0.1, indicating no risk to the environment. For MAR, the majority of samples indicated an environment “under risk of impact”, with the exception of the most superficial layer and bottom layers at 60 and 80 cm, classified under “potential risk” of impact. EG presented a gradient along the core with samples >15 cm (> 2000s) indicating an environment under “high risk of impact”, layers between 60 to 30 cm (1960–1990s) “under moderate risk of impact” and below 60 cm (<1960’s) “under risk of impact”. CG profile presented a superficial layer “under moderate risk of impact”, enhancing to “high risk of impact” between 15 and 45 cm (1980–2000s), and returning to “under moderate risk of impact” until 75 cm (~1950’s).

4. Discussion

4.1. Spatial Distribution and Geochemical Behavior of Trace Metals

For all analyzed trace metals (Cd, Cu, Zn, Ni, and Pb), the concentrations were highest at the inner part of the bay (EG and CG) (Figure 2). The Sepetiba Bay is a transition system between open marine and estuarine, with gradients in salinity and grain size distribution between the Marambaia Barrier Island Area and Coroa Grande. This gradient is also observed in the retention of metals, which naturally follows the grain size, but also reflects the proximity to the main anthropogenic sources in the northeastern side of the bay. This is clearly illustrated by excess metal inventories (Figure 4).
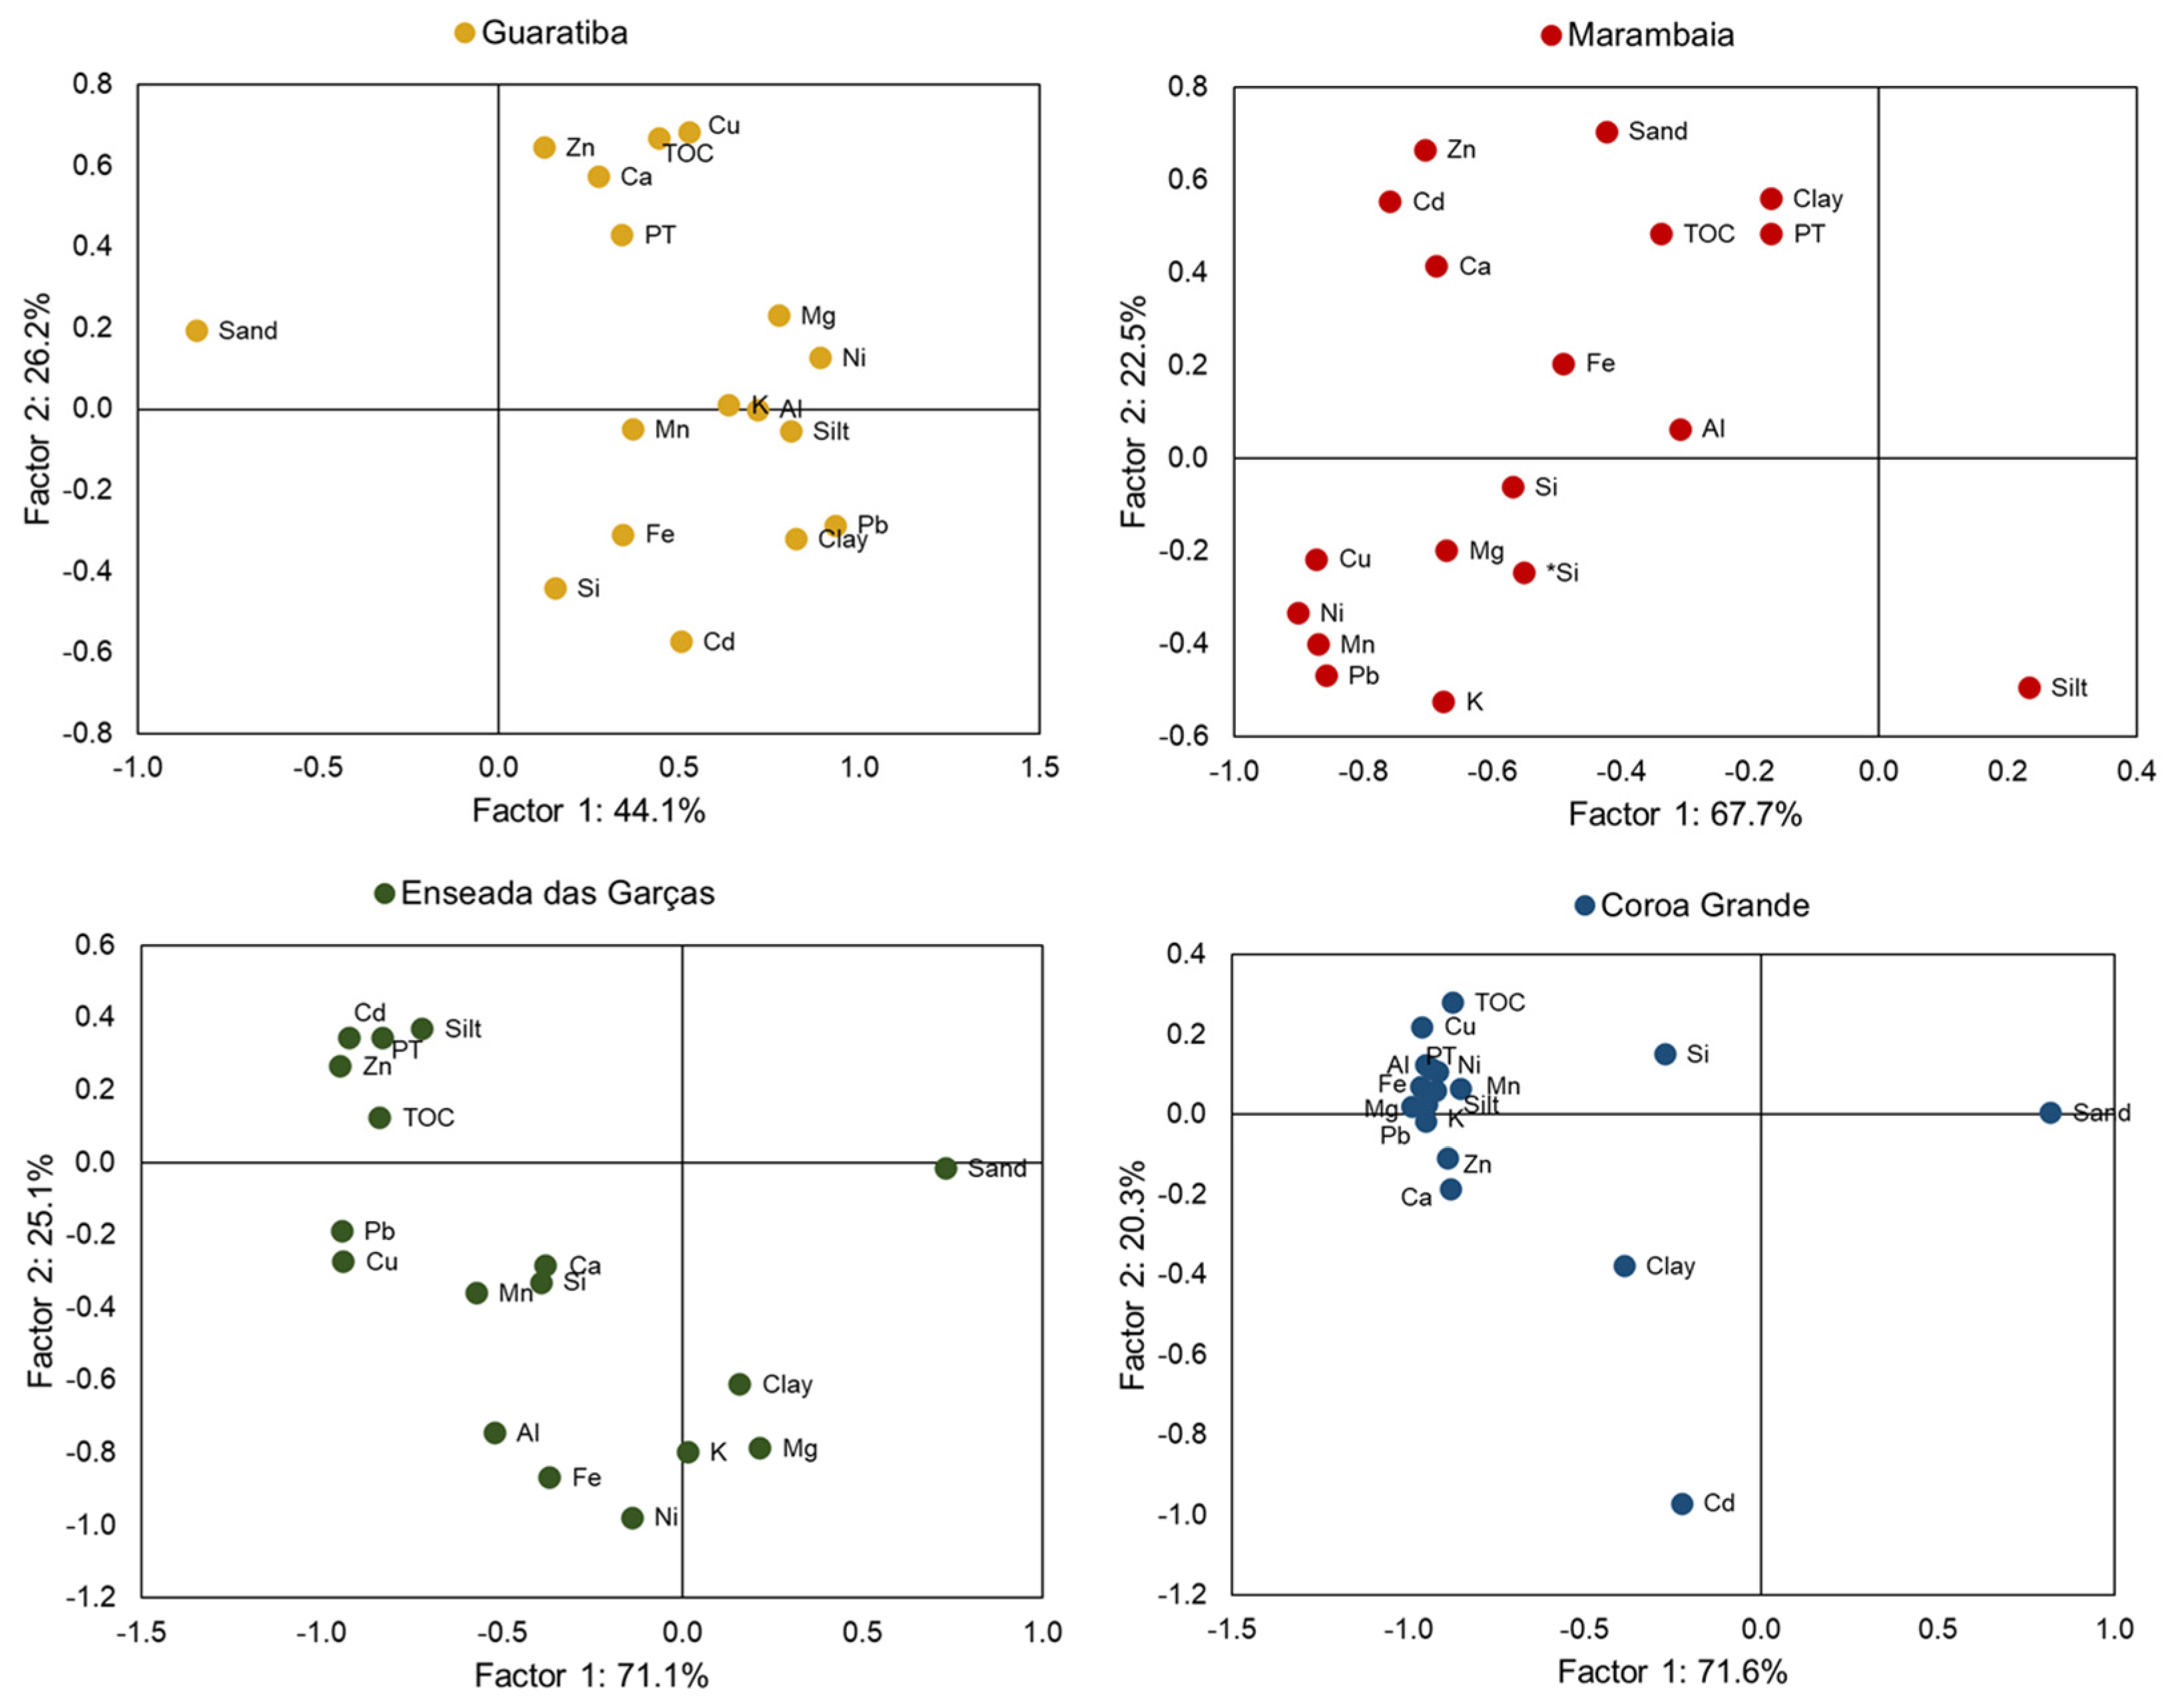
The affinity of metals with the fine-grained sediment fraction is evidenced by positive correlations of trace metals (Cu, Ni, Pb, Zn), silt, clay, and TOC, depicted in the PCAs (Figure 8, Table S3). High mud contents reduce the diffusion of oxygen into the sediment, while high TOC contents favor microbial oxygen uptake/demand. The combination of TOC and grain size affects trace metal mobility/retention in the sediment since the depletion of oxygen and production of sulfides results in metal retention through the formation of metal sulfides. Contrastingly, lower contents of fines in sediments from the Marambaia Barrier Island, associated with an intermittent exchange between the bay and the open sea through a narrow breach between the Marambaia Barrier Island and the coastline of Guaratiba, decreases the potential condition for trace metal retention in this area. The reduced trace metal retention capacity observed in the Marambaia Barrier Island region is strongly linked to its hydrodynamic setting and sediment texture. According to Damasceno et al. [22,23], sediment grain size and hydrodynamics play critical roles in contaminant distribution across Sepetiba Bay. Their findings highlight those coarse sediments with low organic content—characteristic of the Marambaia sector—limit the adsorption of trace metals, in contrast to the finer, organic-rich sediments of the inner bay where higher contamination levels were observed. This corroborates the textural and mineralogical observations by Rodrigues et al. [9], who noted that despite the reduction in industrial emissions, the inner areas retained higher levels of Cd and Zn due to sediment characteristics favoring metal binding, while more dynamic and sandy regions like Marambaia displayed lower retention potential.
Besides organic carbon content and grain size, mineralogical composition also plays a crucial role in determining the reactivity of sediment surfaces and their capacity to retain trace metals [57]. The predominance of quartz in the sediments from GUA and MAR, as revealed by XRD analyses (Table 3), indicates a sediment type with low reactivity and low capacity for adsorption of metals, which partially explains lower trace metal concentrations in the area. At the same time, biotite, goethite, anorthite, chloritoid, and magnetite, while present in smaller quantities, may provide some minor capacity for metal binding and retention in the area. In contrast, sediments from EG and CG are enriched in clay minerals such as kaolinite and mica (e.g., biotite), and in weathering products like goethite and magnetite, which are known to offer reactive surface sites for adsorption and complexation. These minerals possess layered or porous structures with high surface area and active functional groups, enabling them to retain heavy metals (e.g., Zn2+, Pb2+, Cd2+) through ion exchange and surface complexation mechanisms [58,59]. The PCA results from EG (Figure 8) show positive correlations between Al, Fe, Mn, Cd, and Zn. According to Miranda et al. [60], under estuarine conditions, Cd and Zn have the highest affinity for Fe and Al oxides, respectively, which suggests that these metals can be retained by such minerals [61]. Indeed, the predominance of the Al oxide kaolinite in samples from EG and CG is revealed by XRD analyses.
The presence of aragonite in CG is also relevant since it holds the potential to adsorb a certain amount of trace metals from aqueous solution, contributing to reduced mobility of trace metals in the inner part of the bay. Finally, the presence of pyrite in all samples from EG is noteworthy, since it can release previously retained metals into the surrounding pore waters and water column through oxidative processes under certain environmental conditions. The presence of reactive surface areas for adsorption and complexation of trace metals in the area, further promoting their retention, is corroborated by relatively high concentrations of elements associated with clay minerals (Al, Fe, Ca, K, and Mg), feldspars (i.e., anorthite) and micas (i.e., biotite) (Ca, K, and Mg).
At CG, mobilization of trace metals as a consequence of sediment disturbance events can take place. This can be explained by an enhancement of Al, Fe, and Mn contents in a recent layer of this core, while Cd and Zn concentrations decrease concomitantly (Figure 2). Fe and Mn are redox-sensitive metals, occurring as solid oxides in well-oxygenated environments, while in sediments depleted in oxygen these two metals are found in dissolved form in the pore water [62,63,64]. According to Castelo et al. [49], frequent changes in sedimentary conditions due to disturbances can result in a transient redox boundary affecting the distribution of redox-sensitive metals by inducing alternating cycles of scavenging and mobilization of metals. Cd and Zn are relatively more soluble than other metals, which means that they do not tend to form strong bonds with solid particles compared to other metals [65,66,67]. Therefore, Cd and Zn appear less prone than other trace metals to compete for sorption sites and tend to attach to less competitive binding positions present on the mineral surfaces [60]. Finally, Al showed a significantly positive correlation (Spearman, Figure S1) with Ni in all cores (GUA: r2 = 0.62; EG: r2 = 0.97; CG: r2 = 0.79, p < 0.05 for all), except for MAR (r2 = −0.31), suggesting the presence of Ni derived from parent material associated with fine sediments.

4.2. Historical Perspective on Trace Metal Fluxes and Inventories

Elemental fluxes and inventories show the accumulation and/or depletion of the elements over time. For MAR and GUA, trace metal fluxes are generally low, reflecting the relative distance from the main anthropogenic sources, as well as hydrodynamic behavior, mineralogy, and grain size profile. Differences between older layers and more recent ones are not clearly noticeable in these cores (see Table 5), even though a slight increase in trace metal fluxes occurred in the marine part of the bay after the 1960s, most probably as a consequence of earlier human alterations such as population increase and the establishment of the Ingá Cia.
On the other hand, high fluxes of metals occurred in the inner part of the bay. EG showed increasing fluxes of all five trace metals, mostly Cd (8 × 10⁻⁵ to 0.4 g m−2 y−1) and Zn (4.0 to 60.9 g m−2 y−1). Trace metal enhancements of the same order are observed in CG, which can be explained by its proximity to Madeira Island and its sheltered position. Barcellos and Lacerda [16] reported an increase of 1.6 tons y−1 of Cd to Sepetiba Bay, which has 447 km2 and a relatively low dilution capacity [16].
The inputs of Cd and Zn into Sepetiba Bay in the last century can be largely attributed to wastes from the Ingá Cia, while Cu and Pb are related to this point source to a lesser extent [12,28]. Significant increases in trace metals concentrations from the 1960s were also reported by Silva et al. [8], Araújo et al. [10], Gomes et al. [13], Molisani et al. [28], Patchineelam et al. [37] and Marques et al. [38]. All these authors attributed these findings to the beginning of the Ingá Cia activities. Araújo et al. [10], by assessing Zn isotopes in sediments from Sepetiba Bay, found peaks of anthropogenic waste pile signature in cores from the São Francisco Channel mouth (estuarine part of Guandu River), in the inner part of the bay, and the Marambaia Bay, at Marambaia Barrier Island Area.
In the late 1970s, trace metal fluxes continued to increase due to the construction of Itaguaí Harbor facilities, dredging of the navigation channel, and construction of docking berths (Figure 3). Additionally, large amounts of sediments from in and around Madeira Island were also mobilized due to dredging operations for deepening and construction of channels. The remobilization of sediments containing high amounts of trace metals could contribute to the spreading of sediments enriched with these elements further south to the mouth and Marambaia Barrier Island area [8,9,33,39].
Still, decreasing patterns towards the surface occur for all elements since the 2000’s, especially for Cd (Figure 2). This can be a consequence of sediment resuspension and mobilization to other regions of the bay and to exchangeable forms (mobile phases). Monte et al. [18] observed Cd and Zn mobilization towards weakly bound fractions after resuspension experiments with sediments from SEC’s mouth (Figure 1). More specifically, the lowering in Cd, Pb, and Zn fluxes over the years (Figure 3), can be attributed to recent sediment mobilization due to the ThyssenKrup/CSA construction, today Ternium, and dredging activities nearby to the sampling station area, and to remediation actions at Madeira Island to treat wastes from the Ingá Cia [68]. Similarly, Rodrigues et al. [9] observed a decrease in Cd and Zn concentrations over the last two decades of almost one order of magnitude.
The noticeable increases in Cu and Ni fluxes and inventories in different areas of the bay (Figure 3 and Figure 4) are alert to the accentuation of recent anthropogenic sources of trace metals in the system. Despite lower concentrations of Ni (Figure 2 and Figure S1) and its association with parent material, an enhancement is observed throughout the years (Figure 2 and Figure 3). Regarding Cu, these increases can be attributed to various sources: residues from boat maintenance where antifouling paint is scraped from the hulls, disposal sites of contaminated dredged sediments, and industrial wastes from point and non-point sources. According to NORMAN 23/DCP [69], the dumping of waste comprising anti-fouling agents at sea is prohibited. These residues (barnacles and paint residues) must be collected at ports and shipyards. In semi-enclosed waters, Cu is readily leached from the hulls of resident and visiting ships and, after oxidation, Cu2+ ions can absorb suspended particles which may settle on bottom sediment [70]. Paint fragments and dust generated during boat maintenance can be also a direct source of particulate residual contamination in such settling [70].

4.3. Evaluation of Priority Metals and Areas of Concern with Results of Pollution Indexes

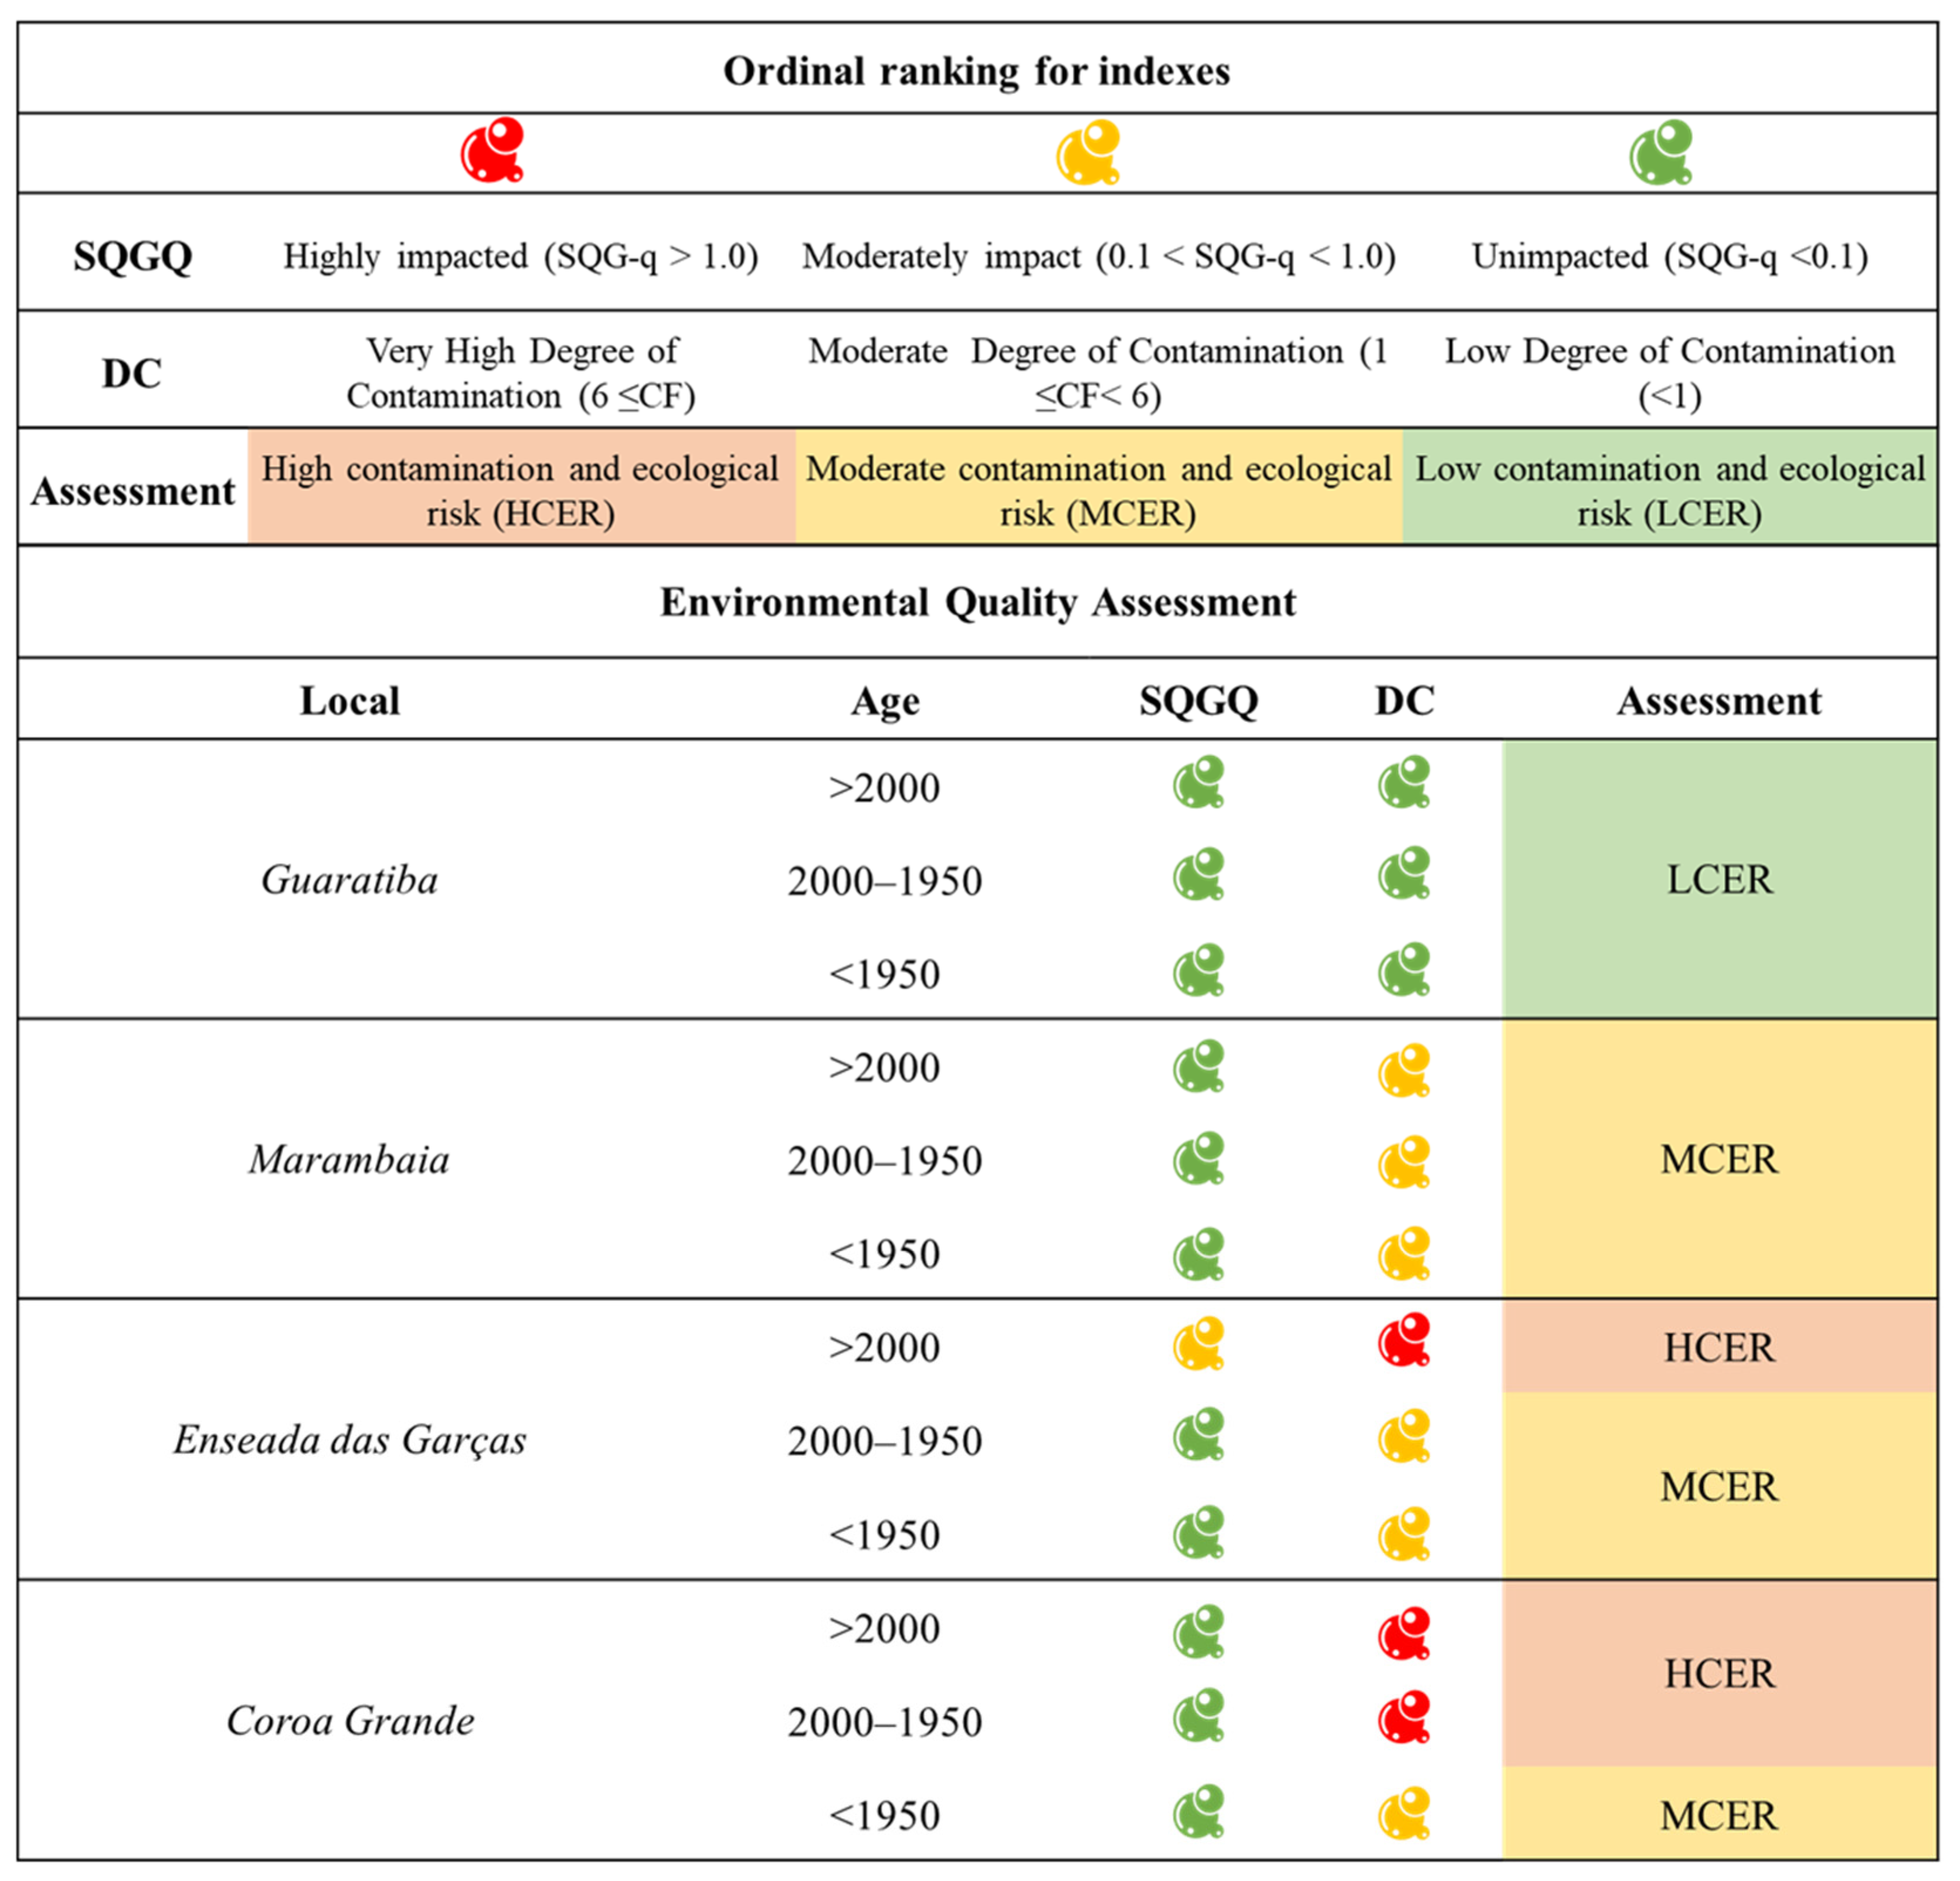
In general, pollution indexes reveal that trace metal contents in the Marambaia Barrier Island area present a low to moderate risk for the environment (Figure 9 and Figure 10). Generally presenting lower contamination levels compared to the inner area but is not without concern. Recent layers (10 cm > 2000s) show moderate contamination according to enrichment factors for Cu, Ni, Pb, and Zn (Figure 9). The indexes of multiple elements for MAR indicate an environment under “moderate contamination and ecological risk” of impact, as revealed by SGQGs and DC values (Figure 10).
These findings resonate with those from Castelo et al. [33,56] and Patchineelan et al. [37], who stated that the Marambaia Barrier Island environment has been under anthropogenic stress since the 1960’s. Along with an increase in trace metal concentrations, fines, and organic matter contents, Castelo et al. [33] evaluated ecological health using foraminiferal diversity. They concluded that ecological indicators pointed to deteriorating environmental health. Authors argue that the Marambaia Bay at the Barrier Island evolved from “moderately polluted” to “heavily polluted” between 1975 and 2015.
The inner part of the bay, especially in the EG, exhibits significant contamination and ecological risk, particularly in recent layers (Figure 9 and Figure 10). The sediments in the inner area were in the range of “high contamination and ecological risk” for Cd and “moderate contamination and ecological risk” for Zn. Regarding multi-elemental indexes both EG and CG were classified as “high contaminated” and “under ecological risk” (Figure 10). Cd and Zn exhibit similar patterns of enhancement from the 1960s in all cores (Figure 2) and presented strong correlations for all sites. The inputs of Cd and Zn into Sepetiba Bay in the last century are largely attributed to wastes of the Ingá Cia., which closed its activities in 1998, highlighting the long-lasting impacts of the Cd and Zn legacy contamination in the area. Araújo et al. [10] also observed higher pollution indexes (EFs) in the inner part of the bay, near SFC Delta, and, mostly, at the SEC mouth. Lower EFs were observed by the authors at MAR. Castelo et al. [33,56] and Silva et al. [8] results presented higher EFs for Cd in the inner part of the bay, but also near the Marambaia Barrier Island.
According to indexes EF and CF, Cd appears as the metal of most concern in Sepetiba Bay. Cd is classified as a ‘Priority Hazardous Substance’ under the European Union’s Water Framework Directive (2000/60/EC) due to its toxicity, bioaccumulation, and persistence in the environment, being one of the mining-related contaminants of regulatory concern.
Finally, Cu contamination has notably increased in the bay in recent years (Figure 3), and CF values indicate moderate contamination levels in recent layers from EG and CG (Figure 6) and copper EFs for GUA. This suggests that Cu is a priority contaminant of concern in the bay, especially in these areas. Its presence can be attributed to various points and diffuse sources, which hinders environmental management measures, especially regarding source control. This, associated with the temporal tendencies, emphasizes the need for continued monitoring and management efforts to mitigate the impact of this contaminant on the bay’s ecosystem.

5. Conclusions

This study provides a comprehensive understanding of the spatial distribution and geochemical dynamics governing trace metals within the sediments of Sepetiba Bay. The inner reaches of the bay persist as focal points for the accumulation of trace metals, a phenomenon driven by the confluence of reactive mineral surfaces and proximity to major anthropogenic pollution sources in the northeastern bay region. Our findings draw attention to the Marambaia Barrier Island area, which exhibits a recent trend of increasing trace metal concentrations while demonstrating a relatively diminished physical and chemical capacity to mediate the availability of contaminants from surrounding waters. The legacy of contamination, predominantly stemming from sediments enriched with Cd and Zn from the former Ingá Cia industrial operations, persists as an ecological challenge in this coastal ecosystem. Furthermore, there is an emerging concern in the form of heightened Cu concentrations, likely originating from diverse diffuse and point sources. This underscores the need for sustained monitoring and strategic interventions. Additionally, special attention must be given to recent episodes of sediment remobilization. While surface-layer trace metal concentrations may exhibit declines, there is a concurrent risk of contaminants being released into the water column, augmenting their availability and toxicity.

Supplementary Materials

The following supporting information can be downloaded at: https://www.mdpi.com/article/10.3390/jmse13061033/s1, (1) Word File contains—Table S1: Detection limits (DL), certified material concentrations (mg kg−1) in ICP-OES/MS in the 3050B extractions. Table S2: Means, minimum, maximum, and standard deviation for major and trace elements (mg kg−1), total organic carbon (%), total phosphorous (mg kg−1), and grain size (%) (sand, silt, and clay); Table S3: Principal component analysis results for each site. Eigenvalues of correlation matrix, related statistics, and factor coordinates of the variables, based on correlations. Figure S1. Correlation between aluminum and metals (Cd, Cu, Ni, Pb, and Zn) content on all sediment analyzed from the cores sampled at the inner area (Enseada das Garças and Coroa Grande) and near Marambaia Barrier Island (Maramabaia and Guaratiba); (2) Excel file contains raw data.

Author Contributions

S.K.R.: Conceptualization, Data curation, Formal analysis, Funding acquisition, Investigation, Methodology, Writing—original draft. W.T.V.M.: Conceptualization, Writing—original draft, Funding acquisition, Supervision. J.B.: Data Curation, Writing—original draft. S.B.V.: Supervision, Funding Acquisition, Writing—original Draft. All authors have read and agreed to the published version of the manuscript.

Funding

Dr. Sarah K. Rodrigues is provided by Fundação Carlos Chagas Filho de Amparo à Pesquisa do Estado do Rio de Janeiro, FAPERJ (project processes: SEI-260003/000283/2022) Brazil and received financial support from the Brazilian Federal Agency for Support and Evaluation of Graduate Education—CAPES (process: PDSE—99999.007403/2015-01). Brazilian Council for Scientific and Technological Development (CNPq) is acknowledged for Grant 31029/2015-0 to the last author.

Data Availability Statement

Additional data that support the findings of this study are available from the corresponding author upon reasonable request.

Conflicts of Interest

The authors declare no conflicts of interest. The funders had no role in the design of the study; in the collection, analyses, or interpretation of data; in the writing of the manuscript; or in the decision to publish the results.

References

  1. Koiter, A.; Owens, P.; Petticrew, E.; Lobb, D. The behavioural characteristics of sediment properties and their implications for sediment fingerprinting as an approach for identifying sediment sources in river basins. Earth-Sci. Rev. 2013, 125, 24–42. [Google Scholar] [CrossRef]
  2. Cordeiro, R.C.; dos Santos, D.D.; Santelli, R.E., Jr.; Figueiredo, A.G.; Moreira, L.S.; Machado, W.T.V.; Meniconi, M.F.G. Bulk, isotopic, petrographic organic matter and mineral distribution as proxies of environmental process in Guanabara Bay, SE, Brazil. Geo-Mar. Lett. 2021, 41, 30. [Google Scholar] [CrossRef]
  3. Cordeiro, R.; Monteiro, F.; Santelli, R.; Moreira, L.; Figueiredo, A.; Bidone, E.; Pereira, R.; Anjos, L.; Meniconi, M. Environmental and anthropic variabilities at Guanabara Bay (Brazil): A comparative perspective of metal depositions in different time scales during the last 5500 yrs. Chemosphere 2021, 267, 128895. [Google Scholar] [CrossRef]
  4. Cozzoli, F.; Smolders, S.; Eelkema, M.; Ysebaert, T.; Escaravage, V.; Temmerman, S.; Meire, P.; Herman, P.M.; Bouma, T.J. A modeling approach to assess coastal management effects on benthic habitat quality: A case study on coastal defense and navigability. Estuar. Coast. Shelf Sci. 2017, 184, 67–82. [Google Scholar] [CrossRef]
  5. Huang, Y.; Jin, P. Impact of human interventions on coastal and marine geological hazards: A review. Bull. Eng. Geol. Environ. 2018, 77, 1081–1090. [Google Scholar] [CrossRef]
  6. López, P.; Navarro, E.; Marcé, R.; Ordoñez, J.; Caputo, L.; Armengol, J. Elemental ratios in sediments as indicators of ecological processes in Spanish reservoirs. Limnetica 2006, 25, 499–512. [Google Scholar] [CrossRef]
  7. Vieira, C.D.; Oliveira, D.F.C.; Frota, M.N.; Viana, C.A.S.; Gonçalves, R.A.; Godoy, J.M.O. Siltation Process and Metals Sediment Profile in a Hydroelectric Power Plant Reservoir Located in the Brazilian Most Industrialized Region, Paraíba Do Sul River Basin, Southeastern Brazil. Environ. Erath Sci. 2022, 81, 523. [Google Scholar] [CrossRef]
  8. da Silva, L.C.; Martins, M.V.A.; Castelo, W.F.L.; Saibro, M.B.; Rangel, D.; Pereira, E.; Bergamaschi, S.; Sousa, S.H.M.; Varela, J.; Laut, L.; et al. Trace metals enrichment and potential ecological risk in sediments of the Sepetiba Bay (Rio de Janeiro, SE Brazil). Mar. Pollut. Bull. 2022, 177, 113485. [Google Scholar] [CrossRef] [PubMed]
  9. Rodrigues, S.K.; Machado, W.; Guerra, J.V.; Geraldes, M.; Morales, S.; Vinzón, S.B. Changes in Cd and Zn distribution in sediments after closure of an electroplating industry, Sepetiba bay, Brazil. Mar. Pollut. Bull. 2020, 161, 111758. [Google Scholar] [CrossRef]
  10. Araújo, D.F.; Peres, L.G.; Yepez, S.; Mulholland, D.S.; Machado, W.; Tonhá, M.; Garnier, J. Assessing man-induced environmental changes in the Sepetiba Bay (Southeastern Brazil) with geochemical and satellite data. Comptes Rendus Geosci. 2017, 349, 290–298. [Google Scholar] [CrossRef]
  11. Araújo, D.; Machado, W.; Weiss, D.; Mulholland, D.S.; Boaventura, G.R.; Viers, J.; Garnier, J.; Dantas, E.L.; Babinski, M. A critical examination of the possible application of zinc stable isotope ratios in bivalve mollusks and suspended particulate matter to trace zinc pollution in a tropical estuary. Environ. Pollut. 2017, 226, 41–47. [Google Scholar] [CrossRef] [PubMed]
  12. Rodrigues, S.K.; Abessa, D.M.; Rodrigues, A.P.d.C.; Soares-Gomes, A.; Freitas, C.B.; Santelli, R.E.; Freire, A.S.; Machado, W. Sediment quality in a metal-contaminated tropical bay assessed with a multiple lines of evidence approach. Environ. Pollut. 2017, 228, 265–276. [Google Scholar] [CrossRef] [PubMed]
  13. Gomes, F.d.C.; Godoy, J.M.; Godoy, M.L.D.; de Carvalho, Z.L.; Lopes, R.T.; Sanchez-Cabeza, J.A.; de Lacerda, L.D.; Wasserman, J.C. Metal concentrations, fluxes, inventories and chronologies in sediments from Sepetiba and Ribeira Bays: A comparative study. Mar. Pollut. Bull. 2009, 59, 123–133. [Google Scholar] [CrossRef]
  14. Lacerda, L.D.; Marins, R.V.; Barcellos, C.; Molisani, M.M. Chapter 21: Sepetiba bay: A case study of the environmental geochemistry of heavy metals in a subtropical coastal lagoon. In Environmental Geochemistry in Tropical and Subtropical Environments; Lacerda, L.D., Santelli, R.E., Duursma, E.K., Abrao, J.J., Eds.; Springer: Berlin/Heidelberg, Germany, 2004; pp. 293–318. ISBN 978-3-662-07060-4. [Google Scholar]
  15. Lacerda, L.; Molisani, M. Three decades of Cd and Zn contamination in Sepetiba Bay, SE Brazil: Evidence from the mangrove oyster Crassostraea rhizophorae. Mar. Pollut. Bull. 2003, 52, 969–987. [Google Scholar] [CrossRef]
  16. Barcellos, C.; Lacerda, L.D. Cadmium and zinc source assessment in the Sepetiba Bay and basin region. Environ. Monit. Assess. 1994, 29, 183–199. [Google Scholar] [CrossRef]
  17. Lacerda, L.D.; Pfeiffer, W.C.; Fiszman, M. Heavy metals distribution, availability and fate in the Sepetiba Bay (SE-Brazil). Sci. Total Environ. 1987, 65, 163–173. [Google Scholar] [CrossRef]
  18. Monte, C.N.; Rodrigues, A.P.C.; Cordeiro, R.C.; Freire, A.S.; Santelli, R.E.; Machado, W. Changes in Cd and Zn bioavailability upon an experimental resuspension of highly contaminated coastal sediments from a tropical estuary. Sustain. Water Resour. Manag. 2015, 1, 335–342. [Google Scholar] [CrossRef]
  19. Ribeiro, A.P.; Figueiredo, A.M.G.; Dos Santos, J.O.; Dantas, E.; Cotrim, M.E.B.; Figueira, R.C.L.; Filho, E.V.S.; Wasserman, J.C. Combined SEM/AVS and attenuation of concentration models for the assessment of bioavailability and mobility of metals in sediments of Sepetiba Bay (SE Brazil). Mar. Pollut. Bull. 2013, 68, 55–63. [Google Scholar] [CrossRef]
  20. Nascimento, J.R.; Bidone, E.D.; Rolão-Araripe, D.; Keunecke, K.A.; Sabadini-Santos, E. Trace metal distribution in white shrimp (Litopenaeus schmitti) tissues from a Brazilian coastal area. Environ. Earth Sci. 2016, 75, 990. [Google Scholar] [CrossRef]
  21. Damasceno, F.L.; Martins, M.V.A.; Santos, L.G.C.; Filho, J.G.M.; Hohenegger, J.; Reis, G.A.; Diaz, R.d.S.; Rebouças, R.C.; Senez-Mello, T.M.; Arruda, S.; et al. Assessment of potential ecological risk by metals in Ilha Grande Bay (Southeast Brazil). Mar. Pollut. Bull. 2025, 212, 117612. [Google Scholar] [CrossRef]
  22. Damasceno, F.L.; Martins, M.V.A.; Frontalini, F.; Pawlowski, J.; Cermakova, K.; Angeles, I.B.; Santos, L.G.C.; Filho, J.G.M.; Francescangeli, F.; Senez-Mello, T.M.; et al. Assessment of the ecological quality status of the Sepetiba Bay (SE Brazil): When metabarcoding meets morphology on foraminifera. Mar. Environ. Res. 2024, 195, 106340. [Google Scholar] [CrossRef] [PubMed]
  23. Damasceno, F.L.; Martins, M.V.A.; Senez-Mello, T.M.; Santos, L.G.C.; Filho, J.G.M.; Pereira, E.; Figueira, R.; Nascimento, C.A.D.; Arruda, S.; Castelo, W.F.L.; et al. Potential ecological risk by metals in Sepetiba bay (SE Brazil): Exporting metals to the oceanic region. J. South. Am. Earth Sci. 2024, 141, 104934. [Google Scholar] [CrossRef]
  24. Saibro, M.B.; Martins, M.V.A.; Guerra, J.V.; Figueira, R.C.L.; Simões, F.d.C.F.; Dadalto, T.P.; Trevizani, T.H.; Ferreira, P.A.d.L.; Silva, C.G.; Dos Reis, A.T.; et al. Transfer of industrial contaminants from the inner to the outer region of Sepetiba Bay (SE Brazil) by dredge spoil dumping activities: A temporal record. Environ. Earth Sci. 2023, 82, 560. [Google Scholar] [CrossRef]
  25. Jeong, H.; Araújo, D.F.; Garnier, J.; Mulholland, D.; Machado, W.; Cunha, B.; Ponzevera, E. Copper and lead isotope records from an electroplating activity in sediments and biota from Sepetiba Bay (southeastern Brazil). Mar. Pollut. Bull. 2023, 190, 114848. [Google Scholar] [CrossRef] [PubMed]
  26. Tonhá, M.S.; Araújo, D.F.; Araújo, R.; Cunha, B.C.; Machado, W.; Portela, J.F.; Souza, J.P.; Carvalho, H.K.; Dantas, E.L.; Roig, H.L.; et al. Trace metal dynamics in an industrialized Brazilian river: A combined application of Zn isotopes, geochemical partitioning, and multivariate statistics. J. Environ. Sci. 2021, 101, 313–325. [Google Scholar] [CrossRef]
  27. Abreu, I.M.; Cordeiro, R.C.; Soares-Gomes, A.; Abessa, D.M.S.; Maranho, L.A.; Santelli, R.E. Ecological risk evaluation of sediment metals in a tropical Euthrophic Bay, Guanabara Bay, Southeast Atlantic. Mar. Pollut. Bull. 2016, 109, 435–445. [Google Scholar] [CrossRef]
  28. Marins, R.V.; Machado, W.; Paraquetti, H.H.M.; Bidone, E.D.; Lacerda, L.D.; Molisani, M.M. Environmental changes in Sepetiba Bay, SE Brazil. Reg. Environ. Chang. 2004, 4, 17–27. [Google Scholar] [CrossRef]
  29. Roncarati, H.; Carelli, S.G. Considerações sobre estado da arte dos processos geológicos cenozóicos atuantes na baía de Sepetiba. In Baía de Sepetiba: Estado da Arte; Rodrigues, M.A.C., Pereira, S.D., dos Santos, S.B., Eds.; FAPERJ: Rio de Janeiro, Brazil, 2012; pp. 12–36. [Google Scholar]
  30. Barcellos, C.; de Lacerda, L.D.; Ceradini, S. Sediment origin and budget in Sepetiba Bay (Brazil)—An approach based on multielemental analysis. Environ. Geol. 1997, 32, 203–209. [Google Scholar] [CrossRef]
  31. de Magalhães, V.F.; Pfeiffer, W.C. Arsenic concentration in sediments near a metallurgical plant (Sepetiba Bay, Rio de Janeiro, Brazil). J. Geochem. Explor. 1995, 52, 175–181. [Google Scholar] [CrossRef]
  32. CEIVAP—Committee for the Integration of the Paraíba do Sul River Basin. Environmental Impact Report—EIA for the Guandu Hydroelectric Project. Available online: https://www.ceivap.org.br/guandu/eia/CD%20FINAL/RIMA/01_Rima.pdf (accessed on 20 May 2025).
  33. Castelo, W.F.L.; Martins, M.V.A.; Martínez-Colón, M.; Guerra, J.V.; Dadalto, T.P.; Terroso, D.; Soares, M.F.; Frontalini, F.; Duleba, W.; Socorro, O.A.A.; et al. Disentangling natural vs. anthropogenic induced environmental variability during the Holocene: Marambaia Cove, SW sector of the Sepetiba Bay (SE Brazil). Environ. Sci. Pollut. Res. 2021, 28, 22612–22640. [Google Scholar] [CrossRef]
  34. Pinto, A.F.S.; Martins, M.V.A.; da Fonseca, M.C.M.; Rodrigues, M.A.C.; Nogueira, L.; Laut, L.L.M.; Pereira, E. Late holocene evolution of the northeast intertidal region of Sepetiba bay, Rio de Janeiro, Brazil. J. Sediment. Environ. 2016, 1, 50–80. [Google Scholar] [CrossRef]
  35. Pinto, A.F.S.; Martins, M.V.A.; da Fonseca, M.C.M.; Pereira, E.; Terroso, D.L.; Rocha, F.; Rodrigues, M.A.D.C. Holocene closure of a barrier beach in sepetiba bay and its environmental impact (Rio de Janeiro, Brazil). J. Sediment. Environ. 2017, 2, 50–80. [Google Scholar] [CrossRef]
  36. Borges, H.V.; Nittrouer, C.A. Sediment accumulation in Sepetiba Bay (Brazil) during the Holocene: A Reflex of the human influence. J. Sediment. Environ. 2016, 1, 96–112. [Google Scholar] [CrossRef]
  37. Patchineelam, S.M.; Sanders, C.J.; Smoak, J.M.; Zem, R.C.; Oliveira, G.; Patchineelam, S.R. A Historical Evaluation of Anthropogenic Impact in Coastal Ecosystems by Geochemical Signatures. J. Braz. Chem. Soc. 2010, 22, 120–125. [Google Scholar] [CrossRef]
  38. Marques, A.N., Jr.; Monna, F.; Silva Filho, E.V.; Fernex, F.E.; Simões Filho, F.L. Apparent discrepancy in contamination history of a sub-tropical estuary evaluated through 210Pb profile and chronostratigraphical markers. Mar. Pollut. Bull. 2006, 52, 532–539. [Google Scholar] [CrossRef] [PubMed]
  39. Morales, S.J.D.; Guerra, J.V.; Nunes, M.A.D.S.; de Souza, A.M.; Geraldes, M.C. Evaluation of the environmental state of the western sector of Sepetiba Bay (Se Brazil): Trace metal contamination. J. Sediment. Environ. 2019, 4, 174–188. [Google Scholar] [CrossRef]
  40. Folk, R.L.; Ward, W.C. Brazos river bar: A study of significante of grain size parameters. J. Sediment. Pet. 1957, 27, 3–26. [Google Scholar] [CrossRef]
  41. Camargo, M.G. SysGran: Um sistema de código aberto para análises granulométricas do sedimento. Rev. Bras. Geociências 2006, 36, 371–378. [Google Scholar] [CrossRef]
  42. Aspila, K.I.; Agemian, H.; Chau, A.S.Y. A semi-automated method for the determination of inorganic, organic and total phosphate in sediments. Analyst 1976, 101, 187–197. [Google Scholar] [CrossRef]
  43. Method 3050B: Acid Digestion of Sediments, Sludges and Soils. Revision 2; U.S. Environmental Protection Agency (EPA): Washington, DC, USA, 1996.
  44. Sutherland, R.A. Bed sediment-associated trace metals in an urban stream, Oahu, Hawaii. Environ. Geol. 2000, 39, 611–627. [Google Scholar] [CrossRef]
  45. Håkanson, L. An ecological risk index for aquatic pollution control. A sedimentological approach. Water Res. 1980, 14, 975–1001. [Google Scholar] [CrossRef]
  46. Fairey, R.; Long, E.R.; Roberts, C.A.; Anderson, B.S.; Phillips, B.M.; Hunt, J.W.; Puckett, H.R.; Wilson, C.J. An evaluation of methods for calculating mean Sediment Quality Guideline Quotients as indicators of contamination and acute toxicity to amphipods by chemical mixtures. Environ. Toxicol. Chem. 2001, 20, 2276–2286. [Google Scholar] [CrossRef] [PubMed]
  47. Barbieri, M. The importance of Enrichment Factor (EF) and Geoaccumulation Index (Igeo) to Evaluate the Soil Contamination. Geol. Geophys. 2016, volume 5, 1000237. [Google Scholar] [CrossRef]
  48. Abrahim, G.M.S.; Parker, R.J. Assessment of heavy metal enrichment factors and the degree of contamination in marine sediments from Tamaki Estuary, Auckland, New Zealand. Environ. Monit. Assess. 2007, 136, 227–238. [Google Scholar] [CrossRef]
  49. Uduma, A.U.; Jimoh, W.L.O. Aluminum as a Reference Element for the Elucidation of Pb Enrichment/Depletion in Selected Arable Soils of Nigeria. IOSR J. Eng. 2014, 4, 15–22. [Google Scholar]
  50. Wedepohl, K.H. The composition of the continental crust. Geochim. Cosmochim. Acta 1995, 59, 1217–1232. [Google Scholar] [CrossRef]
  51. CONAMA – National Council for the Environment. Resolution No. 454 of 2012. Establishes General Guidelines and Minimum Procedures for the Assessment of Material to Be Dredged in Brazilian Jurisdictional Waters, and Other Provisions. Official Gazette of the Federative Republic of Brazil, Brasília. Available online: https://conama.mma.gov.br/?option=com_sisconama&task=arquivo.download&id=667 (accessed on 12 April 2025).
  52. R Core Team. R: A Language and Environment for Statistical Computing; R Foundation for Statistical Computing: Vienna, Austria, 2021; Available online: https://www.R-project.org/ (accessed on 30 September 2024).
  53. Posit team. RStudio: Integrated Development Environment for R. Posit Software, version 2024.04, PBC: Boston, MA, USA. 2023. Available online: https://www.posit.co/ (accessed on 30 September 2024).
  54. Moreira, L.B.; Choueri, R.B.; Abessa, D.M.d.S. A consensus-based approach for the development of Site-specific Sediment Quality Values in an SW Atlantic region (São Paulo State, Brazil). J. Hazard. Mater. Adv. 2022, 7, 100142. [Google Scholar] [CrossRef]
  55. Aguiar, V.M.; Bastos, A.C.; Quaresma, V.d.S.; Orlando, M.T.D.; Vedoato, F.; Cavichini, A.S.; Neto, J.A.B. Trace metals distribution along sediment profiles from the Doce River Continental Shelf (DRCS) 3 years after the biggest environmental disaster in Brazil, the collapse of the Fundão Dam. Reg. Stud. Mar. Sci. 2023, 63, 103001. [Google Scholar] [CrossRef]
  56. Castelo, W.F.L.; Martins, M.V.A.; Ferreira, P.A.d.L.; Figueira, R.; da Costa, C.F.; da Fonseca, L.B.; Bergamashi, S.; Pereira, E.; Terroso, D.; Pinto, A.F.S.; et al. Long-term eutrophication and contamination of the central area of Sepetiba Bay (SW Brazil). Environ. Monit. Assess. 2021, 193, 100. [Google Scholar] [CrossRef]
  57. Chen, J.; Gaillardet, J.; Louvat, P.; Huon, S. Zn isotopes in the suspended load of the Seine River, France: Isotopic variations and source determination. Geochim. Cosmochim. Acta 2009, 73, 4060–4076. [Google Scholar] [CrossRef]
  58. Kenworthy, J.B.; Forstner, U.; Wittman, G.T.W. Metal Pollution in the Aquatic Environment. J. Ecol. 1981, 68, 700. [Google Scholar] [CrossRef]
  59. Sposito, G. The Chemistry of Soils; Oxford University Press: New York, NY, USA, 1989. [Google Scholar]
  60. Miranda, L.S.; Wijesiri, B.; Ayoko, G.A.; Egodawatta, P.; Goonetilleke, A. Water-sediment interactions and mobility of heavy metals in aquatic environments. Water Res. 2021, 202, 117386. [Google Scholar] [CrossRef] [PubMed]
  61. Aşçı, Y.; Nurbaş, M.; Açıkel, Y.S. Investigation of sorption/desorption equilibria of heavy metal ions on/from quartz using rhamnolipid biosurfactant. J. Environ. Manag. 2010, 91, 724–731. [Google Scholar] [CrossRef]
  62. Monteiro, F.F.; Cordeiro, R.C.; Santelli, R.E.; Machado, W.; Evangelista, H.; Villar, L.S.; Viana, L.C.A.; Bidone, E.D. Sedimentary geochemical record of historical anthropogenic activities affecting Guanabara Bay (Brazil) environmental quality. Environ. Earth Sci. 2012, 65, 1661–1669. [Google Scholar] [CrossRef]
  63. Alvarez-Iglesias, P.; Rubio, B.; Vilas, F. Pollution in intertidal sediments of San Simon Bay (inner Ria de Vigo, NW of Spain). Total heavy metal concentration and speciation. Mar Pollut Bull 2003, 46, 491–521. [Google Scholar] [CrossRef]
  64. Laing, G.D.; Rinklebe, J.; Vandecasteele, B.; Meers, E.; Tack, F. Trace metal behaviour in estuarine and riverine floodplain soils and sediments: A review. Sci. Total. Environ. 2009, 407, 3972–3985. [Google Scholar] [CrossRef]
  65. Gao, X.; Chen, C.A. Heavy metal pollution status in surface sediments of the coastal Bohai Bay. Water Res. 2012, 46, 1901–1911. [Google Scholar] [CrossRef]
  66. Huo, S.; Xi, B.; Yu, X.; Su, J.; Zan, F.; Zhao, G. Application of equilibrium partitioning approach to derive sediment quality criteria for heavy metals in a shallow eutrophic lake, Lake Chaohu, China. Environ. Earth Sci. 2013, 69, 2275–2285. [Google Scholar] [CrossRef]
  67. Jayarathne, A.; Egodawatta, P.; Ayoko, G.A.; Goonetilleke, A. Assessment of ecological and human health risks of metals in urban road dust based on geochemical fractionation and potential bioavailability. Sci. Total. Environ. 2018, 635, 1609–1619. [Google Scholar] [CrossRef]
  68. Gonçalves, R.; Oliveira, D.; Rezende, C.E.; Almeida, P.; Lacerda, L.; da Gama, B.; Godoy, J.M. Spatial and temporal effects of decommissioning a zinc smelter on the sediment quality of an estuary system: Sepetiba bay, Rio de Janeiro, Brazil. J. Braz. Chem. Soc. 2020, 31, 683–693. [Google Scholar] [CrossRef]
  69. Brazilian Navy–Directorate of Ports and Coasts. NORMAM-23: Standards of the Maritime Authority for the Control of Antifouling Systems on Vessels; Brazilian Navy–Directorate of Ports and Coasts: 2007. Available online: https://www.marinha.mil.br/dpc/normas-autoridade-maritima-brasileira (accessed on 20 May 2025).
  70. Turner, A. Marine pollution from antifouling paint particles. Mar. Pollut. Bull. 2010, 60, 159–171. [Google Scholar] [CrossRef] [PubMed]
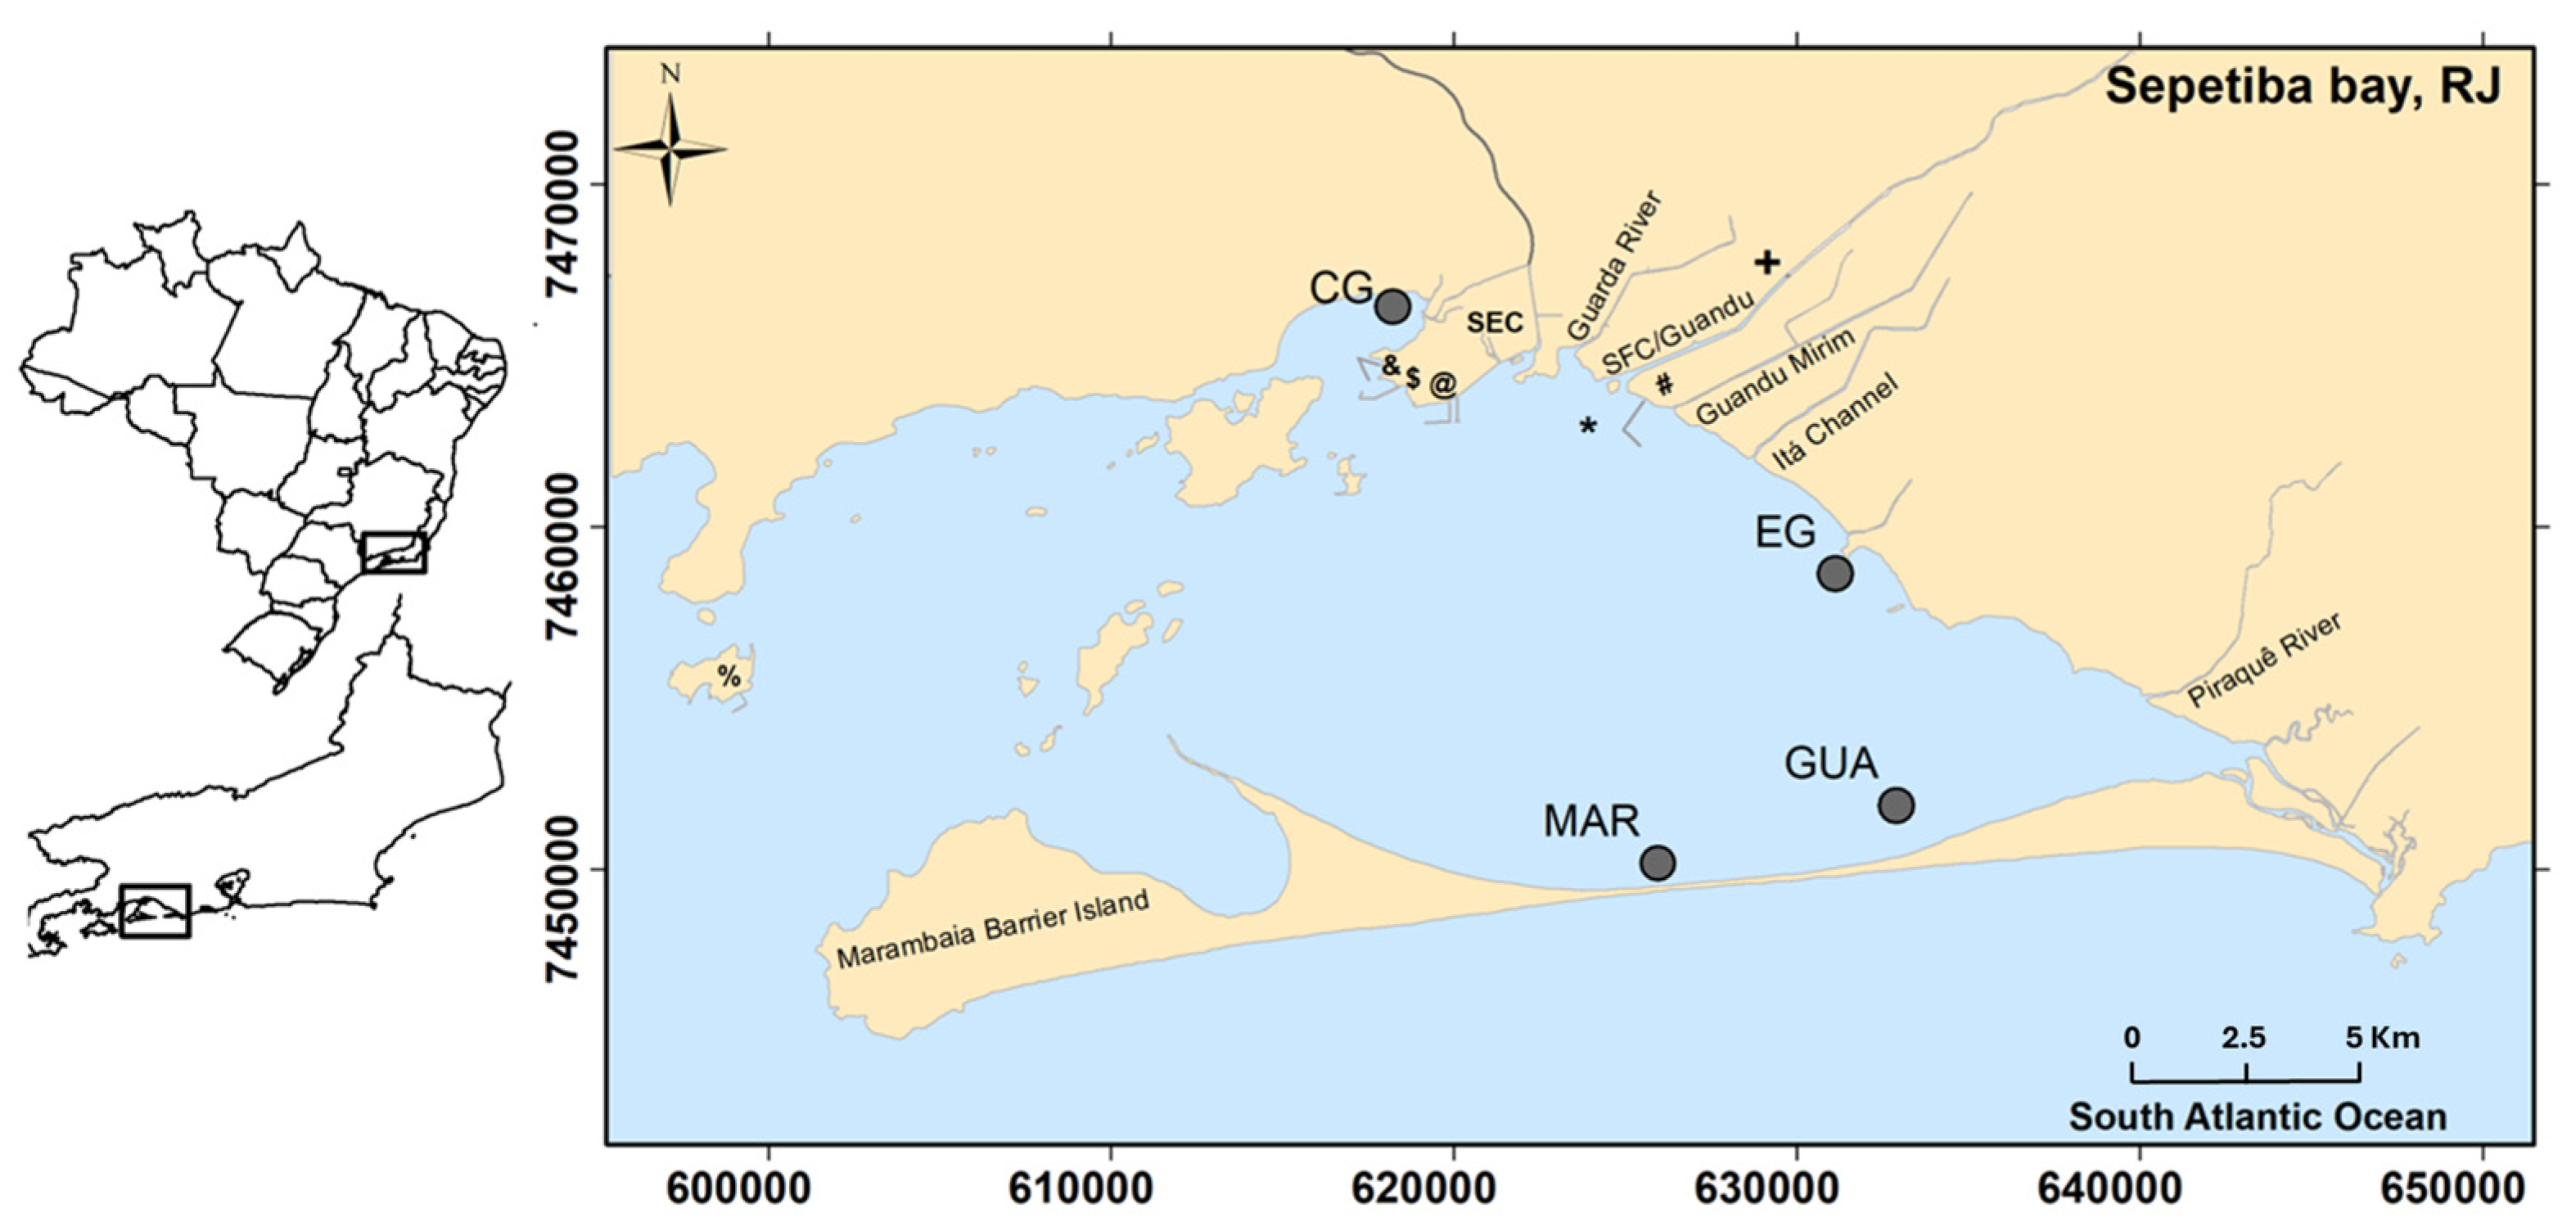
Figure 1. Sepetiba Bay location along the coast of SE Brazil, and sampling sites of the cores described in this study: GUA e MAR (Guaratiba: 80 cm and Marambaia: 95 cm) near to Marambaia Barrier Island area, EG (Enseada das Garças:175 cm) and CG (Coroa Grande:130 cm) in the inner part of the bay. SEC Abbreviations: SEC– Saco do Engenho Creek. Symbology: %—Vale SA. Port; &—Nuclear-powered Submarines Shipyard; $—Sudeste Port; @—Itaguaí Port; #—Ternium mooring benches; * Thermoeletric porwerships; + Santa Cruz Industrial District.
Jmse 13 01033 g001
Figure 2. Fines (<63 µm), Total Organic Carbon (TOC), Total Phosphorous (TP), trace and major metals in sediments from the inner part of the bay (Coroa Grande and Enseada das Garças) and the Marambaia barrier island (Guaratiba and Marambaia). The purple line shows recent events of human interventions such as Itaguaí main navigation channel deepening, channel dredging, and construction of mooring benches by the TKCSA (>2000); dark cyan line shows earlier human alterations such as the population increase, Ingá Cia. establishment and the diversion of the Paraíba do Sul-Guandú fluvial system (~1960–1950). The means, maximum, minimum, and standard deviation of the parameter can be found in the Supplementary Information (Table S2).
Jmse 13 01033 g002
Figure 3. Trace metal annual fluxes along time in the sediment cores. The purple line shows recent events of human interventions such as Itaguaí main navigation channel deepening, channel dredging, and construction of mooring benches by the TKCSA (>2000); dark cyan line shows earlier human alterations such as the population increase, Ingá Cia. establishment and the diversion of the Paraíba do Sul-Guandú fluvial system (~1960–1950).
Jmse 13 01033 g003
Figure 4. Excess metal inventories for Cd, Cu, Ni, Pb, and Zn from four different areas in Sepetiba Bay. Marambaia barrier island area (Guaratiba and Marambaia) and Inner area (Enseada das Garças and Coroa Grande).
Jmse 13 01033 g004
Figure 5. Concentration Factors (CFs) of five elements in sediments from the sampling sites (Guaratiba, Marambaia, Enseada das Garças, and Coroa Grande). Background values used for CF calculation were obtained from Gomes et al. [13]. Contamination factor classes are defined in Table 2. The green line represents a low degree of contamination (CF < 1), the yellow line indicates a significant degree of contamination (1 ≤ CF < 6), and the red line denotes a very high degree of contamination (CF ≥ 6).
Jmse 13 01033 g005
Figure 6. Contamination Factor and Enrichment factor of trace metals along the cores. The classification according to the three classes of each index can be seen in Table 2. The purple line shows recent events of human interventions such as Itaguaí main navigation channel deepening, channel dredging, and construction of mooring benches by the TKCSA (>2000); dark cyan line shows earlier human alterations such as the population increase, Ingá Cia. establishment and the diversion of the Paraíba do Sul-Guandú fluvial system (~1960–1950).
Jmse 13 01033 g006
Figure 7. Degree of Contamination (DC) and Sediment Quality Guideline Quotient (SQGQ) of trace metals along the cores. The classification according to the three classes of each index can be seen in Table 2. The purple line shows recent events of human interventions (>2000); dark cyan line shows earlier human alterations such as the population increase, Ingá Cia. Establishment and the diversion of the Paraíba do Sul-Guandú fluvial system (~1960–1950).
Jmse 13 01033 g007
Figure 8. Plot of the coordinate factors 1 and 2 of the Principal Component Analysis variables in each site (Enseada das Garças: green, Coroa Grande: blue, Marambaia: orange, and Guaratiba: dark yellow). The main controlling factors, eigenvalues, and correlations between the parameters can be found in the Supplementary Information (Online Resource 2).
Jmse 13 01033 g008
Figure 9. Assessment of Marambaia Barrier Island (GUA and MAR) and Inner area (EG and CG) of Sepetiba Bay based on indexes for each metal: EF and CF. The classification was based on mean values between the two sites of each area.
Jmse 13 01033 g009
Figure 10. Assessment according to an ordinal ranking of each site based on the indexes SQGQ and DC.
Jmse 13 01033 g010
Table 1. Sediment accumulation rates (SAR) estimated for Marambaia, Guaratiba, Enseada das Garças, and Coroa Grande are listed below, the SAR values were used for the estimation of metal fluxes and inventory trends in these sites.
Depth (cm)SAR (cm y−1)ReferencesEstimated Years
Marambaia—Guaratiba0–300.1[30]1970–1997
>300.4<1970
Enseada das Garças0–601.2[30]1970–1997
60–1750.49<1970
Coroa Grande0–16.50.8[32]1980–1995
>16.51.03<1980
Table 2. Classification used for indexes adapted from the literature: Enrichment Factor (EF; Sutherland [44]); Contamination Factor and Degree of Contamination (CF/DC; Hakanson et al. [45]); Sediment Quality Guidelines Quotient (SQGQ; Fairey et al. [46]).
IndexDegreeClassification
Enrichment FactorEF < 2Low enrichment;
2≤ EF < 20Significant enrichment;
EF > 20High enrichment;
Contamination Factor/DegreeCF/DC < 1Low Degree of Contamination
1 ≤ CF/DC < 6Significant Degree of Contamination
6 ≤ CF/DCVery High Degree of Contamination
Sediment Quality Guideline QuotientSQGQ < 0.1Unimpacted
0.1 < SQGQ < 1.0Significantly impacted
SQGQ > 1Highly impacted
Table 3. XRD results from selected layers from each core at the surface (GUA; MAR; EG; CG: 0–5 cm), middle (GUA:40–45 cm; MAR: 35–40 cm; EG: 75–80 cm; CG: 60–65 cm) and bottom (GUA: 90–95 cm; MAR: 80–85 cm; EG: 175–180 cm; CG: 130–135 cm) samples.
LocalSurfaceMiddleBottom
GuaratibaQuartz > GoethiteQuartz > GoethiteQuartz > left > Goethite > Biotite > Magnetite > Pyrite
MarambaiaQuartz > Biotite > MagnetiteQuartz > Chloritoid > Biotite > MagnetiteQuartz > Chloritoid
Enseada das GarçasKaolinite > Chloritoid > Quartz > Biotite > Pyrite > MagnetiteQuartz > Kaolinite > Chloritoid > Magnetite > PyriteKaolinite > Quartz > Chloritoid > Biotite > Magnetite > Pyrite
Coroa GrandeKaolinite > Quartz > Aragonite > Biotite > Gibbsite > PyriteQuartz > Nacrite > Gibbsite > Aragonite > Biotite > MagnetiteNacrite > Quartz > Aragonite > Gibbsite > Magnetite
Table 4. Minimum and maximum values of trace metals found in the cores and reported in the literature and national thresholds for each trace metal. All concentrations are in mg kg−1.
CdCuNiPbZnReference
MinimumMarambaia Barrier IslandND2--<500[37]
0.177.717.727.6[33,56]
0.012.494.117.6727.6[8]
Marambaia0.163.082.322.0912.6This study
GuaratibaND2.630.20.223.35This study
Enseada das GarçasND5.17.49.243.8This study
Guandú Channel Mouth0.348.098.322054[13]
0.412172257[8]
Coroa GrandeND2.91.83.220.9This study
<0.2---69–103[38]
Guanabara Bay (Brazil)0.353.438.95.139.2[3]
São Paulo State coast (Brazil)0.010.280.310.831.65[54]
Doce River Mouth (Brazil)-23.572.7624.51[55]
MaximumMarambaia Barrier Island0.35--~1600[37]
2.127.622.860.6433.7[33,56]
3.127.6122.873.53577.8[8]
Marambaia0.6714.846.256.5994.9This study
Guaratiba0.265.161.5428.92This study
Enseada das Garças2.418.812.220.4364.7This study
Guandú Channel Mouth4.942.527.155779[13]
4.93835771067[8]
Coroa Grande11610.812.6393.1This study
1.6---878[38]
Guanabara Bay (Brazil)1.335917.334.8179[3]
São Paulo State coast (Brazil)8.84167.244.2204.751077.33[54]
Doce River Mouth (Brazil)-44.9252.4143.4175.53[55]
ThreshouldsLevel 11.23420.946.7150[51]
Level 27.227051.6218410
Table 5. Recent, bottom fluxes (g m−2 y−1) and excess metal inventories (g m−2), for Cd, Cu, Ni, Pb, and Zn derived from cores from four different areas in Sepetiba Bay.
Guaratiba
Recent Bottom Excess
Cd8 × 10−20.0130.796
Cu0.1620.20862.386
Ni0.0170.04210.053
Pb0.0220.0865.992
Zn0.480.27249.941
Marambaia
Recent Bottom Excess
Cd0.0160.0157.164
Cu0.6120.277346.47
Ni0.2380.126150.22
Pb0.2170.17293.839
Zn1.9590.71976.327
Coroa Grande
Recent BottomExcess
Cd1 × 10−49 × 10−517.707
Cu1.9160.802215.078
Ni1.290.202290.864
Pb1.4520.92392.407
Zn22.1282.00113,078.959
Enseada das Garças
Recent Bottom Excess
Cd0.4038 × 10−552.647
Cu2.8380.577370.163
Ni1.3480.707113.652
Pb2.8260.786291.901
Zn60.8744.0175841.952
Disclaimer/Publisher’s Note: The statements, opinions and data contained in all publications are solely those of the individual author(s) and contributor(s) and not of MDPI and/or the editor(s). MDPI and/or the editor(s) disclaim responsibility for any injury to people or property resulting from any ideas, methods, instructions or products referred to in the content.