Article

Study on the Movement and Distribution Patterns of Sand Particles in a Vane-Type Multiphase Pump

Key Laboratory of Fluid and Power Machinery, Xihua University, Ministry of Education, Chengdu 610039, China
*
Author to whom correspondence should be addressed.
J. Mar. Sci. Eng. 2025, 13(6), 1034; https://doi.org/10.3390/jmse13061034 (registering DOI)
Submission received: 24 April 2025 / Revised: 19 May 2025 / Accepted: 21 May 2025 / Published: 24 May 2025
(This article belongs to the Section Ocean Engineering)

Abstract

:
In oilfield operations, produced fluids consist of complex mixtures including heavy oil, sand, and water. Variations in sand particle parameters and operational conditions can significantly impact the performance of multiphase pumps. To elucidate the movement patterns of sand particles within a vane-type multiphase pump, this study employs the Discrete Phase Model (DPM) to investigate the effects of different sand particle parameters and operational conditions on the internal flow characteristics. The study found that: sand particle diameter, flow rate, rotational speed, and oil content significantly influence the trajectories of the solid–liquid two-phase flow, the motion characteristics of sand particles, and the vortices in the liquid flow field. As sand particle diameter increases, their radial and axial momentum first rise and then decline. Both radial and axial momentum are positively correlated with sand concentration. An increase in flow rate, higher rotational speed, and lower oil content all lead to greater fluctuations in the radial momentum curve of sand particles inside the impeller. Larger sand particles are predominantly distributed near the inlet, while smaller particles are more concentrated at the outlet. Higher sand concentrations and non-spherical particles increase particle distribution within the flow passages, with the guide vane channels exhibiting the most pronounced accumulation—reaching a maximum concentration of 6260 kg/m3 due to elevated sand loading. Increasing flow rate, rotational speed, or oil content significantly reduces sand concentration in the flow channel, promoting more efficient particle transport. Conversely, lower inlet sand concentration, non-spherical particles, reduced flow rate, decreased rotational speed, and higher oil content all result in fewer large particles in the flow passage. The findings provide important guidance for improving the wear resistance of vane-type multiphase pumps.

1. Introduction

As a key equipment in modern oilfield closed gathering and transportation systems, the vane-type multiphase pump must meet multiple stringent requirements including high head capacity, excellent mixed transport performance, operational stability, and outstanding wear resistance. Among these, the wear resistance of the impeller is particularly crucial as it directly determines the pump’s service life. To improve the anti-wear performance of vane-type multiphase pump, comprehensive research should be conducted focusing on two critical aspects: first, elucidating the internal solid–liquid two-phase flow patterns; and second, investigating the wear characteristics of pump components.
In the study of solid–liquid two-phase flow patterns, researchers commonly employ flow visualization experimental methods to observe the motion of solid particles [1,2]. Building upon visualization experiments, scholars have utilized ultrasonic velocimetry to precisely measure particle velocities [3]. Meanwhile, to obtain two-dimensional and three-dimensional particle distributions within flow channels, researchers have adopted improved PIV techniques [4], Phase Doppler Particle Analyzers (PDPA) [5], and high-speed photography [6] in their experimental investigations of solid–liquid two-phase flow. These experiments particularly focus on particle trajectories [7,8] as well as particle concentration and mass distributions [9,10] within the flow channels. However, the design and execution of such complex solid–liquid two-phase flow experiments require substantial human and material resources. In this context, computational fluid dynamics (CFD) has been increasingly applied in research. Two predominant methods exist for calculating two-phase flows: the Euler–Euler approach and the Euler–Lagrange approach. The Euler–Euler method treats solid particle motion as fluid flow, making it suitable for high particle concentrations [11,12]. Studies show that while the Euler–Euler method can simulate specific solid–liquid two-phase flow scenarios [13,14], it may yield significant errors under other research conditions [15,16,17]. The Euler–Lagrange method achieves particle tracking by calculating individual particle trajectories throughout the system [18], offering higher computational accuracy. Researchers employing this method have conducted extensive studies on particle motion, revealing that particle velocity [19], forces acting on particles [20], particle size and shape [21], as well as vortices and secondary flows in the flow field [22] all significantly influence particle movement. As evidenced by the aforementioned literature, experimental data serves as the fundamental basis guiding theoretical research and numerical calculations in solid–liquid two-phase flow studies, underscoring its critical importance.
In the field of wear characteristic research, scholars have conducted extensive wear experiments based on solid–liquid two-phase flow studies. Bueno et al. [23] evaluated the feasibility of using diamond-like carbon (DLC) coatings in pumps through wear and erosion tests. Luo et al. [24] investigated the influence of component surface coating thickness on the performance of centrifugal pumps handling solid–liquid two-phase flows, finding that increased coating thickness led to reduced pump head and efficiency, while simultaneously causing increased pressure fluctuations and radial forces within the pump. While well-designed model tests can yield accurate surface wear data, their high costs and significant time requirements have limited their application. With advancements in computational fluid dynamics theory and simulation technology, numerical methods have become increasingly prevalent in solid–liquid flow and wear analysis. Tang et al. [25] examined the effects of particle size and shape on impact forces against component surfaces in single-channel pump solid–liquid flows. Gu et al. [26] explored how solid particle concentration affects centrifugal pump characteristics and the drag-reduction properties of non-smooth impeller surfaces, discovering that dimpled surface configurations demonstrated excellent drag reduction effects that significantly improved pump performance when handling solid–liquid mixtures. Further application of bionic principles to create non-smooth blade models showed nearly identical performance to prototype blades but with improved wear resistance [27]. Additional studies have investigated cavitation phenomena in gas–solid–liquid three-phase flows [28], while Zhang et al. [29] analyzed how gas phase distribution influences wear in centrifugal pumps. Building upon research on coating thickness effects, Tao et al. [30] studied how blade thickness impacts solid–liquid two-phase flow and wear in ceramic centrifugal slurry pumps, finding that increased blade thickness reduced wear on the leading edge and pressure side but exacerbated wear on the suction side. To validate simulation accuracy, researchers often combine simplified model tests with computational results. For instance, Peng et al. [31] verified simulated wear patterns through experimental testing when studying solid phase distribution and velocity under varying particle concentrations in centrifugal pumps.
Based on the aforementioned literature, scholars have conducted in-depth research on the characteristics of solid–liquid two-phase flow and wear performance in pumps. However, there are few reported studies on solid–liquid two-phase flow in vane-type multiphase pumps. Therefore, this paper introduces the research methods of solid–liquid two-phase flow in fluid machinery into vane-type multiphase pumps, conducting a thorough investigation on the motion and distribution patterns of sand particles within such pumps.

2. Physical Model of Vane-Type Multiphase Pump

Figure 1 shows the vane-type multiphase pump independently designed by Xihua University. Since the pump is of a multistage type, each stage has the same structure and similar flow characteristics. To reduce computational costs, a single stage was selected as the research subject in this study. The main parameters are listed in Table 1, with a design flow rate of Q = 200 m3/h and a rotational speed of n = 2980 rpm. Using Unigraphics NX software, the inlet and outlet of the pump were extended under the conditions of at least three times the length of the pressure-increasing unit at the inlet and six times at the outlet to ensure fully developed flow at both ends. The entire fluid domain model was simplified into four parts: the inlet section, impeller, guide vane, and outlet section. The detailed 3D computational domain is shown in Figure 2.

3. Discrete Phase Model

The Discrete Phase Model (DPM) belongs to the Eulerian–Lagrangian computational approach and is commonly used to solve fluid flow problems involving particles. In this study, the DPM calculates particle trajectories based on Newton’s second law of motion, and the particle paths are governed by the following force–balance equation:
m p d u p d t = F D + F B + F V M + F P + F R + F M + F S
where script p denotes particle parameters; m represents mass; u indicates velocity; FD stands for drag force; FB is buoyancy force; FVM denotes virtual mass force; Fp represents pressure gradient force; FR includes Coriolis and centrifugal forces in rotating systems; FM is Magnus lift force; FS indicates Saffman lift force.
In two-phase flow fields, the discrete phase generates a slip velocity (vslip) relative to the continuous phase, which can be calculated by the following equation:
v s l i p = v f v p
where vf is the fluid velocity and vp is the particle velocity.
The particle trajectories are predominantly determined by drag forces during motion, with the governing equation expressed as:
F D = m p v s l i p τ r
where the subscript f denotes fluid-phase parameters, u represents velocity, and τr is the particle relaxation time.
τ r = ρ p d p 2 18 μ f 24 C D Re p
Re P = ρ f d p v s l i p μ f
where ρ is the density; dp is the particle diameter; μf is the dynamic viscosity of the fluid; Rep is the particle Reynolds number; CD is the drag coefficient.
The paper assumes the particle shape to be spherical and adopts the drag coefficient calculation formula proposed by Morsi and Alexander. The drag coefficient is given as
C D = a 1 + a 2 Re p + a 3 Re p 2
where a1, a2, and a3 are empirical constants, adopting the recommended values from Morsi.
The buoyancy force caused by the particle’s own gravity is calculated as follows:
F B = m p 1 ρ f ρ p g
where g is the gravitational acceleration.
The virtual mass force arises from the relative acceleration between the fluid and particles, and can be expressed as:
F V M = C V M m f d u f d t d u p d t
where CVM is the virtual mass coefficient, taken as 0.5.
The pressure gradient force arises from the pressure difference across the particle surface due to non-uniform pressure distribution in the flow field, and can be expressed as
F P = m p ρ f ρ p u p u f
In rotating machinery, particles are inevitably subjected to both Coriolis and centrifugal forces, calculated as follows:
F R = m p 2 ω × u p ω × ω × r p
where ω is the relative angular velocity between the particle and fluid, and rp is the position vector from the particle to the origin of coordinates.
When particles move in a flow field with velocity gradients, they rotate about their own centroids due to these gradients, generating Magnus lift. When the velocity gradient is perpendicular to the particle’s motion direction, the particles experience Saffman lift. The calculation formulas for these two forces are as follows:
F M = 1 2 A p C M ρ f v s l i p ω v s l i p × ω
F S = K S 4 r p 2 ρ f ν f V f i x i 1 2 V f i V p i sgn V f i x i
where Ap is the projected particle area, CM is the rotational lift coefficient, KS is an empirical coefficient, and sgn denotes the signum function.

4. Boundary Conditions and Mesh Generation

4.1. Boundary Condition Setup

The liquid media in the computational domain are primarily liquid water with a density of 998.2 kg/m3 and crude oil with a density of 882.6 kg/m3. A gravitational acceleration of 9.81 m/s2 is applied in the negative Z-axis direction. The SST k-ω turbulence model was selected for this study. This model employs the Wilcox k-ω formulation in near-wall regions while adopting the standard k-ε model in areas farther from the wall. By combining the respective advantages of Wilcox k-ω in boundary layer resolution and standard k-ε in free shear flow computation, the SST k-ω model incorporates modifications to the eddy viscosity coefficient. It accounts for the transport effects of turbulent shear stress, thereby enabling accurate prediction of both the initiation point of flow separation on smooth surfaces and the extent of fluid separation zones. The walls of the flow channel are set as no-slip boundaries. The inlet boundary condition is defined as a velocity inlet, while the outlet boundary condition is set as a pressure outlet. The impeller rotation speed is 2980 rpm, and the frozen rotor model is adopted by intersecting the static and dynamic computational domains.
In the DPM simulation, a two-way coupled solution was implemented between the discrete phase and continuous phase to account for their mutual interactions. The particle injection source was configured as a surface injection at the inlet boundary, with sand particles uniformly injected normally to the inlet surface. The particle injection velocity was set equal to the inlet flow velocity, assuming that particles had already reached full acceleration before entering the computational domain. Quartz sand was selected as the particle material with a density of 2650 kg/m3. The computational cases were determined based on field data of sand concentration in crude oil, as detailed in Table 2. Furthermore, a comprehensive analysis was conducted on all datasets presented in Table 2.
For spatial discretization schemes, the gradient terms were discretized using the Green-Gauss cell-based method, while pressure was handled by the PRESTO! scheme. First-order upwind discretization was applied for density, momentum equations, turbulent kinetic energy, and turbulent dissipation rate. For polydisperse particle conditions, the particle size distribution was described by the Rosin-Rammler (RR) function, with key computational parameters summarized in Table 3. The simulation initialized with a stabilized oil–water flow field before commencing the solid–liquid two-phase calculations.

4.2. Mesh Generation

The ICEM software was used to generate structured meshes for the inlet and outlet sections, while TurboGrid was employed to create structured meshes for the impeller and guide vanes. To ensure high-quality boundary layer meshes near the walls, the mesh was refined in these regions. Specifically, 30 layers of grid cells were arranged along the tip clearance gap, and an O-type topology was applied around the blades for enhanced mesh quality, as illustrated in Figure 3. The red box in Figure 3 highlights the pressurization unit of the multiphase mixed-transport pump, which consists of an impeller and a diffuser. The circled component is the impeller.
The y+ value in the near-wall region was controlled to be below 5, and no wall functions were used in the turbulence calculations to comply with the SST k-ω turbulence model’s requirement for low y+ values.
Mesh quality has a significant impact on both the accuracy and efficiency of CFD simulations, making mesh generation the most critical step in the CFD pre-processing stage.
In this study, the Eulerian–Lagrangian approach is employed to solve the solid–liquid two-phase flow within the multiphase pump. This method tracks particle trajectories in a Lagrangian coordinate system, which demands high computational performance and memory when handling a large number of particles, leading to prolonged simulation times. To improve computational efficiency, a grid independence study was conducted by analyzing the pump head under clear water (single-phase) conditions. A total of six fluid domain models with varying mesh densities were generated using TurboGrid and ICEM, all consisting of structured meshes. The results of the grid independence verification, including mesh cell counts and corresponding pump heads, are presented in Table 4. The data shows that as the mesh density increases, the calculated pump head initially fluctuates but eventually stabilizes. Beyond the fourth mesh configuration, the variations in head become negligible, indicating that further mesh refinement has minimal influence on the results. Therefore, the fourth mesh configuration was selected as the final computational grid.

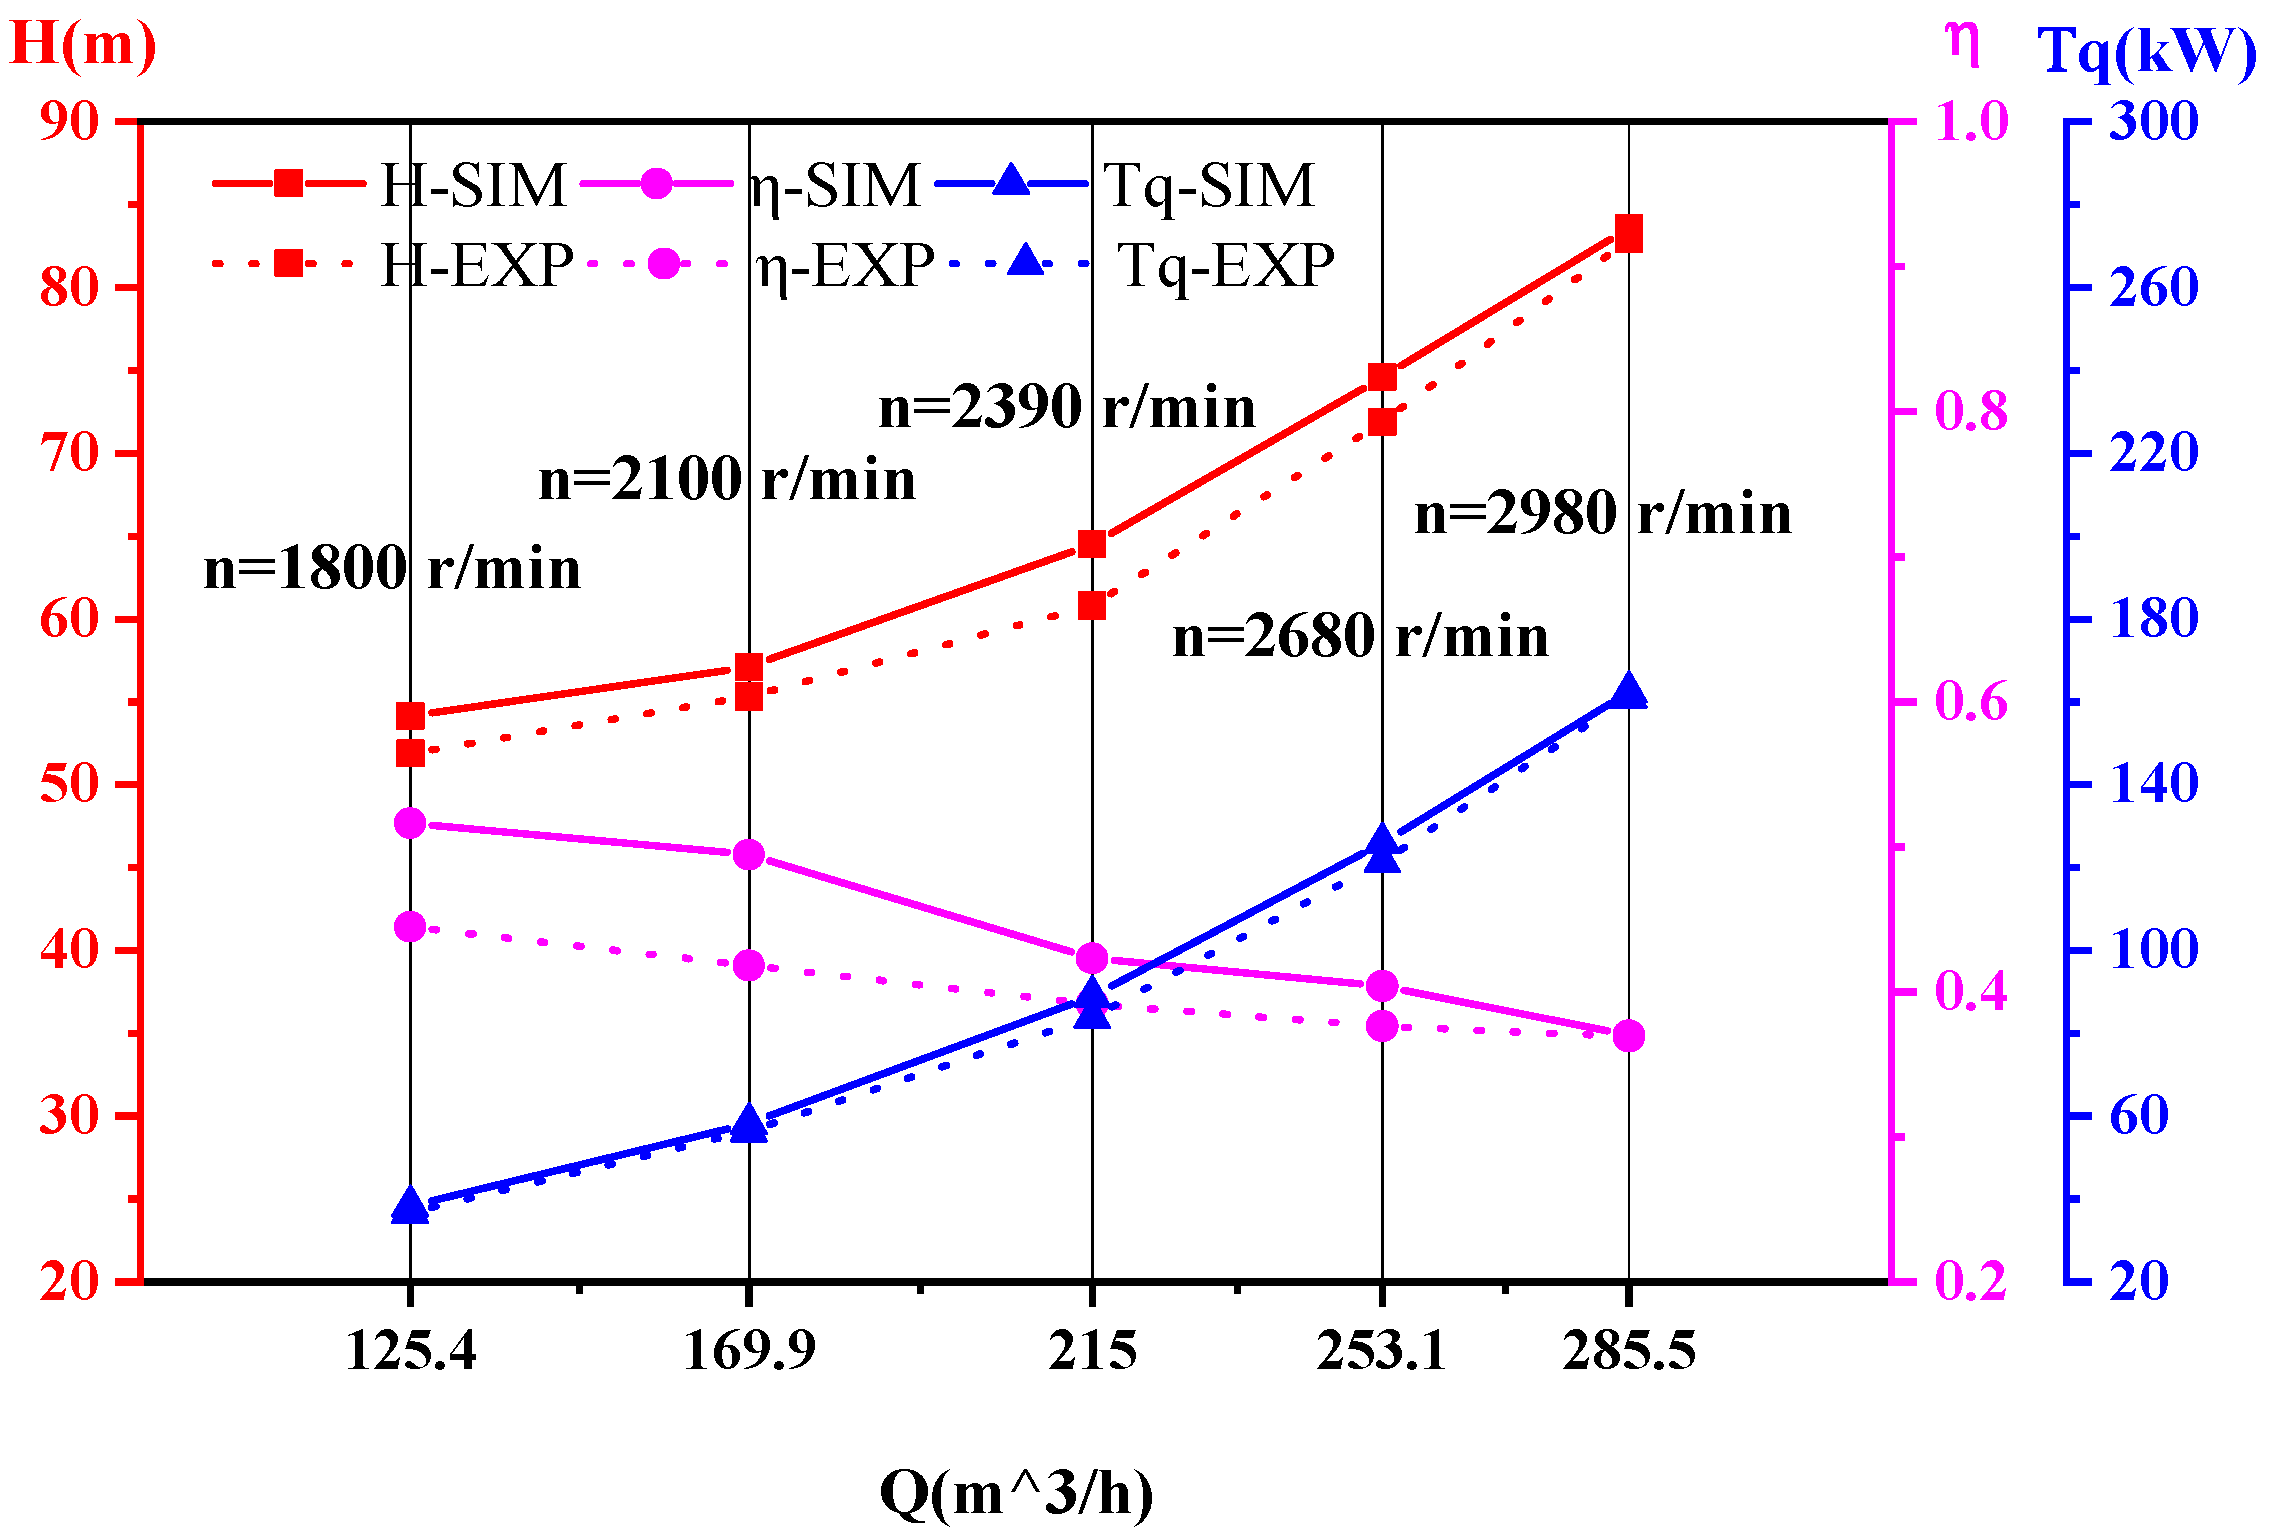
5. Experimental Study

To experimentally evaluate the operational performance of the multiphase pump under real-world conditions, the pump was installed in an enclosed gathering station at an oilfield site, as shown in Figure 4a. During the pipeline installation of the multiphase pump, relevant testing devices were incorporated at key locations, including inlet/outlet pipelines, sealing pipelines, lubrication pipelines, motor side. The experimental setup was configured with the following parameters: sand concentration ≥2% by mass, sand particle diameters ranging from 0.065 mm to 5 mm, oil content of approximately 10% by volume, a constant flow rate of 200 m3/h, and a rotational speed of 2980 rpm. These carefully controlled conditions enabled systematic investigation of multiphase flow characteristics in the test system. The test instrumentation system enables both on-site real-time data acquisition and remote data transmission to off-site computers for analysis as shown in Figure 4b.
The flow rate and head of the vane-type multiphase pump under actual operating conditions were recorded to further verify the accuracy of the simulation method. The comparison between experimental results and simulation calculations is shown in Figure 5. The parameters are defined as follows: H for head (m), η for efficiency (%), and Tq for power (kW). It can be seen that when transporting oil, water, and sand particles, the difference between simulated and experimental results for pump head, efficiency and power is small as the speed increases and flow rate rises. The experimental conditions comprised approximately 10% oil content and 2% sand content by volume. Under low-speed and low-flow conditions, there is a significant difference between the experimental and simulated efficiency values, which is related to the pump operating under off-design conditions. As the speed and flow rate gradually approach the design values, the error gradually decreases. This demonstrates the high reliability of the numerical research method used in this study.

6. Characteristics of Solid–Liquid Two-Phase Flow in Vane-Type Multiphase Pumps

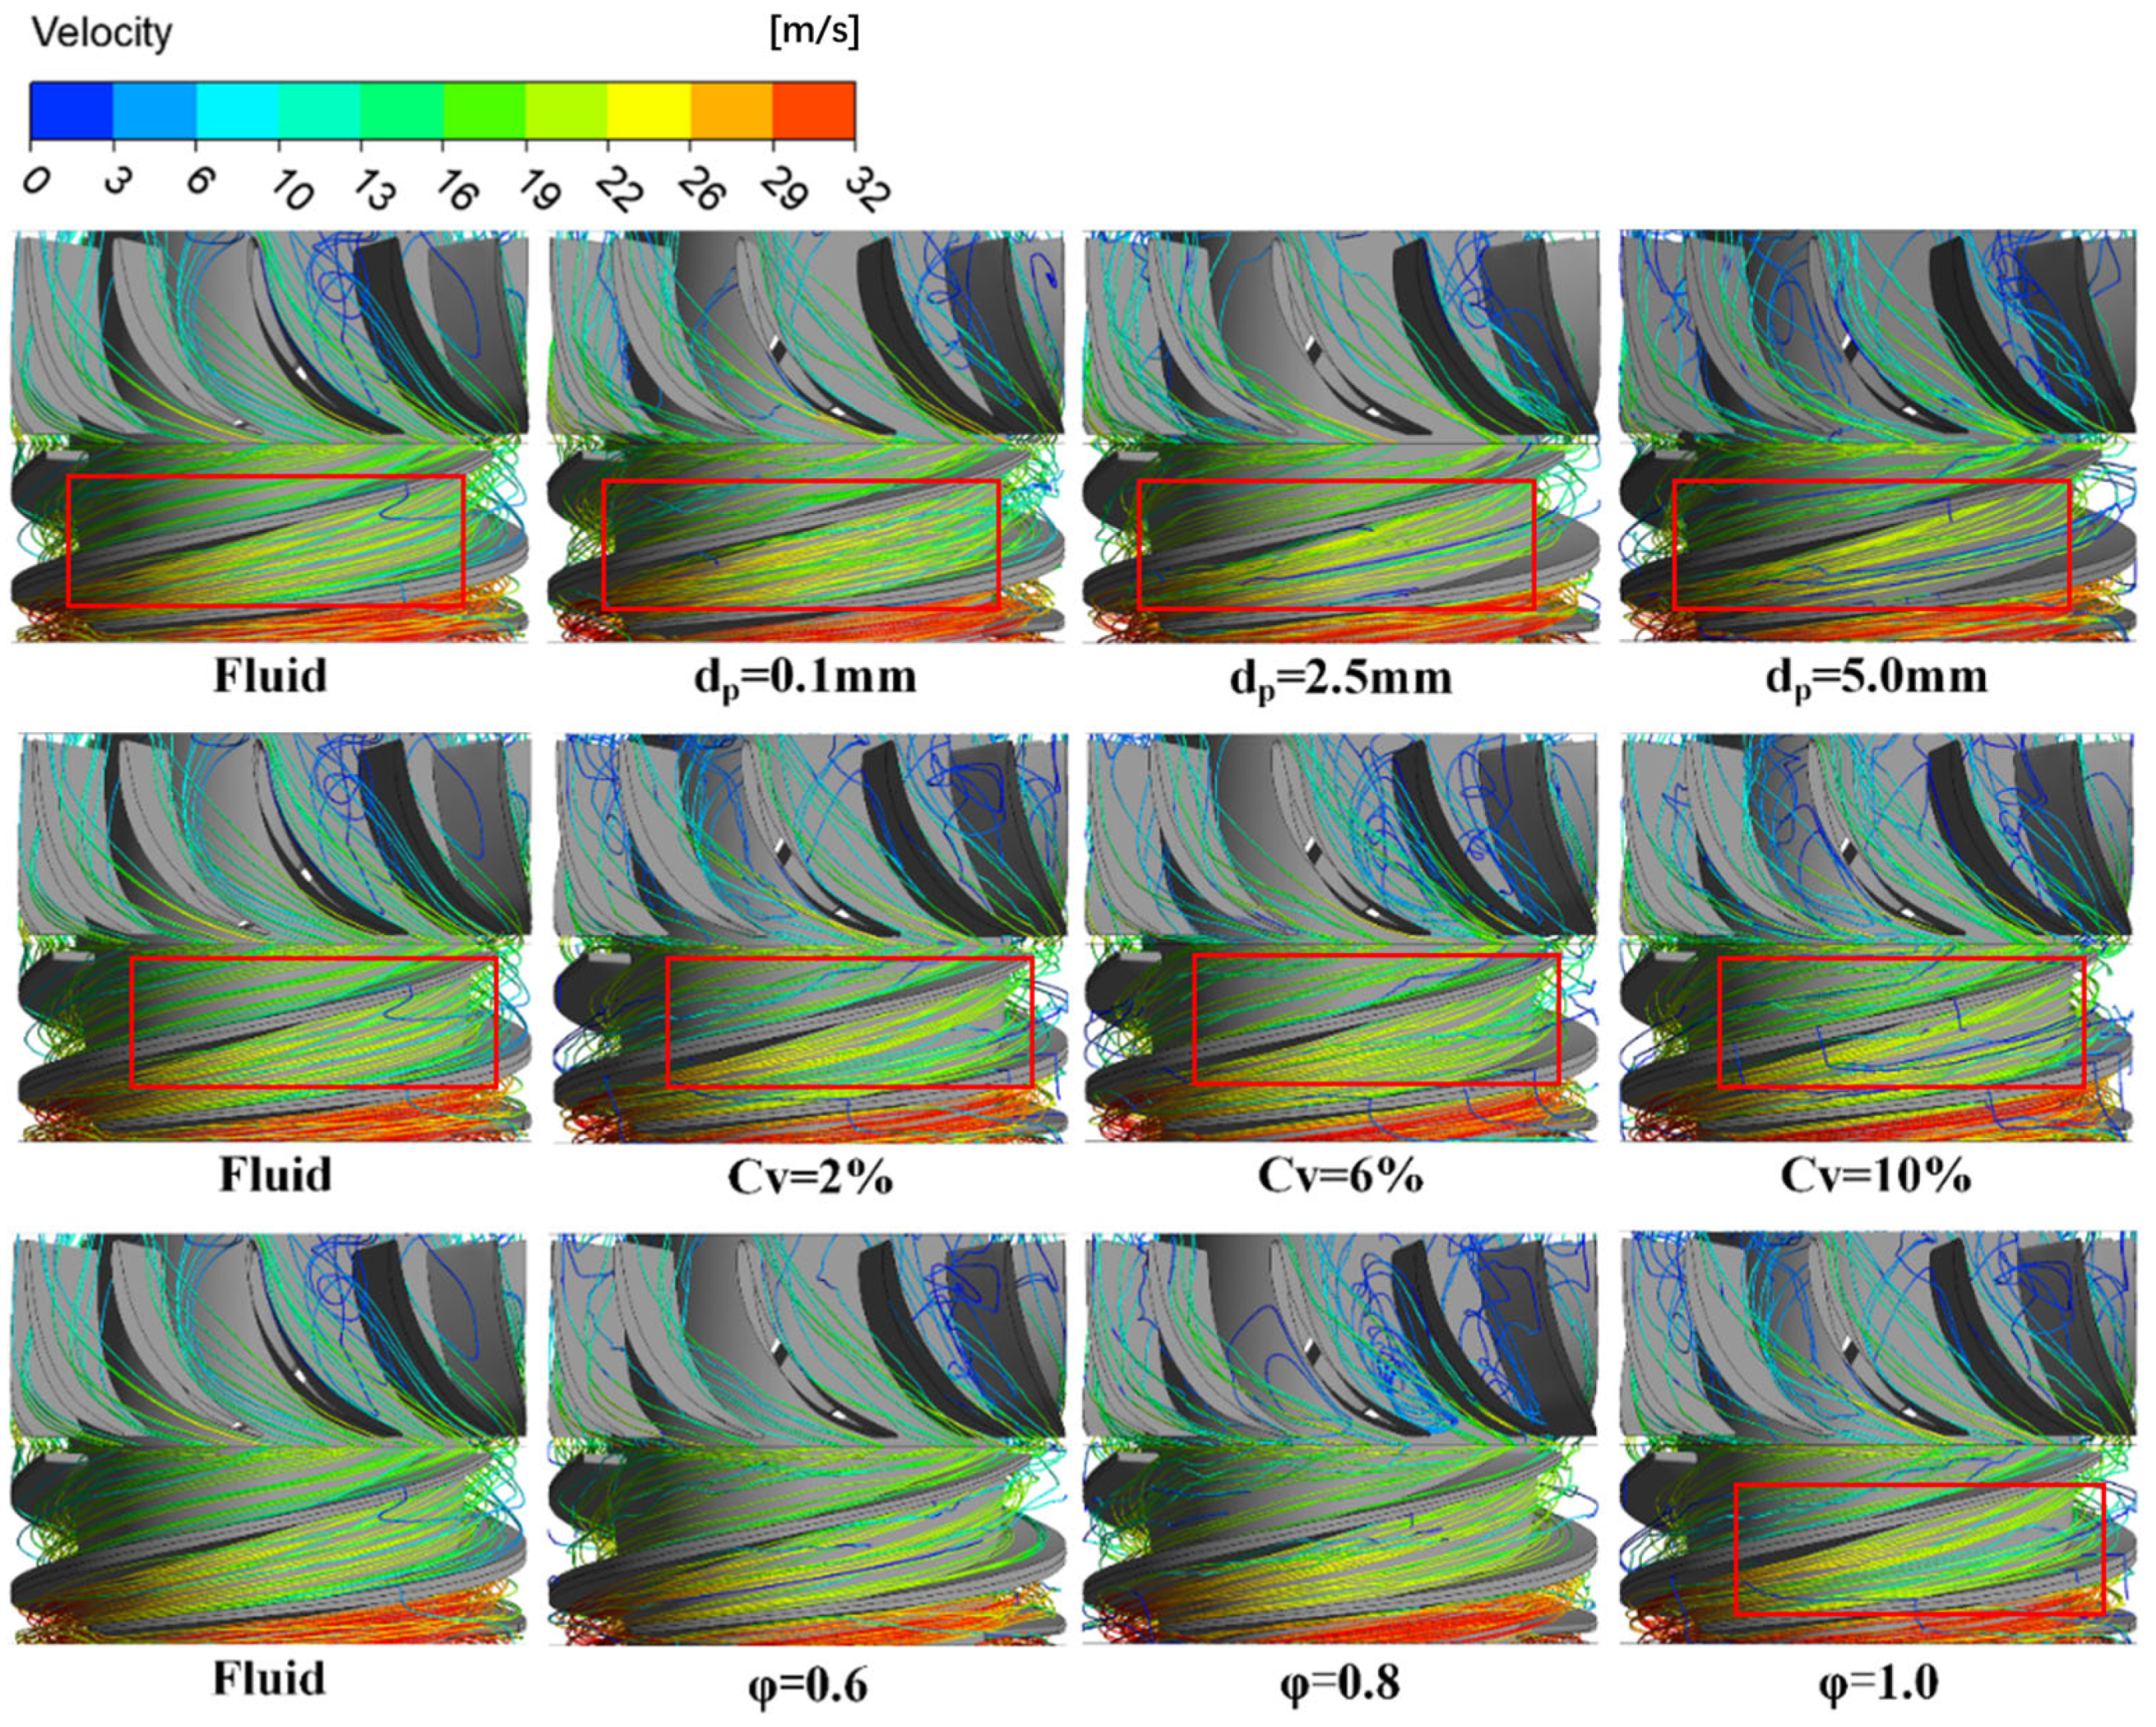
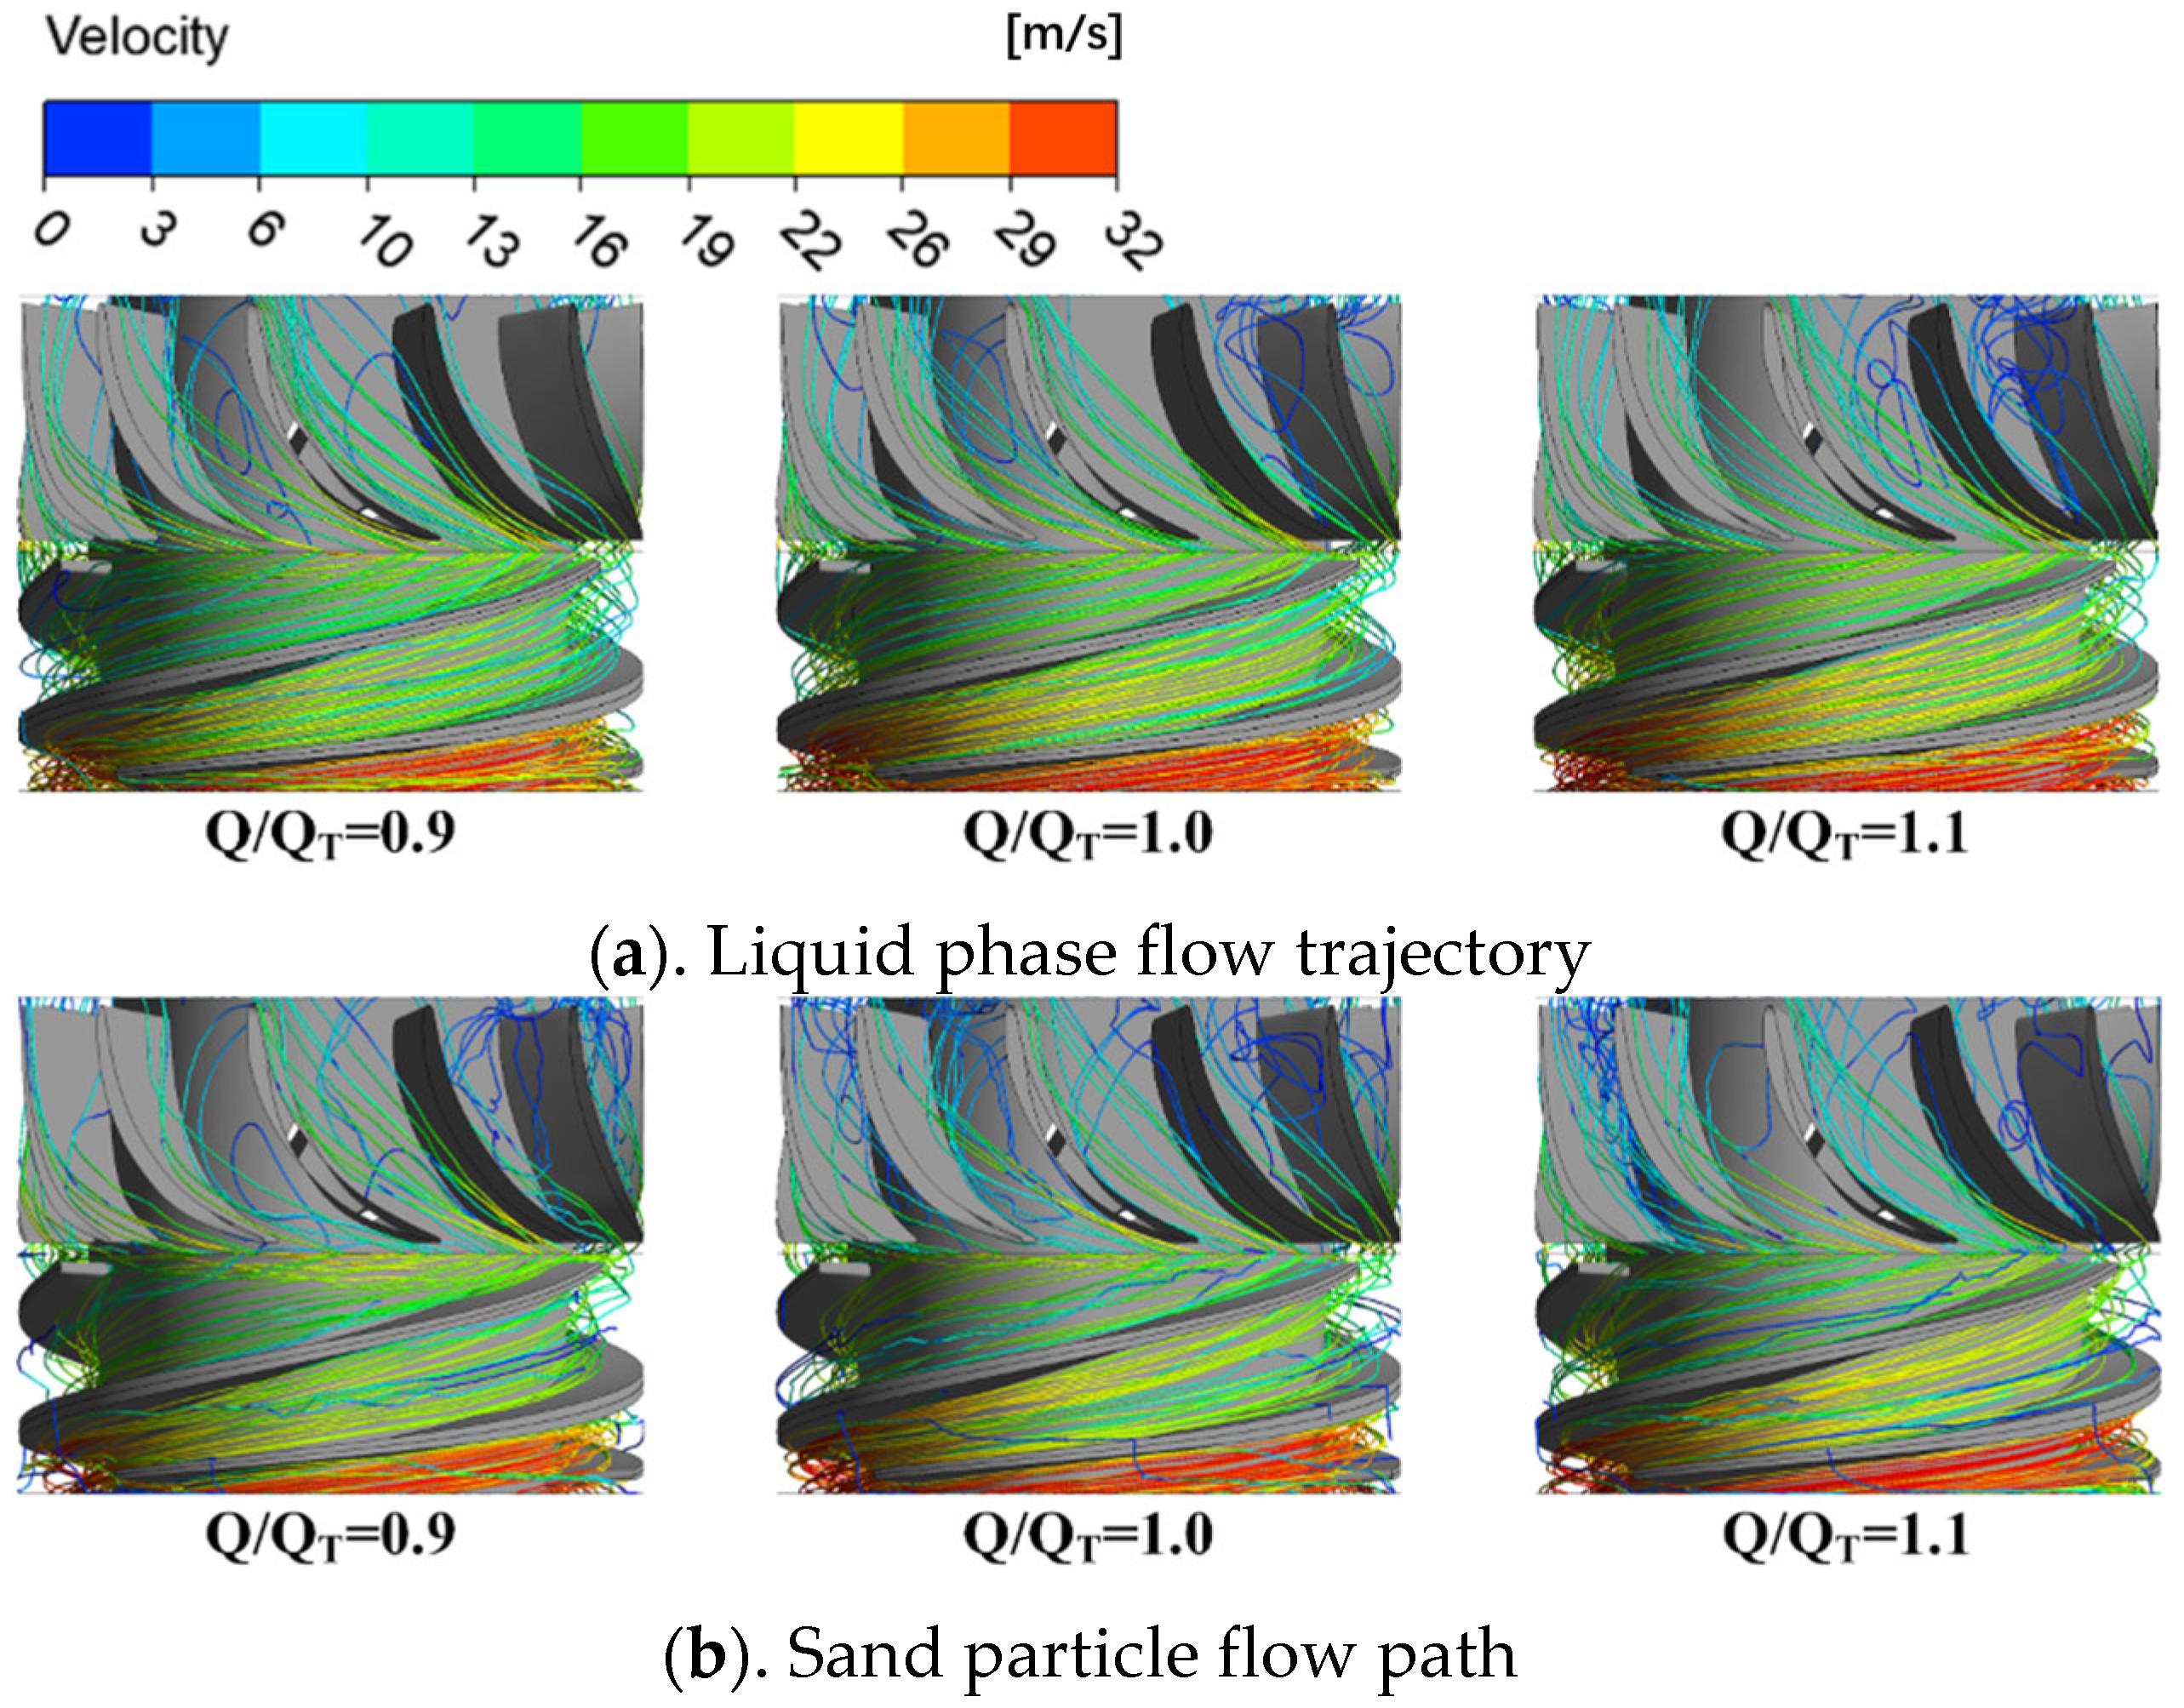
6.1. Solid–Liquid Two-Phase Trajectory

The solid–liquid two-phase trajectories under different sand particle parameters were first analyzed, with Figure 6 presenting the phase trajectories under various operating conditions. The red box demonstrates the variation in particle trajectories. The results in Figure 6 demonstrate that the fluid velocity inside the multiphase pump flow passage gradually decreases along the flow direction, with some low-velocity leakage flow occurring at the impeller shroud region, while vortices form in the middle section of guide vane passages due to residual circulation. Under different sand particle parameters, most sand particles follow trajectories similar to the fluid flow, yet they exhibit distinct behaviors due to their specific properties. With increasing particle size, the particle velocity progressively decreases, resulting in more low-velocity particles accumulating at the shroud and blade surfaces. Higher particle concentrations lead to significantly more particles depositing on blade surfaces and passing through the tip clearance region. Regarding shape effects, when decelerating after impacting flow passage surfaces, spherical particles maintain better transport performance by continuing movement under fluid driving forces compared to non-spherical particles.
Figure 7 shows the two-phase flow trajectories in the multiphase pump under different flow conditions. As the pump’s flow rate increases, the fluid velocity within the flow passages rises significantly, accompanied by enhanced vortex formation in the guide vanes, where vortices primarily concentrate in specific sub-channels. Under off-design conditions, some fluid near the pump inlet deviates from the main flow direction, creating localized jet flows that obstruct normal fluid movement. The sand particle velocity generally increases with higher flow rates; however, the intensified vortices in the guide vanes at large flow rates cause more particles to be affected, resulting in noticeable velocity reduction and prolonged entrapment within the guide vane passages. At low flow rates, particles colliding with the blade surfaces or shroud lose momentum due to insufficient fluid energy to sustain their motion, as is evident in the corresponding trajectory plots. Additionally, the inlet jet flows under off-design conditions lead to extended residence times for some particles near the impeller inlet region.
Figure 8 presents the streamlines and sand particle trajectories at different rotational speeds. The results demonstrate that speed reduction leads to significantly decreased fluid velocity within the pump, resulting in more stable inflow conditions at the multiphase pump inlet. Within the impeller region, the particle trajectories become smoother as the rotational speed decreases. At higher speeds (2980 rpm), the trajectories of high-velocity and low-velocity particles exhibit complex intercrossing patterns, which essentially disappear when the speed is reduced. Concurrently, fewer particles are observed crossing the tip clearance region at lower speeds. In the guide vane passage, a substantial number of particles exhibit helical motion patterns when the pump operates at 2480 rpm, which correlates with performance degradation under off-design conditions. However, as the rotational speed further decreases, the quantity of particles demonstrating such helical motion in the guide vanes shows marked reduction.
Figure 9 presents the liquid streamlines and sand particle trajectories under varying oil concentration conditions. The results demonstrate that increasing oil content leads to partial flow separation from the suction surface at the impeller inlet. The elevated mixture viscosity simultaneously reduces vortex intensity within the guide vanes. Notably, the enhanced mixture viscosity strengthens the drag forces acting on sand particles, causing their trajectories to follow the liquid flow patterns more closely as oil concentration increases.

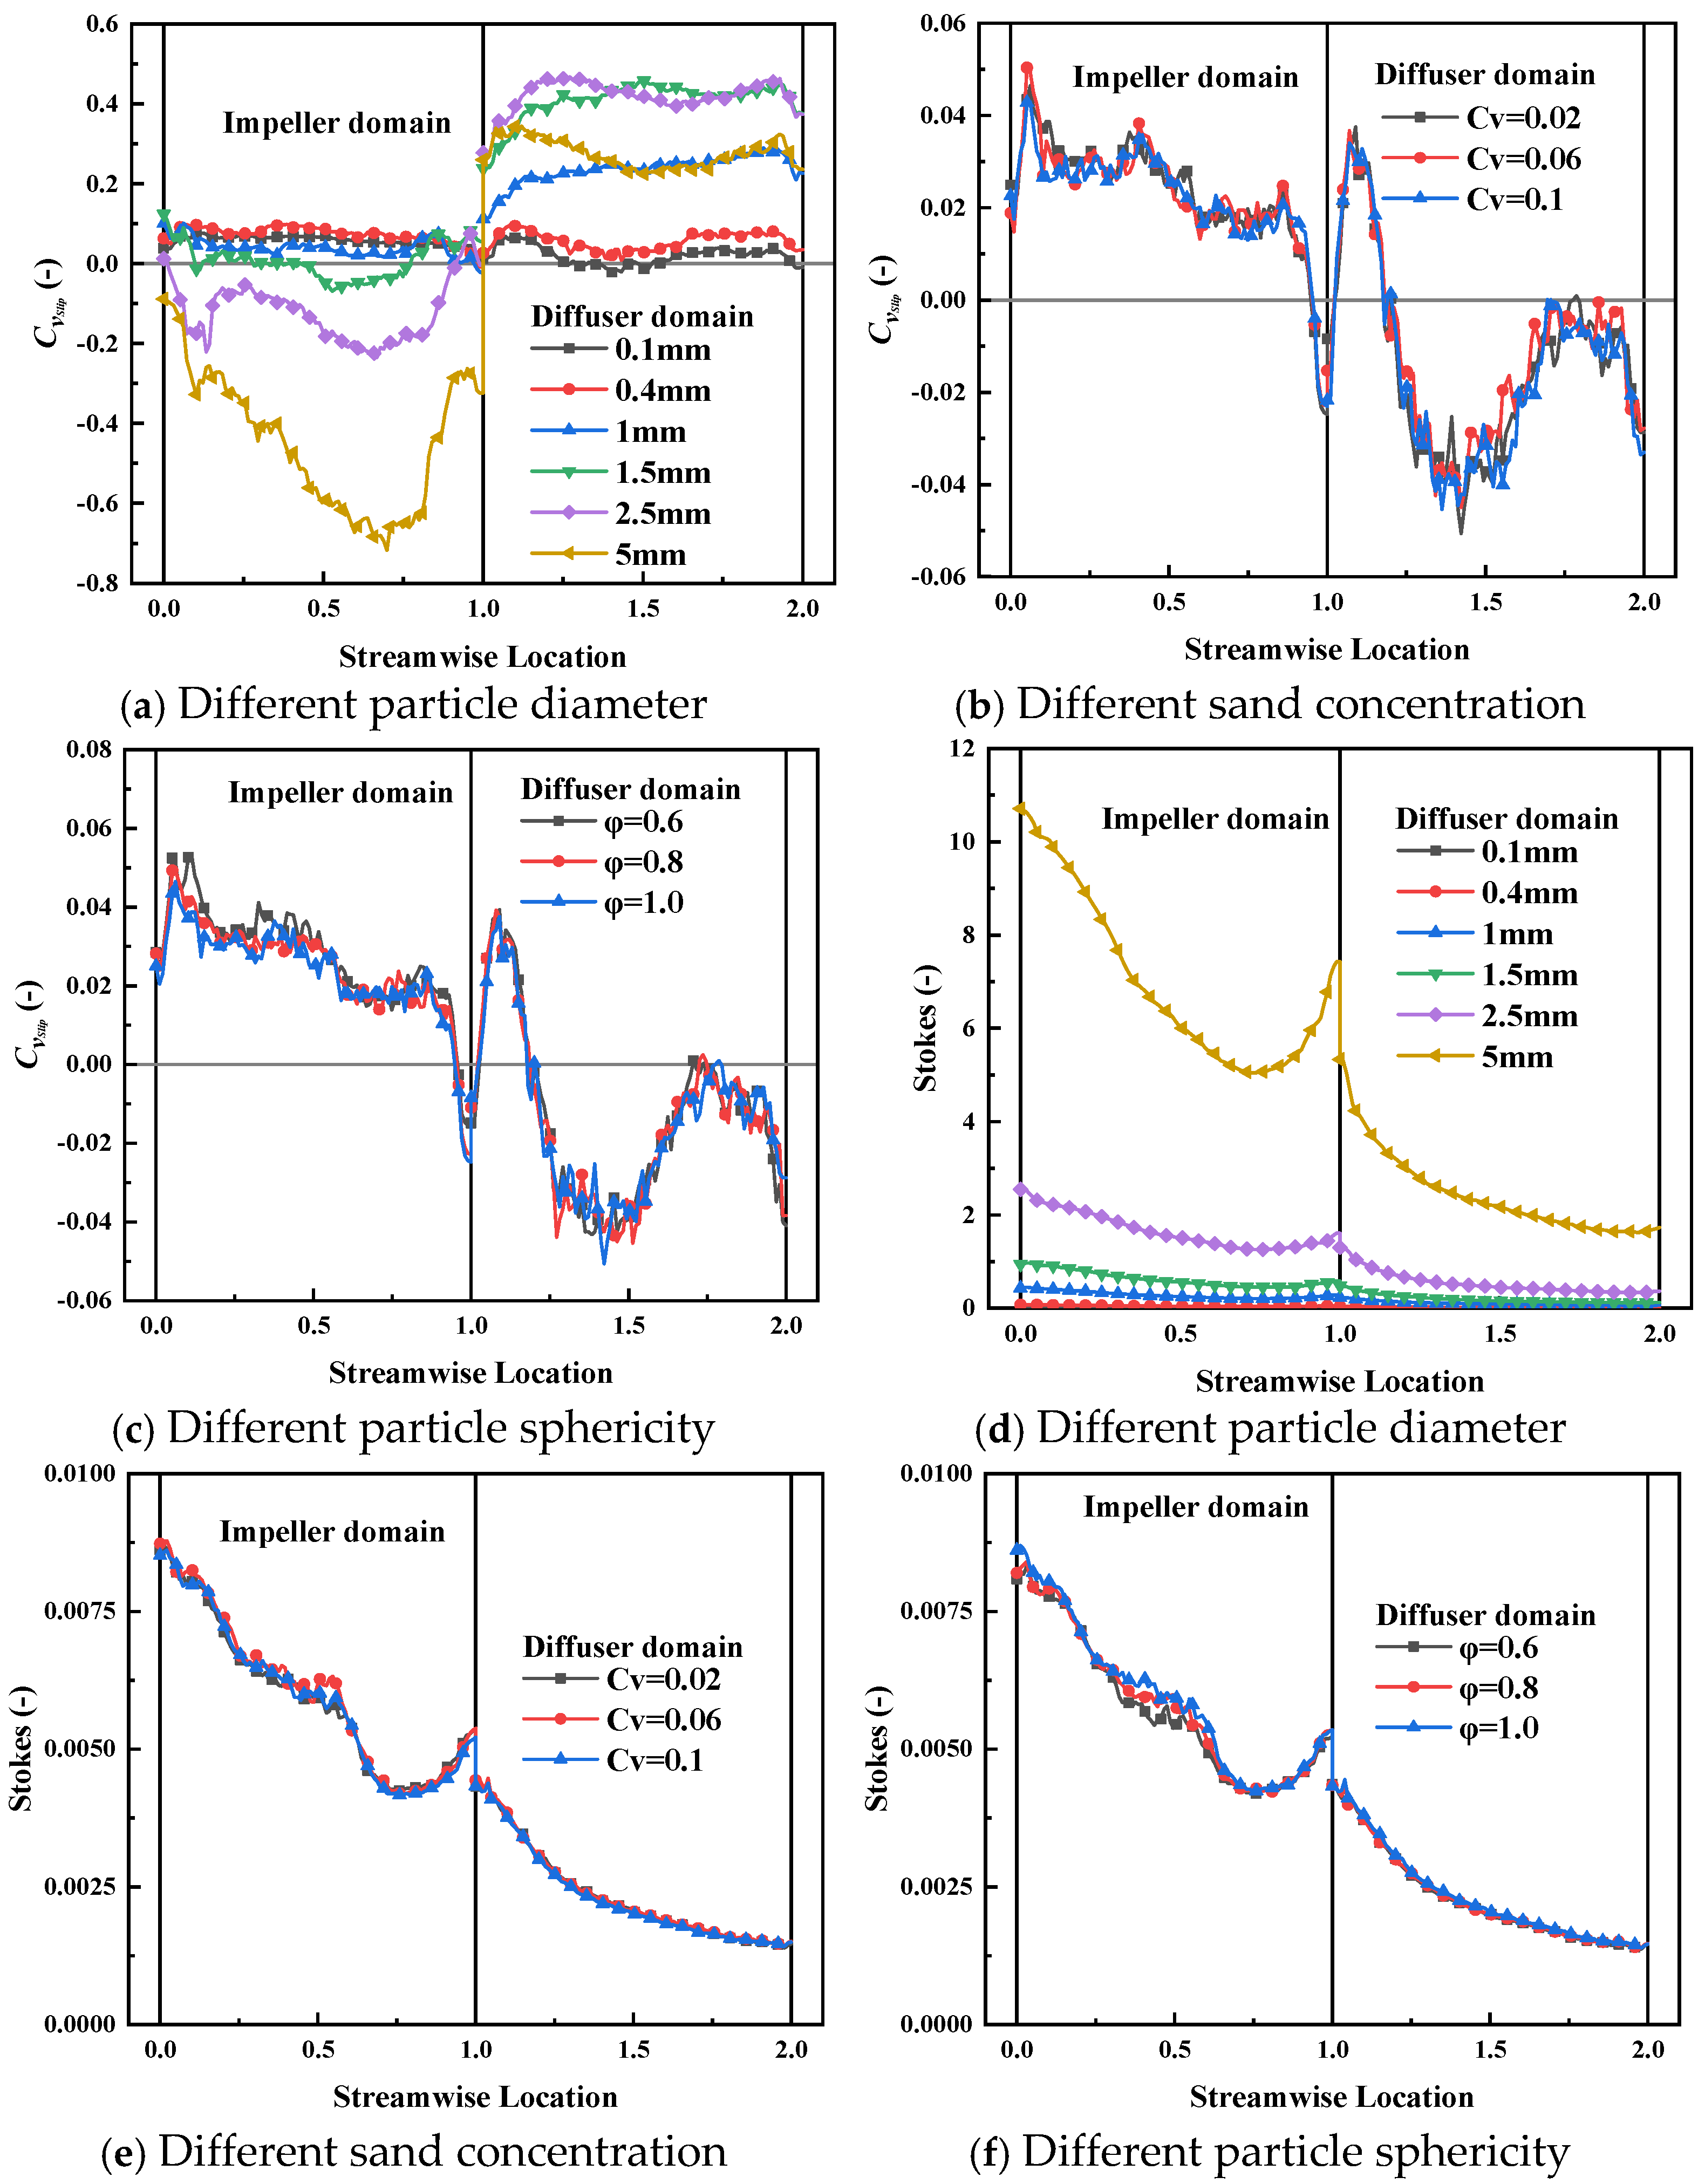
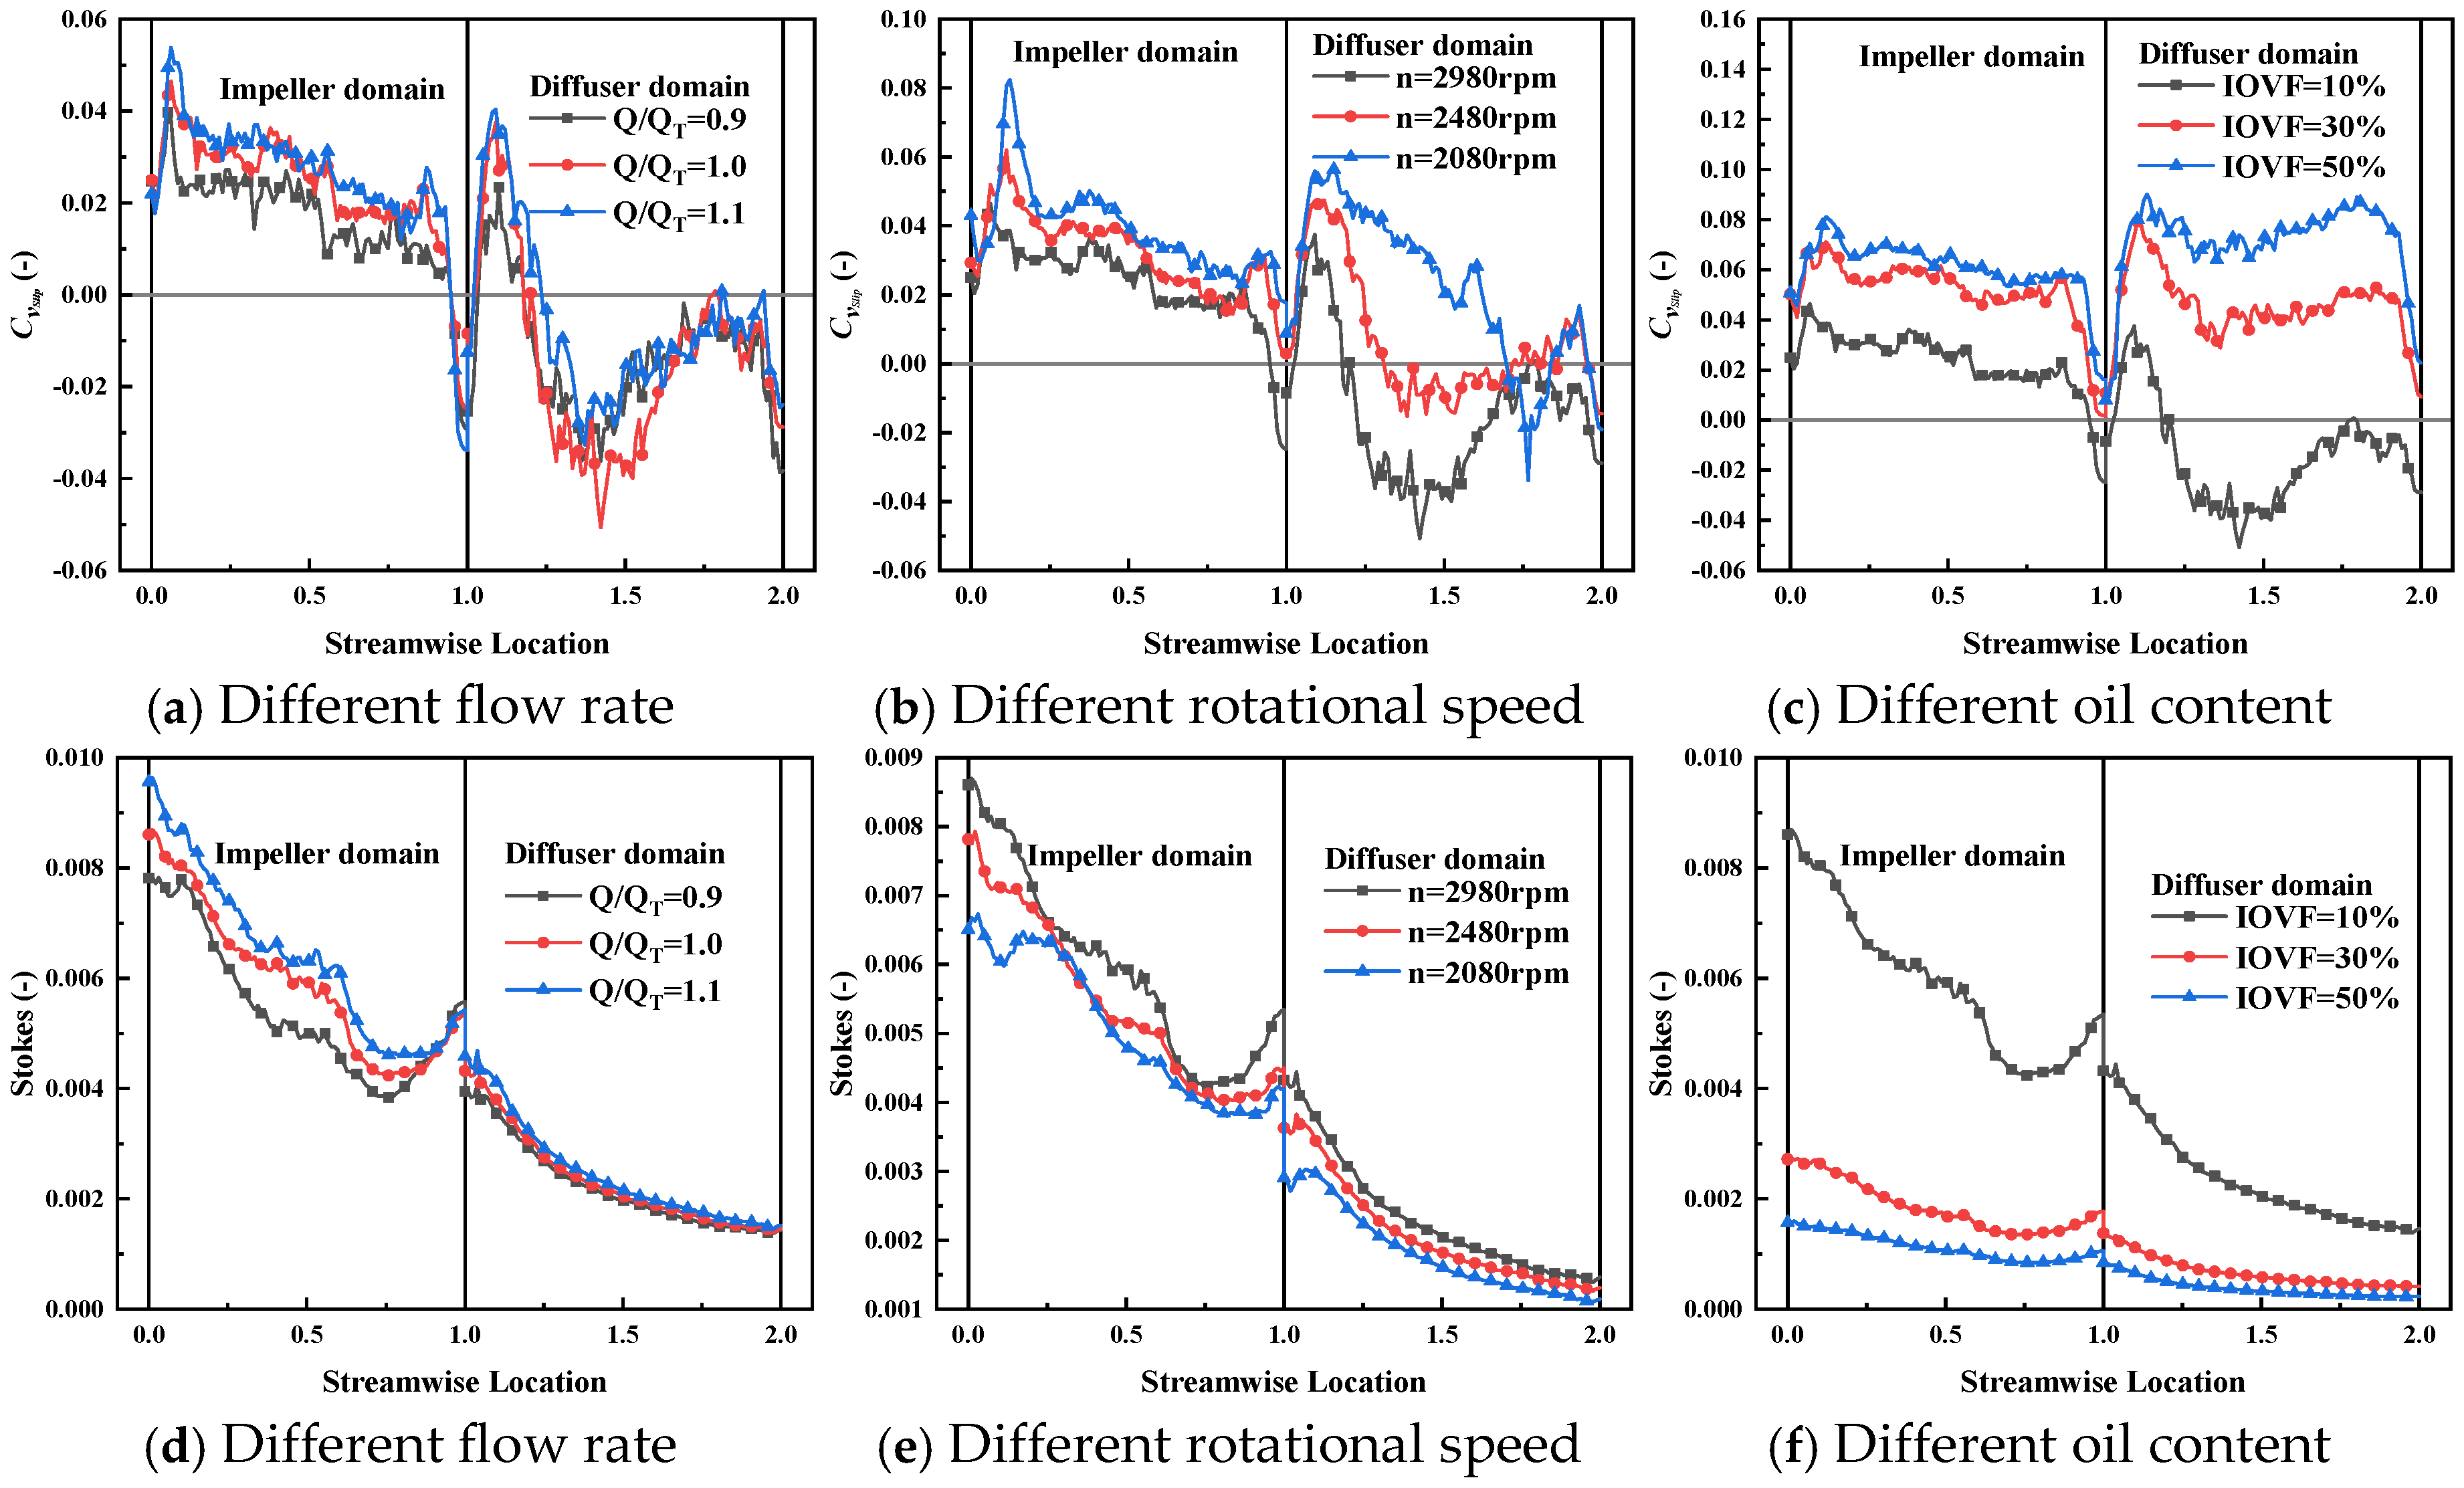
6.2. Sand Particle Motion Characteristics

In solid–liquid two-phase flow, sand particles acquire velocity through fluid drag forces while simultaneously losing kinetic energy due to particle inertia and collision effects, resulting in velocity differences between the particles and the main fluid flow. To quantitatively characterize this particle-flow separation phenomenon, we define a slip velocity coefficient [32] between particles and fluid as shown in Equation (13):
C v s l i p = v f v p / v f
Meanwhile, the dimensionless Stokes number (St) [33], defined as the ratio of particle relaxation time to fluid characteristic time, is employed to characterize suspended particle behavior in the fluid flow, as calculated by Equation (14):
S t o k e s = ρ p d p 2 v 18 μ D
where ρ p = particle density; d p = particle diameter; v = fluid velocity; μ = fluid dynamic viscosity; D = flow passage diameter. When the value of C v s l i p is less than 0, particle kinetic energy transfers to the fluid. Conversely, particles will be accelerated by the fluid when this value is positive.
Figure 10 shows the variations of C v s l i p and Stokes number along the flow direction under different particle parameters. The results indicate that the differences in C v s l i p and Stokes number across various operating conditions are mainly attributed to particle size effects. Figure 10a shows that as particle size increases, the C v s l i p value of particles in the impeller passage first rises and then declines, with larger particles exhibiting higher velocities than the fluid. In the guide vanes, particle velocities remain consistently lower than the fluid velocity, demonstrating continuous energy transfer from the fluid to particles. Figure 10d reveals that larger particles correspond to higher Stokes numbers, indicating greater tendency to deviate from fluid streamlines within the pump passages. The Stokes number reaches extreme values at both the pump inlet and rotor–stator interface, suggesting enhanced particle trajectory divergence in these regions.
For different particle concentrations and shapes, since particle size distribution is determined by specific functions, both C v s l i p and Stokes number exhibit similar trends along the flow path:
(1) As illustrated in Figure 10a through 10c, within the impeller, particles of all sizes maintain lower velocities than the fluid, with maximum energy transfer occurring at the impeller inlet and gradually decreasing along the flow direction.
(2) At the guide vane inlet, particle velocities remain below the fluid velocity. As fluid kinetic energy converts to pressure energy in the guide vanes, particle velocities eventually exceed the fluid velocity, with the velocity difference diminishing toward the outlet.
(3) As illustrated in Figure 10d through 10f, particle concentration and shape show minimal influence on Stokes number distribution along the flow path, with noticeable differences between curves only appearing in the mid-section of the impeller passage.
Figure 11 presents the streamwise variations in the dimensionless parameter C v s l i p and Stokes number under different operating conditions, demonstrating that flow rate, rotational speed, and oil concentration all significantly influence sand particle motion to varying degrees.
In Figure 11, regarding the C v s l i p between sand particles and the fluid, within the impeller, an increase in flow rate, a decrease in rotational speed, and a rise in oil content all widen the velocity difference between sand particles and the fluid, causing the particles to absorb more energy from the fluid. In contrast, within the guide vane, the flow rate has a minimal effect on the C v s l i p , while a decrease in rotational speed and an increase in oil content lead to the particle velocity falling below the fluid velocity, resulting in a reversal of the energy transfer direction. Figure 11d–f further illustrate that the flow rate exhibits a positive correlation with the Stokes number, whereas the Stokes number decreases with declining rotational speed and increasing oil content, showing a negative correlation. From the impeller inlet to the outlet, the influence of flow rate, rotational speed, and oil content on the Stokes number gradually diminishes.

7. Sand Particle Momentum in Vane-Type Multiphase Pumps

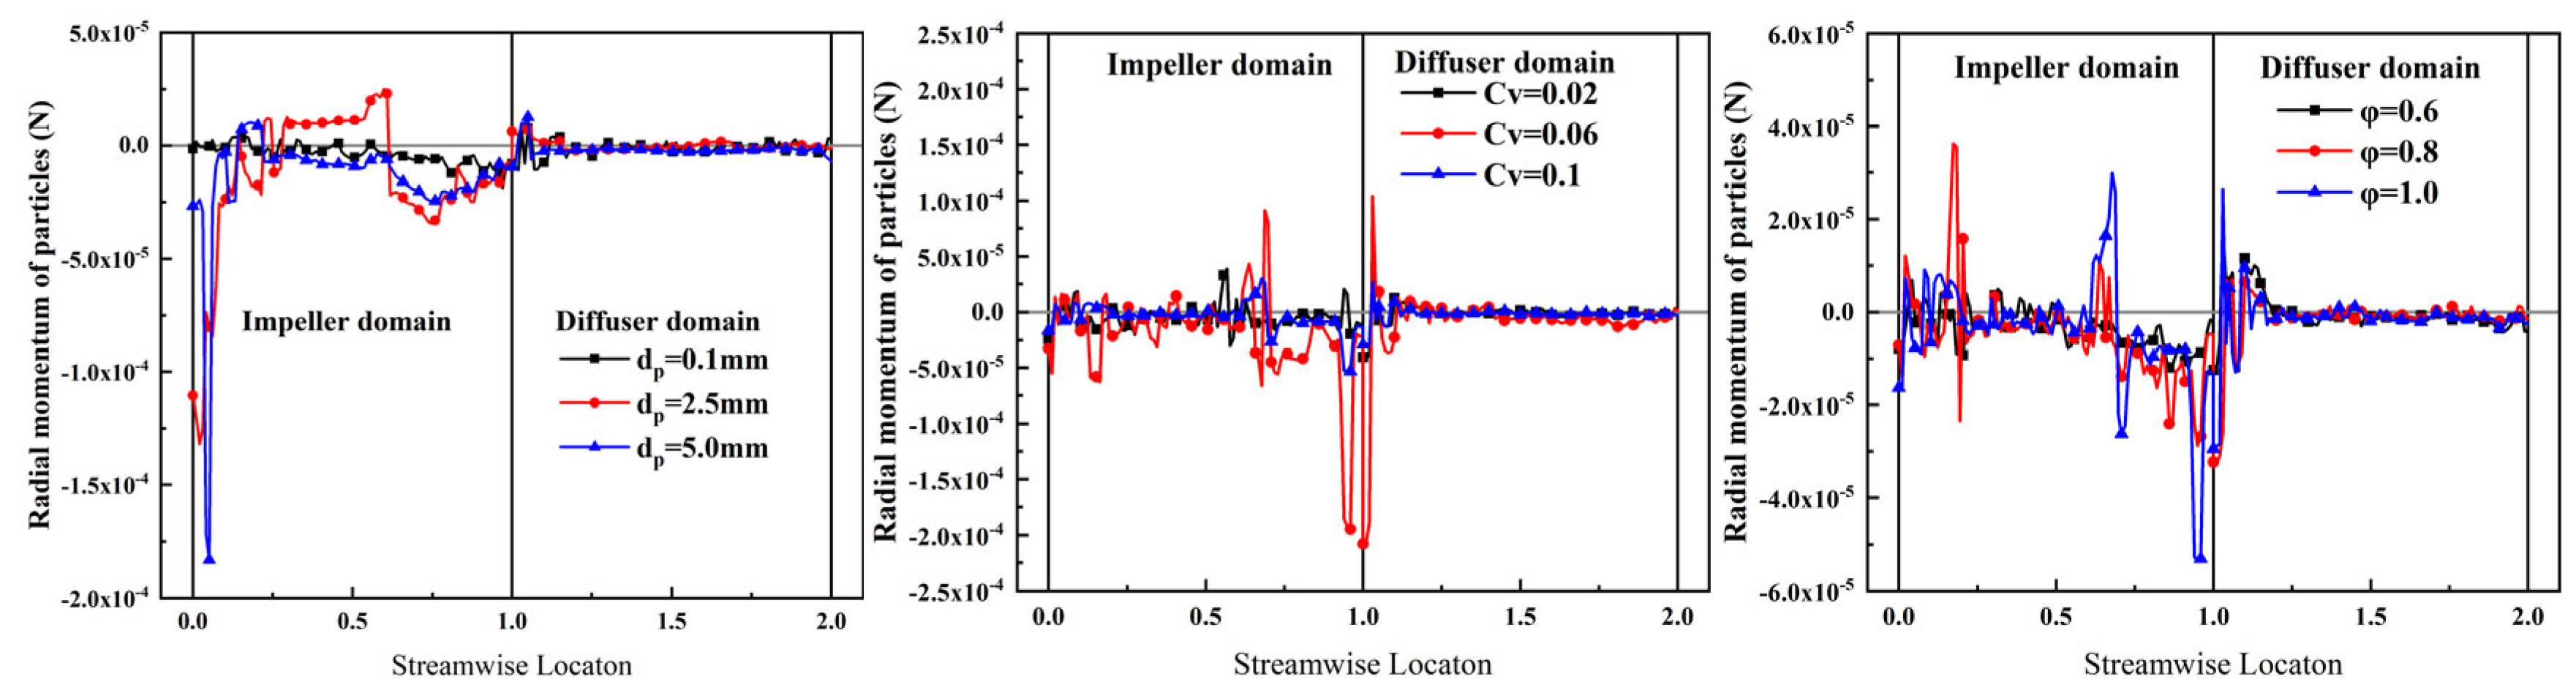
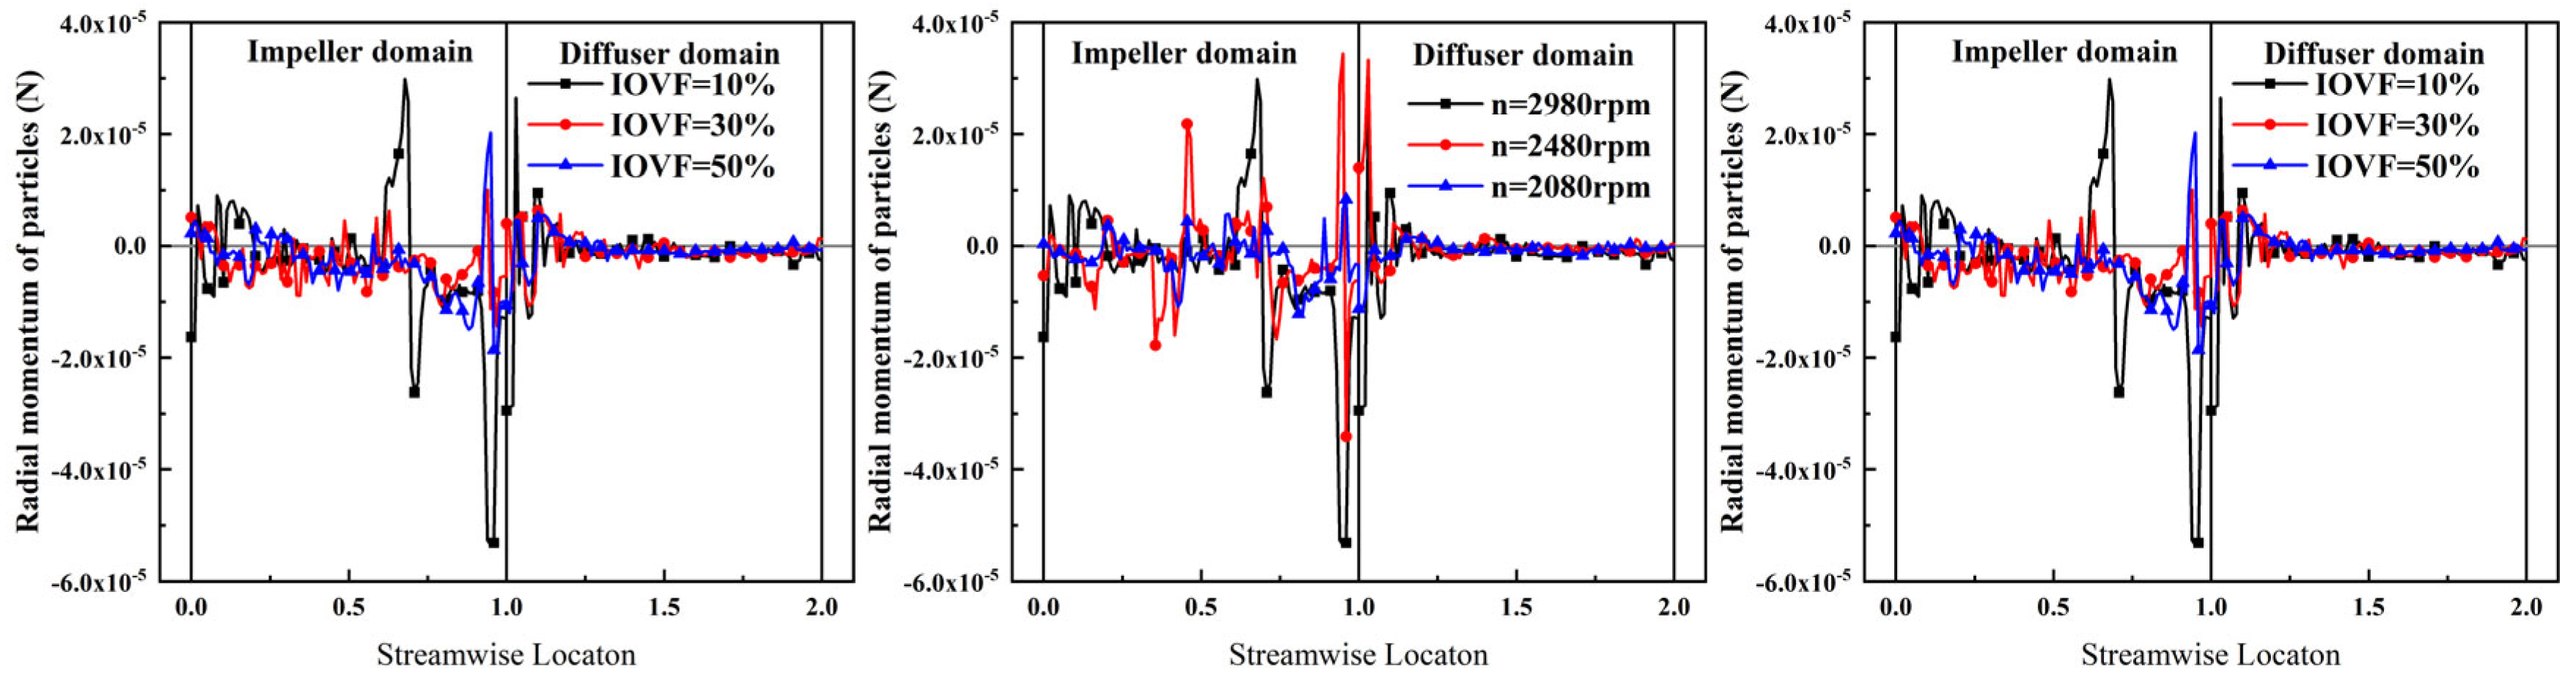
7.1. Radial Momentum of Sand Particle Motion

This section examines particle motion trends through momentum analysis of sand particles. Figure 12 presents the streamwise radial momentum distribution curves of particles within the vane-type multiphase pump under different particle parameters, where positive radial momentum indicates particle movement toward the shroud and negative values represent hubward motion. The particle momentum calculation depends on both particle velocity and diameter—while higher velocities increase momentum, larger diameters reduce both velocity and consequently momentum. Therefore, particles with median diameters of 2.5 mm exhibit maximum radial momentum.
In single-diameter particle conditions, the radial momentum of particles in the front half of the impeller passage is close to or greater than zero, indicating a tendency for particles to migrate toward the shroud. In contrast, particles in the rear half of the impeller passage tend to move toward the hub. Figure 12 further demonstrates that particle concentration positively influences radial momentum, primarily due to the increased number of particles, while particle shape has a relatively minor effect on radial momentum distribution.
Figure 13 illustrates the influence of operational parameters on sand particles’ radial momentum. The results demonstrate that increased flow rate, higher rotational speed, and reduced oil content—all contributing to enhanced fluid kinetic energy—amplify fluctuations in the radial momentum curves of particles within the impeller. This phenomenon indicates more pronounced localized particle movement toward either the hub or shroud due to intensified fluid-particle interactions.
A comprehensive analysis of Figure 12 and Figure 13 reveals consistent patterns in sand particle radial momentum across various particle parameters and operating conditions. The radial momentum profiles consistently exhibit significant fluctuations within the impeller region, characterized by multiple pronounced peaks and troughs. In contrast, the guide vane section demonstrates fundamentally different behavior, with particle radial momentum maintaining near-zero values throughout.

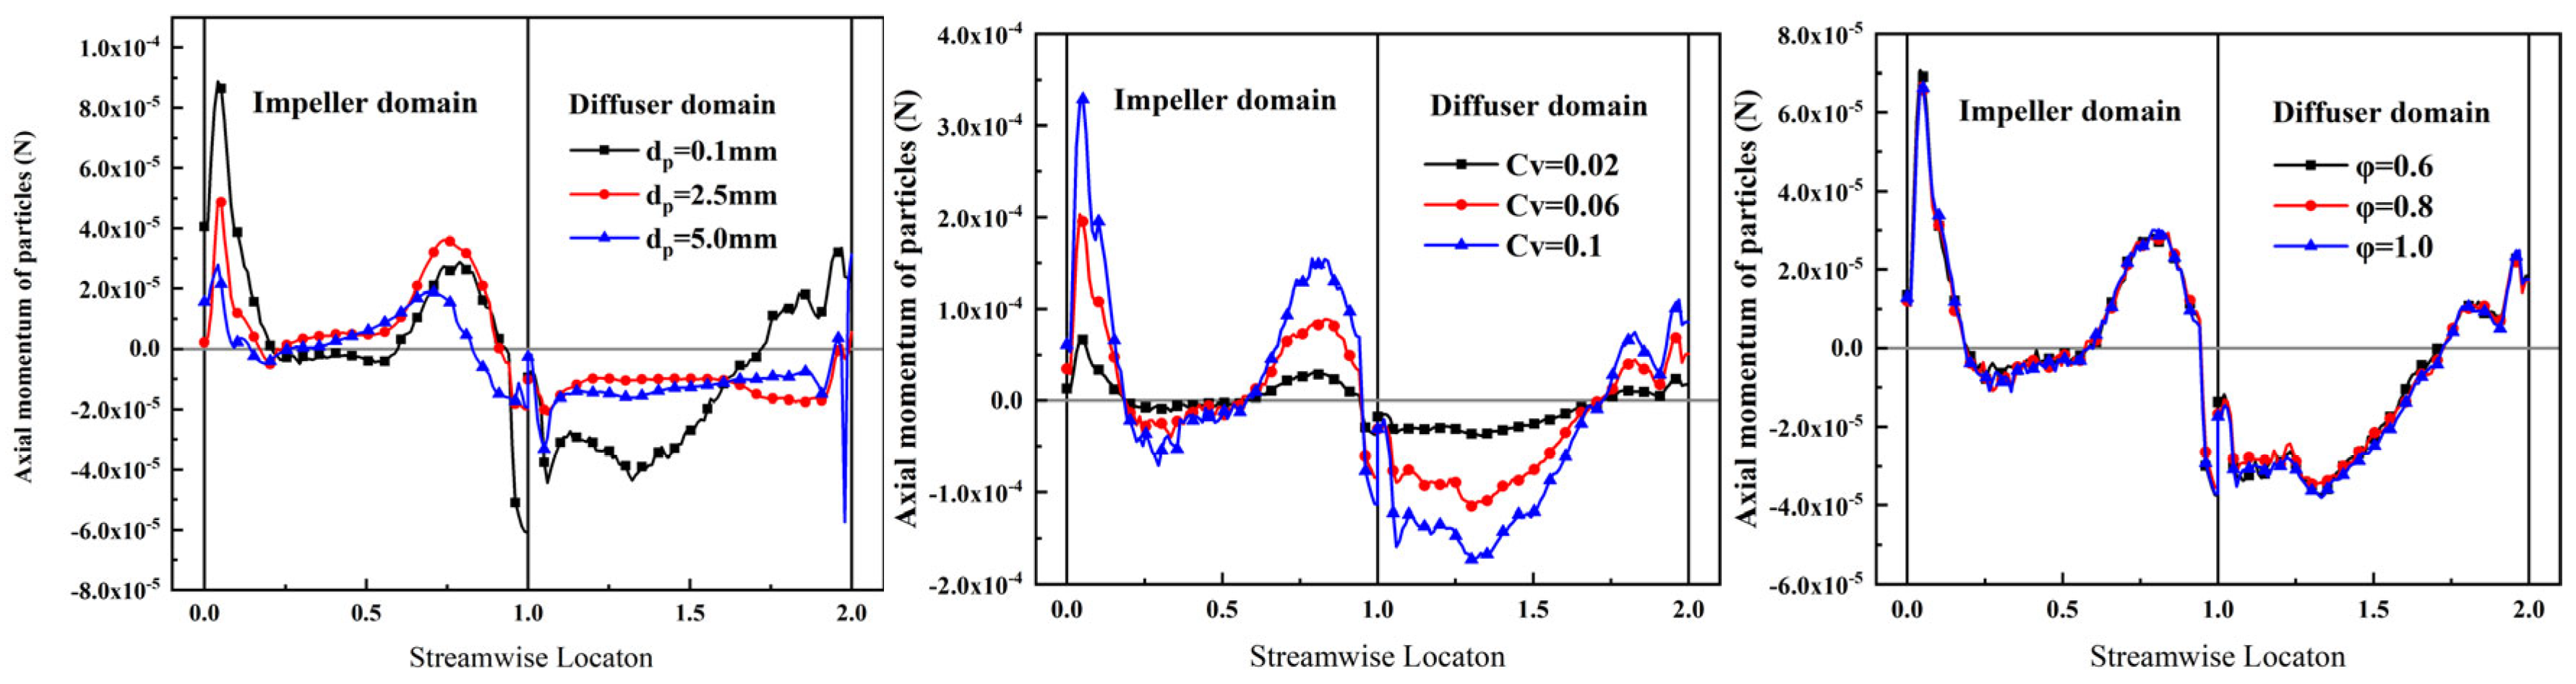
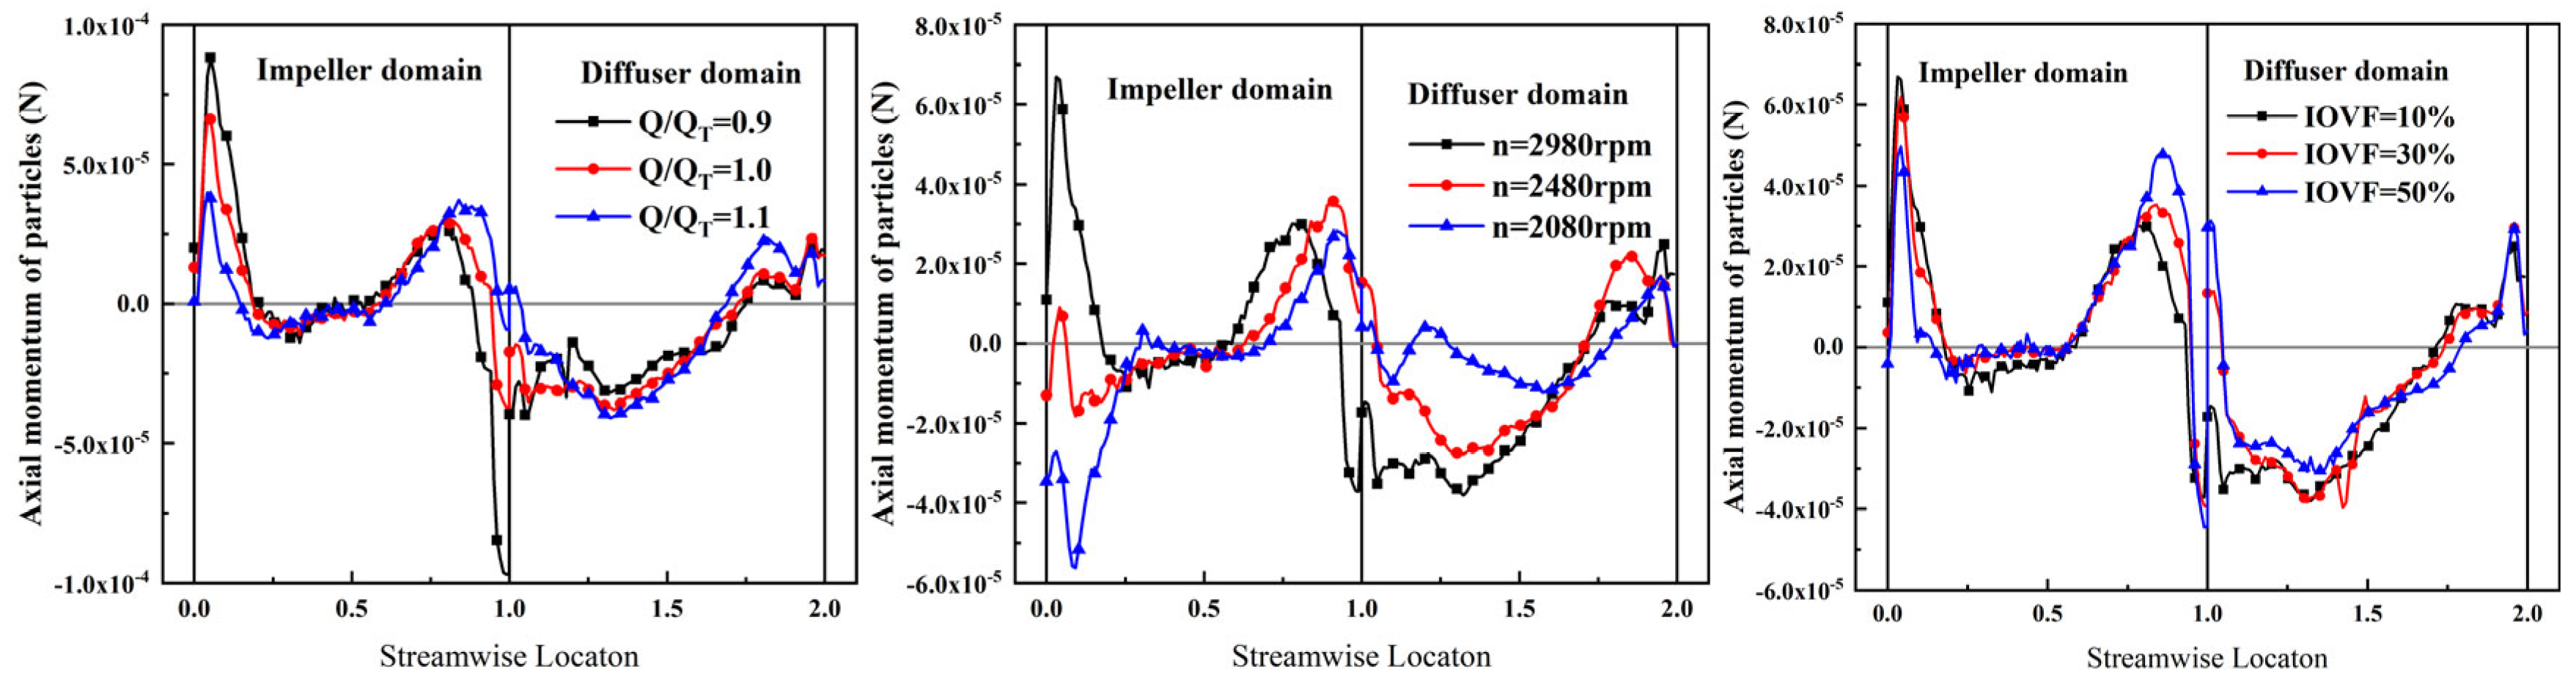
7.2. Axial Momentum of Sand Particle Motion

Figure 14 and Figure 15 illustrate the effects of particle parameters and operational parameters on particle axial momentum, respectively. Positive axial momentum values indicate particles experience a drag force toward the flow channel outlet, while negative values represent forces directed toward the inlet. The results reveal similar axial momentum variation trends across all operating conditions: particle axial momentum peaks at the impeller inlet, rapidly decreases to near zero, then gradually rises to a secondary peak in the latter half of the impeller before declining again. Upon entering the guide vanes, particle axial momentum remains negative through approximately the first three-quarters of the flow path, only becoming positive near the guide vane outlet.
However, different parameters exert distinct influences on axial momentum characteristics. Regarding particle diameter effects, axial momentum initially increases then decreases with larger diameters, exhibiting monotonic variations only at the impeller inlet and within the guide vanes. Particle concentration demonstrates positive correlation with axial momentum, where higher concentrations yield greater momentum values throughout the flow path, while particle shape shows negligible impact. Under varying flow rate conditions, off-design flows amplify both positive momentum in the impeller and negative momentum in the guide vanes. Rotational speed variations induce multiple effects: at the impeller inlet, particle momentum shifts from positive to negative as speed decreases, suggesting potential blockage risks during low-speed operation; in the impeller’s rear section, the axial momentum peak shifts toward the outlet with reduced speed, indicating particles require longer travel distances to gain sufficient energy and become more prone to accumulation; within guide vanes, negative momentum values approach zero as reduced rotational speed weakens vortex intensity, facilitating particle discharge. Finally, increased oil content elevates axial momentum values at the rotor–stator interface while slightly reducing negative momentum in the guide vanes.

8. Characteristics of Sand Particle Distribution in Vane-Type Multiphase Pumps

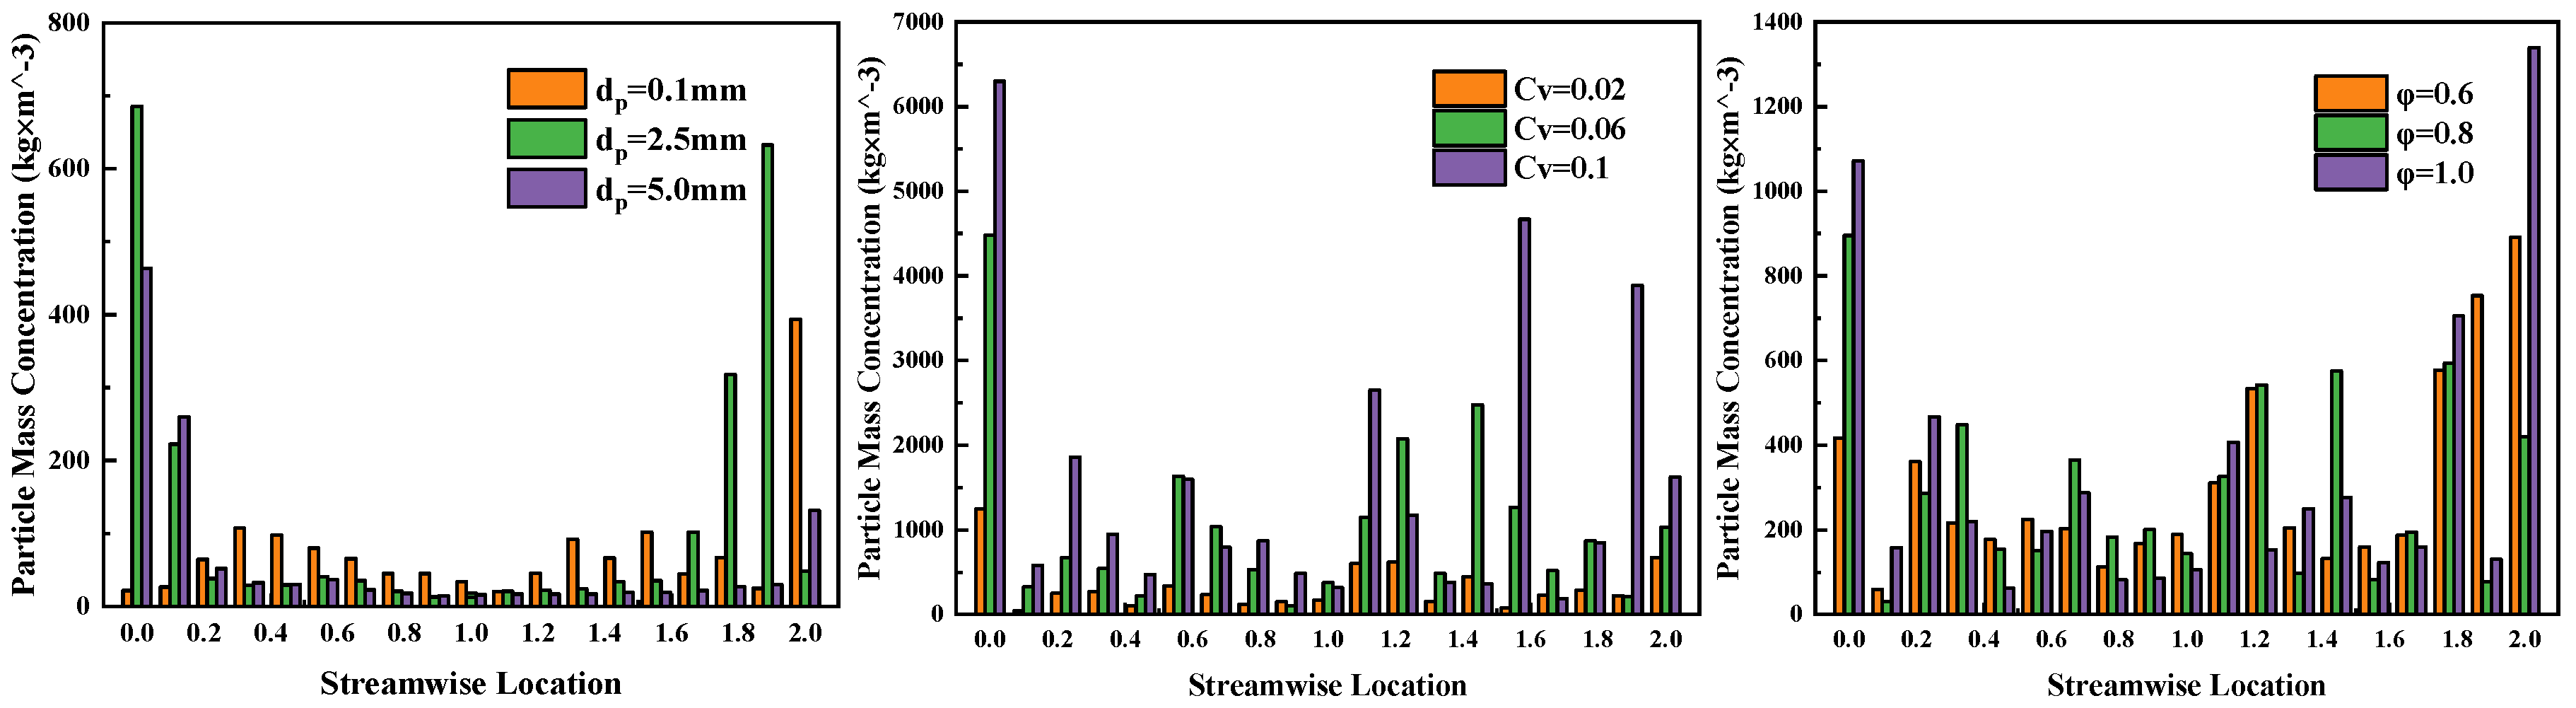
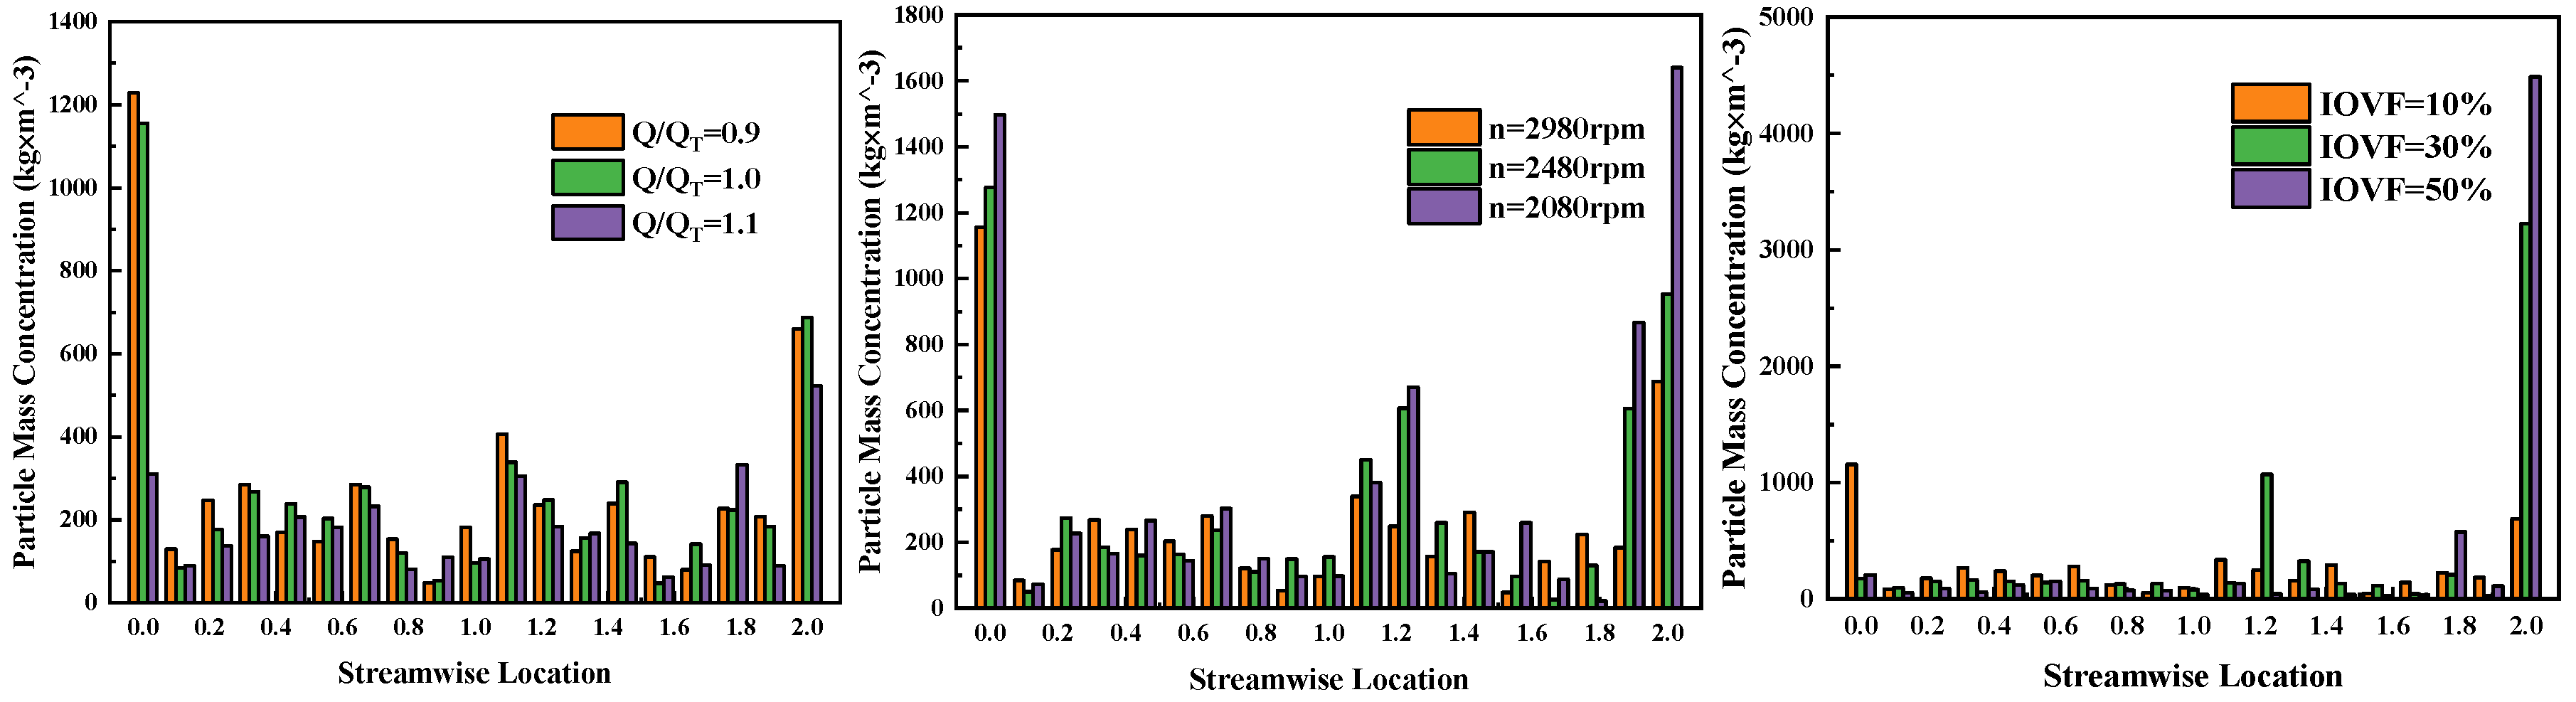
8.1. Sand Particle Mass Concentration Distribution in Flow Passage

Building upon the investigation of solid–liquid flow fields and particle momentum characteristics in the mixed-flow pump, this section presents the particle distribution patterns, focusing specifically on mass concentration and diameter distributions. The analysis reveals that lower particle mass concentration within the flow passages indicates fewer particles and consequently better solid-transport performance.
Figure 16 demonstrates that under different particle diameters, sand particles primarily accumulate near the inlet and outlet regions. Larger particles exhibit higher mass concentrations at the inlet, while smaller particles show greater concentrations at the outlet. Furthermore, increasing the inlet particle concentration leads to elevated mass concentrations throughout key regions—impeller inlet, impeller passage, rotor–stator interface, and guide vane passage—with the most significant particle accumulation occurring in the guide vane section.
Regarding particle shape effects, spherical particles demonstrate superior transport performance, as evidenced by their substantially lower mass concentration within the flow passages. However, some particle accumulation persists at the inlet even for spherical particles.
Figure 17 presents the effects of various operating parameters on sand particle mass concentration distribution within the mixed-flow pump. The results demonstrate three key trends: (1) Under varying flow conditions, when the flow rate exceeds the design specification, the particle mass concentration decreases rapidly, indicating enhanced particle transport capability in high-flow conditions; conversely, at below-design flow rates, significantly higher particle concentrations accumulate in the front section of guide vane passages, further confirming the critical role of flow rate in particle transport efficiency. (2) For rotational speed variations, reduced speeds cause substantial increases in particle mass concentration at three critical locations: impeller inlet, guide vane inlet, and guide vane outlet. (3) Regarding oil concentration effects, increasing oil content elevates fluid viscosity, which simultaneously weakens vortex intensity in the flow field while strengthening fluid drag forces on particles—this dual mechanism ultimately improves particle transport out of the flow passages.

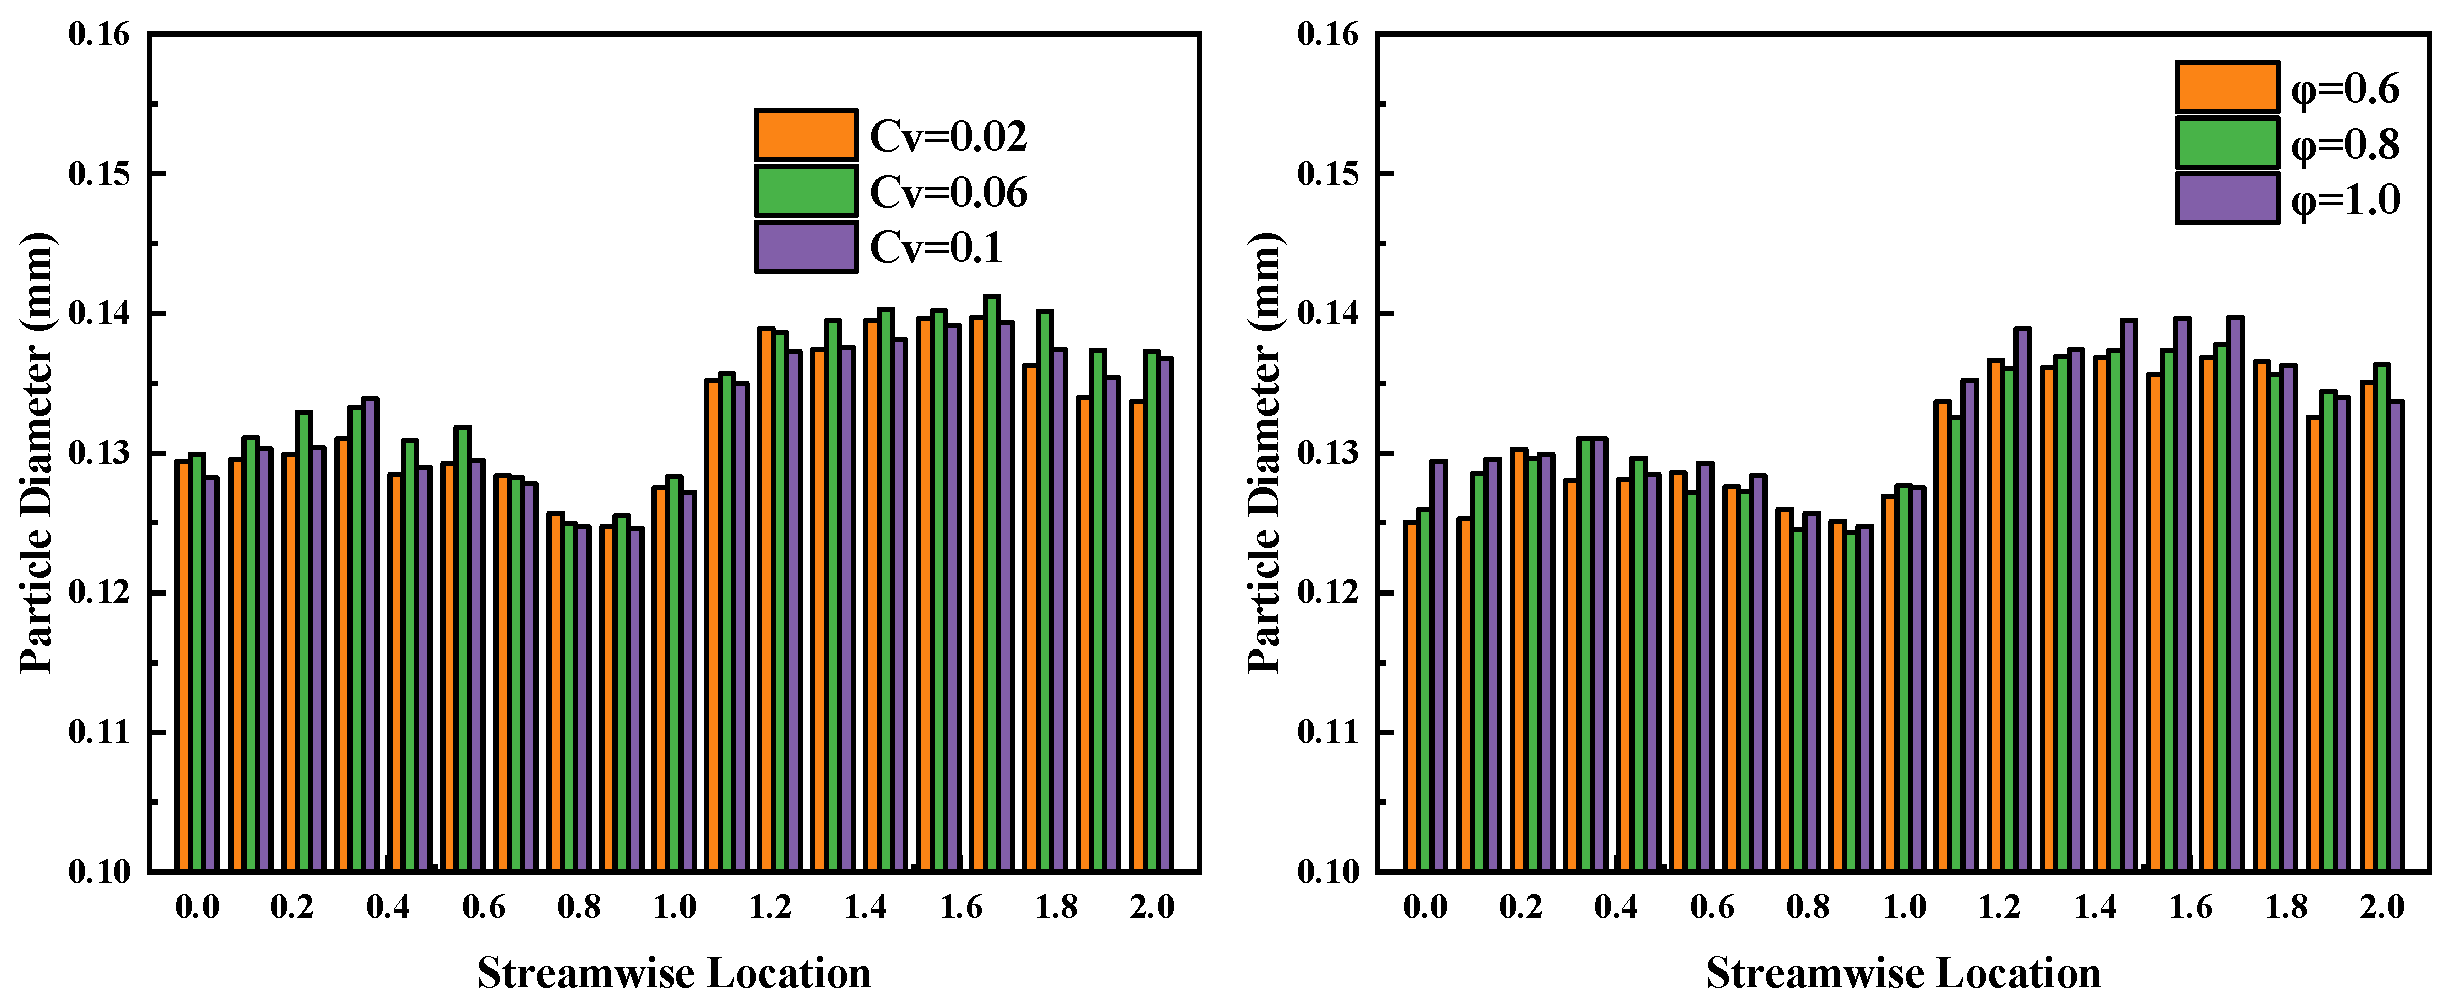
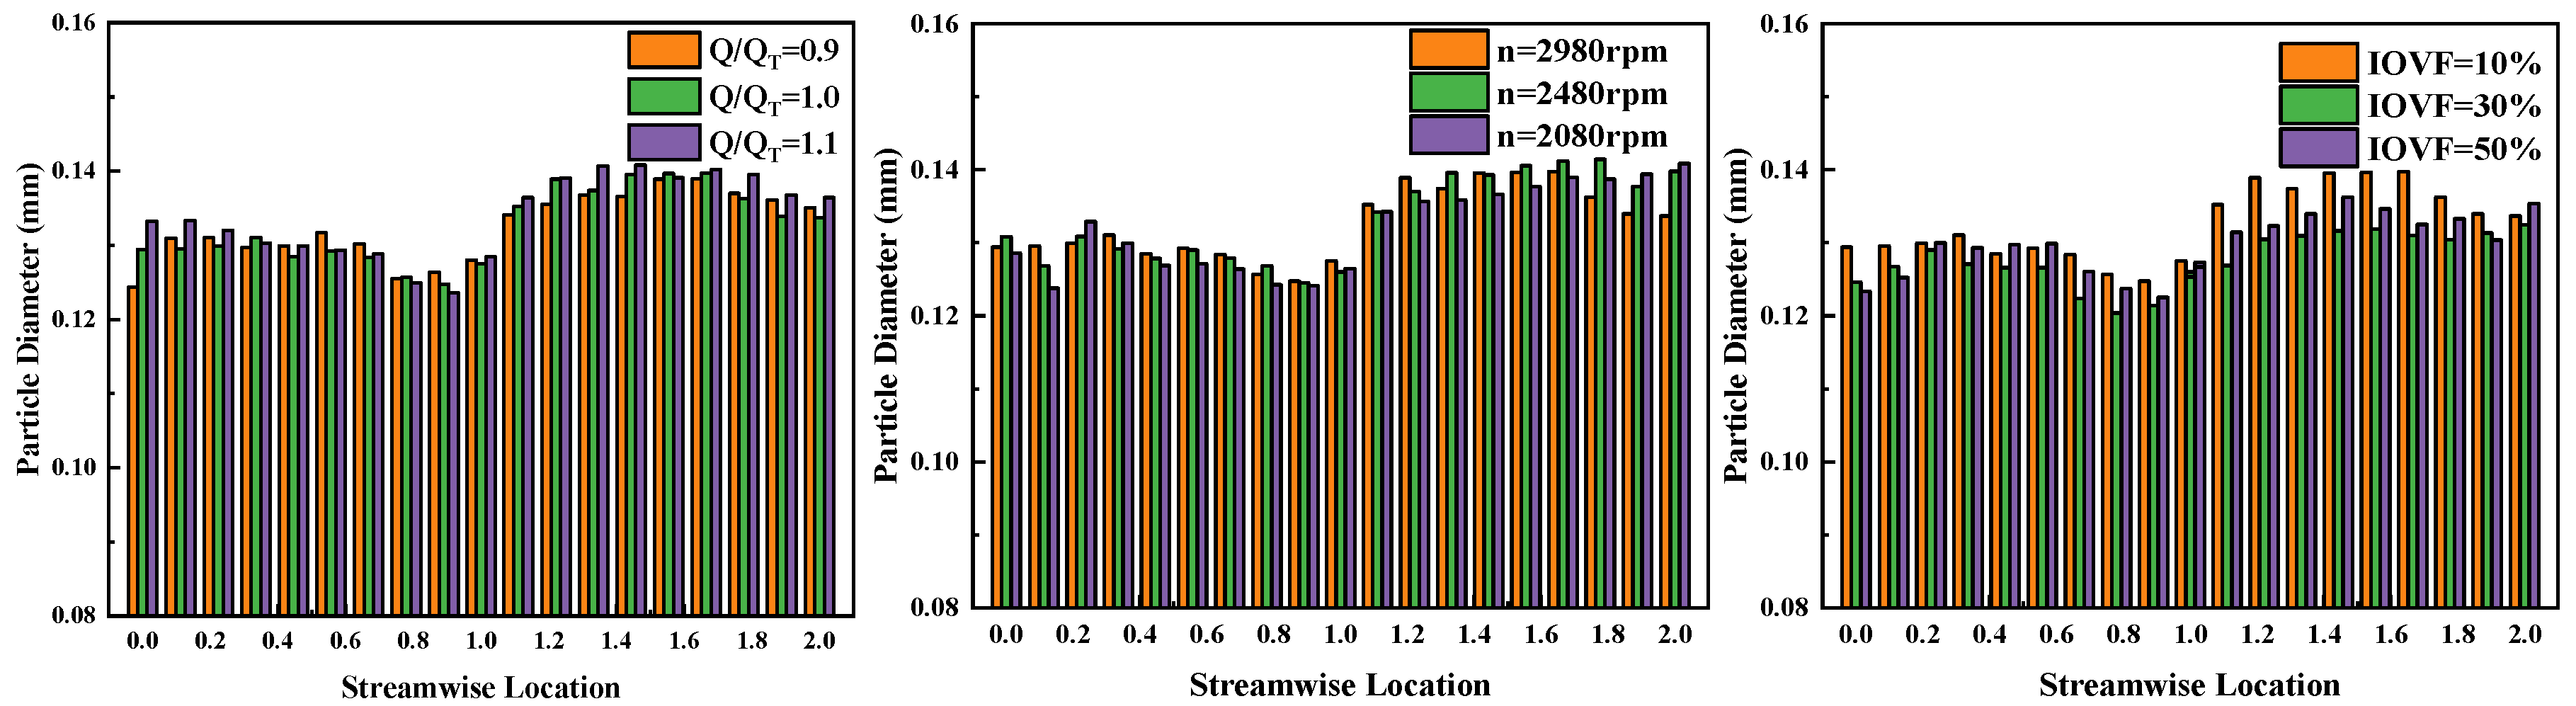
8.2. Distribution of Mean Sand Particle Diameter in Flow Passage

To analyze the average particle diameter distribution within the flow passages, we extracted streamwise-averaged particle diameter data and plotted the corresponding histograms for various operating conditions in Figure 18 and Figure 19. The results in Figure 18 reveal two significant trends: (1) Increasing the inlet particle concentration leads to notably larger particle sizes within the flow passages, with particularly pronounced growth observed in the front half of the impeller and the rear section of the guide vanes; (2) Particle shape variations demonstrate that non-spherical particles exhibit substantially reduced average diameters throughout the flow passages compared to their spherical counterparts.
Figure 19 demonstrates three key trends regarding particle diameter distribution under varying operational parameters: (1) Flow rate effects—both the impeller inlet and front section of guide vanes show increased average particle diameters with higher flow rates, while other flow passage regions exhibit larger diameters under off-design conditions; (2) Rotational speed effects—reduced speeds decrease average diameters in the impeller passage, yet paradoxically increase diameters near the guide vane outlet; (3) Oil concentration effects—increasing oil content reduces average particle diameters throughout the pump, with the most significant reductions occurring at the impeller inlet and front section of the guide vanes.

9. Conclusions

This paper studies the flow characteristics of vane-type multiphase pumps transporting solid–liquid two-phase flow and investigates particle motion and distribution. It mainly analyzes the effects of different particle parameters and operating conditions on solid–liquid phase trajectories, particle motion characteristics, particle momentum, particle mass concentration, and particle diameter distributions. The main conclusions are as follows:
(1) For different particle diameters, the phase trajectory coincidence is relatively low with notable differences in particle dynamics and distinct vortex distribution patterns in the flow passages. In contrast, variations in particle concentration and shape demonstrate minimal influence on phase trajectories, particle behavior, and vortex distribution. Under off-design flow conditions, the inlet jet flow substantially alters particle trajectories, modifies particle dynamics, and significantly affects vortex formation. As rotational speed decreases, the coincidence between particle and liquid phase trajectories increases while particle dynamics weaken, with vortex intensity initially strengthening then diminishing. With increasing oil content, particle trajectories become nearly identical to the liquid phase, accompanied by a substantial reduction in both particle dynamics and vortex intensity throughout the flow passages. These findings demonstrate the complex interplay between particle characteristics and operational parameters in governing multiphase flow behavior.
(2) The investigation demonstrates that particle concentration exhibits a positive correlation with radial momentum, while particle shape shows negligible influence. Increased flow rate, higher rotational speed, and reduced oil content collectively enhance fluid kinetic energy, resulting in greater fluctuations in the radial momentum curves within the impeller. The radial momentum profiles under various particle and operational parameters display multiple pronounced peaks and troughs in the impeller region, while remaining essentially negligible throughout the guide vanes. Axial momentum follows a non-monotonic relationship with particle diameter, initially increasing before decreasing, while maintaining a strictly increasing trend with particle concentration. Particle shape again proves insignificant for axial momentum characteristics. Off-design flow conditions amplify positive axial momentum in the impeller while concurrently intensifying negative values in the guide vanes. Rotational speed variations induce critical behavioral changes: the impeller inlet momentum transitions from positive to negative values with decreasing speed, and the axial momentum peak in the rear impeller section shifts toward the outlet. Increased oil content elevates axial momentum at the rotor–stator interface while moderately attenuating negative momentum in the guide vanes. These parametric interactions underscore the complex momentum transfer mechanisms governing solid–liquid flows in rotating machinery.
(3) The increase in sand particle concentration leads to elevated mass concentrations at the impeller inlet, impeller flow passages, rotor–stator interface, and guide vane channels. Particularly in the guide vane passages, the particle concentration shows the most significant rise, reaching a peak value of 6260 kg/m3. Spherical particles show lower mass concentration within the flow passage but accumulate at the inlet. As rotational speed decreases, the particle mass concentration increases substantially at the pump impeller inlet, guide vane inlet, and guide vane outlet. With increasing oil content, the fluid viscosity gradually rises, enhancing the drag force on particles and enabling more particles to be transported out of the flow passage. Higher inlet particle concentration results in larger particle sizes within the flow passage, particularly in the front half of the impeller and the rear half of the guide vane. Non-spherical particles exhibit significantly smaller particle sizes in the flow passage. At the impeller inlet, particle diameter increases with higher flow rates, and the same trend is observed in the front half of the guide vane passage. As rotational speed decreases, particle diameter in the impeller passage decreases noticeably, but closer to the guide vane outlet, particle diameter becomes larger at lower speeds. Increasing oil content reduces particle diameter within the pump flow passage.
The findings of this study provide critical guidance for both the redesign of vane-type multiphase pumps and the investigation of blade wear mechanisms, thereby offering valuable references and empirical insights for subsequent multiphase pump design optimization.

Author Contributions

Data curation, C.W. and Y.L.; formal analysis, C.W. and H.W.; methodology, W.L.; Software, C.W. and Y.L.; validation, G.S.; writing—original draft, C.W., G.S. and H.W.; writing—review and editing, C.W., G.S., Y.L. and W.L.; Conceptualization, G.S. All authors have read and agreed to the published version of the manuscript.

Funding

This research was funded by Sichuan Natural Science Foundation Outstanding Youth Science Foundation (2024NSFJQ0012), Key project of Regional Innovation and Development Joint Fund of National Natural Science Foundation (U23A20669), Sichuan Science and Technology Program (2022ZDZX0041).

Data Availability Statement

The original contributions presented in this study are included in the article. Further inquiries can be directed to the corresponding author.

Conflicts of Interest

The authors declare no conflict of interest.

References

  1. Rajkumar, Y.; Shirazi, S.A.; Karimi, S. Effect of pipe size on erosion measurements and predictions in liquid-dominated multiphase flows for the elbows. Wear 2023, 523, 204797. [Google Scholar] [CrossRef]
  2. Othayq, M.M.; Bilal, F.S.; Sedrez, T.A.; Shirazi, S.A. Experimental and numerical assessments on solid particle erosion in upward vertical-horizontal and horizontal-vertical downward elbows for multiphase and gas-sand flows. Wear 2023, 524, 204812. [Google Scholar] [CrossRef]
  3. Espinoza-Jara, A.; Walczak, M.; Brevis, W.; Messa, G.V. Erosion by turbulence: Discovering the counter-wise vortex events and their effect on wear. Wear 2023, 530–531, 1–12. [Google Scholar] [CrossRef]
  4. Shi, B.; Xue, K.; Pan, J.; Zhang, X.; Ying, R.; Wu, L.; Zhang, Y. Liquid/solid flow field in a centrifugal pump with different impeller blade types by PIV. Meas. Control 2021, 54, 1219–1233. [Google Scholar] [CrossRef]
  5. Kang, C.; Li, Q.; Li, M.; Teng, S. Deposition of solid particles exposed to the suction of dual pumps in the tank of a pumping station. Powder Technol. 2020, 361, 727–738. [Google Scholar] [CrossRef]
  6. Wang, K.; Hu, J.; Liu, H.; Zhang, Z.; Zou, L.; Lu, Z. Research on the Deposition Characteristics of Integrated Prefabricated Pumping Station. Symmetry 2020, 12, 760. [Google Scholar] [CrossRef]
  7. Wang, P.; Zhu, X.; Li, Y. Analysis of Flow and Wear Characteristics of Solid-Liquid Two-Phase Flow in Rotating Flow Channel. Processes 2020, 8, 1512. [Google Scholar] [CrossRef]
  8. Chen, Y.; Xiong, H.; Cheng, H.; Yu, C.; Xie, J. Effect of particle motion on the hydraulic collection of coarse spherical particles. Acta Mech. Sin. 2020, 36, 72–81. [Google Scholar] [CrossRef]
  9. Hu, Q.; Chen, J.; Deng, L.; Kang, Y.; Liu, S. CFD-DEM Simulation of Backflow Blockage of Deep-Sea Multistage Pump. J. Mar. Sci. Eng. 2021, 9, 987. [Google Scholar] [CrossRef]
  10. Calderón-Hernández, J.W.; Sinatora, A.; de Melo, H.G.; Chaves, A.P.; Mano, E.S.; Filho, L.S.L.; Paiva, J.L.; Braga, A.S.; Pinto, T.C.S. Hydraulic convey of iron ore slurry: Pipeline wear and ore particle degradation in function of pumping time. Wear 2020, 450–451, 1–13. [Google Scholar] [CrossRef]
  11. Wydrych, J. Comparative analysis of the methods of simulation of flow in boiler dust systems. Chem. Process Eng. Inz. Chem. I Proces. 2010, 31, 603–623. [Google Scholar]
  12. Bukreev, F.; Raichle, F.; Nirschl, H.; Krause, M.J. Simulation of adsorption processes on moving particles based on an Euler-Euler description using a lattice Boltzmann discretization. Chem. Eng. Sci. 2023, 270, 118485. [Google Scholar] [CrossRef]
  13. Tarodiya, R.; Gandhi, B.K. Numerical simulation of a centrifugal slurry pump handling solid-liquid mixture: Effect of solids on flow field and performance. Adv. Powder Technol. 2019, 30, 2225–2239. [Google Scholar] [CrossRef]
  14. Peng, G.; Huang, X.; Zhou, L.; Zhou, G.; Zhou, H. Solid-liquid two-phase flow and wear analysis in a large-scale centrifugal slurry pump. Eng. Fail. Anal. 2020, 114, 104602. [Google Scholar] [CrossRef]
  15. Wang, X.; Xiao, Y. Research of the Gas-solid Flow Character Based on the DEM Method. J. Therm. Sci. 2011, 20, 521–526. [Google Scholar] [CrossRef]
  16. Geng, F.; Luo, G.; Zhou, F.; Zhao, P.; Ma, L.; Chai, H.; Zhang, T. Numerical investigation of dust dispersion in a coal roadway with hybrid ventilation system. Powder Technol. 2017, 313, 260–271. [Google Scholar] [CrossRef]
  17. Seidel, T.; Krishnamoorthy, G.; Seames, W.S. Characterizing flame stability and radiative heat transfer in non-swirling oxy-coal flames using different multiphase modeling frameworks. Fuel 2019, 256, 115948. [Google Scholar] [CrossRef]
  18. Pandey, B.; Prajapati, Y.K.; Sheth, P.N. CFD analysis of the downdraft gasifier using species-transport and discrete phase model. Fuel 2022, 328, 125302. [Google Scholar] [CrossRef]
  19. Li, L.; Liu, C.; Li, W.; Chen, W.; Zhu, H.; Xu, W. Numerical research on the particle transport and deposition in the impingement-film cooling passage. Phys. Fluids 2023, 35, 053302. [Google Scholar]
  20. Ren, W.; Zhang, X.; Zhang, Y.; Li, P.; Lu, X. Investigation of particle size impact on dense particulate flows in a vertical pipe. Phys. Fluids 2023, 35, 073302. [Google Scholar]
  21. Hong, S.; Hu, X. Influence of Different Particle Parameters and Operating Conditions on Flow Characteristics and Performance of Deep-Sea Mining Pump. J. Mar. Sci. Eng. 2022, 10, 363. [Google Scholar] [CrossRef]
  22. Song, X.; Qi, D.; Xu, L.; Shen, Y.; Wang, W.; Wang, Z.; Liu, Y. Numerical Simulation Prediction of Erosion Characteristics in a Double-Suction Centrifugal Pump. Processes 2021, 9, 1483. [Google Scholar] [CrossRef]
  23. Bueno AH, S.; Solis, J.; Zhao, H.; Wang, C.; Simões, T.A.; Bryant, M.; Neville, A. Tribocorrosion evaluation of hydrogenated and silicon DLC coatings on carbon steel for use in valves, pistons and pumps in oil and gas industry. Wear 2018, 394, 60–70. [Google Scholar] [CrossRef]
  24. Luo, K.; Wang, Y.; Liu, H.; Dular, M.; Chen, J.; Zhang, Z. Effect of Coating Thickness on a Solid-Liquid Two-Phase Flow Centrifugal Pump under Water Medium. Stroj. Vestn.-J. Mech. Eng. 2019, 65, 251–261. [Google Scholar] [CrossRef]
  25. Tang, C.; Kim, Y.J. CFD-DEM Simulation for the Distribution and Motion Feature of Solid Particles in Single-Channel Pump. Energies 2020, 13, 4988. [Google Scholar] [CrossRef]
  26. Gu, Y.; Liu, N.; Mou, J.; Zhou, P.; Qian, H.; Dai, D. Study on solid-liquid two-phase flow characteristics of centrifugal pump impeller with non-smooth surface. Adv. Mech. Eng. 2019, 11, 1–12. [Google Scholar] [CrossRef]
  27. Gu, Y.; Yan, M.; Yu, J.; Xia, K.; Ma, L.; Mou, J.; Wu, D.; Tang, J. Effect of the Bionic Circular Groove Non-Smooth Structure on the Anti-Wear Performance of the Two-Vane Pump. Lubricants 2022, 10, 231. [Google Scholar] [CrossRef]
  28. Xu, H.L.; Chen, W.; Xu, C. Cavitation performance of multistage slurry pump in deep-sea mining. AIP Adv. 2019, 9, 105024. [Google Scholar] [CrossRef]
  29. Zhang, C.; Xu, S.; Yu, P. Numerical analysis of the effects of gas-phase properties on the internal characteristics and wear in a centrifugal pump. Aquac. Eng. 2020, 91, 102126. [Google Scholar] [CrossRef]
  30. Tao, Y.; Bai, Y.; Wu, Y. Influence of Blade Thickness on Solid-Liquid Two-Phase Flow and Impeller Wear in a Ceramic Centrifugal Slurry Pump. Processes 2021, 9, 1259. [Google Scholar] [CrossRef]
  31. Peng, G.; Chen, Q.; Bai, L.; Hu, Z.; Zhou, L.; Huang, X. Wear mechanism investigation in a centrifugal slurry pump impeller by numerical simulation and experiments. Eng. Fail. Anal. 2021, 128, 105637. [Google Scholar] [CrossRef]
  32. Ouyang, T.; Shen, Y.; Lei, W.; Xu, X.; Liang, L.; Waqar, H.S.; Lin, B.; Tian, Z.Q.; Shen, P.K. Reduced friction and wear enabled by arc-discharge method-prepared 3D graphene as oil additive under variable loads and speeds. Wear 2020, 462–463, 203495. [Google Scholar] [CrossRef]
  33. Meibohm, J.; Pistone, L.; Gustavsson, K.; Mehlig, B. Relative velocities in bidisperse turbulent suspensions. Phys. Rev. E 2017, 96, 061102. [Google Scholar] [CrossRef] [PubMed]
Figure 1. The real machine of Vane-type Multiphase Pump.
Jmse 13 01034 g001
Figure 2. Fluid domain model.
Jmse 13 01034 g002
Figure 3. The grid of fluid domain.
Jmse 13 01034 g003
Figure 4. Test system.
Jmse 13 01034 g004
Figure 5. Performance test results of multiphase pumping system.
Jmse 13 01034 g005
Figure 6. Two-phase flow trajectories under different sand particle parameters.
Jmse 13 01034 g006
Figure 7. Two-phase flow trajectories under different flow rates.
Jmse 13 01034 g007
Figure 8. Two-phase trajectories at different speeds.
Jmse 13 01034 g008
Figure 9. Two-phase flow trajectories at different oil saturations.
Jmse 13 01034 g009
Figure 10. Variation of C v s l i p and Stokes number along the flow direction with different grit parameters.
Jmse 13 01034 g010
Figure 11. Variation of C v s l i p and Stokes number along the flow direction under different operating parameters.
Jmse 13 01034 g011
Figure 12. Radial momentum of sand particles along the flow direction under different sand particle parameters.
Jmse 13 01034 g012
Figure 13. Distribution of radial momentum of sand particles along the flow direction under different operating parameters.
Jmse 13 01034 g013
Figure 14. Distribution of axial momentum of sand particles along the flow direction under different sand particle parameters.
Jmse 13 01034 g014
Figure 15. Distribution of axial momentum of sand particles along the flow direction under different operating parameters.
Jmse 13 01034 g015
Figure 16. Distribution of sand particle mass concentration under different sand particle parameters.
Jmse 13 01034 g016
Figure 17. Distribution of sand particle concentration under different operating parameters.
Jmse 13 01034 g017
Figure 18. The average sand particle size distribution under different sand particle parameters.
Jmse 13 01034 g018
Figure 19. The average sand particle size distribution under different operating parameters.
Jmse 13 01034 g019
Table 1. Geometric parameters of vane-type multiphase pump.
ImpellerGuide Vane
ParameterSymbolValueSymbolValueUnit
Tip diameterDS234DD234mm
Inlet hub diameterDh1164Dh3182mm
Outlet hub diameterDh2182Dh4164mm
Blade inlet angleβh1s17.8/4.5βh3s30°
Blade outlet angleβh2s228/20βh4s435°
Axial lengthLI90LD92mm
Number of bladesBI3BD11
Table 2. Calculation condition table.
Test ConditionValueTest ConditionValueTest ConditionValue
Particle diameter (dp)0.1 mmSand concentration (Cv)2%Particle sphericity (φ)0.6
2.5 mm6%0.8
5.0 mm10%1.0
Flow rate (Q/QT)0.9QRotational speed (n)2080 rpmOil content (IOVF)10%
1.0Q2480 rpm30%
1.1Q2980 rpm50%
Table 3. Pre-process characteristics.
ItemValue/Method
Solver TypePressure-based
Inlet Boundary Condition2.54 m/s
Outlet Boundary Condition0.3 Mpa
Particle Size Distribution:
Rosin-Rammler (RR) Distribution
Y d = e d 0.4 2.53 Y d : Fraction, d: Particle Diameter
Particle Velocity2.54 m/s
Inlet/Outlet BoundariesEscape
Other WallsReflect
Pressure-Velocity Coupling SchemeSIMPLE
GradientGreen-Gauss cell-based
PressurePRESTO!
Density, Momentum, Turbulent Kinetic Energy, Turbulent Dissipation RateFirst-Order Upwind
GCI10−3
Table 4. Grid independence verification.
Case No.Impeller Mesh (Million)Guide Vane Mesh (Million)Total Mesh (Million)Head (m)Error
Percentage
11.881.233.1135.591
22.171.383.5535.620.0843%
32.361.493.8535.650.169%
42.641.554.1935.720.365%
52.741.674.4135.53−0.169%
62.931.724.6535.610.0562%
Disclaimer/Publisher’s Note: The statements, opinions and data contained in all publications are solely those of the individual author(s) and contributor(s) and not of MDPI and/or the editor(s). MDPI and/or the editor(s) disclaim responsibility for any injury to people or property resulting from any ideas, methods, instructions or products referred to in the content.

