Article

Experimental Study on the Sediment-Trapping Performance of Different Coastal Protection Structures in a High-Tidal Range Area

by
Hao-Nan Hung
1,
Hsin-Hung Chen
2,* and
Ray-Yeng Yang
1,*
1
Department of Hydraulic and Ocean Engineering, National Cheng Kung University, Tainan 701401, Taiwan
2
Tainan Hydraulics Laboratory, National Cheng Kung University, Tainan 709015, Taiwan
*
Authors to whom correspondence should be addressed.
J. Mar. Sci. Eng. 2025, 13(6), 1022; https://doi.org/10.3390/jmse13061022
Submission received: 25 March 2025 / Revised: 14 May 2025 / Accepted: 21 May 2025 / Published: 23 May 2025
(This article belongs to the Special Issue Morphological Changes in the Coastal Ocean)

Abstract

:
This study evaluates the sediment-trapping performance of three coastal protection structures—submerged breakwaters, derosion lattices, and a composite seawall–submerged breakwater system—under monsoon and typhoon wave conditions. Physical model experiments were conducted in a wave basin with a movable-bed setup and variable water levels to simulate high tidal range environments. The results show that all three structures significantly improved sediment retention in the landward region, with the composite system performing best, followed by the submerged breakwaters and derosion lattices. However, in the seaward region, the sediment retention was 55.36% lower with submerged breakwaters and 126.79% lower with the composite system, relative to the no-structure case under monsoon wave conditions. Notably, the derosion lattice was the only structure that consistently achieved greater sediment retention than the no-structure case on both the seaward and landward sides.

1. Introduction

Coastal areas, as transitional zones between the ocean and land, are highly dynamic [1]. With the intensification of global climate change, rising sea levels, and the increasing frequency of extreme weather events, coastal regions are increasingly affected by natural forces such as waves, currents, wind, and rainfall. At the same time, human activities like port construction and land reclamation have altered the dynamic balance of coastlines, causing significant changes in coastal morphology, which may even result in shoreline retreat and land loss, posing major challenges for global coastal protection [2,3].
According to The Manual of Coastal Protection Facilities Planning and Design, coastal protection structures include seawalls, revetments, groins, offshore breakwaters, beach nourishment, artificial bays, and other protective installations. Traditional coastal protection works primarily rely on hard engineering structures, which emphasize linear protection along the coastline, such as the construction of seawalls, revetments, breakwaters, etc. These structures aim to prevent wave overtopping, inhibit seawater intrusion, and reduce land loss. However, hard engineering structures often intensify scouring at the toe of the seawall due to wave reflection, requiring the addition of tetrapods or an increase in seawall height [4,5]. This not only limits public access to the water but also damages the natural coastal landscape.
As our understanding of coastal environments and mechanisms has deepened, hard engineering structures are no longer considered ideal. Instead, soft engineering approaches that create gently sloping beaches and allow the natural dissipation of wave energy are increasingly adopted to mitigate erosion risks, such as beach nourishment and artificial headland bay [6,7,8,9,10].
In recent years, engineering design has increasingly emphasized harmony with the natural environment. Therefore, a coastal protection structure based on the concept of soft engineering approaches—a derosion lattice—has been proposed. A derosion lattice is a highly flexible, high-strength net structure that reduces incoming wave energy through the friction and vibration of polyamide fibers (Figure 1), dissipating the energy over a broader area. It also offers advantages such as low construction cost and ease of installation.
Peng et al. [11] conducted a three-year field experiment in 2009 at Shuangchun Beach in Tainan, Taiwan. The results demonstrated that the derosion lattice effectively reduces wave energy, promotes sediment deposition, prevents coastal erosion, and protects the beach.
Lee et al. [12] conducted a physical model experiment in a two-dimensional wave flume to investigate the coastal profile changes and sediment transport characteristics of an erosive beach under regular wave conditions with a derosion lattice. The experiment focused on sediment deposition patterns around derosion lattice and compared the effects of different hydrodynamic conditions, including wave period, wave steepness, and water level. The analysis indicated that greater wave steepness leads to increased erosion, consistent with findings from previous studies. Furthermore, the experimental results showed that the difference in sand trapping height between setups with and without derosion lattice could reach up to 30%, demonstrating that such structures offer a significant degree of protection for erosive beaches.
Based on previous research, Lu et al. [13] further investigated the effects of various configurations of derosion lattice on cross-section changes and sediment transport characteristics along erosive beaches. The tested configurations included the emerged derosion lattice, submerged derosion lattice, and series derosion lattice. Experimental results indicated that, in most cases, as wave period, wave height, and water level increased, the wave attenuation and turbidity reduction performance of the structures tended to decrease. Compared to the baseline condition without the derosion lattice, the maximum bottom elevation differences behind the structures reached 29%, 24%, and 25%, respectively, while the values in front of the structures reached −16%, −12%, and −13%. Overall, all configurations provided protective effects for erosive beaches, with the submerged and series derosion lattices being particularly effective in mitigating scouring in front of the structures.
Although the sediment-trapping performance of the derosion lattice has been validated through both field observations and two-dimensional flume experiments, no studies to date have conducted comparative investigations in a large-scale wave basin to evaluate the sediment-trapping performance of derosion lattice versus conventional hard engineering structures in the sediment-trapping performance.
To address this gap, this study conducted physical model experiments to evaluate the sediment-trapping performance of hard engineering structures (submerged breakwater and seawall) and soft engineering approaches (derosion lattice), and to observe the localized scour phenomena induced by these structures, thereby providing a foundational reference for future engineering design and practical applications. To enhance the realism of the simulations, variable water levels were used to simulate actual tidal fluctuations, a design rarely adopted in previous experimental studies and still worthy of further exploration.
Therefore, this study utilizes a wave basin at the Tainan Hydraulics Laboratory, National Cheng Kung University (THL), to simulate tidal fluctuations using variable water levels and to examine sediment deposition patterns under irregular wave action. Four structural configurations were tested: (1) no structure, (2) submerged breakwaters, (3) derosion lattices, and (4) a composite seawall–submerged breakwater system. Changes in seabed morphology were analyzed based on bed elevation measurements taken before and after the tests. The design rationale and configuration of each structure are detailed in the following section.

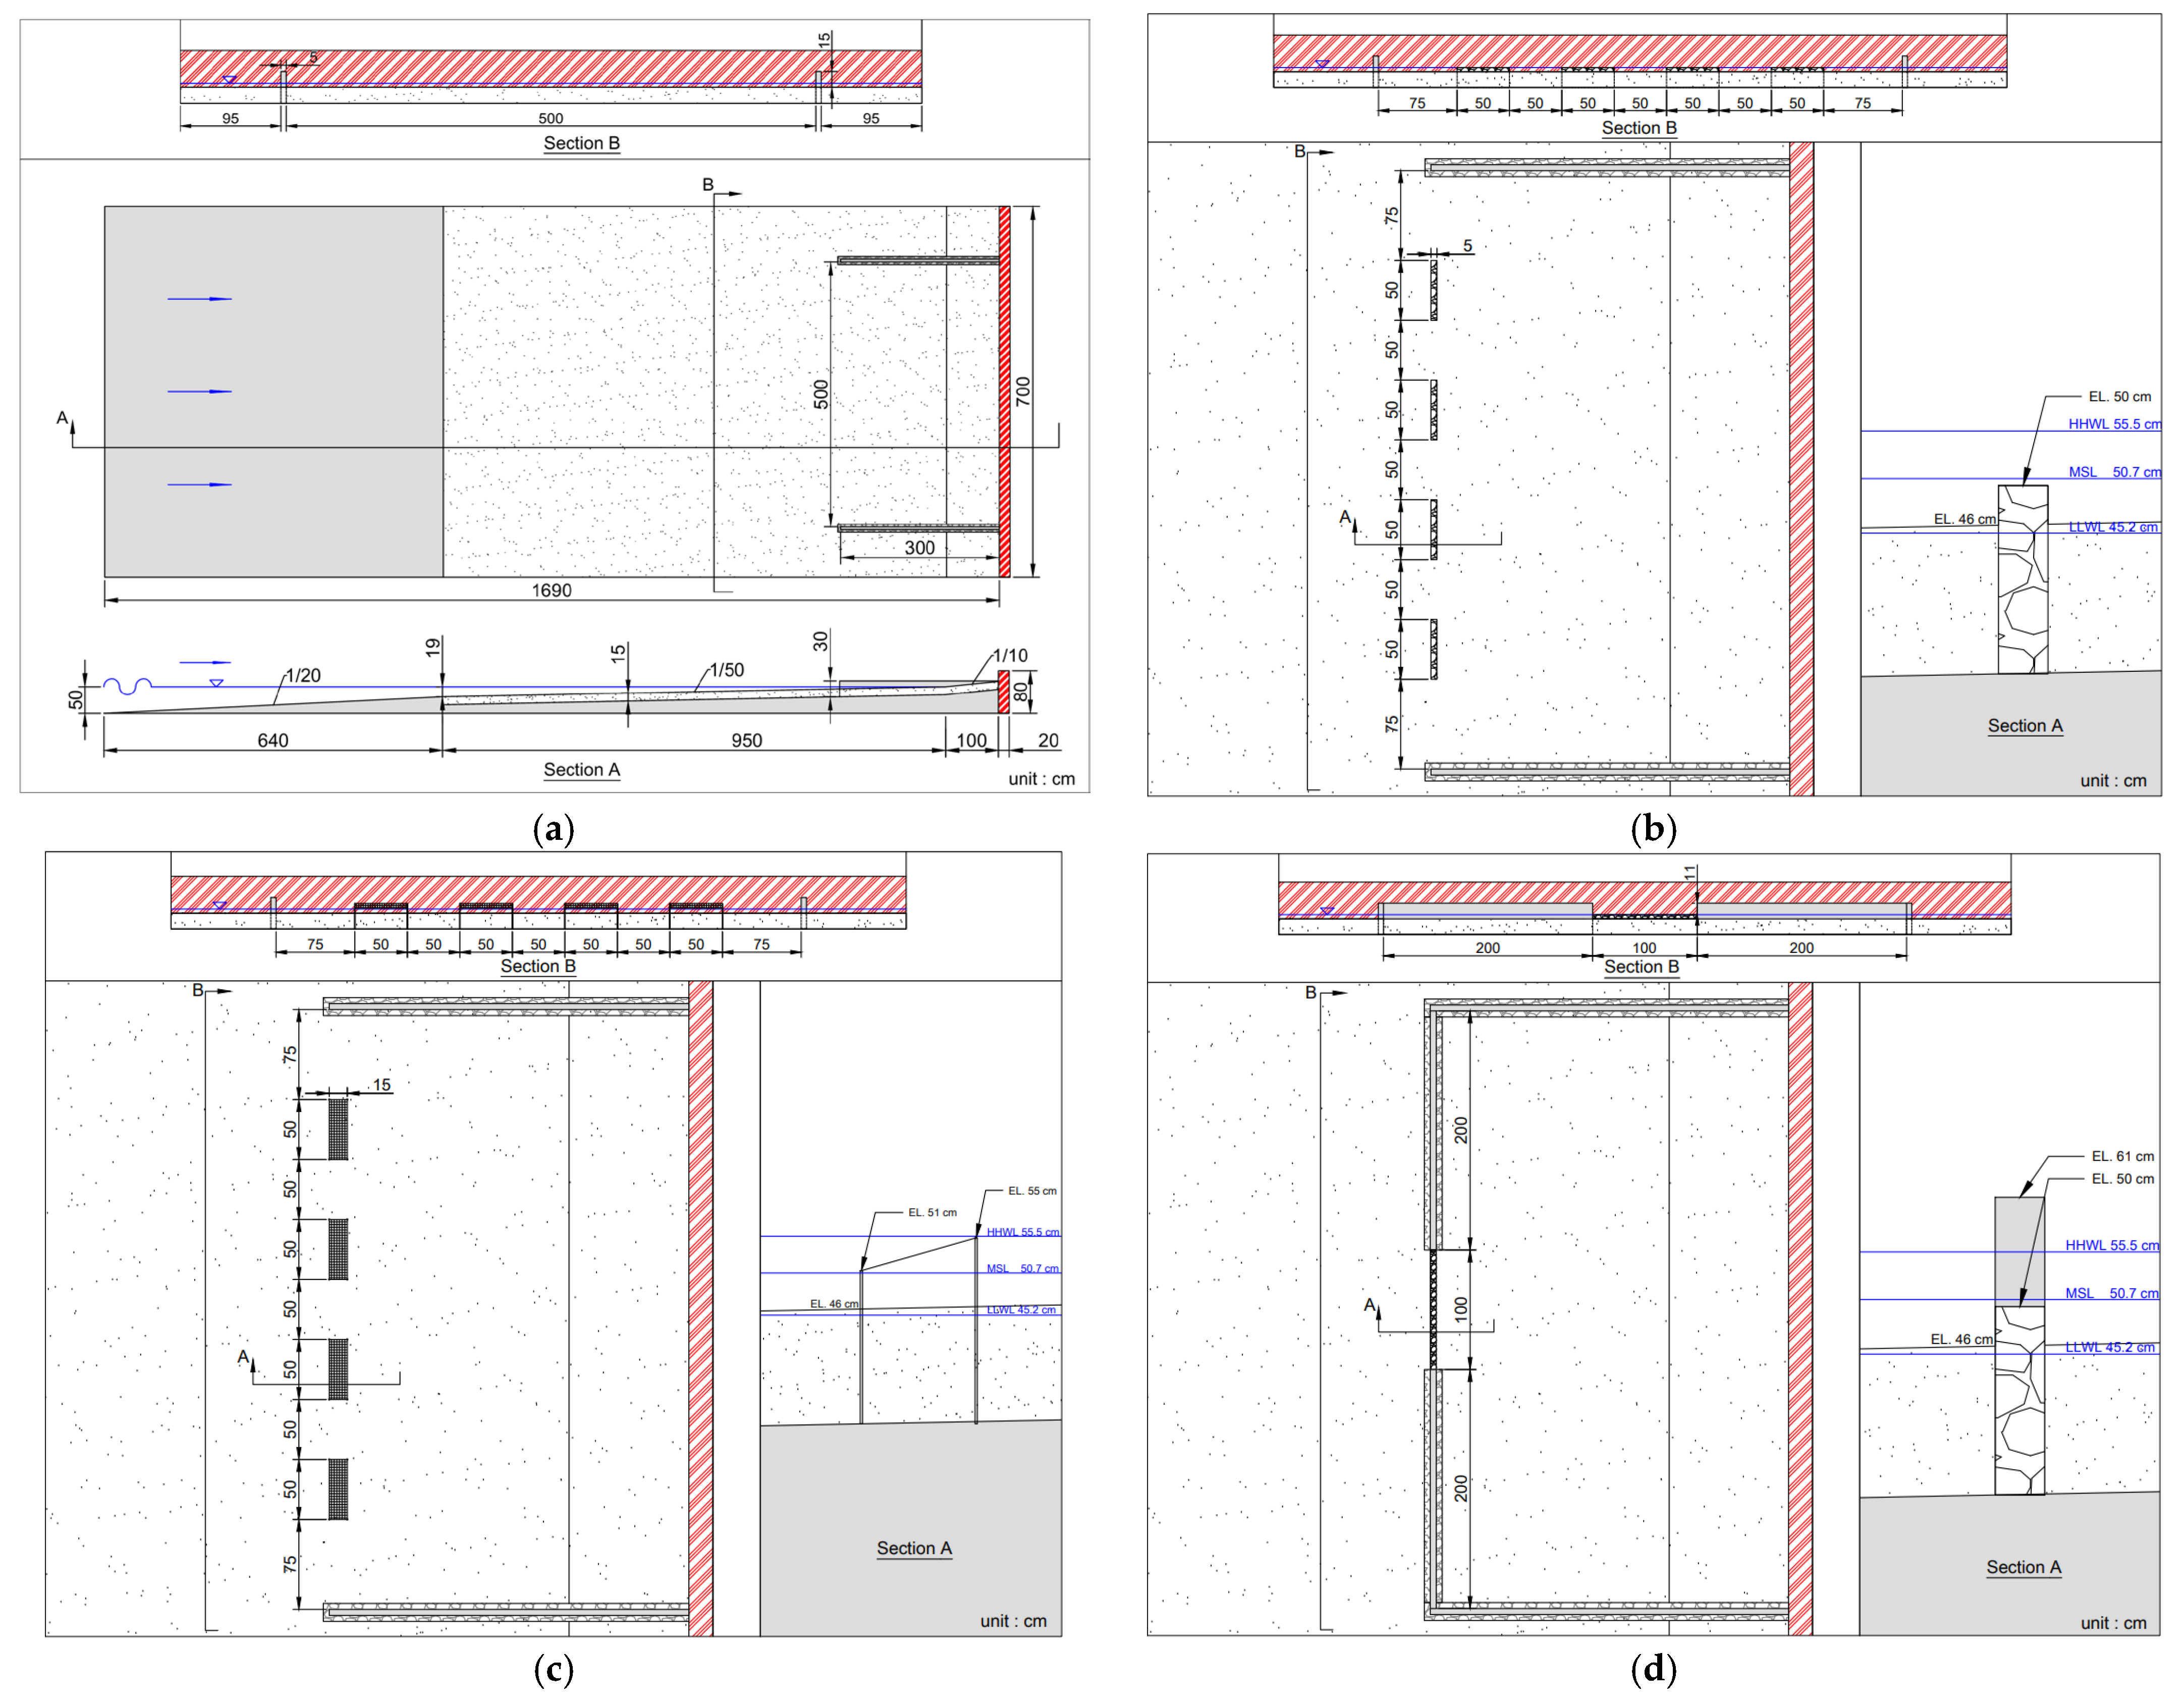
2. Materials and Methods

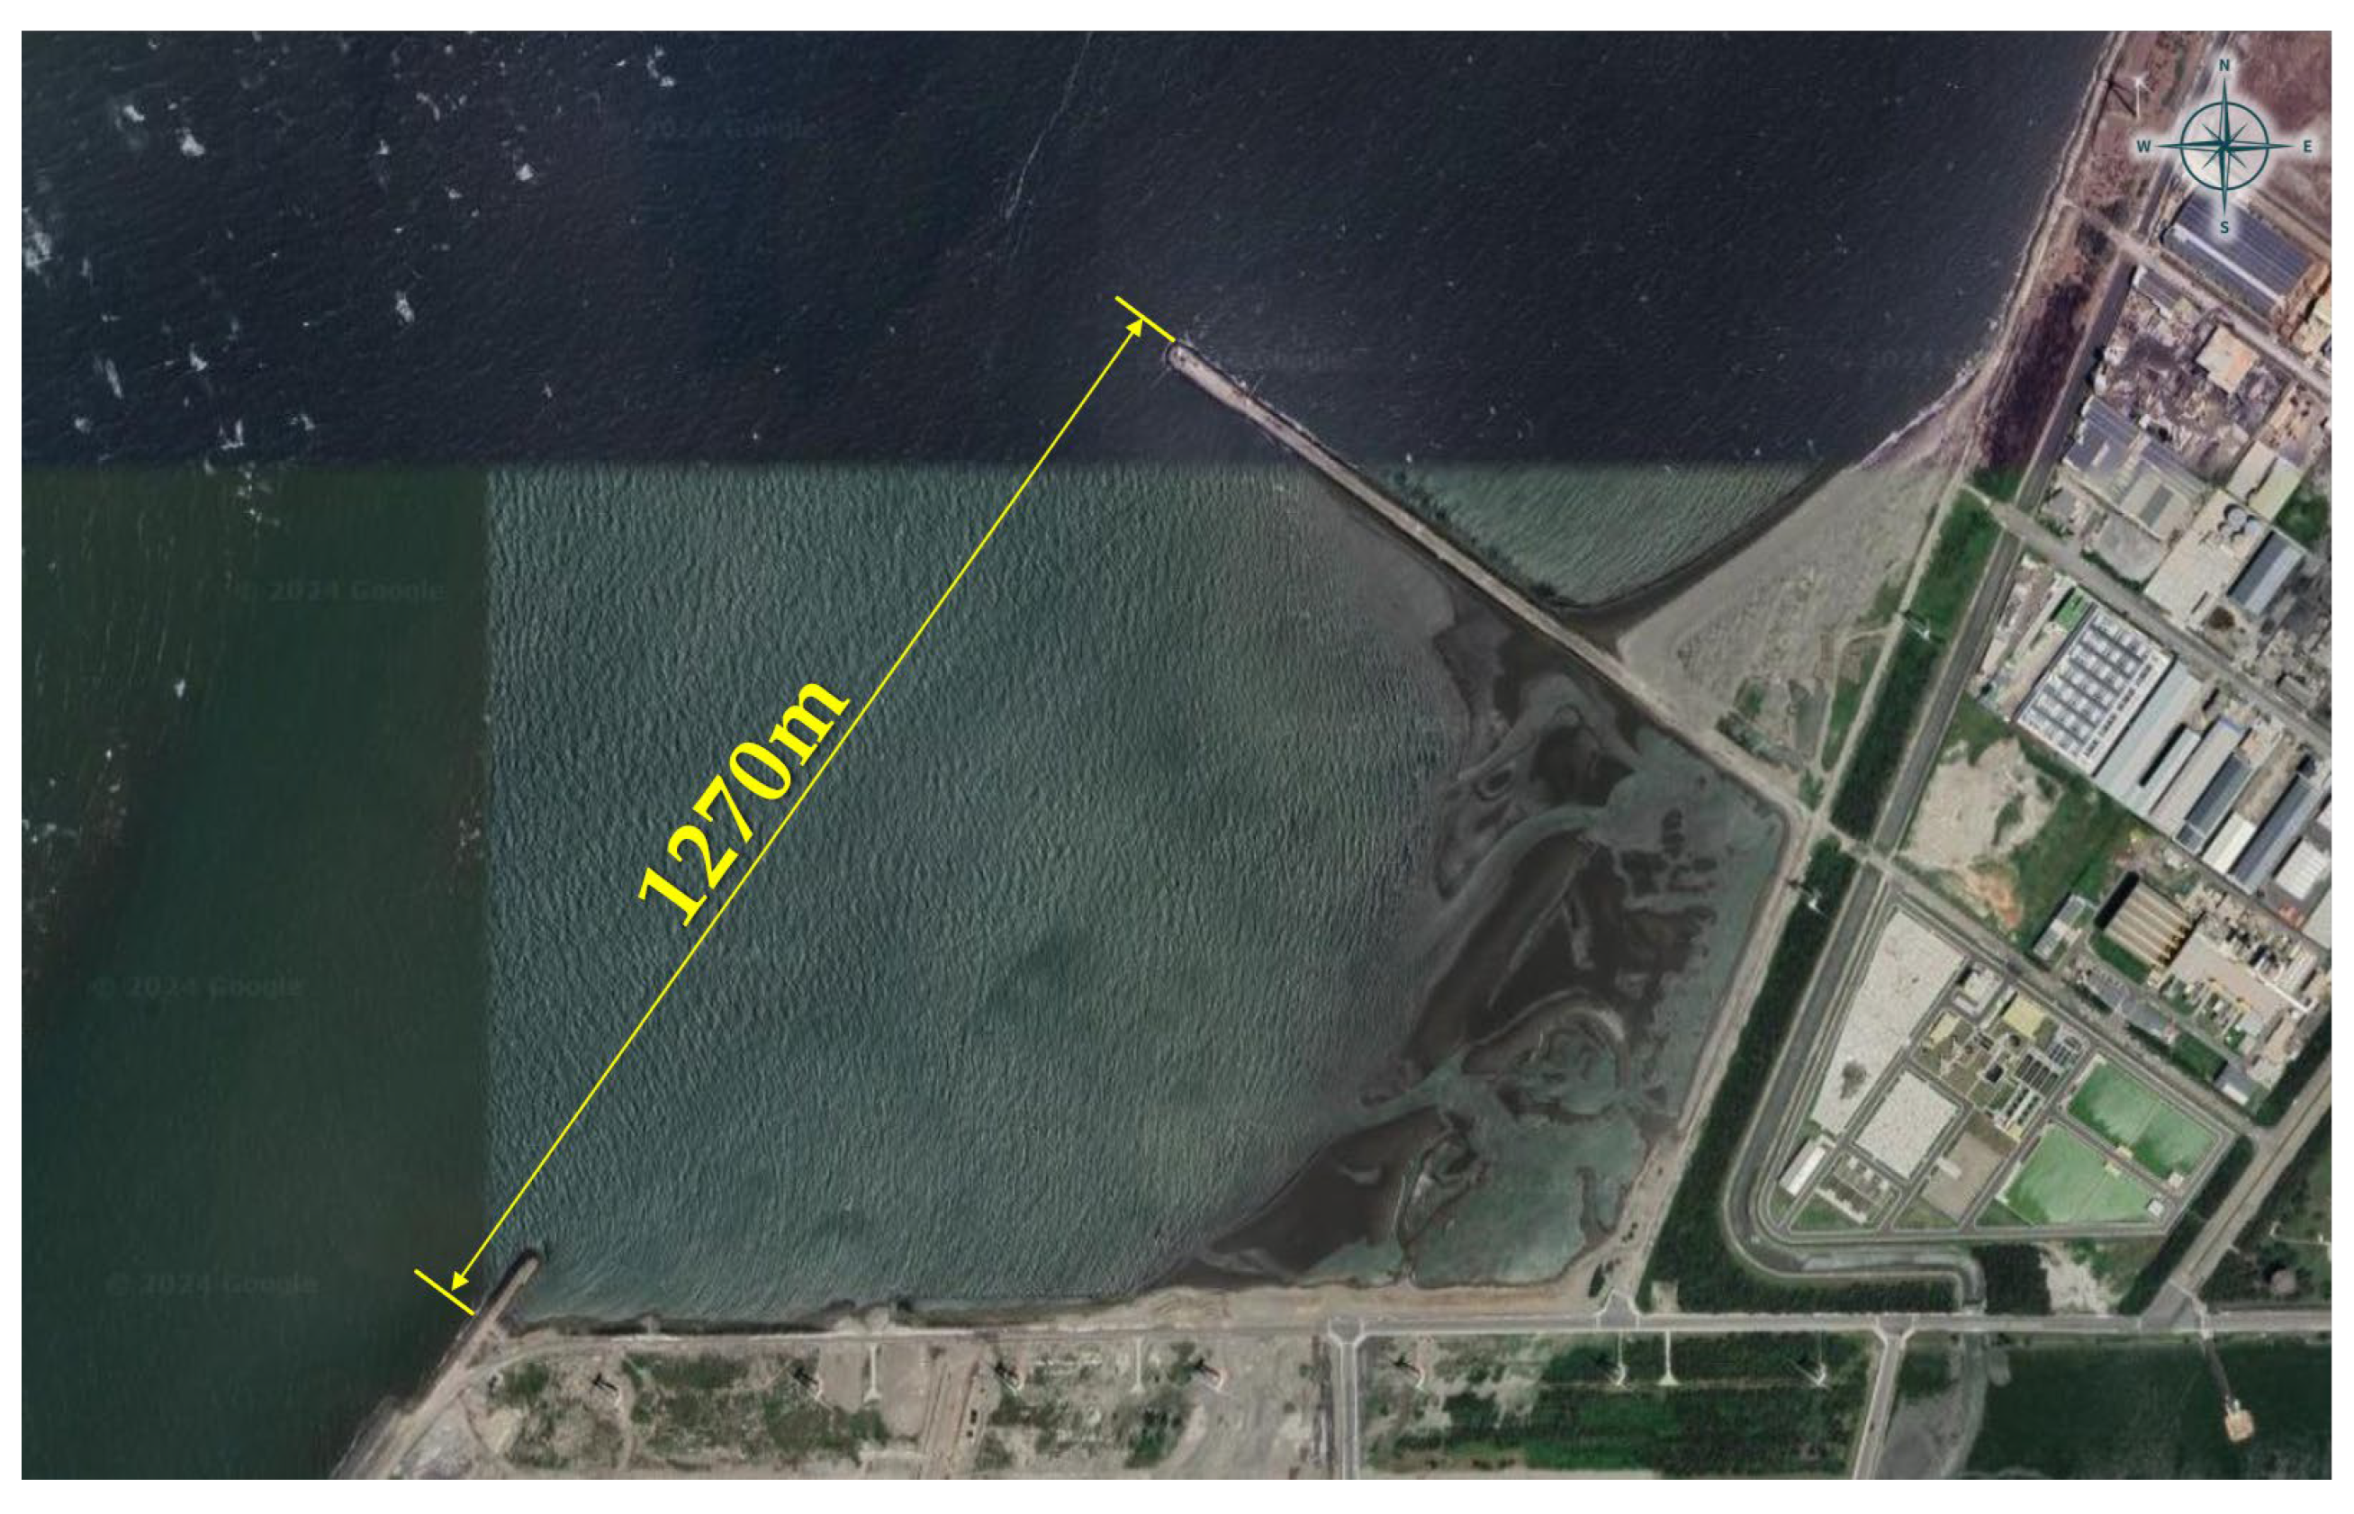
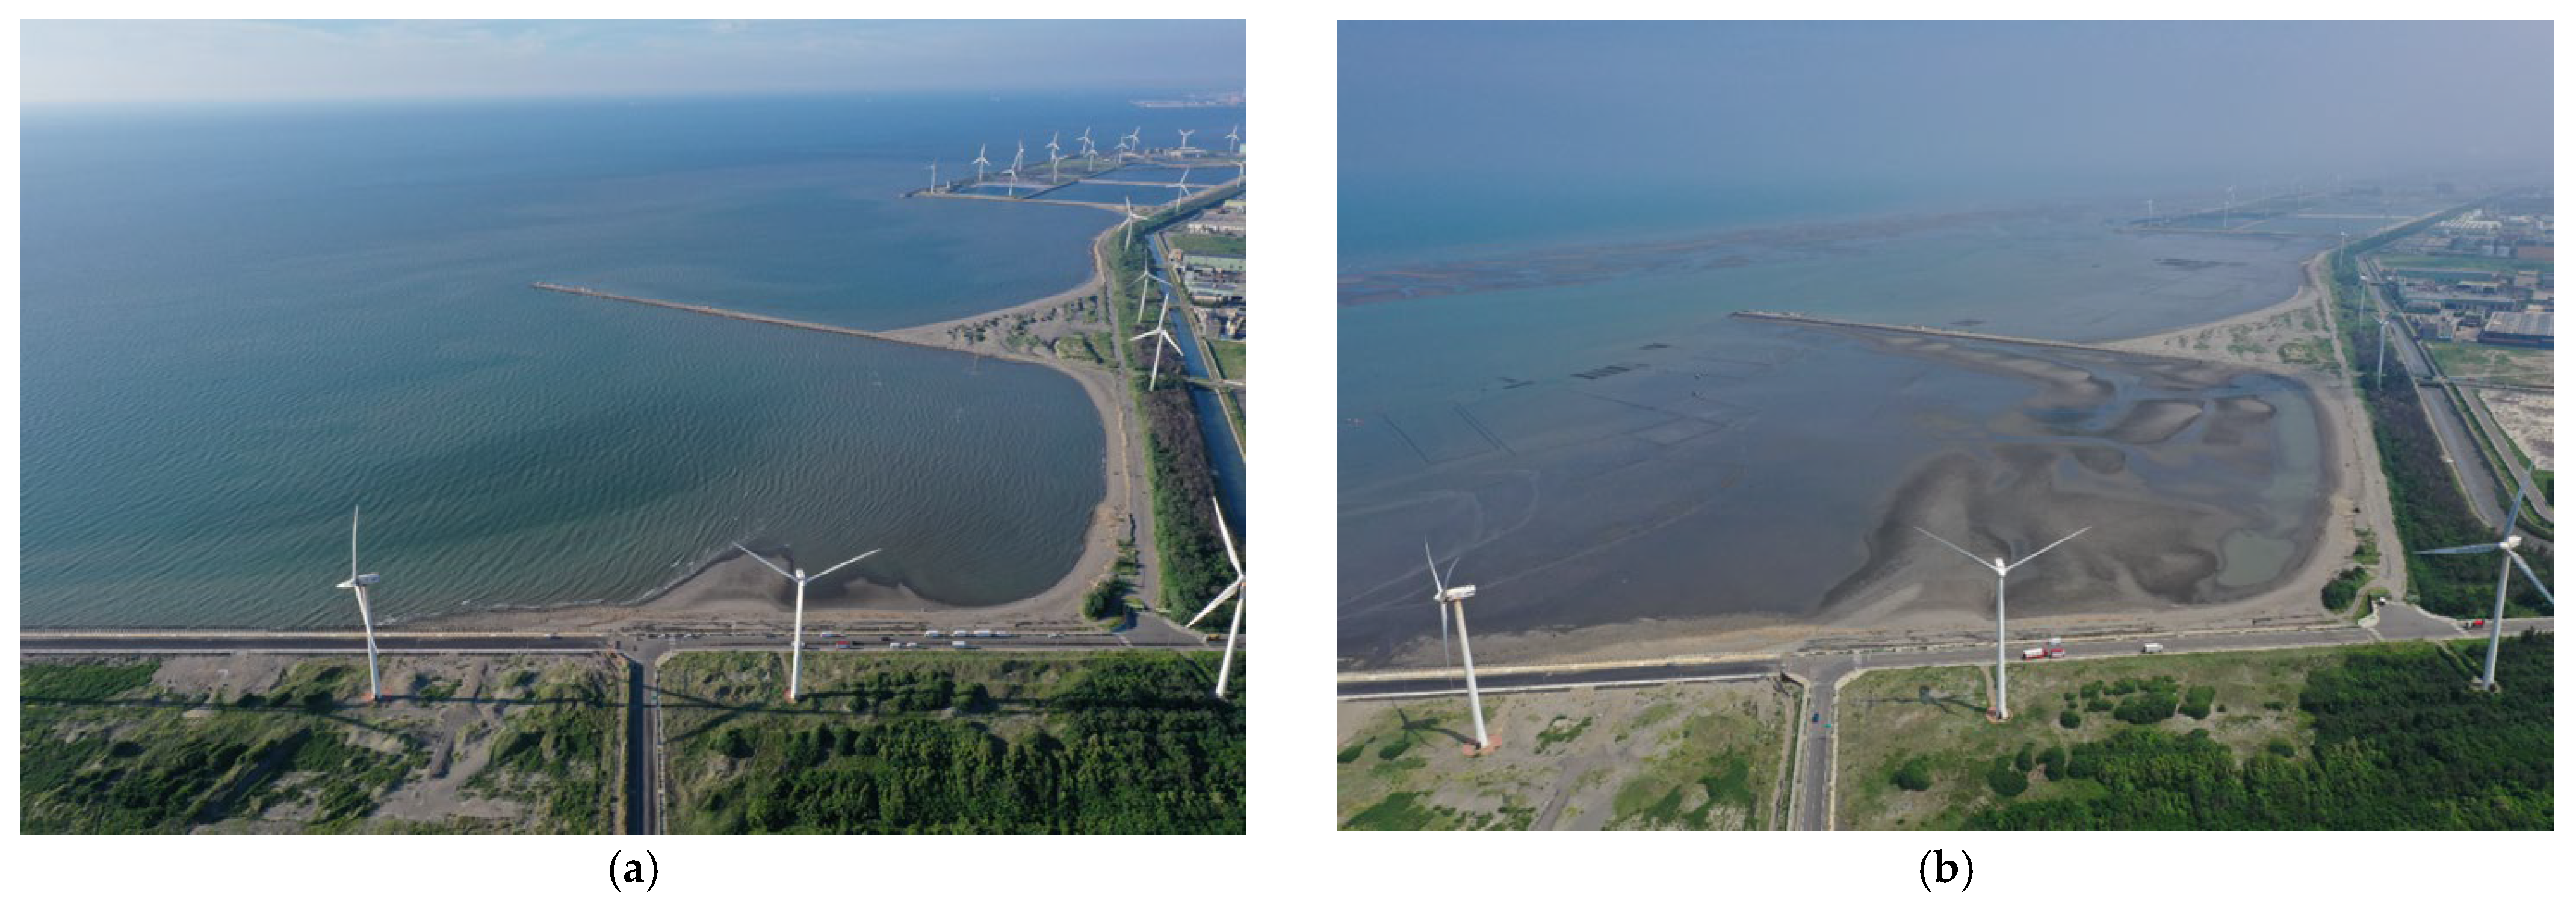
2.1. Overview of the Field Environment

The study site is located in Changhua County, Taiwan (latitude 24.127, longitude 120.411), with a coastline stretching approximately 1270 m from north to south and an average seabed slope of 1/200. This is a famous local beach, a good place for bird watching, and an important habitat for migratory birds returning north.
Currently, breakwaters and revetments have been completed on the eastern, southern, and northern sides, while the seaward-facing structure remains unconstructed, leaving the coastal area directly exposed to wave and tidal forces (Figure 2). The area features an intertidal zone with a tidal range reaching up to 5 m, resulting in periodic exposure and submersion of the seabed, which influences sediment transport and morphological changes. During high tide, the entire area is submerged, while during low tide, the sandy shore is fully exposed (Figure 3).
According to long-term wave data from the Bureau of Industrial Parks, Ministry of Economic Affairs, the study area is influenced by stronger and more consistent wind fields during the northeast monsoon season (October to March). During this period, the average wave height ranges from 1 to 2 m, with dominant wave directions from north to north-northwest (approximately 70%) and wave periods between 6 and 7 s (around 68%). In contrast, during the summer season, wave heights are generally below 1 m, and wave directions are more dispersed. The joint distribution of wave height and period shows a positive correlation, indicating that wind waves dominate in this region, particularly during the northeast monsoon season [14].
In this study, typhoon wave conditions were derived from simulation results presented in the Environmental Impact Assessment report of the Zhongneng Offshore Wind Farm. The report utilized the MIKE21 numerical model developed by the Danish Hydraulic Institute, incorporating the Cyclone Wind and Spectral Waves modules. Typhoon data from 1977 to 2015 were collected for storms that passed through or affected the region between 117–126° E and 18–28° N. Using the annual maximum method, directional wave simulation results within the project area were extracted and subjected to frequency analysis to estimate the design wave conditions corresponding to various return periods [15]. The estimated typhoon wave heights and periods for various return periods near the study area are summarized in Table 1.
Based on tidal observations recorded from 2003 to 2022 at the Mailiao Tidal Station by the Central Weather Administration, Ministry of Transportation and Communications, the mean sea level near the study area is 0.343 m, referenced to the Taiwan Vertical Datum 2001. The highest high water level reaches 2.728 m, while the lowest low water level drops to −2.379 m, indicating a significant tidal range in this region, with a maximum difference of 5.107 m (Table 2).

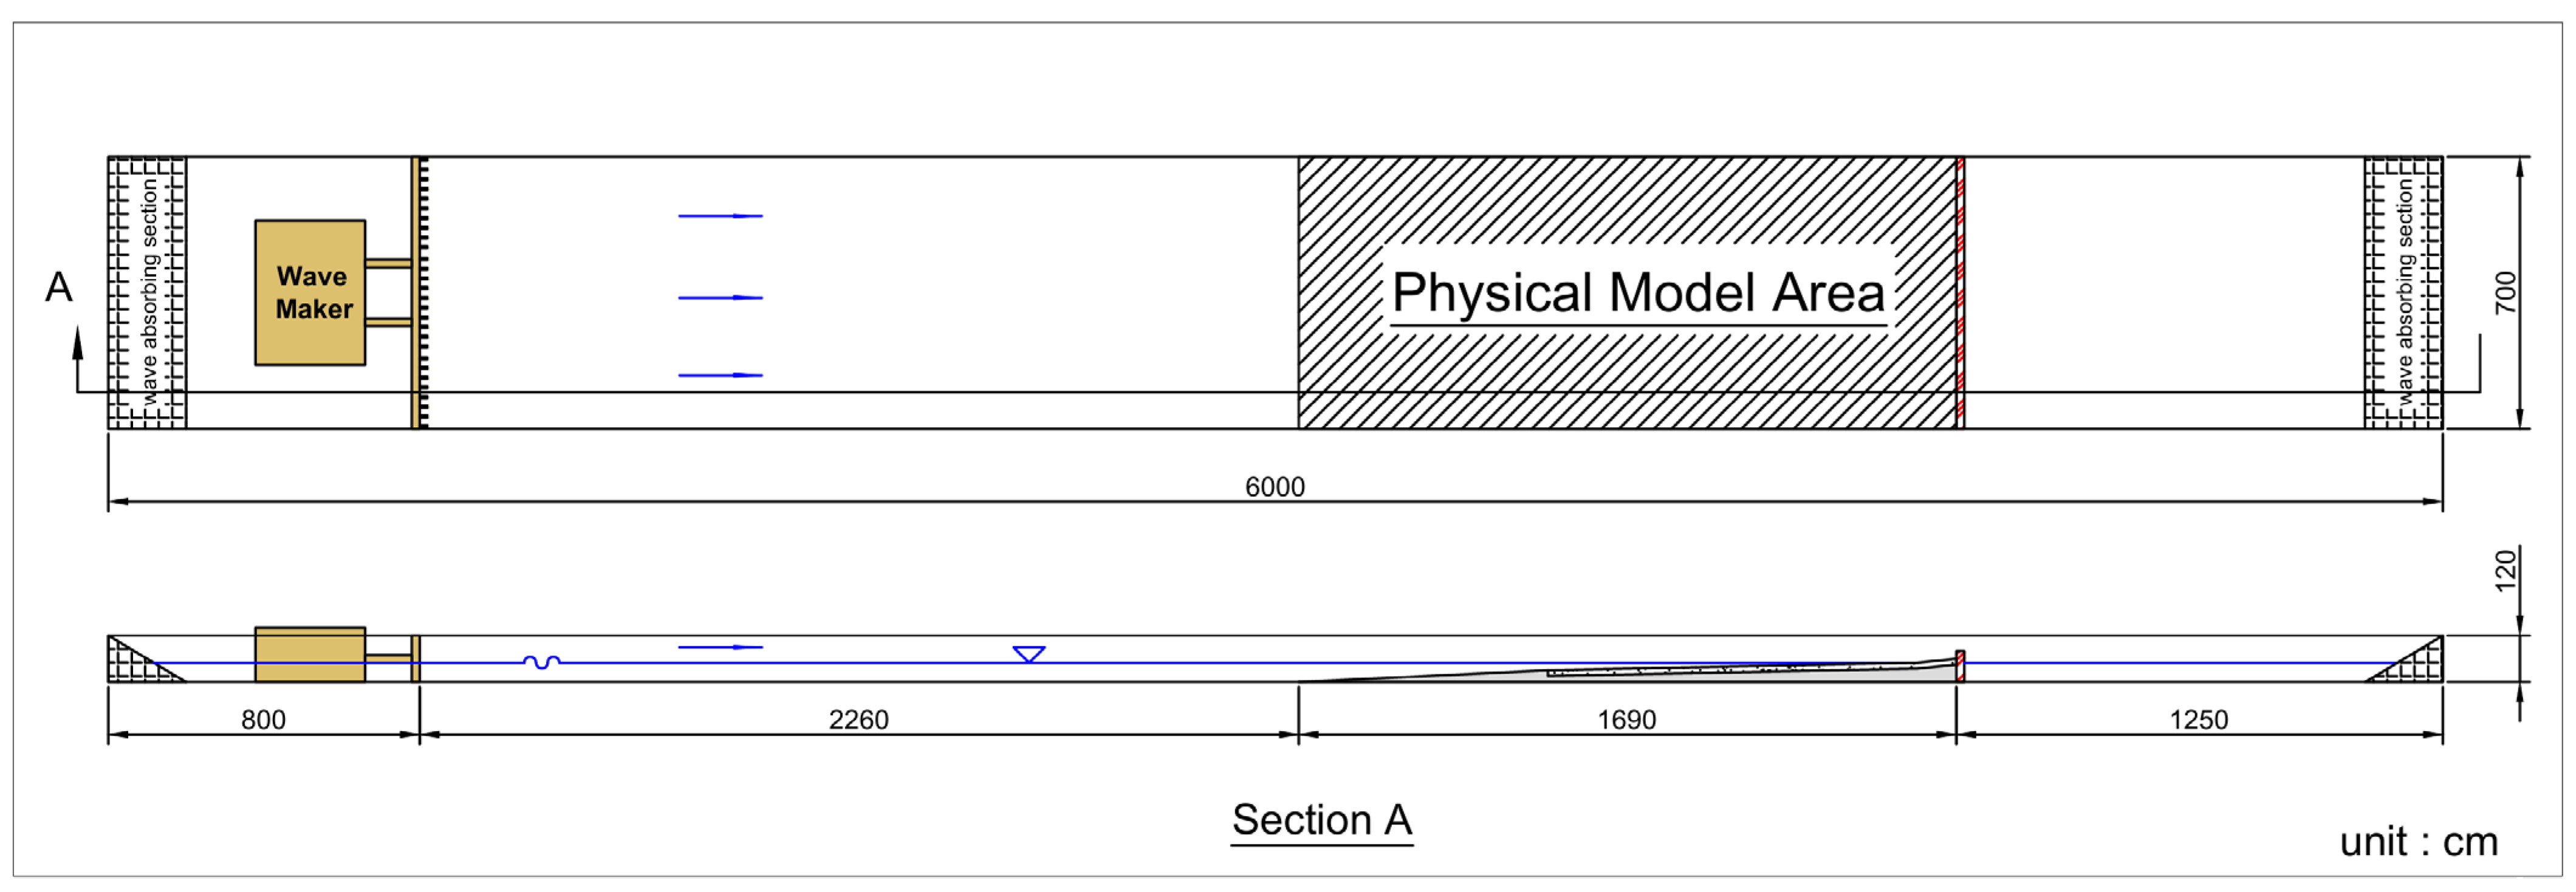
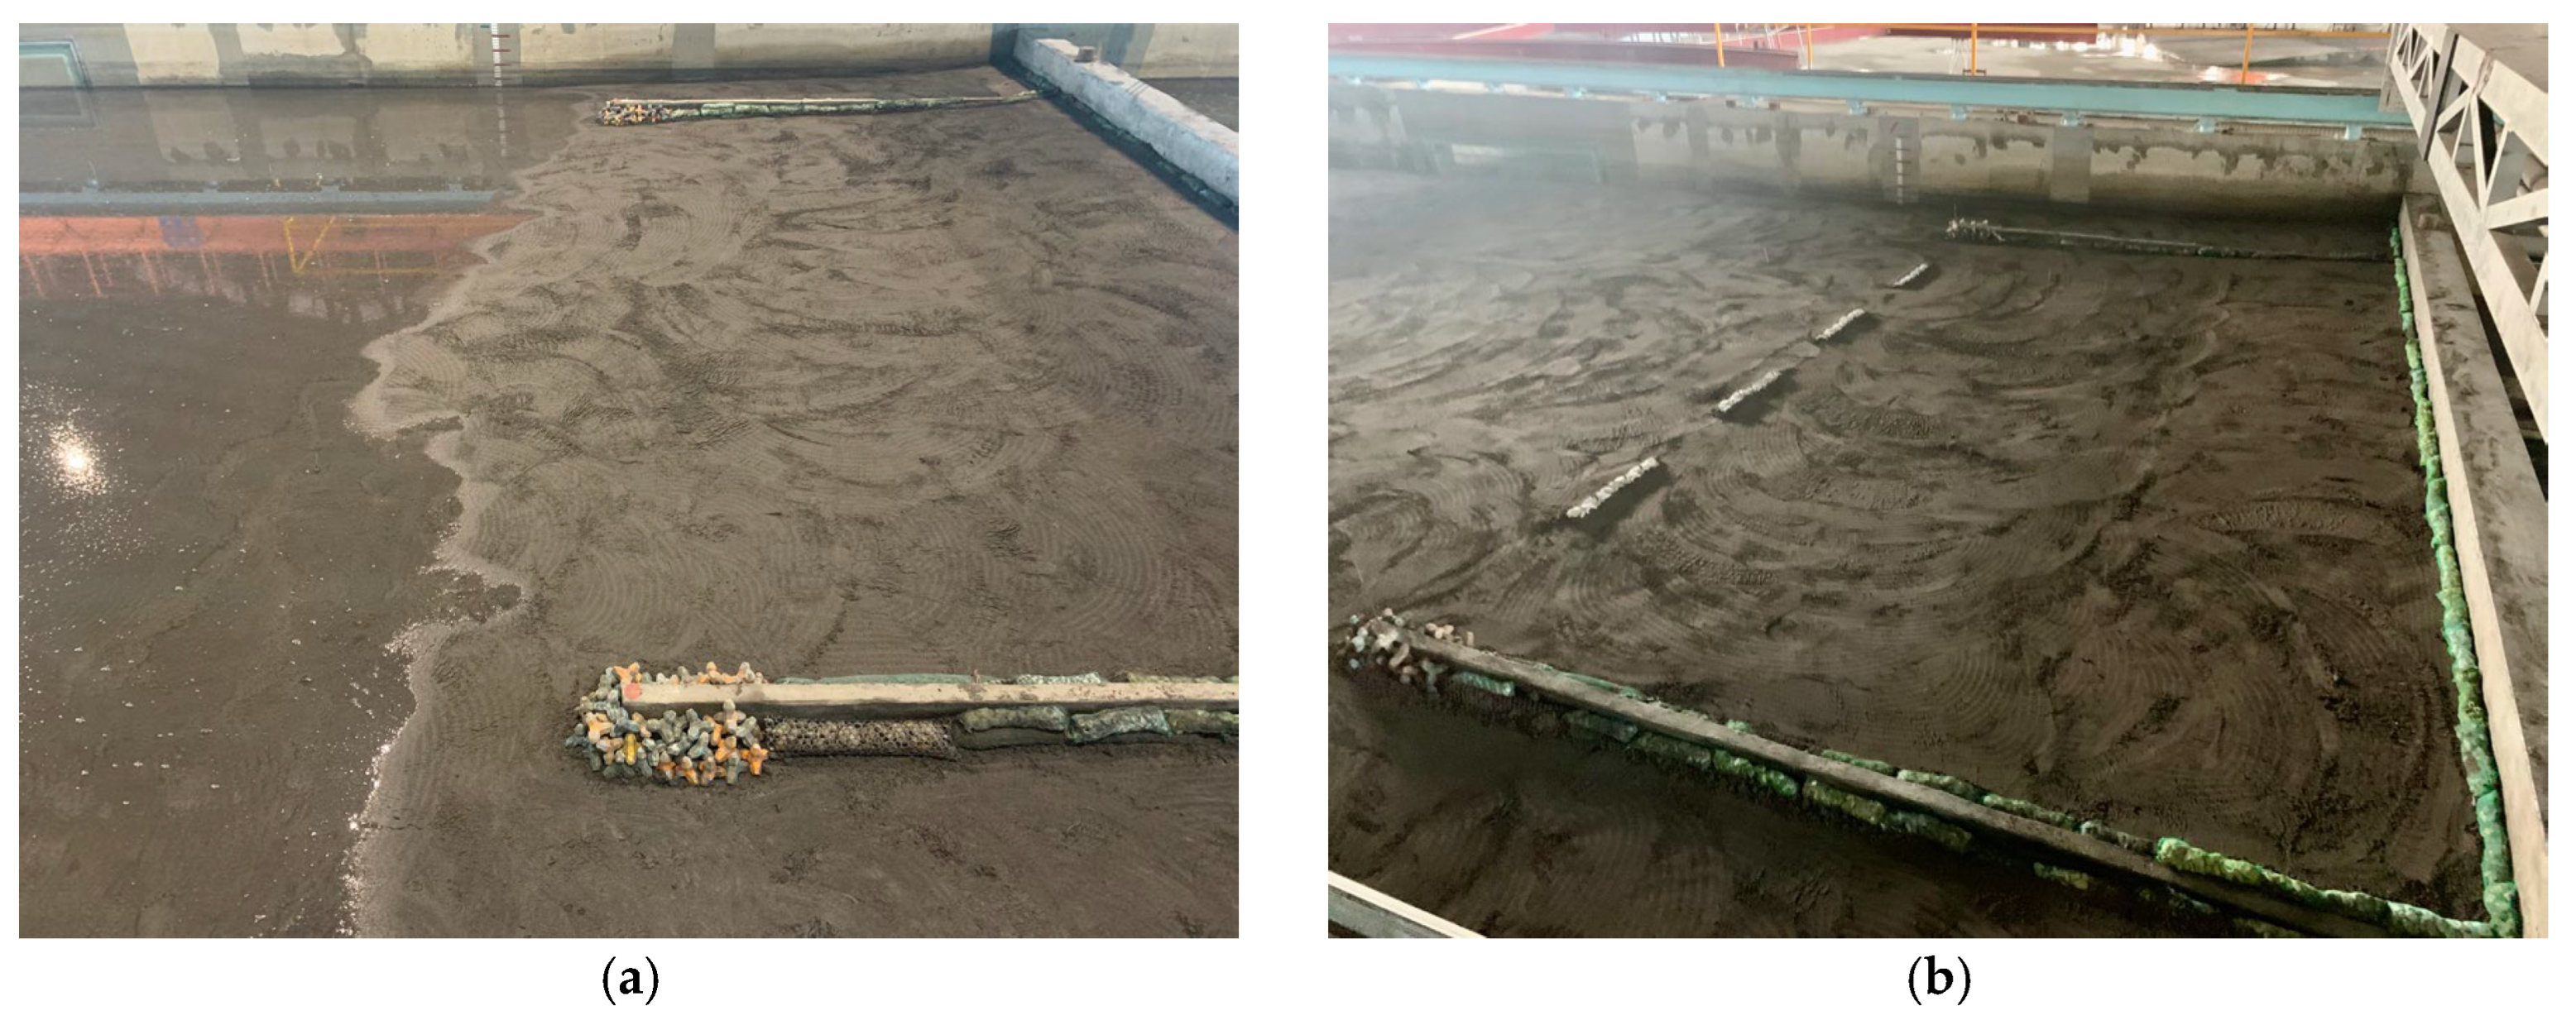
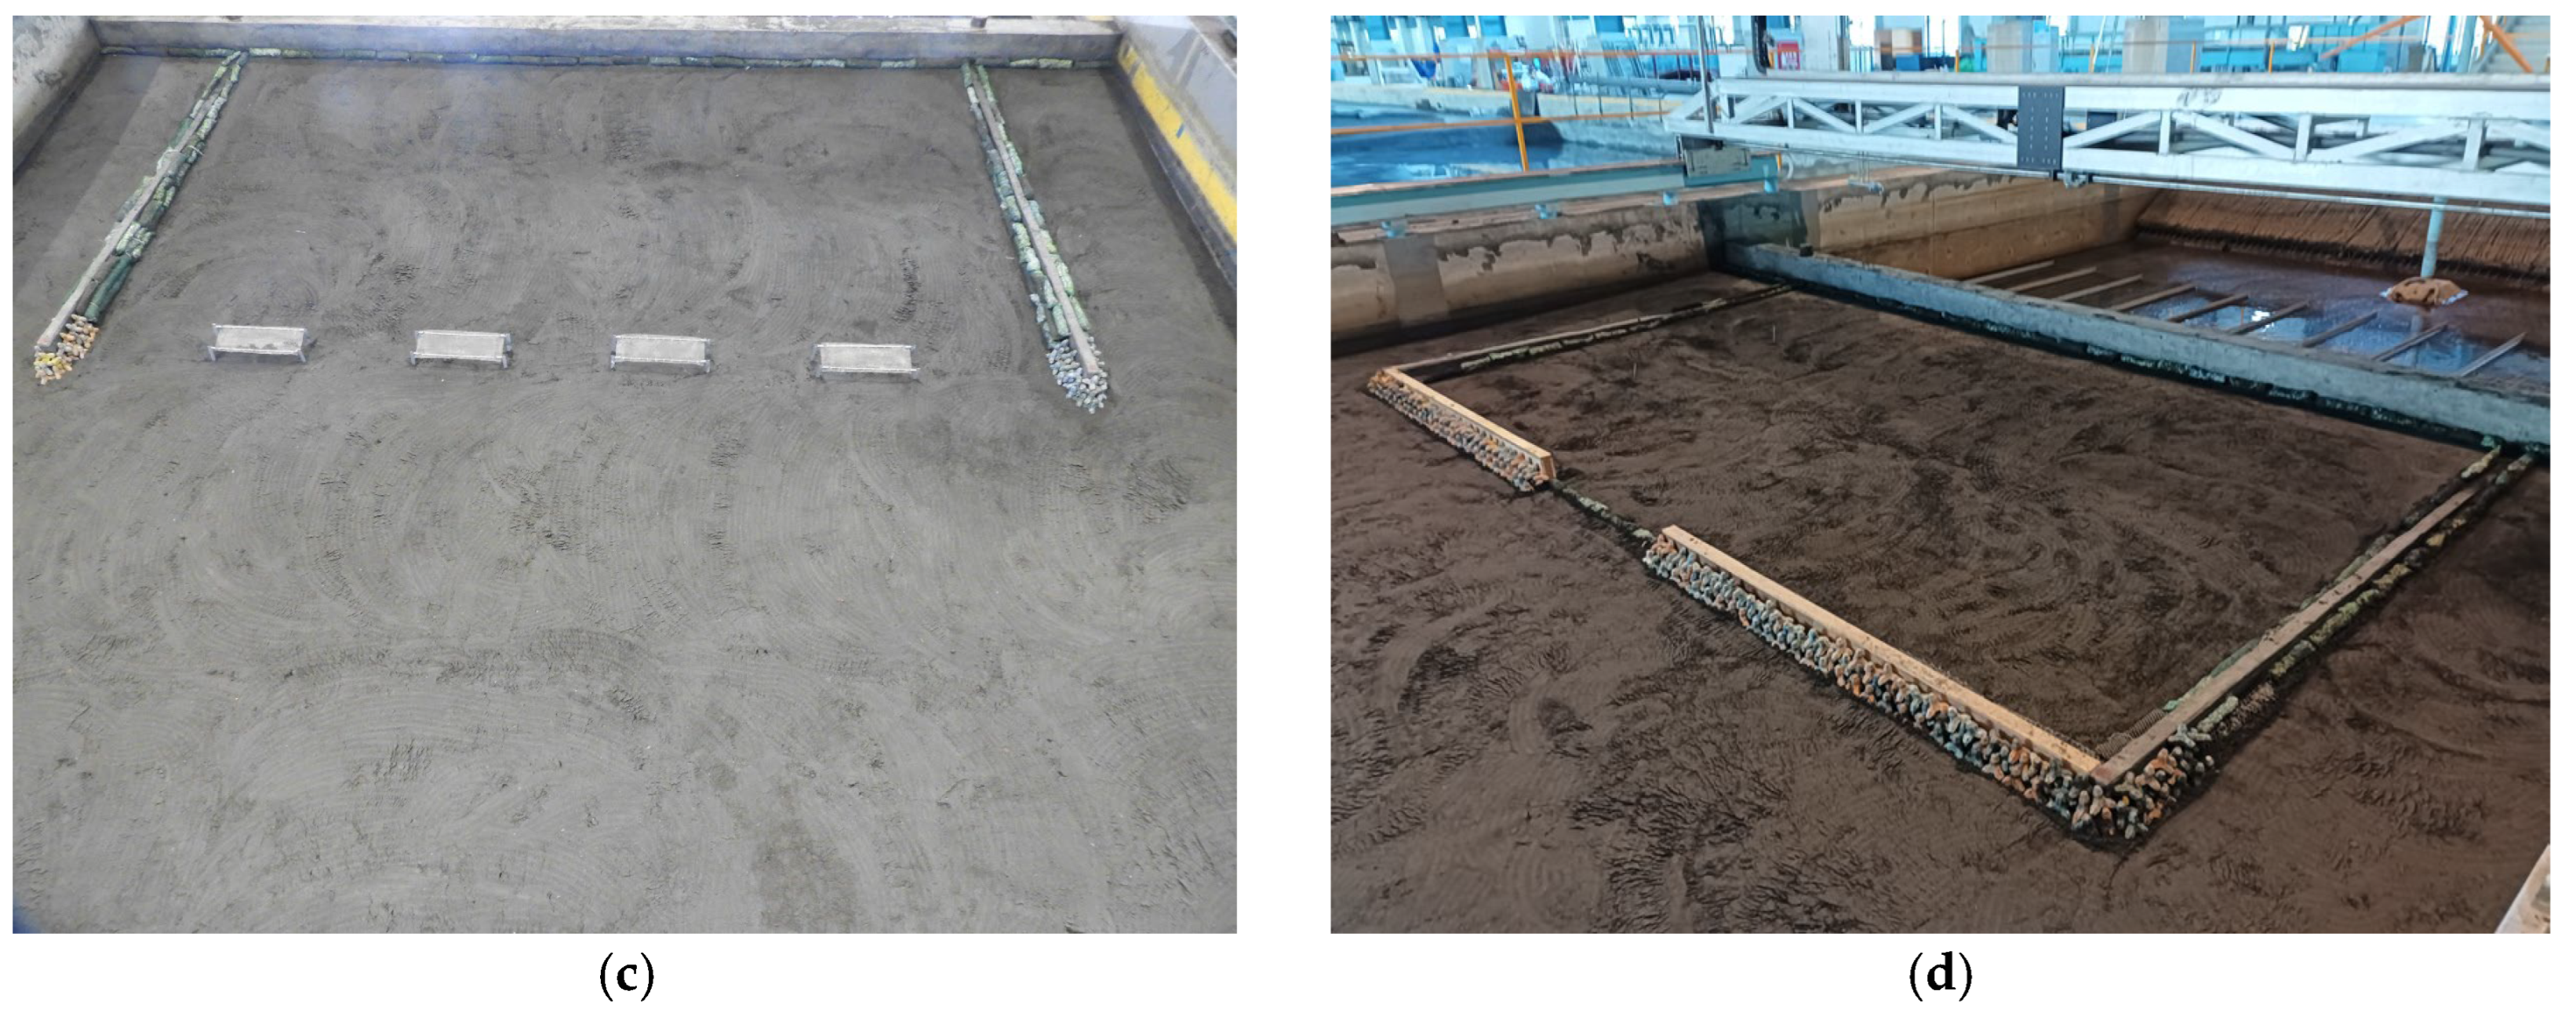
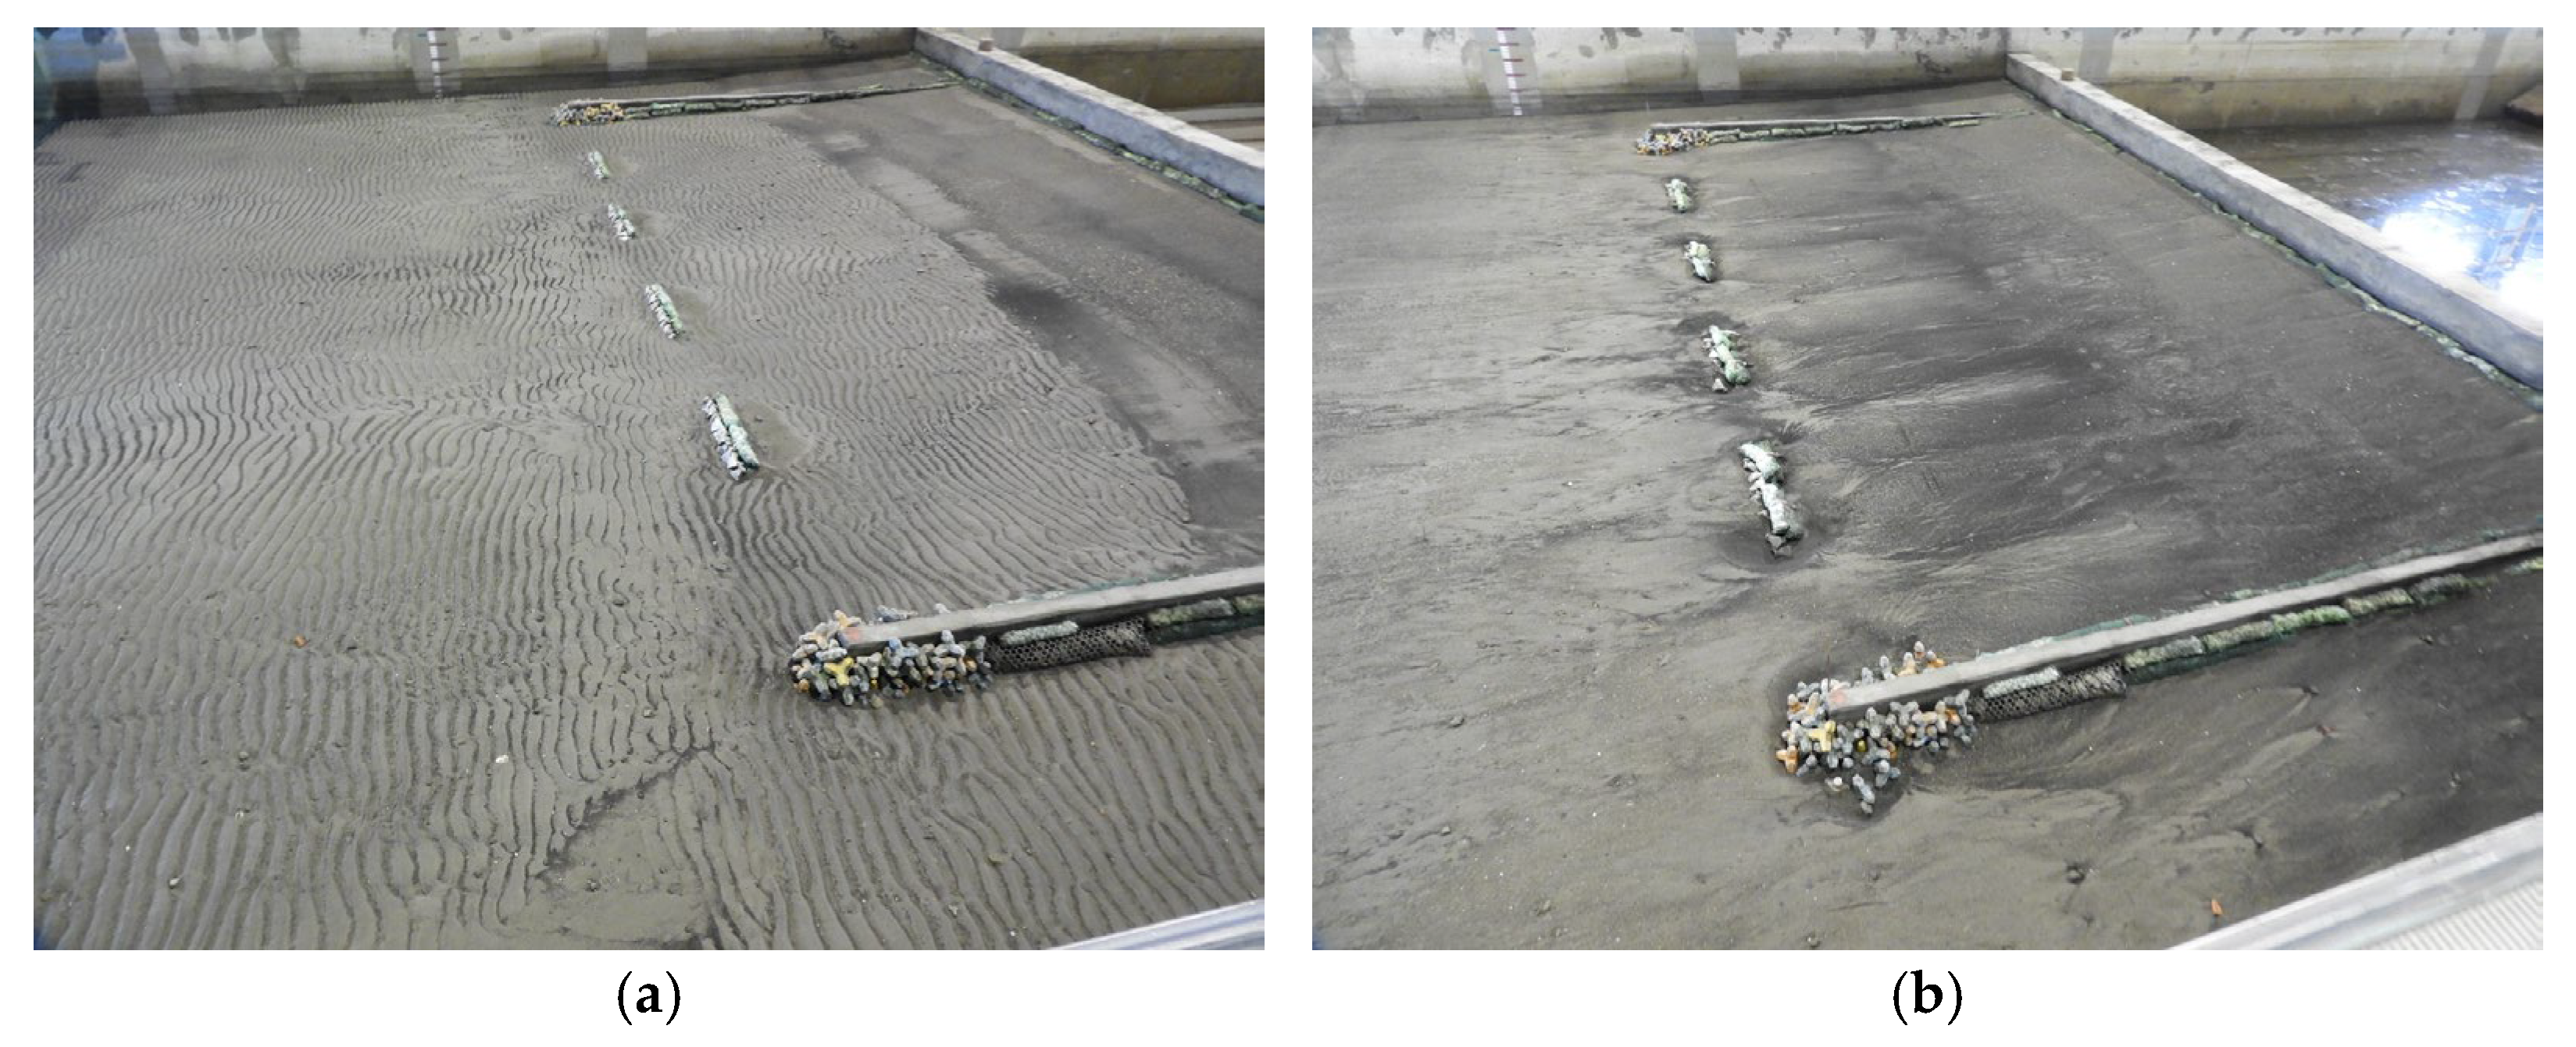
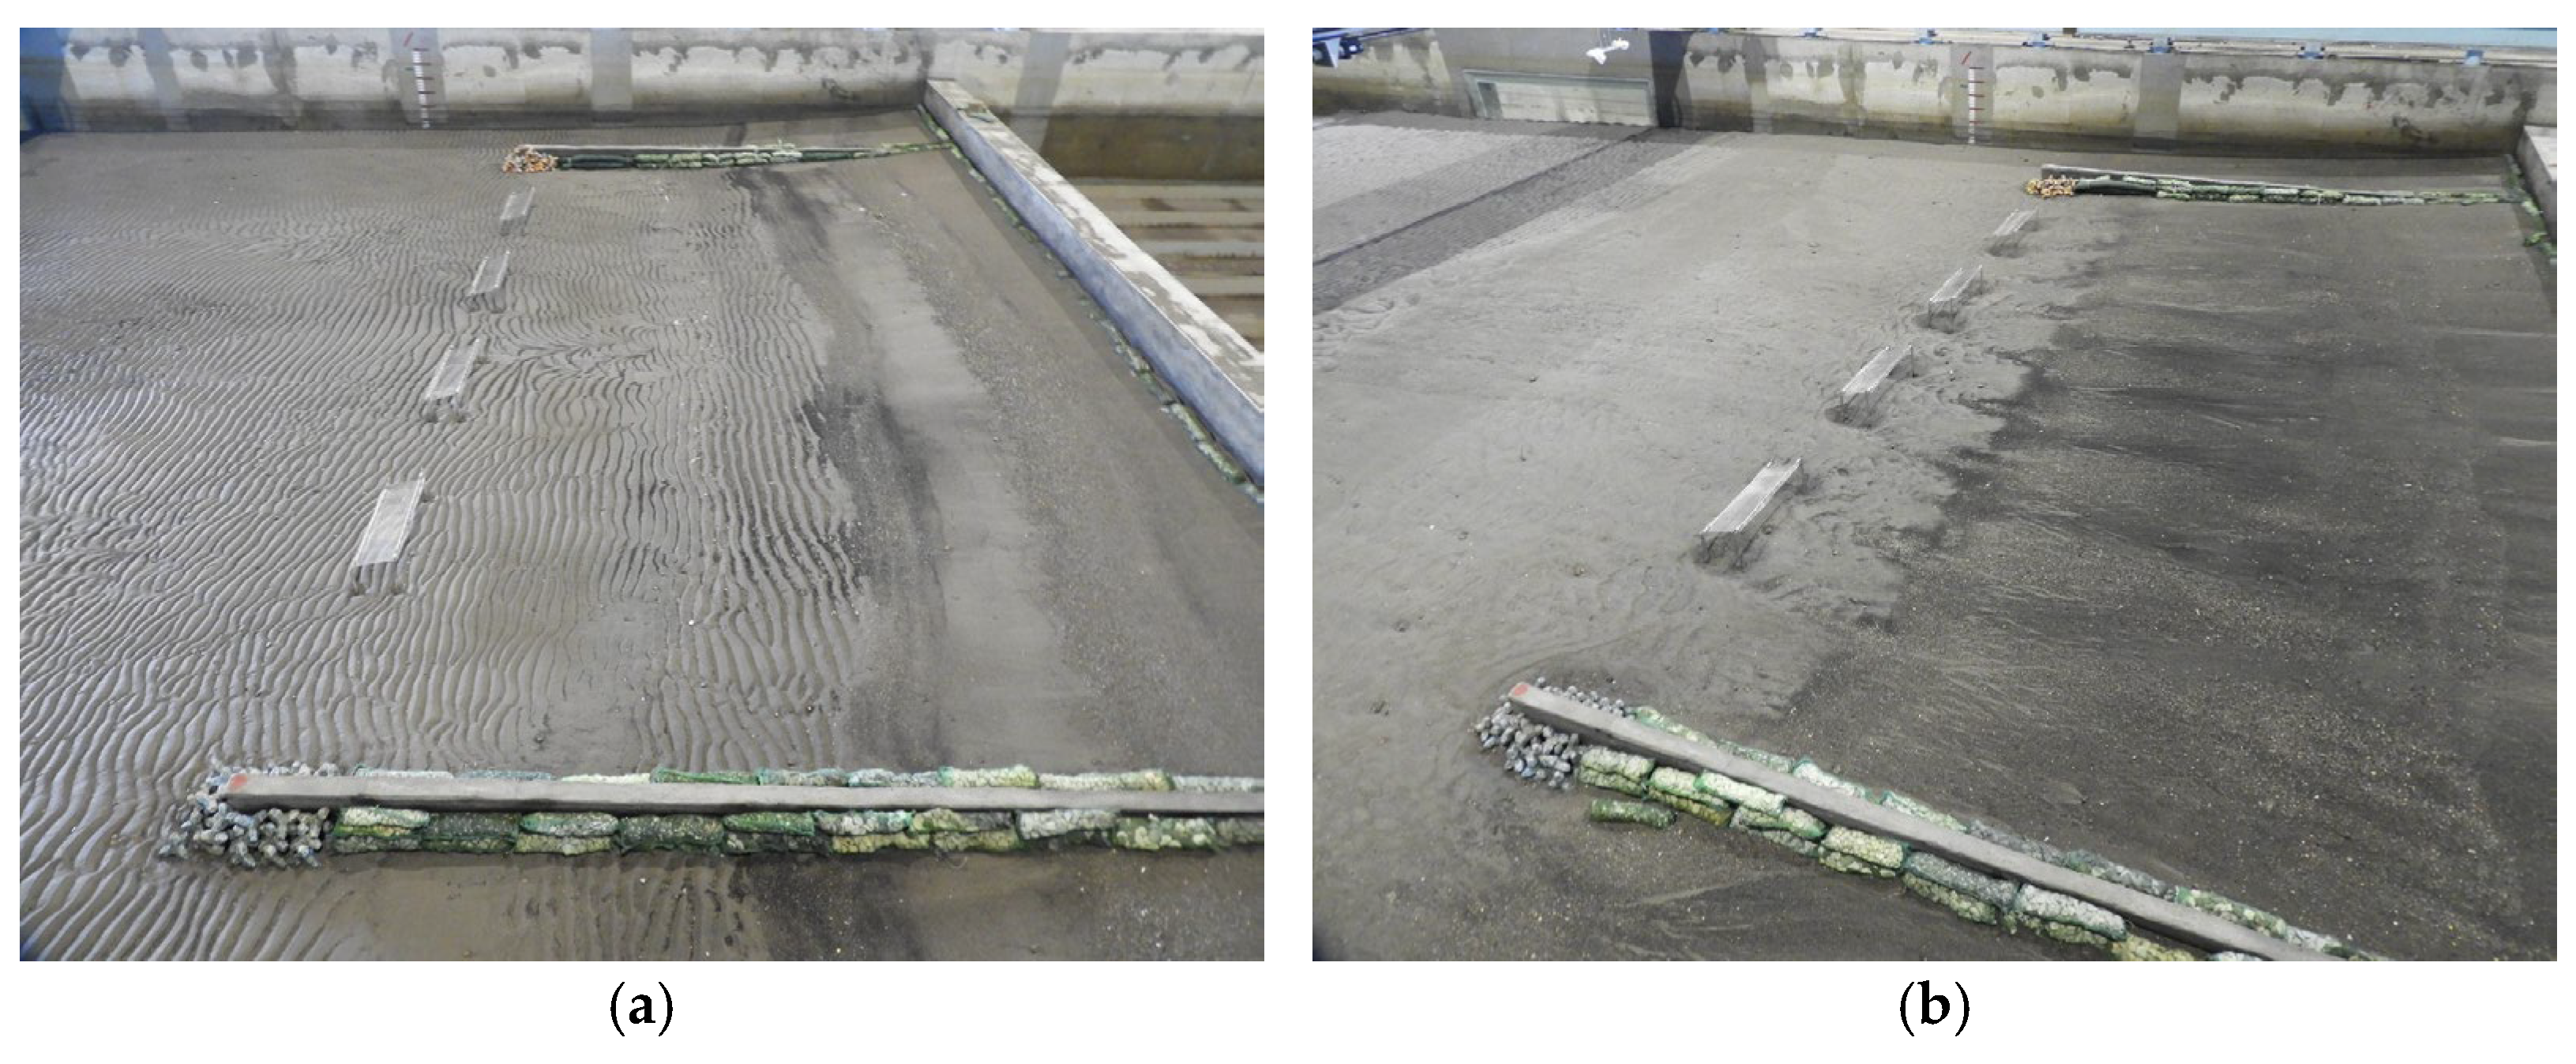
2.2. Physical Modelling of Hydraulic Experiments

The physical model experiment was conducted in the wind–wave–current basin at THL. The basin measures 60 m in length, 7 m in width, and 1.2 m in depth. It is equipped with a wave maker, a current generation system, and a low-turbulence wind generator, allowing for the simultaneous simulation of wind, waves, and currents. Since this study primarily investigates coastal morphological changes induced by wave and structure interaction, the wind and current generation systems were not activated, and only the wave maker function was utilized. The wave heights were measured using a capacitance-type wave gauge developed in-house by THL. The wave gauges were installed in front of the wave paddle to measure the incident wave heights, record water surface fluctuations, and determine wave heights and periods for validating the wave data.
Considering the intended simulation area, the dimensions of the test basin, and the wave maker capacity, as well as referencing previous studies [16], this experiment adopts a horizontal scale of 1/200 and a vertical scale of 1/50.
In movable-bed sediment transport experiments, the appropriateness of the selected wave scale is critical to the accuracy of the simulation results [17]. Based on past sediment transport experiments conducted in Taiwan, the similarity model developed by Ou and Hsu [16] has been proven effective in simulating morphological changes along the western coast of Taiwan. The derived scaling relationships for wave height and wave period are as follows:
λ H 0 = λ z 2 5 × λ x 4 15 × λ γ × λ D 50 1 3
λ T = λ z 1 5 × λ x 2 15 × λ γ 1 2 × λ D 50 1 6
where λ H 0 is the wave height scale ratio, λ T is the wave period scale ratio, λ z is the vertical scale ratio, λ x is the horizontal scale ratio, λ γ is the scale ratio of the submerged unit weight of the sediment, and λ D 50 is the scale ratio of the median grain size of the bed material.
The selection of bed materials for sediment transport experiments is another complex and challenging issue. THL has conducted extensive analyses on various bed materials, evaluating their characteristics through cross-sectional and plan-view flume tests to assess sediment transport and deposition patterns. Based on their findings, coal ash, with a specific gravity of approximately 2.02 and a median grain size ranging from 0.13 mm to 0.18 mm, has been identified as a suitable material for scaled experiments, as it effectively replicates coastal morphological changes observed in the field. Therefore, this study utilizes coal ash as the bed material for the experiments.
Based on field sampling and the physical properties of the selected model material, the relevant parameters were substituted into the equations. The field sediment had a median grain size of 0.24 mm and a submerged unit weight of 1.65, while the coal dust used in the model had a median grain size of 0.15 mm and a submerged unit weight of 1.05. As a result, the calculated wave height scale ratio was 1/36, and the wave period scale ratio was 1/6.
A coastal model measuring approximately 16.9 m in length and 7 m in width was constructed in the basin. Within the model, a movable-bed test section measuring 10.5 m × 7 m was established, with a 0.15 m-thick layer of coal ash placed at the bottom to simulate sediment transport and morphological changes.
Since winter wave directions are predominantly from the north to north-northwest, i.e., waves approach the coast perpendicularly at the study site, while summer wave directions are more widely distributed with no clear prevailing direction, the incident wave direction in this study was uniformly set to be perpendicular to the coastline. This approach was adopted to simplify variable control and focus on the effects of different coastal protection structures on morphological changes. The layout of the experimental model is shown in Figure 4.
According to the actual field conditions in the study area, structures on three sides have already been constructed, while the structure on the seaward side has not yet been built. Considering the spatial limitations of the experimental basin, a seawall measuring 7 m in length, 0.2 m in width, and 0.8 m in height was constructed at the end of the model. In addition, two seawalls measuring 3 m in length, 0.05 m in width, and 0.15–0.3 m in height were installed approximately 1 m from each sidewall to simulate the actual coastal topography. The sides of the seawalls were reinforced with gabions, and tetrapods were placed at the seawall heads to reduce local scouring and enhance structural stability. The model layout is illustrated in Figure 5a, and on-site photos are provided in Figure 6a.
The experiment was first conducted under conditions where the seaside structure had not been constructed (Case 1), serving as the baseline for comparison. The results from Case 1 were then used to evaluate coastal morphological changes under different structures.
In Case 2, four submerged breakwaters were installed as a typical hard engineering solution to dissipate wave energy, reduce flow velocity, and stabilize the beach. These structures were selected based on their widespread use in coastal protection, with the expectation that they would promote sediment deposition in the landward area and mitigate coastal erosion under both monsoon and typhoon wave conditions. Each breakwater measured 0.5 m in length and 0.05 m in width, with a spacing of 0.5 m between structures. The crest elevation was set at +0 m, i.e., level with the still water level. The breakwaters were constructed using crushed stone combined with tetrapods. The breakwaters were arranged perpendicular to the direction of wave propagation, forming a transverse layout parallel to the shoreline. The model layout is illustrated in Figure 5b, and on-site photos are provided in Figure 6b.
In Case 3, four derosion lattices were installed in the same location as the submerged breakwaters in Case 2. As previously described, the derosion lattice is a flexible coastal protection device with advantages such as low construction cost and ease of installation. Its effectiveness in wave energy dissipation and sediment trapping has been validated through field experiments and 2D flume tests. This study further investigates its performance in a large-scale wave basin under both monsoon and typhoon wave conditions, aiming to compare its sediment-trapping performance with traditional hard engineering structures (submerged breakwaters and seawalls). Each derosion lattice measured 0.5 m in length and 0.15 m in width, with a spacing of 0.5 m between units. The crest elevation was set at +0.05 m, slightly above the still water level. The four derosion lattices were arranged perpendicular to the wave propagation direction, forming a transverse layout parallel to the shoreline. The model layout is illustrated in Figure 5c, and on-site photos are provided in Figure 6c.
As previously mentioned, the study area is a well-known beach and bird-watching site, where local authorities aim to preserve the ecological environment while promoting land use and creating a water-accessible public space. To achieve this, a composite structure combining a seawall and a centrally open submerged breakwater was proposed. This design allows for controlled wave and current exchange through a central gap, thereby supporting both ecological continuity and public access to water. In Case 4, a combined coastal protection structure consisting of a seawall and a submerged breakwater was installed. The sections connecting to the existing seawalls on both sides were constructed using timber, with each end measuring approximately 2.0 m in length. A submerged breakwater, 1.0 m in length and at an elevation of +0 m, was placed in the central gap. Both the seawalls and the submerged breakwater had a width of 0.05 m, and the total length of the structure remained 5 m. The model layout is illustrated in Figure 5d, and on-site photos are provided in Figure 6d.
Bed elevations were measured using an optical total station both before and after each test, enabling the calculation of erosion and deposition volumes for evaluating sediment-trapping performance. The total station used in this study was the SOKKIA iX-1200 (Topcon Corporation, Tokyo, Japan), equipped with automatic target recognition and tracking capabilities, allowing for real-time data recording. The instrument has a distance measurement accuracy of 1 mm. During the bed elevation surveys, a regular grid of fixed measurement points was established, with measurements taken at 10 cm intervals across the test area to obtain detailed bed elevation data.
The wave conditions adopted in this study represent two primary hydrodynamic environments in the study area: typical waves driven by the northeast monsoon and extreme waves generated by typhoon events. The former reflects the common wave characteristics in the region, while the latter corresponds to the extreme conditions typically considered in coastal protection design. Since this study focuses on the sediment-trapping performance of different coastal structures under variable water level conditions, the water level rise caused by storm surges was not included in the simulations. The monsoon wave condition was determined based on representative parameters derived from long-term wave monitoring data, with a significant wave height (Hs) of 2.0 m and a peak period (Tp) of 7.0 s. For typhoon conditions, the wave parameters were selected from estimated data corresponding to a 50-year return period, with Hs = 7.35 m and Tp = 11.39 s.
Tidal variation is a continuous process that changes over time; however, due to spatial constraints of the wave basin and limitations of the wave-making system, a fully smooth and continuous simulation could not be achieved [18]. Therefore, this study adopted a stepwise approach: starting from the lowest low water level (LLWL), the water level was adjusted approximately every 10 min through the mean sea level (MSL) to the highest high water level (HHWL), and then returned in reverse order. Although this method does not replicate the tidal cycle in a perfectly continuous manner, the selected water levels are representative, allowing the physical model to reasonably capture the hydrodynamic conditions and morphological responses throughout a complete tidal cycle, including both rising and falling tide stages.
For monsoon wave tests, six full tidal cycles were simulated (LLWL → MSL → HHWL → HHWL → MSL → LLWL), with 10 min of wave generation at each stage. For typhoon wave tests, one full tidal cycle was simulated using the same sequence and duration. The stepwise changes in water levels used to simulate the tidal variation are illustrated in Figure 7.
Case 1 was tested under both fixed and variable water level conditions. This comparative experimental design helped eliminate the influence of coastal structures, allowing for a clearer evaluation of how different water level conditions affect morphological changes. Considering the substantial tidal range in the study area, variable water levels were used in the experiments for Cases 2 through 4 to better reflect real-world site conditions. In total, ten experimental scenarios were implemented across the four cases.
Based on the experimental conditions and scaling considerations mentioned above, the physical quantities of both the model and the corresponding prototype are summarized in Table 3.

3. Results

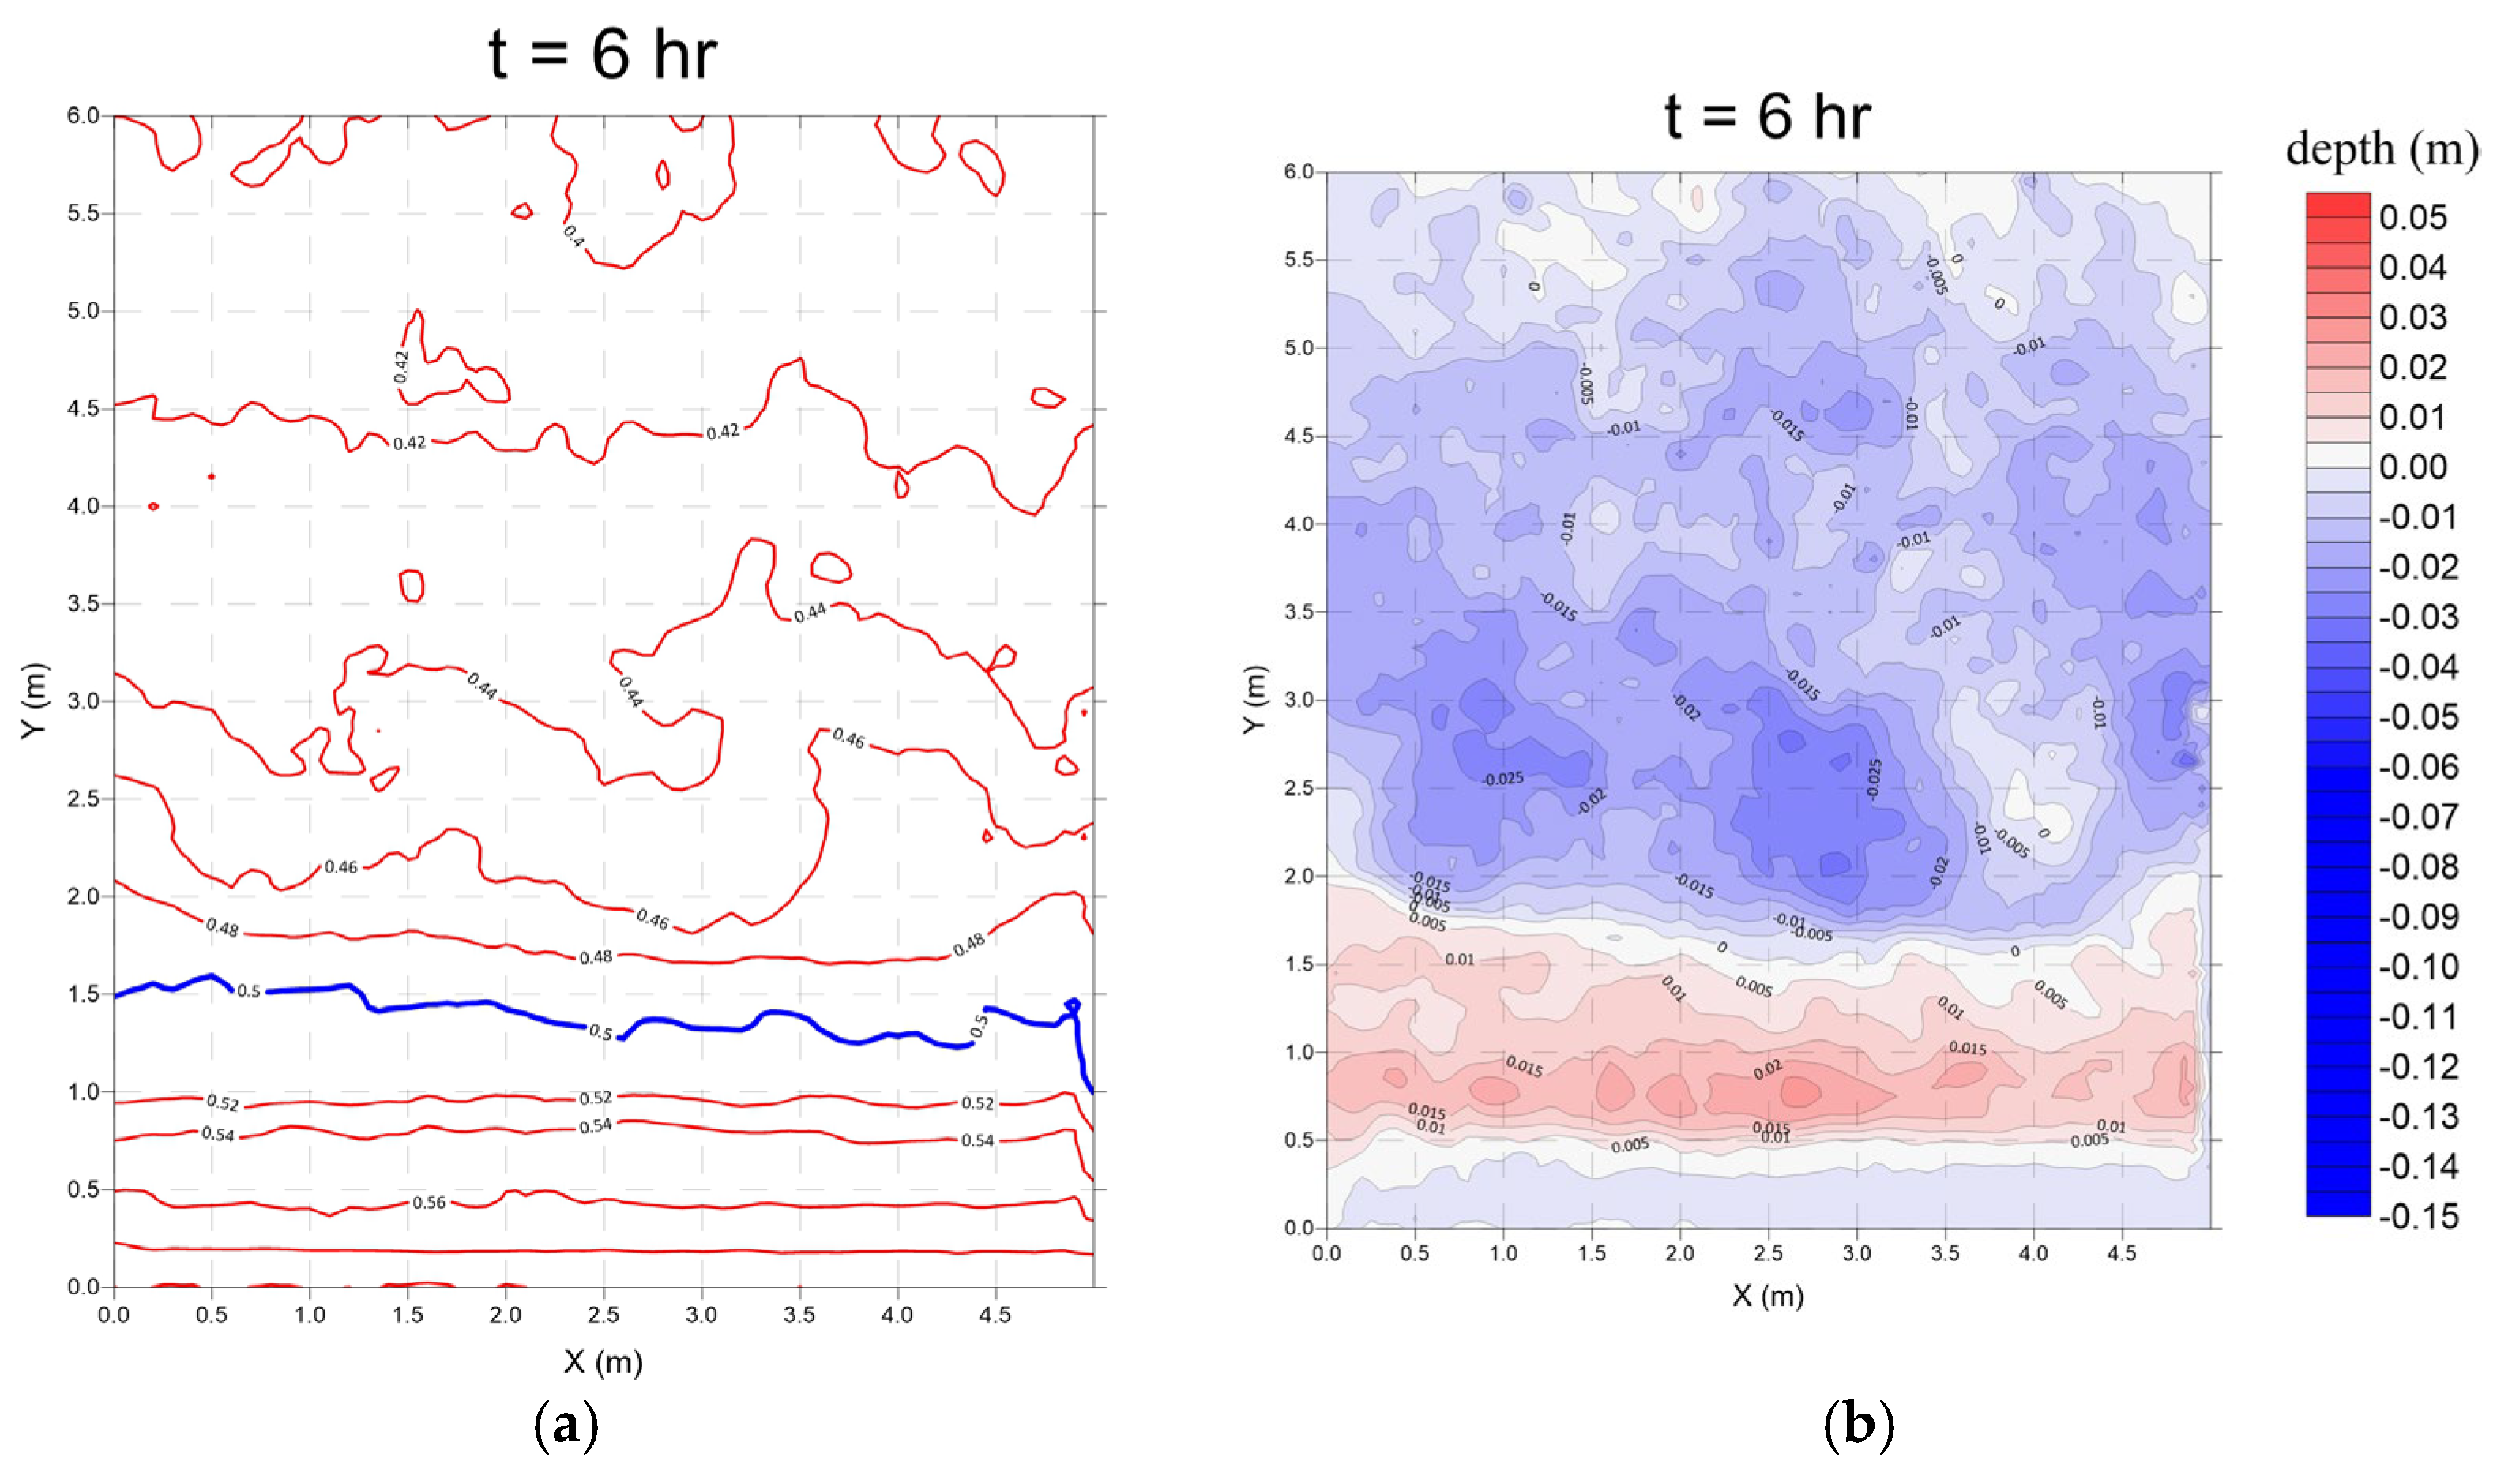
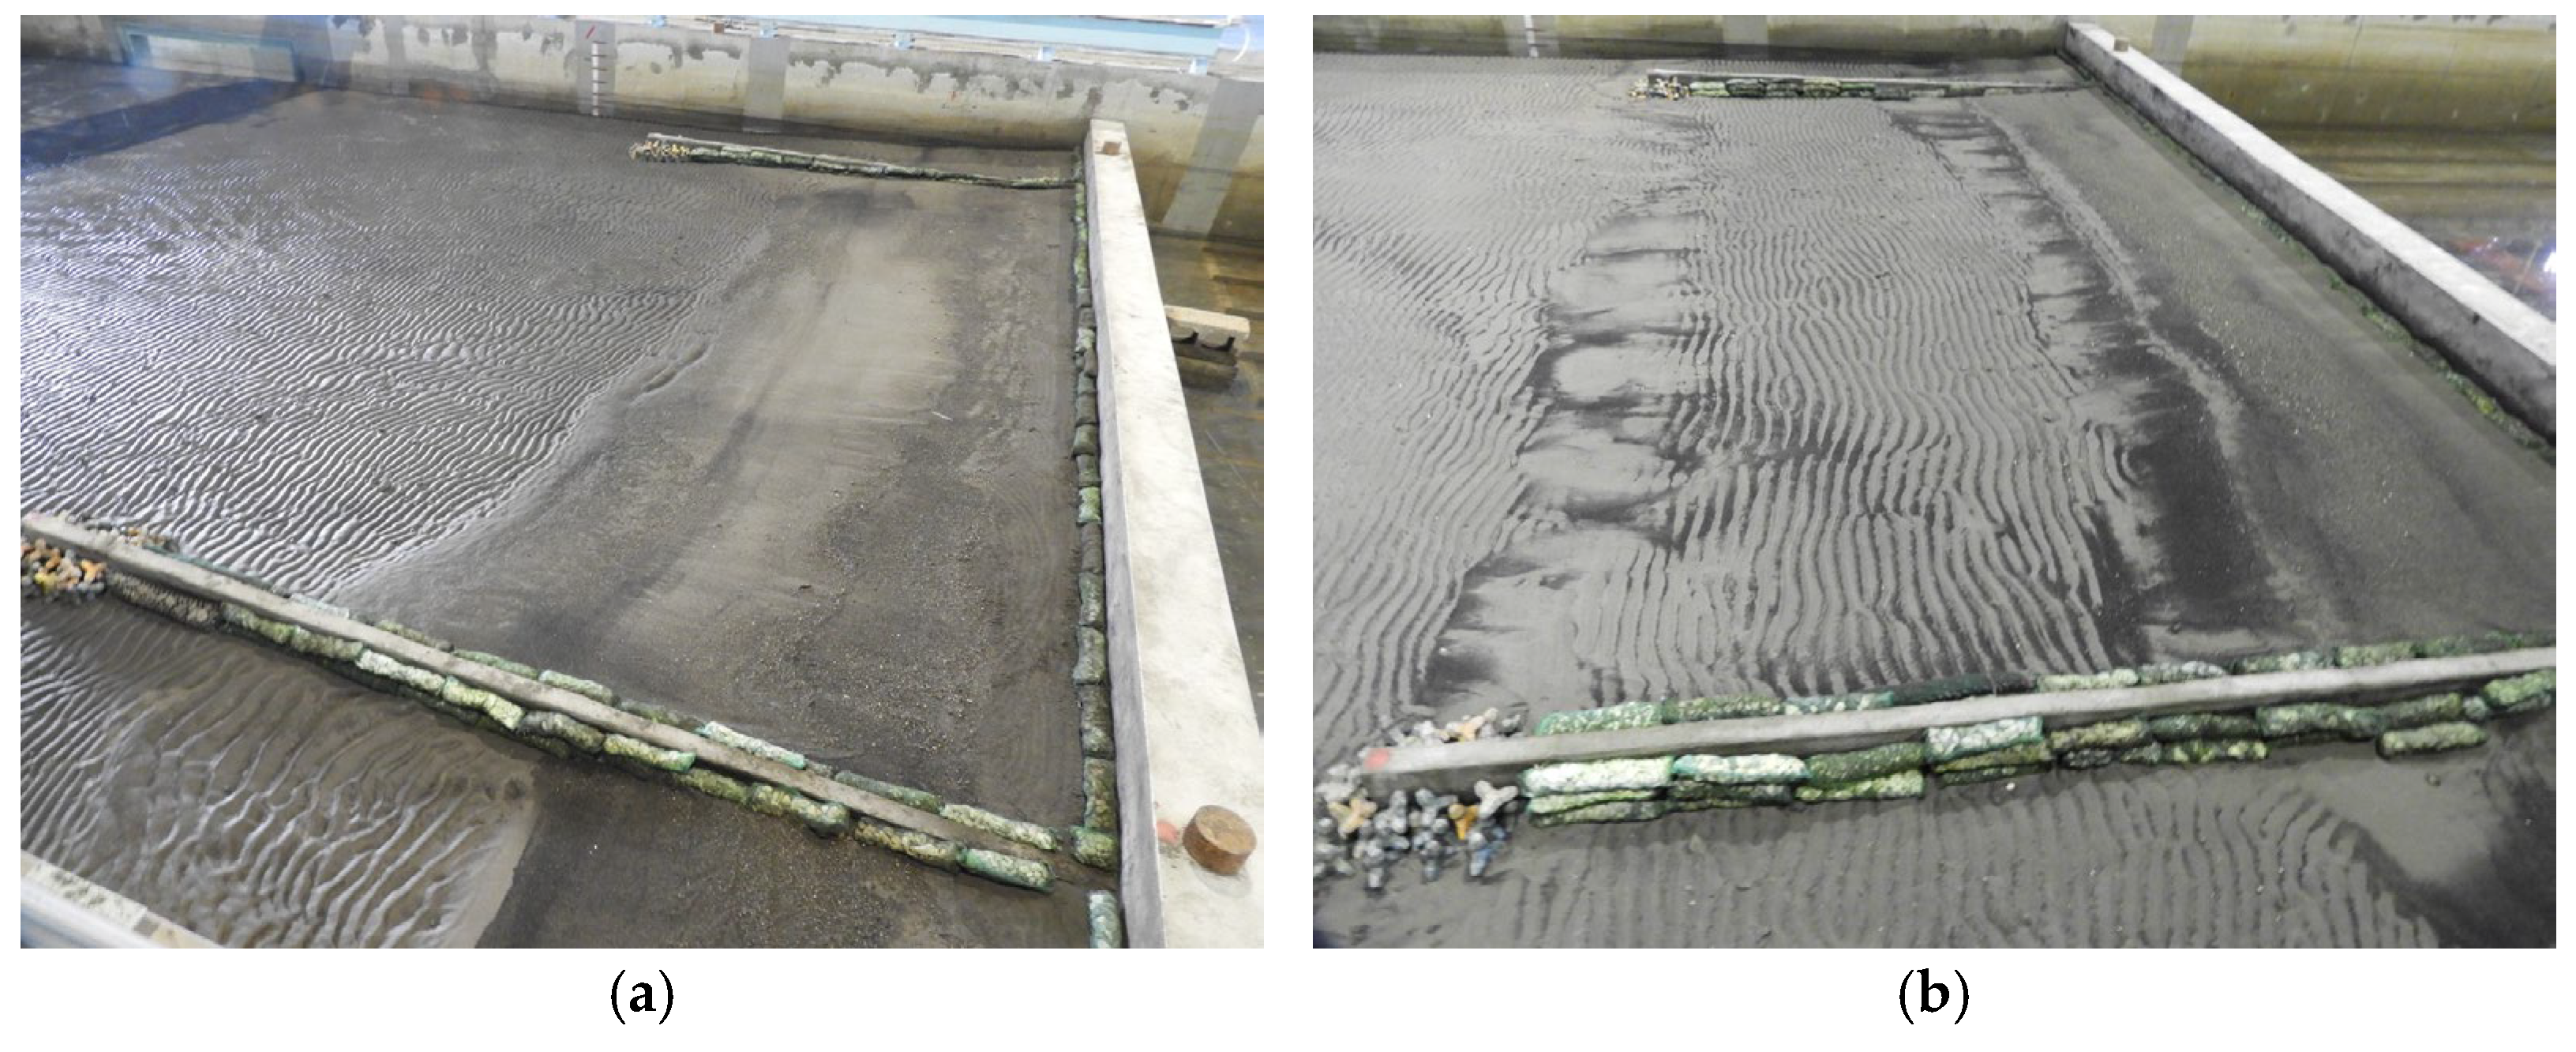
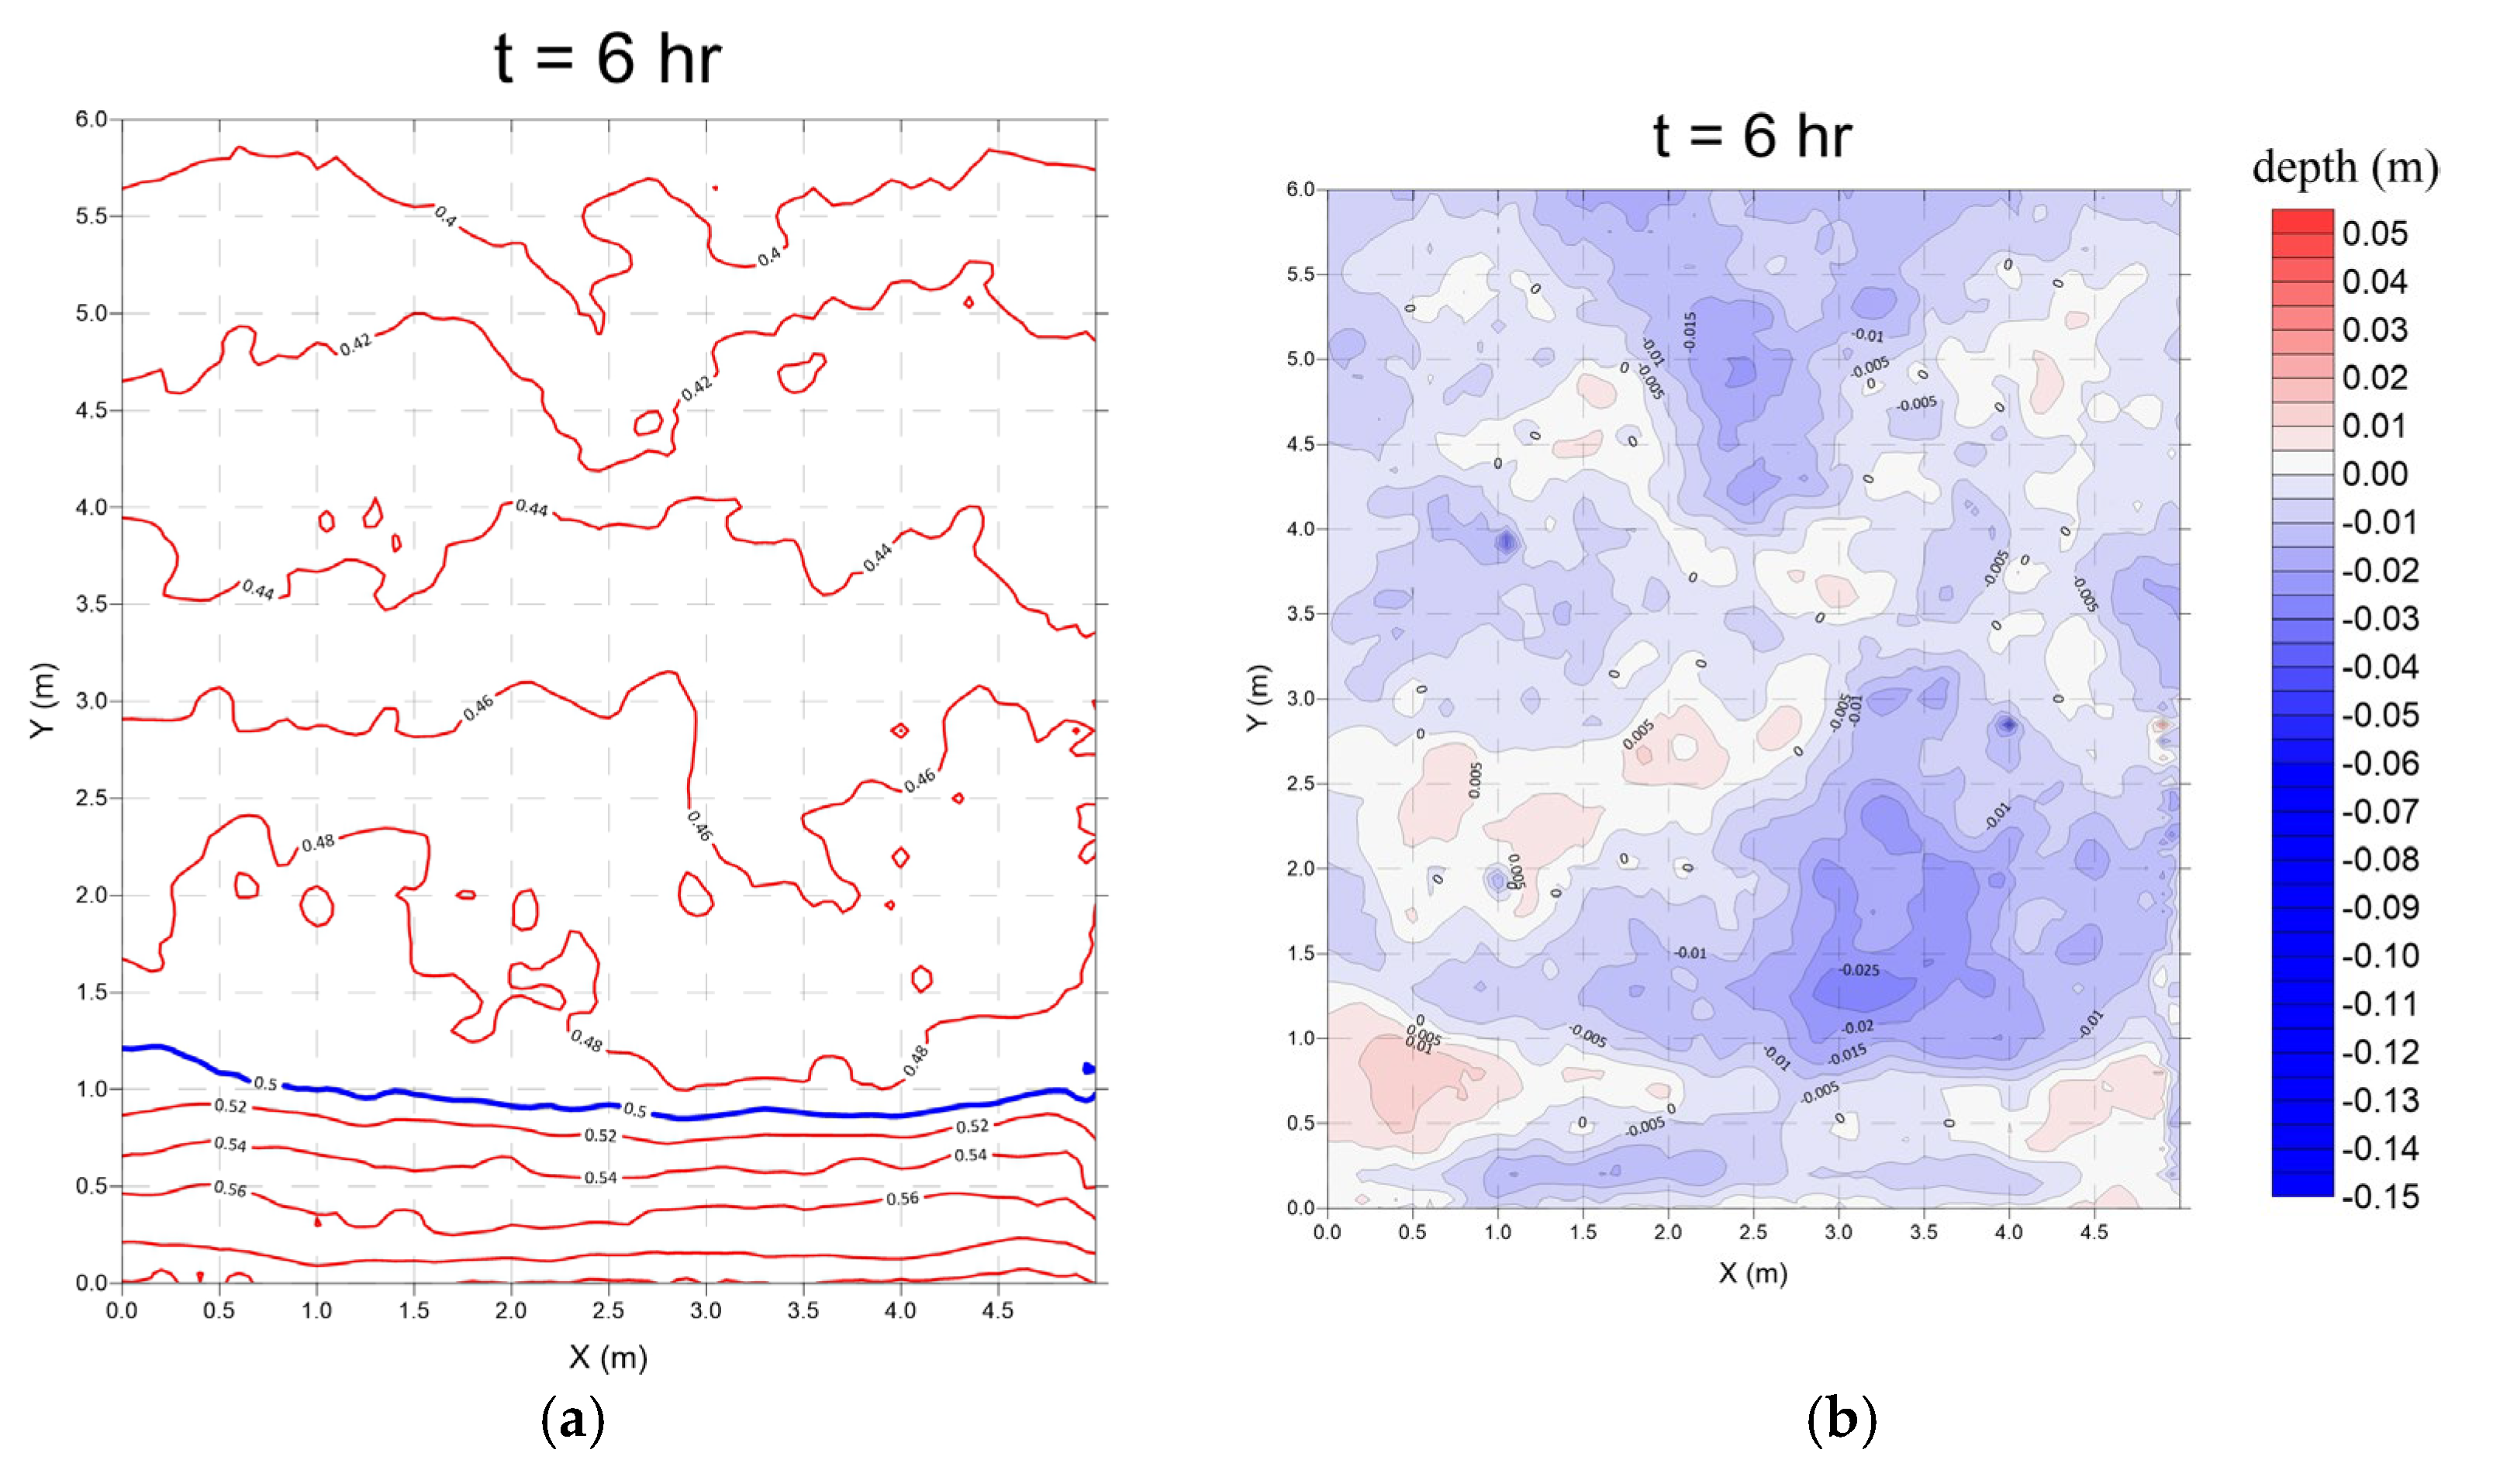
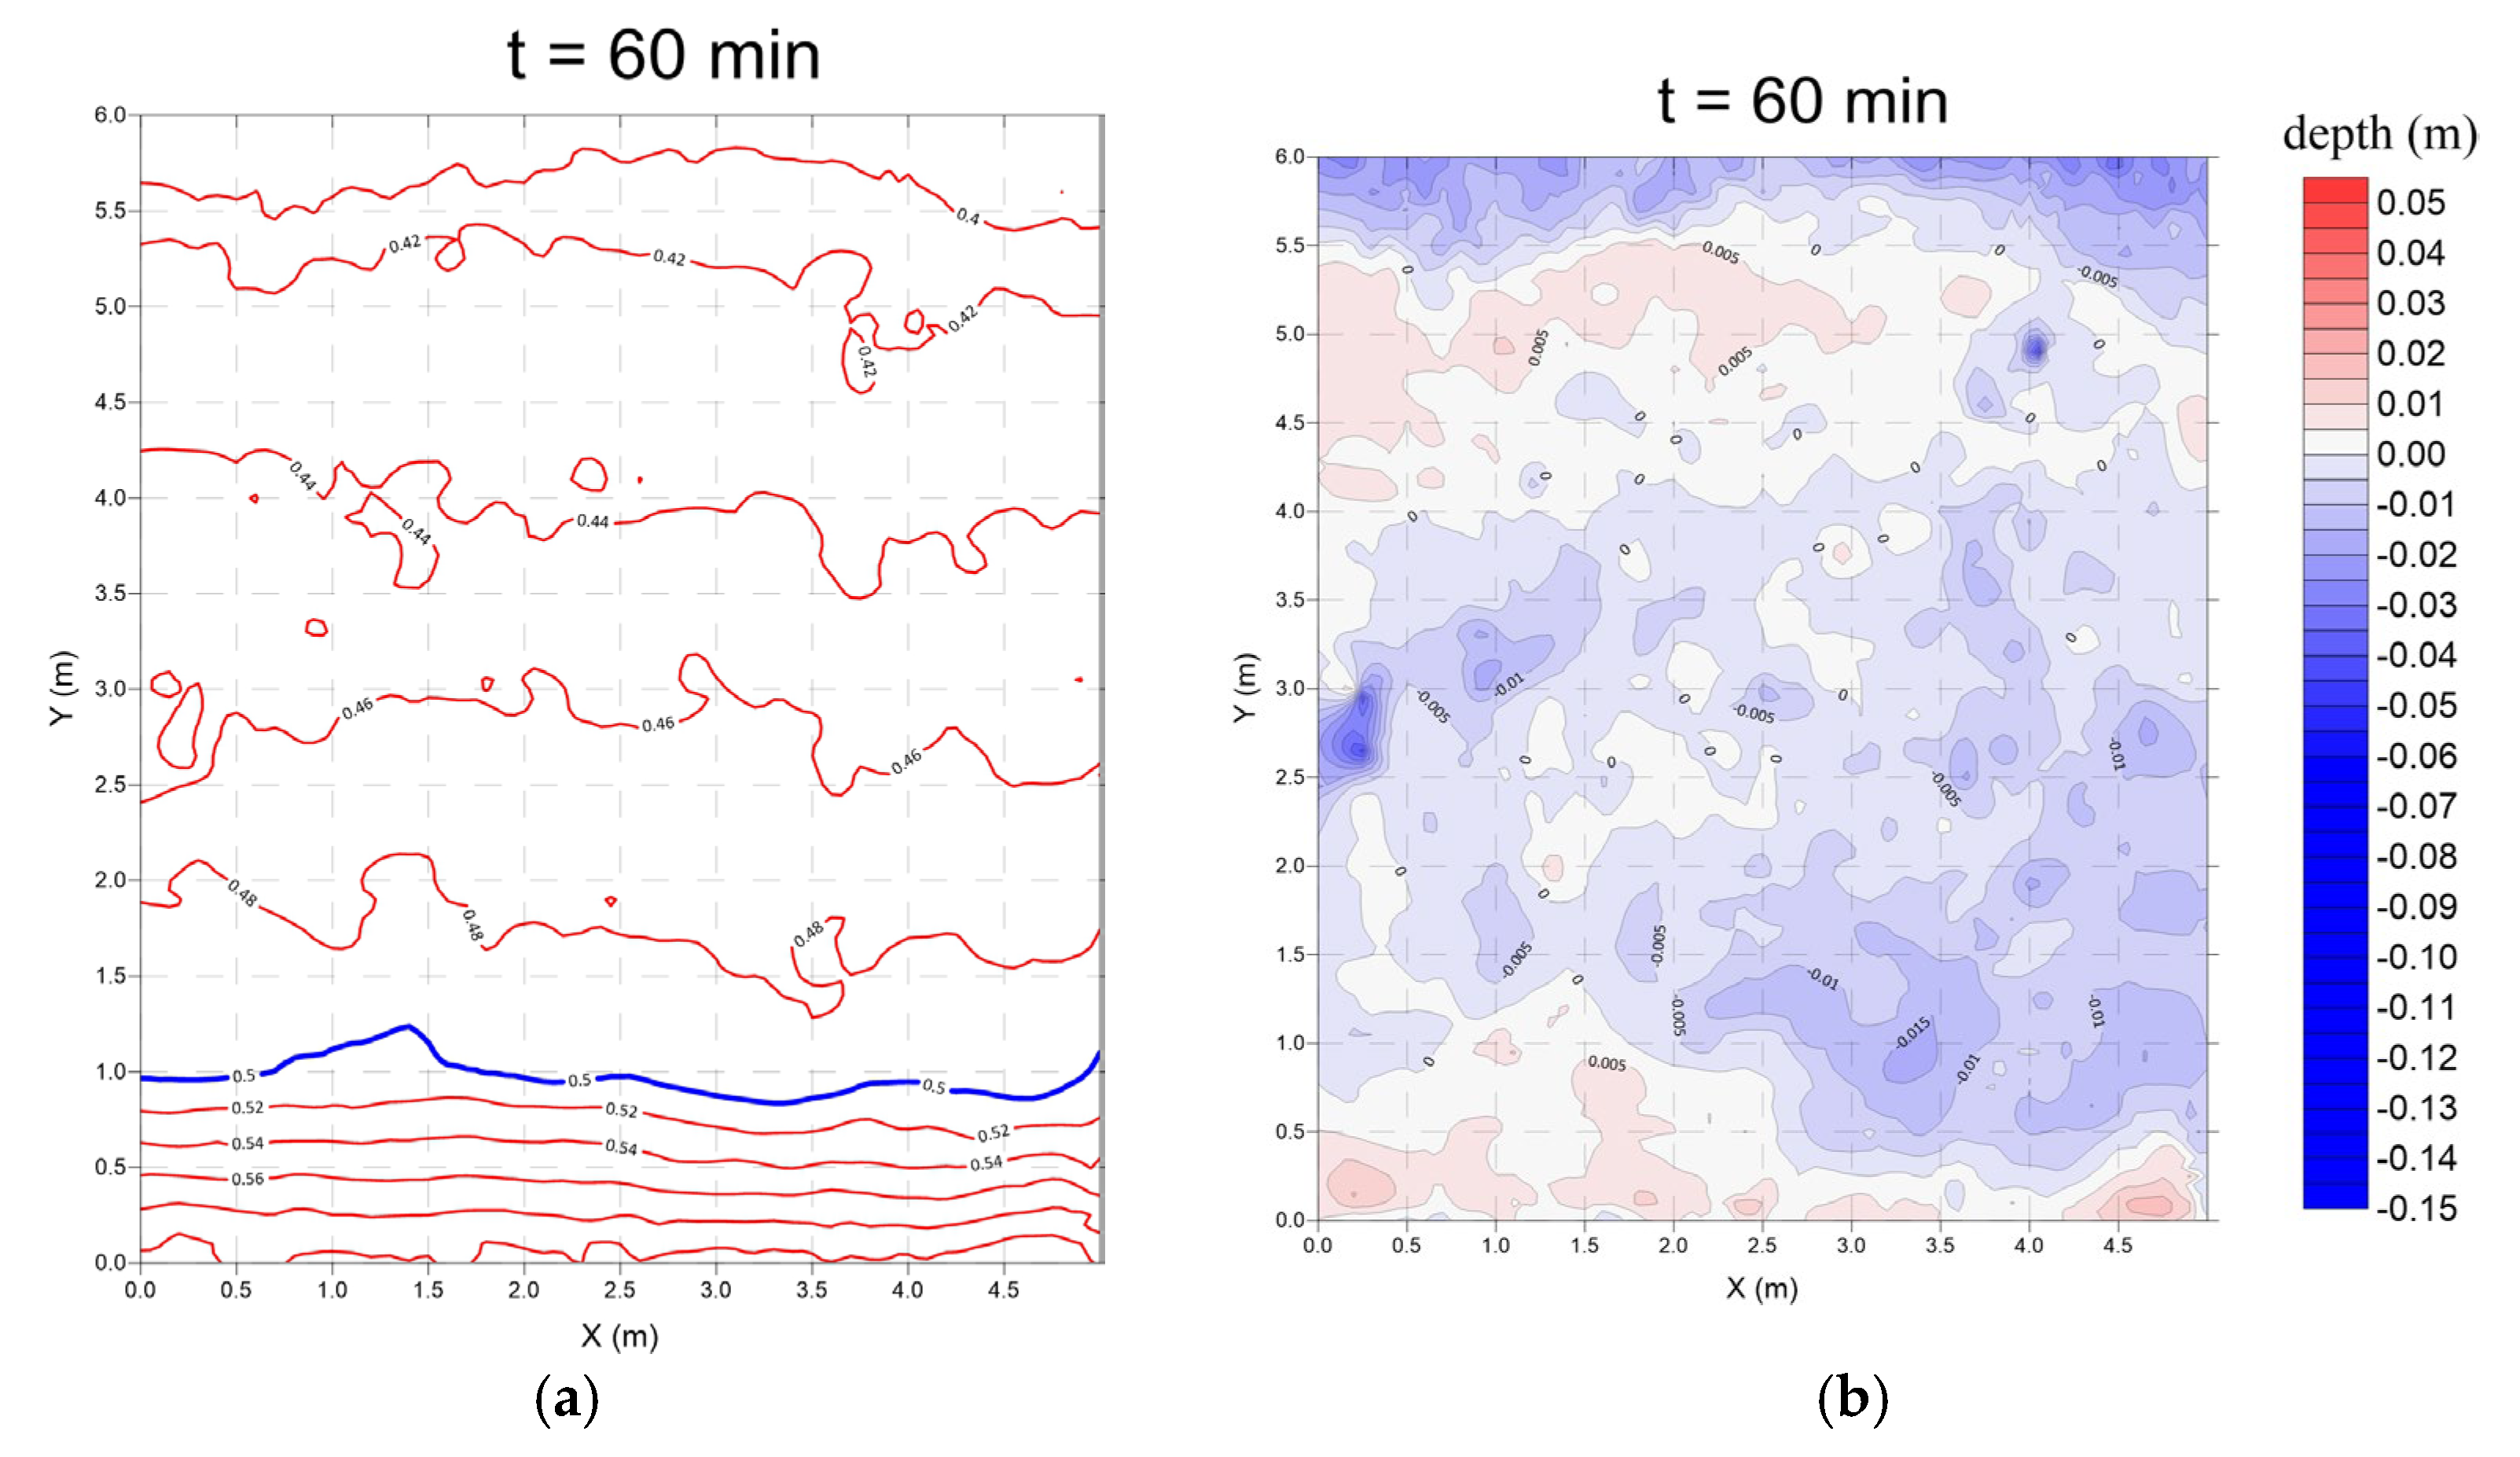
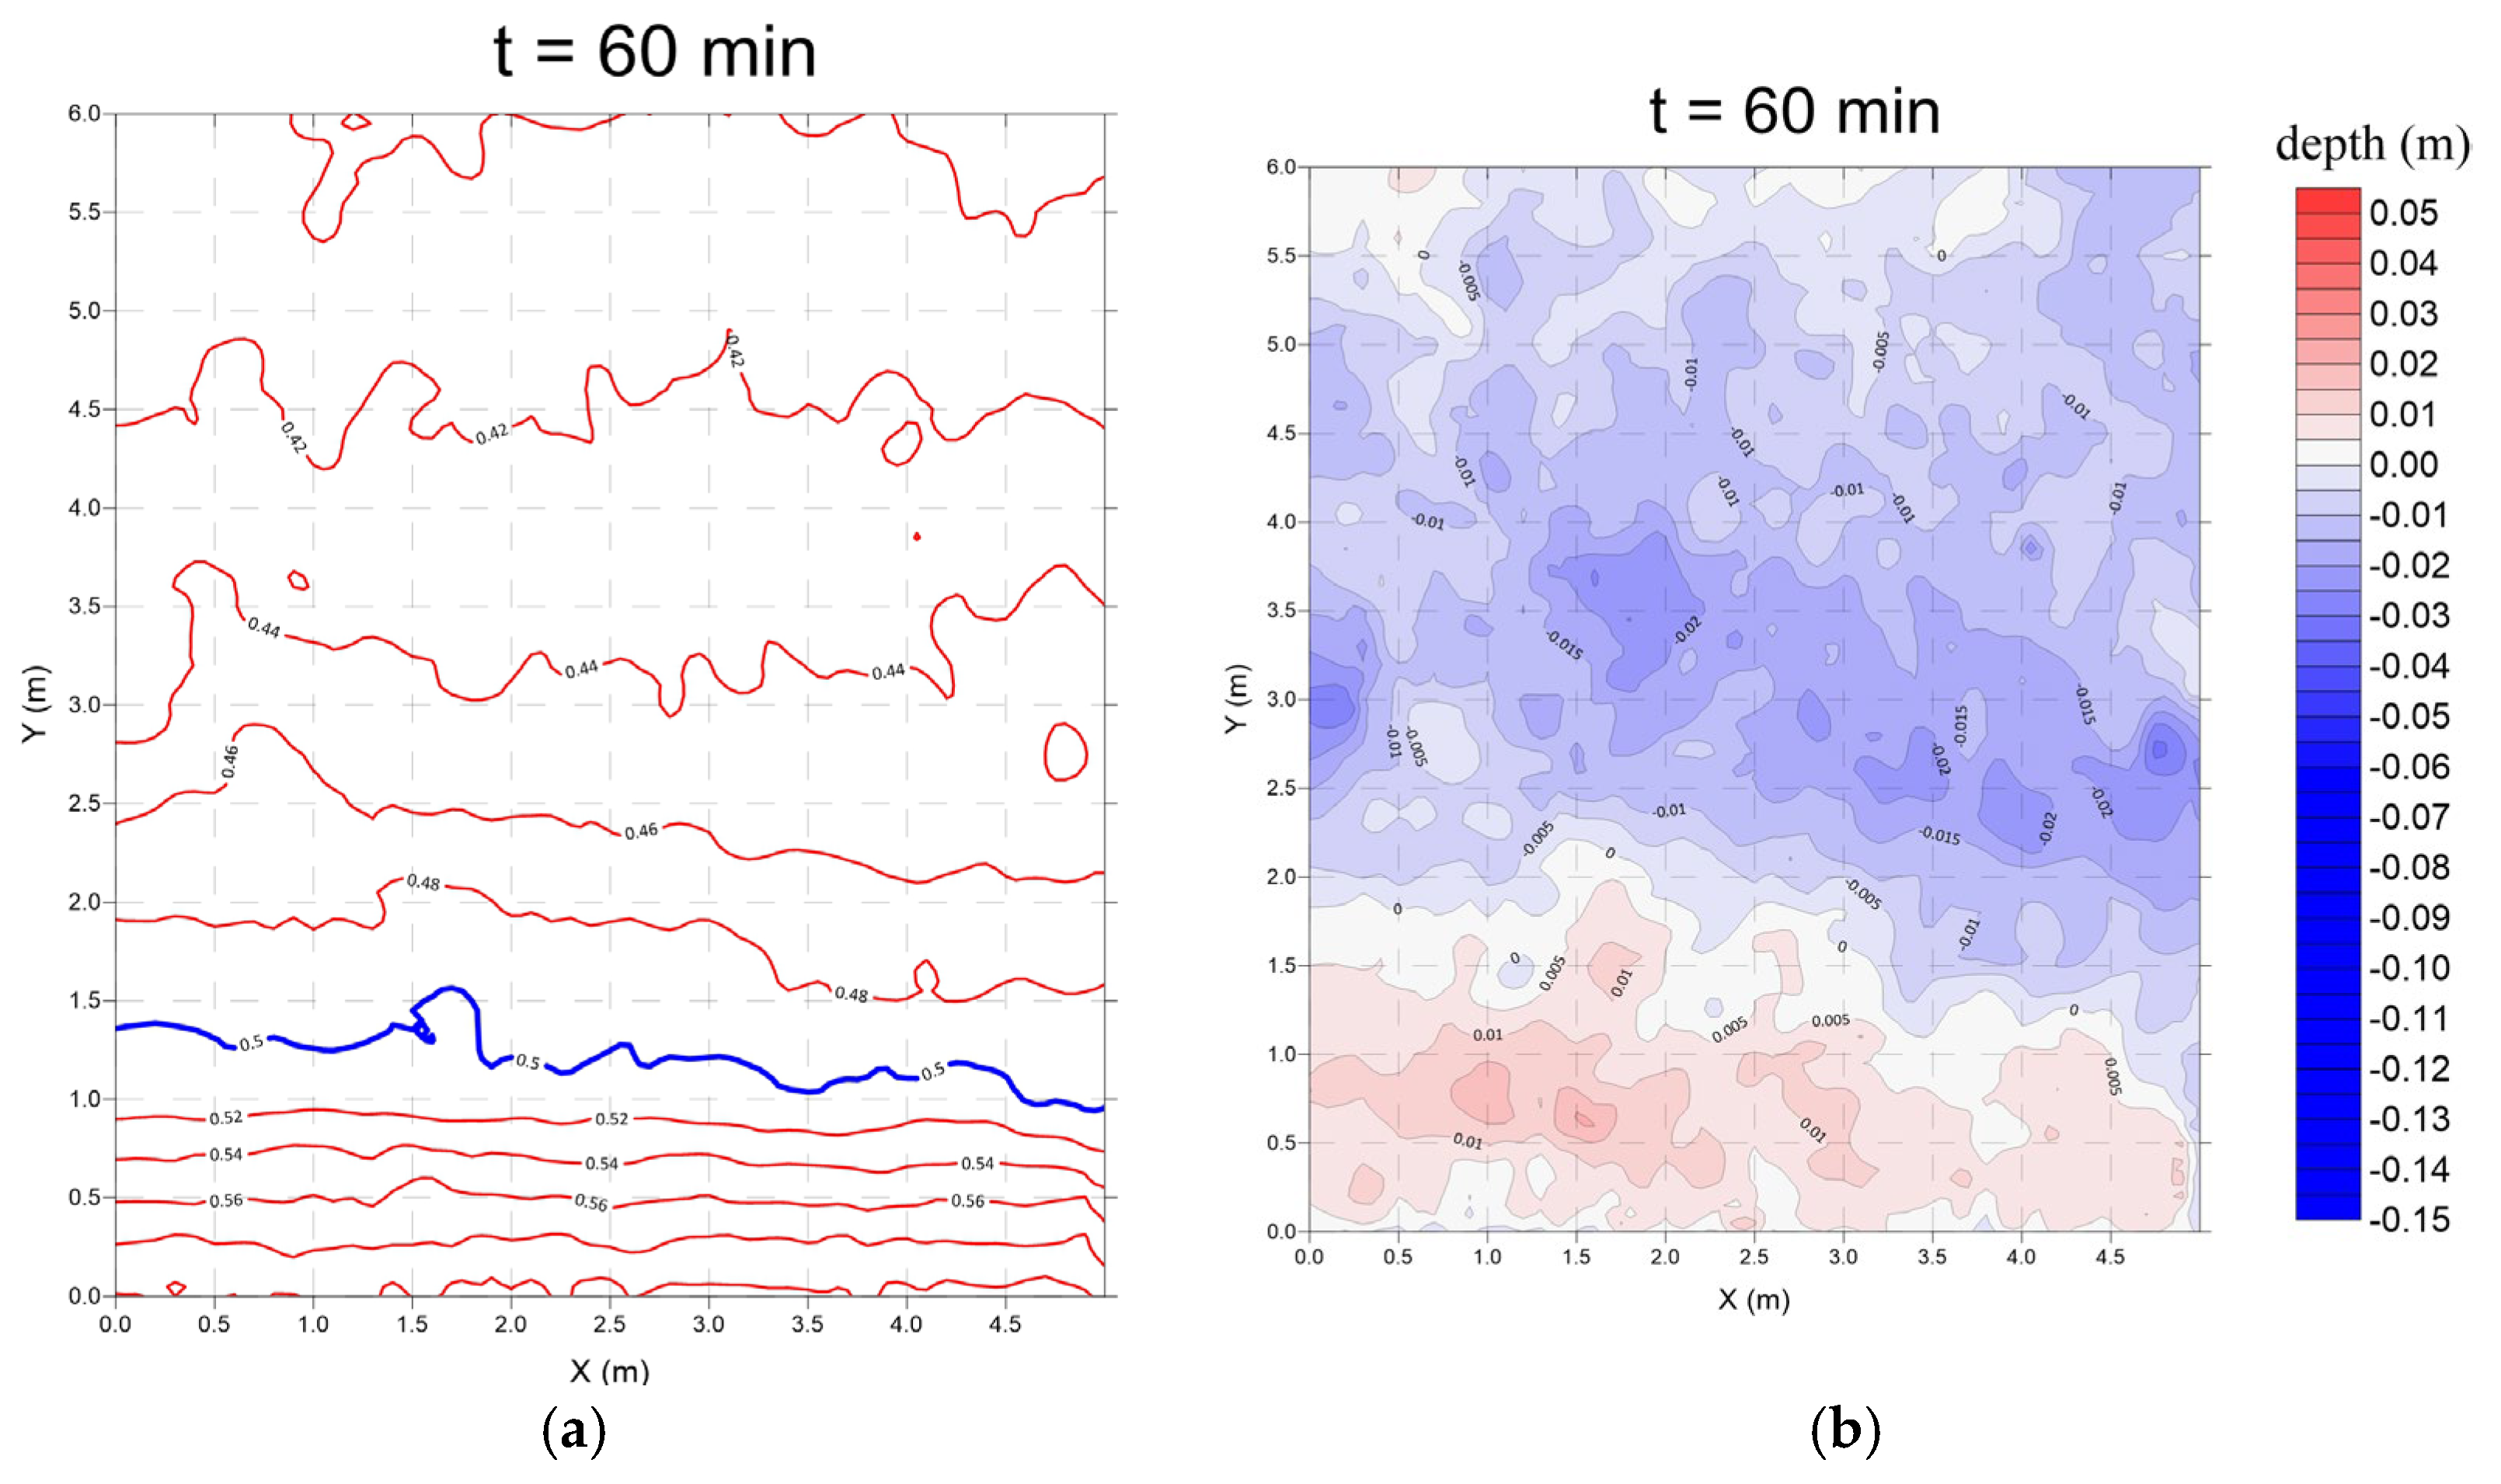
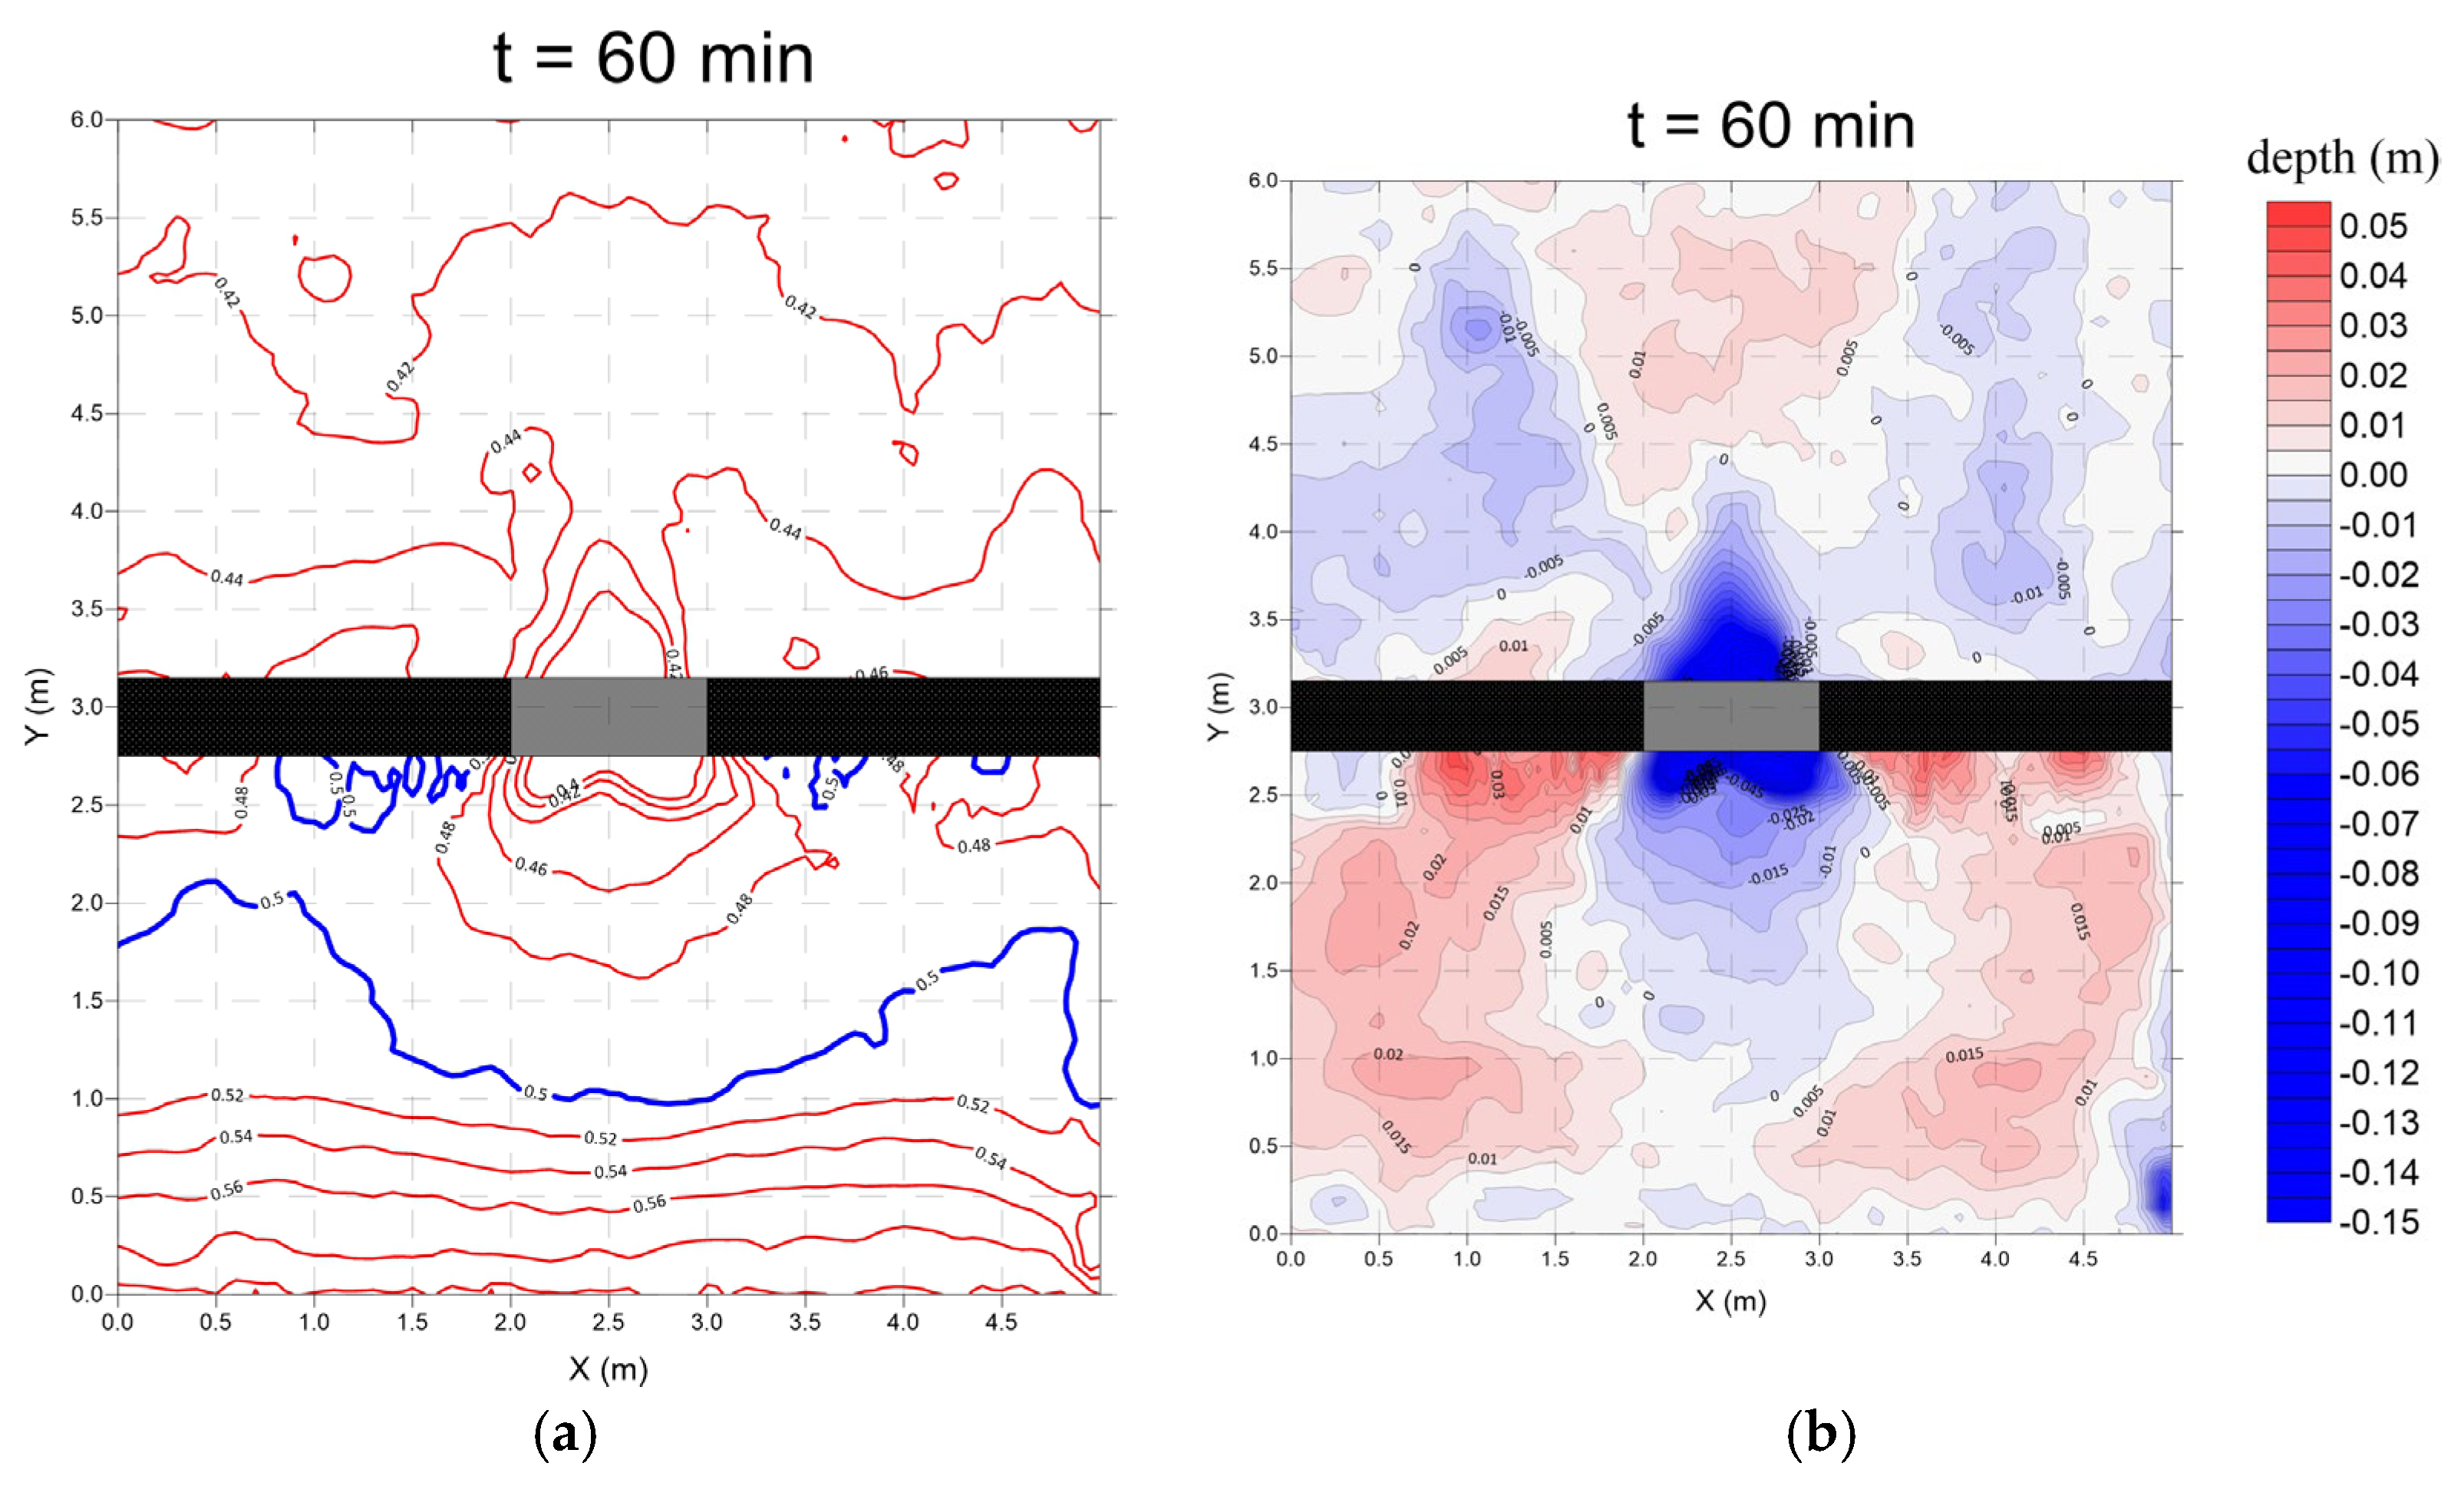
3.1. No Structure (Case 1)

  • Monsoon wave
Case 1 represents the natural field environment without artificial coastal protection structures on the seaward side. By comparing the results under fixed and variable water level conditions, notable differences in seabed response were observed. Under fixed water levels, the seabed morphology remained relatively stable and uniform, with clearly defined spatial boundaries between erosion and deposition zones (Figure 8 and Figure 9a). This indicates that sediment transport tends to follow more consistent and predictable paths when tidal influences are absent.
In contrast, under variable water levels, the seabed exhibited more dynamic and irregular topographic changes. The boundaries between erosion and deposition became blurred, and the overall sediment distribution appeared more scattered and complex (Figure 9b and Figure 10). These findings highlight the destabilizing effect of tidal fluctuations on nearshore sediment transport, emphasizing the importance of incorporating tidal variability into morphological predictions and coastal design considerations.
2.
Typhoon wave
Under typhoon wave conditions, Case 1 exhibited intensified hydrodynamic responses due to the higher wave energy. However, a comparison between the fixed (Figure 11 and Figure 12a) and variable water level (Figure 12b and Figure 13) scenarios reveals that the overall contour line patterns remained relatively similar in both cases, with no significant differences in smoothness or distribution. This suggests that over the short testing duration, tidal fluctuations exerted only a limited influence on large-scale seabed topography under extreme wave conditions.
Localized scour was consistently observed at both seawall heads, indicating areas of concentrated wave and current action. Notably, under variable water level conditions, the scour at these locations appeared less severe; erosion was more evenly distributed, and the maximum depth was shallower compared to the fixed high tide scenario. This implies that water level fluctuations may help disperse hydrodynamic forces, thereby reducing localized erosion intensity near structural boundaries.
In terms of sediment deposition, a broader and more widespread spatial distribution was observed under typhoon wave conditions compared to monsoon conditions. This reflects the increased sediment mobility and landward transport potential induced by high-energy wave action. These results highlight the complex interplay between wave intensity, tidal variation, and sediment dynamics in unprotected coastal environments.

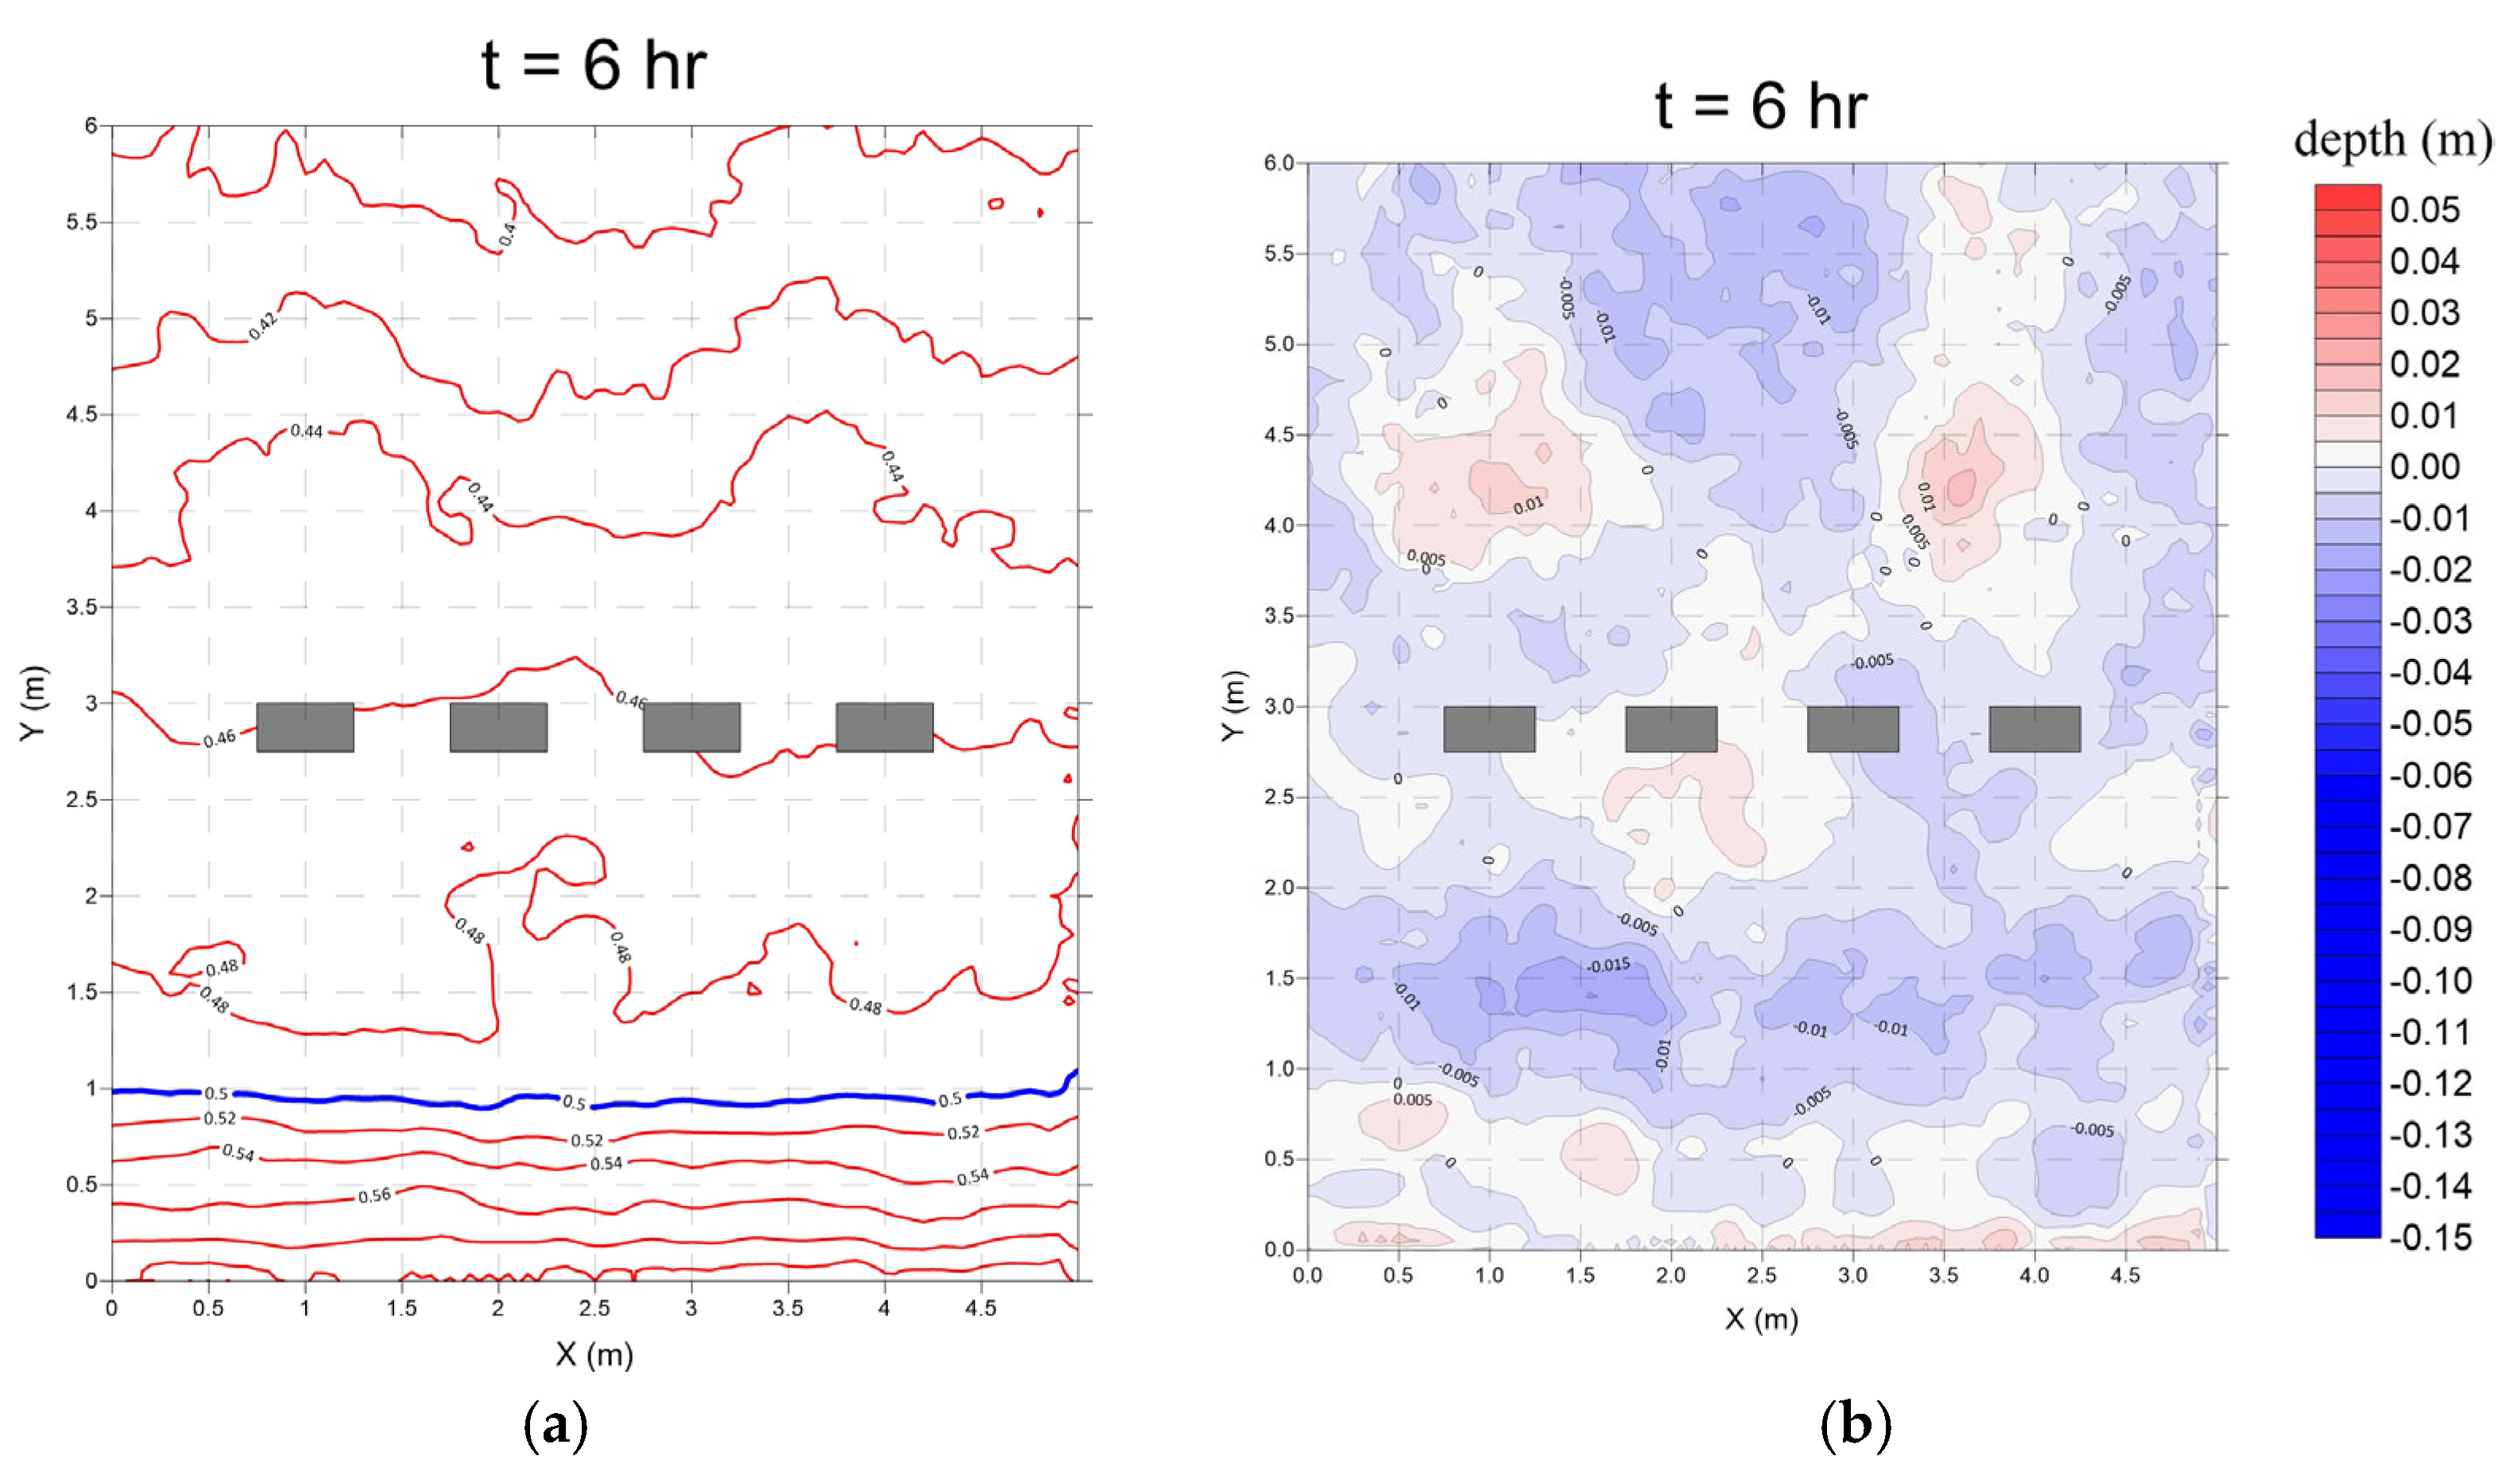
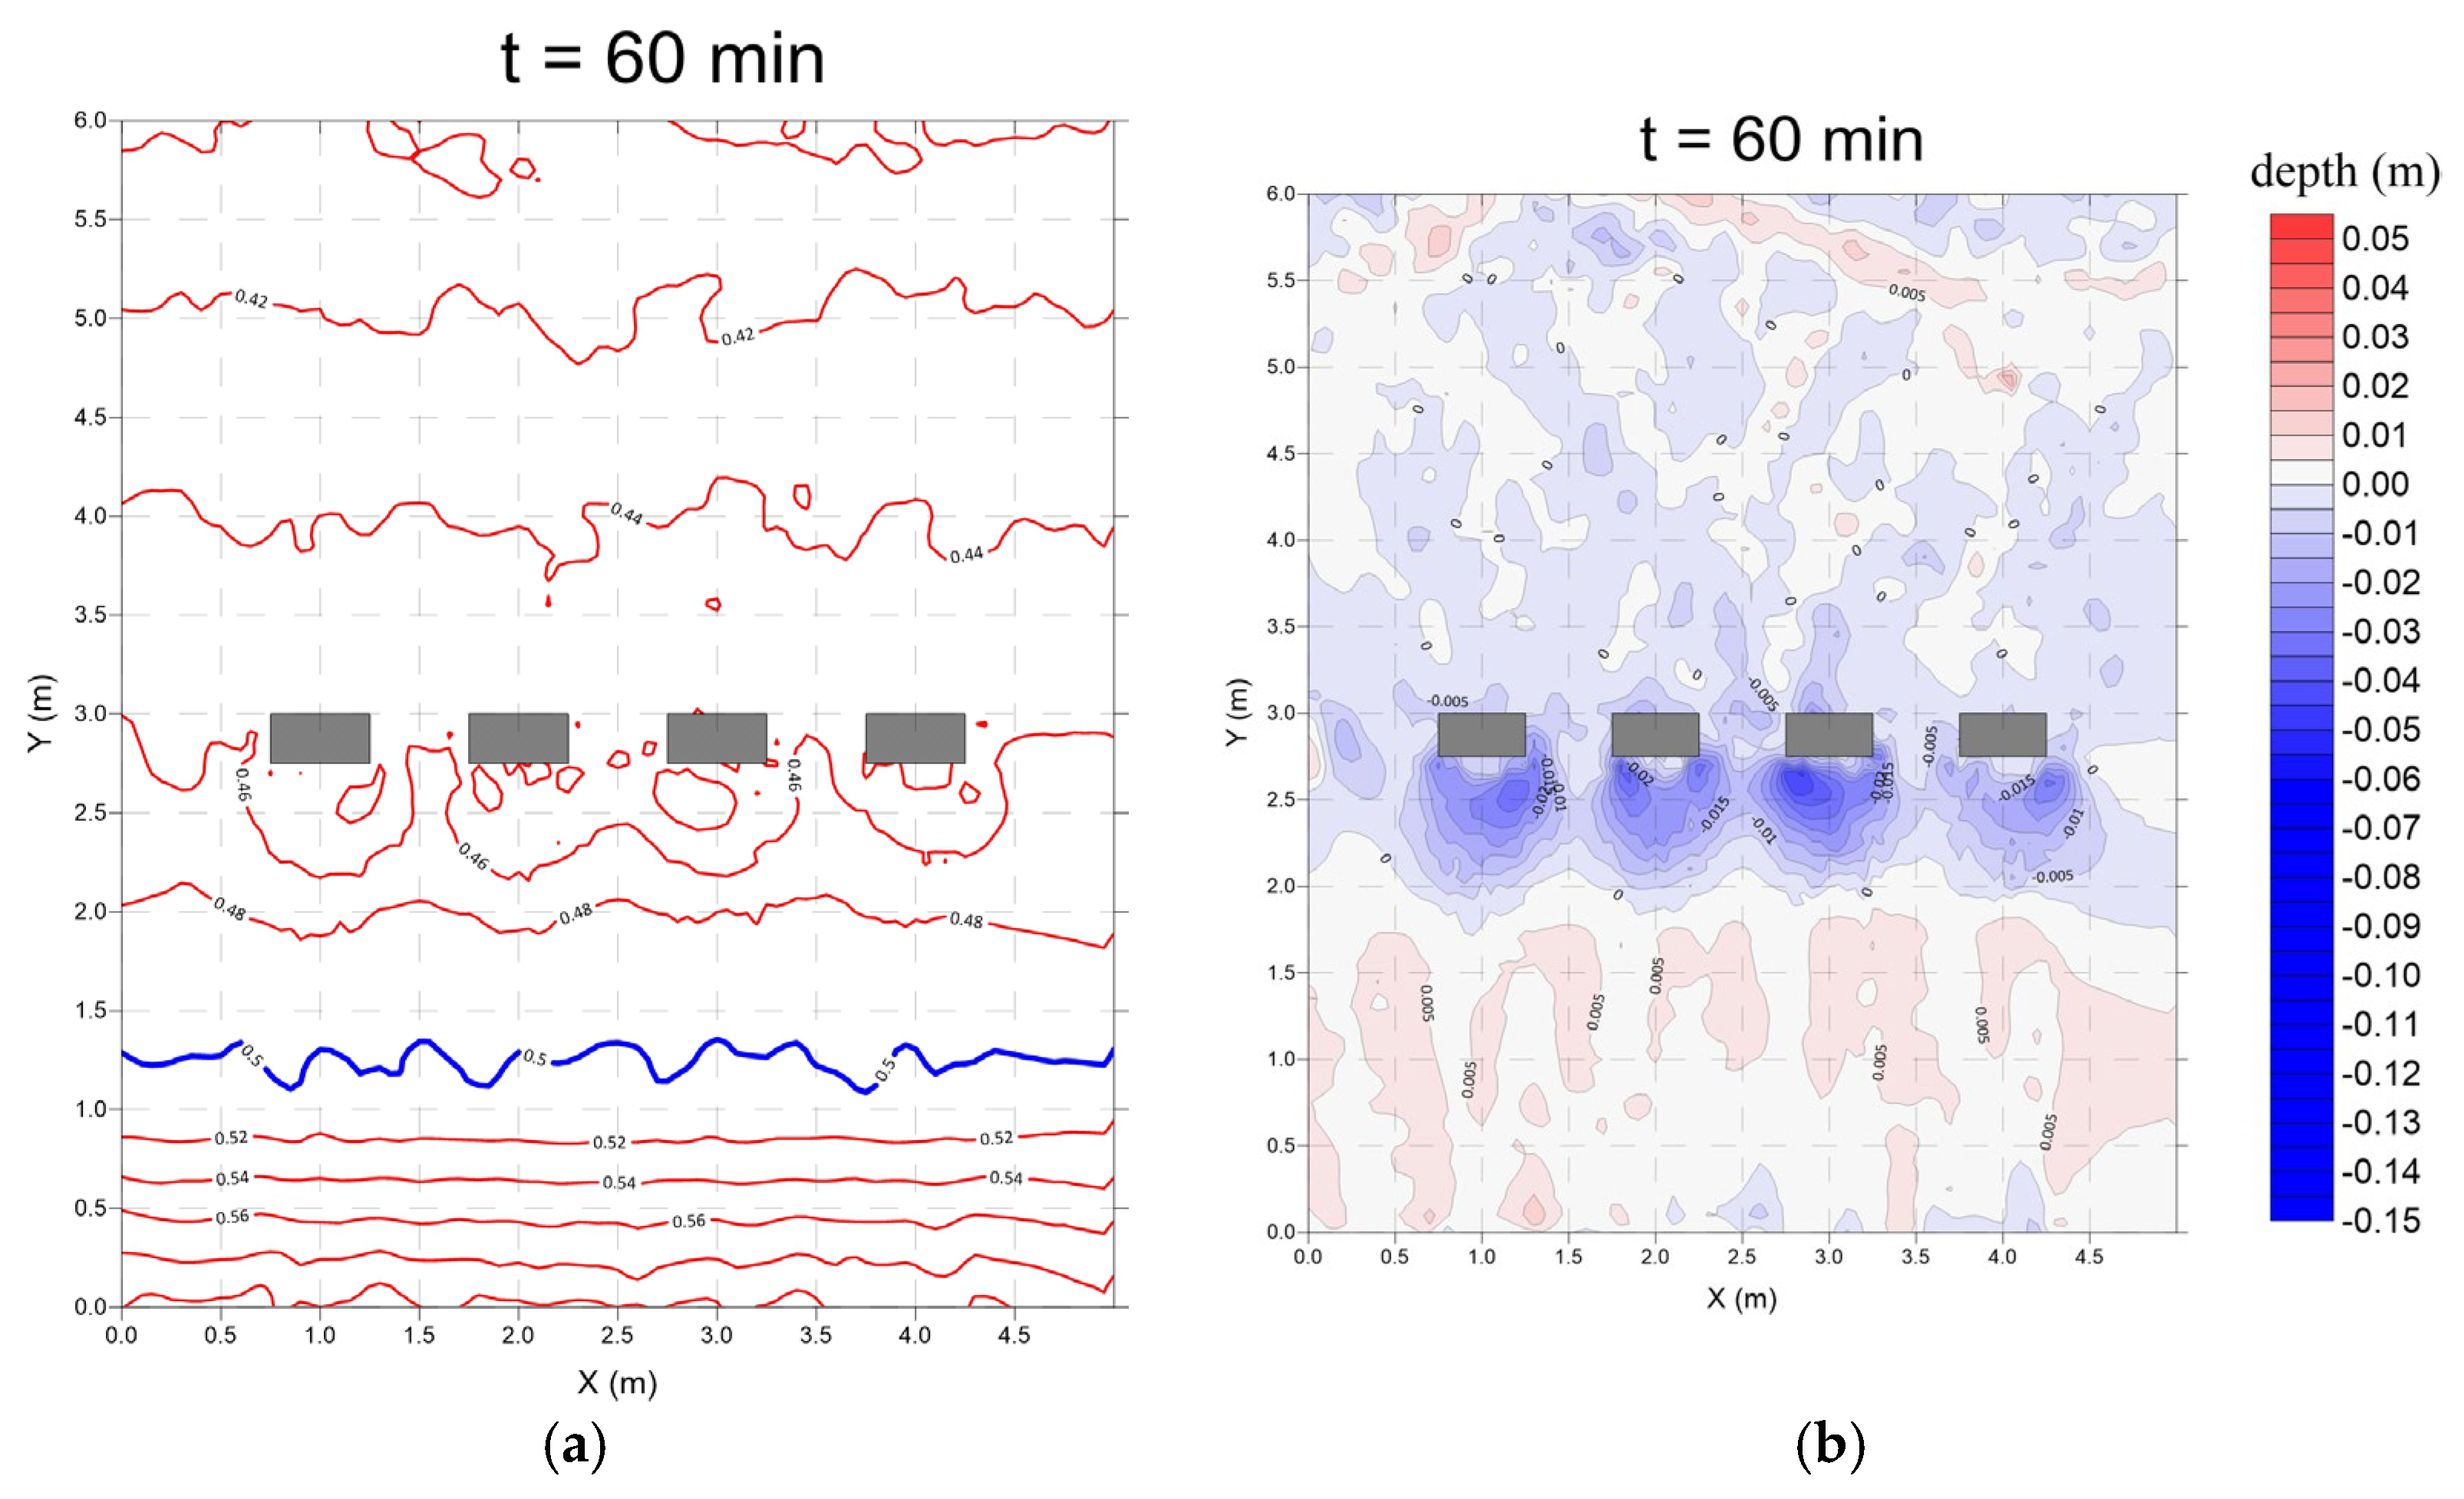
3.2. Submerged Breakwaters (Case 2)

  • Monsoon wave
In Case 2, four submerged breakwaters were installed on the seaward side. The experimental results indicate that this configuration effectively promoted sediment deposition (Figure 14 and Figure 15a). As anticipated, a band-shaped accumulation zone formed in the lee of the breakwaters, indicating reduced sediment mobility and calmer flow conditions in the protected area.
This depositional feature is associated with modifications to the nearshore flow field induced by the breakwaters. By interrupting incoming waves and deflecting nearshore currents, the structures created a more quiescent hydrodynamic environment on the landward side. These conditions allowed suspended sediments to settle more readily and remain undisturbed, facilitating the development and persistence of the observed depositional pattern.
Overall, the formation of this accumulation zone is linked to flow deceleration and turbulence reduction behind the submerged breakwaters, which enhances sediment retention in the sheltered region.
2.
Typhoon wave
Under typhoon wave conditions, the submerged breakwaters similarly demonstrated their effectiveness in enhancing sediment deposition in the landward region. Compared to monsoon conditions, a broader and more continuous accumulation zone was observed, reflecting higher sediment mobility and enhanced landward transport driven by strong wave forcing (Figure 15b and Figure 16). These findings underscore the complex interaction between wave energy, tidal variation, and structural influence in shaping coastal morphology.
However, localized scour was notably observed at the ends of the submerged breakwaters, as well as at the seawall heads on both sides of the basin. The scour near the breakwater end was primarily caused by wave diffraction, which led to flow concentration and turbulence around the structural boundaries. In contrast, erosion around the seawall heads resulted from a combination of wave reflection, flow convergence, and corner-induced turbulence, intensifying local hydrodynamic forces and sediment transport.

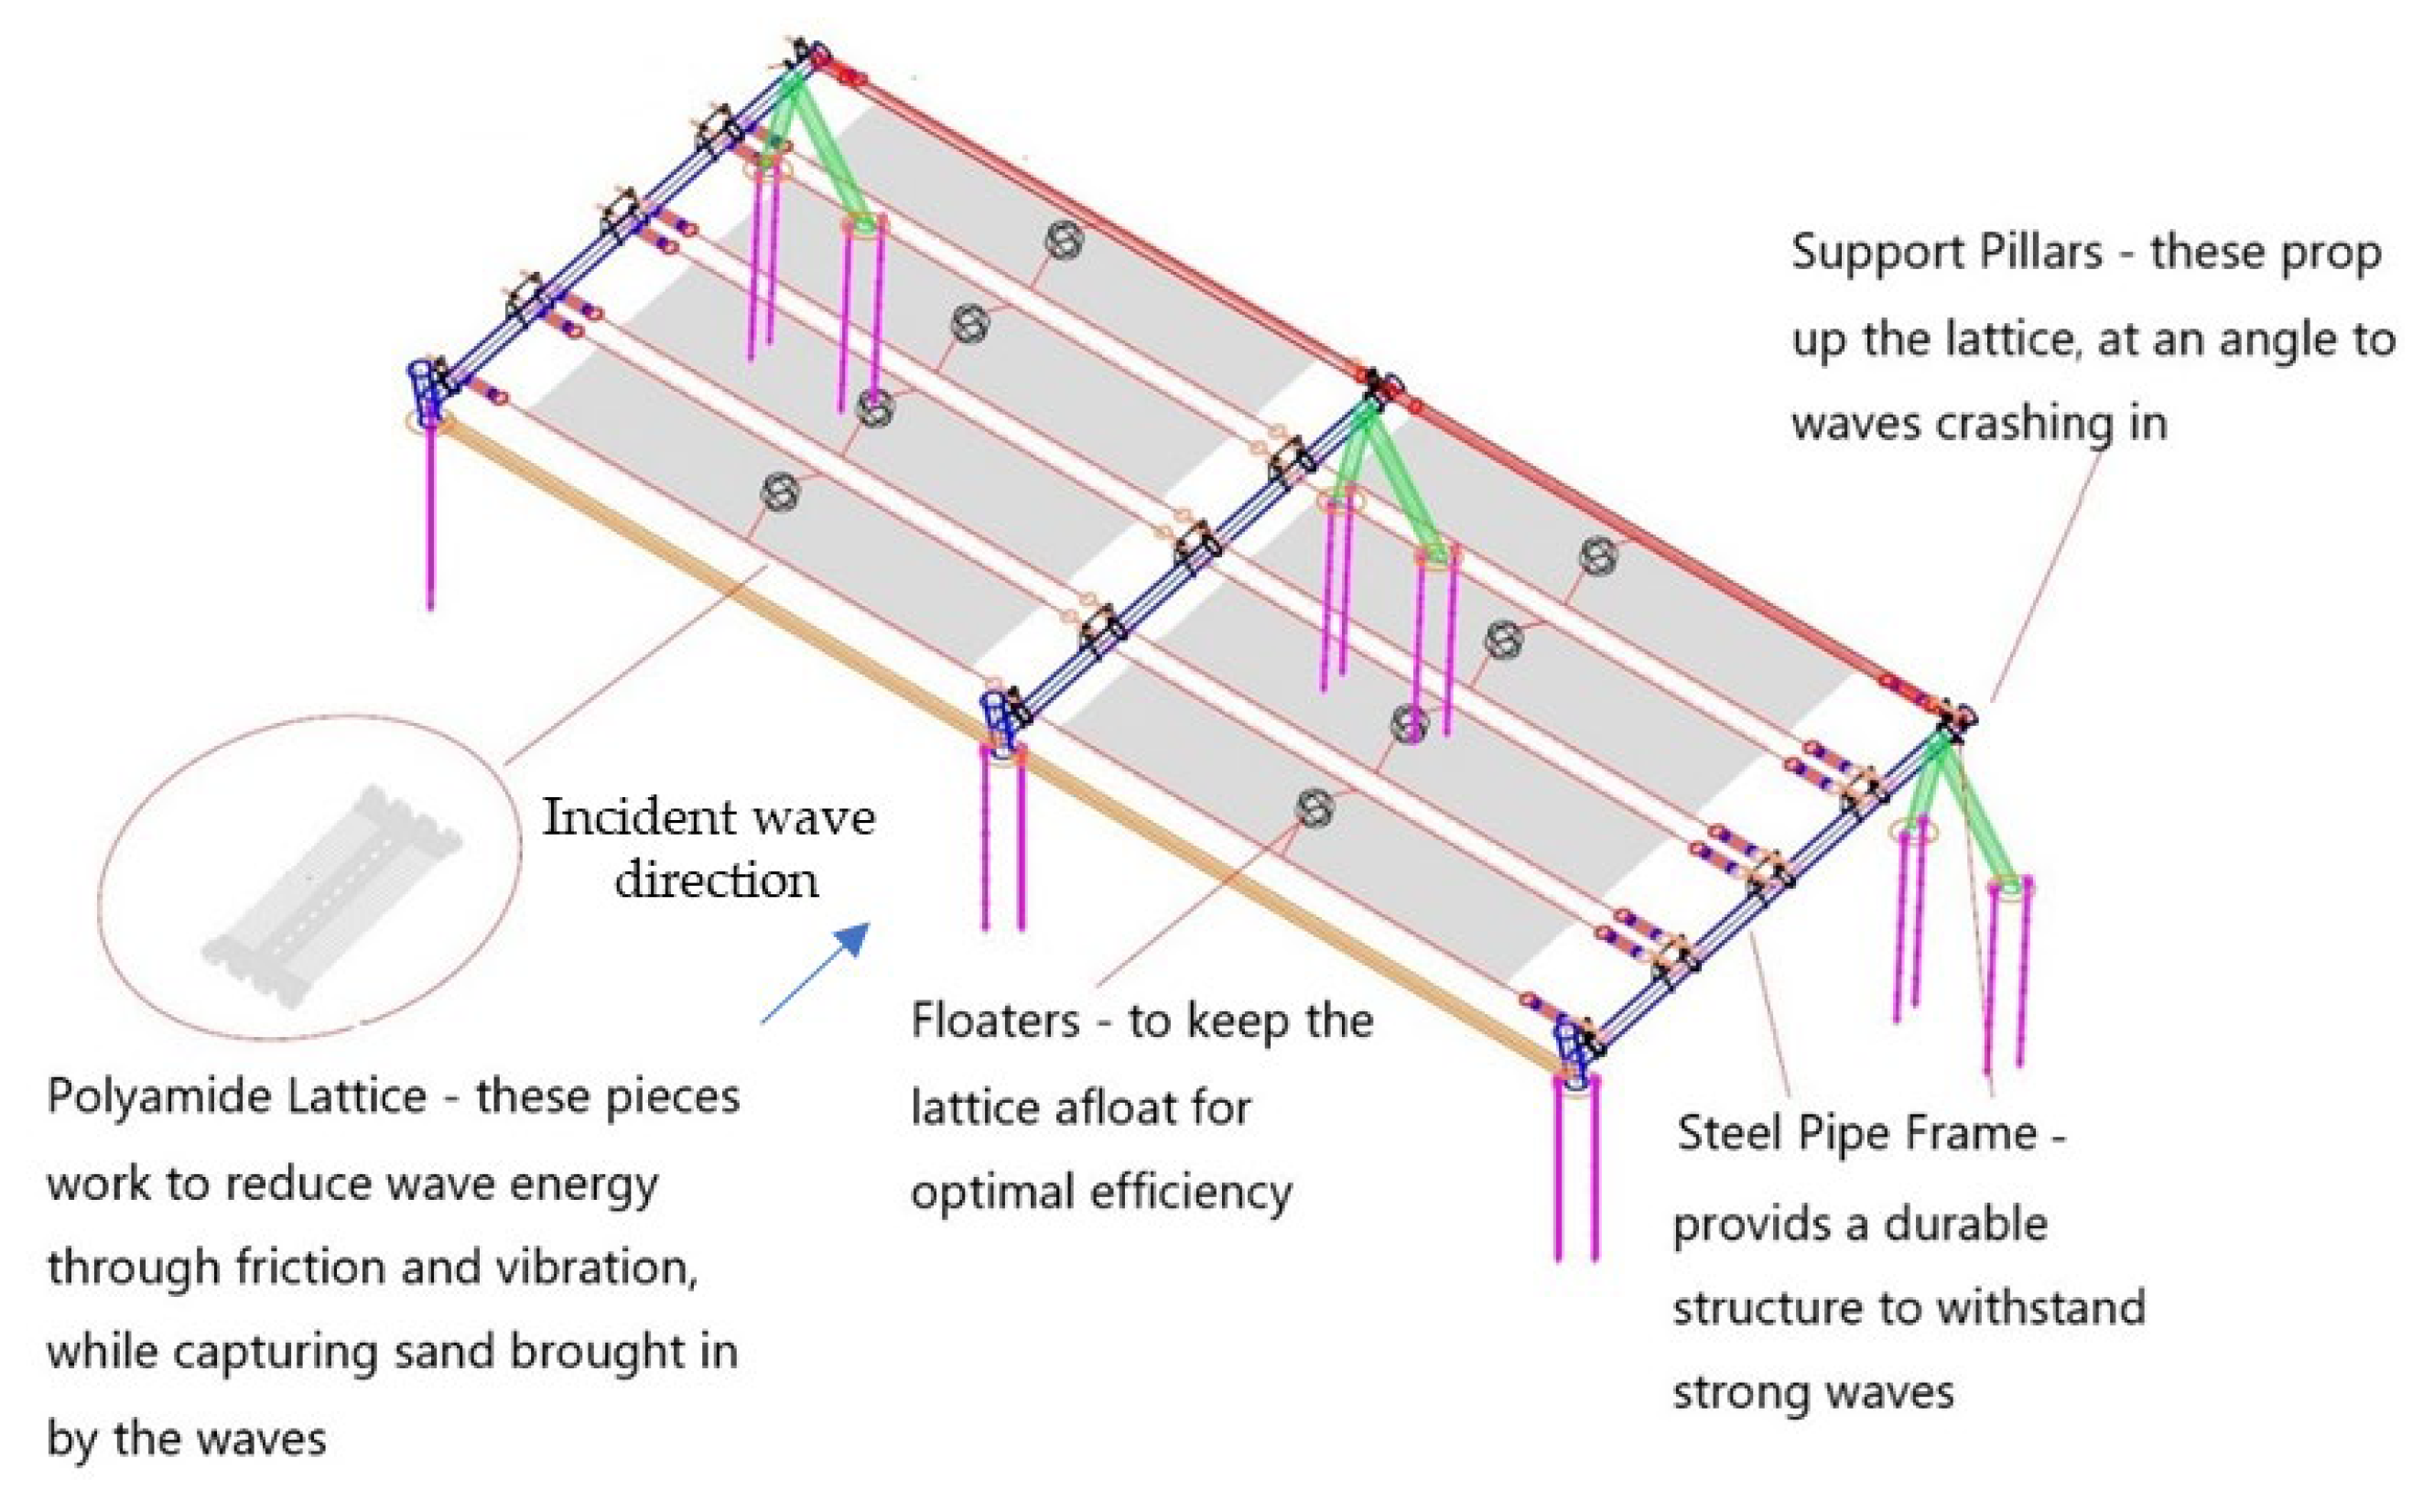
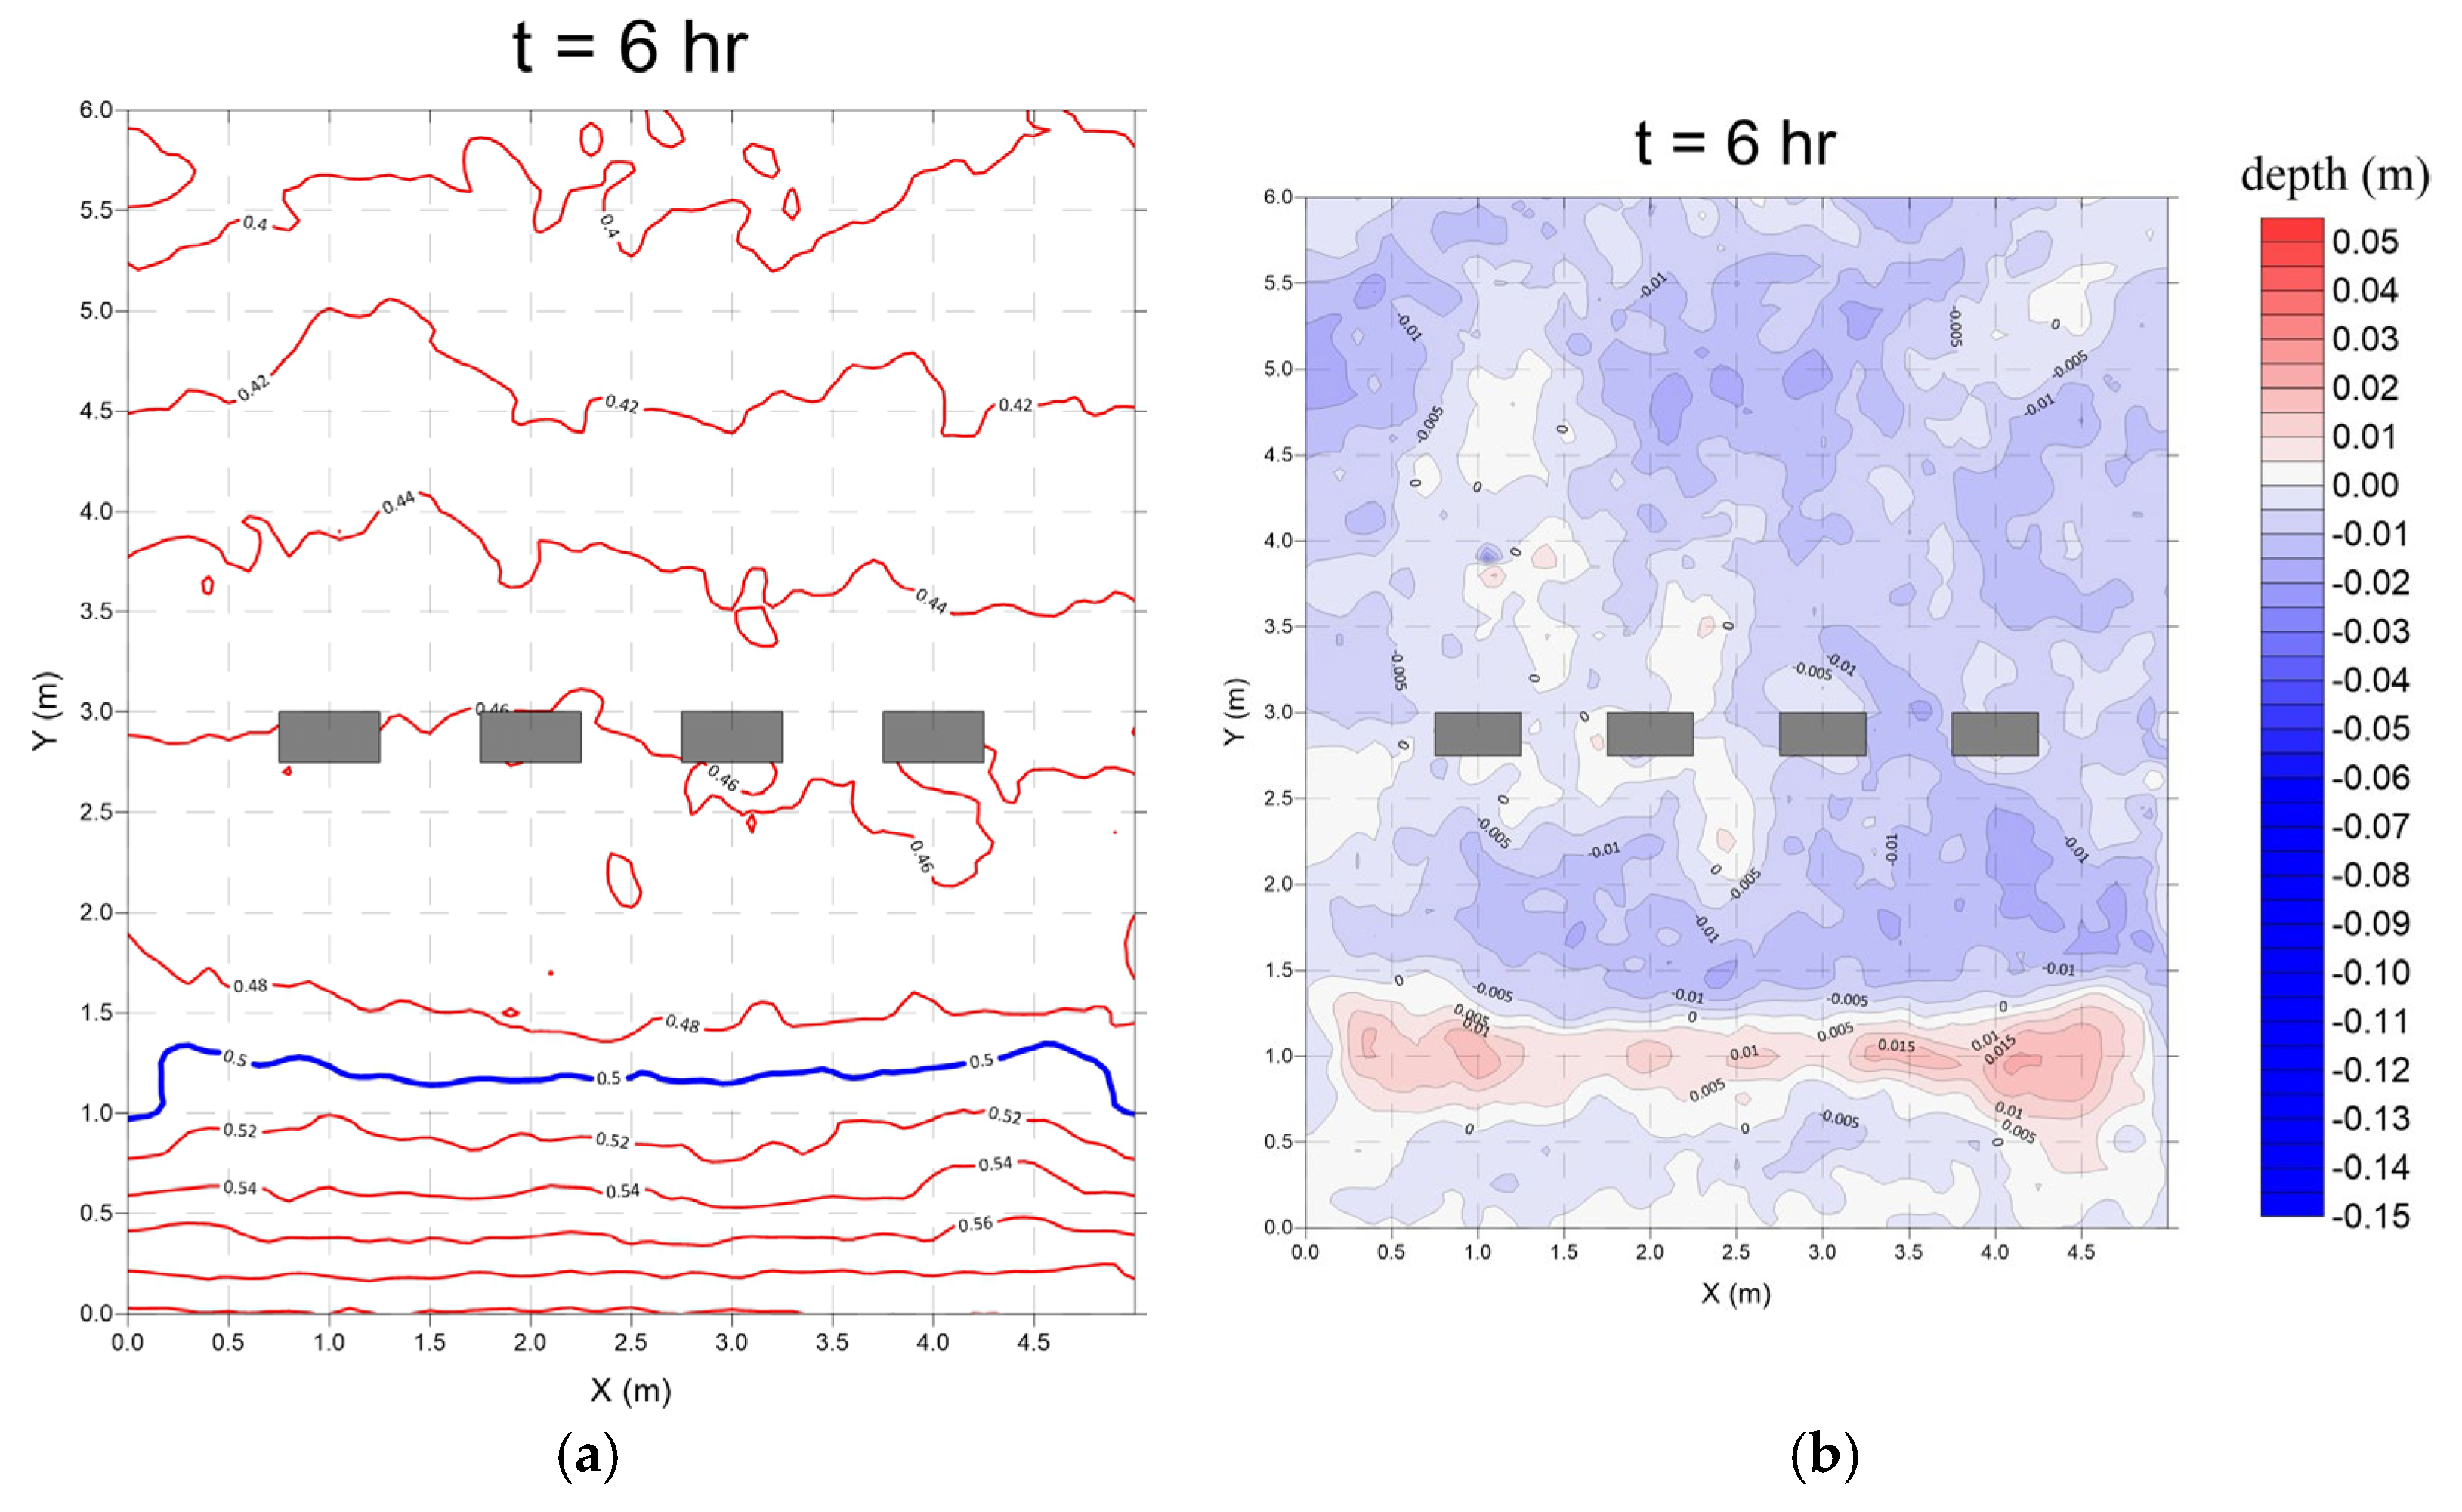
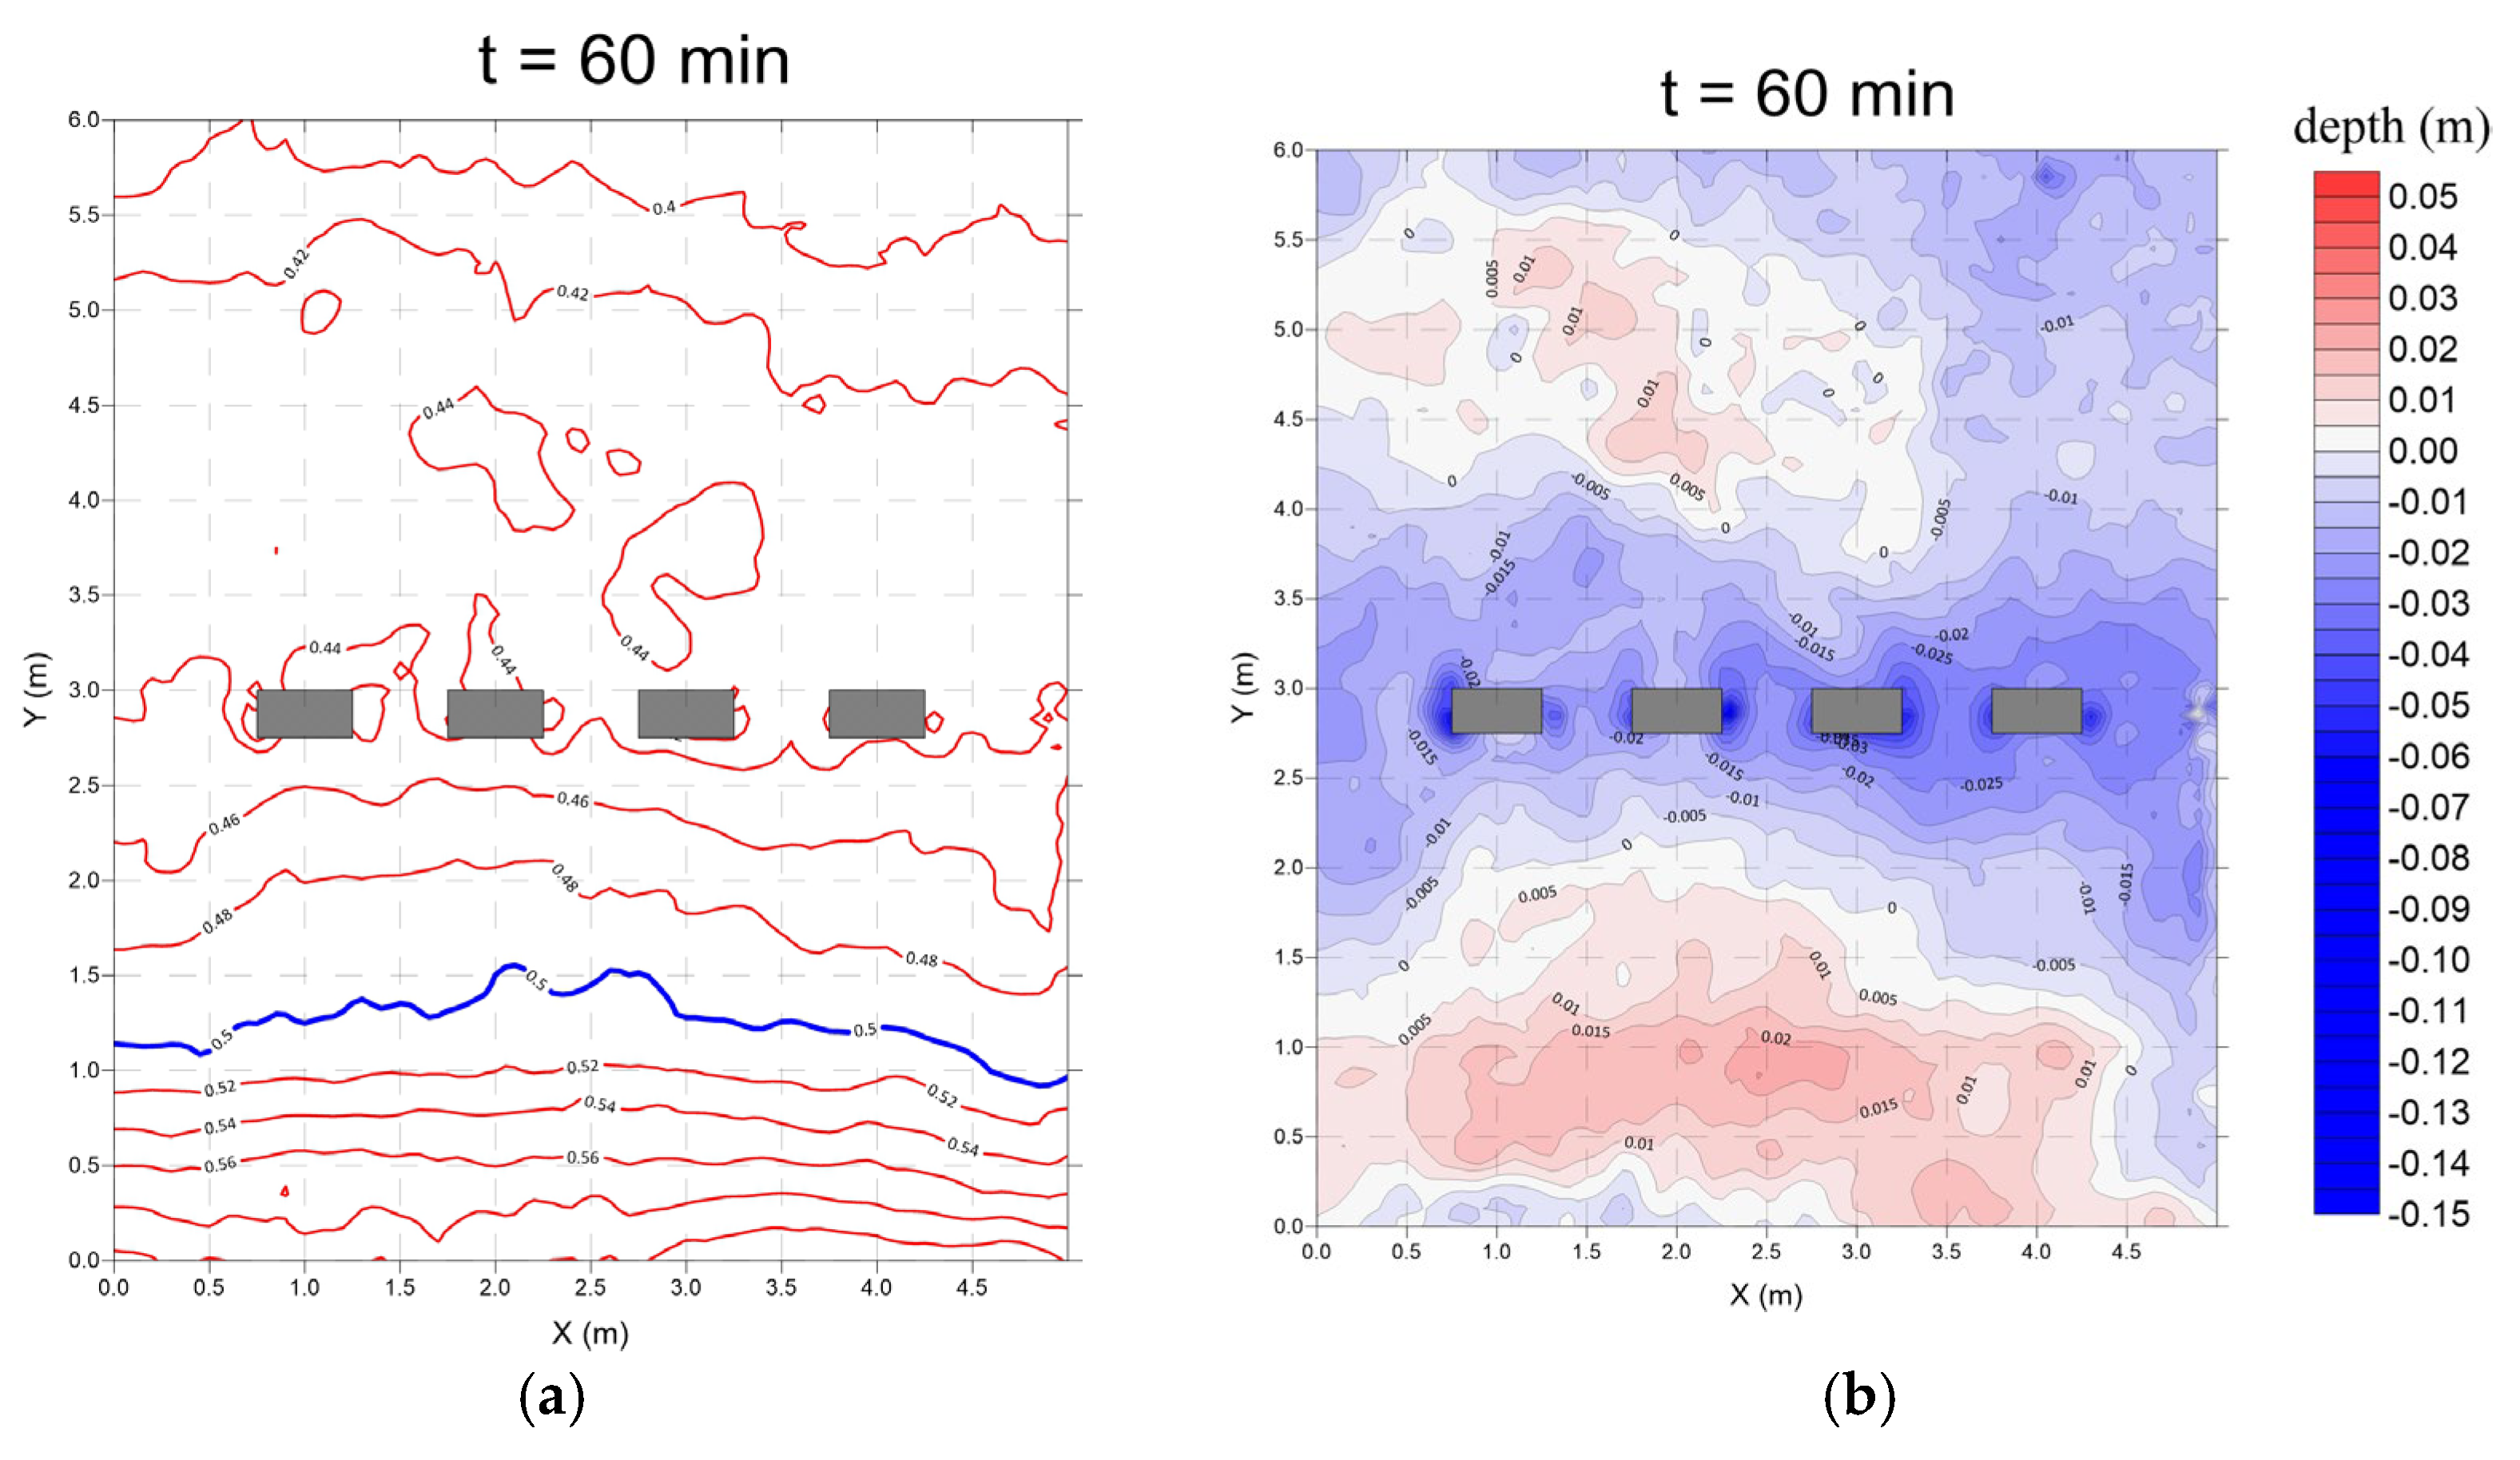
3.3. Derosion Lattices (Case 3)

  • Monsoon wave
In Case 3, four derosion lattices were installed on the seaward side as a soft engineering approach for coastal protection. Due to their high permeability, the structures allowed water to pass through, resulting in a more evenly distributed hydrodynamic environment and helping to reduce localized erosion caused by wave diffraction or reflection.
The experimental results showed that the derosion lattices effectively moderated seabed changes, with sediment transport appearing more uniform. No distinct band-shaped deposition was observed behind the structures, and no clear boundary was present between erosion and deposition zones (Figure 17 and Figure 18a). This phenomenon may be related to the elevation of the derosion lattices, which were slightly higher than the still water level, thereby enhancing the extent to which waves and currents could pass through the structure.
Overall, the derosion lattices, unlike rigid structures that forcefully redirect waves, provided a balance between coastal protection and water exchange, while preserving internal flow dynamics within the protected area.
2.
Typhoon wave
Under typhoon wave conditions, the derosion lattices demonstrated a similarly effective role in stabilizing the seabed morphology (Figure 18b and Figure 19). Compared to monsoon wave conditions, sediment deposition extended over a wider area, and a continuous band-shaped sediment accumulation zone was observed behind the structures, indicating enhanced sediment retention under stronger wave forcing.
In addition to the increased deposition, pronounced localized scour was observed immediately behind the derosion lattices. The erosion pattern extended outward in a fan-shaped manner from the rear of the structures, suggesting that flow retained considerable energy after passing through the derosion lattices. These results indicate that while the derosion lattices helped dissipate wave energy and promote sediment deposition, they also allowed flow penetration. Under stronger wave forcing, the flow may pass directly through the structure, further intensifying seabed response behind the derosion lattices.

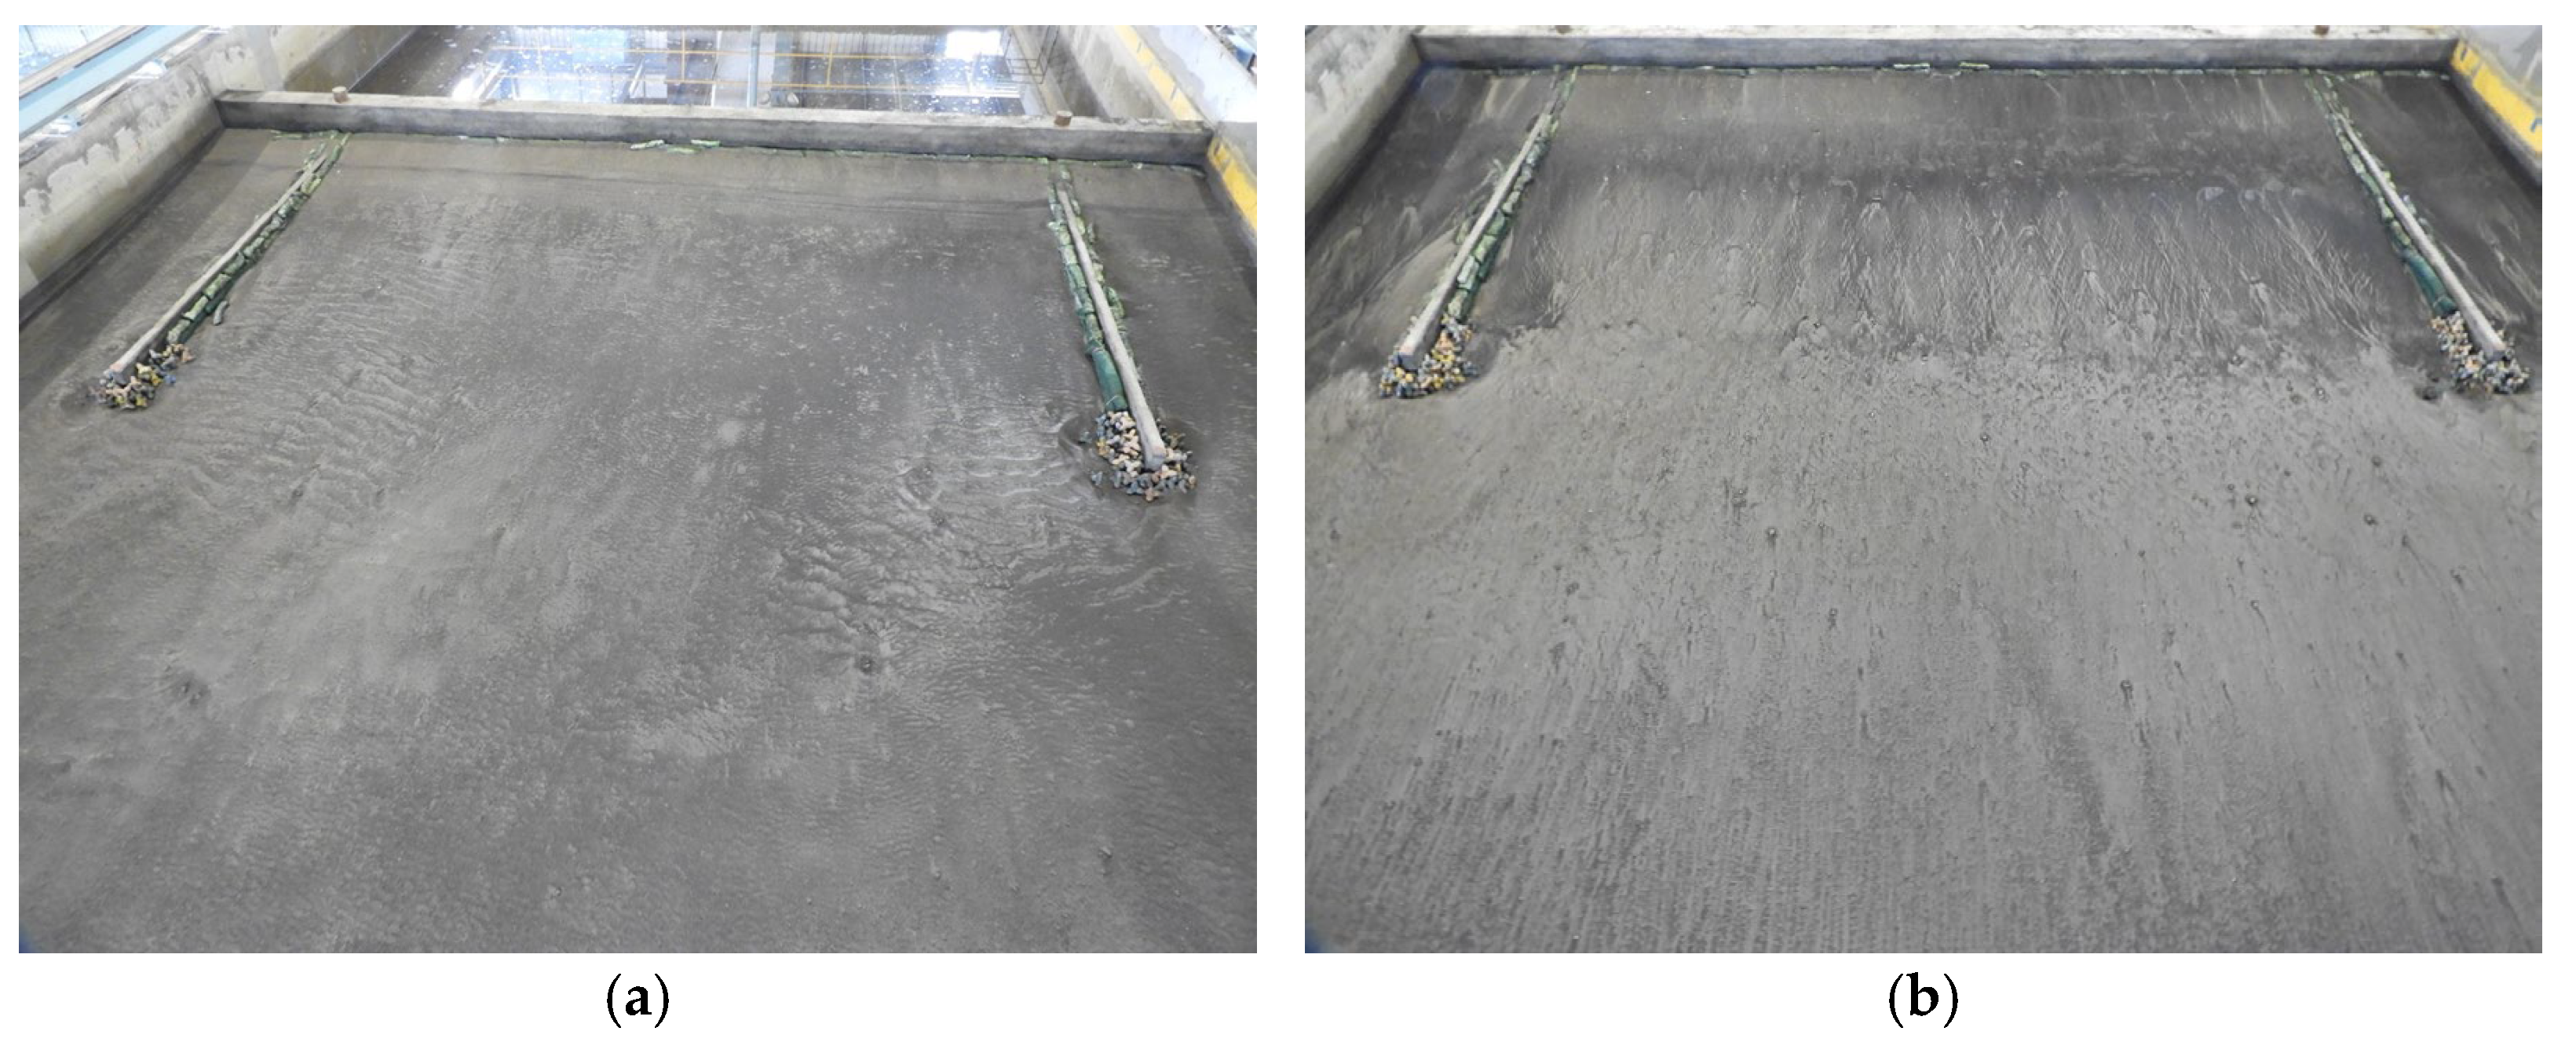
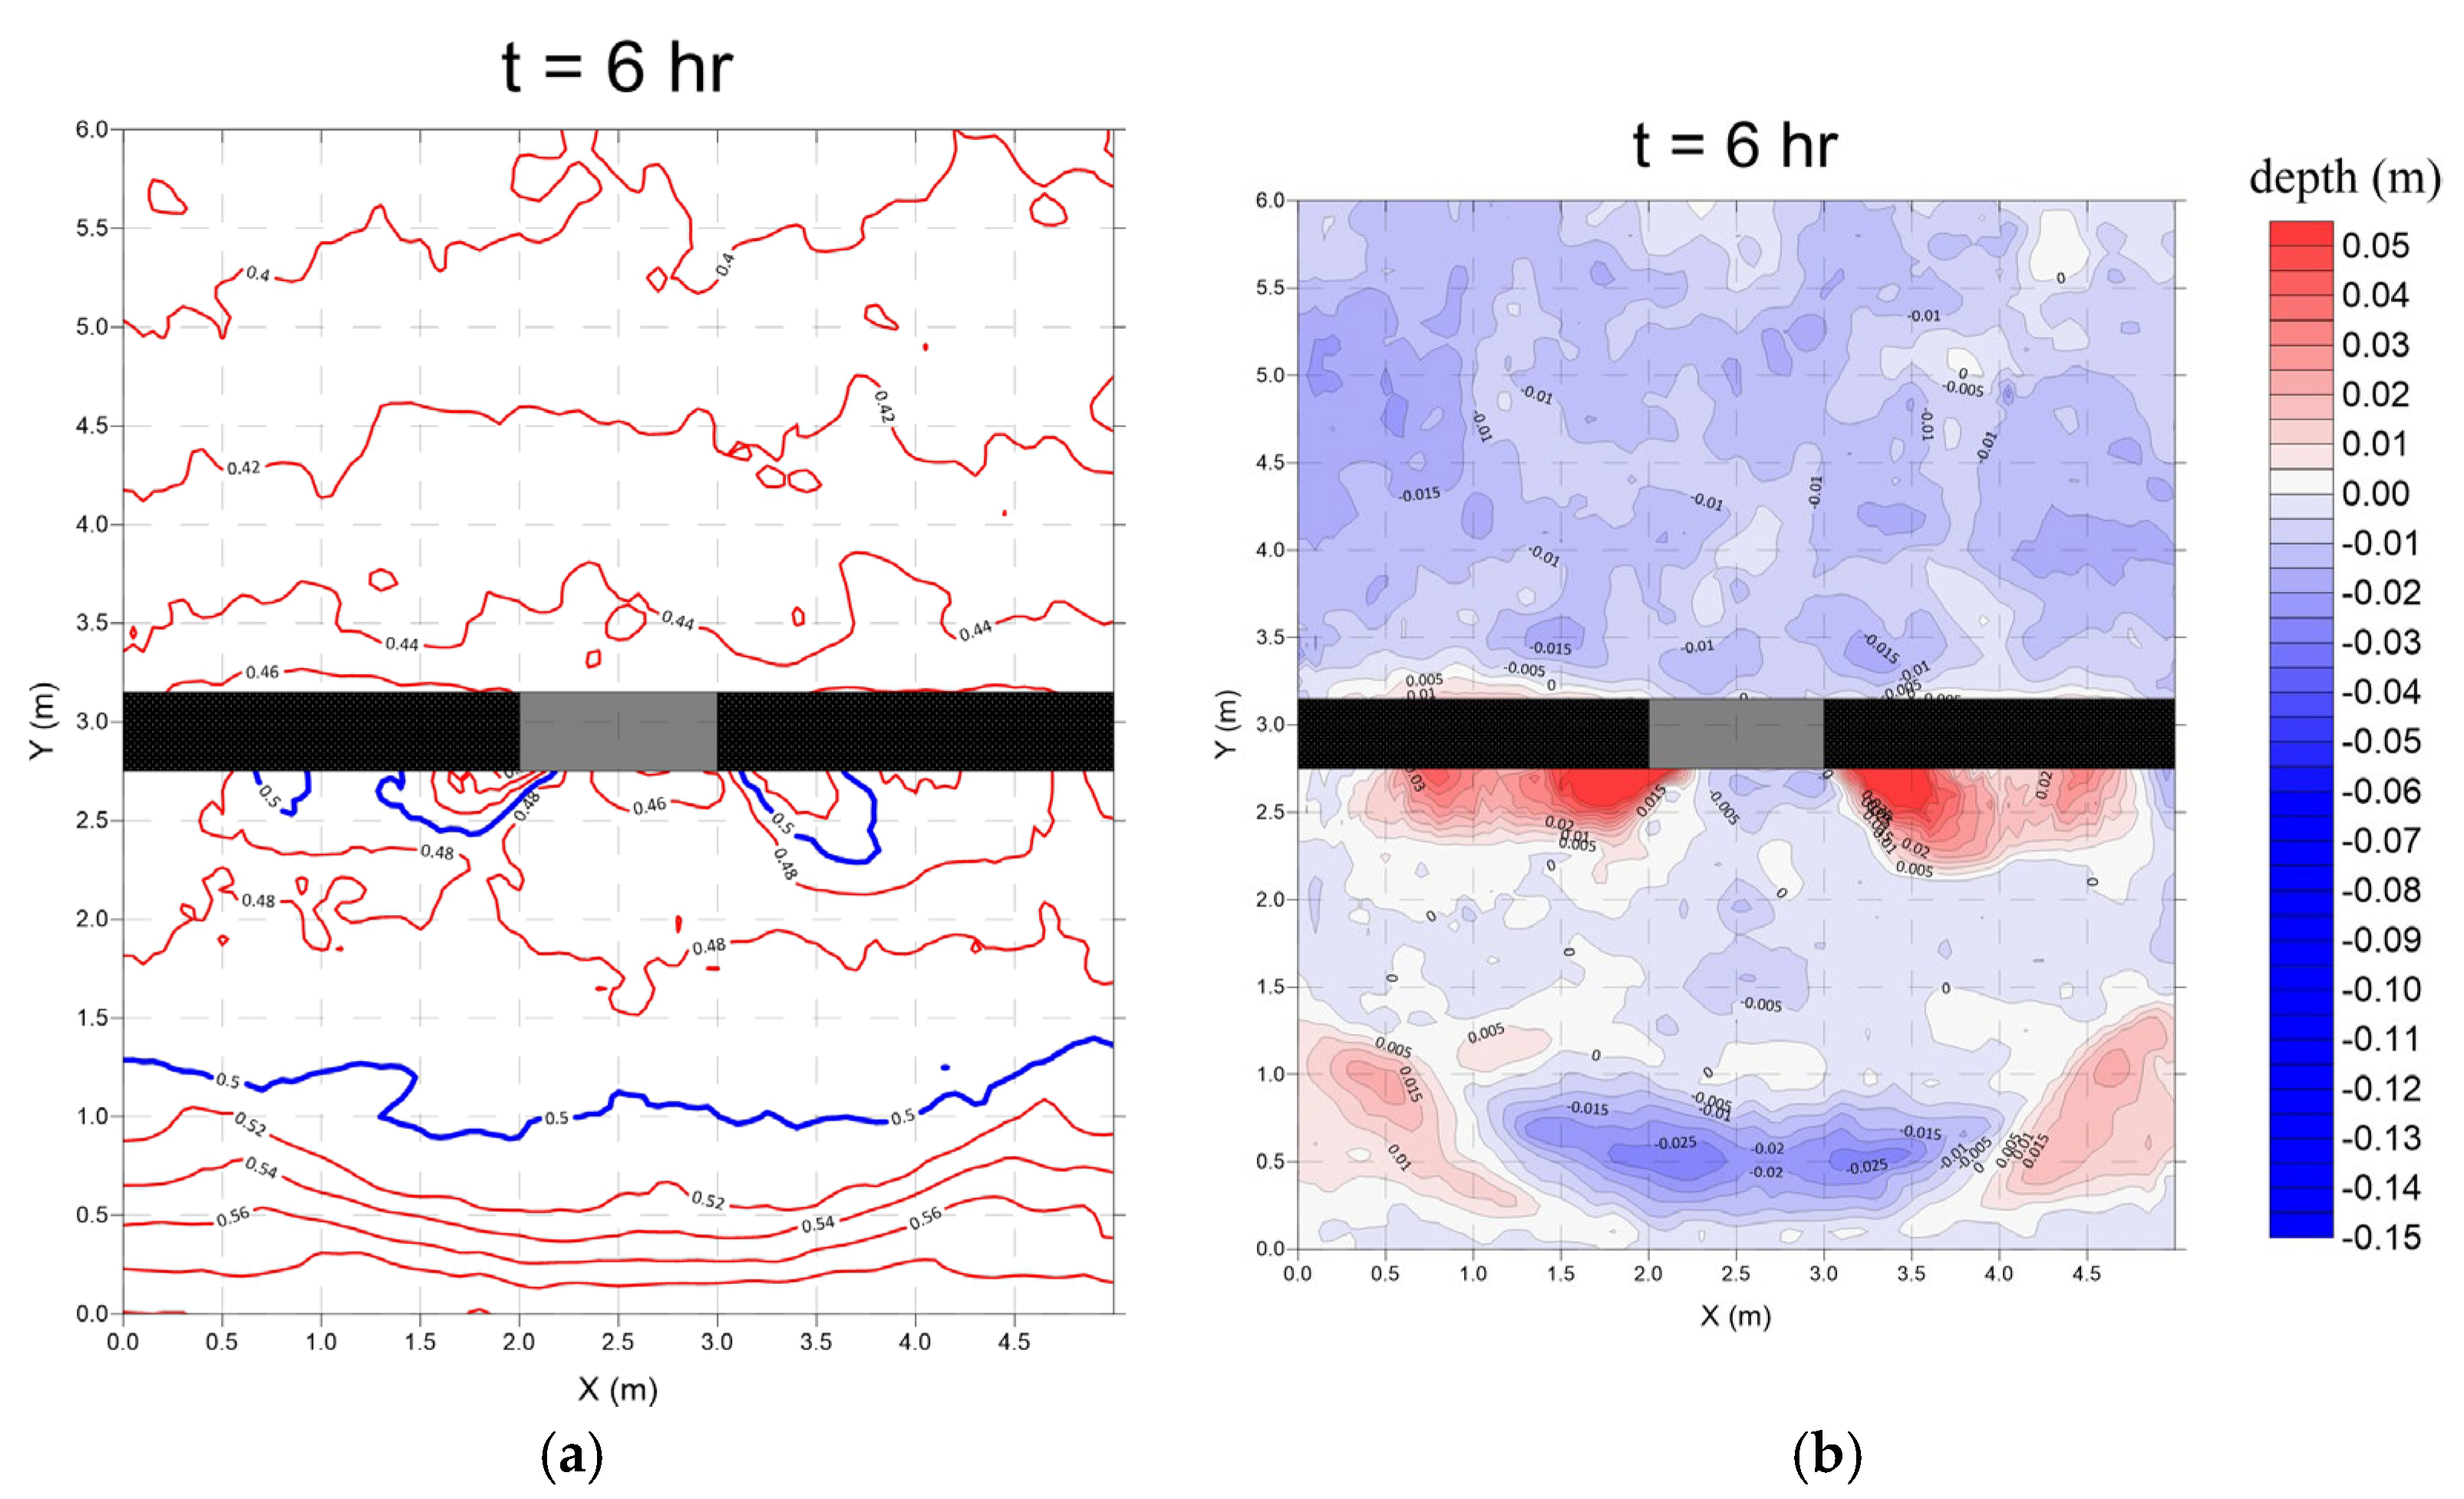
3.4. Seawall Combined with Submerged Breakwater (Case 4)

  • Monsoon wave
In Case 4, a composite coastal protection structure consisting of a seawall and a submerged breakwater with a central gap was installed on the seaward side. The purpose of this design was to implement a hard engineering structure for coastal defense while allowing a certain degree of seawater exchange, thereby addressing both ecological conservation and public access to water. The rigid and enclosed configuration of the seawall effectively blocked wave energy from entering the protected area. During the experiment, the seabed morphology in the landward region remained highly stable, with noticeable sediment retention. The contour lines behind the seawall were straight and evenly spaced, indicating that wave-induced disturbance in most of the protected area was minimal (Figure 20 and Figure 21a).
A localized bowl-shaped depression was clearly observed directly behind the central gap, which is consistent with the expected localized scour caused by concentrated flow passing through the opening. Overall, the structure effectively maintained seabed stability in the landward region under monsoon wave forcing while allowing a certain degree of seawater exchange.
2.
Typhoon wave
Under typhoon wave conditions, the experimental results (Figure 21b and Figure 22) indicate that the composite structure effectively stabilized the seabed morphology in the landward region and facilitated sediment retention within the protected area. Compared to monsoon wave conditions, the sediment deposition became more extensive and widespread, reflecting the increased sediment transport induced by high-energy wave action. This depositional response can be attributed to the combined effects of several mechanisms: (1) the composite structure provided effective wave sheltering, reducing wave and current energy as they passed through, which in turn decreased flow intensity and facilitated sediment settling; (2) the structure created a relatively semi-enclosed environment, with the central gap serving as the sole channel for water and sediment exchange, thereby limiting sediment outflow and further promoting accumulation behind the structure.
A particularly noteworthy feature was the localized scour observed directly behind the central gap, presumably caused by concentrated flow and increased turbulence as waves and currents passed through the opening. The maximum scour depth exceeded –0.15 m, indicating a heightened erosion risk at this location under strong wave forcing. Overall, while the structure successfully maintained seabed stability in the protected region under typhoon conditions, the centrally located gap, designed to support ecological continuity and public water access, also introduced a vulnerability to localized scour, which should be carefully addressed in future design applications.

4. Discussion on Sediment-Trapping Performance of Different Coastal Structures

This study focuses on comparing the sediment-trapping performance of representative hard and soft coastal protection structures under variable water level conditions. Therefore, instead of testing a wider range of wave parameters, two representative wave conditions—monsoon and typhoon waves—were selected to reflect the primary hydrodynamic forces in the study area. In addition, for the no-structure case, both fixed and variable water level tests were conducted to observe how tidal variation affects morphological changes.
A total of ten experimental scenarios were conducted across four structural configurations to evaluate the sediment-trapping performance of submerged breakwaters, derosion lattices, and a composite seawall–submerged breakwater system relative to the no-structure case under realistic wave and tidal conditions. This experimental design provides a robust basis for understanding the combined influence of structural configuration and tidal variability on coastal morphological evolution [19].
To evaluate the sediment-trapping performance of each structure, this study measured the bed elevations before and after testing using a total station [20] and processed the data with Surfer software (version 13, Golden Software, LLC, Golden, CO, USA) to calculate the areas and volumes of erosion and deposition. The results are summarized in Table 4 and Table 5. Table 6 presents the percentage change in sediment retention volume for each case relative to Case 1, allowing for a comparative assessment of the protective effectiveness of each configuration.
According to the experimental results, except for Case 4 under typhoon wave conditions, which showed overall sediment accumulation (totaling approximately 0.004 m3) based on the combined changes in the seaward and landward regions, all other cases exhibited net erosion. Nevertheless, Cases 2, 3, and 4 all demonstrated significant effectiveness in reducing erosion and promoting sediment deposition, both in terms of area and volume.
In this study, sediment-trapping performance was evaluated based on the volume changes within specific regions, which were analyzed separately for the seaward and landward sides of the structures. Since the area behind the structures serves as the primary protection zone, the sediment retention results in the landward region are discussed first.
Under both monsoon and typhoon wave conditions, Case 4 exhibited the highest sediment retention in the landward region, with increases of 126.67% and 1383.33%, respectively, compared to Case 1. This indicates highly effective sediment-trapping performance. The superior performance can be attributed to its semi-enclosed configuration, which limits water and sediment exchange to the central gap. Such a design reduces sediment outflow, facilitates deposition behind the structure, and promotes sediment accumulation in the protected area. Case 2 ranked second in effectiveness, with sediment retention increases of 57.33% under monsoon and 100.00% under typhoon wave conditions. A clear band-shaped sediment accumulation zone formed behind the submerged breakwaters, demonstrating the structure’s ability to retain transported sediments [21]. In contrast, Case 3 showed a more diffuse and uniform sediment distribution, without forming a distinct band-shaped deposition zone under monsoon conditions. However, the sediment retention in the landward region still increased by 45.33% under monsoon and 83.33% under typhoon wave conditions compared to Case 1, indicating a reasonably effective sediment-trapping performance, albeit slightly lower than that of Case 2.
In the seaward region under monsoon wave conditions, the sediment retention was 55.36% lower in Case 2 and 126.79% lower in Case 4, relative to Case 1. These results suggest that hard engineering structures, such as submerged breakwaters and seawalls, may intensify seabed scouring in front of the structures due to wave reflection, thereby increasing the risk of localized erosion.
Unlike the results under monsoon wave conditions, all cases demonstrated improved performance under typhoon wave forcing when compared to Case 1, exhibiting less erosion or even localized deposition. This phenomenon can be attributed to two primary mechanisms: (1) Typhoon events significantly increase sediment inflow from outside the domain. The wave-driven suspended sediments not only contribute to deposition in the landward region but may also accumulate locally in front of the structures, offsetting potential erosion. (2) The substantial wave heights during typhoons often exceeded the crest elevations of the submerged breakwaters and derosion lattices. As a result, waves overtopped these structures and propagated directly into the landward region. This reduces wave reflection and scouring in front of the structures [22]. Overall, under typhoon wave conditions, the sediment dynamics in the front region are no longer governed solely by the wave reflection or energy dissipation of the structures but must also consider wave transmission and external sediment supply as interacting factors that jointly govern sediment dynamics in this region.
In the seaward side region, Case 3 exhibited the best sediment-trapping performance under both wave conditions. Under monsoon waves, the sediment retention increased by 57.14% compared to Case 1, while under typhoon waves, the increase reached 91.33%. This contrasts with previous small-scale studies, such as Lu [13], which showed that all configurations of derosion lattice—including emerged, submerged, and series types—led to varying degrees of relative erosion in the seaward region, with maximum reductions in bottom elevation reaching up to −16% compared to the no-structure case. These findings suggest that, while derosion lattices promote sediment deposition landward of the structures, they may also intensify erosion on the seaward side under limited hydrodynamic simulation conditions.
The differences from Lu [13] may result from three key factors [23]: (1) this study used variable water levels to simulate actual tidal changes, while Lu’s experiment applied fixed water levels; (2) this study was conducted in a 3D wave basin, capable of simulating both lateral and longitudinal processes, whereas Lu used a 2D cross-sectional flume that only captures vertical and longitudinal interactions; (3) this study adopted a large-scale physical model, in contrast to the small-scale setup used by Lu [13].
The derosion lattice demonstrated effective sediment-trapping performance in both the seaward and landward regions. This can be attributed to its design as a soft engineering structure that allows wave and current energy to pass through without generating significant reflection. Unlike rigid hard structures, which often alter wave direction and induce strong turbulence at their seaward face, the derosion lattice dissipates energy through structural oscillation and friction. This energy dissipation mechanism not only reduces localized scouring in front of the structure but also promotes more uniform sediment deposition along the coastline. Consequently, a more stable seabed morphology was achieved, and seaward erosion was effectively minimized. These findings highlight the potential of derosion lattices as a flexible, energy-dissipating coastal protection measure that offers both hydrodynamic and sedimentary benefits, particularly in dynamic high tidal range environments.

5. Conclusions

This study conducted large-scale physical model experiments under variable water levels to evaluate the sediment-trapping performance of three types of coastal protection structures—submerged breakwaters, derosion lattices, and a composite seawall–submerged breakwater system—under both monsoon and typhoon wave conditions. The following conclusions have been drawn:
  • In the landward region, all three coastal protection structures showed significantly higher sediment retention compared to the no-structure case, under both conditions. The composite system exhibited the highest retention, submerged breakwaters ranked second, and derosion lattices had slightly lower retention;
  • In the seaward region under typhoon wave conditions, all three structures showed notable improvements in sediment retention compared to the no-structure case, with the derosion lattice achieving the best performance. Under monsoon wave conditions, only the derosion lattice resulted in greater sediment retention than Case 1, while the other two structures performed worse than the no-structure case;
  • Among the three structural types tested, the derosion lattice was the only configuration that achieved improved sediment retention on both the seaward and landward sides under all wave conditions, compared to the no-structure case. Considering its low construction cost, ease of installation, and consistent sediment-trapping performance, the derosion lattice serves as one viable option among modern coastal protection measures;
  • In contrast to the findings of Lu [13], which reported reduced sediment-trapping performance and relative erosion on the seaward side of derosion lattices, this study demonstrates that the derosion lattices (Case 3) exhibited effective sediment-trapping performance even in the seaward region. This difference may be attributed to the use of variable water levels, a plan-view (3D) wave basin, and large-scale physical modeling in the present experiments;
  • Under monsoon wave conditions, the submerged breakwaters and the composite system demonstrated relatively poor sediment retention on the seaward side. Although this was primarily caused by strong wave reflection commonly associated with hard engineering structures, differences in cross-sectional flow areas between structures may also have contributed. Due to limitations in the experimental design, the composite system tested in this study featured only a single and relatively narrow gap, resulting in the smallest flow cross-section among the three structures. Future studies are encouraged to examine modified composite systems with wider or multiple openings to enable a more balanced performance comparison;.
  • In summary, the experimental results demonstrated that each coastal protection structure exhibited distinct performance characteristics depending on the wave conditions and spatial location. The derosion lattice showed relatively stable performance across both the seaward and landward regions, whereas the submerged breakwaters and the composite system performed well in the landward region but were affected by localized scour and wave reflection issues on the seaward side.
Although this study primarily focused on evaluating the sediment-trapping performance of individual structures, practical coastal protection planning must consider site-specific conditions, such as hydrodynamic concentration, sediment supply, public safety, and landscape integration. It is often necessary to adopt a combination of engineering approaches tailored to each site, particularly in beach environments like the study area, which is characterized by a high tidal range and serves both ecological conservation and recreational purposes. The composite system tested in this study included only a single, relatively narrow gap, which resulted in concentrated flow that may pose safety risks to swimmers in real-world applications. Future designs may consider increasing the width of the opening and adopting sloped transitions to reduce such risks. Additionally, when sufficient funding and natural sediment supply are available, combining structural measures with beach nourishment may offer a more sustainable solution for coastal protection. This study employed variable water levels, a plan-view movable-bed setup, and a large-scale wave basin, allowing for a more realistic representation of coastal morphodynamics. These methods provide enhanced insights into the performance of different coastal protection structures.

Author Contributions

Conceptualization, H.-N.H., H.-H.C. and R.-Y.Y.; methodology, H.-N.H. and H.-H.C.; software, H.-H.C.; validation, H.-H.C.; formal analysis, H.-N.H. and H.-H.C.; investigation, H.-H.C.; resources, H.-N.H. and R.-Y.Y.; data curation, H.-H.C.; writing—original draft preparation, H.-N.H.; writing—review and editing, H.-H.C. and R.-Y.Y.; visualization, H.-N.H. and H.-H.C.; supervision, R.-Y.Y.; project administration, H.-H.C.; funding acquisition, R.-Y.Y. All authors have read and agreed to the published version of the manuscript.

Funding

This research received no external funding.

Data Availability Statement

The original contributions presented in this study are included in the article. Further inquiries can be directed to the corresponding authors.

Conflicts of Interest

The authors declare no conflicts of interest.

References

  1. LeMéhauté, B.; Oceanographic, L.P.; Tech, I.T. An Introduction to Hydrodynamics and Water Waves; Environmental Science Servies Administration: Boulder, CO, USA, 1969. [Google Scholar]
  2. Hsu, J.-C. The Effect of Coast Development on the Coastal Morphology; National Taiwan Ocean University: Keelung, Taiwan, 2017. [Google Scholar]
  3. Wang, H.-Y. Effects of the Sediment Transport in Estuary on Coastal Topographic Changes; National Taiwan Ocean University: Keelung, Taiwan, 2019. [Google Scholar]
  4. Water Resources Agency, MOEA. The Manual of Coastal Protection Facilities Planning and Design; Water Resources Agency, MOEA: Taichung, Taiwan, 2016. [Google Scholar]
  5. Shim, K.-T.; Kim, K.-H. A Study on the Effects of Morphological Changes Due to the Construction of Multiple Coastal Structures. J. Mar. Sci. Eng. 2024, 12, 2174. [Google Scholar] [CrossRef]
  6. Meng, Y.; Qu, Z.; Li, X.; Zhu, M.; Liang, B. An experimental study on the evolution of beach profiles under different beach nourishment methods. Front. Mar. Sci. 2024, 11, 1381937. [Google Scholar] [CrossRef]
  7. Kim, H.D.; Kobayashi, N.; Cardenas, X.C. Comparison of Rock Seawall and Dune for Storm Damage Reduction. Coast. Eng. Proc. 2017, 1, sediment.31. [Google Scholar] [CrossRef]
  8. Hu, N.-R. Experimental Study of Morphological Evolution Due to Irregular Waves on a Gravel Beach; National Cheng Kung University: Tainan, Taiwan, 2017. [Google Scholar]
  9. Vera-Cruz, D. Artificial Nourishment of Copacabana Beach. Coast. Eng. 1972, 1451–1463. [Google Scholar] [CrossRef]
  10. Gunyakti, A. Beach Preservation by Means of Offshore Submerged Mound of Dredged Materials. In Proceedings of the Coastal Zone’87, Seattle, WA, USA, 26–29 May 1987; pp. 2461–2471. [Google Scholar]
  11. Peng, T.-H. An Experimental Field Study Using a Flexible High–Strength Net Breakwater for Shore Protection; National Cheng Kung University: Tainan, Taiwan, 2014. [Google Scholar]
  12. Lee, J.-Y. Experimental Study on the Shore Erosion and Deposition Evolution by Using Derosion Lattice; National Cheng Kung University: Tainan, Taiwan, 2022. [Google Scholar]
  13. Lu, K.-L. Experimental Study on the Effect of Shore Erosion and Deposition by Using Submerged Derosion Lattice; National Cheng Kung University: Tainan, Taiwan, 2024. [Google Scholar]
  14. Bureau of Industrial Parks; Ministry of Economic Affairs. Final Report of the Annual Entrusted Planning and Feasibility Study Project: Integrated Development Plan and Technical Services for the Development of the Changhua Coastal Industrial Park; Sinotech Engineering Consultants, Ltd.: Taipei, Taiwan, 2024. [Google Scholar]
  15. Unitech New Energy Engineering Co., Ltd. Environmental Impact Assessment Report for the Zhongneng Offshore Wind Farm Project; Commissioned by China Steel Power Corporation; Unitech New Energy Engineering Co., Ltd.: New Taipei, Taiwan, 2018. [Google Scholar]
  16. Ou, S.-H.; Hsu, T.-W. Similarity Laws for Coastal Movable Bed Models on Sloping Beaches. Harb. Technol. Q. 1985, 1, 33–50. [Google Scholar]
  17. Chang, C.-K. Coastal Engineering Hydraulic Model; Transportation Technology Research Center, MOTC: Taichung, Taiwan, 1982. [Google Scholar]
  18. Yen, C.-C. Experimental Study of the Tide-Affecting Beach Profile Under Wave Action; National Sun Yat-sen University: Kaohsiung, Taiwan, 2009. [Google Scholar]
  19. Zwamborn, J.A.; Fromme, G.A.W.; FitzPatrick, J.B. Underwater Mound for the Protection of Durban’s Beaches. Coast. Eng. 1970, 975–994. [Google Scholar] [CrossRef]
  20. Horikawa, K. Nearshore Dynamics and Coastal Processes: Theory, Measurement, and Predictive Models; University of Tokyo Press: Tokyo, Japan, 1988. [Google Scholar]
  21. Sawaragi, T.; Deguchi, I.; Park, S.-K. Experimental Study on the Function of Submerged Breakwater to Control Cross-Shore Sediment Transport on Artificially Nourished Beaches. Coast. Eng. Jpn. 1988, 31, 121–130. [Google Scholar] [CrossRef]
  22. Kuo, C.-T. Coastal Engineering; Chinese Institute of Civil and Hydraulic Engineering: Taipei, Taiwan, 2010. [Google Scholar]
  23. Van der Werf, I.; Van Gent, M.R.A. Gravel Beaches with Seawalls. Coast. Eng. Proc. 2011, 1, 1–5. [Google Scholar] [CrossRef]
Figure 1. Component layout of derosion lattice (modified from ReShore Technologies, 2020).
Jmse 13 01022 g001
Figure 2. Satellite image of the study site (Google Maps, 2024).
Jmse 13 01022 g002
Figure 3. Aerial photographs of the study site taken in 2024: (a) high tide; (b) low tide.
Jmse 13 01022 g003
Figure 4. Schematic layout of the hydraulic model experiment setup.
Jmse 13 01022 g004
Figure 5. Structural layouts of the four experimental cases: (a) Case 1; (b) Case 2; (c) Case 3; (d) Case 4.
Jmse 13 01022 g005
Figure 6. On-site photographs of the four experimental cases: (a) Case 1; (b) Case 2; (c) Case 3; (d) Case 4.
Jmse 13 01022 g006aJmse 13 01022 g006b
Figure 7. Schematic diagram of water level variation used in the tidal cycle simulation.
Jmse 13 01022 g007
Figure 8. (a) Contour map and (b) erosion and deposition map of Case 1 under monsoon wave conditions with a fixed water level.
Jmse 13 01022 g008
Figure 9. Post-test photographs of Case 1 under monsoon wave conditions: (a) fixed water level; (b) variable water levels.
Jmse 13 01022 g009
Figure 10. (a) Contour map and (b) erosion and deposition map of Case 1 under monsoon wave conditions with variable water levels.
Jmse 13 01022 g010
Figure 11. (a) Contour map and (b) erosion and deposition map of Case 1 under typhoon wave conditions with a fixed water level.
Jmse 13 01022 g011
Figure 12. Post-test photographs of Case 1 under typhoon wave conditions: (a) fixed water level; (b) variable water levels.
Jmse 13 01022 g012
Figure 13. (a) Contour map and (b) erosion and deposition map of Case 1 under typhoon wave conditions with variable water levels.
Jmse 13 01022 g013
Figure 14. (a) Contour map; (b) erosion and deposition map for Case 2 under monsoon wave conditions and variable water levels.
Jmse 13 01022 g014
Figure 15. Post-test photographs of Case 2: (a) monsoon wave; (b) typhoon wave.
Jmse 13 01022 g015
Figure 16. (a) Contour map; (b) erosion and deposition map for Case 2 under typhoon wave conditions and variable water levels.
Jmse 13 01022 g016
Figure 17. (a) Contour map; (b) erosion and deposition map for Case 3 under monsoon wave conditions and variable water levels.
Jmse 13 01022 g017
Figure 18. Post-test photographs of Case 3: (a) monsoon wave; (b) typhoon wave.
Jmse 13 01022 g018
Figure 19. (a) Contour map; (b) erosion and deposition map for Case 3 under typhoon wave conditions and variable water levels.
Jmse 13 01022 g019
Figure 20. (a) Contour map; (b) erosion and deposition map for Case 4 under monsoon wave conditions and variable water levels.
Jmse 13 01022 g020
Figure 21. Post-test photographs of Case 4: (a) monsoon wave; (b) typhoon wave.
Jmse 13 01022 g021
Figure 22. (a) Contour map; (b) erosion and deposition map for Case 4 under typhoon wave conditions and variable water levels.
Jmse 13 01022 g022
Table 1. Typhoon wave parameters under different return periods.
Return Period (Years)Significant Wave Height, Hs (m)Peak Period, Tp (s)
53.658.02
256.3210.56
507.3511.39
1008.3212.12
Table 2. Mailiao tidal station statistics (2003–2022).
Highest High
Water Level
(m)
Highest
Astronomical Tide (m)
Mean High Water Level (m)Mean Sea Level
(m)
Mean Low
Water Level
(m)
Lowest Astronomical Tide (m)Lowest Low Water Level (m)
2.7282.5631.8390.343−1.194−2.150−2.379
Table 3. Summary of prototype and model test conditions.
CategoryPrototypeModel
MonsoonHs (m)20.0556
Tp (s)71.17
TyphoonHs (m)7.350.2041
Tp (s)11.391.90
Submerged unit weight (m)1.651.05
Median particle diameter (mm)0.240.15
Bed slope1/2001/50
Monsoon time scale1 year6 hr
Typhoon time scale7 hr1 hr
Highest high water level2.728 m5.456 cm (55.5 cm)
Mean sea level0.343 m0.686 cm (50.7 cm)
Lowest low water level−2.379 m−4.758 cm (45.2 cm)
Table 4. A table of erosion and deposition areas and volumes (monsoon wave).
Monsoon WaveSeaward of the Structures (Y = 2.75~5.5)
Case 1Case 2Case 3Case 4
deposition area (m2)2.62/19.05%1.14/8.29%4.67/33.96%1.06/7.71%
erosion area (m2)10.51/76.44%11.99/87.20%8.45/61.45%12.36/89.89%
unchanged area (m2)0.62/4.51%0.62/4.51%0.63/4.59%0.33/2.40%
deposition volume (m3)0.0060.0020.0180.016
erosion volume (m3)−0.062−0.089−0.042−0.143
total volume S (m3)−0.056−0.087−0.024−0.127
Monsoon WaveLandward of the Structures (Y = 0~2.75)
Case 1Case 2Case 3Case 4
deposition area (m2)3.80/27.64%4.83/35.13%3.96/28.80%6.03/43.85%
erosion area (m2)9.33/67.85%8.30/60.36%9.16/66.62%7.12/51.78%
unchanged area (m2)0.62/4.51%0.62/4.51%0.63/4.58%0.60/4.37%
deposition volume (m3)0.0170.0280.0120.062
erosion volume (m3)−0.092−0.060−0.053−0.042
total volume L (m3)−0.075−0.032−0.0410.020
total volume S+L (m3)−0.131−0.119−0.065−0.107
Table 5. A table of erosion and deposition areas and volumes (typhoon wave).
Typhoon WaveSeaward of the Structures (Y = 2.75~5.5)
Case 1Case 2Case 3Case 4
deposition area (m2)0.07/0.51%3.76/27.35%4.99/36.29%5.12/37.24%
erosion area (m2)13.05/94.91%9.38/68.22%8.13/59.13%8.25/60.00%
unchanged area (m2)0.63/4.58%0.61/4.43%0.63/4.58%0.38/2.76%
deposition volume (m3)0.0000.0160.0090.031
erosion volume (m3)−0.150−0.133−0.022−0.104
total volume S (m3)−0.150−0.117−0.013−0.073
Typhoon WaveLandward of the Structures (Y = 0~2.75)
Case 1Case 2Case 3Case 4
deposition area (m2)7.54/54.84%7.32/53.24%9.46/68.80%10.09/73.38%
erosion area (m2)5.58/40.58%5.79/42.11%3.68/26.76%3.07/22.33%
unchanged area (m2)0.63/4.58%0.64/4.65%0.61/4.44%0.59/4.29%
deposition volume (m3)0.0530.0710.0400.117
erosion volume (m3)−0.059−0.071−0.041−0.040
total volume L (m3)−0.0060.000−0.0010.077
total volume S+L (m3)−0.156−0.117−0.0140.004
Table 6. Comparison table of erosion and deposition volumes between each case and case 1.
Wave ConditionCaseSeaward of the StructuresLandward of the Structures
monsoon2−55.36%57.33%
357.14%45.33%
4−126.79%126.67%
typhoon222.00%100.00%
391.33%83.33%
451.33%1383.33%
Disclaimer/Publisher’s Note: The statements, opinions and data contained in all publications are solely those of the individual author(s) and contributor(s) and not of MDPI and/or the editor(s). MDPI and/or the editor(s) disclaim responsibility for any injury to people or property resulting from any ideas, methods, instructions or products referred to in the content.

