1. Introduction
Electrical imaging logging technology plays a crucial role in the field of petroleum exploration and development, providing geologists with detailed information about wellbore formations through high-resolution resistivity measurements [
1,
2]. This technology can accurately identify geological features such as fractures, pores, and sedimentary structures, which is of significant importance for reservoir evaluation [
3,
4,
5,
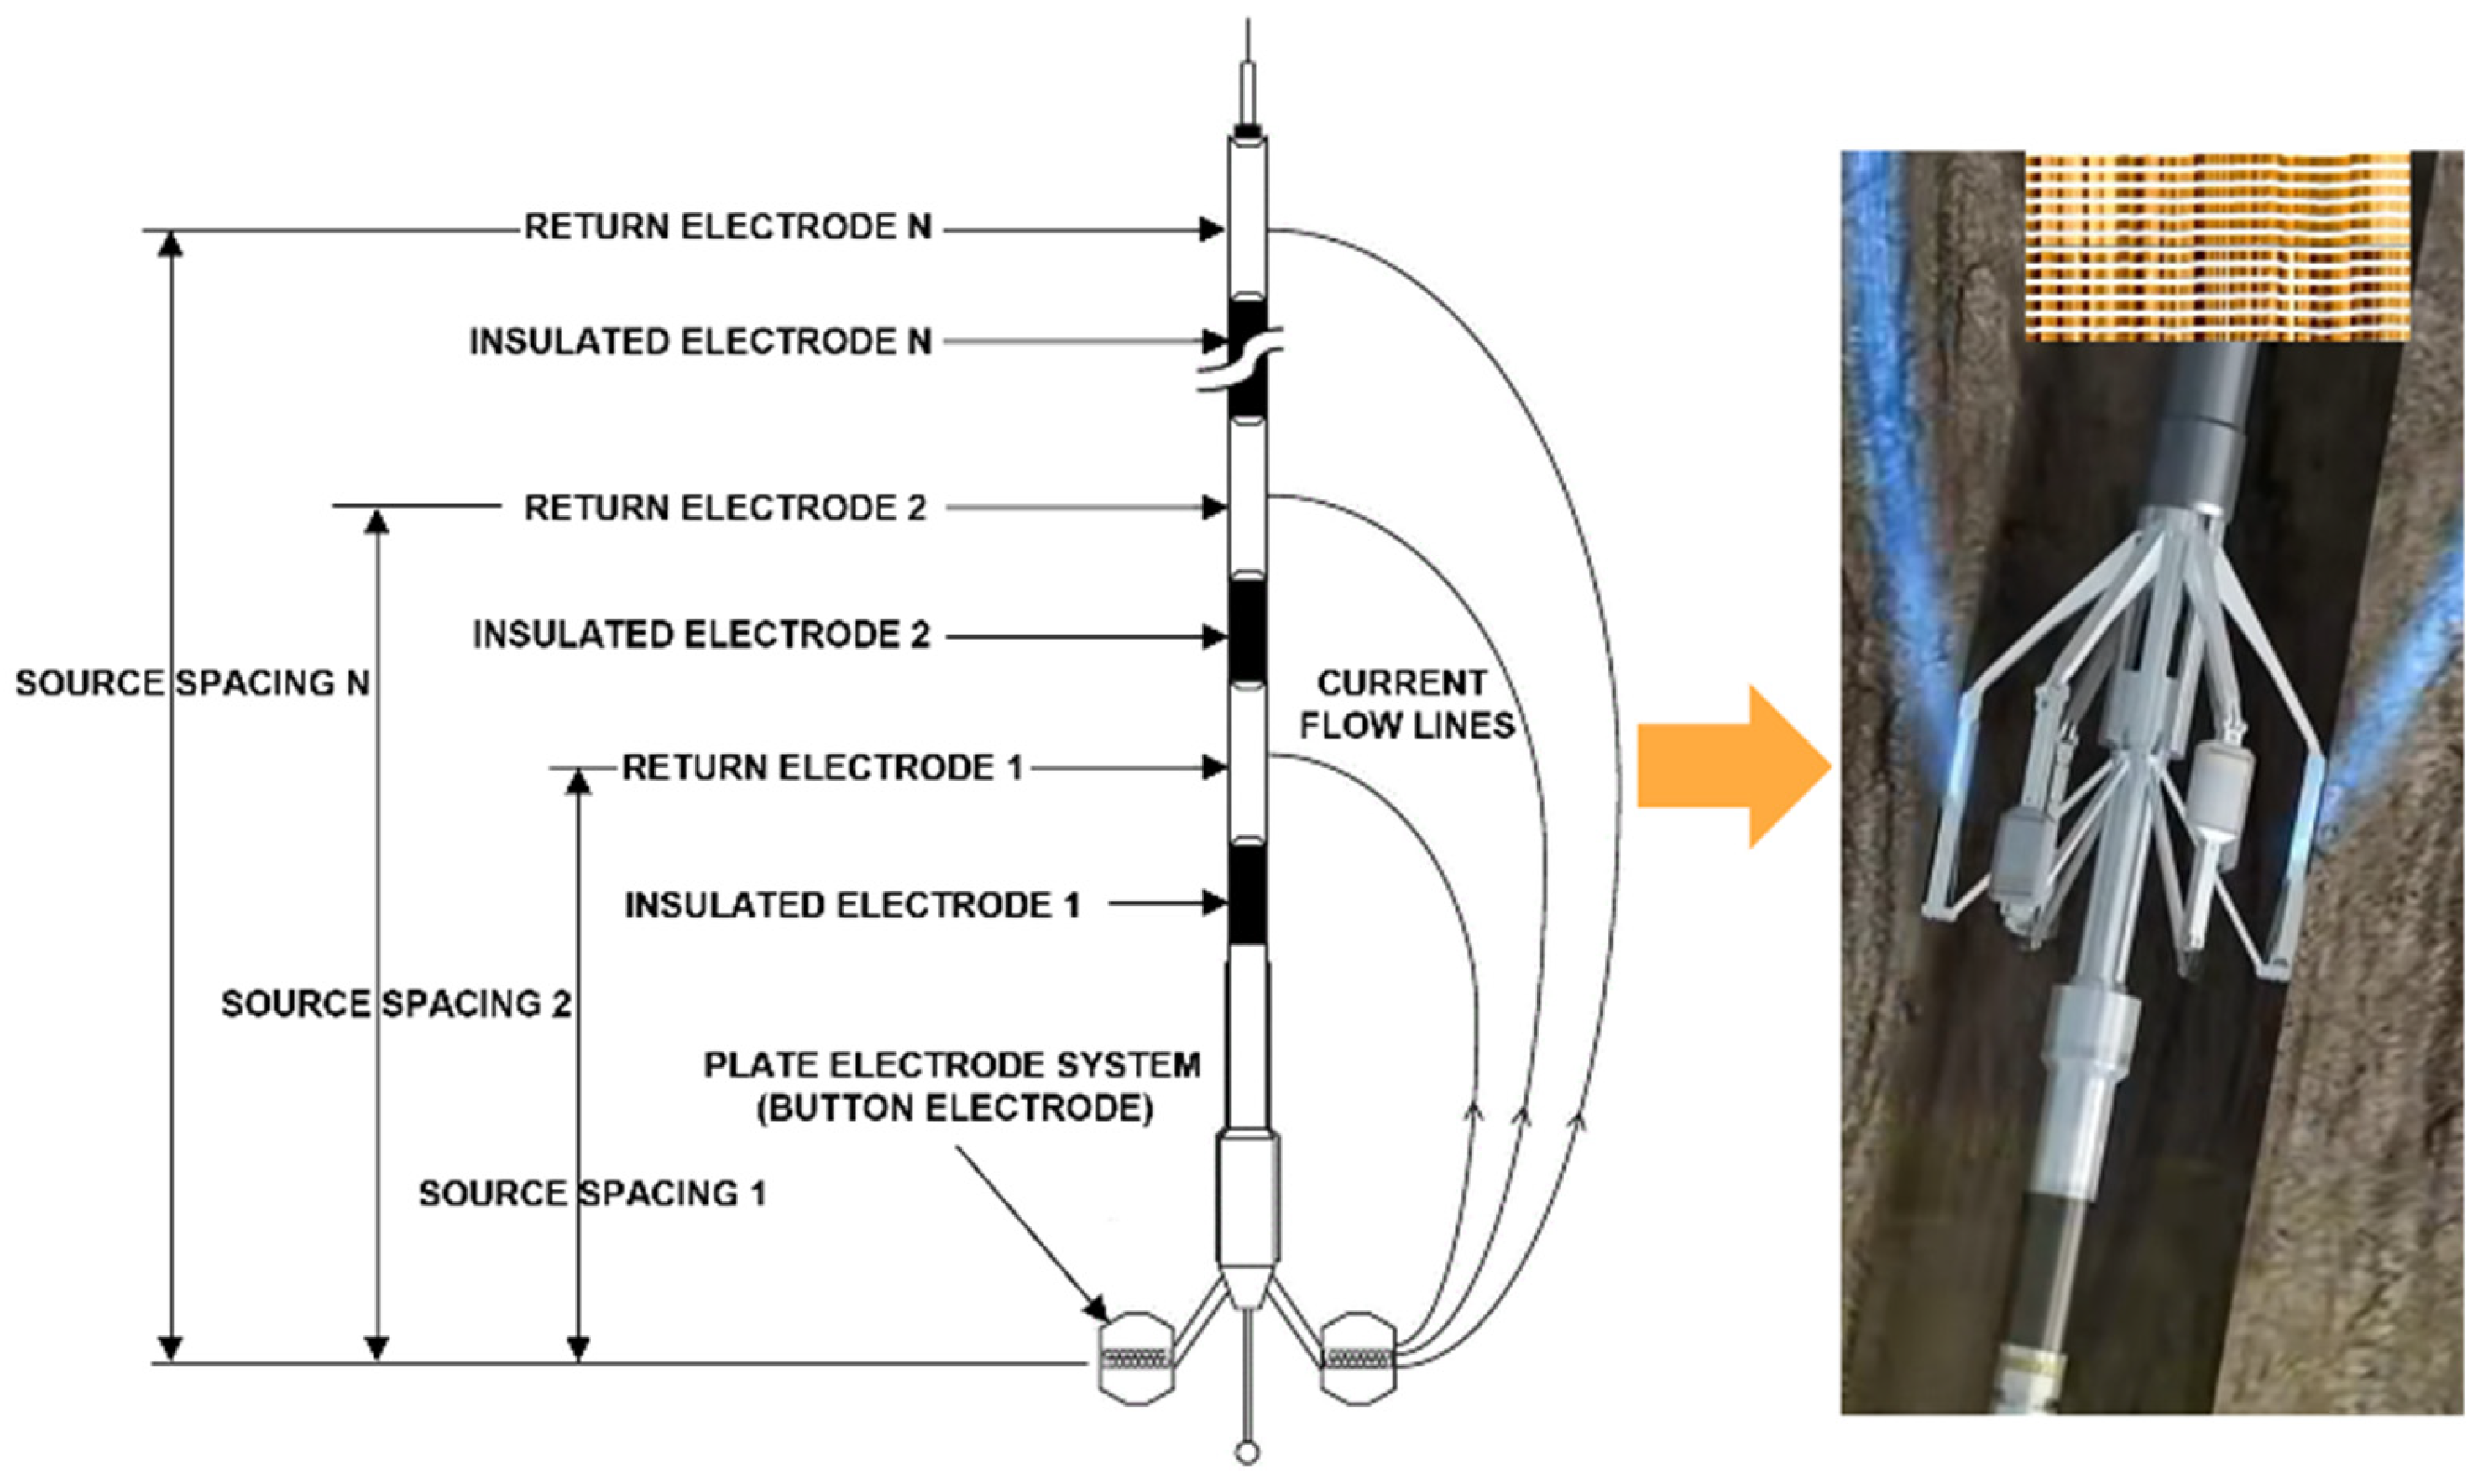
6]. Micro-resistivity imaging logging instruments, as one of the advanced devices, utilize multiple small electrodes on a multi-pad to emit currents to the wellbore wall. The changes in current caused by different rock compositions, structures, and contained fluids reflect the variations in resistivity at various points along the wellbore wall, as shown in
Figure 1. These changes are converted into high-resolution images, which not only help in intuitively understanding the microstructure of the wellbore formations but also provide key data support for subsequent geological interpretation and reservoir evaluation. Although significant progress has been made in electrical imaging logging technologies, such as Schlumberger’s fullbore formation micro-imager (FMI), the incomplete match between the instrument pad size and the wellbore diameter leads to the issue of blank strips during data acquisition. These blank areas affect the integrity and continuity of the images, posing challenges to the accuracy of fracture identification and stratigraphic continuity interpretation. Therefore, it is essential to fill in the blank strips from the electrical imaging logging images.
In recent years, researchers have explored various approaches to tackle this challenge. Traditional methods for inpainting blank strips can be broadly classified into two categories: those based on morphological features and those based on detailed features. For instance, Hurley et al. [
7] made a groundbreaking contribution by using actual wellbore images for training, incorporating multipoint statistical techniques and the filtersim algorithm [
8] to create full-borehole images with geological statistical properties, offering a measurable theoretical framework for filling in the gaps. Zhang et al. [
9] introduced a hybrid approach that effectively balanced rapid inpainting with the preservation of geological feature continuity by combining inverse distance weighting interpolation with pattern matching algorithms. Luo et al. [
10] enhanced the Criminisi algorithm [
11] by incorporating a texture priority mechanism, thereby broadening the applicability of traditional structural repair techniques. Despite these advancements in specific contexts, common limitations persist: sensitivity to parameters that restrict generalization; challenges with matching in complex texture areas; and inadequate adaptation to multi-scale geological structures. In contrast, deep learning offers a paradigm shift by leveraging hierarchical feature extraction and end-to-end learning frameworks to autonomously capture multi-scale information. These challenges have thus driven researchers to adopt more adaptive deep learning solutions.
The rapid advancement of computer vision and deep learning technologies has brought revolutionary changes to multiple fields [
12,
13,
14,
15,
16]. Scholars have begun to actively explore the application of these advanced technologies in electrical imaging of logging image processing to solve problems that traditional methods cannot overcome. For example, Chen et al. [
17] proposed a fully convolutional neural network based on the U-Net architecture [
18], which extracts underlying statistical features under a small number of samples through parameter optimization, recovers details through skip connections, and introduces dilated convolutions to enhance multi-scale feature capture. Zhang et al. [
19] used an improved U-Net network model to learn a large number of image blank strip filling sample instances, calculated based on the original features of the image and the labeled area to be filled, thereby achieving automatic filling of blank strips. Du et al. [
20] adopted a deep generative network method based on attention constraints to fill in the blank strips in logging electrical imaging. They replaced the convolution method in traditional convolutional neural networks with deformable convolutions, thereby improving the model’s ability to handle complex structural images. Cao et al. [
21] used an improved method based on generative adversarial networks [
22] to repair partially missing issues in imaging logging images. They constructed a generator network based on the Fully Convolutional Network (FCN) and enhanced the repair effect of missing parts in imaging logging images through the addition of depthwise separable convolution residual blocks, Inception modules, multi-scale feature extraction, and spatial attention mechanisms, as well as the design of global and local discriminator networks. Sun et al. [
23] used a multi-scale generative adversarial network method to fill in the blank strips in electrical imaging. Su et al. [
24] used a deep learning method based on fast Fourier convolution for the repair of blank strips in electrical imaging logging images. The network enhances the ability to recognize geological features by perceiving the spatial frequency domain periodicity of the image features. Wang et al. [
25] proposed a method combining deep filling image repair algorithms with histogram equalization principles to restore full-borehole electrical imaging logging images. This method improves the overall quality of the image to some extent, especially in terms of texture consistency at the edges. Zhong et al. [
26] proposed a prior-guided adaptive generative adversarial network (GAN) method to improve the repair quality of defective areas in logging images. They enhanced the recovery of image continuity features by training the GAN network on a large number of natural images. Yang et al. [
27] proposed a deep learning method named LogMAT based on a hybrid architecture, which leverages key techniques including multi-stage pretraining, incremental completion strategy, and cylindrical boundary constraint to achieve high-quality missing pixel filling for various borehole images. Despite the breakthroughs achieved in adaptive multi-dimensions by the above methods, they still face four core challenges: first, single-stream or ordinary dual-stream models are difficult to coordinate structural–texture features, leading to fracture artifacts and detail distortion; second, the limited receptive field of traditional convolutions restricts the ability of global context modeling, causing large-scale repair blurring; third, static feature fusion strategies introduce redundant noise, weakening the semantic consistency of fracture edges; fourth, the model is overly dependent on specific data distributions, resulting in significant fluctuations in cross-block generalization errors. Therefore, developing an innovative method that adapts to marine geological conditions, coordinates multi-scale structure-texture features, achieves precise filling of blank strips, and maintains cross-scale semantic consistency has become the core breakthrough direction of this study.
According to the characteristics of borehole imaging diagrams and geological features [
28,
29,
30], this study proposes a dual-stream network repair method that combines wavelet transform and spatial-channel convolution. This method addresses the challenging issue of repairing blank strips in electrical imaging logging images through a three-stage progressive strategy. The first stage targets the problem of complete data absence in engineering scenarios by innovatively constructing a texture-aware data prior algorithm for initial filling. It also introduces a manual verification mechanism by geological experts for fracture morphology and stratigraphic continuity, screening candidate samples that conform to geological laws, and establishing a training foundation that balances data availability and geological rationality. The second stage is based on the dual-stream network architecture [
31] for core algorithm innovation and collaborative optimization: (1) A cascaded wavelet transform convolution module [
32] is designed to enhance the generator, expanding the receptive field through multi-level wavelet decomposition to capture global low-frequency information and strengthen the multi-scale representation of cave edges and multi-angle fractures. (2) A spatial-channel bidirectional gated convolution [
33] is designed to enhance feature fusion, realizing semantic consistency reconstruction of texture–structure features while suppressing noise through a feature redundancy compression and dynamic fusion mechanism. (3) A composite loss function system is constructed, integrating reconstruction loss, perception loss [
34], style loss, and adversarial loss [
35], forming an optimization objective driven by geological constraints. The third stage evaluates the method’s performance through a multi-dimensional validation system: quantitative analysis of fracture topological continuity indicators in comparative experiments, verification of the contribution of core modules in ablation experiments, evaluation of geological generalization ability through cross-block testing, and fracture interpretation consistency verification using core-observed data. This ultimately forms a complete technology chain from data preprocessing to model optimization and then to engineering verification.
2. Geological Overview
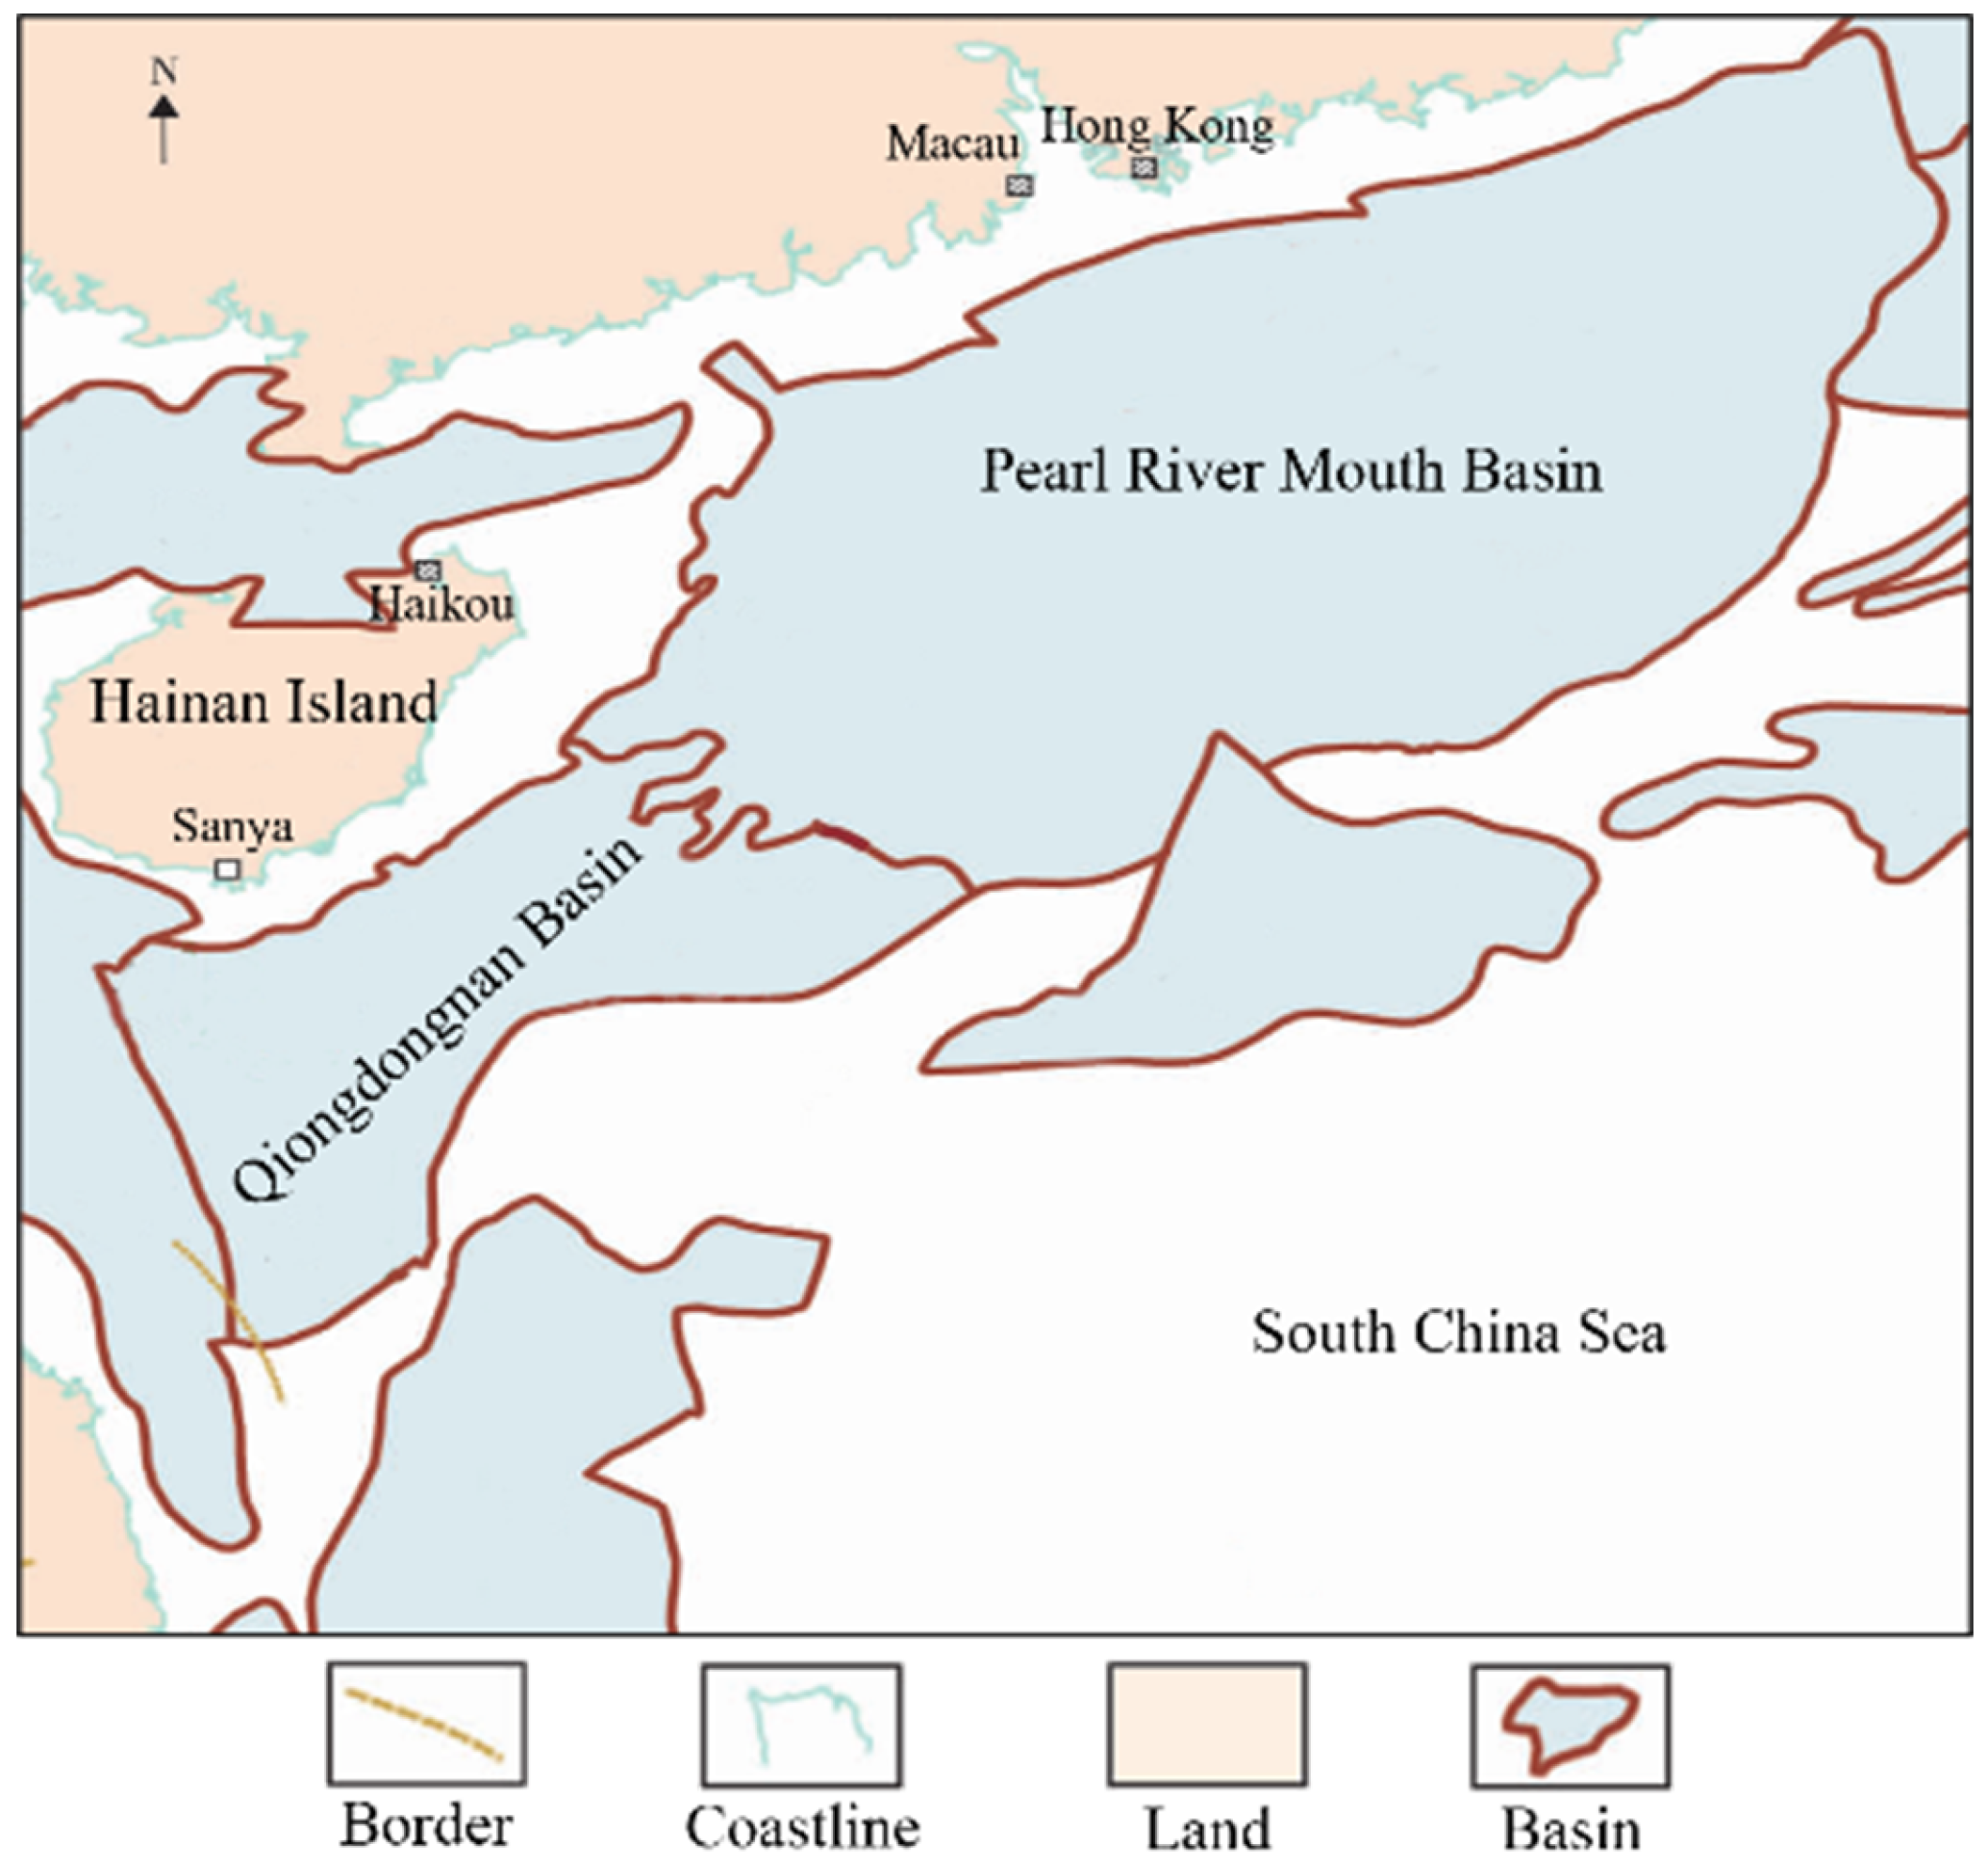
Buried hills, defined as paleo-topographic highlands unconformably overlain by younger strata, constitute critical hydrocarbon reservoir targets in basin exploration. Their fracture zones and complex pore structures considerably heighten the exploration challenges in the deepwater Qiongdongnan and Pearl River Mouth Basins of the northern South China Sea. Recent exploration successes there have underscored their strategic importance [
36], as illustrated by the basins in
Figure 2.
The Qiongdongnan Basin exhibits a NE–SW extensional structural pattern, bounded between the Xisha Uplift and Hainan Uplift. Its evolution comprises two phases: Paleogene rifting and Neogene sagging, forming four first-order tectonic units distributed progressively from north to south—the Northern Depression, Central Uplift, Central Depression, and Southern Uplift. The Cenozoic stratigraphy comprehensively documents the transition from continental to marine sedimentation, with the Lingtou and Yacheng formations constituting primary source rock layers.
In contrast, the Pearl River Mouth Basin extends 800 km along the continental margin, characterized by a six-segment structural zonation. Its Zhu-I Depression developed upon the Yanshanian granitic basement (170–90 Ma), genetically linked to the South China continental margin. The stratigraphic sequence includes the Upper Cretaceous Shenhu Formation overlain by Paleocene Wenchang and Enping formations. Geophysical data reveal a basement dominated by intermediate-acid intrusive rocks, locally intercalated with basaltic volcanic rocks.
Consequently, addressing the prevalent blank strip issues in electrical imaging logging under these complex structural settings, the inpainting method proposed in this study will provide new technical support for deepwater hydrocarbon exploration in the South China Sea.
3. Methodology
3.1. Data Collection and Preprocessing
In this study, both the training data and test data were collected from six wells in the Buried Hills Reservoir, which are conveniently labeled as A, B, C, D, E, and F. The data from these six wells were sequentially processed for imaging, screening, and cropping, resulting in a total of 2642 original electrical image logs with a standardized imaging scale bars of 1:10. The image data were acquired using Halliburton Company’s (Houston, TX, USA) micro-resistivity scanner imager (XRMI) and Schlumberger Ltd.’s (Houston, TX, USA) fullbore formation micro-imager (FMI) logging tools. The XRMI tool is equipped with 150 micro-electrodes (6 pads, each containing 25 button electrodes arranged in two vertical rows). The FMI tool comprises 192 measuring electrodes, distributed across 4 primary pads and 4 secondary pads, with 24 electrodes per pad (12 electrodes per row in two staggered rows) arranged in a staggered pattern to optimize borehole wall coverage. Fifty representative images were randomly selected as the test set, and the remaining 2592 images were used as the training set. To obtain complete electrical image logs without blank bands and to maintain the original texture structure features, this study proposed a texture-aware data prior algorithm to preprocess the 2592 images in the training set. After professional personnel selection, the final effective training set contained 2500 images.
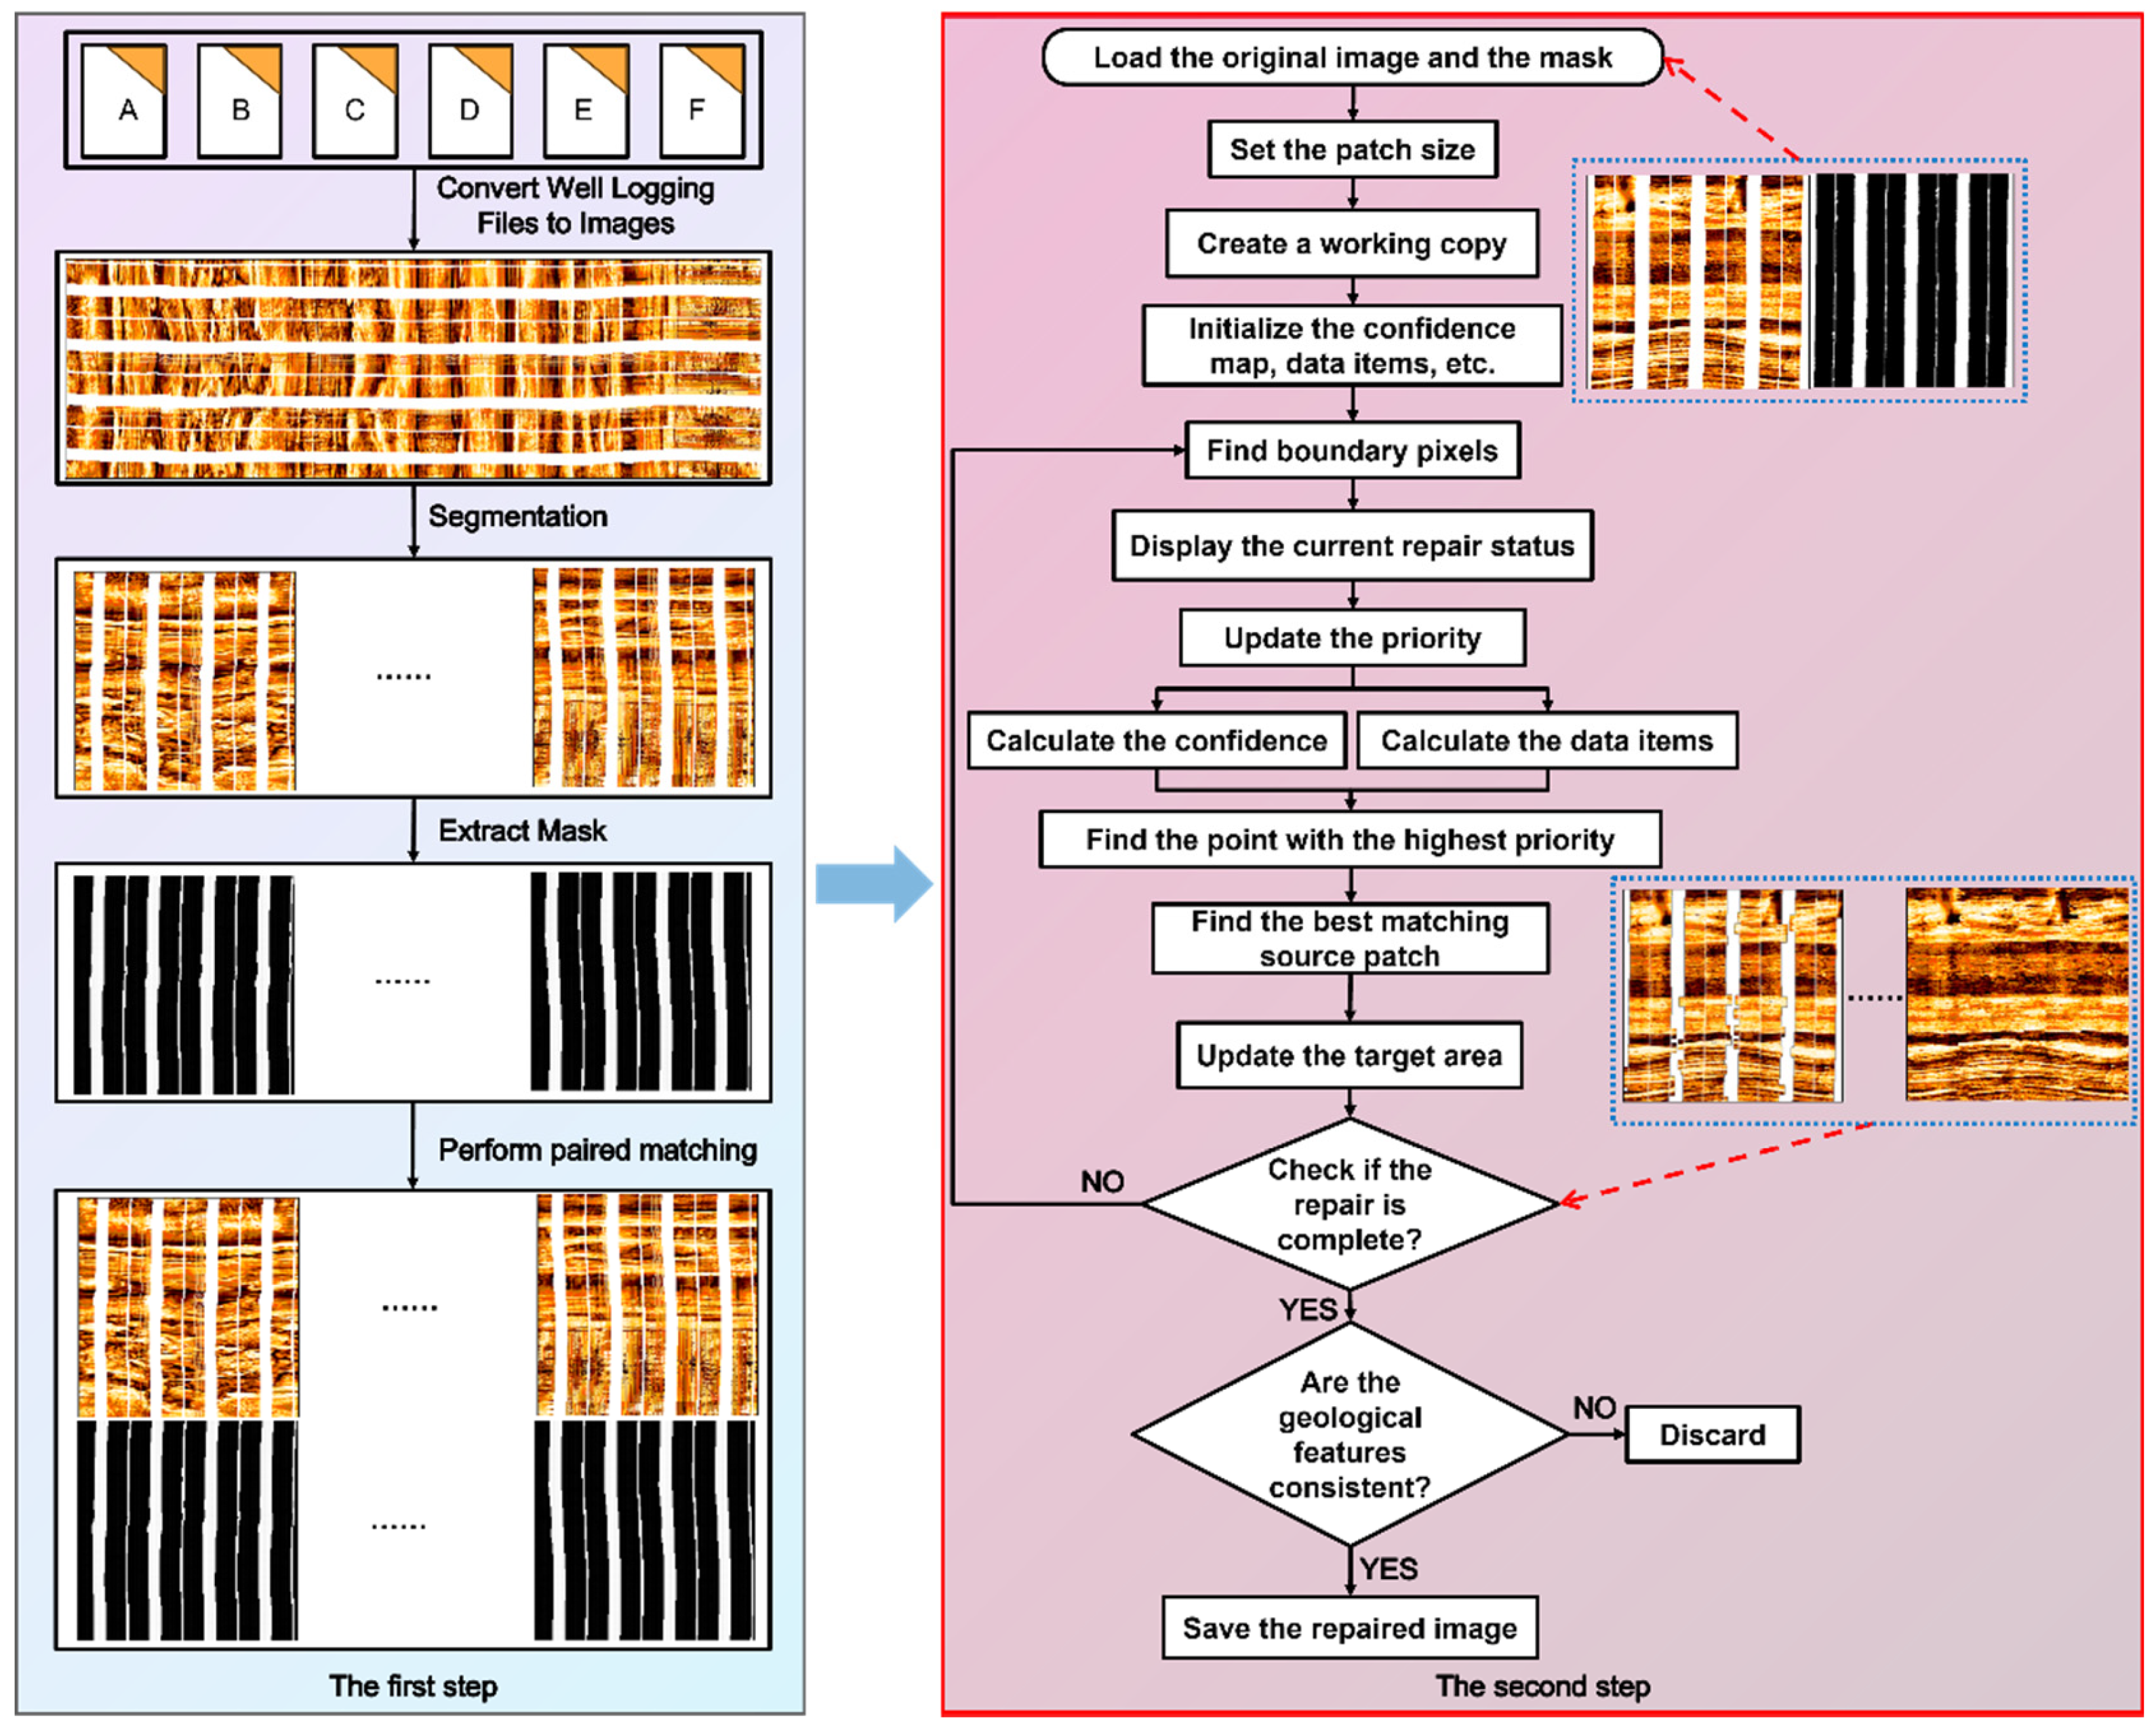
The overall processing steps for data acquisition are shown in
Figure 3 and can be divided into two steps. The first step involves processing the raw logging data for imaging, followed by sequential segmentation and mask extraction operations on the imaging results. The second step is the process of the texture-aware data prior algorithm, which uses texture features (LBP) and structural gradient fields for model fusion and data priors. This process includes three key stages: priority calculation, texture-aware patch matching, and progressive repair updates. Among these, the priority calculation integrates confidence propagation, structural gradient fields, and texture features to construct a comprehensive evaluation index, defined by Equation (1):
where
C(
p) represents the confidence of the current pixel point
p, reflecting the reliability of known information;
D(
p) is the data term, reflecting the continuity of image structural features; and
F(
p) is the repair front detection term, identifying the boundary features of the area to be repaired. The data term
D(
p) is calculated by combining the geometric constraints of the normal field and gradient field, as shown in Equation (2):
where ∇I
⊥ denotes the positive gradient operator,
n(
p) is the normal field vector, and
Gc(
p) is the composite gradient field combining the original gradient with the LBP texture gradient, as shown in Equation (3):
In the above equation, ∇
Ix and ∇
Iy are the gradient components of the original image in the
x and
y directions, respectively; ∇
Tx and ∇
Ty are the gradient components of the LBP texture feature in the
x and
y directions, respectively; and
α is the fusion weight coefficient. During the patch matching stage, a multi-modal similarity measurement method is adopted, simultaneously considering color space differences and texture feature distances, as shown in Equation (4):
Here, , represent the features of patches Ψp and Ψq in the Lab color space, , are the local binary pattern (LBP) histogram features of patches Ψp and Ψq, ∥⋅∥2 is the Euclidean distance, ∥⋅∥H is the histogram intersection distance, and β is set to 0.7 to balance the contributions of color and texture.
The confidence update introduces a texture complexity factor, as shown in Equation (5):
Tcomplex(q) is the local texture complexity calculated based on the variance of LBP features, and N is the patch size. This mechanism effectively maintains the consistency of high-texture areas during the repair process.
In summary, through the texture-aware data prior algorithm, combined with multi-modal similarity measurements and confidence updates, a high-quality training set with geological rationality was constructed, providing a reliable data foundation for subsequent network training.
Figure 3.
Schematic diagram of dataset creation. The first step illustrates the workflow of data imaging processing, segmentation, and mask extraction operations. The second step outlines the process flow of the texture-aware data prior algorithm.
Figure 3.
Schematic diagram of dataset creation. The first step illustrates the workflow of data imaging processing, segmentation, and mask extraction operations. The second step outlines the process flow of the texture-aware data prior algorithm.
3.2. Overall Network Architecture
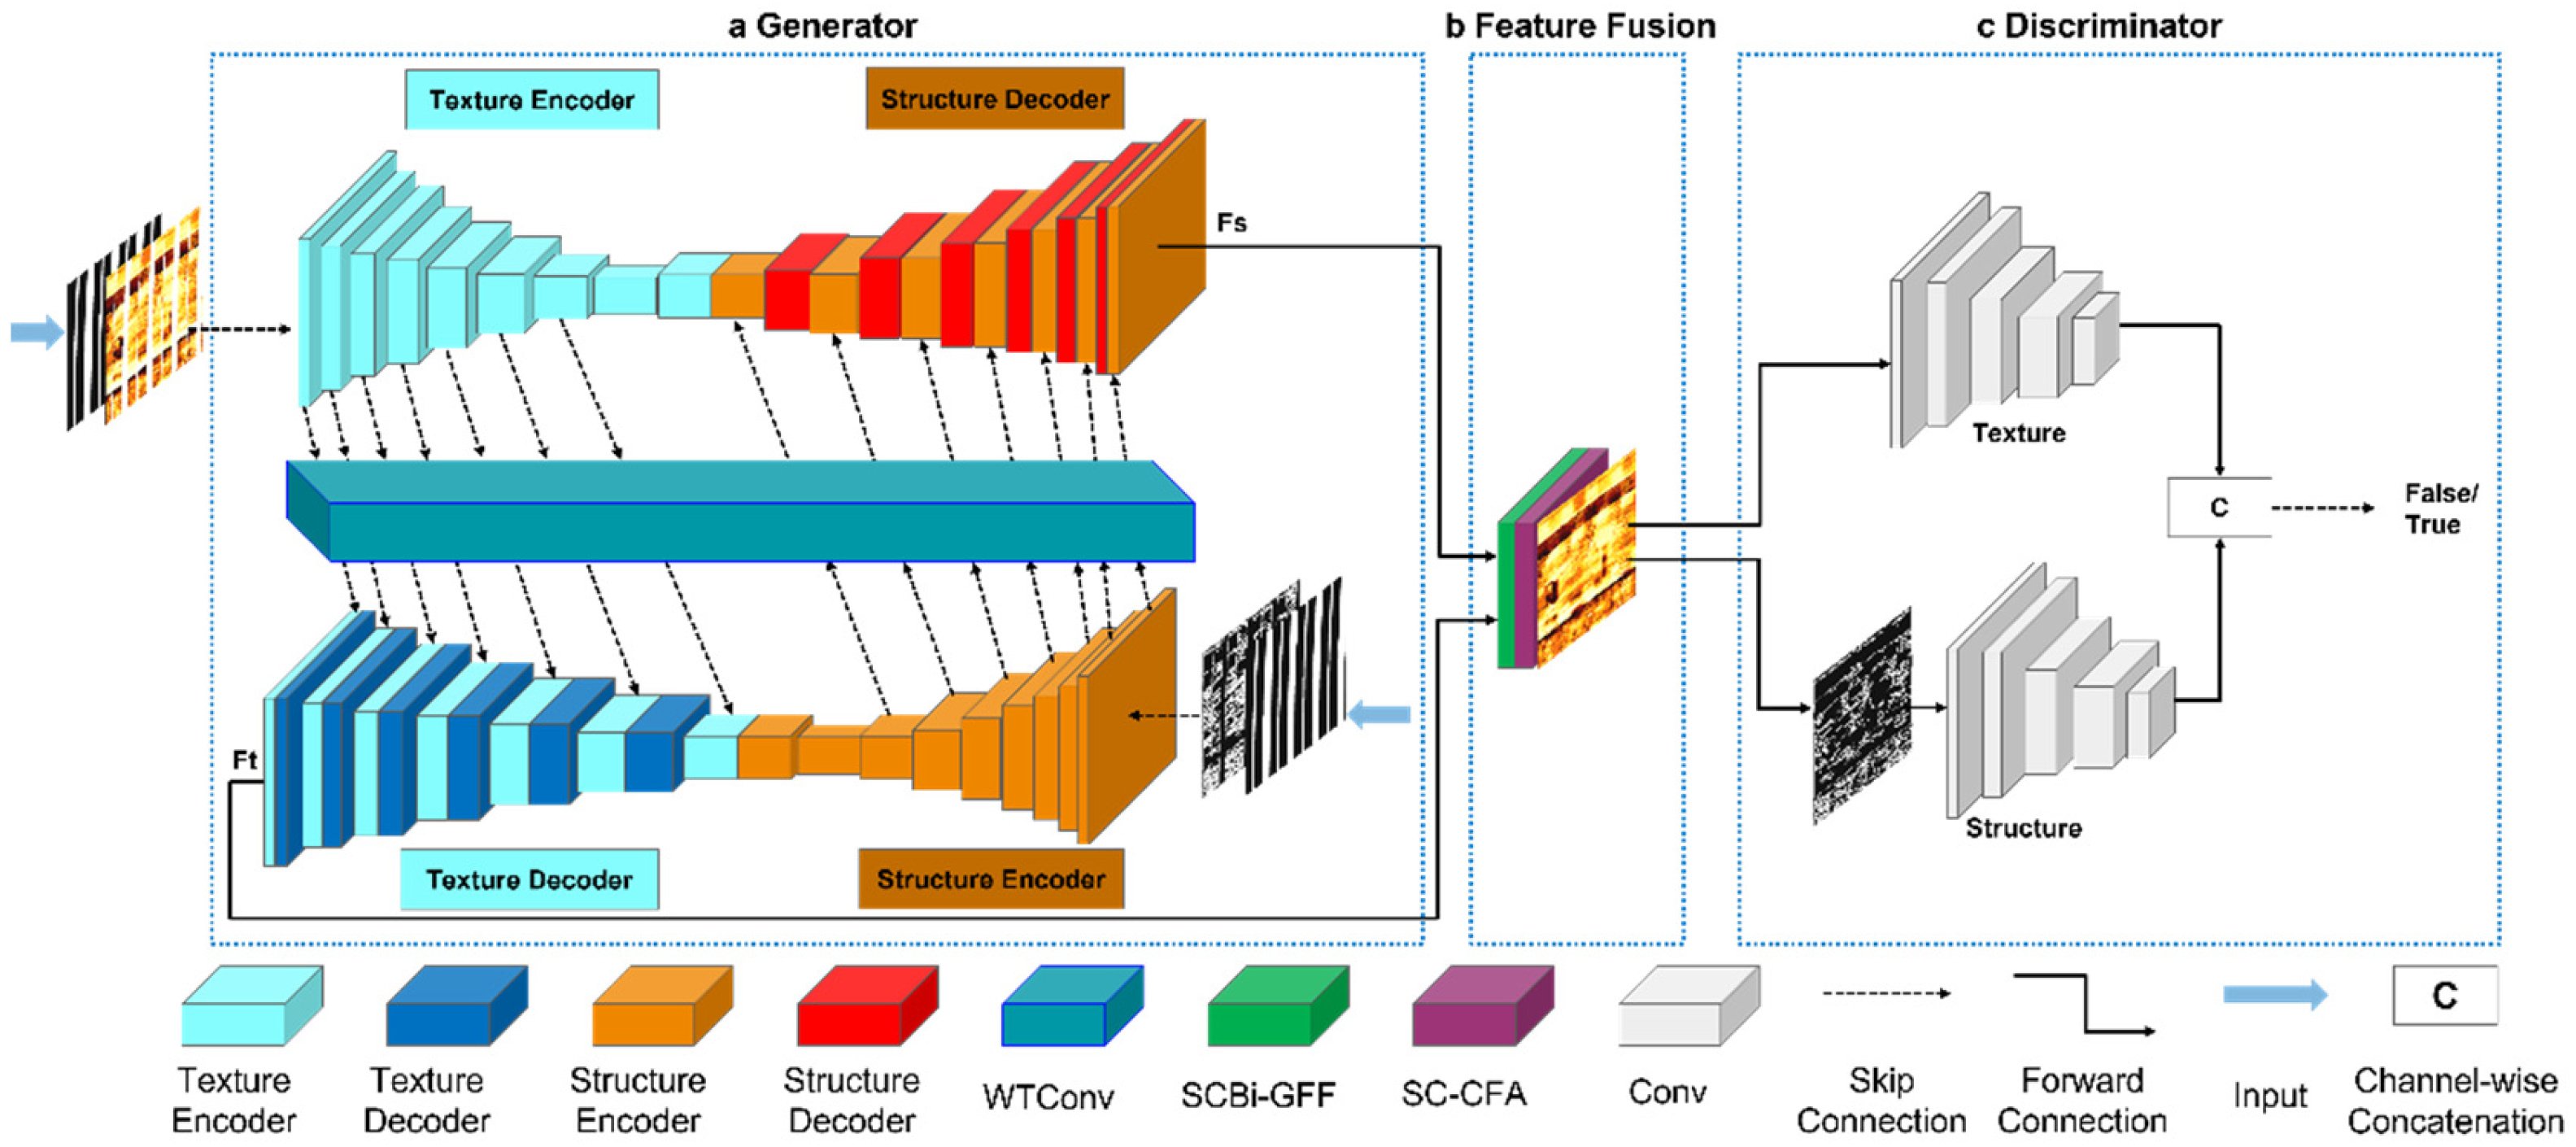
The network architecture of the electrical imaging logging image inpainting method proposed in this study, which is based on the collaborative optimization of wavelet and spatial-channel convolution in a dual-stream network, is shown in
Figure 4. The overall model is divided into three parts: the first part is a generator enhanced by wavelet transform convolution, the second part is a feature fusion module enhanced by spatial-channel convolution, and the third part is a discriminator composed of two parallel branches for structure and texture. The generator is responsible for generating restored images from damaged ones, while the feature fusion module enhances the consistency and expressiveness of features through bidirectional gated feature fusion in spatial and channel domains (SCBi-GFF) and context feature aggregation (SC-CFA). The discriminator evaluates the realism and quality of the generated images. Additionally, a multi-joint loss function is designed to guide the training of the entire network, ensuring that the generated images are highly consistent with real images in terms of texture and structure.
3.2.1. Wavelet Transform Enhanced Generator Design
In the task of restoring blank bands in electrical imaging well logs, the generator needs to reconstruct high-fidelity images with geological significance from locally missing input data. Traditional full convolutional generators are limited by their fixed-scale receptive field and single-frequency feature extraction capabilities, making it difficult to simultaneously capture low-frequency stratigraphic structures, fracture morphology, and pore distribution. This can lead to misalignment or texture artifacts in the restored regions. To address this issue, this work proposes a generator enhancement architecture based on wavelet transform convolutions, which achieves refined restoration through multi-band orthogonal decomposition—convolution-inverse transformation mechanisms. As shown in
Figure 4a, the generator adopts a dual-stream U-Net variant, divided into texture streams and structural streams, working collaboratively through an encoder-decoder framework. During the encoding phase, the texture stream extracts multi-scale texture features via partial convolutions, while the structural stream uses edge information as prior knowledge to extract global constraints. In the decoding phase, the texture decoder combines the high-level features from the structural branch to generate texture-constrained textures, and the structural decoder integrates the features from the texture branch to generate structure-guided structures. To further enhance the generator’s ability to process different frequency components, we introduce wavelet transform convolutions (WTConv) into the generator.
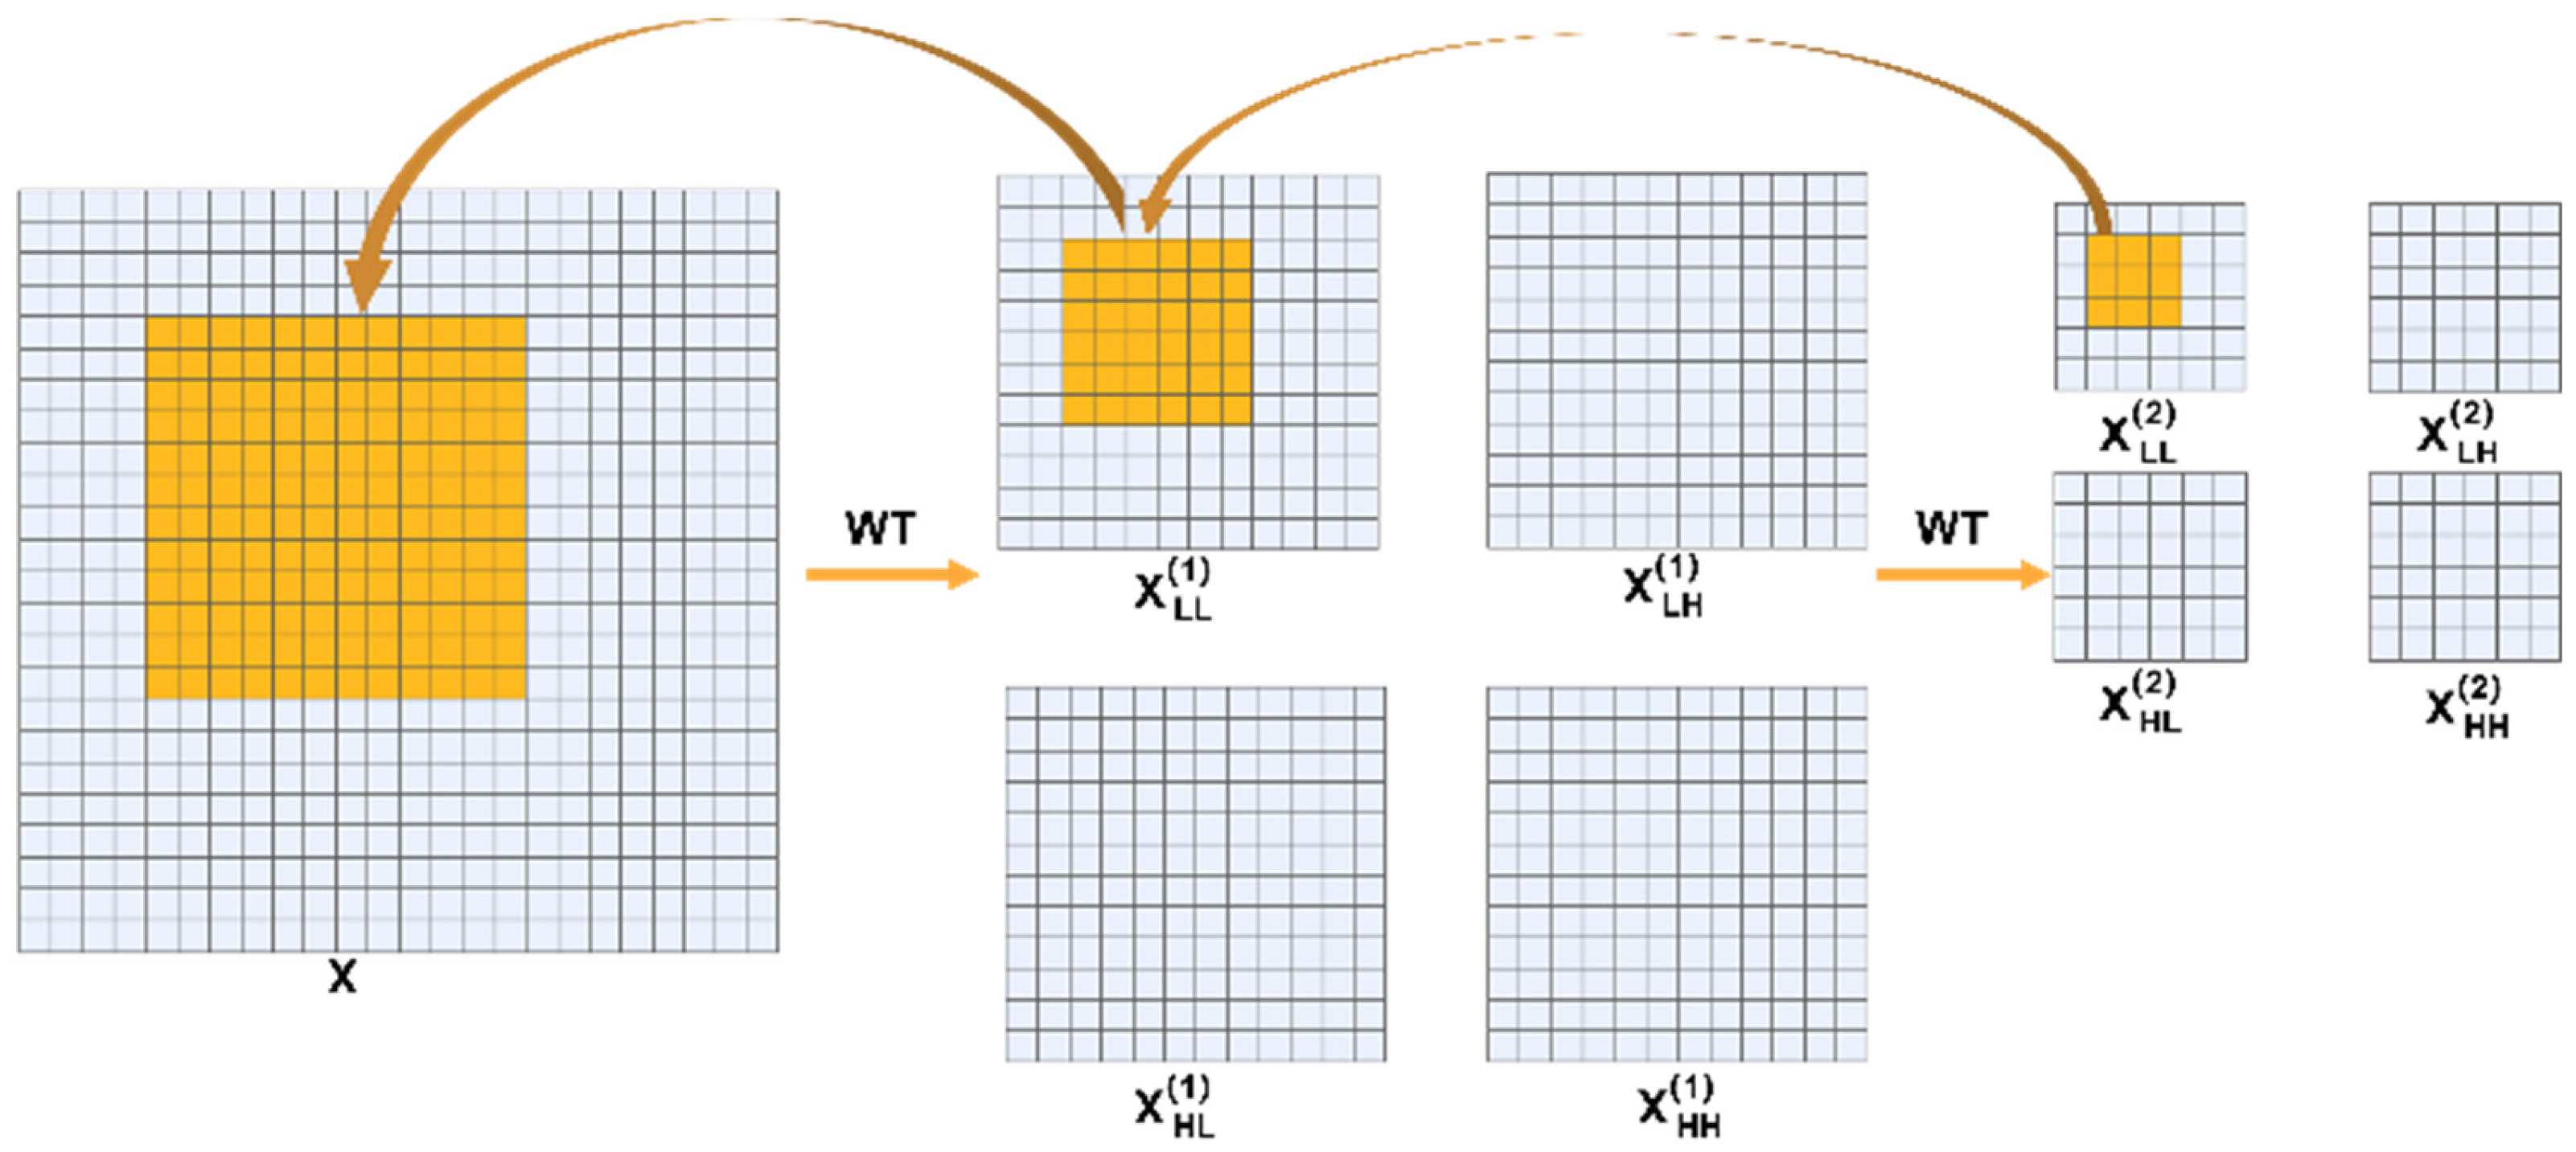
Figure 5 illustrates the operation diagram of wavelet transform convolutions, revealing how they enhance the model’s receptive field through two-level wavelet decompositions. Specifically, the original input image undergoes two wavelet transformations (WT), decomposing it into low-frequency components
and high-frequency components in horizontal, vertical, and diagonal directions:
,
, and
. Here,
represents the low-frequency part after the second wavelet decomposition, preserving the overall structure and trend of the image; while
,
, and
represent the detailed information in the horizontal, vertical, and diagonal directions, respectively. Although the operation performed on
is a 3 × 3 small convolution kernel, since it is executed on the already decomposed low-frequency part, the actual receptive field covers a larger 12 × 12 region of the original image. This mechanism not only significantly expands the receptive field of the convolution layer but also enables the model to capture more contextual information at lower computational costs, thereby helping to better understand the overall structure of the image and improve the restoration effect. By separating information at different frequencies, wavelet transform convolutions enable the model to effectively process image data at different scales, providing stronger feature extraction capabilities and higher restoration accuracy for tasks such as restoring blank bands in electrical imaging well logs.
Thus, wavelet transform convolutions, by performing convolutions in the wavelet domain, can effectively capture the multi-scale features of images, enhancing the generator’s modeling capabilities for image details and structures. This ensures the accuracy and consistency of the restoration results in both low-frequency stratigraphic structures and high-frequency details. Experimental results show that this method significantly improves the structural integrity and texture clarity of the restored regions when handling the task of restoring blank bands in electrical imaging well logs.
3.2.2. Spatial-Channel Convolution Enhanced Feature Fusion Design
The two-dimensional resistivity rate image obtained from electrical imaging well logging data exhibits significant stratigraphic texture directionality and local anisotropic characteristics. This places high demands on the spatial detail restoration and channel feature distinction capabilities of the reconstruction algorithm. Therefore, based on the feature fusion design of the SCConv module and the CTSDG framework, this paper constructs the SCBi-GFF and SC-CFA modules. These modules aim to jointly optimize texture and structure generation quality, thereby addressing the issue of discontinuous crack details in the images.
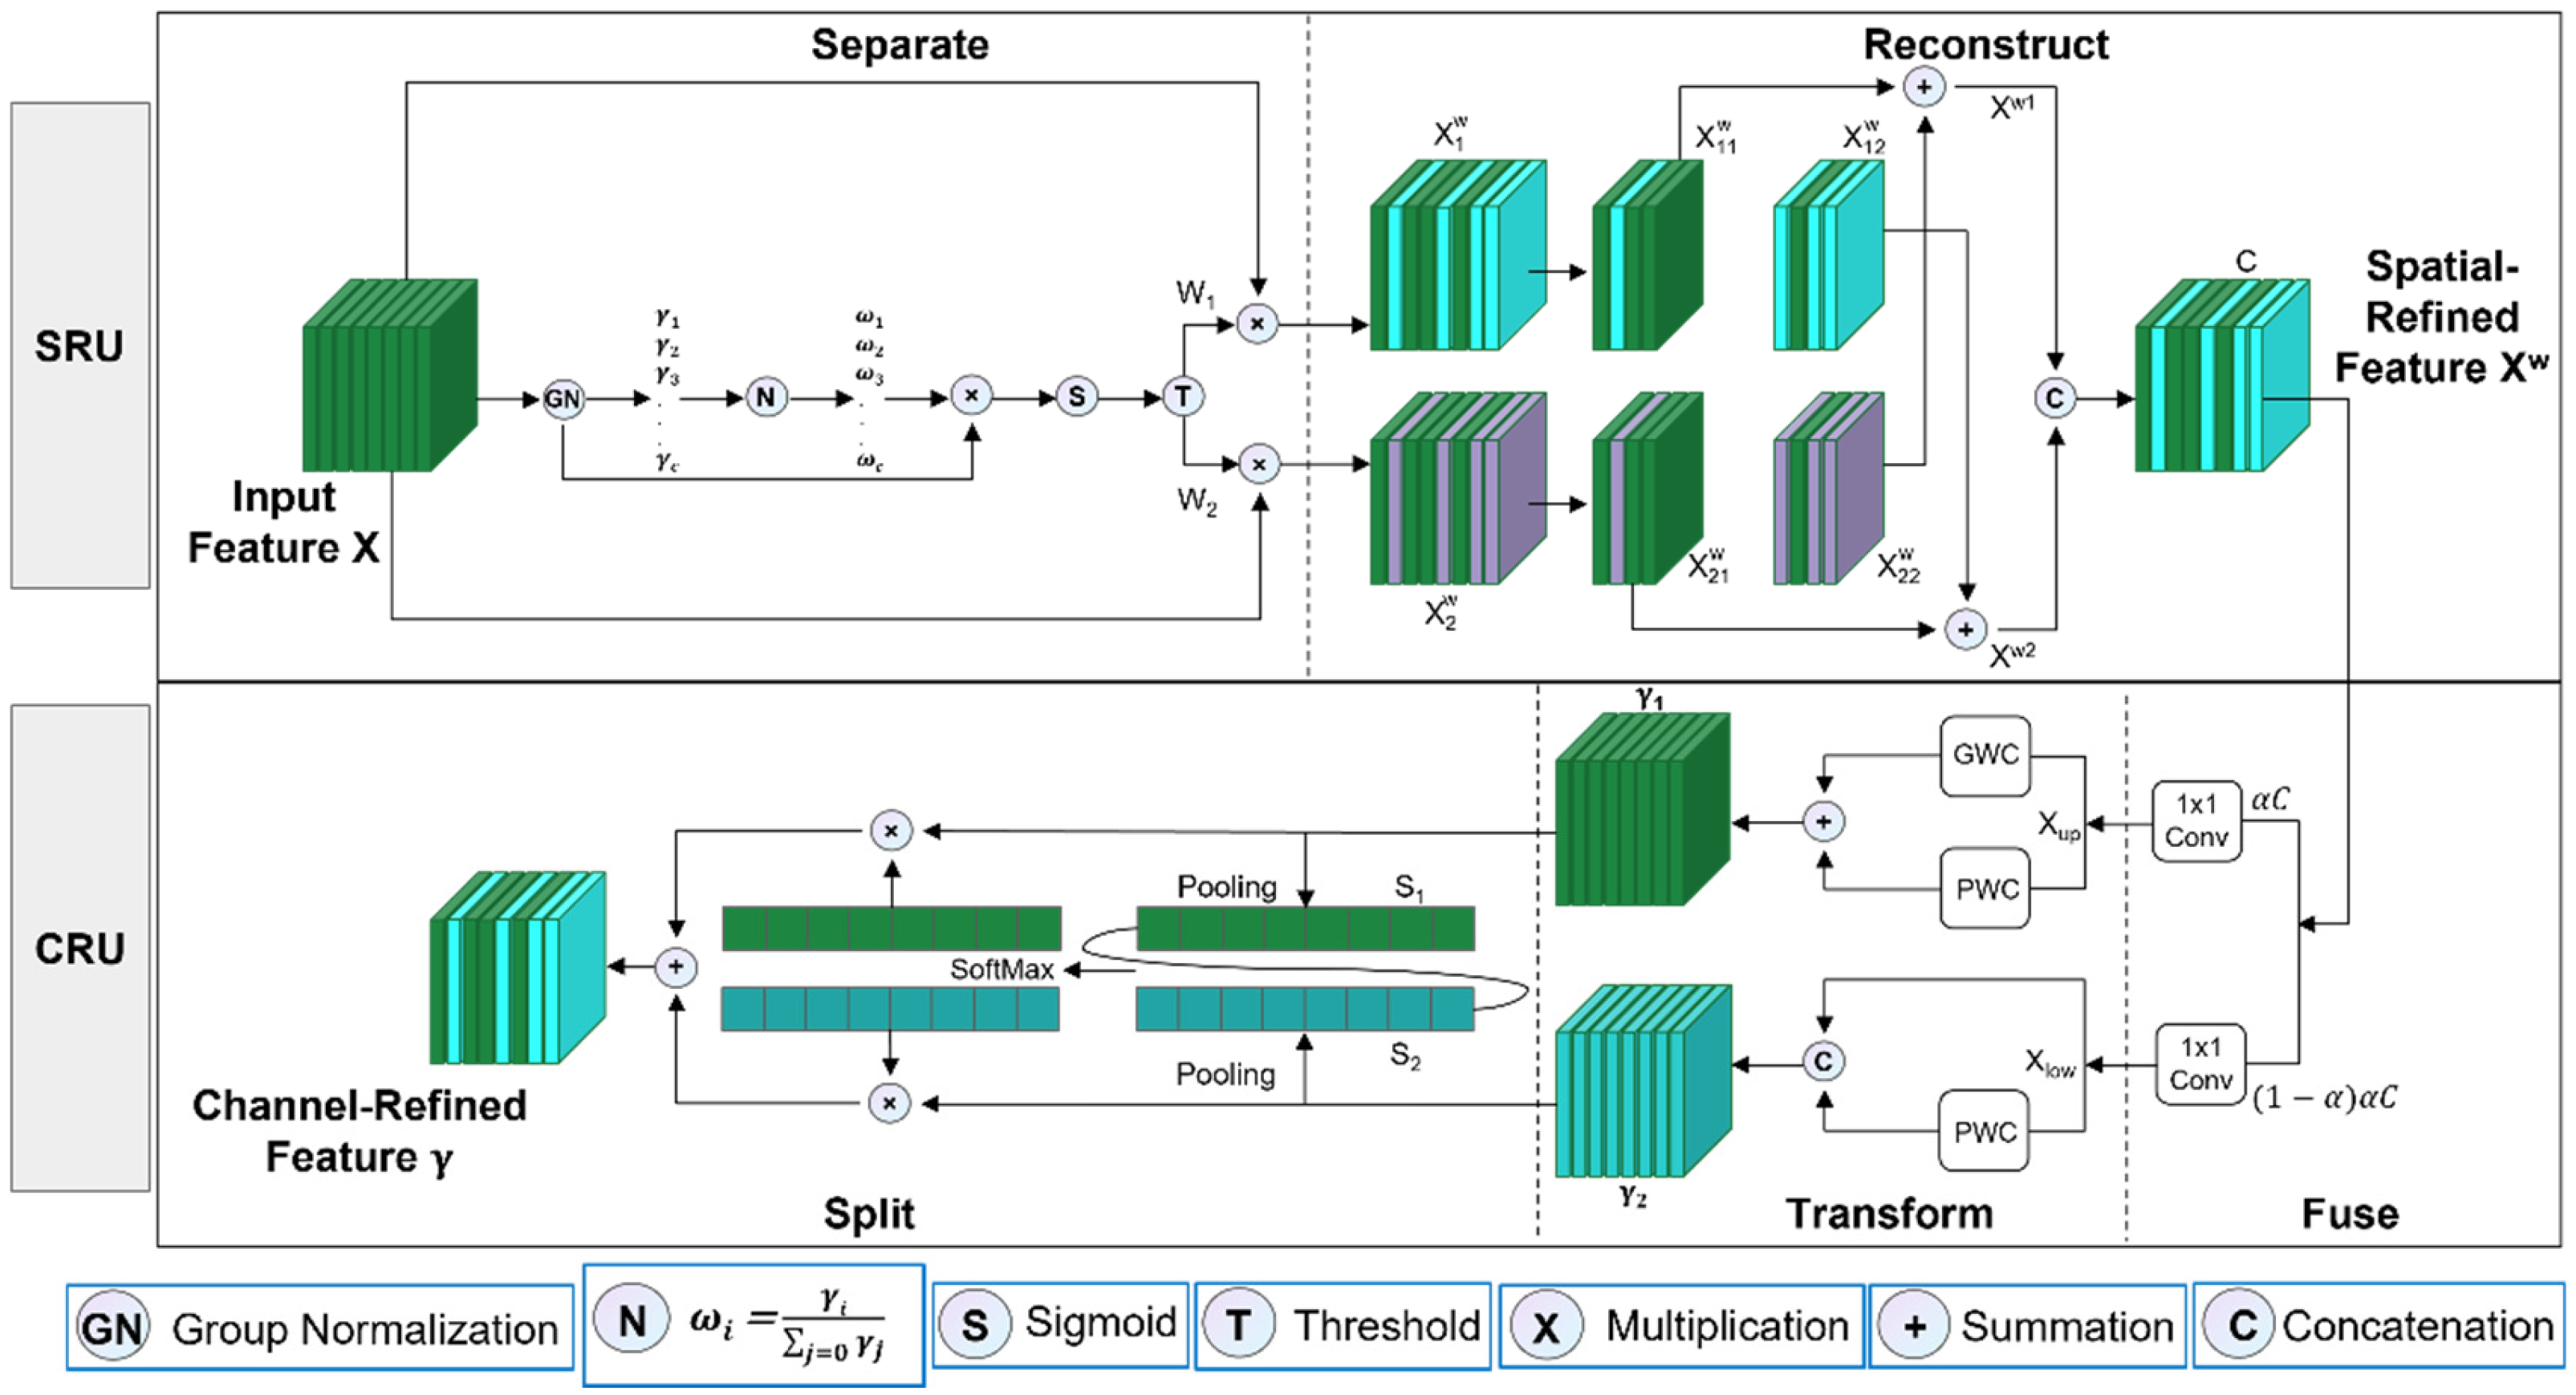
SCConv is an efficient convolution module that uses a combined reconstruction strategy across spatial and channel dimensions, significantly reducing computational costs while enhancing feature expression capabilities. As shown in
Figure 6, this module consists of a sequential concatenation of spatial reconstruction units (SRU) and channel reconstruction units (CRU). Its core idea is to dynamically model redundancy distribution, explicitly separate and reconstruct effective features, and optimize the interaction efficiency of multi-modal information. In the spatial dimension, SRU adopts a three-step strategy of “separation-threshold-reconstruction”. The input feature X is first grouped and normalized to generate a channel scaling factor γ, which quantifies the spatial information density of each channel. Subsequently, the normalized weights W are mapped to the range (0,1) via a Sigmoid function and binarized using a fixed threshold T = 0.5, dividing the features into information-dominant regions
and redundancy-dominant regions
. To avoid information loss caused by simply discarding redundant features, SRU reconstructs the spatial feature X
w through cross-addition (e.g.,
⊕
) and concatenation operations, suppressing smooth background redundancy while retaining inter-regional context. In the channel dimension, CRU further optimizes features through a “split-heterogeneous-fusion” strategy. After spatial refinement, the feature X
w is split into high- and low-information-density branches at a preset ratio α = 0.5: the high branch uses group convolution (GWC) and pointwise convolution (PWC) in parallel to extract multi-scale semantic features, while the low branch retains shallow-layer details through lightweight PWC and skip connections. The two types of features are globally averaged and pooled after extracting channel statistics, and their attention weights are adaptively fused using SoftMax, ultimately outputting the refined channel feature γ. This design balances computational efficiency and expressive power through heterogeneous paths—sparse connections in the high branch reduce parameters, while the reuse mechanism in the low branch avoids detail loss.
The SCBi-GFF module is based on a bidirectional gate-controlled feature fusion framework. It inputs structural features F
s and texture features F
t through dual branches and embeds SCConv into the feature preprocessing stage to achieve sparse contextual modeling. As shown in
Figure 7, the input structural feature F
s and texture feature F
t first pass through the SCConv module, utilizing its space-channel joint reconstruction mechanism to perform prior dimensionality reduction and redundancy information filtering, suppressing noise interference and strengthening key region expressions. On this basis, the module constructs a bidirectional gate-controlled dynamic modulation mechanism: through cross-path feature interaction, the structural feature F
s and texture feature F
t are multiplied element-wise with a Sigmoid function to generate gate control weight matrices G
t and G
s, respectively, which quantify the supplementary strength of texture details to structural features and the geometric constraint weight of structural contours on texture features. Subsequently, learnable parameters α and β are introduced to dynamically weight-modulate the original features, generating optimized structural feature
and texture feature
, where α and β are initialized to zero to stabilize early training convergence and gradually learn the optimal fusion ratio of cross-modal features through gradient backpropagation. After modulation, the features are fed back to the original path via skip connections, forming a closed-loop optimization circuit, forcing the network to strengthen the semantic consistency between structural and texture features during iterations and avoiding local misalignment. Ultimately, the two-path features are fused through channel concatenation and nonlinear transformation to generate the fusion feature F
b, which deeply integrates the global constraints of structural contours and the multi-scale contextual information of texture details. Through the gate mechanism, it explicitly balances the complementarity of the two, enabling the restored region to present high-fidelity texture transitions while maintaining geometric rationality.
The SCBi-GFF module dynamically balances structural and textural features through bidirectional gating, ensuring semantic consistency and high-fidelity texture restoration. Its closed-loop optimization and adaptive parameter learning enable precise alignment of multi-scale geological patterns.
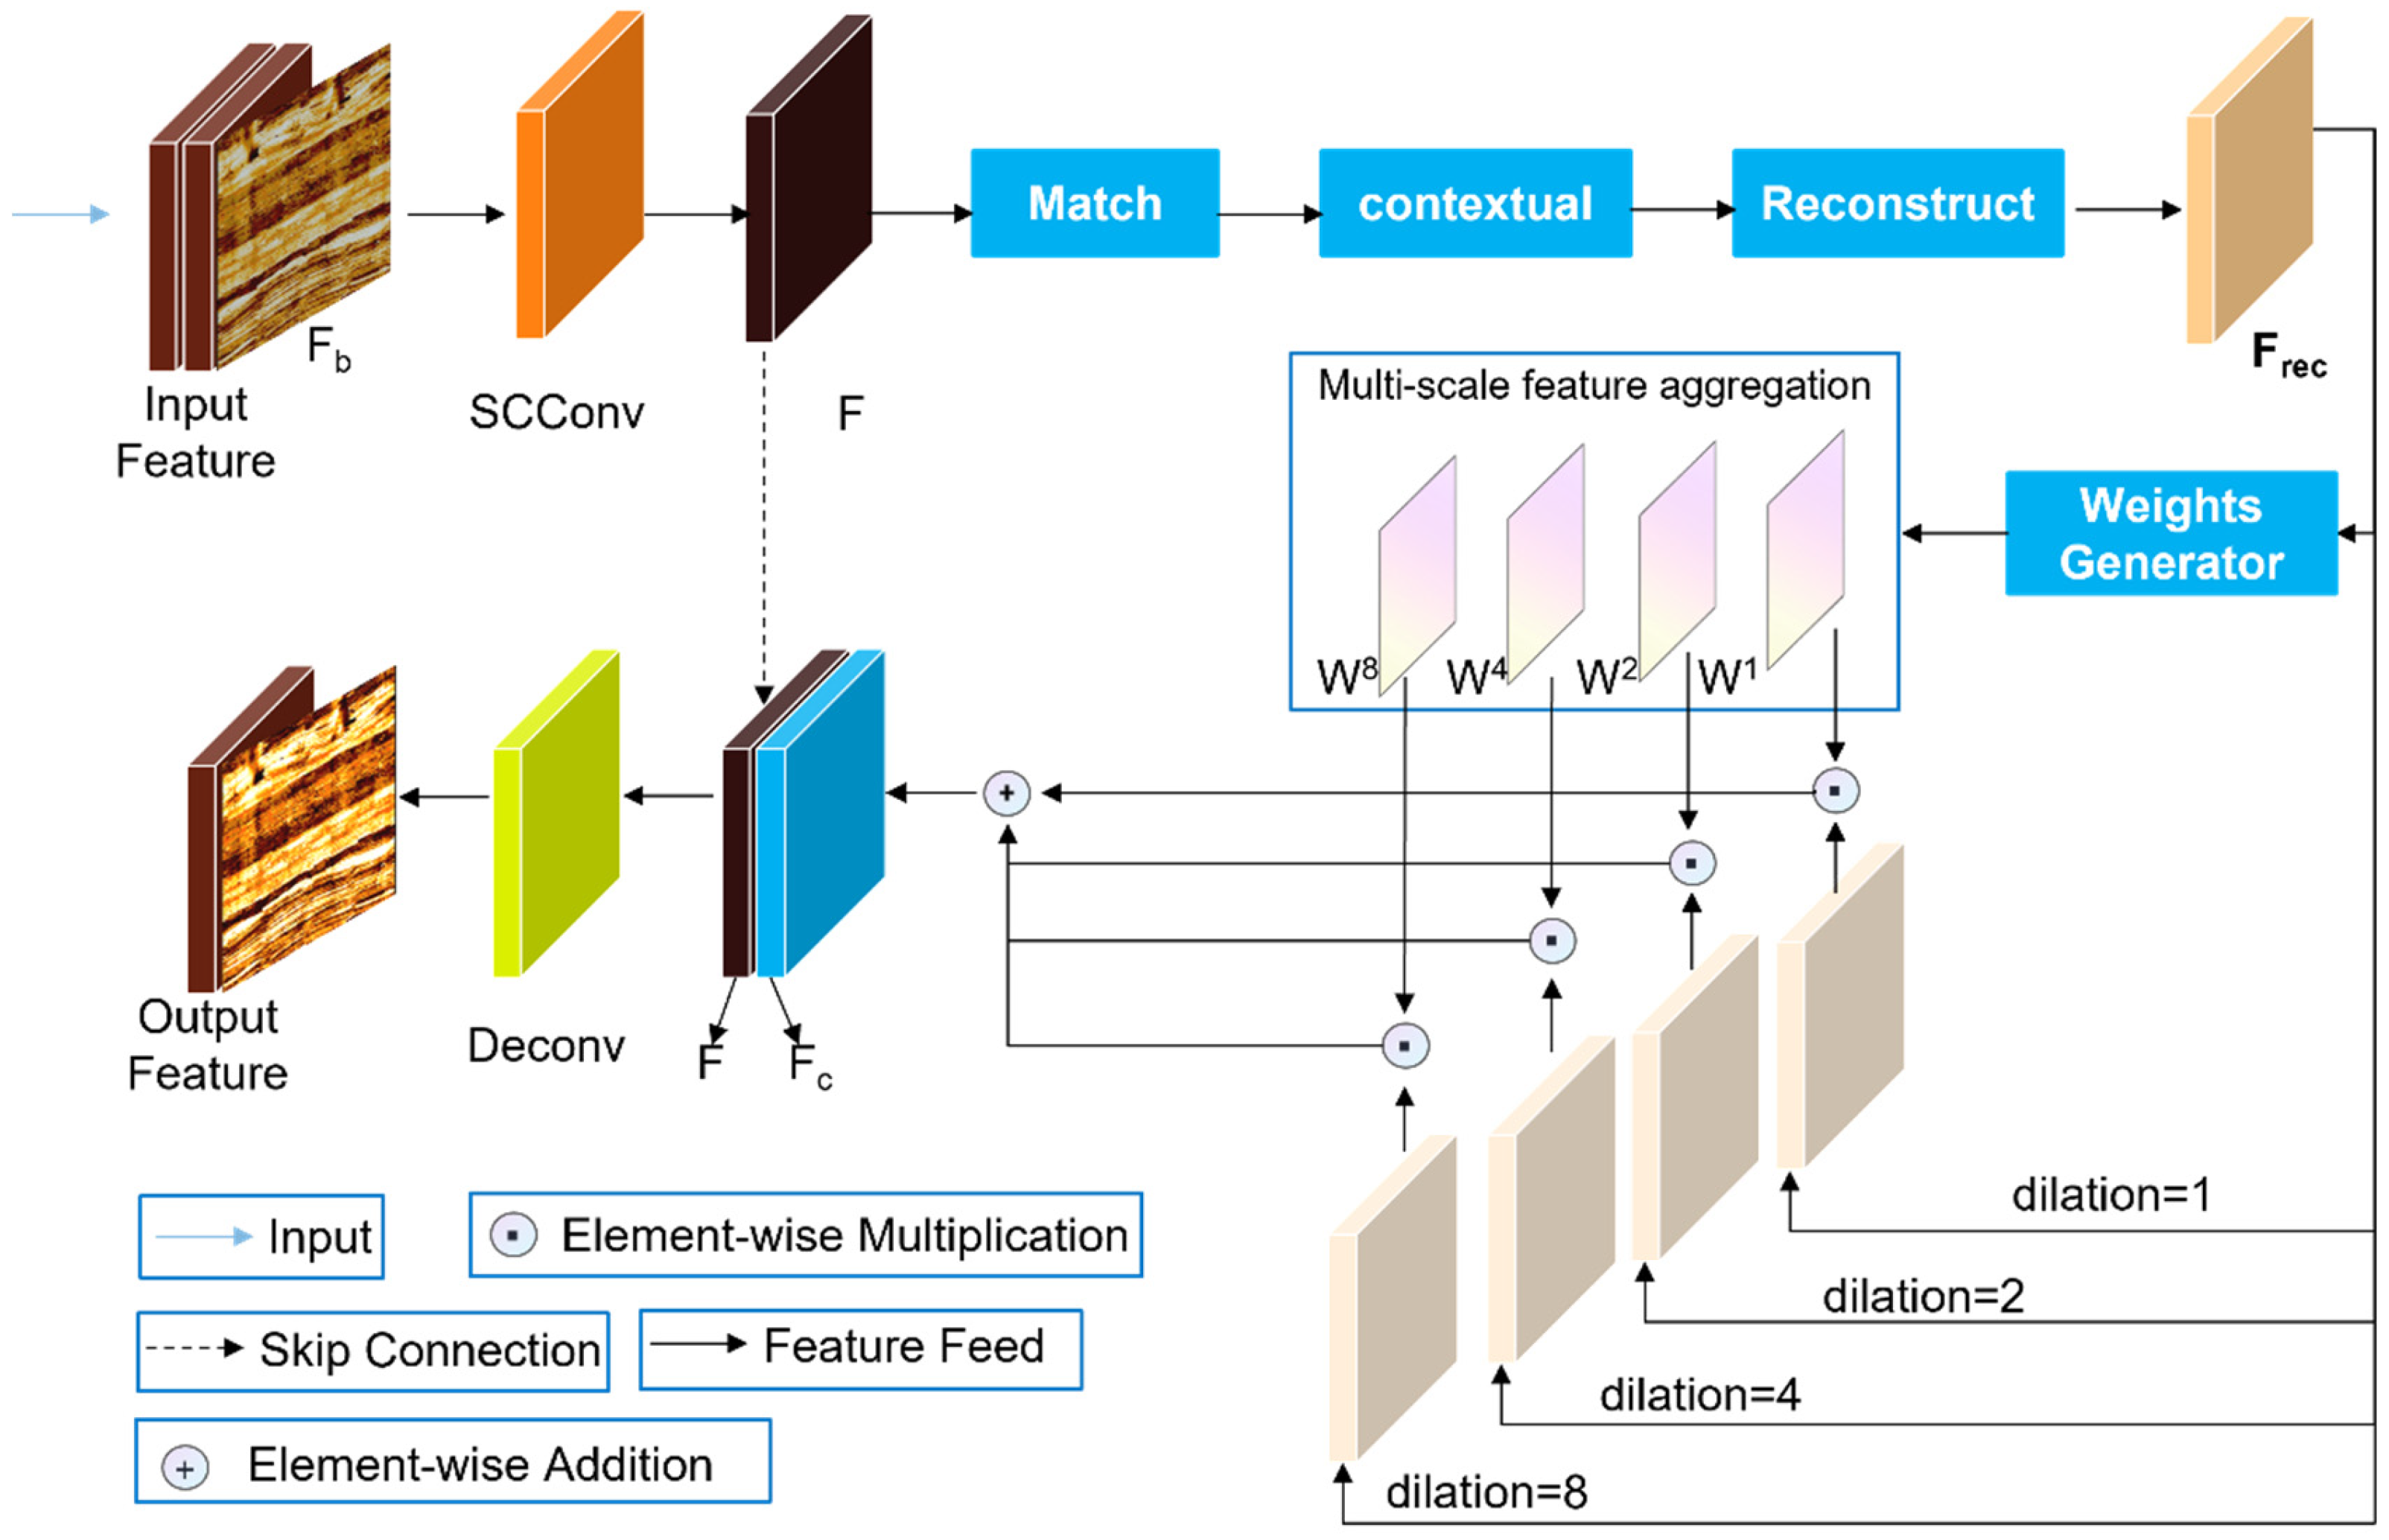
The SC-CFA module is based on a context aggregation framework and combines SCConv to achieve feature redundancy suppression and deep coupling of multi-scale contextual modeling. As shown in
Figure 8, the input feature first passes through the SCConv module, where SRU separates important and non-important regions, and CRU compresses redundant channels to generate an optimized intermediate feature F, providing a denoised foundational expression for subsequent processing. Subsequently, the feature enters the context matching and reconstruction stage, constructing attention weights through block similarity calculations to guide feature recombination and generate an initial repair feature F
rec. This feature is further input into a multi-scale feature aggregation branch, consisting of four parallel dilated convolutions (dilation rates of 1, 2, 4, 8) to extract contextual information at different scales. Each group outputs independent weight generators that dynamically produce pixel-level weights W
1, W
2, W
4, and W
8. Through element-wise multiplication, these weights adaptively weight each scale’s features, which are then fused into global perception features through element-wise addition. The fused features are restored to spatial resolution via deconvolution and combined with skip connections to provide cross-layer feedback with the original input features, preserving consistency to avoid information loss. The entire process achieves hierarchical feature fusion from local details to long-range dependencies through SCConv’s redundancy suppression, multi-scale dynamic weighting, and cascaded context reconstruction, reducing redundancy while enhancing the semantic rationality and texture continuity of the restored region.
The SC-CFA module hierarchically aggregates multi-scale features through dynamic weighting and redundancy suppression, enhancing long-range dependency modeling while preserving texture continuity and geological coherence.
3.2.3. Discriminator Network Design
The discriminator network adopts a dual-branch architecture, as shown in
Figure 4c, consisting of two parallel branches to process RGB images and edge-grayscale composite inputs, respectively. The texture branch employs a five-layer convolutional structure (the first three layers use 4 × 4 convolutions with stride 2 for downsampling, while the latter two layers maintain resolution) to hierarchically extract features and evaluate texture authenticity. The structure branch introduces residual blocks to preprocess edge information and processes concatenated edge and grayscale maps using convolutional operations of the same hierarchy, focusing on constraining geometric rationality. Both branches utilize spectral normalization to stabilize training. Final feature fusion is achieved by concatenating outputs along the channel dimension.
3.2.4. Loss Function Design
For the blank strip inpainting task in electrical imaging logging, a multi-objective joint loss function is introduced to enhance visual quality, structural consistency, and semantic rationality of the restored results. The loss components include reconstruction loss, perceptual loss, style loss, and adversarial loss.
Reconstruction loss: Based on the L1 norm, this loss constrains pixel-level alignment between the inpainted image
Iout and the ground-truth logging image
Igt, suppressing global blurring while preserving high-frequency geological response features. This avoids lithological misjudgment caused by low-frequency deviations and ensures accurate reconstruction of physical quantities such as resistivity:
where ||⋅||
1 denotes the L1 norm.
Perception loss: Leveraging a pretrained VGG-16 network [
37], this loss extracts multi-level semantic features to constrain similarity between generated and real images in deep feature space, enhancing semantic coherence of formation interfaces and pore structures:
where
ϕi represents the activation maps from the
i-th pooling layer of VGG-16.
Style loss: This loss constrains local texture distribution via Gram matrix differences between generated and real images, suppressing non-geological pseudo-texture noise and abrupt resistivity patterns:
where
ψi is the Gram matrix of feature maps.
Adversarial loss: Introduces a discriminator
D to improve visual realism through adversarial training while avoiding excessive smoothing or artifacts:
where
Egt and
Eout denote structural edge maps of real and generated images, respectively.
The total multi-objective joint loss is defined as:
where
λ denotes the weights of each loss, experimentally set to
λrec = 1.0,
λperc = 0.2,
λstyle = 50, and
λadv = 0.05.
3.3. Workflow
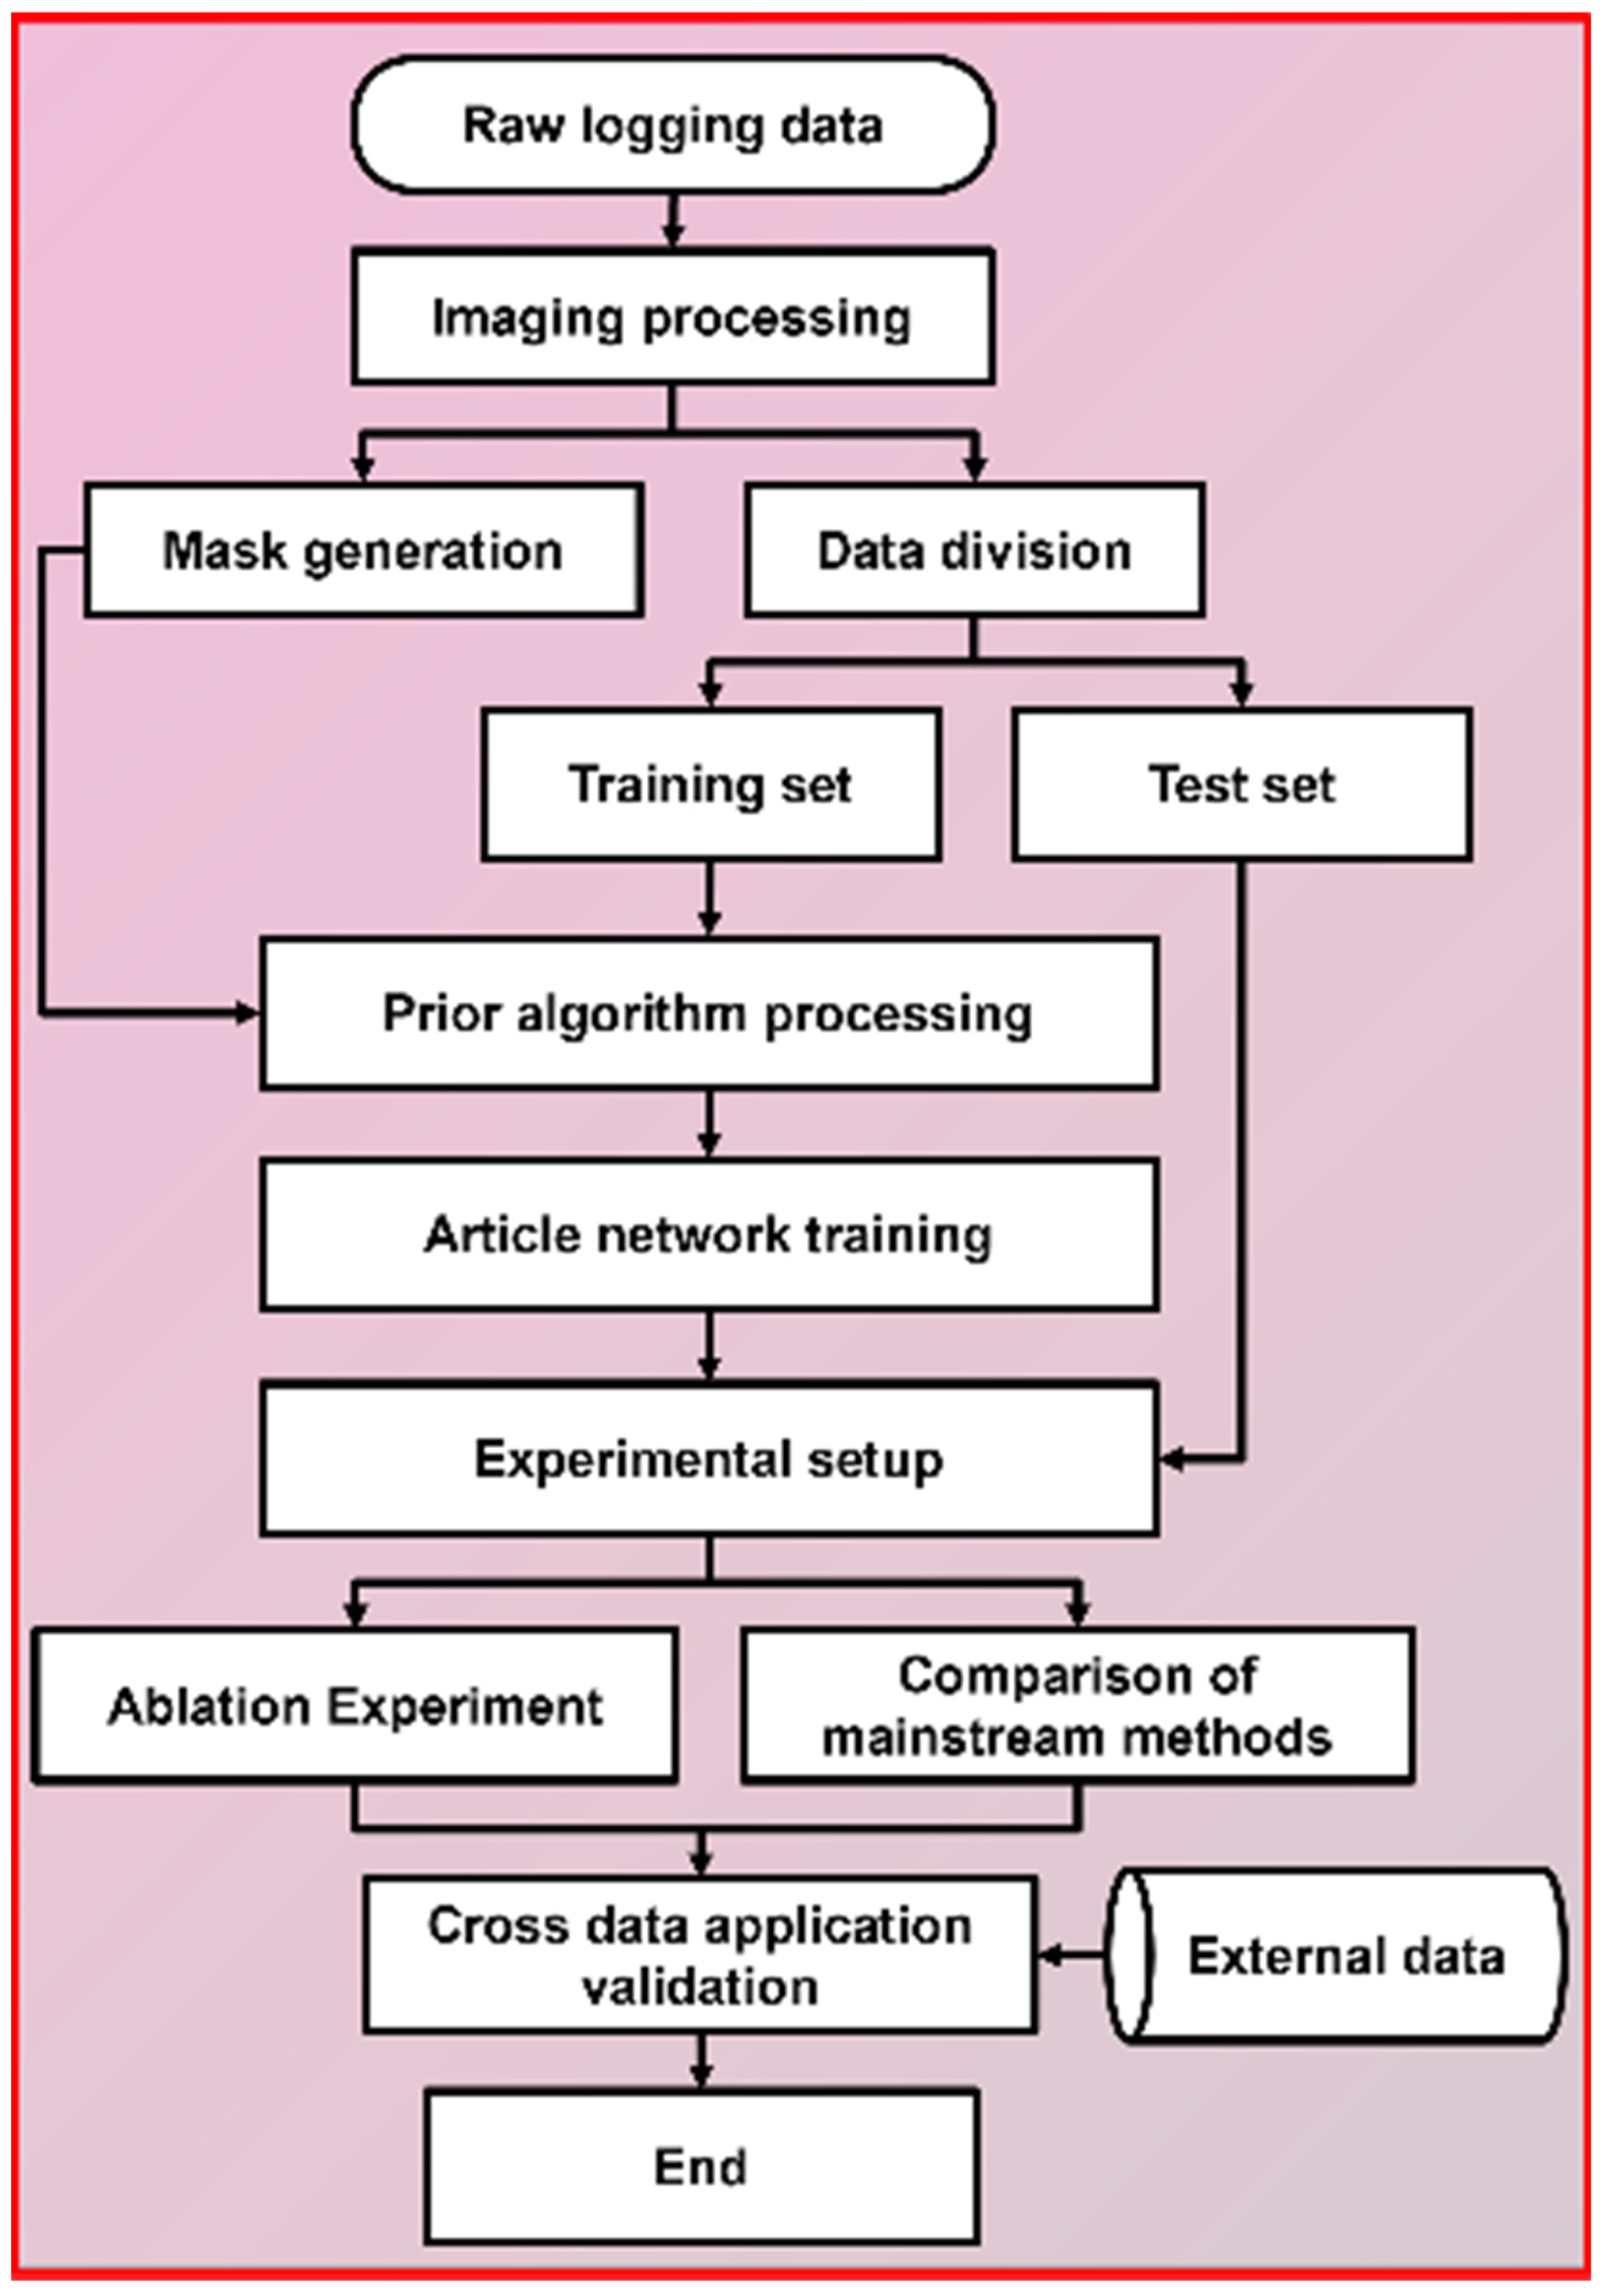
The workflow of the proposed dual-stream network based on wavelet and spatial-channel convolution collaborative optimization for blank strips inpainting in electrical imaging logging images is illustrated in
Figure 9. First, six wells from the Buried Hills reservoir were selected as the dataset and divided into training and test sets to establish a benchmark data framework. A texture-aware data prior algorithm was then applied to concurrently inpaint the training set images, followed by manual validation and selection of valid data by expert staff. Next, the dual-stream network was constructed, and the training set images with their corresponding masks were fed into the model for training. The hyperparameters used in the model are listed in
Table 1. Finally, the optimal trained weights were loaded to evaluate the model on 50 test set images, including comparative experiments and ablation experiments. To further validate the effectiveness of the proposed method, cross-region generalization analysis was performed using logging data from low-permeability hydrocarbon reservoirs, supplemented by core sample comparisons.
5. Discussion
5.1. Pixel-Wise Correlation Statistical Analysis
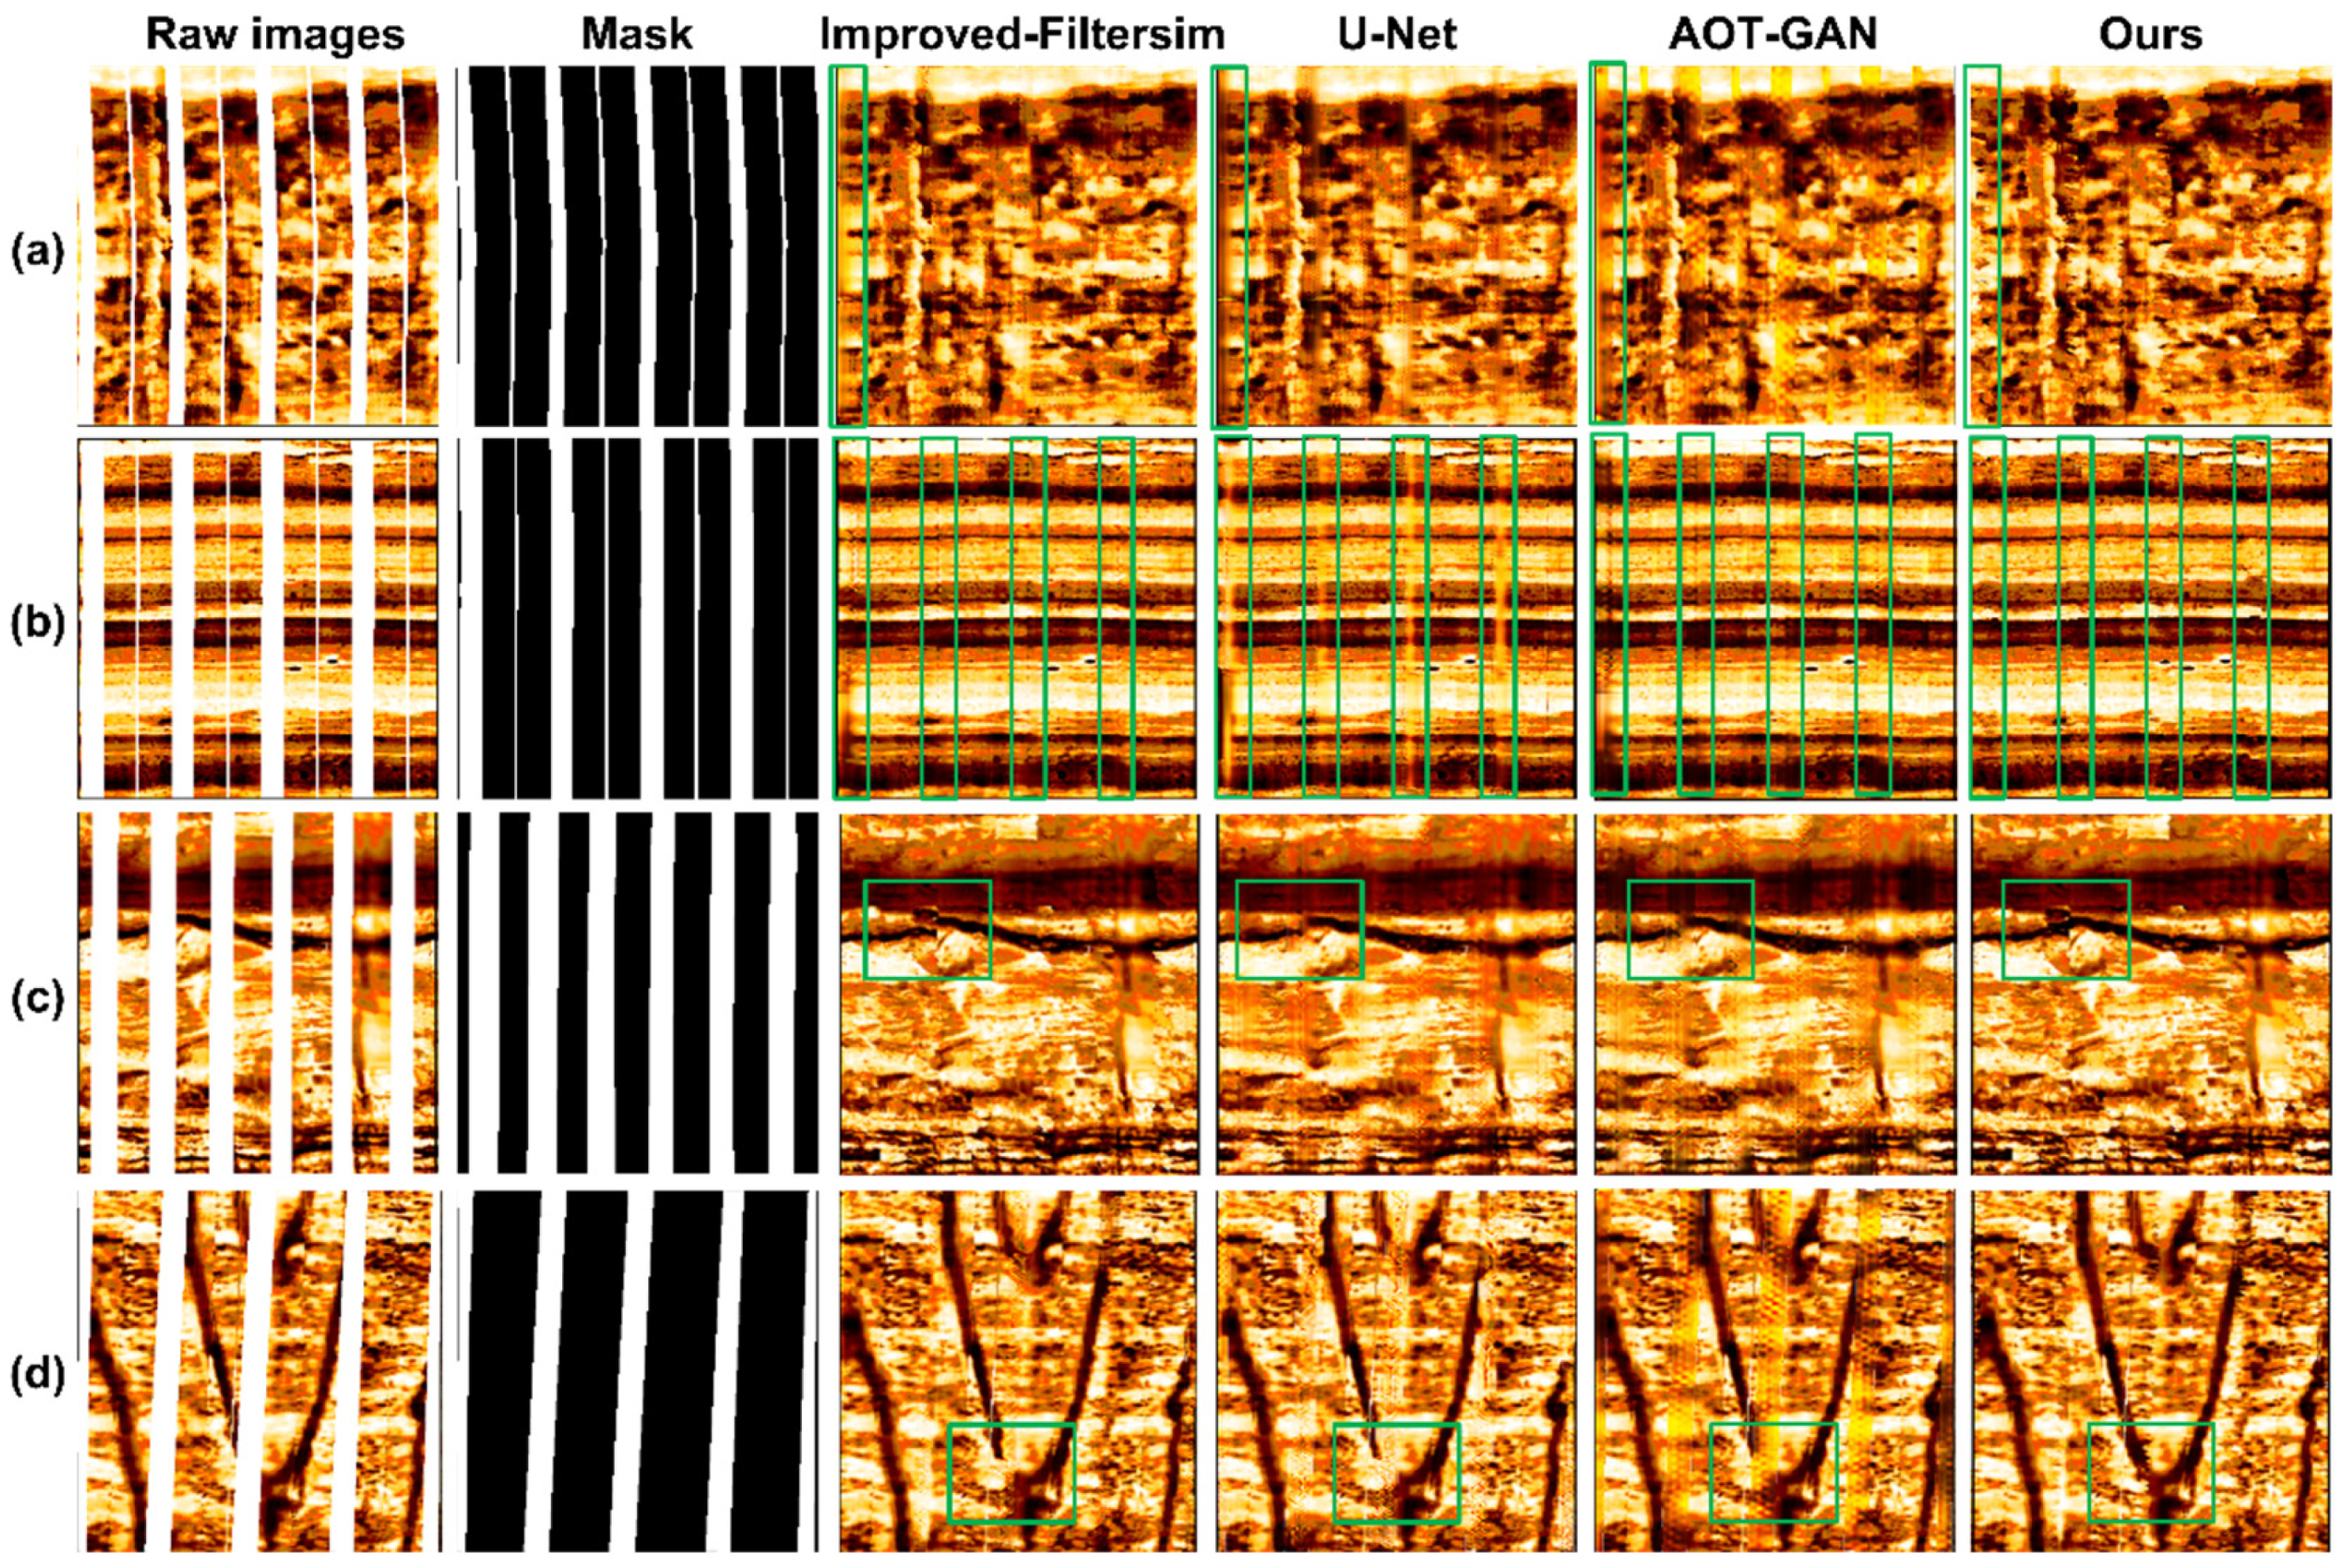
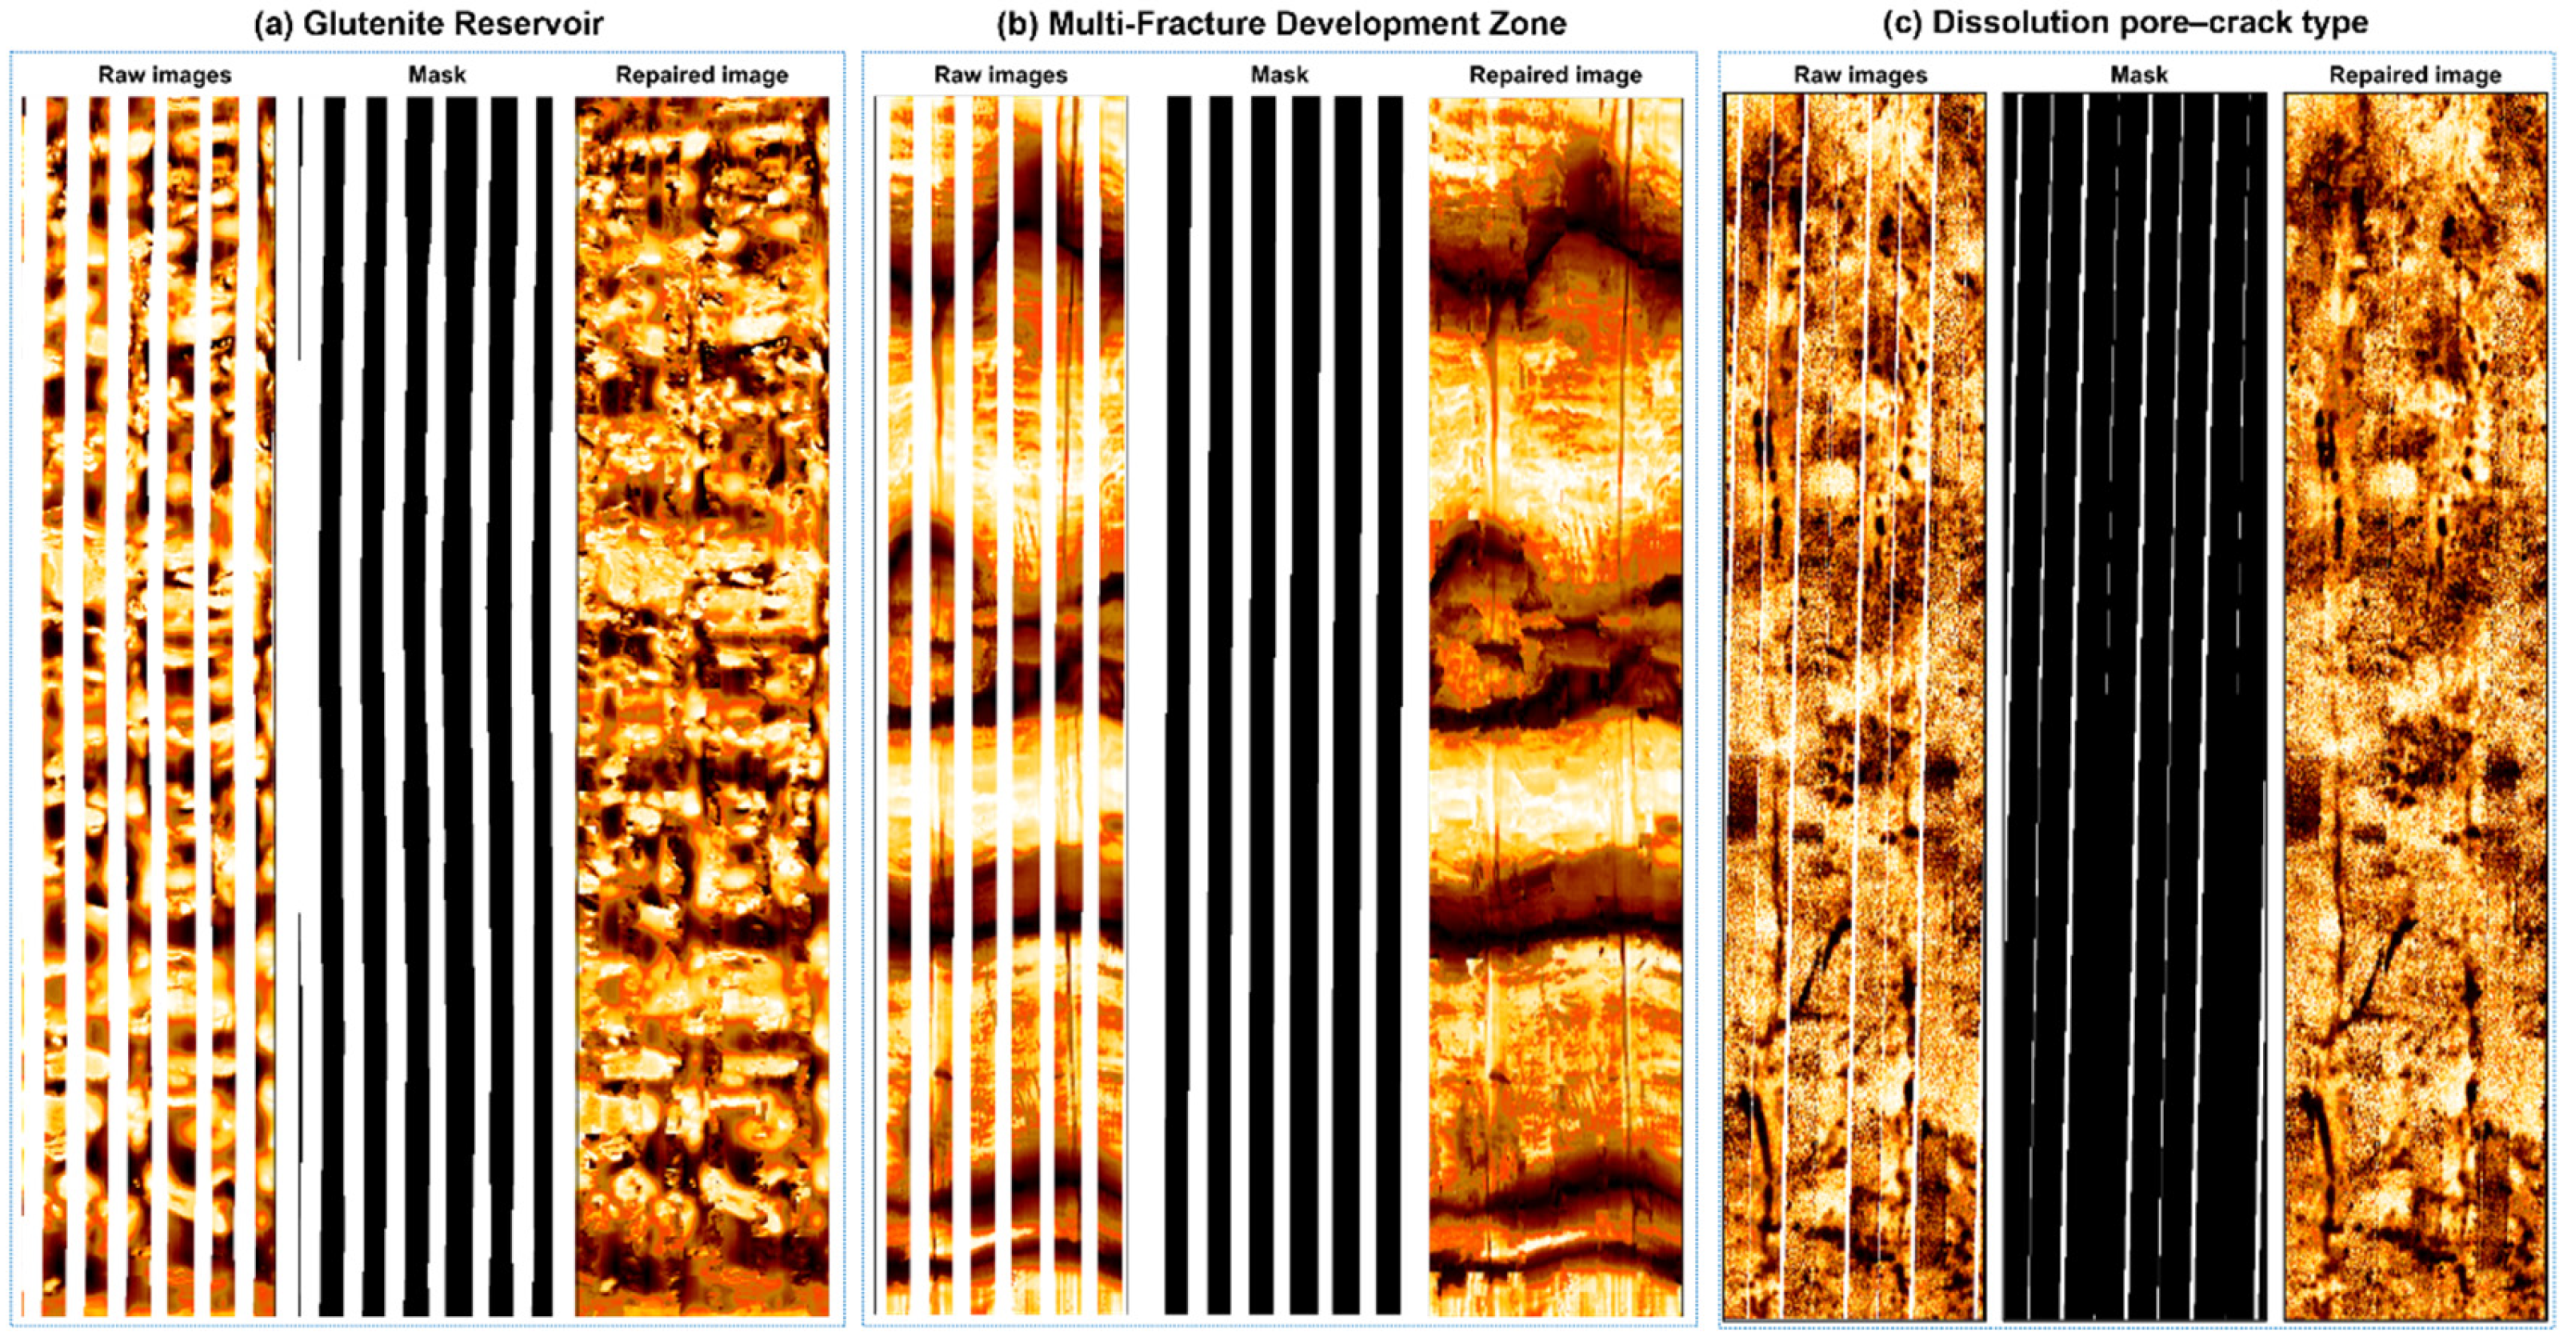
Through the collaborative design of wavelet transforms and spatial-channel convolutions, this study successfully addresses the key challenges of multi-scale feature extraction and texture consistency in the task of blank-band restoration for electrical imaging logging images. Innovatively adopting a dual-stream complementary optimization mechanism of structure-flow and texture-flow (
Figure 4), experiments demonstrate that this architecture simultaneously enhances the geometric rationality and texture clarity of repaired regions: the structure-flow network ensures the topological continuity of fracture morphology, while the texture-flow network achieves subpixel-level texture reconstruction through multi-scale feature fusion, effectively overcoming the common fracture artifact issues in models like U-Net.
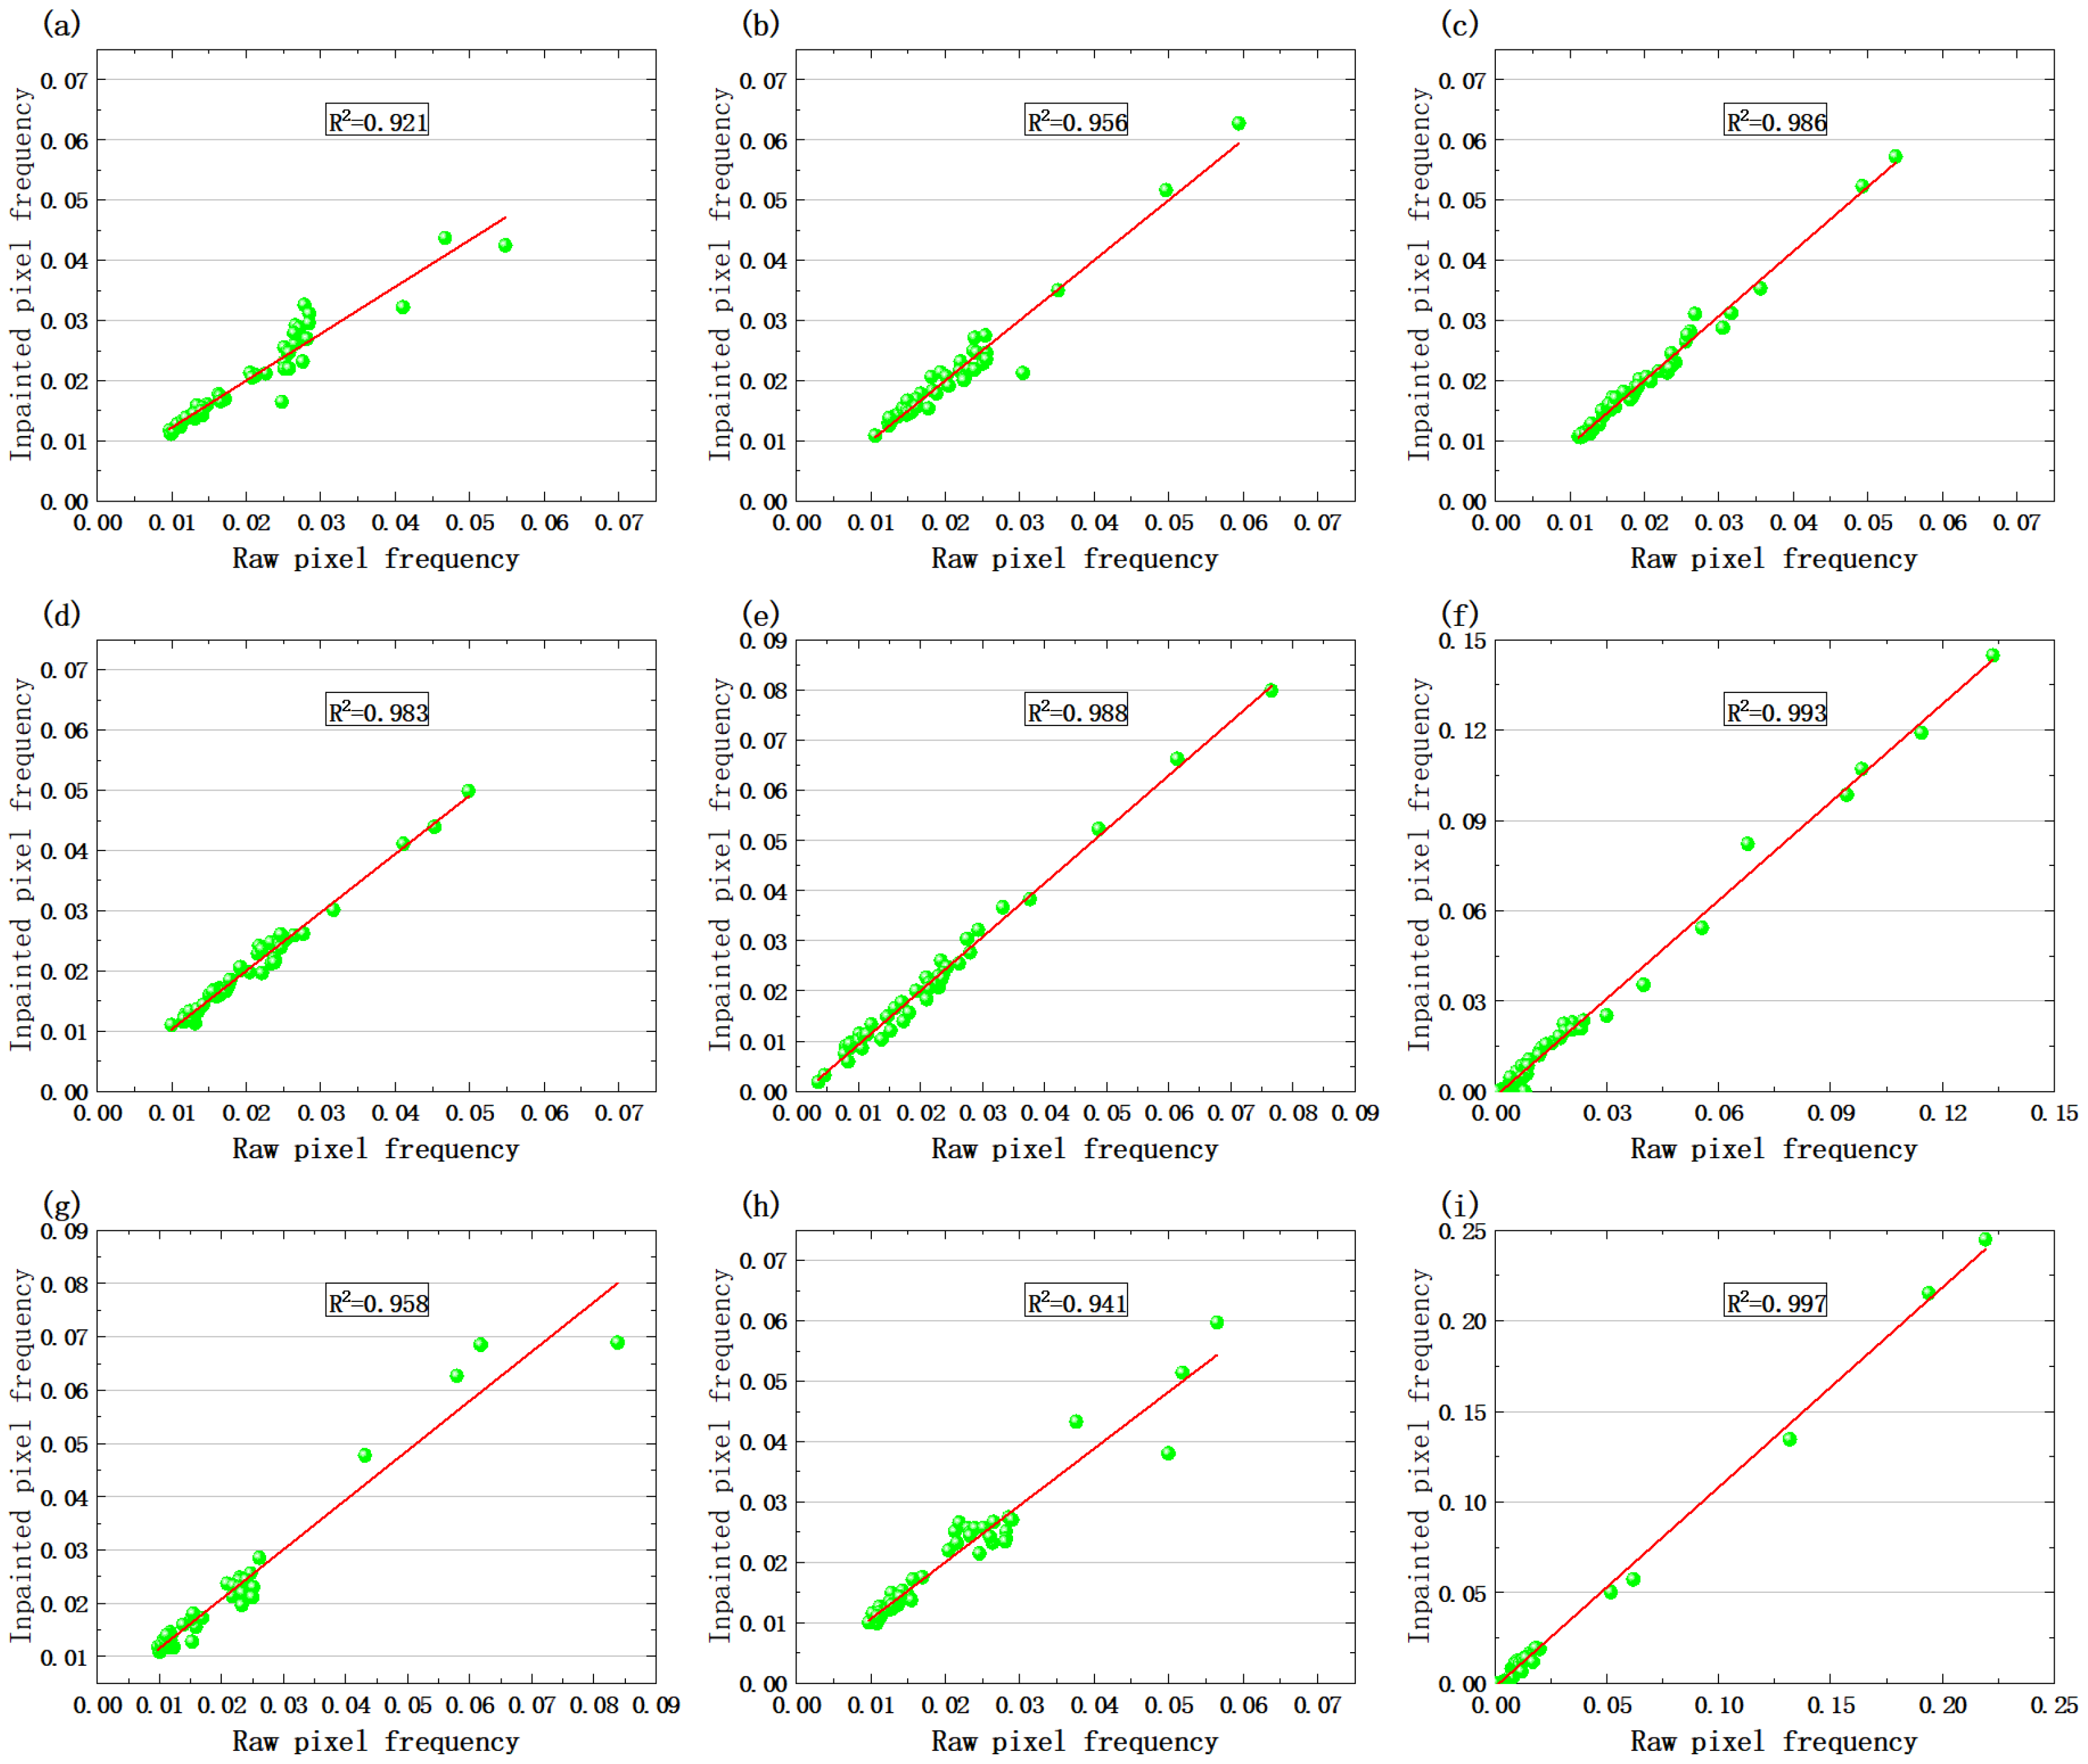
To quantify the statistical consistency between the repaired results and the original images, this study innovatively introduces pixel distribution correlation analysis: the pixel values of repaired regions are divided into intervals, and their frequency distributions are statistically compared with those of the original images using Pearson correlation coefficients for quantitative evaluation. Statistical analysis of nine representative samples from the proposed method’s repaired results in
Figure 10,
Figure 12 and
Figure 14 (see
Figure 16a–i) reveals that the pixel distribution correlation coefficients between repaired and original images range from 0.921 to 0.997, demonstrating high statistical significance. These results confirm the dual advantages of our method in complex geological image restoration: it maintains both the spatial continuity of structural features in local regions and the statistical distribution patterns of sedimentary textures at a global scale. Notably, the highest correlation coefficient (0.997) appears in the sample with multi-fracture structures (corresponding to
Figure 14b), as shown in
Figure 16i, fully illustrating the dual-stream network’s capability for collaborative modeling of multi-scale geological features. While achieving precise local structural restoration, the method effectively preserves the consistency of global statistical properties in images. This “local–global” dual-constraint mechanism significantly improves the reliability of geological interpretation for electrical imaging logging data.
5.2. Sensitivity to Key Hyperparameters
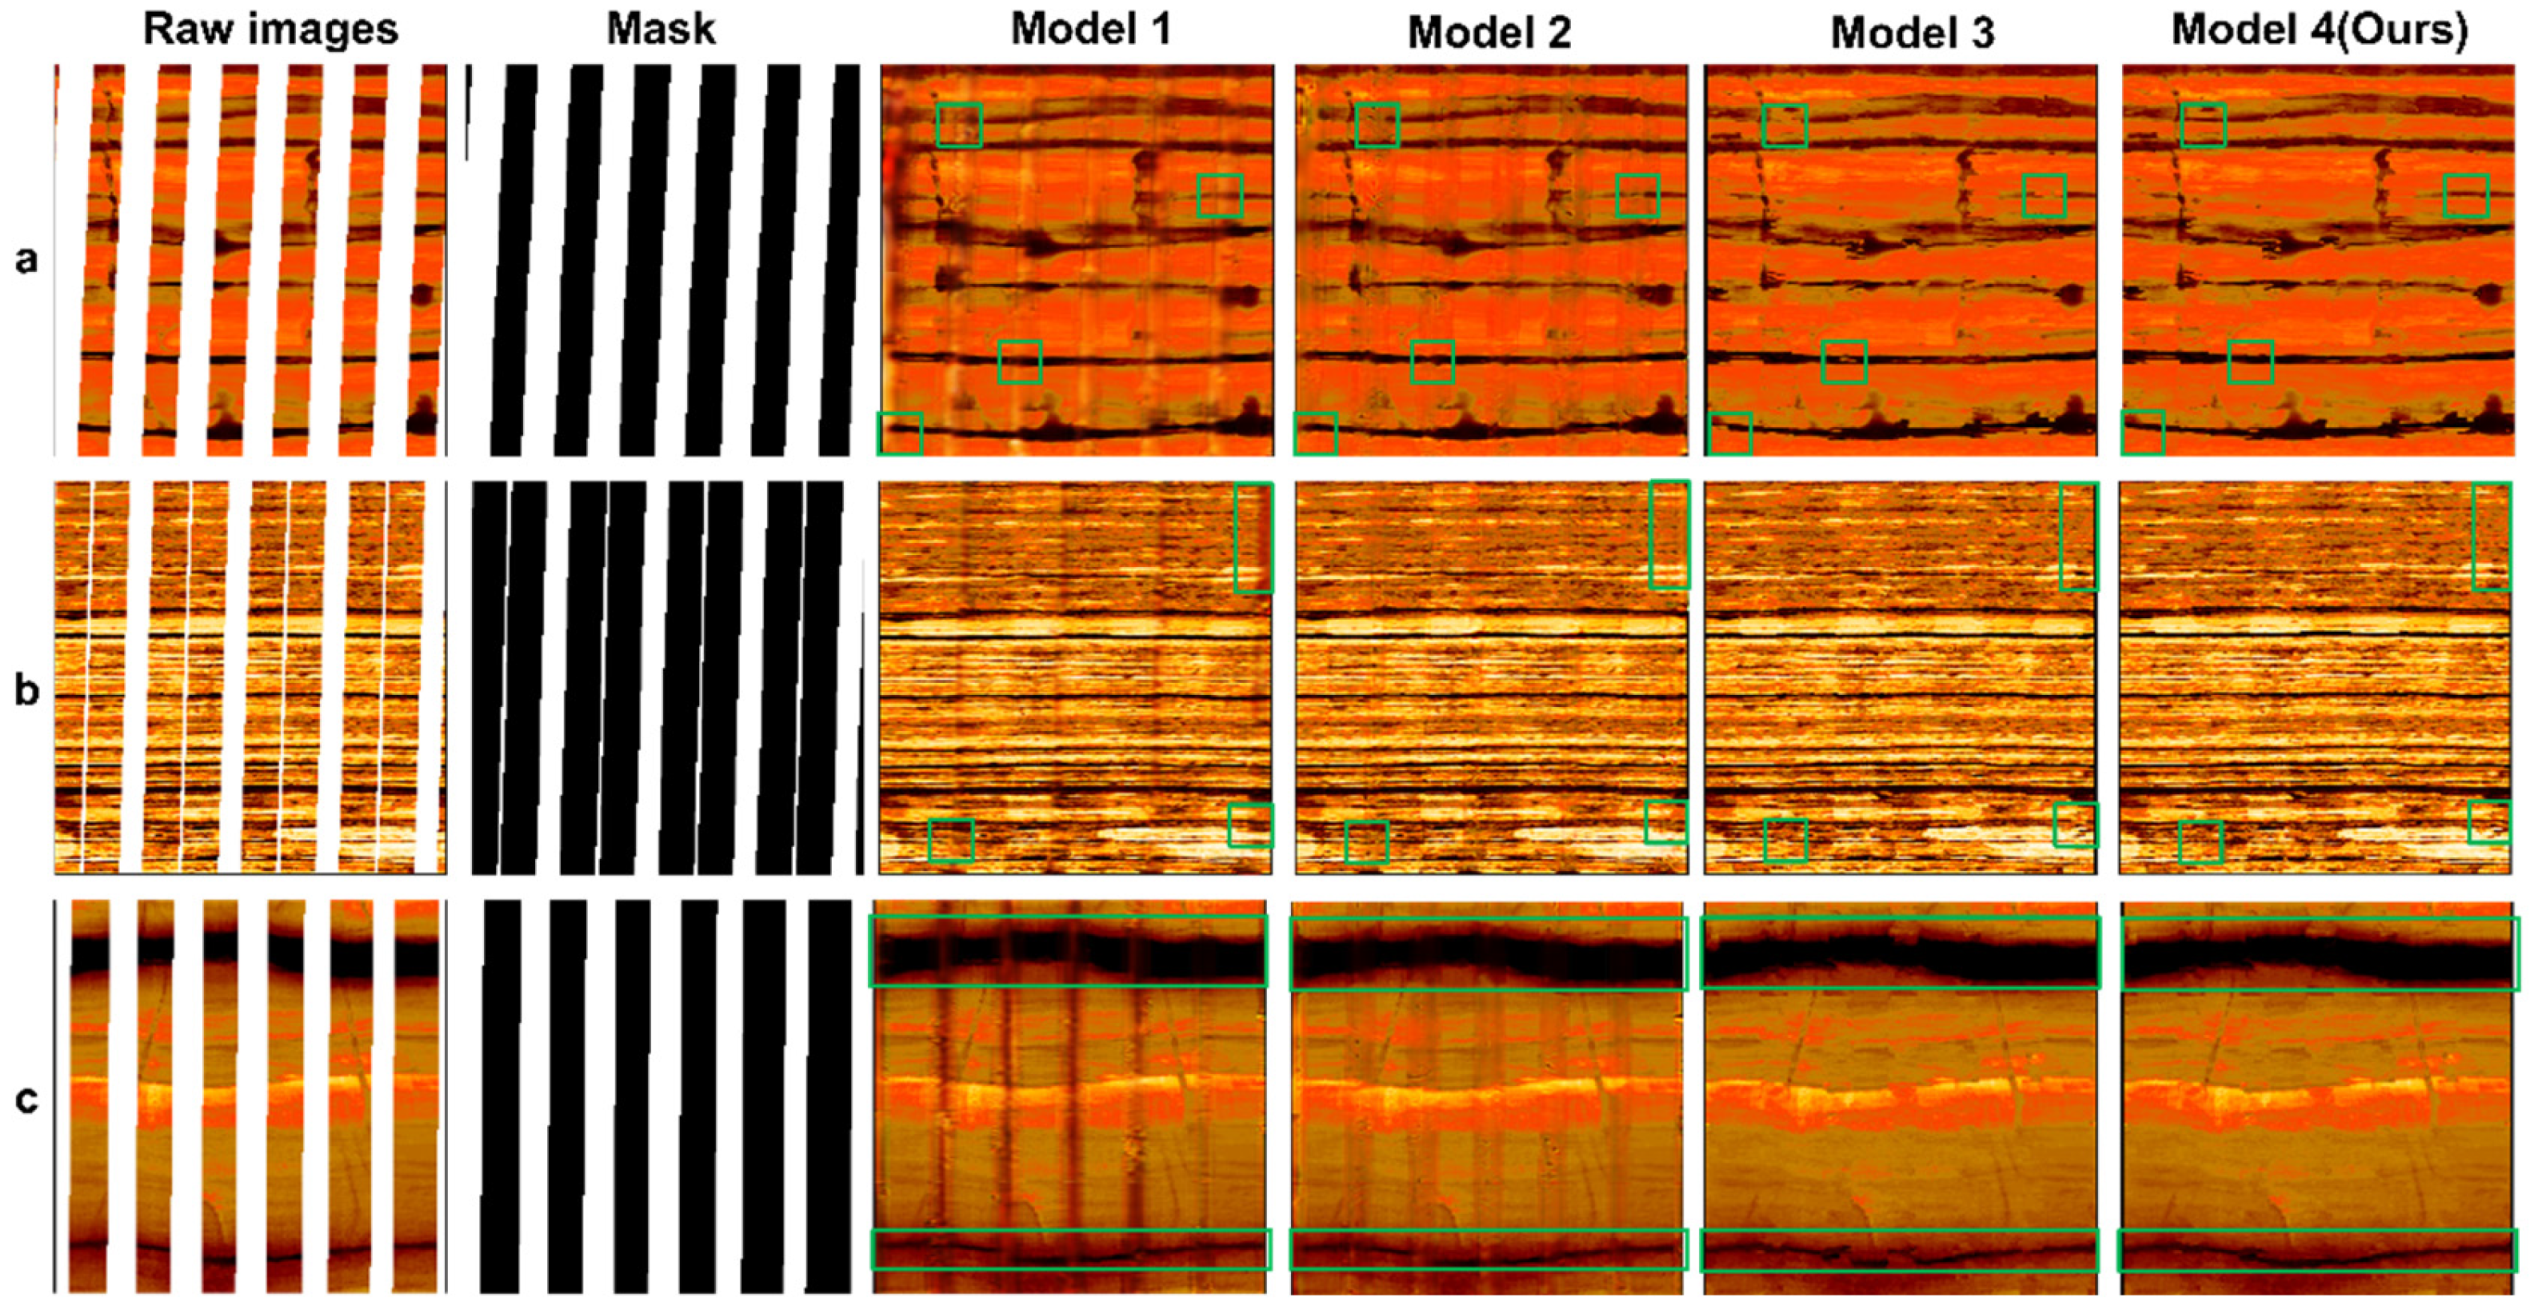
Although the proposed dual-stream image restoration framework demonstrates notable advantages in structural preservation and texture detail reconstruction, it still exhibits a degree of dependency on hyperparameters at the model design level, which requires further investigation. As shown in
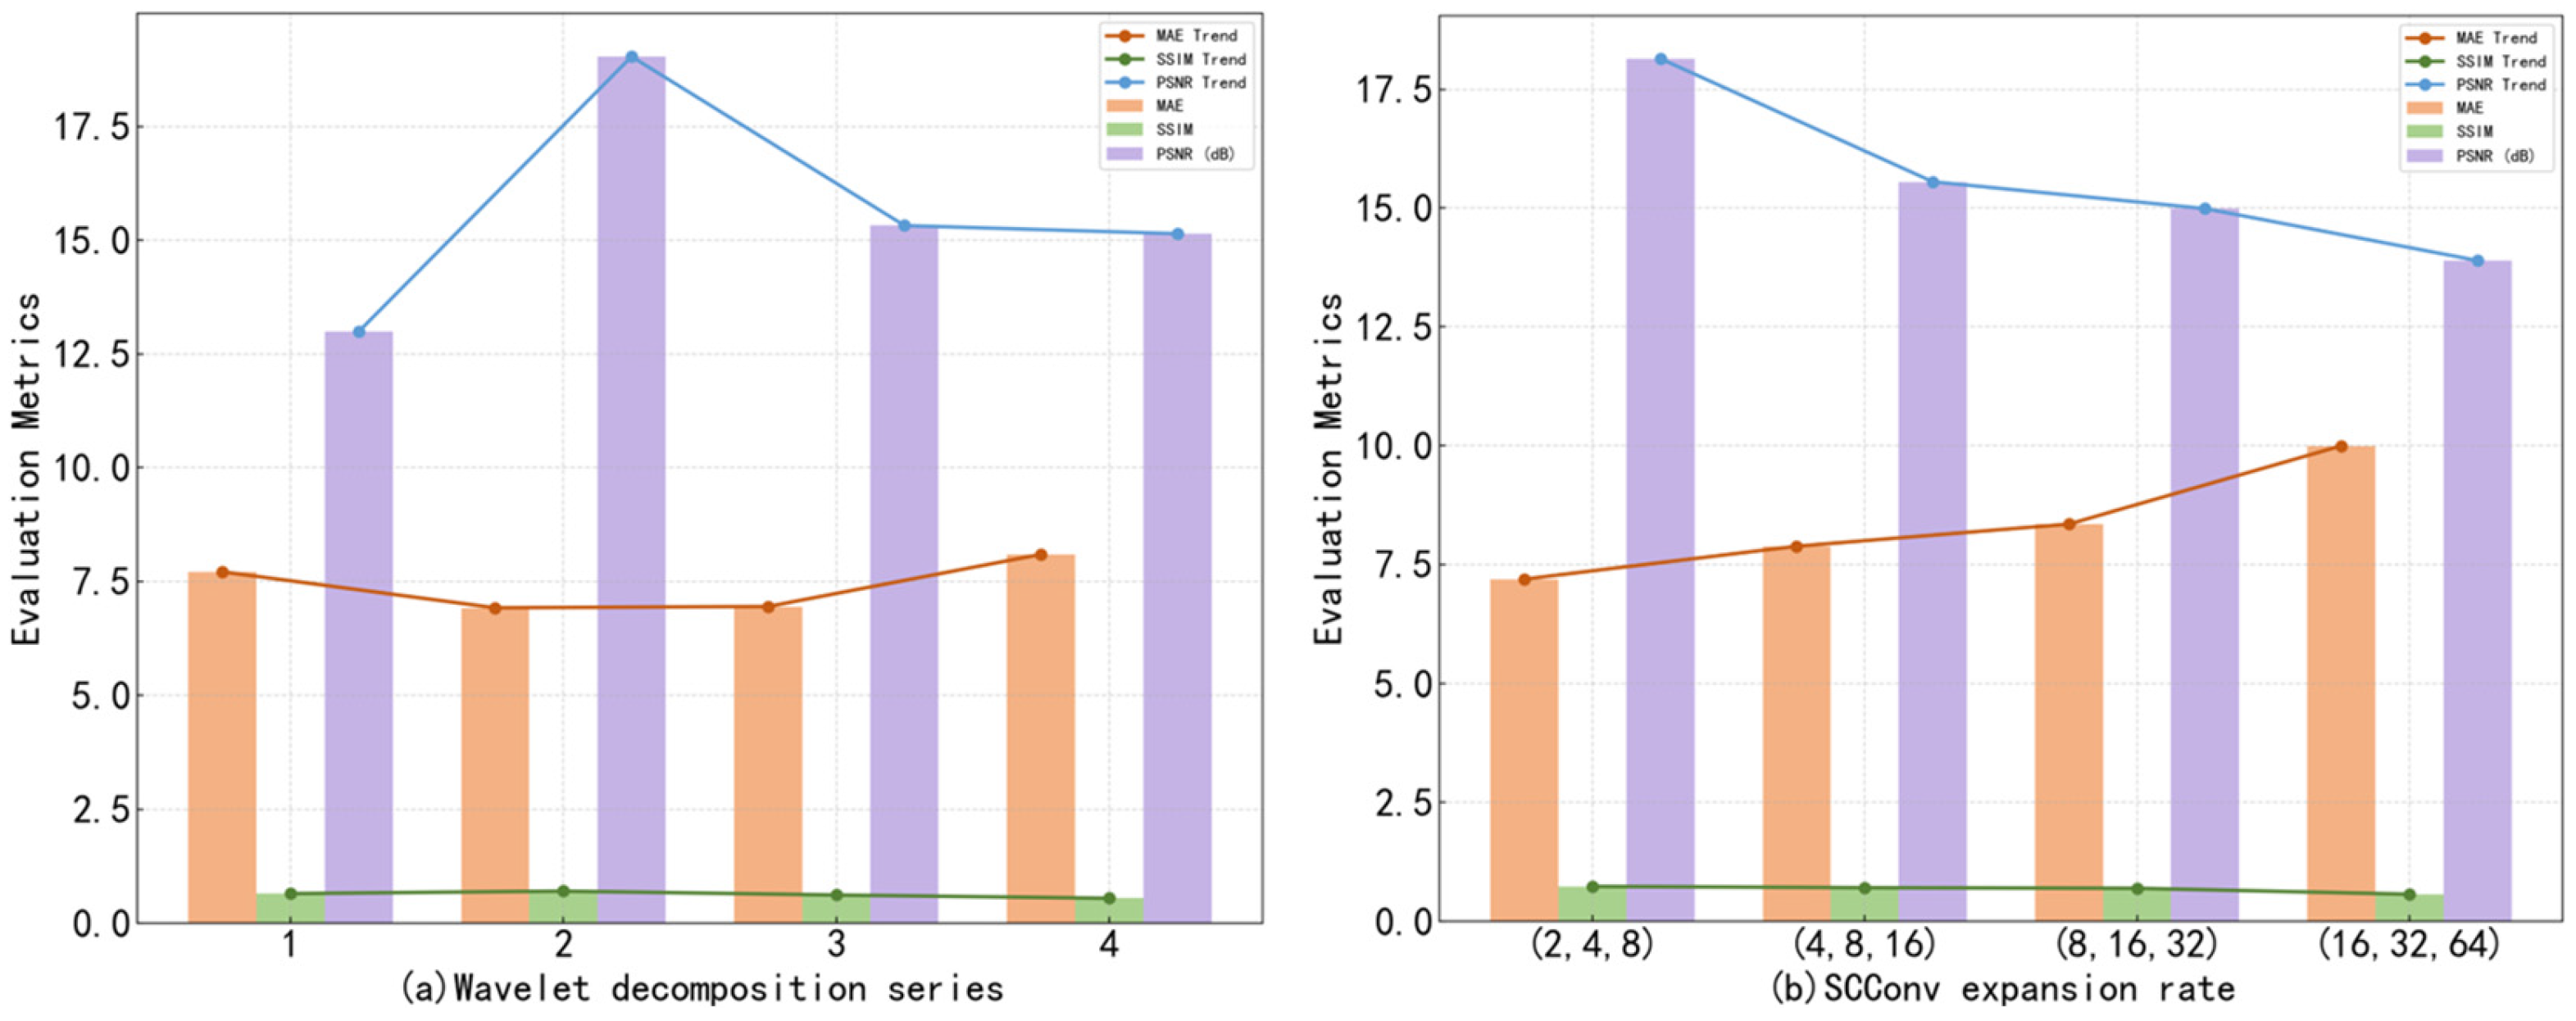
Figure 17, the model’s performance shows significant variation under different wavelet decomposition series and SCConv expansion rate configurations, indicating a certain sensitivity to key hyperparameters.
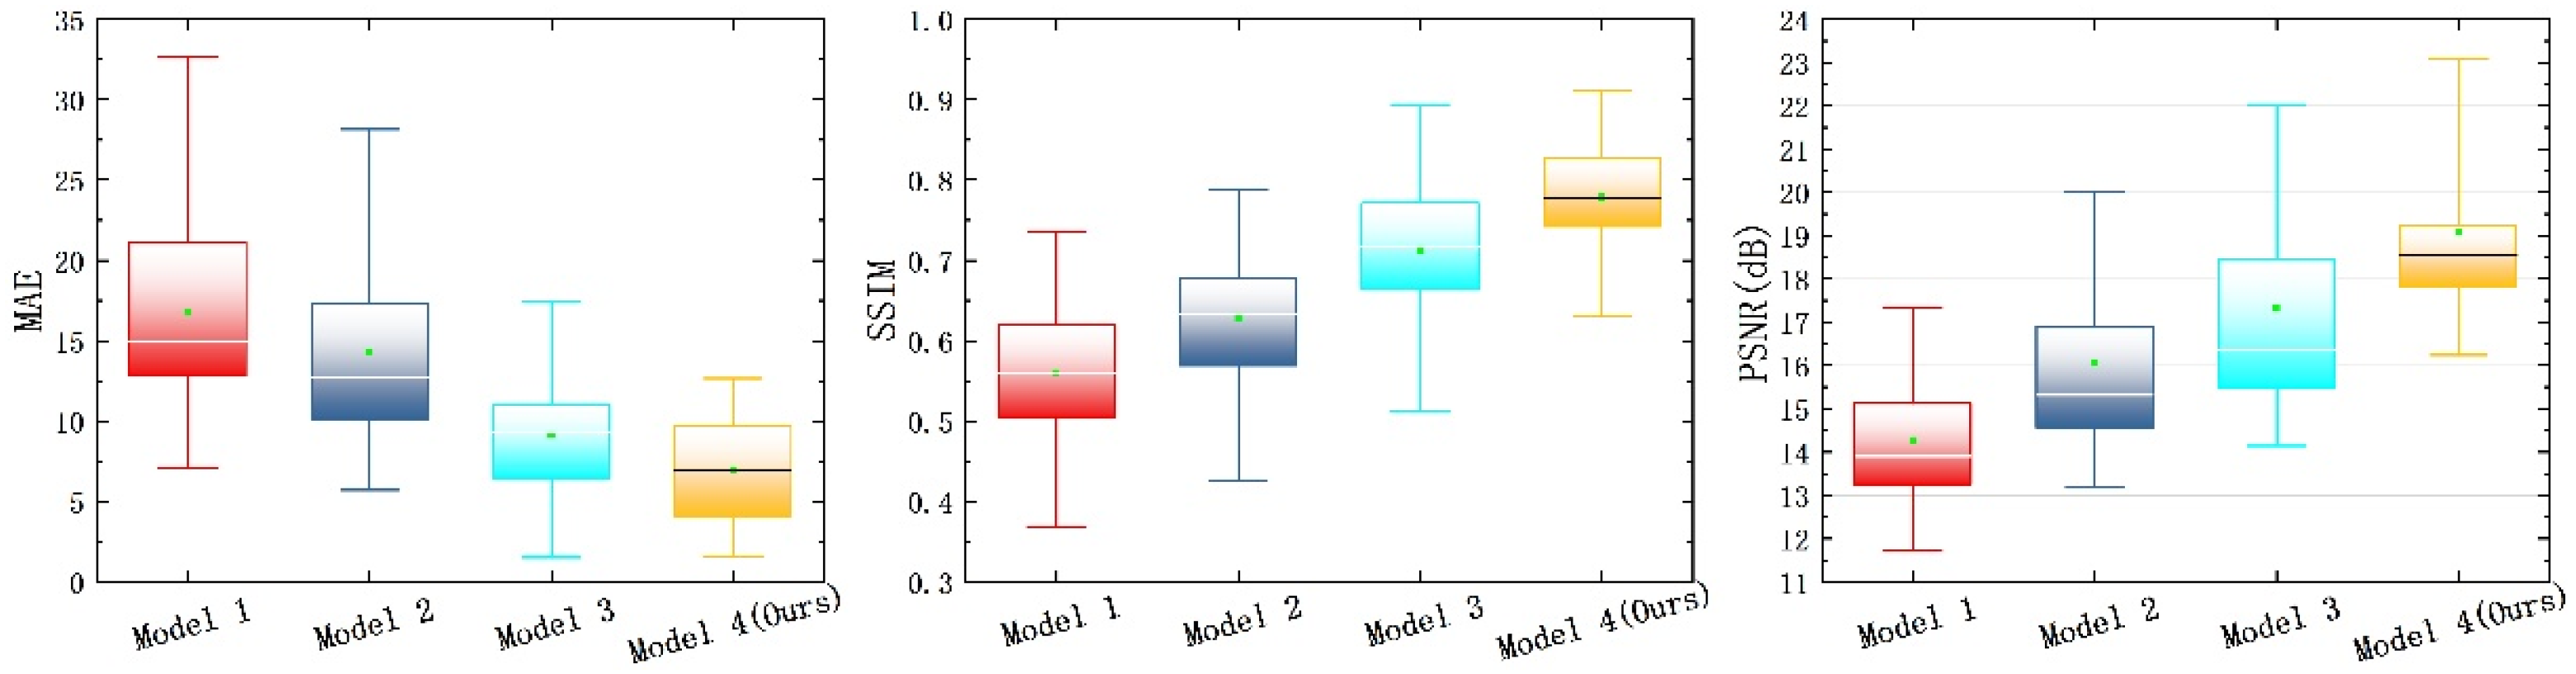
In terms of the wavelet decomposition series, configurations with 1, 2, 3, and 4 decomposition levels were examined. The results reveal that a two-level decomposition achieves the best overall performance, demonstrating the lowest MAE and the highest SSIM and PSNR scores. This indicates that it can effectively capture high-frequency textures while suppressing checkerboard artifacts, without causing a notable increase in memory consumption. In comparison, a single decomposition level is insufficient for detail extraction, while three-level and four-level decompositions tend to introduce information redundancy and risk of detail loss. These results suggest an optimal range exists for the depth of wavelet decomposition in structural restoration tasks.
Regarding the SCConv expansion rate, four sequences—(2, 4, 8), (4, 8, 16), (8, 16, 32), and (16, 32, 64)—were compared. Among them, the (2, 4, 8) configuration strikes the best balance between receptive field enlargement and computational complexity control, resulting in the lowest MAE and the highest SSIM and PSNR scores. This shows that moderate expansion rates are effective in enlarging the receptive field while preserving local structural details. In contrast, larger expansion rates such as (4, 8, 16) enhance the expressive capacity of feature channels but are prone to introducing excessive smoothing artifacts during reconstruction, leading to structural degradation and overall performance decline. Extreme configurations like (16, 32, 64) exhibit near-degraded performance across multiple metrics, likely due to high memory demands and unstable gradient propagation, further indicating that excessively large expansion rates are not advisable.
In conclusion, although the proposed model surpasses existing approaches in several evaluation metrics, its robustness still depends, to some extent, on the careful tuning of critical hyperparameters.
6. Conclusions
This study proposes a dual-stream network for electrical imaging log blank-band restoration based on wavelet–spatial channel collaborative optimization. The main innovations of this method in electrical imaging restoration are summarized as follows:
- (1)
A dual-stream complementary optimization mechanism integrating structure-flow and texture-flow: The structure-flow ensures the topological continuity of fracture morphology. The texture–flow achieves subpixel-level texture reconstruction through multi-scale feature fusion, effectively resolving fracture artifacts common in single-stream or conventional dual-stream models, while simultaneously improving the geometric rationality and texture clarity of repaired regions.
- (2)
Innovative introduction of the WTConv module: A multi-band orthogonal decomposition-convolution-inversion mechanism enables refined restoration, significantly expanding the receptive field of convolutional layers. This allows the model to capture more contextual information at lower computational costs, better understand the overall image structure, and improve processing capabilities for different frequency components.
- (3)
Design of SCBi-GFF and SC-CFA modules: Joint optimization of texture and structural generation quality collaboratively addresses discontinuous fracture details. Through cross-path feature interaction and dynamic parameter weighting, semantic consistency of structural-textural features is enhanced, avoiding local distortions.
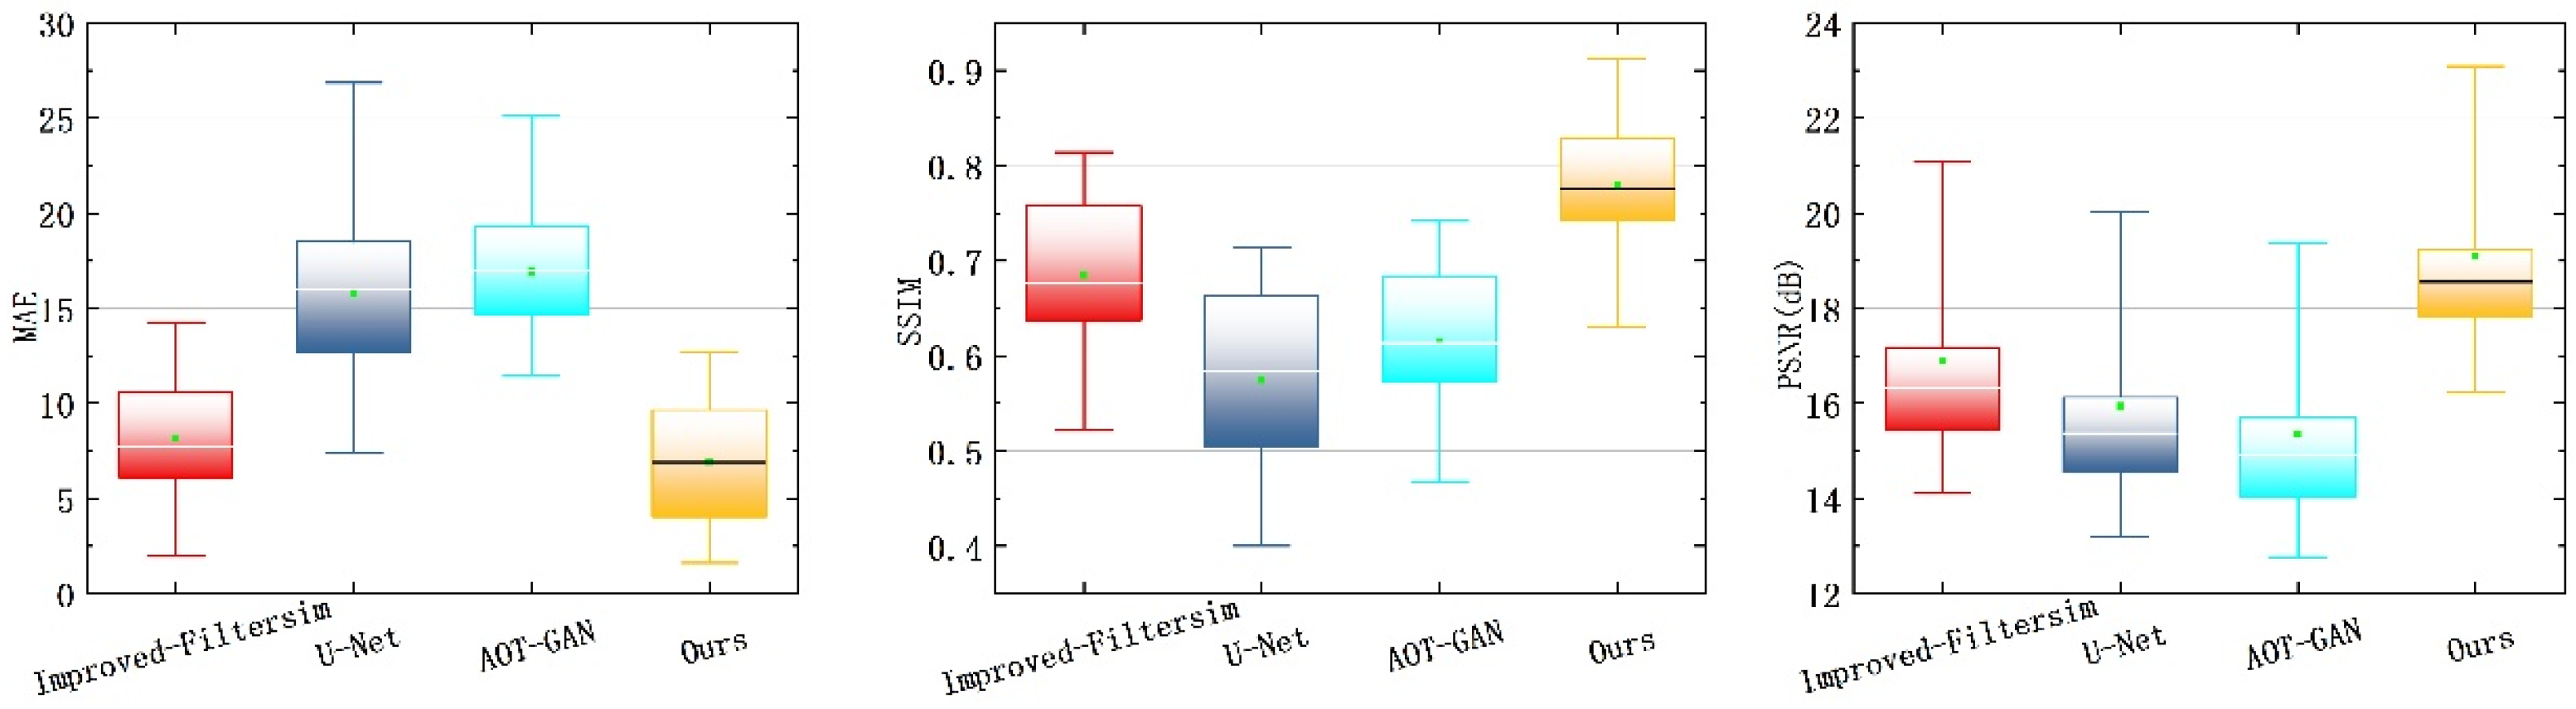
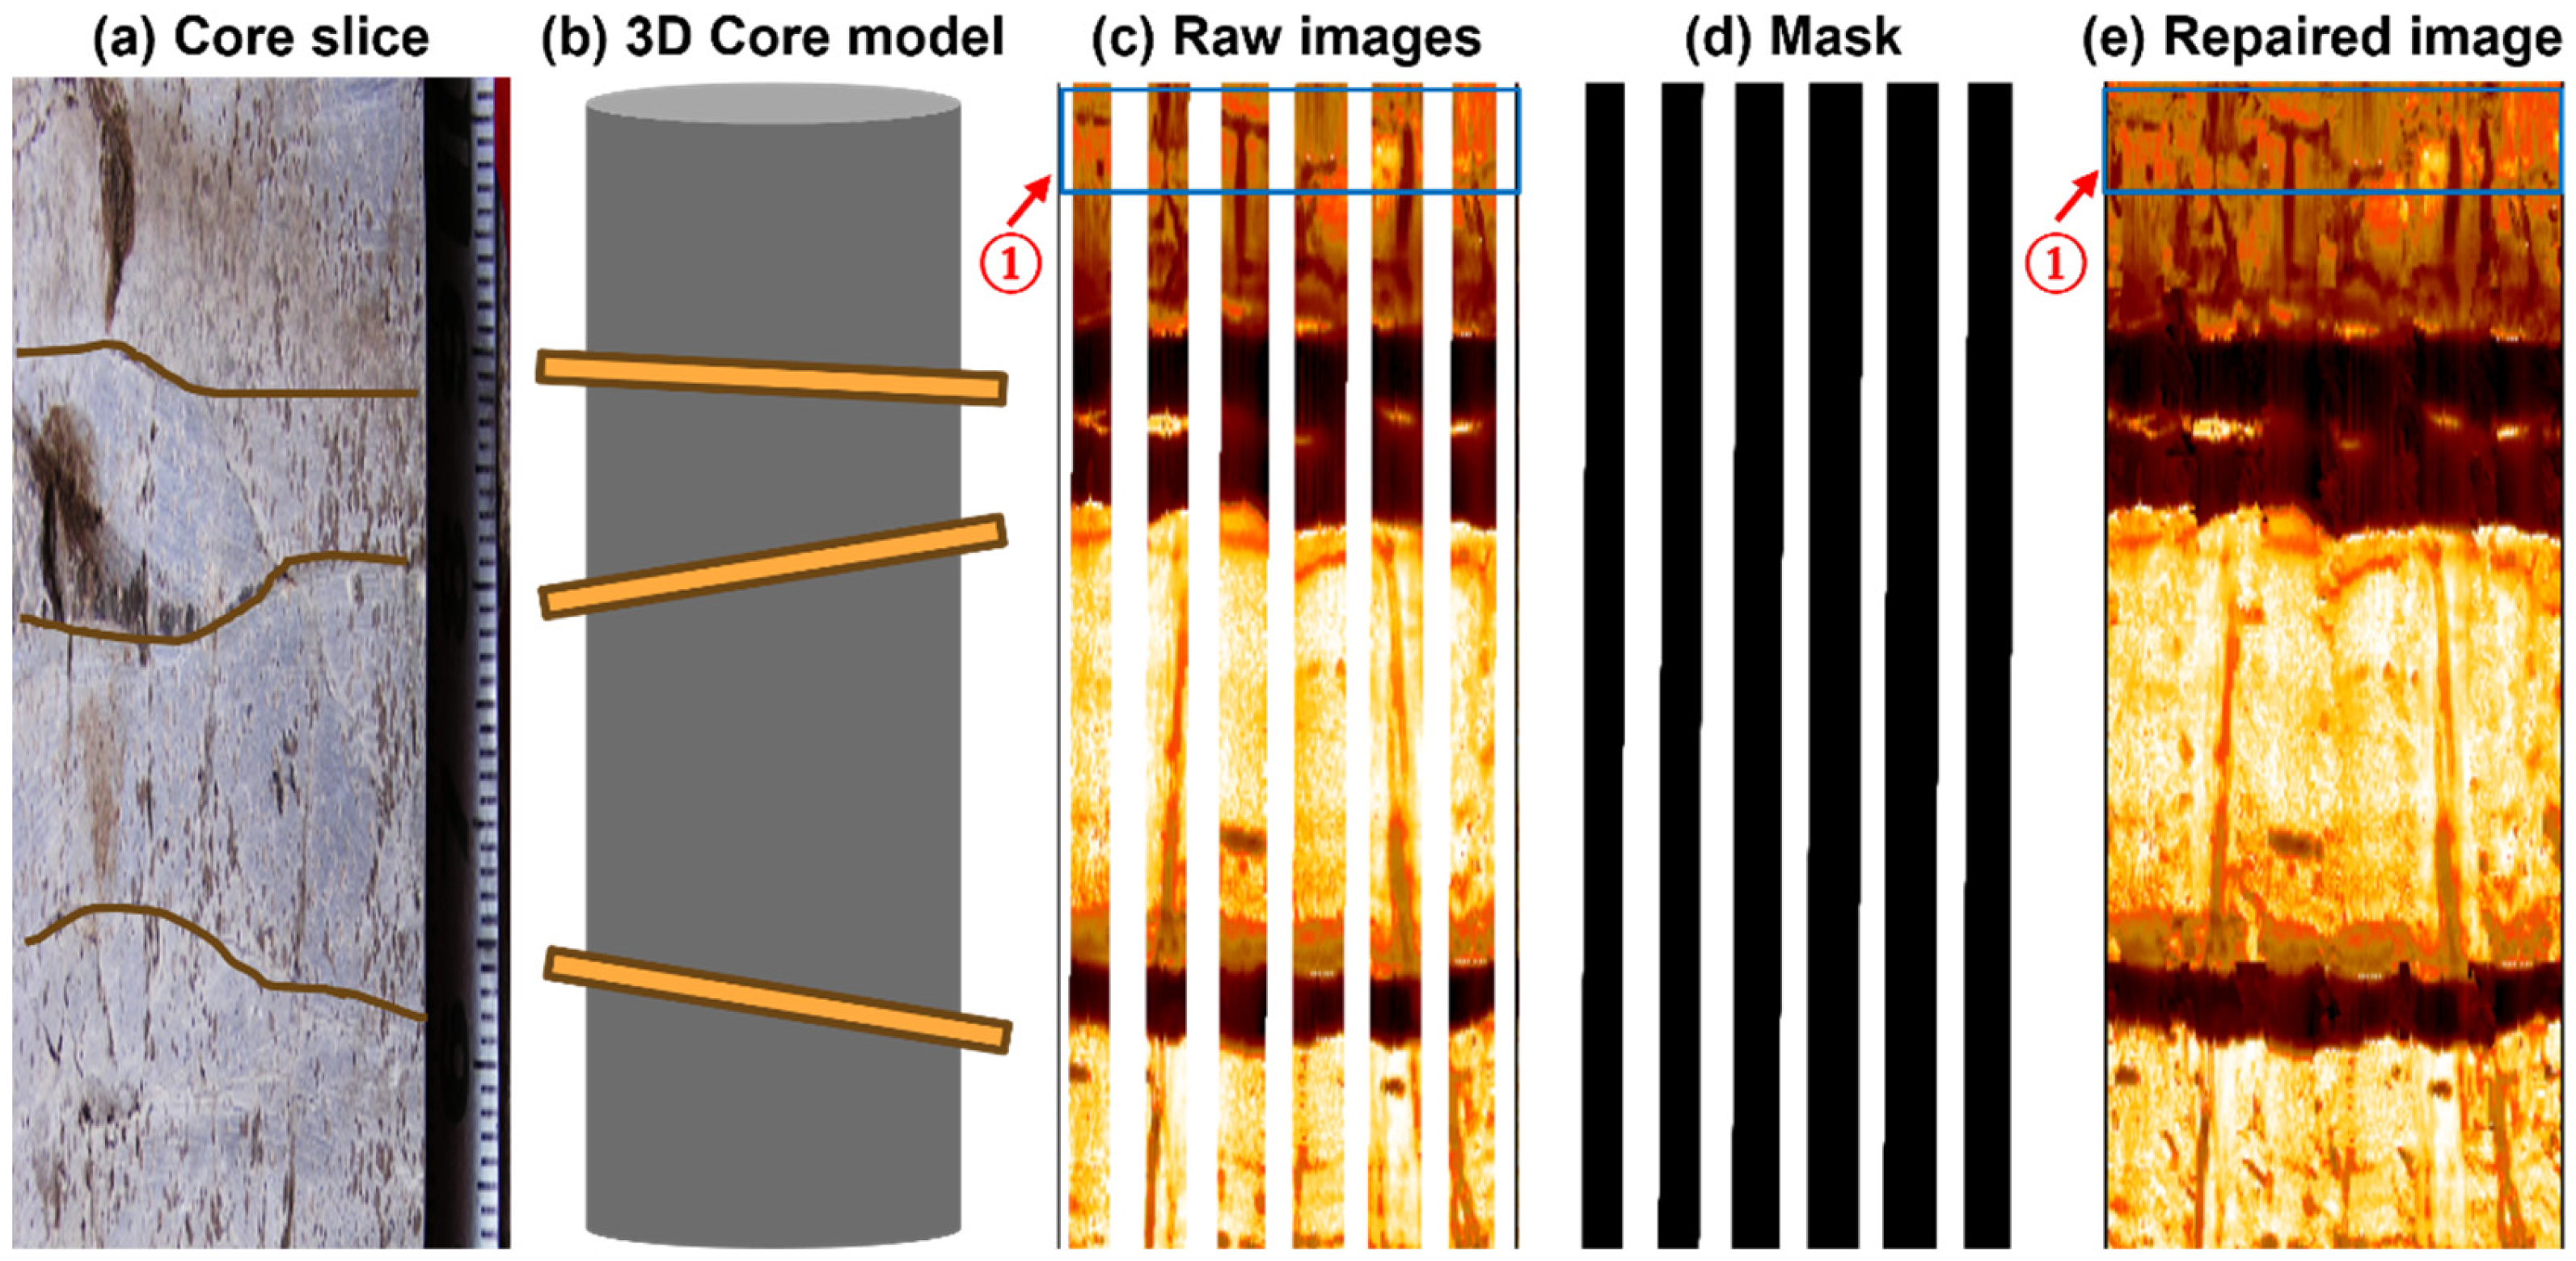
Through these innovations, comprehensive evaluations were conducted, including comparative experiments, ablation studies, and cross-block generalization tests. Quantitative analysis demonstrates that the proposed method achieves MAE = 6.893, SSIM = 0.779, and PSNR = 19.087, significantly outperforming existing mainstream models. Ablation studies systematically reveal the synergistic effects between modules, confirming the effectiveness of the dual-stream complementary architecture and multi-band optimization design. Cross-block generalization tests further validate the model’s strong robustness. Additionally, fracture consistency verification based on core slice comparisons confirms that the inpainted results do not interfere with geological interpretation and effectively eliminate false fracture indicators, providing more reliable data support for downstream reservoir modeling tasks. In future work, the research team intends to extend this framework to 3D electrical imaging data restoration, integrate geological parameters such as fracture aperture and occurrence, and achieve intelligent spatially continuous reconstruction of fracture systems in complex reservoirs. Meanwhile, we also plan to introduce a multi-modal fusion approach by integrating complementary logging data and combining it with our model to promote joint feature learning.


 ,
, 

