Once the installation of PV panels for the fire detection system network had been verified from a technical point of view, an analysis was carried out taking into account economic, legal and sustainable aspects. The results are presented in the following sections.
3.1. Economic Analysis
This section analyzes both the investment required and the consumption in tons of marine diesel oil (MDO) for several alternatives to power the fire detection system for one year. It has been taken into account that the ship is out of port for 200 days per year while, the rest of the time, it is in port and powered by the harbor network on the shore (this part is outside the scope of this work). Three alternatives were evaluated:
- -
Alternative 1, based on a diesel-powered system (baseline);
- -
Alternative 2, based on a solar-only system;
- -
Alternative 3, based on a hybrid solar and emergency backup system.
More details of these alternatives are described below.
Alternative 1
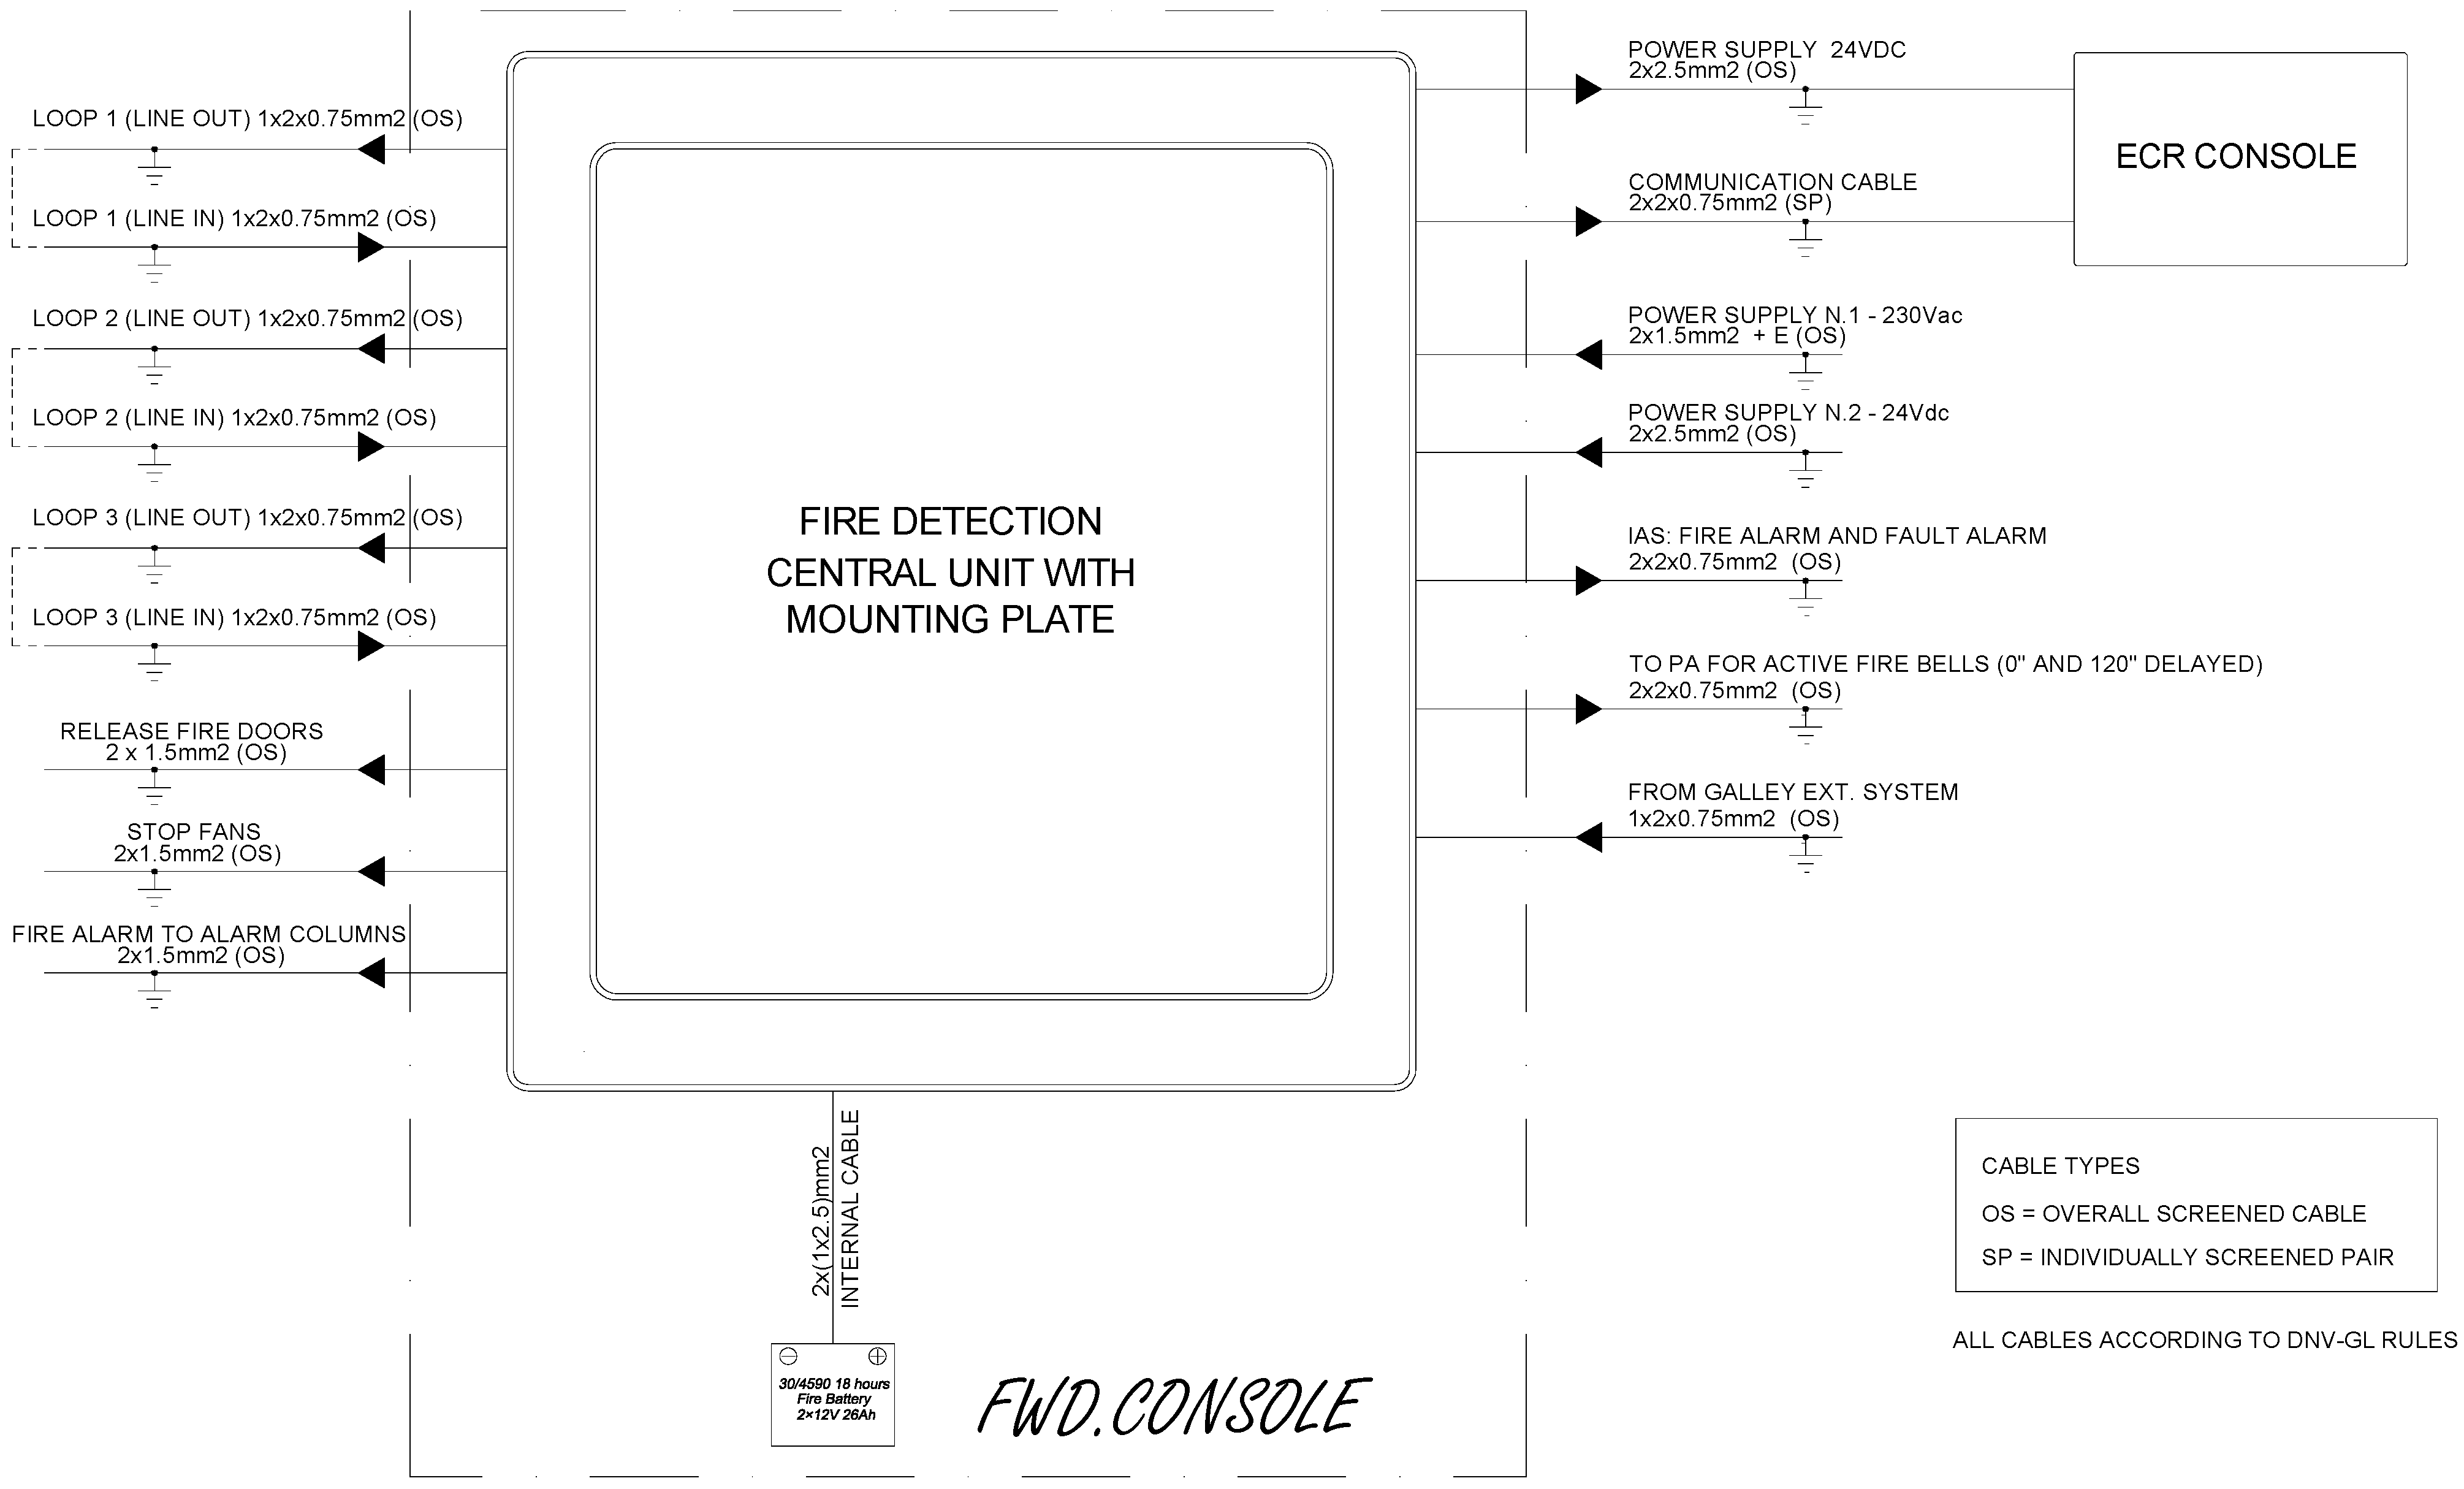
The detection system is powered only by the ship’s 230 Vac emergency mains (via interconnection to the 230 Vac main switchboard), where an AC/DC converter is installed to supply the fire detection system with 24 Vdc in addition to the emergency mains. Under these conditions, the planned investment is shown in
Table 4. The unit costs shown in this table were obtained from the manufacturers’ websites and directly from the manufacturers themselves.
In addition to this initial investment, the consumption of MDO that must be consumed in the generator set to power the system must be taken into account. An average consumption of the generators of 180 g/kWh is considered, which corresponds to 180 g/kWh × 0.72 kWh/day × 200 days = 25.92 kg of fuel per year. Taking into account the current price of MDO, which is around 761 USD/t (700 EUR/t), this is equivalent to 18.14 EUR/year, which would amount to EUR 453.6 considering a service life of 25 years.
Alternative 2
The normal power supply relies solely on solar panels installed on the decks with sufficient capacity to keep both the fire detection battery charged and the operating system running when the sun is shining. The remainder of the power generated by the panels is used for charged a battery system 2 × 100 Ah—2 × 12 Vdc, in order to supply power to the system at night (10 h of sun per day). The investment is shown in
Table 5.
Although this solution is technically feasible, it is forbidden by SOLAS. Also, its implementation would mean that, during long periods where there the sun is not shining, the system would go into emergency mode and would be powered by its own batteries, which would quickly reduce the life of the batteries and the system would not be prepared for a real emergency on the ship. It would be necessary to have power supplied from the emergency network for at least eight hours a day, as is shown in alternative 3.
Alternative 3
A solar panel of sufficient capacity to keep the system operational and the fire detection batteries charged is proposed, with solar batteries to maintain the rest of the generated power supply and to supply the fire detection system with power at night, and an auxiliary power supply so that, in the event of insufficient voltage being generated by the solar panels or their solar batteries, it could switch to the ship’s emergency 230 Vac network, thus keeping the system always operational from the ship’s networks and also keeping the battery always charged. This solution would be a combination of the above situations together with an automatic switching system so that the power supply to the solar panels would be prioritized. The investment is shown in
Table 6.
In addition to this investment, fuel consumption does not need to be taken into account, as the supply of the fire detection system from the onboard emergency network would be an exceptional situation.
In order to quantify the savings achieved by alternative 3 compared to alternative 1, the following economic parameters were estimated: NPV (net present value), IRR (internal rate of return) and DPBP (discounted pay-back period)—Equations (1)–(3), respectively [
35].
The NPV is the present value of the cash flow at the required rate of return of the economic savings generated by the consumption of MDO compared to the investment of alternative 3
where t is the required return or discount rate,
i the number of time periods and the cash flow considered was the revenue between the yearly cost of the MDO consumption of alternative 1 (18.15 EUR/year).
The IRR is calculated by solving the previous NPV expression for the discount rate required to make the NPV equal to zero.
The DPBP refers to the amount of time it takes to break even from undertaking the initial expenditure.
A service life of 25 years [
36,
37,
38,
39], 3% of the inversion for maintenance [
40,
41] and a discount rate of 12% were considered. The initial investment is the subtraction of the total cost shown in
Table 6 minus the total cost shown in
Table 4, i.e, 2219.26 – 432.43 = EUR 1743.83. The annual saving is EUR 18.15. Using these data, the NPV results EUR –1746.32. Given that this value is negative, the installation of the solar panel is not economically viable. IRR: Considering the previous values, the IIR is −14.58%. As this value is negative, the sum of the post-investment cash flow is less than the initial investment.
These results show that, from an economic point of view, the installation of solar panels is not worthwhile for supplying energy to small consumers, as the installation costs are too high compared to those of supplying energy using a diesel generator. While the technical feasibility of powering a ship’s fire detection system using a single 550 Wp solar panel was clearly demonstrated, the economic justification remains weak. The system’s low energy demand—approximately 0.72 kWh/day—means that the cost savings in fuel consumption are minimal when compared to the high upfront investment in solar infrastructure, including batteries, converters and installation. This highlights a critical insight: for low-consumption systems, the fixed costs of renewable integration are disproportionately high relative to the marginal savings. Consequently, the economic viability of solar energy on ships improves only when scaled to serve larger loads or when integrated into broader hybrid systems that can amortize costs across multiple consumers.
In view of the previous negative result, the main conclusion is that it is advisable to install as many panels as possible. Taking into account the different layouts of merchant vessels, it would normally be possible to install around 20 solar panels (550 Wp per panel) on a typical bridge deck covering an area of around 45 m
2 (panels inclined at 30°), which is possible on most merchant vessels. The total power generated by the 20 solar panels should be approximately 10 kW. An inverter (DC/AC 3-phase) would be required to supply this solar energy to any consumer whose power consumption is less than 10 kW. The investment corresponding to this proposal is shown in
Table 7. As can be seen, the total investment amounts to EUR 12,308.85.
Table 8 shows the breakdown of investments by year. This table assumes a life of 25 years and a discount rate of 12%. The maintenance costs shown in this table correspond to the assumed value of 3% of the inversion, which is 369.26 EUR/year. In order to calculate the savings in MDO consumption, it was assumed that the solar panels operate for 8 h/day, providing a load of about 10 kW, for 200 days/year, which (considering the engine consumption of 180 g/kWh) corresponds to a saving of 2.88 t/year of MDO, which in economic terms corresponds to 2016 EUR/year (considering an MDO price of 700 EUR/kg). As can be seen from the table, the NPV is EUR 606.7. This value indicates that the investment is profitable, but there are no major savings. The result for the IRR is 12.7%, which indicates that it is positive, but it is too similar to the initial rate of return, so it is not a very profitable project in economic terms. The result for the DPBP is 21 years.
The assumed value of 12% for the discount rate corresponds to the sum of the risk-free rate (such as the yield on Treasury bills) and the risk premium, representing the minimum return desired by the investor. Hernández-Moro et al. [
42] discuss the wider economic implications of using discount rates for renewable technologies compared to traditional power plants. They mention that PV installations carry higher technological risks, which can justify applying higher discount rates. Although the assumption of a 12% discount rate for a PV inversion is reasonable, this value is obviously not universally accepted [
43,
44]. According to this, and taking into account that the discount rate is a critical parameter in economic calculations, a sensitivity analysis of this parameter was performed.
Figure 2 shows the NPV as a function of the discount rate for values between 8 and 14%. As expected, the NPV decreases as the discount rate increases. In this particular case, it becomes 0 for discount rates from 12.71%, a value above which the investment is not economically viable.
In view of the results obtained, it can be stated that, from an economic point of view, the installation of solar panels on merchant ships is not profitable given the small number of panels that can be installed due to the limited surface area. It is worth noting that although approximately 20 solar panels (550 Wp each) could be installed on the deck of a typical merchant vessel—covering approximately 45 m2 at a 30° tilt—this theoretical capacity does not take into account real operational constraints. In practice, shading from structural elements, equipment and safety routes significantly reduces the usable area and therefore the actual energy yield. Another important problem is that the electricity generated by solar panels is difficult to connect in parallel and synchronize with the auxiliary generators on board, given that the variation of their frequency goes, typically, at ±10% of the nominal value and is not stable. Also, the difference in the power supplies generated on both networks means that this coupling would be unbalanced.
3.2. Sustainability Analysis
The feasibility analysis carried out above considers technical, legal and economic factors to determine whether the proposal can be implemented. In contrast, a sustainability analysis considers whether a project can maintain its benefits over time without depleting resources or harming the environment [
45,
46].
A sustainability analysis includes environmental, social and economic factors [
47]. Various methods for calculating what is known as the sustainability index (SI) can be found in the literature. One of the most commonly used methods is simple additive weighting (SAW), according to which the SI can be calculated using Equation (4) [
48], where i is the alternative analyzed, c the criteria, w the weight assigned to each criterion j and n the number of criteria. The SI ranges between 0 (corresponding to the worst sustainability) and 1 (corresponding to the optimal sustainability).
Three criteria are considered in the present analysis: economic, social and environmental. As far as the alternatives are concerned, since alternative 2 does not meet the SOLAS legal requirements, only alternatives 1 and 3 are compared. The numerical data are shown in
Table 9. With regard to the economic criteria, the costs of alternative 1 and alternative 3 are considered. The cost of alternative 3 refers to the investment cost (EUR 1426.83), while the cost of alternative 1 refers to the investment cost plus the MDO consumption cost (EUR 432.43 + 463.6 = 896.03). These are measurable values obtained in the previous section. On the other hand, the environmental and social criteria were treated as discrete values, so that alternative 1 was given a value of 0 and alternative 3 a value of 1, given that the latter is more ecological and also more socially appropriate (in terms of community benefits, social equity, cultural impact and so on).
Once the data for the sustainability analysis are collected, the next step is to normalize them. The normalization process in a sustainability analysis is essential to ensure fair comparisons. In this case, the economic criterion is provided through continuous values in EUR while the other criteria are provided through discontinuous values as 0 (bad) and 1 (good). Normalization adjusts values to a common scale for consistency and comparability in the analysis. The linear max normalization was used, which follows the following Equations (5) and (6) [
47] for beneficial and non-beneficial criteria, respectively. In these equations, X is the value and X
j,max the maximum value corresponding to that criterion. In this case, the economic criterion is a non-beneficial criterion since it is desirable that the cost is as low as possible, while environmental and social criteria are beneficial since an environmental and social solution is desirable.
The normalized data are shown in
Table 10. This table includes the normalized values calculated using Equations (5) and (6), as well as the SI calculated using Equation (4). In order to calculate the SI, a weight must be given to each alternative. In a sustainability analysis, weights represent the relative importance assigned to different environmental, social and economic criteria to prioritize key factors in decision-making. For example,
Table 10 shows the results of the SI corresponding to 50% economic weight (0.5 on a per-unit basis), 25% environmental weight (0.25 on a per-unit basis) and 25% social weight (0.25 on a per-unit basis). These weights correspond to economic factors, given half of the possible importance (50%); the remaining importance has been equally distributed between the other two factors (25% and 25%). Logically, the sum of the assigned weights must be 100, or 1 on a per-unit basis. This weighting distribution reflects a decision-making approach where economic sustainability is considered twice as important as environmental and social aspects, influencing how the project’s overall sustainability performance is assessed. It is worth mentioning that choosing weights in a sustainability analysis depends on several factors such as stakeholder priorities, industry standards, regulatory requirements, project goals and so on. Common methods include expert judgment, stakeholder surveys, historical data analysis and even statistical analyses. For example, a government policy might prioritize environmental factors, while a business-driven project may emphasize profitability. According to this, a sensitivity analysis of the weights was carried out. The results are shown in
Figure 3, which shows the SI for alternative 1 and for alternative 3, with the weight of the economic criterion ranging from 0 (lowest possible) to 100 (highest possible). As can be seen, the solution of installing solar panels is recommendable from a sustainability point of view, unless the economic issue is of high relevance in the decision-making process.


