Article

Microbial and Functional Gene Dynamics in Long-Term Fermented Mariculture Sediment

1
College of Light Industry and Food Engineering, Guangxi University, Nanning 530004, China
2
Institute of Green and Low Carbon Technology, Guangxi Institute of Industrial Technology, Nanning 530004, China
3
Weihai Ocean Development Research Institute, Weihai 264200, China
*
Authors to whom correspondence should be addressed.
These authors contributed equally to this work.
J. Mar. Sci. Eng. 2025, 13(5), 975; https://doi.org/10.3390/jmse13050975 (registering DOI)
Submission received: 14 April 2025 / Revised: 5 May 2025 / Accepted: 12 May 2025 / Published: 18 May 2025
(This article belongs to the Section Marine Aquaculture)

Abstract

:
The microorganisms of mariculture sediments are key to regulating and maintaining their ecosystem balance and have garnered research interest. Although the microbial composition and functional potential of mariculture sediments have been extensively explored in the past, the effects of long-term aquaculture on microbial communities and functional genes have been scarcely studied. Sediment samples from mariculture ponds with durations of 1 year, 6 years, and 10 years were collected in this study. A high-throughput metagenomic analysis was then conducted. The results showed that the sediments fermented for 1 year had the highest α-diversity, creating conditions for the divergence of functional microbial communities. Due to nutrient competition, long-term fermentation led to a decrease in both diversity and functional redundancy. Key functional groups exhibited different temporal succession patterns. In addition, long-term fermentation, especially fermentation over 10 years, resulted in significant differentiation of functional genes, particularly those related to carbon and nitrogen metabolism. This study reveals the distribution pattern of the microbiome during the natural fermentation process and its temporal coupling relationship with the functions of the pond ecosystem. It clarifies the dynamic evolution of functional genes, providing a theoretical basis for the sustainable management of mariculture.

1. Introduction

Marine aquaculture, serving as a crucial pillar for global protein supply, alleviates food security issues [1,2]. However, its large-scale expansion has imposed significant environmental pressures [3,4]. Research indicates that in some highly intensive mariculture regions, the organic matter content in significant sediment accumulation and high-salt and high-sulfur heterogeneous sedimentary environments accelerate the dynamic succession of the sediment microbial community, posing potential threats to the marine ecosystem [5,6,7]. The sediment in aquaculture ponds, as the core carrier of material cycling, has long been enriched with pollutants such as residual feed, excreta, antibiotics, and microplastics, forming a unique natural fermentation ecosystem [8,9,10,11]. In this system, the microbial community drives the degradation of organic matter through a complex metabolic network and records the historical load of environmental pollution [12,13]. Previous studies have shown that specific microbiota is associated with certain contaminants [14,15,16,17]. For example, Zhang et al. (2016) showed that Bacillus and Pseudomonas can effectively decompose organic matter, reduce the chemical oxygen demand of the substrate, and maintain the relative stability of dissolved oxygen in the water [18]. In addition, the drug residues in the breeding process will also have an impact. For example, antibiotic-resistant genes are transferred among different microorganisms, resulting in changes in the genetic diversity of the microbial community. The presence of virulence factors may also provide a growth advantage for certain microorganisms with corresponding resistance or adaptability, thus changing the composition and function of the microbial community. These microorganisms not only decompose organic matter but also retain the imprints of historical environmental pollution in the form of community structure and functional genes, reflecting the long-term impact of pollutants on the ecosystem [19].
Although existing research has focused on the ecological role of sediment microorganisms, most of them are limited to static analyses of short-term sediments, relying on discrete-time-point sampling strategies [20,21,22,23]. For instance, Wei et al. conducted gene sequencing on pond sediments within 60 days and found that ammonia-oxidizing archaea and bacteria are involved in the nitrogen cycle in sediments and play different ecological roles [24]. However, this approach makes it difficult to reveal the dynamic response patterns of microbial communities during long-term natural fermentation. Such limitations have led to significant gaps in our understanding of the mechanisms of microbial adaptive evolution [25], metabolic network reconstruction [26], and their co-evolution with abiotic factors (such as pollutant accumulation and redox conditions) [27]. Most existing studies identify microbial species based on traditional sequencing methods, overlooking the functional interactions between different species, which are particularly prominent on a time scale [28,29,30]. Therefore, there is an urgent need for long-term time-series studies to integrate the characteristics of microbial communities and systematically analyze the evolution of sediment ecosystems during natural fermentation, providing a theoretical basis for environmental management.
This study, for the first time, focuses on seawater aquaculture sediments with different fermentation ages. Through metagenomic analysis, it aims to uncover the structural succession patterns of microbial communities and the expression characteristics of functional genes during long-term natural fermentation. It particularly emphasizes clarifying the adaptive evolution strategies of microbial communities and the mechanisms of metabolic network reconstruction. The research results can provide precise regulation targets for the sustainable governance of aquaculture environments and promote the optimization of eco-friendly seawater aquaculture models.

2. Materials and Methods

2.1. Sample Collection

Three long-term sea cucumber culture areas in Shandong Province, which has the highest output of mariculture products in China, were selected as sampling sites (Figure 1a). (The high-density breeding scale and mature breeding techniques in Shandong have led to the accumulation of abundant organic matter in the bottom sediment, creating a typical high-salt and high-sulfur sedimentary environment, which provides ideal experimental conditions for research). A total of 9 sediment samples were collected from sea cucumber culture ponds with usage durations of 1 year (Figure 1b), 6 years (Figure 1c), and 10 years (Figure 1d) (numbered S1_1, S1_2, S1_3, S6_1, S6_2, S6_3, S10_1, and S10_2, S10_3, respectively). A steel grab-type mud sampler was used to collect about 2 kg of sediment from the bottom 30 cm of the pond. The samples were immediately stored in dry ice to maintain microbial activity and prevent DNA degradation and then transported to the laboratory for storage at −20 °C for subsequent DNA extraction and metagenomic sequencing analysis.

2.2. DNA Extraction from Sediment Samples

Microbial DNA was extracted from sediment samples (0.5 g) using the FastDNA™ SPIN Kit for Soil (MP Biomedicals, USA). Samples were homogenized in lysis buffer (Buffer SL1 and MT Buffer) with zirconium silicate beads (0.5 mm) using a FastPrep®-24 homogenizer from MP Biomedicals, USA (6.0 m/s, 2 × 40 s, with 1-min ice-cooling intervals). After centrifugation (14,000× g, 5 min, 4 °C), proteins were precipitated with protein precipitant buffer, and the supernatant was processed through a HiBind® DNA column from Omega Bio-Tek, USA. Contaminants were removed using desalting (WS1) and wash (WS2) buffers, followed by ethanol elimination (14,000× g, 2 min). DNA was eluted with pre-heated elution buffers (65 °C) and quantified via Nanodrop (A260/A280) from Thermo Fisher Scientific, Waltham, WA, USA. Integrity was confirmed by agarose gel electrophoresis prior to metagenomic sequencing.

2.3. High-Throughput Sequencing

Before high-throughput sequencing, the purity and concentration of the extracted DNA samples were measured using the QuantiFluor dsDNA kit (Promega, Madison, WI, USA) in a 96-well microplate reader (SpectraMax M5, San Jose, CA, USA). The DNA was diluted to a concentration of 50 ng/μL to optimize the sequencing effect. In the library construction process, the DNA was fragmented to an average size of about 300 base pairs (bp) using Covaris M220 (Woburn, MA, USA), and a paired-end library was prepared using NEXTFLEX Rapid DNA-seq (BioScientific, Austin, TX, USA). Sequencing was performed on the Illumina NovaSeq platform (Illumina Inc., San Diego, CA, USA), and the sequencing protocol was provided by Shanghai Majorbio Biopharmaceutical Technology Co., Ltd. (Shanghai, China).
Raw sequencing data (FASTQ format) underwent quality control using FASTP, where low-quality reads (average Phred score < 20), short fragments (<50 bp), and ambiguous sequences (containing N bases) were removed. High-quality reads were assembled into contigs using MEGAHIT, followed by open reading frame (ORF) prediction via MetaGene (length cutoff: ≥100 bp). Translated amino acid sequences were clustered using CD-HIT (90% identity threshold) to generate a non-redundant gene catalog. Quality-filtered reads were mapped to representative sequences using SOAPaligner (version soap2.21release) (95% identity), and functional annotation was performed against the NCBI NR database via DIAMOND (E-value ≤ 1 × 10⁻⁵). All sequencing data were submitted to NCBI with the accession number PRJNA797856.

2.4. Calculation of Community Niche Characteristics

In this study, a quantitative analysis method for niche attributes developed in previous research was employed [31]. The calculations of the niche breadth index (Levins’ standardized niche breadth index) and the niche overlap coefficient were performed using the “spa”, “vegan”, “EcolUtils”, “mecodev”, and “microeco” packages in R 4.3.2 software. The formulas used to quantify the niche attributes are as follows:
Niche Breadth:
B S = 1 Σ p i , s 2 1 n 1
In this formula, s represents an individual species (operational taxonomic unit); Pi,s indicates the proportion of individuals of the species in niche i; and n represents the number of available niches. The result of this formula reflects the niche breadth of a single species. In this study, the community niche breadth refers to the sum of Bs for all species.
Niche Overlap Coefficient:
O i j = k = 1 r P i k P j k / k = 1 r P i k 2 k = 1 r P j k 2
In this formula, Oi,j represents the niche overlap coefficient between species i and j; Pi,k and Pj,k, respectively, represent the relative abundances of species i and j in sample k; and r is the number of samples.

2.5. Functional Gene Annotation

Diamond (versions 2.0.13), https://github.com/bbuchfink/diamond (accessed on 24 March 2024) was used to annotate the functions of the amino acid sequences of the non-redundant gene set. The sequences were matched with the eggNOG database through BLASTP alignment (e-value ≤ 1 × 10⁻⁵) to obtain COG functional classification, and the abundance of each COG category was calculated based on the matching results. The KEGG database was aligned to obtain KO (KEGG Orthology), metabolic pathway (Pathway), enzyme-encoding (EC), and functional module (Module) classification information (BLASTP alignment parameters: expected value e-value = 1 × 10⁻⁵), and the relative abundance of each functional level was normalized by the sum of gene abundances.

2.6. Data Statistical Analysis

Data analysis was performed using SPSS (version 23.0) software for one-way analysis of variance (ANOVA) and Student’s t-test to evaluate the significance of differences between groups. For volcano plots, linear regression analysis, and principal coordinate analysis (PCoA) based on Bray-Curti’s distance, the “vegan” and “ggplot2” packages in R (versions 4.1.1) software were used, and the statistical significance of differences between groups was evaluated by the Adonis test. Linear discriminant analysis (LDA) was performed using LEfSe based on taxonomic information and taxa under different conditions to identify significantly different taxa between samples. Heatmaps, Pearson correlation tests, and Mantel tests were completed using packages such as “corrplot”, “vegan”, “ggcor”, “Rmisc”, “ggcorrplot”, “RColorBrewer”, “grDevices”, “dplyr”, and “ggplot2” in R language to reveal the correlations between variables. Other graphs were generated using OriginPro (version 2024), and the graph layout was completed using Adobe Illustrator (version 22.1).

3. Results

3.1. Occurrence Characteristics of the Microbiome in Mariculture Sediments with Different Natural Fermentation Durations

A total of 1,026,376,626 raw sequences were extracted from six sediment samples, which were assembled into 11,404,545 contigs, and 1,427,808.5 open reading frames (ORFs) were predicted. After clustering the predicted gene sequences of all samples, 512,188.64 non-redundant genes were screened out. Through database alignment, the microorganisms in the sediments were annotated to 5 domains, 15 kingdoms, 261 phyla, 522 classes, 1045 orders, 2068 families, 6179 genera, and 34,460 species, including unclassified taxa in each taxonomic unit. Among these species’ annotations, 933 species were from the Archaea domain, 30,291 species were from the Bacteria domain, 1429 species were from the Eukaryota domain, and 1773 species were from the Viruses domain.

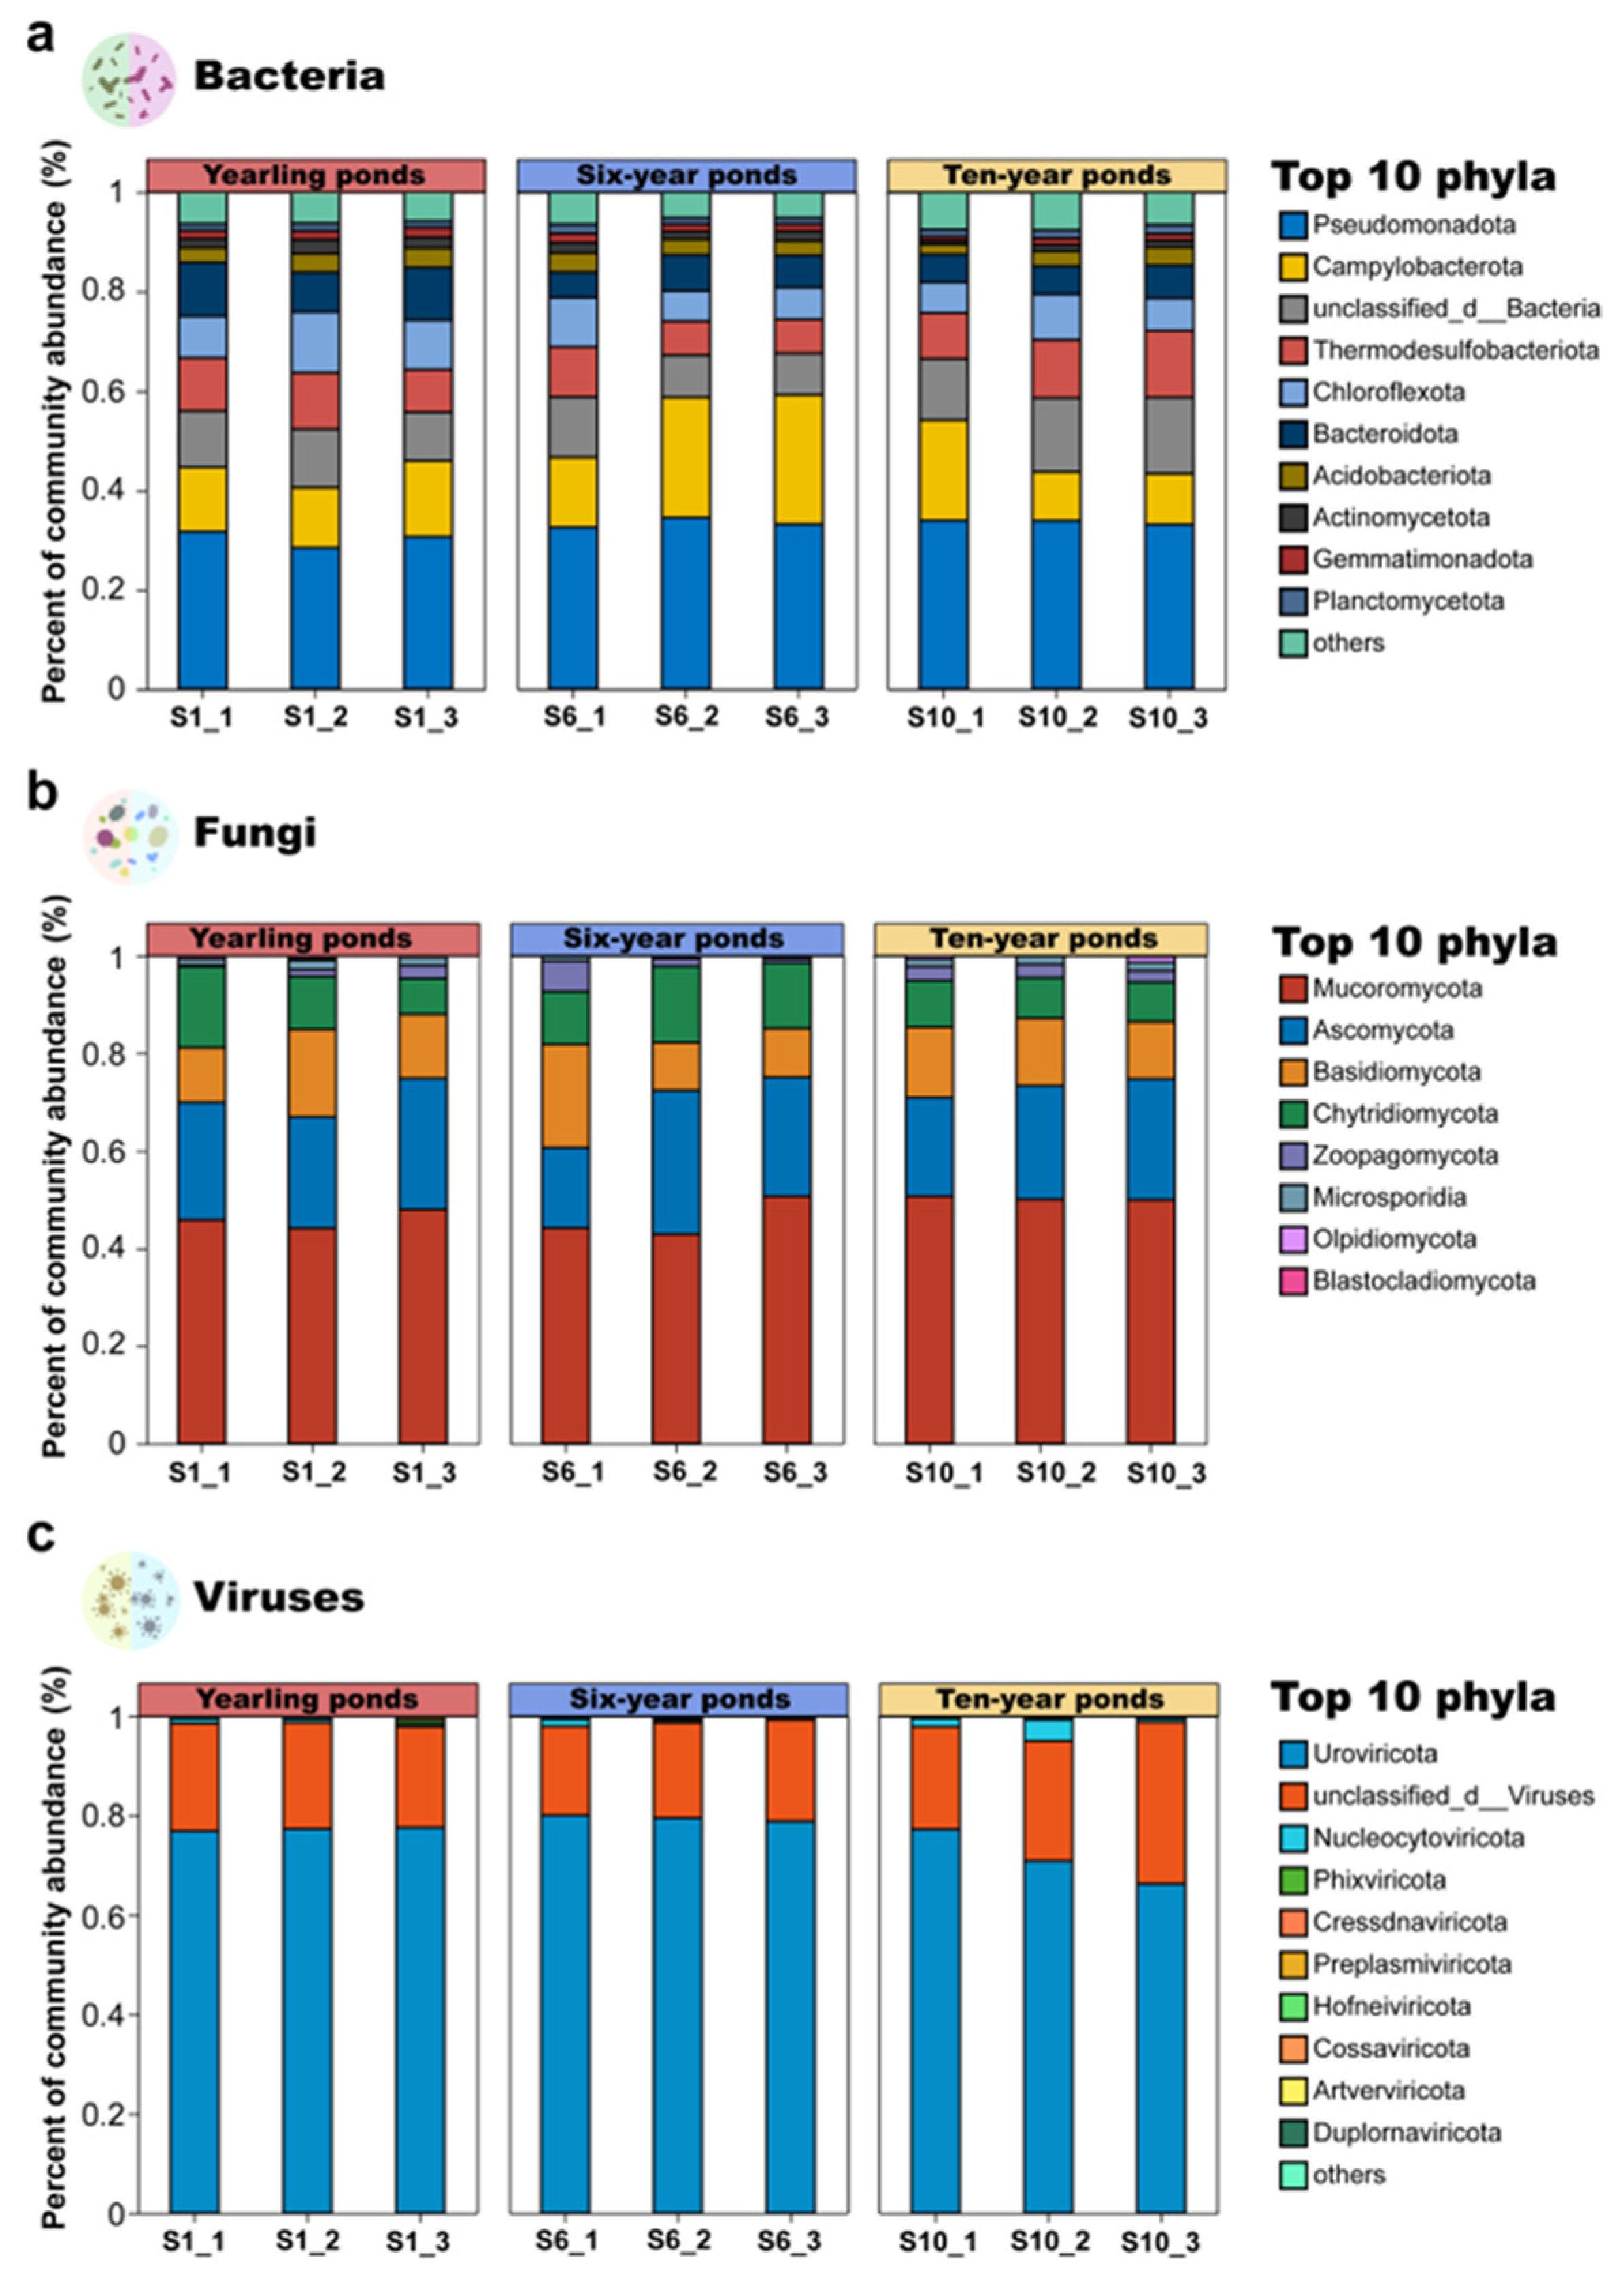
3.1.1. Microbial Community Composition

To comprehensively understand the microbial community composition of mariculture sediments under different usage durations, we investigated the composition of bacteria, fungi, and viruses at the phylum level. Among the detected microbial communities, bacteria mainly originated from Pseudomonadota, Campylobacterota, Thermodesulfobacteriota, Chloroflexota, and Bacteroidota. Excluding a large number of unclassified bacteria, these major bacterial phyla accounted for 85.41% of the total detected bacteria (Figure 2a). Fungi were mainly dominated by Mucoromycota, Ascomycota, Basidiomycota, and Chytridiomycota, accounting for 47.34%, 27.60%, 13.70%, and 11.21% of the total detected fungi species, respectively (Figure 2b). Viruses were basically from Uroviricota, accounting for 97.59% of the classified viruses (Figure 2c).

3.1.2. Microbial Community Diversity

Community diversity is an important indicator reflecting the microbial community structure. Therefore, this study explored the α-diversity and β-diversity of the sediment community. In terms of α-diversity, the 1-year-old mariculture sediment community had the highest richness (Chao index average: 25,854), while the richness of the 10-year-old and 6-year-old sediment communities was relatively lower, with Chao index averages of 24,935.33 and 24,668.33, respectively. Similarly, the Shannon index and Simpson index also showed a similar trend, that is, the 1-year-old sediment community had the highest diversity (Shannon index average: 4.836; Simpson index average: 0.038), followed by the 10-year-old sediment (Shannon index average: 4.813; Simpson index average: 0.041) and the 6-year-old sediment (Shannon index average: 4.590; Simpson index average: 0.050) (Figure 3).
In terms of β-diversity, the PCoA analysis based on the Bray–Curtis algorithm showed a significant clustering phenomenon among mariculture sediments with different natural fermentation durations. The interpretation degrees of the three types of samples in the PC1 dimension reached 45.82%, and those in the PC2 dimension reached 31.11%. Their confidence ellipses did not intersect in the plane formed by the two dimensions. The ANOSIM statistical analysis presented a differential test of this clustering phenomenon, with R = 0.802 and p = 0.001 (Figure 4).

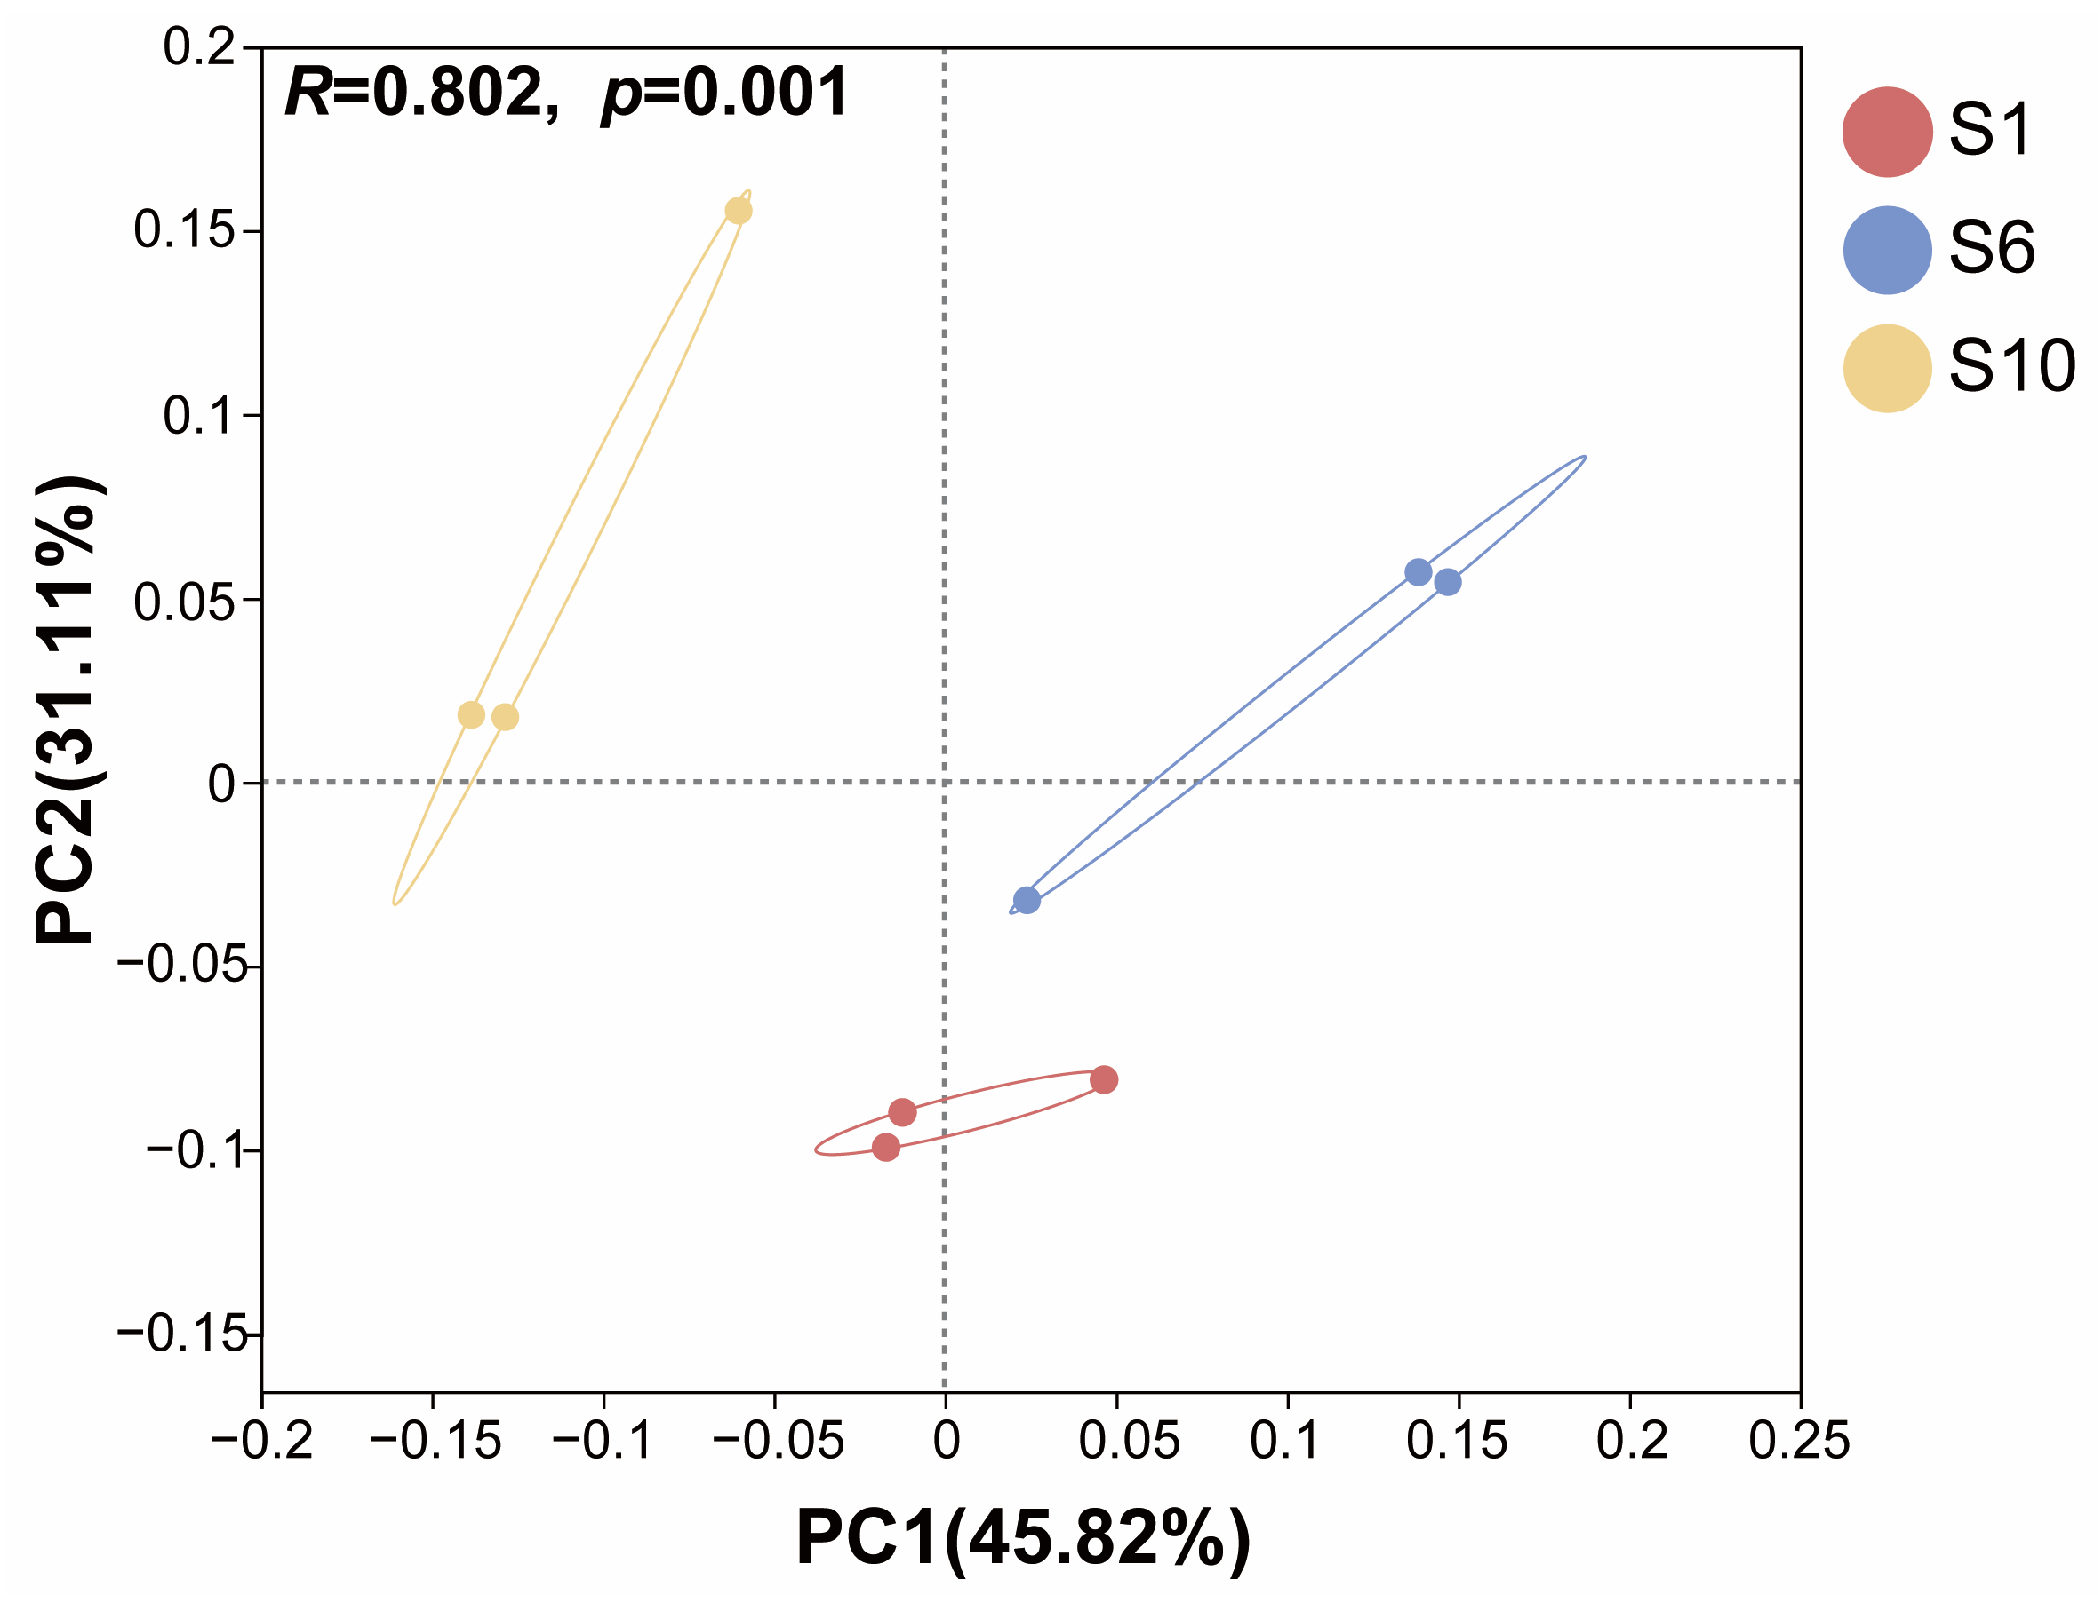
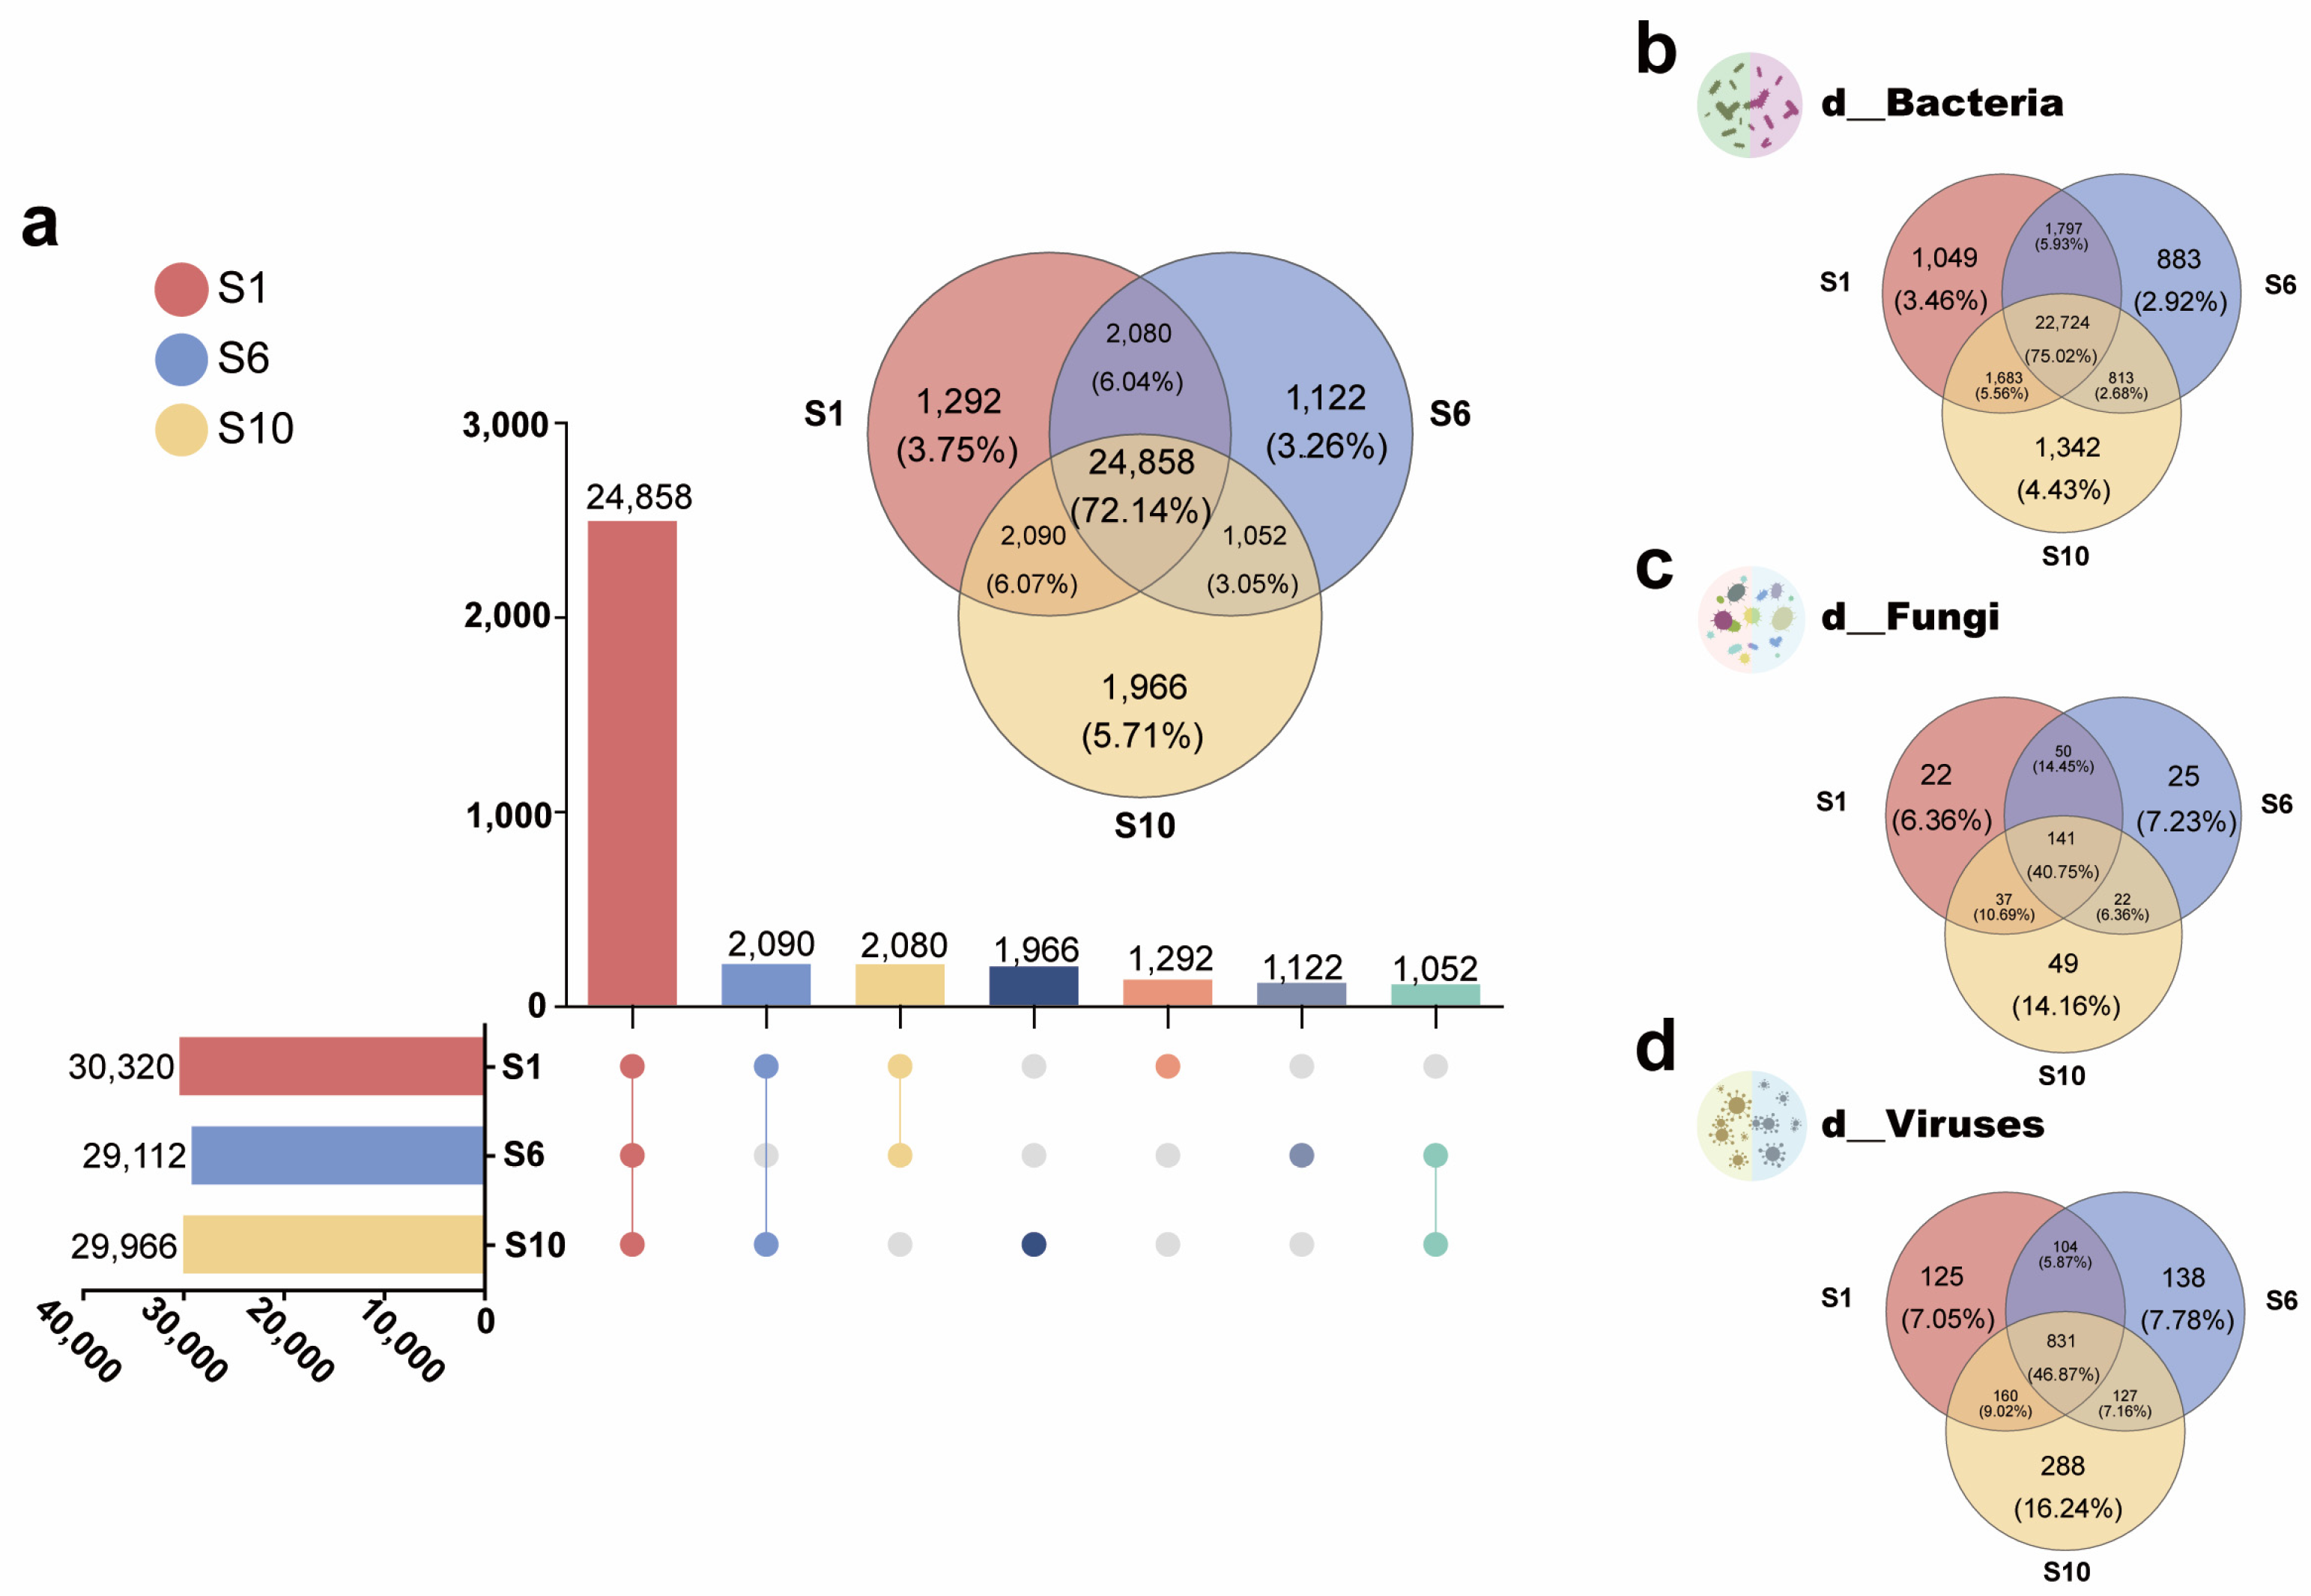
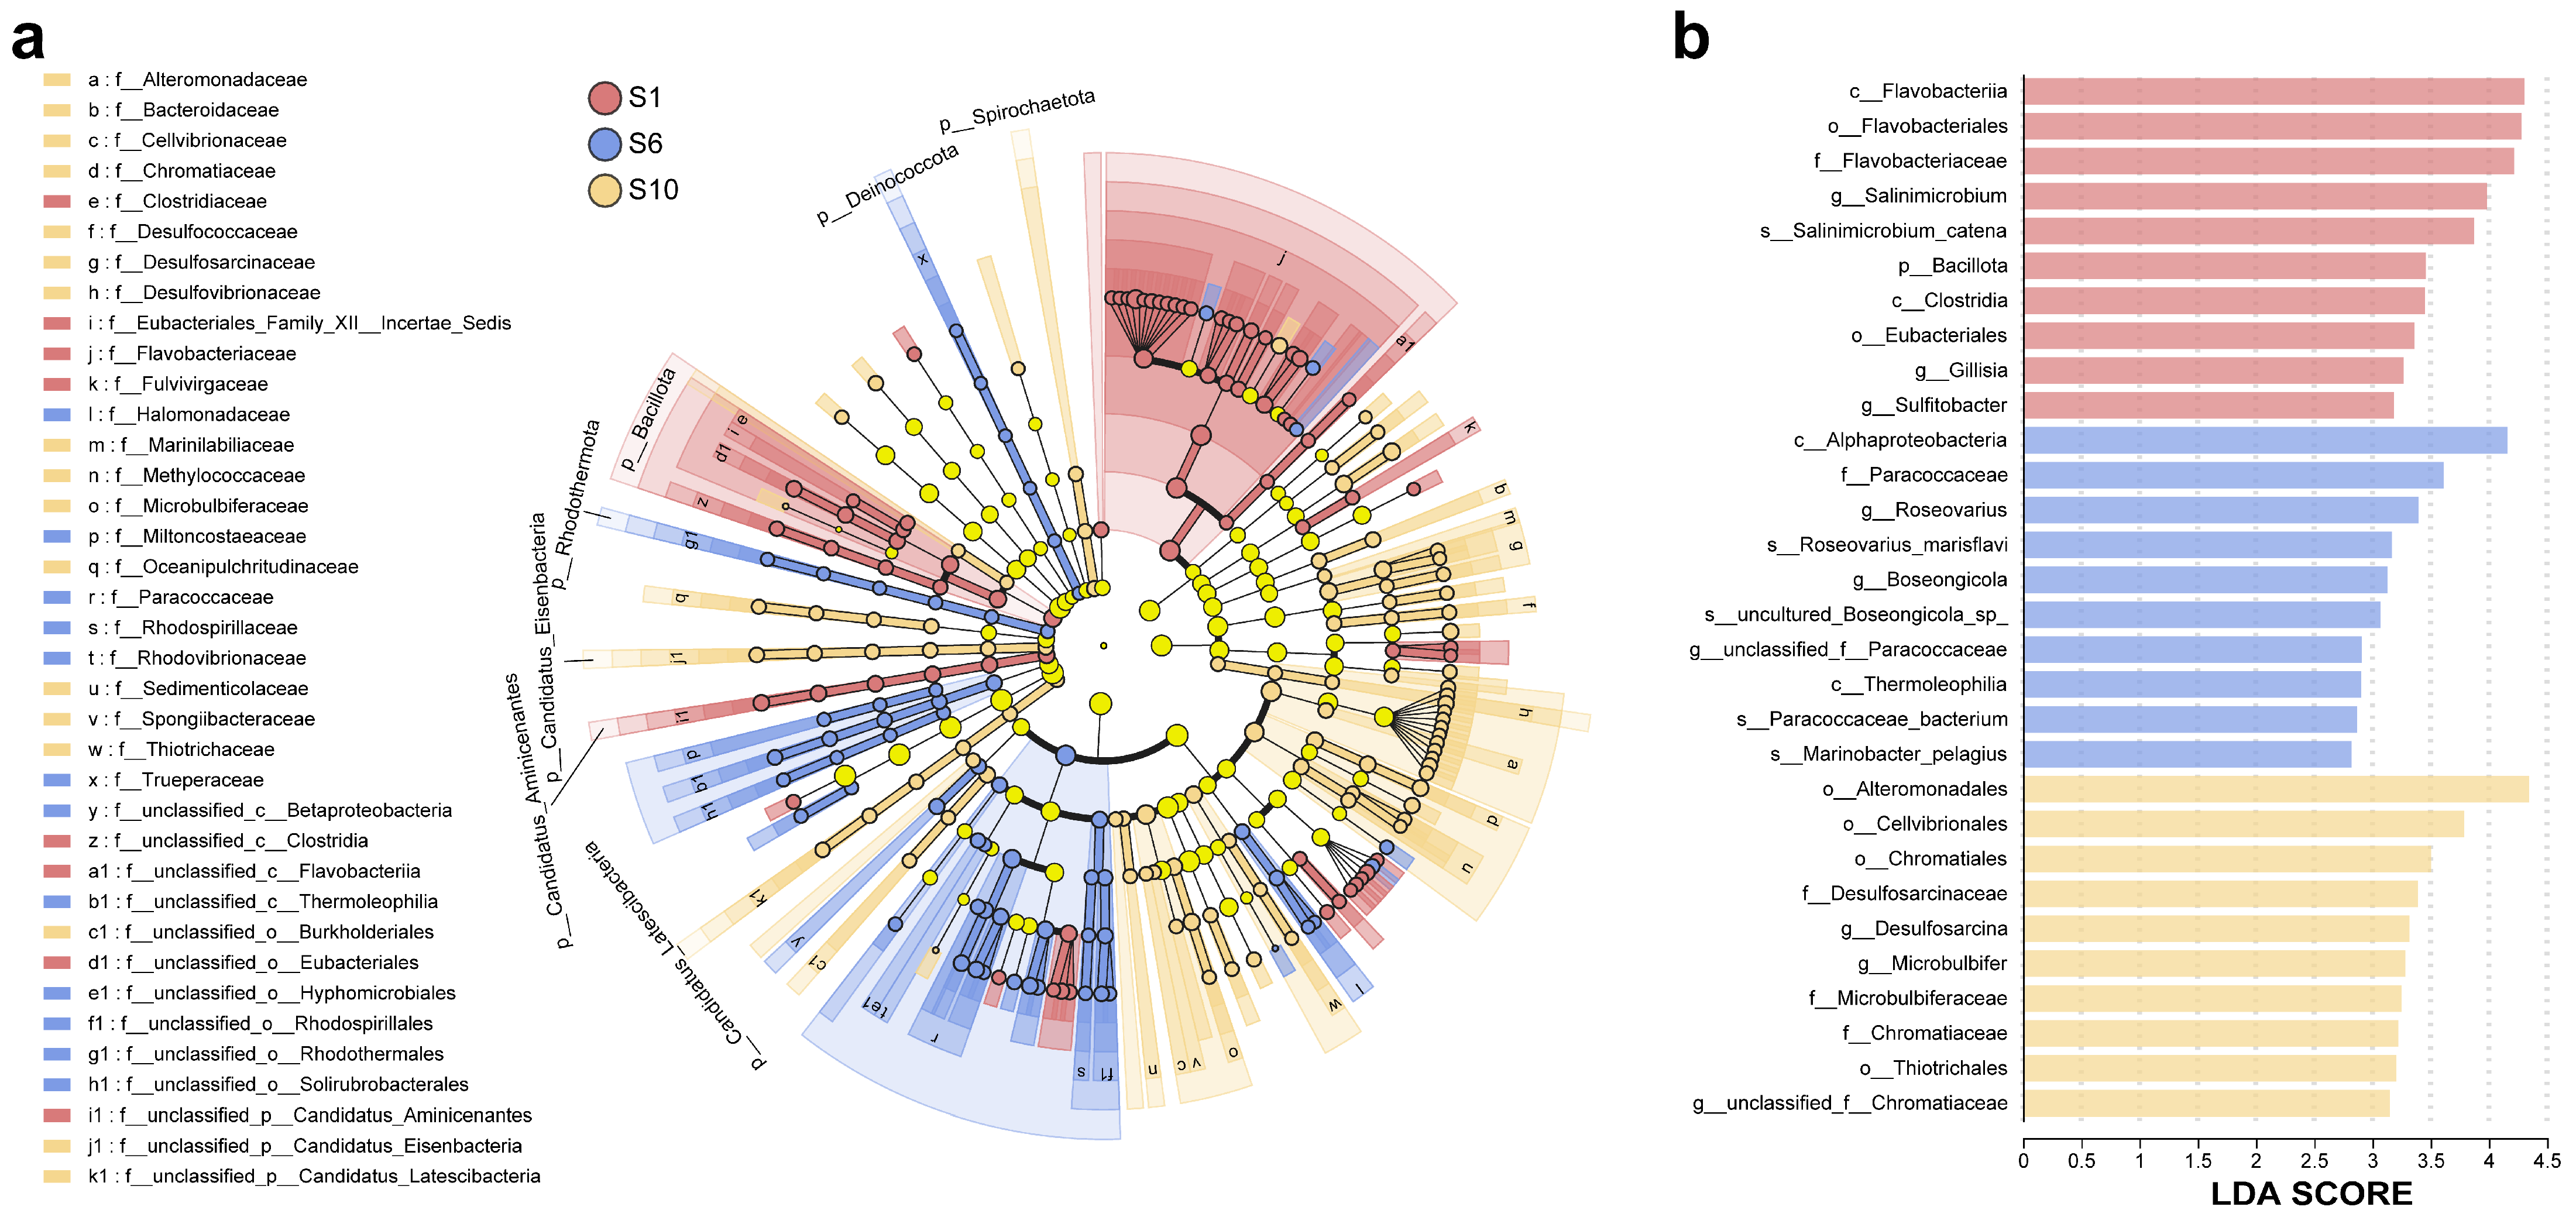
3.1.3. Differences Among Microbiomes of Mariculture Sediments with Different Fermentation Durations

Although the composition of microbial communities in mariculture sediments with different fermentation durations did not seem to have significant differences in the analysis of dominant phyla, the community diversity analysis showed significant differences among the three groups of samples. In particular, in the α-diversity analysis, the difference between the 1-year-old and 6-year-old sediment samples in the Simpson index group-difference test was very significant (p < 0.05). The PCoA confidence ellipse distribution showed that the 10-year-old sediment community was the most distinct from the other two groups of samples. Further analysis of the species-sharing situation at the species level among the three groups of samples showed that 24,858 species were shared among the three groups, accounting for 72.14% of all detected species. In terms of the number of unique species in each group, the 10-year-old sediment had the most unique species, up to 1966, accounting for 5.71%; the 1-year-old sediment ranked second, with 1292 unique species, accounting for 3.75%; and the 6-year-old sediment had the fewest unique species, only 1122, accounting for 3.26% (Figure 5).
The LEfSe differential discriminant analysis showed the significant taxa causing differences among different sample groups. These microorganisms mainly came from seven bacterial phyla, namely Bacillota, Candidatus aminicenantes, Candidatus eisenbacteria, Candidatus Latescibacteria, Deinococcota, Rhodothermota, and Spirochaetota. Subsequently, LDA was used to estimate the impact of the abundance of each species on the differential effect. Among all samples, there were five taxa with an LDA value higher than four. Three of them were contributed by the 1-year-old sediment samples, and the other two sample groups each contributed one high-difference taxon. The microorganism with the greatest impact on the differential effect was the Alteromonadales in the 10-year-old sediment sample, with an LDA value as high as 4.345, followed by the 1-year-old sediment samples, which were Flavobacteriia (LDA: 4.305), Flavobacteriales (LDA: 4.279), and Flavobacteriaceae (LDA: 4.219). Last was the Alphaproteobacteria from the 6-year-old sediment, with an LDA value of 4.160 (Figure 6).

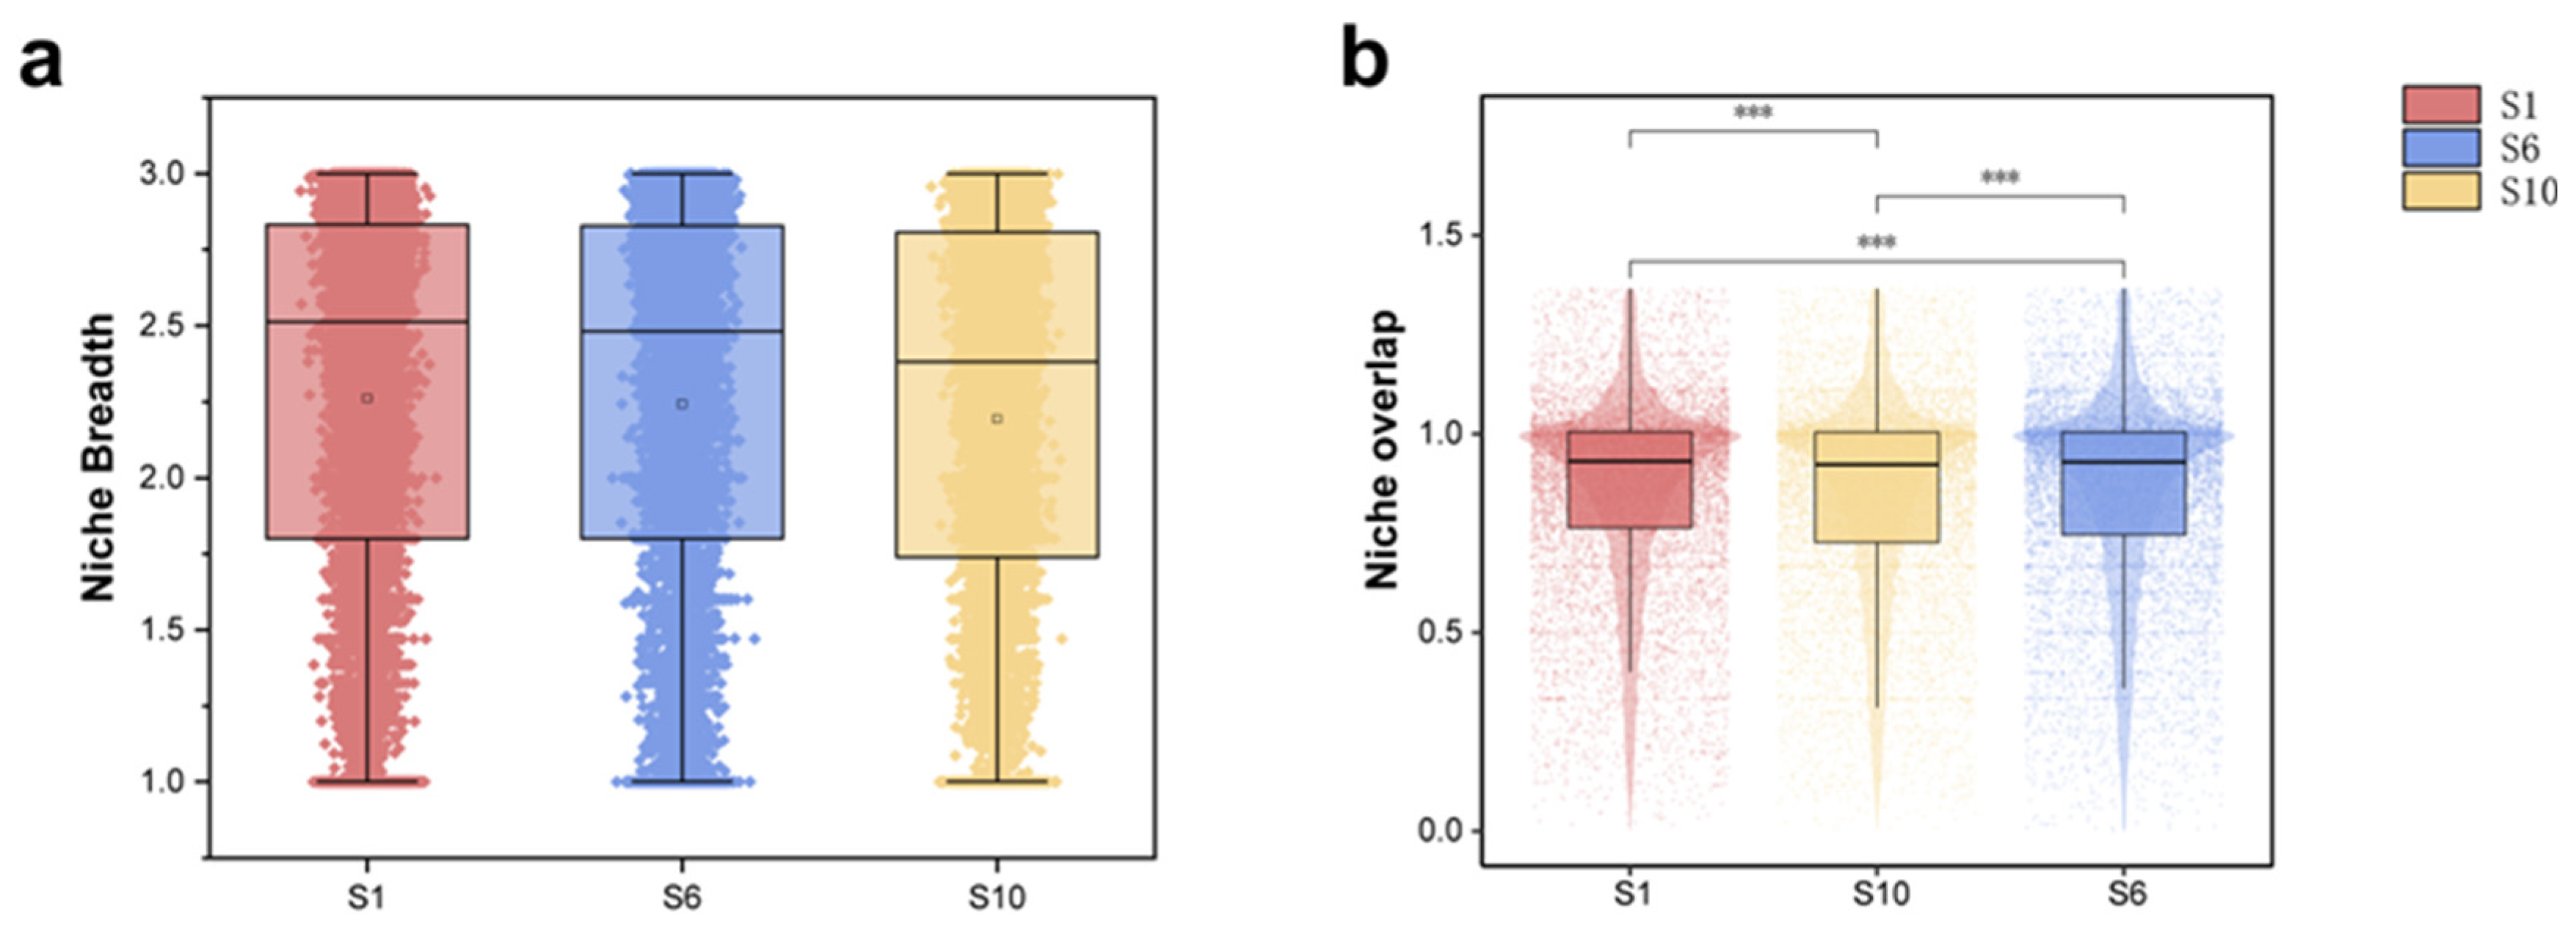
3.2. Niche Characteristics of the Microbiome in Mariculture Sediments with Different Natural Fermentation Durations

The analysis of the niche characteristics of the microbiome in mariculture sediments with different natural fermentation durations showed that the fermentation time had a non-negligible impact on the community’s resource utilization pattern and inter-species interaction relationship. The niche breadth analysis revealed that the microbial community in 1-year-fermented sediment exhibited the highest niche breadth (2.2612). This suggested a high level of resource utilization diversity and environmental adaptation potential, likely attributed to the abundant organic matter input and distinct niche differentiation during the initial fermentation stage. As the fermentation time extended (6-year: 2.2419; 10-year: 2.1924), the community niche breadth gradually declined. This indicated that during the long-term fermentation process, intensified nutrient competition led to a reduction in functional redundancy, enabling dominant microbial groups to assume a leading position through niche specialization (Figure 7a).
The analysis of the niche overlap coefficient further unveiled the temporal evolution of the community competition pattern. The microbial community in 1-year-fermented sediment displayed a relatively high niche overlap coefficient (0.8663), reflecting a relatively intense competition pressure among its community members. In contrast, the niche overlap coefficients of 6-year-fermented (0.8588) and 10-year-fermented (0.8533) sediments decreased significantly, which corroborated their lower community diversity (Figure 7b). These results demonstrated that the natural fermentation duration, by regulating resource availability and the intensity of inter-species interactions, in conjunction with changes in community diversity, jointly drove the transformation of the microbial community’s competition strategies.

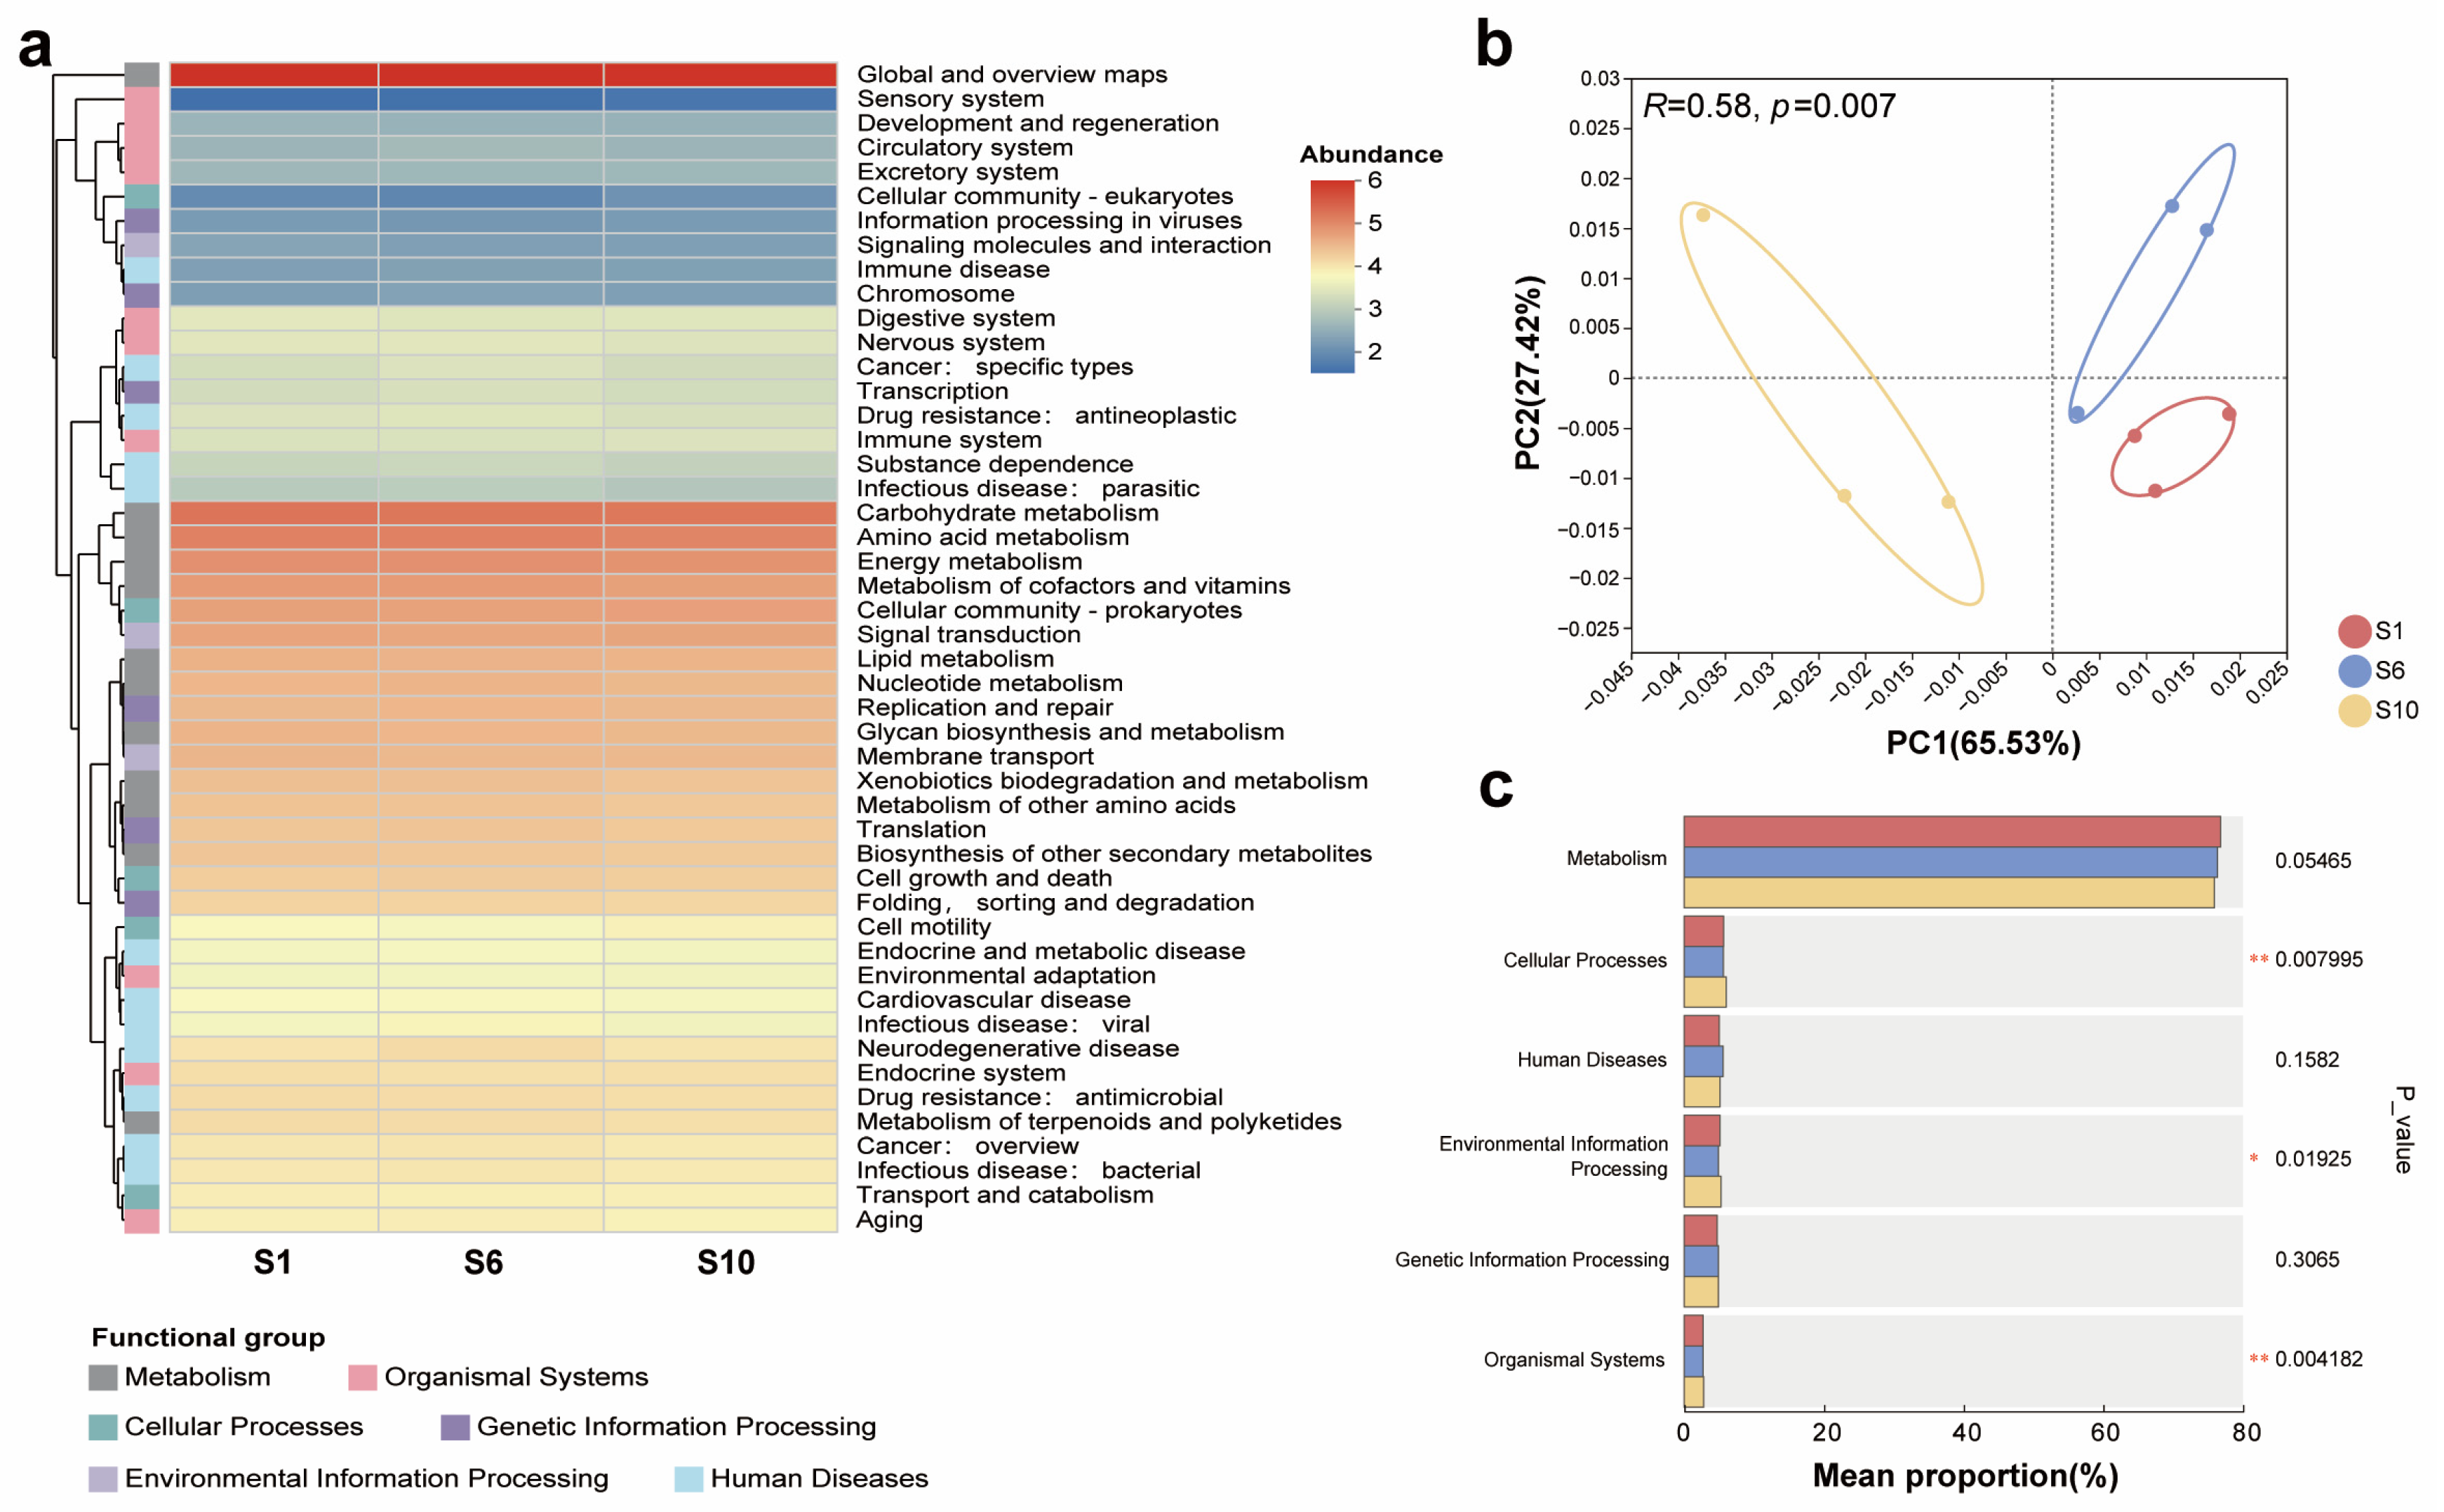
3.3. Overview of the Occurrence Characteristics of Functional Genes in Mariculture Sediments with Different Natural Fermentation Durations

In this study, a total of 11,301 Kyoto Encyclopedia of Genes and Genomes (KEGG) Orthology (KO) functional units were identified from three groups of mariculture sediment samples with different natural fermentation durations (1-year, 6-year, and 10-year). These units mainly belonged to the “Global and overview maps” category under the “Metabolism” taxonomic unit, with a total abundance of 59.749 million (Figure 8). In the Level 2 annotation of KEGG pathways, all samples exhibited a consistent distribution trend of functional genes. The functional genes in the “Global and overview maps”, “Carbohydrate metabolism”, and “Amino acid metabolism” categories had the highest abundances, with average values of 5.69, 5.01, and 4.88, respectively. These categories all fell under the “Metabolism” major category and encompassed the core metabolic pathways of the sediment microbial community (Figure 9a). Although most of the Level 2 metabolic pathways showed similar distribution patterns among samples with different fermentation durations, the principal coordinate analysis based on the Bray–Curtis distance indicated significant differences in the composition of functional genes among groups. Notably, the sediment samples fermented for 10 years showed the most distinct divergence from the other two groups (ANOSIM test, R = 0.58, p = 0.007), suggesting that long-term fermentation shaped unique metabolic functional characteristics (Figure 9b).
Further one-way analysis of variance revealed the main sources of differences in functional genes among samples with different fermentation durations. In the Level 1 classification of KEGG pathways, three major categories, namely “Cellular Processes” (p = 0.0080), “Environmental Information Processing” (p = 0.0193), and “Organismal Systems” (p = 0.0042), showed significant inter-group differences (Figure 9c). This was likely closely related to the oligotrophic adaptation strategies of sediment microorganisms and the reconstruction of metabolic networks in 10-year-fermented sediments, indicating that the natural fermentation duration drove the temporal evolution of the functions of the sediment ecosystem by regulating the metabolic functional divergence of the microbial community.

4. Discussion

Our metagenomic analysis of six sediment samples yielded 11.4 million contigs and 1.4278 million ORFs, revealing extraordinary genetic diversity within the sediment microbiome. The bacterial community exhibited clear functional stratification, with Pseudomonadota, Campylobacterota, and Thermodesulfobacteriota collectively constituting 85.41% of the phylum-level composition. The metabolic versatility of Pseudomonadota, particularly in organic matter degradation and sulfur oxidation, likely explains its predominance. Fungal assemblages were dominated by Mucoromycota (47.34%) and Ascomycota (27.60%), with their enrichment in ligninolytic enzymes (e.g., laccase, manganese peroxidase) suggesting a pivotal role in complex organic matter decomposition. Notably, Uroviricota phages (97.59% of viral sequences) may regulate bacterial populations through host lysis, potentially preventing Pseudomonas overgrowth and maintaining ecosystem equilibrium. However, viruses and eukaryotes were found to be less abundant overall, and most of their major viral types are associated with metabolic growth and are not strongly pathogenic or transmissible.
Temporal analysis demonstrated significant microbial succession patterns during sediment fermentation. The α-diversity peak in 1-year sediments (declining by 4.5% and 3.6% at 6 and 10 years, respectively) reflects niche specialization under prolonged nutrient competition. β-diversity analysis (ANOSIM: R = 0.802, p = 0.001) confirmed temporal control over community assembly, with 10-year samples exhibiting distinct separation in PCoA (PC1 = 52.3%) and 3.2-fold higher unique species representation. This suggests the progressive development of fermentation-specific microbial consortia. Key functional groups displayed stage-dependent dominance: Flavobacteriia prevailed in the initial stages (1-year) through rapid organic matter hydrolysis (protease/glycoside hydrolase genes), while Alteromonadales dominated late-stage (10-year) communities via metabolic plasticity in oligotrophic conditions (extracellular polymer synthesis, multi-carbon utilization). Alphaproteobacteria emerged as crucial transitional players (6-year), likely facilitating organic matter mineralization through specialized electron transport chains.
The observed parallel decline in both niche breadth and niche overlap coefficient during prolonged sediment fermentation reveals a sophisticated ecological trade-off mechanism governing microbial community assembly. In the initial fermentation stages (1-year), abundant fresh organic matter inputs create a resource-rich environment that promotes microbial generalist strategies, manifested through maximized niche breadth supporting peak α-diversity, while high functional redundancy leads to elevated niche overlap. This “high diversity-high competition” coexistence pattern represents a characteristic community configuration under resource-abundant conditions. As fermentation progresses (6–10 years), humification-induced resource depletion triggers a fundamental shift in microbial adaptation strategies. The gradual reduction in labile organic components and resource homogenization select for specialized oligotrophic taxa like Alteromonadales through metabolic optimization, while eliminating functionally redundant populations via intensified competition. This ecological succession is evidenced by the concurrent narrowing of niche breadth (refining resource specialization) and declining niche overlap (indicating metabolic niche partitioning). The emergence of the distinctive “narrow breadth-low overlap” profile in 10-year fermented sediments, coupled with the enrichment of highly specialized functional groups (e.g., exopolysaccharide producers), demonstrates an evolved stability mechanism through “metabolic division-resource partitioning”. These findings challenge conventional ecological paradigms by demonstrating that reduced diversity in resource-limited systems can enhance community resilience via functional complementarity, providing novel insights into microbial self-organization in engineered ecosystems [32].
Through the metagenomic analysis of mariculture sediments with different natural fermentation durations, this study revealed the dynamic change rules of microbial functional genes and their ecological significance. In terms of the occurrence characteristics of functional genes, the research results showed that core metabolic pathways such as “Global and overview maps”, “Carbohydrate metabolism”, and “Amino acid metabolism” dominated the sediment microbial community, which was consistent with the basic requirements of organic matter degradation and energy metabolism in the sediment environment [33]. Notably, as the fermentation time extended, the composition of functional genes in the sediment microbial community changed significantly, especially showing obvious functional differentiation in the 10-year-fermented samples (ANOSIM test, R = 0.58). This temporal functional evolution might be closely related to the changes in the physical and chemical properties of the sediment during the long-term fermentation process, such as the increase in the humification degree of organic matter and the decrease in the redox potential. These factors jointly drove the reconstruction of the microbial metabolic network.

5. Conclusions

This study innovatively reveals the distribution characteristics of the microbiome during the natural fermentation process of mariculture sediments and its spatiotemporal coupling with pond ecosystem functions. Through systematic metagenomic analysis, we elucidated the dynamic evolution of functional genes and clarified the structural reshaping mechanisms of microbial communities during natural fermentation. The results demonstrate that one-year fermented sediments exhibit a relatively high α-diversity index with distinct functional microbiota differentiation. Prolonged fermentation (6–10 years) significantly reduces microbial diversity and functional redundancy by inducing nutrient competition effects. Temporal succession analysis reveals that natural fermentation optimizes community functional allocation through resource competition and metabolic division strategies. The decade-long fermentation system shows marked differentiation in functional genes, particularly in carbon- and nitrogen-metabolizing gene clusters, where differential expression is most prominent. This phenomenon closely correlates with the regulatory effects of sediment humification processes and redox potential dynamics on microbial metabolic networks. These findings not only extend the theoretical framework of microbial ecology in mariculture sediments but also provide new perspectives for studying biogeochemical cycling mechanisms in tidal flat aquaculture systems, offering critical insights for developing microbiota-mediated aquaculture remediation technologies.

Author Contributions

G.Z.: conceptualization, methodology, writing—original draft preparation. M.L.: software, data curation, visualization. C.X.: software, data curation. X.P.: investigation, validation. G.Y.: supervision, investigation. W.X. and C.W.: conceptualization, funding acquisition, supervision. Z.Z. and R.L.: writing—review and editing, project administration, funding acquisition, supervision. All authors have read and agreed to the published version of the manuscript.

Funding

This research was funded by the National Natural Science Foundation of China (22266005), Guangxi Key Research and Development Program (AB23026007), together with Guangxi Science and Technology Major Program (GUIKEAA23062054).

Data Availability Statement

The data presented in this study are available in SRA at the NCBI database, reference number PRJNA797856. Web address: PE_1_r metagenome (ID 797856)-BioProject-NCBI.

Acknowledgments

The authors are grateful for financial support from the National Natural Science Foundation of China (22266005), Guangxi Key Research and Development Program (AB23026007), together with Guangxi Science and Technology Major Program (GUIKEAA23062054).

Conflicts of Interest

The authors declare no conflicts of interest.

References

  1. Boyd, C.E.; McNevin, A.A.; Davis, R.P. The contribution of fisheries and aquaculture to the global protein supply. Food Secur. 2022, 14, 805–827. [Google Scholar] [CrossRef] [PubMed]
  2. Free, C.M.; Cabral, R.B.; Froehlich, H.E.; Battista, W.; Ojea, E.; O’Reilly, E.; Palardy, J.E.; García Molinos, J.; Siegel, K.J.; Arnason, R.; et al. Expanding ocean food production under climate change. Nature 2022, 605, 490–496. [Google Scholar] [CrossRef] [PubMed]
  3. Dong, S.-L.; Cao, L.; Liu, W.-J.; Huang, M.; Sun, Y.-X.; Zhang, Y.-Y.; Yu, S.-E.; Zhou, Y.-G.; Li, L.; Dong, Y.-W. System-specific aquaculture annual growth rates can mitigate the trilemma of production, pollution and carbon dioxide emissions in China. Nat. Food 2025, 6, 365–374. [Google Scholar] [CrossRef]
  4. Zeng, S.; Wei, D.; Hou, D.; Wang, H.; Liu, J.; Weng, S.; He, J.; Huang, Z. Sediment microbiota in polyculture of shrimp and fish pattern is distinctive from those in monoculture intensive shrimp or fish ponds. Sci. Total Environ. 2021, 787, 147594. [Google Scholar] [CrossRef] [PubMed]
  5. Ma, S.; Dong, X.; Luo, C.; Xu, J. Enrichment of organic carbon increases the flux of phosphorus from sediment in mariculture ponds. Aquaculture 2023, 565, 739148. [Google Scholar] [CrossRef]
  6. Moncada, C.; Hassenrück, C.; Gärdes, A.; Conaco, C. Microbial community composition of sediments influenced by intensive mariculture activity. FEMS Microbiol. Ecol. 2019, 95, fiz006. [Google Scholar] [CrossRef]
  7. Zhang, X.; Yao, C.; Zhang, B.; Tan, W.; Gong, J.; Wang, G.-y.; Zhao, J.; Lin, X. Dynamics of Benthic Nitrate Reduction Pathways and Associated Microbial Communities Responding to the Development of Seasonal Deoxygenation in a Coastal Mariculture Zone. Environ. Sci. Technol. 2023, 57, 15014–15025. [Google Scholar] [CrossRef]
  8. Yu, X.; Huang, W.; Wang, Y.; Wang, Y.; Cao, L.; Yang, Z.; Dou, S. Microplastic pollution in the environment and organisms of Xiangshan Bay, East China Sea: An area of intensive mariculture. Water Res. 2022, 212, 118117. [Google Scholar] [CrossRef]
  9. Han, Y.; Wang, J.; Zhao, Z.; Chen, J.; Lu, H.; Liu, G. Fishmeal Application Induces Antibiotic Resistance Gene Propagation in Mariculture Sediment. Environ. Sci. Technol. 2017, 51, 10850–10860. [Google Scholar] [CrossRef]
  10. Thongsamer, T.; Neamchan, R.; Blackburn, A.; Acharya, K.; Sutheeworapong, S.; Tirachulee, B.; Pattanachan, P.; Vinitnantharat, S.; Zhou, X.-Y.; Su, J.-Q.; et al. Environmental antimicrobial resistance is associated with faecal pollution in Central Thailand’s coastal aquaculture region. J. Hazard. Mater. 2021, 416, 125718. [Google Scholar] [CrossRef]
  11. Yang, Z.; Sun, M.; Peng, L.; Dai, L.; Zhu, J.; Li, G.; Tao, L.; Zhang, H. Reduction of nutrient fluxes across the sediment–water interface and nutrient accumulation in lotus-fish co-culture aquaculture ponds. Aquac. Int. 2024, 32, 7683–7694. [Google Scholar] [CrossRef]
  12. Wang, F.; Dong, W.; Zhao, Z.; Wang, H.; Li, W.; Chen, G.; Wang, F.; Zhao, Y.; Huang, J.; Zhou, T. Heavy metal pollution in urban river sediment of different urban functional areas and its influence on microbial community structure. Sci. Total Environ. 2021, 778, 146383. [Google Scholar] [CrossRef] [PubMed]
  13. Xu, M.; Xu, R.-Z.; Shen, X.-X.; Gao, P.; Xue, Z.-X.; Huang, D.-C.; Jin, G.-Q.; Li, C.; Cao, J.-S. The response of sediment microbial communities to temporal and site-specific variations of pollution in interconnected aquaculture pond and ditch systems. Sci. Total Environ. 2022, 806, 150498. [Google Scholar] [CrossRef] [PubMed]
  14. Gavrilescu, M. From pollutants to products: Microbial cell factories driving sustainable biomanufacturing and environmental conservation. Chem. Eng. J. 2024, 500, 157152. [Google Scholar] [CrossRef]
  15. Qian, Y.; Hu, P.; Lang-Yona, N.; Xu, M.; Guo, C.; Gu, J.-D. Global landfill leachate characteristics: Occurrences and abundances of environmental contaminants and the microbiome. J. Hazard. Mater. 2024, 461, 132446. [Google Scholar] [CrossRef]
  16. Sun, W.; Xiao, E.; Xiao, T.; Krumins, V.; Wang, Q.; Häggblom, M.; Dong, Y.; Tang, S.; Hu, M.; Li, B.; et al. Response of Soil Microbial Communities to Elevated Antimony and Arsenic Contamination Indicates the Relationship between the Innate Microbiota and Contaminant Fractions. Environ. Sci. Technol. 2017, 51, 9165–9175. [Google Scholar] [CrossRef]
  17. Falås, P.; Jewell, K.S.; Hermes, N.; Wick, A.; Ternes, T.A.; Joss, A.; Nielsen, J.L. Transformation, CO2 formation and uptake of four organic micropollutants by carrier-attached microorganisms. Water Res. 2018, 141, 405–416. [Google Scholar] [CrossRef]
  18. Zhang, D.; Li, H.; Liu, Y.; Qiao, G.; Chi, S.; Song, J. Screening and identification of organics-degrading bacteria from the sediment of sea cucumber Apostichopus japonicus ponds. Aquac. Int. 2016, 24, 373–384. [Google Scholar] [CrossRef]
  19. Banerjee, S.; Schlaeppi, K.; van der Heijden, M.G.A. Keystone taxa as drivers of microbiome structure and functioning. Nat. Rev. Microbiol. 2018, 16, 567–576. [Google Scholar] [CrossRef]
  20. Han, Q.F.; Zhao, S.; Zhang, X.R.; Wang, X.L.; Song, C.; Wang, S.G. Distribution, combined pollution and risk assessment of antibiotics in typical marine aquaculture farms surrounding the Yellow Sea, North China. Environ. Int. 2020, 138, 105551. [Google Scholar] [CrossRef]
  21. Zago, V.; Veschetti, L.; Patuzzo, C.; Malerba, G.; Lleo, M.M. Shewanella algae and Vibrio spp. strains isolated in Italian aquaculture farms are reservoirs of antibiotic resistant genes that might constitute a risk for human health. Mar. Pollut. Bull. 2020, 154, 111057. [Google Scholar] [CrossRef] [PubMed]
  22. Adair, K.L.; Douglas, A.E. Making a microbiome: The many determinants of host-associated microbial community composition. Curr. Opin. Microbiol. 2017, 35, 23–29. [Google Scholar] [CrossRef] [PubMed]
  23. Zhang, Z.; Deng, Q.; Wan, L.; Cao, X.; Zhou, Y.; Song, C. Bacterial Communities and Enzymatic Activities in Sediments of Long-Term Fish and Crab Aquaculture Ponds. Microorganisms 2021, 9, 501. [Google Scholar] [CrossRef] [PubMed]
  24. Wei, D.; Zeng, S.; Hou, D.; Zhou, R.; Xing, C.; Deng, X.; Yu, L.; Wang, H.; Deng, Z.; Weng, S.; et al. Community diversity and abundance of ammonia-oxidizing archaea and bacteria in shrimp pond sediment at different culture stages. J. Appl. Microbiol. 2021, 130, 1442–1455. [Google Scholar] [CrossRef]
  25. Zhang, J.; Knight, R. Genomic Mutations Within the Host Microbiome: Adaptive Evolution or Purifying Selection. Engineering 2023, 20, 96–102. [Google Scholar] [CrossRef]
  26. Francke, C.; Siezen, R.J.; Teusink, B. Reconstructing the metabolic network of a bacterium from its genome. Trends Microbiol. 2005, 13, 550–558. [Google Scholar] [CrossRef]
  27. Laine, A.-L.; Tylianakis, J.M. The coevolutionary consequences of biodiversity change. Trends Ecol. Evol. 2024, 39, 745–756. [Google Scholar] [CrossRef]
  28. Niu, S.; Zhang, K.; Li, Z.; Wang, G.; Li, H.; Xia, Y.; Tian, J.; Yu, E.; Gong, W.; Xie, J. Nitrification and denitrification processes in a zero-water exchange aquaculture system: Characteristics of the microbial community and potential rates. Front. Mar. Sci. 2023, 10, 1072911. [Google Scholar] [CrossRef]
  29. Zhang, M.; Pan, L.; Huang, F.; Gao, S.; Su, C.; Zhang, M.; He, Z. Metagenomic analysis of composition, function and cycling processes of microbial community in water, sediment and effluent of Litopenaeus vannamei farming environments under different culture modes. Aquaculture 2019, 506, 280–293. [Google Scholar] [CrossRef]
  30. Yang, Z.; Yao, Y.; Sun, M.; Li, G.; Zhu, J. Metagenomics Reveal Microbial Effects of Lotus Root–Fish Co-Culture on Nitrogen Cycling in Aquaculture Pond Sediments. Microorganisms 2022, 10, 1740. [Google Scholar] [CrossRef]
  31. Zhao, Z.; Wang, Y.; Wei, Y.; Peng, G.; Wei, T.; He, J.; Li, R.; Wang, Y. Distinctive patterns of bacterial community succession in the riverine micro-plastisphere in view of biofilm development and ecological niches. J. Hazard. Mater. 2024, 480, 135974. [Google Scholar] [CrossRef] [PubMed]
  32. Kivlin, S.N.; Hawkes, C.V.; Papeş, M.; Treseder, K.K.; Averill, C. The future of microbial ecological niche theory and modeling. New Phytol. 2021, 231, 508–511. [Google Scholar] [CrossRef] [PubMed]
  33. Li, J.; Haeckel, M.; Dale, A.W.; Wallmann, K. Degradation and accumulation of organic matter in euxinic surface sediments. Geochim. Cosmochim. Acta 2024, 370, 128–143. [Google Scholar] [CrossRef]
Figure 1. Sampling locations and field photographs. (a) Map of sampling sites. (b) Field photograph of a sea cucumber aquaculture pond after 1 year of use. (c) Field photograph of a sea cucumber aquaculture pond after 6 years of use. (d) Field photograph of a sea cucumber aquaculture pond after 10 years of use.
Jmse 13 00975 g001
Figure 2. Variation in the composition of dominant microorganisms across different samples. (a) Bacteria, (b) fungi, (c) viruses (the top 10 phylum-level compositions by abundance are shown, with lower-abundance taxa grouped as “others”).
Jmse 13 00975 g002
Figure 3. Distribution patterns of α-diversity in sediment microbial communities: (a) Chao index, (b) Shannon index, (c) Simpson index (* represents a significance level of p < 0.05, meaning there is a significant difference between these two sets of data), (d) Pielou_e index.
Jmse 13 00975 g003
Figure 4. PCoA analysis illustrating the similarities and differences among microbial communities at different fermentation durations. PC1 and PC2 represent the first and second principal coordinate components, respectively.
Jmse 13 00975 g004
Figure 5. Sharing of (a) microorganisms, (b) bacteria, (c) fungi, (d) viruses at the species level in mariculture sediment samples with different use times.
Jmse 13 00975 g005
Figure 6. LEfSe differential discriminant analysis showing species differences at various taxonomic levels: (a) Differential species at different hierarchical levels obtained between groups, where nodes of different colors represent microbial taxa significantly enriched in the corresponding group and having a significant impact on intergroup differences; pale yellow nodes indicate microbial taxa with no significant differences between groups or no significant impact on intergroup differences. (b) LDA values of different differential species.
Jmse 13 00975 g006
Figure 7. Niche characteristics of the microbial community in mariculture sediment. (a) Niche breadth; (b) niche overlap coefficient. (*** indicates a significant difference between the two sets of data at the p < 0.001 level of significance).
Jmse 13 00975 g007
Figure 8. Overview of KEGG annotation.
Jmse 13 00975 g008
Figure 9. KEGG composition and differential analysis of mariculture sediments with different natural fermentation durations. (a) Relative abundance of functional genes annotated by the KEGG database in metagenomes of sediments with different fermentation durations; (b) PCoA of different sample groups; (c) multi-group comparative analysis based on one-way analysis of variance. (* and ** indicate that the factor shows a significant between-group difference at the p < 0.05 and p < 0.01 significance levels, respectively).
Jmse 13 00975 g009
Disclaimer/Publisher’s Note: The statements, opinions and data contained in all publications are solely those of the individual author(s) and contributor(s) and not of MDPI and/or the editor(s). MDPI and/or the editor(s) disclaim responsibility for any injury to people or property resulting from any ideas, methods, instructions or products referred to in the content.

