
Numerical Study of the Energy-Saving Effect of the Gate Rudder System


Abstract
1. Introduction
2. Geometry and Simulation Conditions
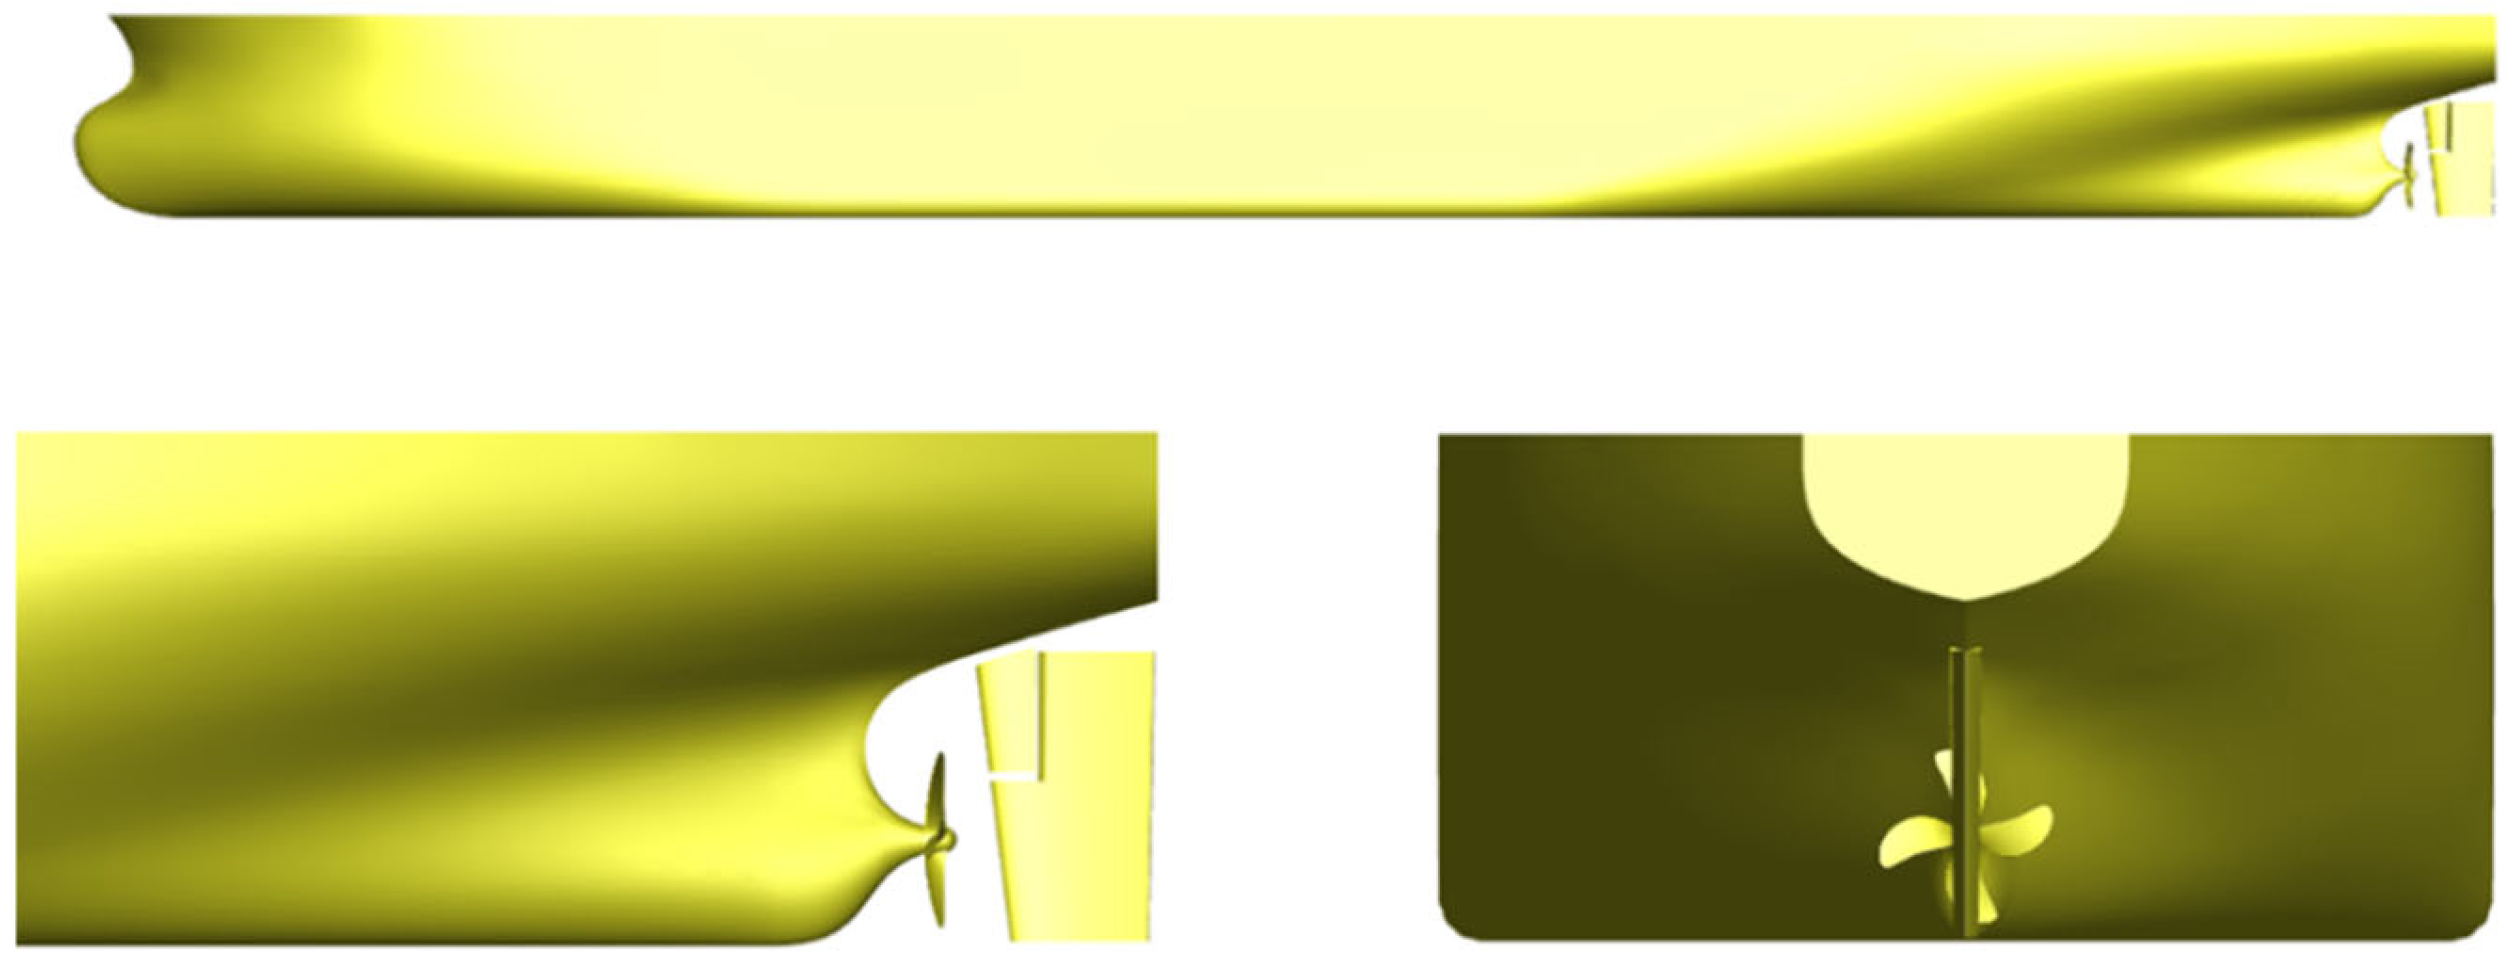
2.1. The KVLCC2 Model
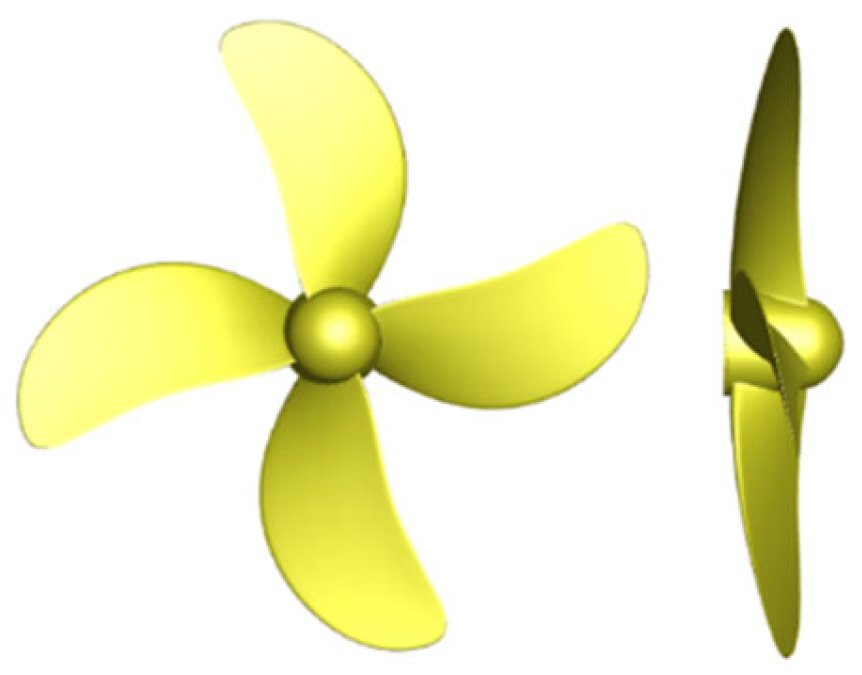
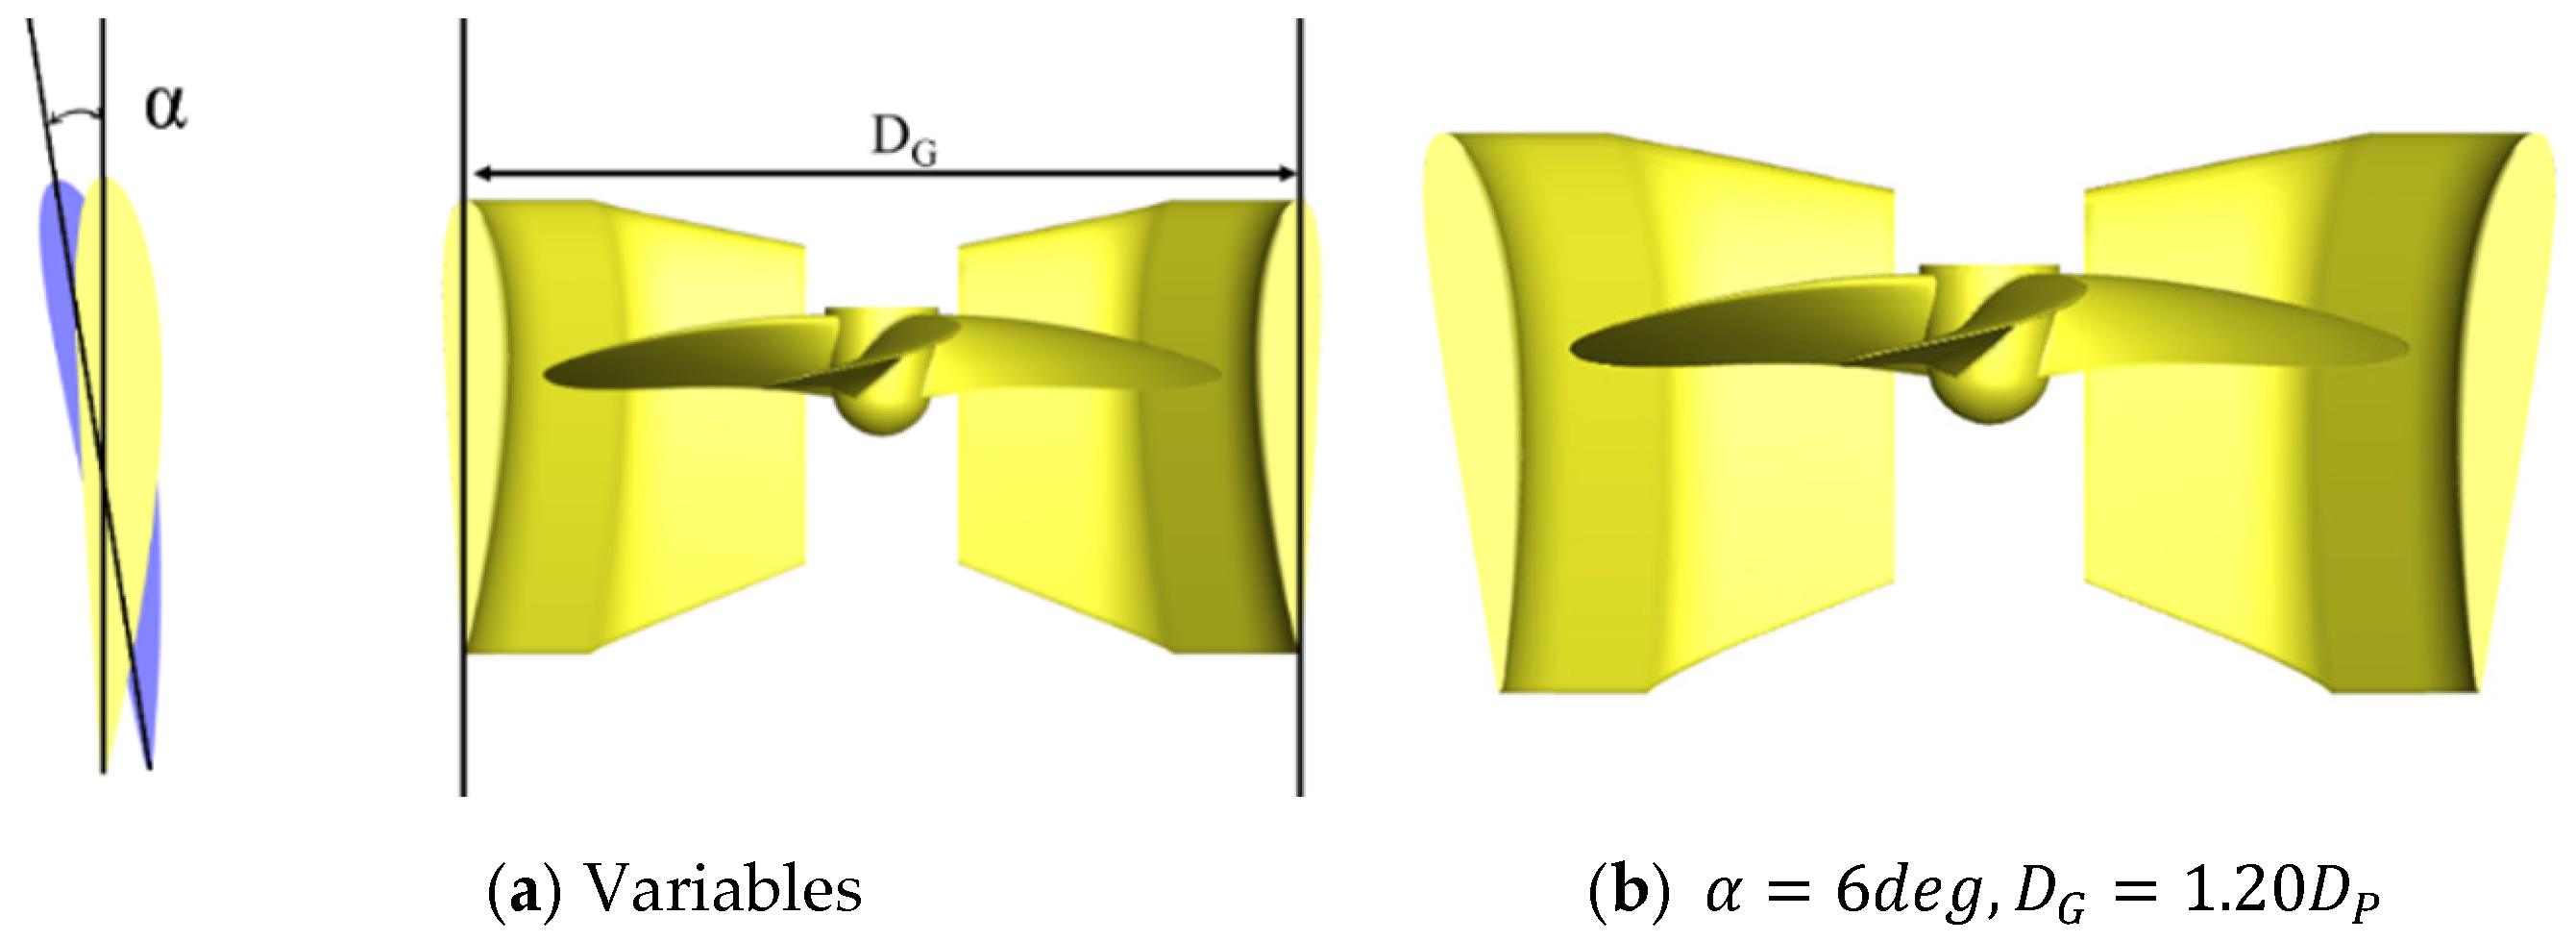
2.2. The Gate Rudder Model
2.3. Simulation Conditions
3. Mathematical Formulation
3.1. Governing Equation
3.2. Six-DOF Equations
3.3. The P-I Speed Controller
4. Numerical Method
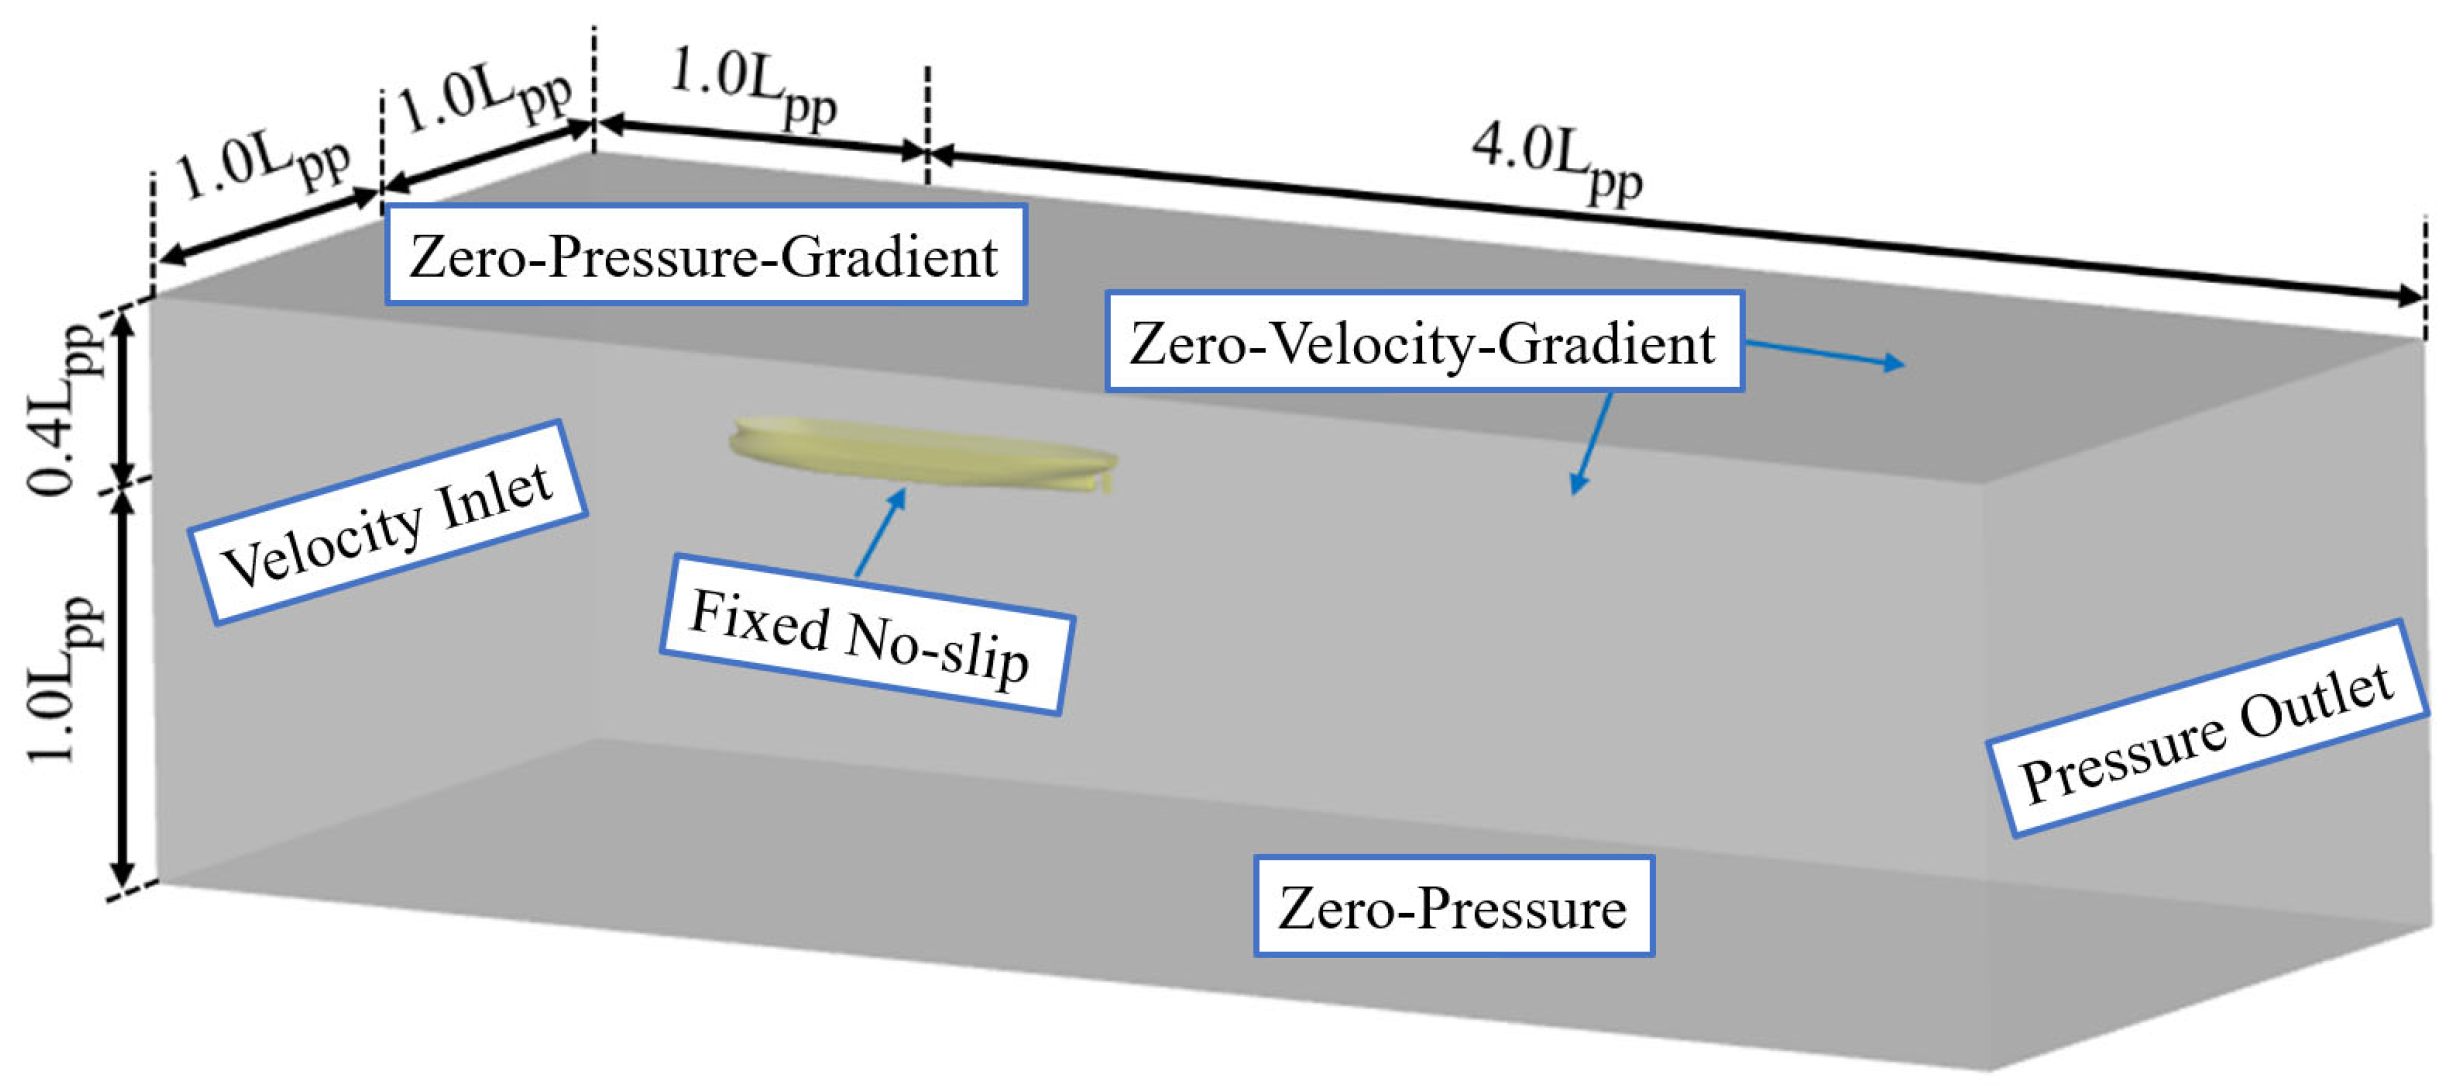
4.1. Computational Domain and Boundary Conditions
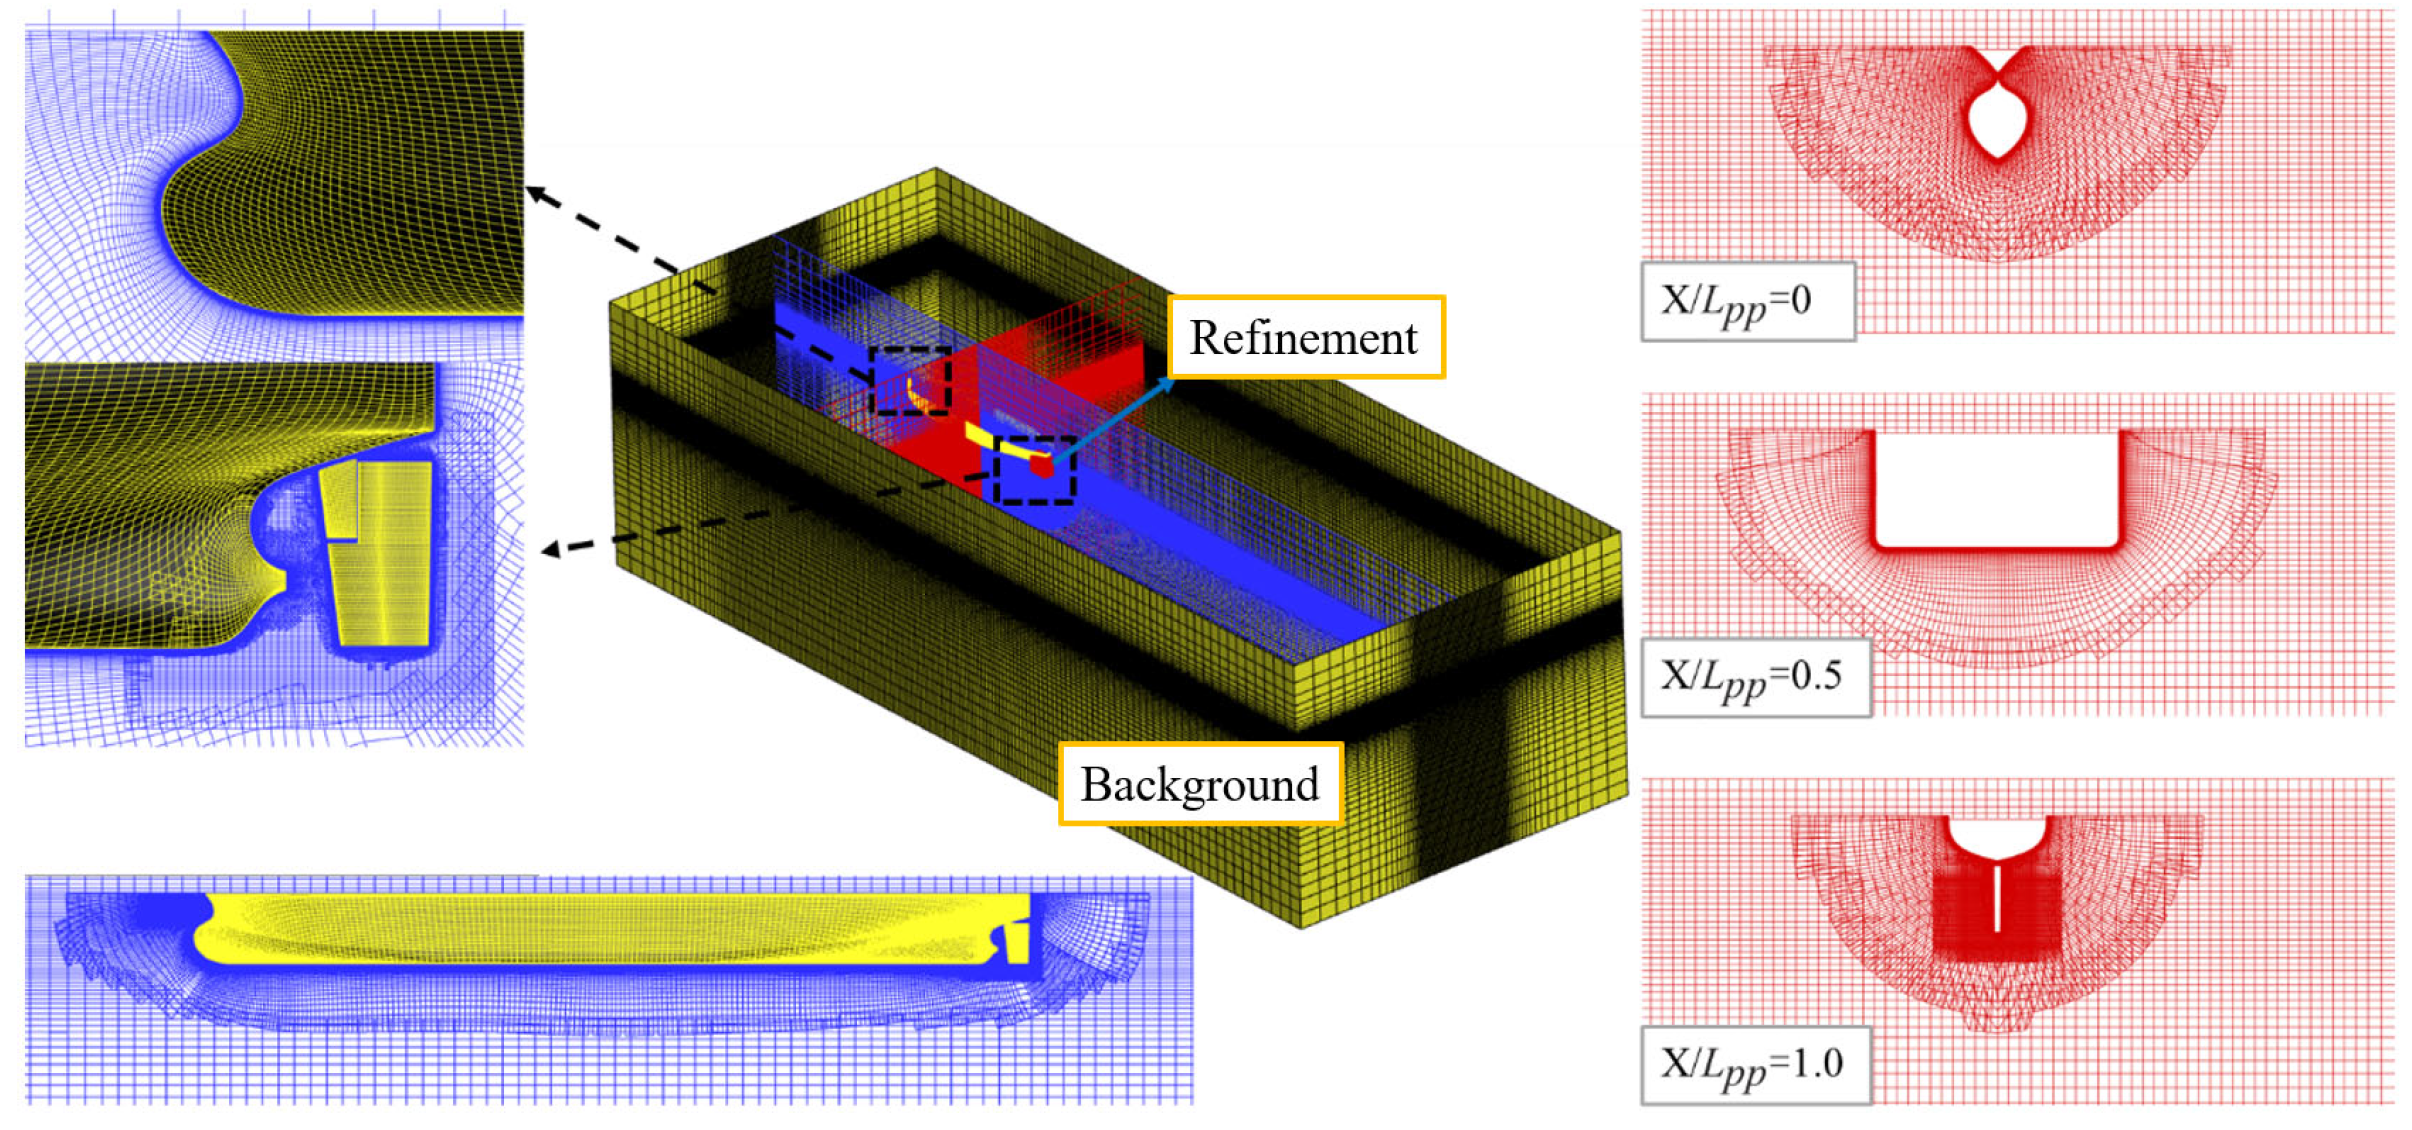
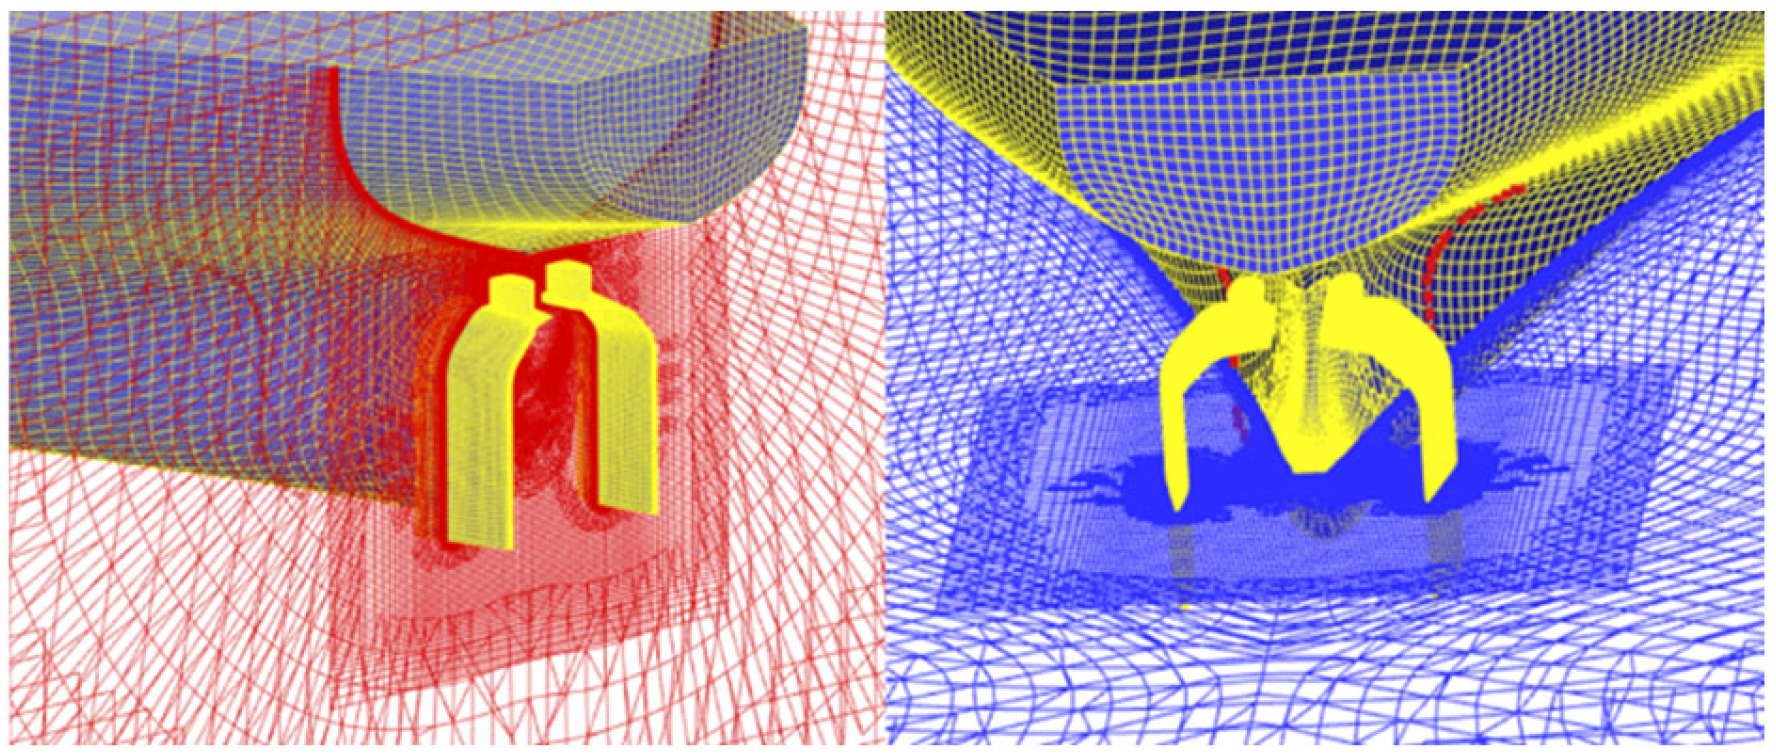
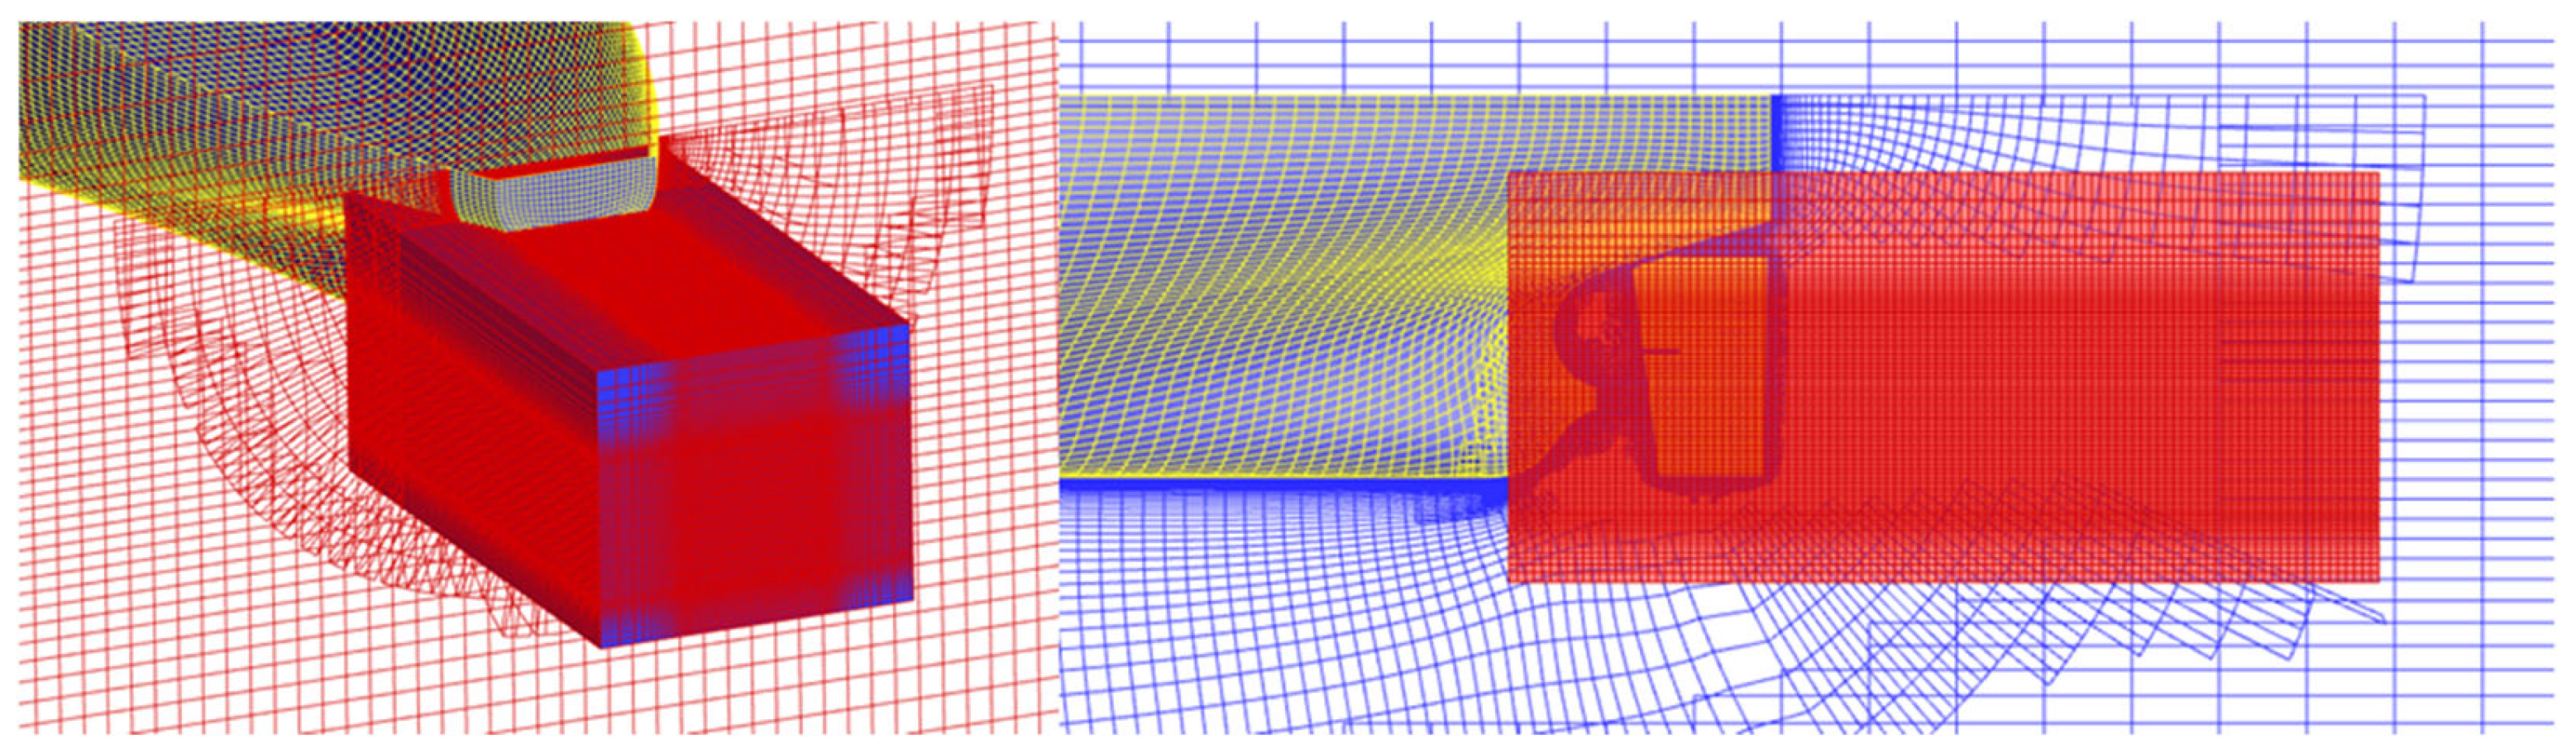
4.2. Grid Generation
5. Verification and Validation
5.1. Verification
- (1)
- , Monotonic convergence
- (2)
- , Oscillatory convergence
- (3)
- , Divergence
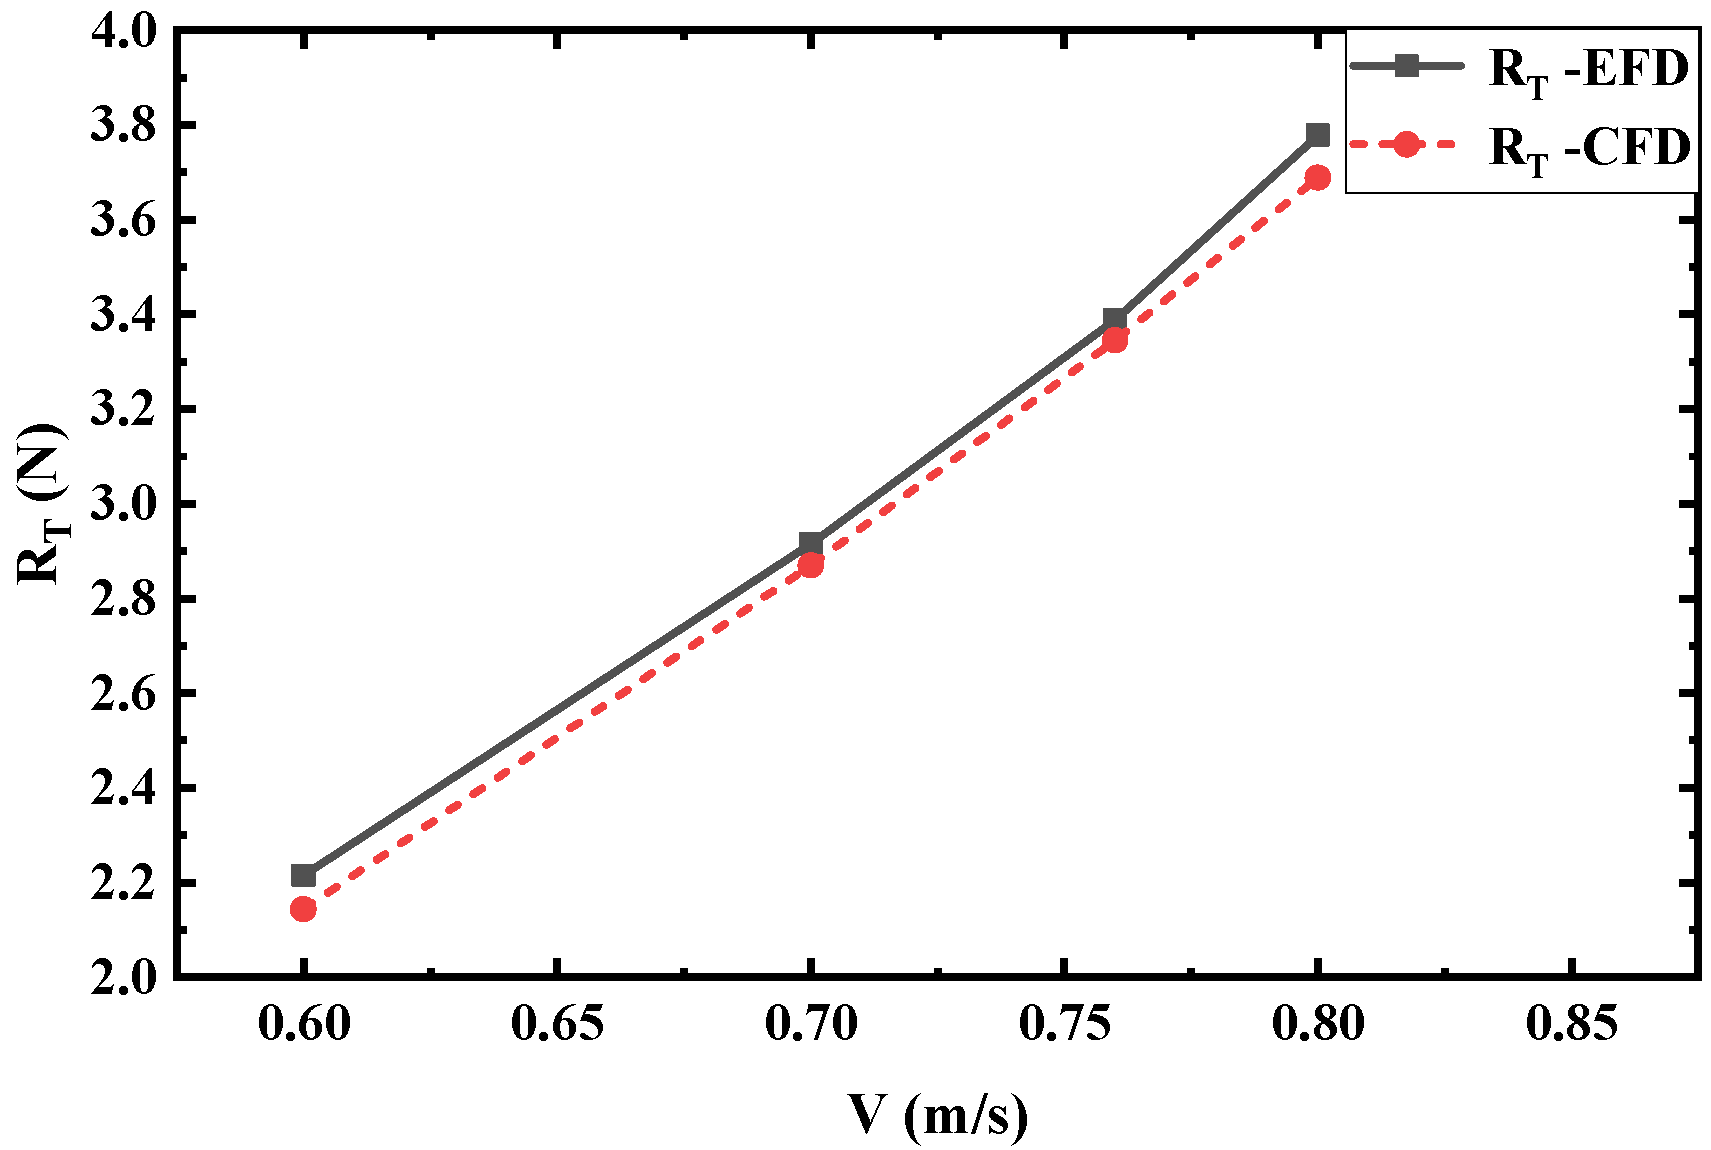
5.2. Validation
6. Results and Discussion
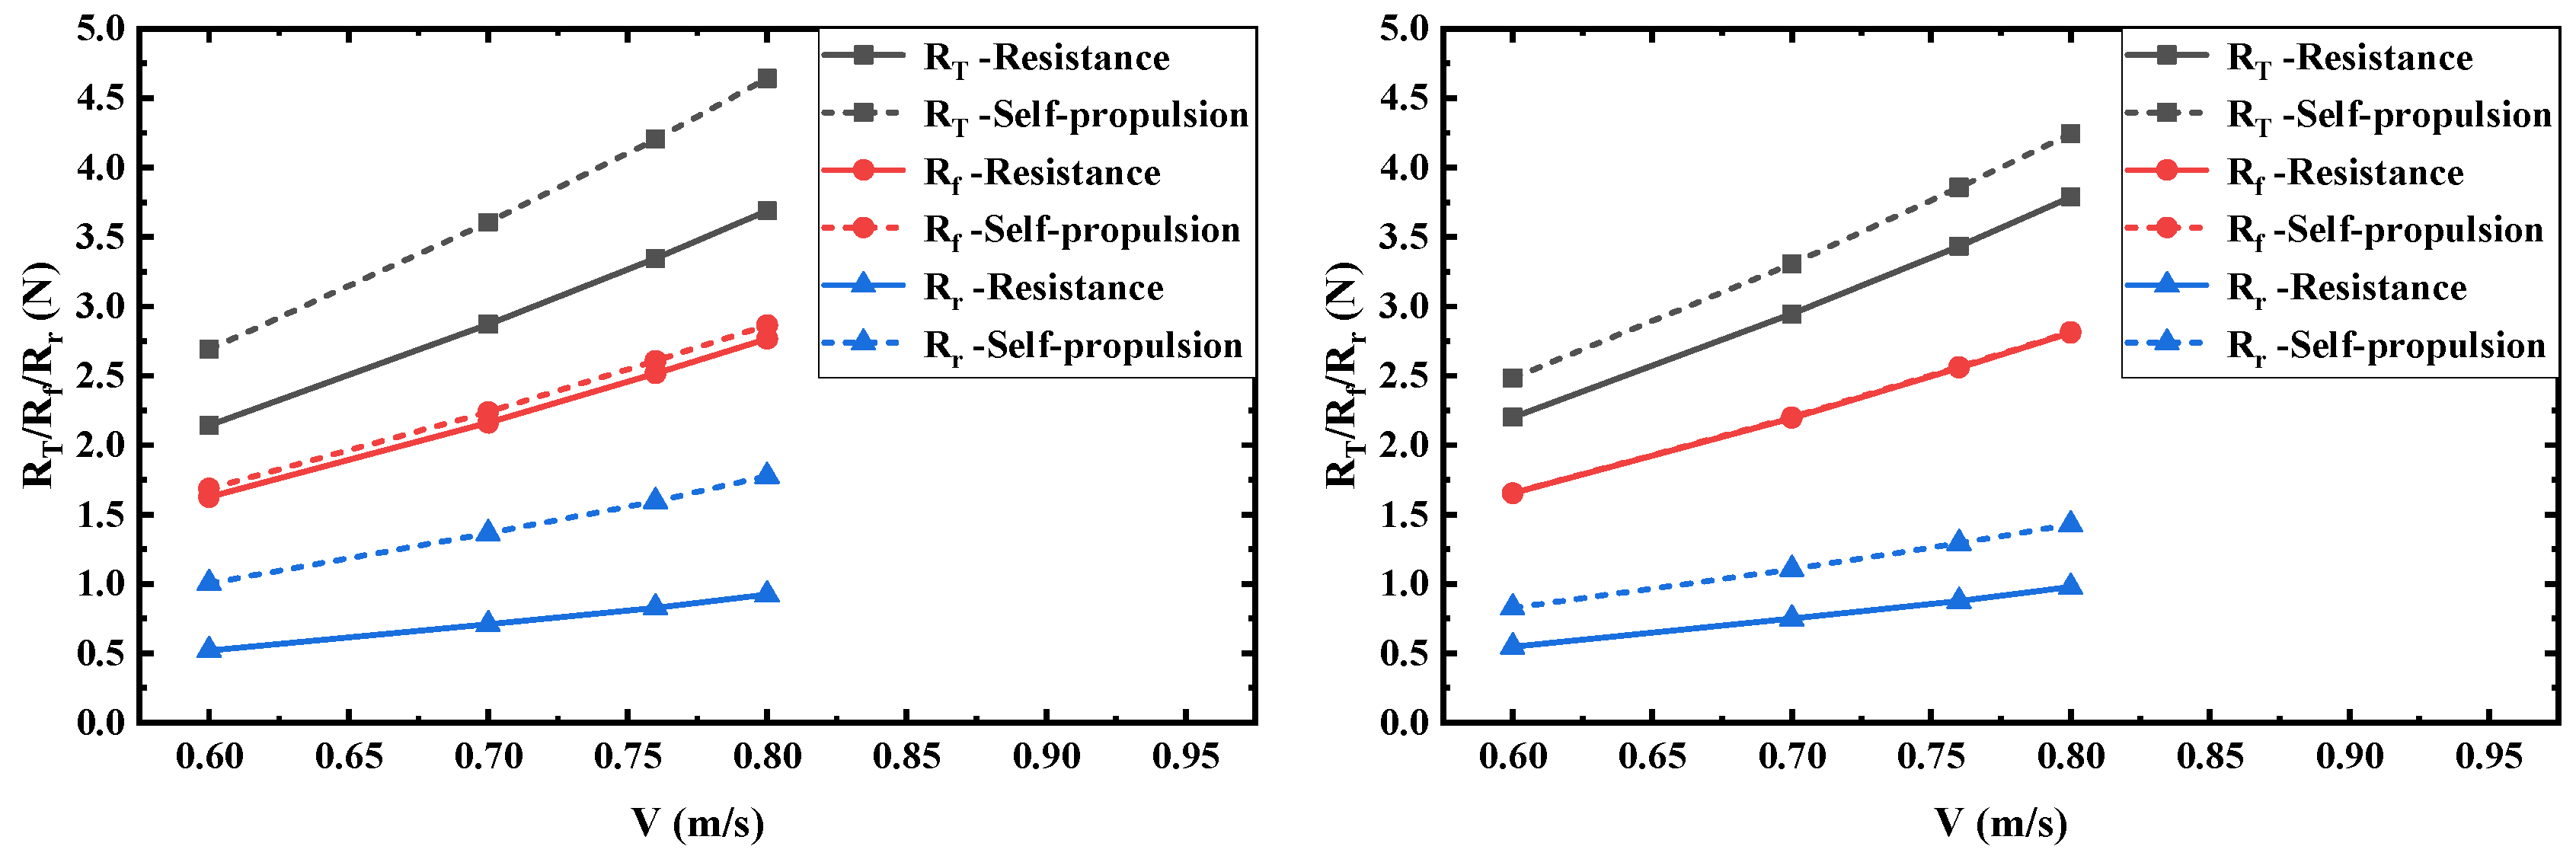
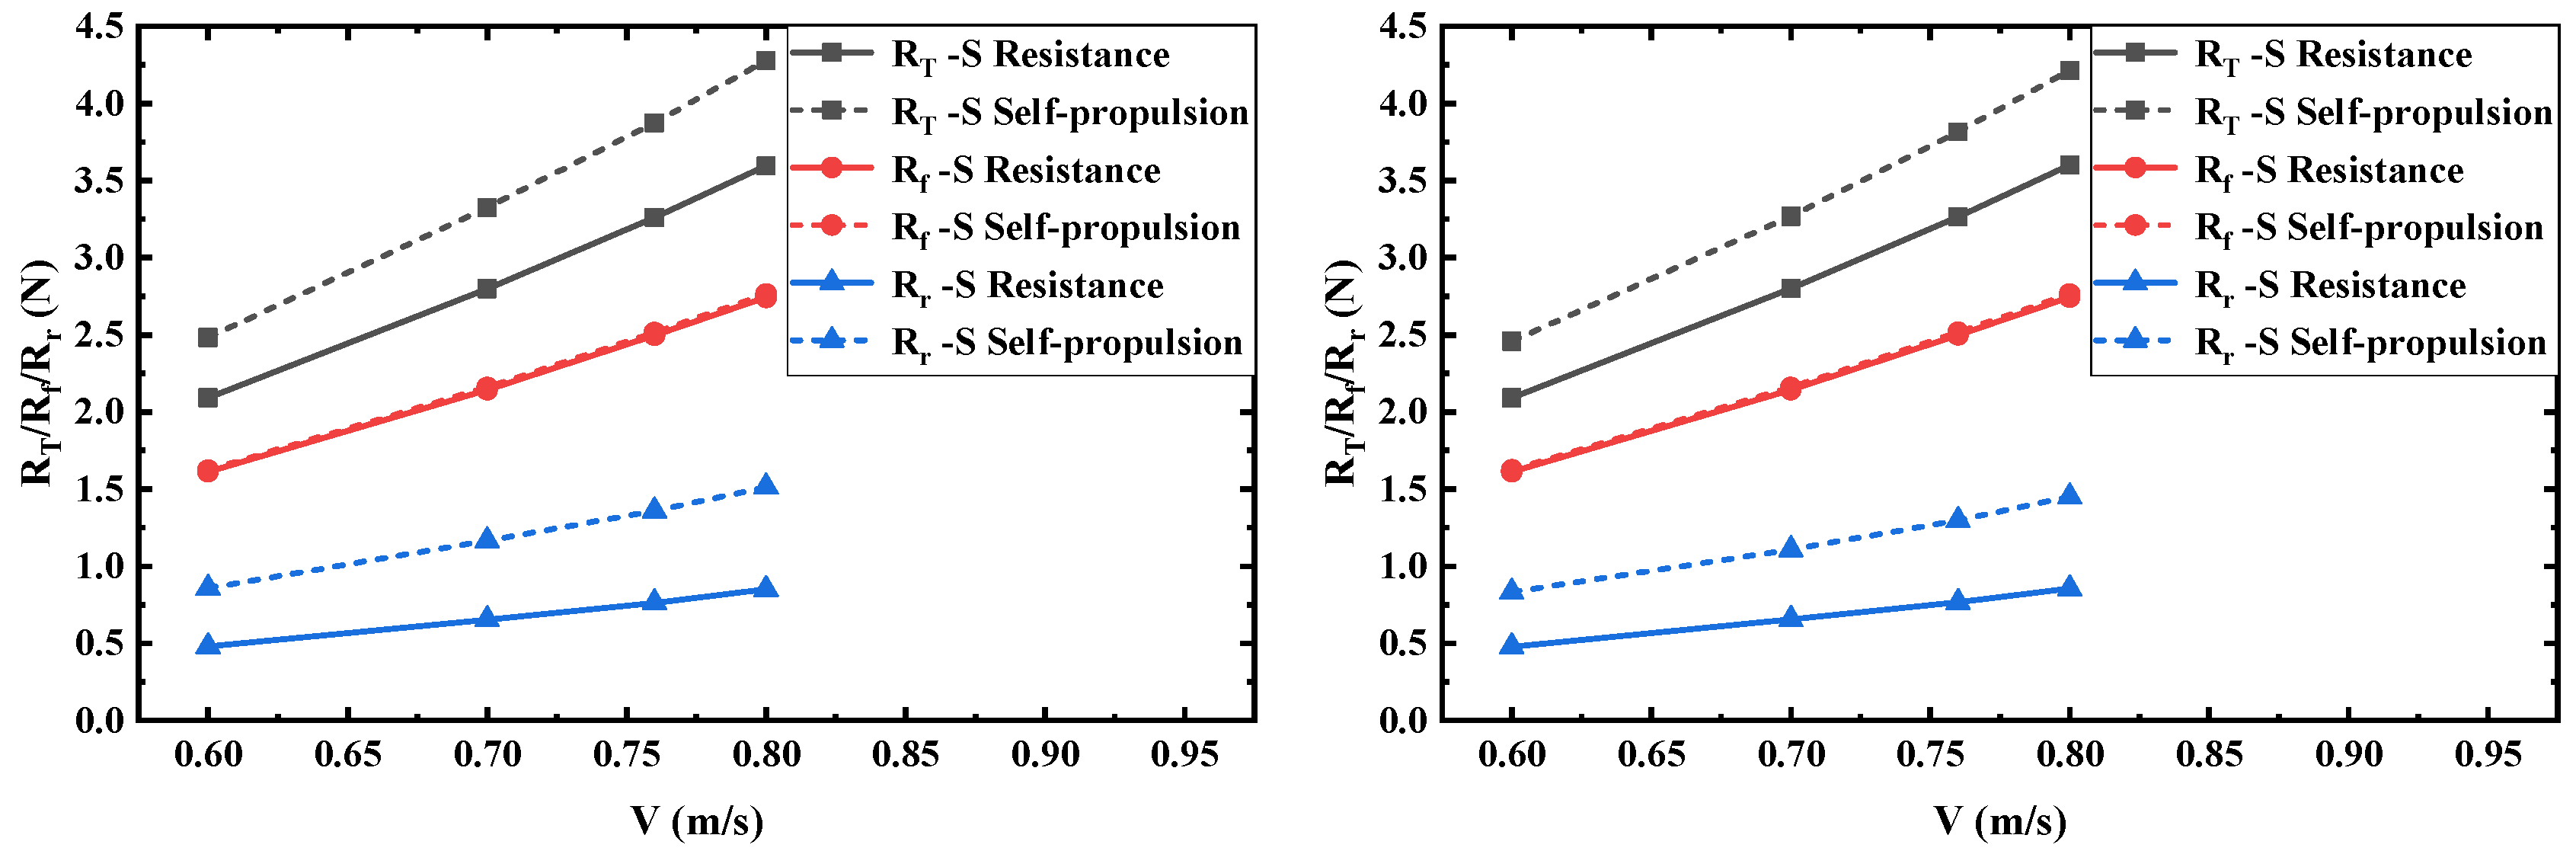
6.1. Results of Ship Resistance Simulation
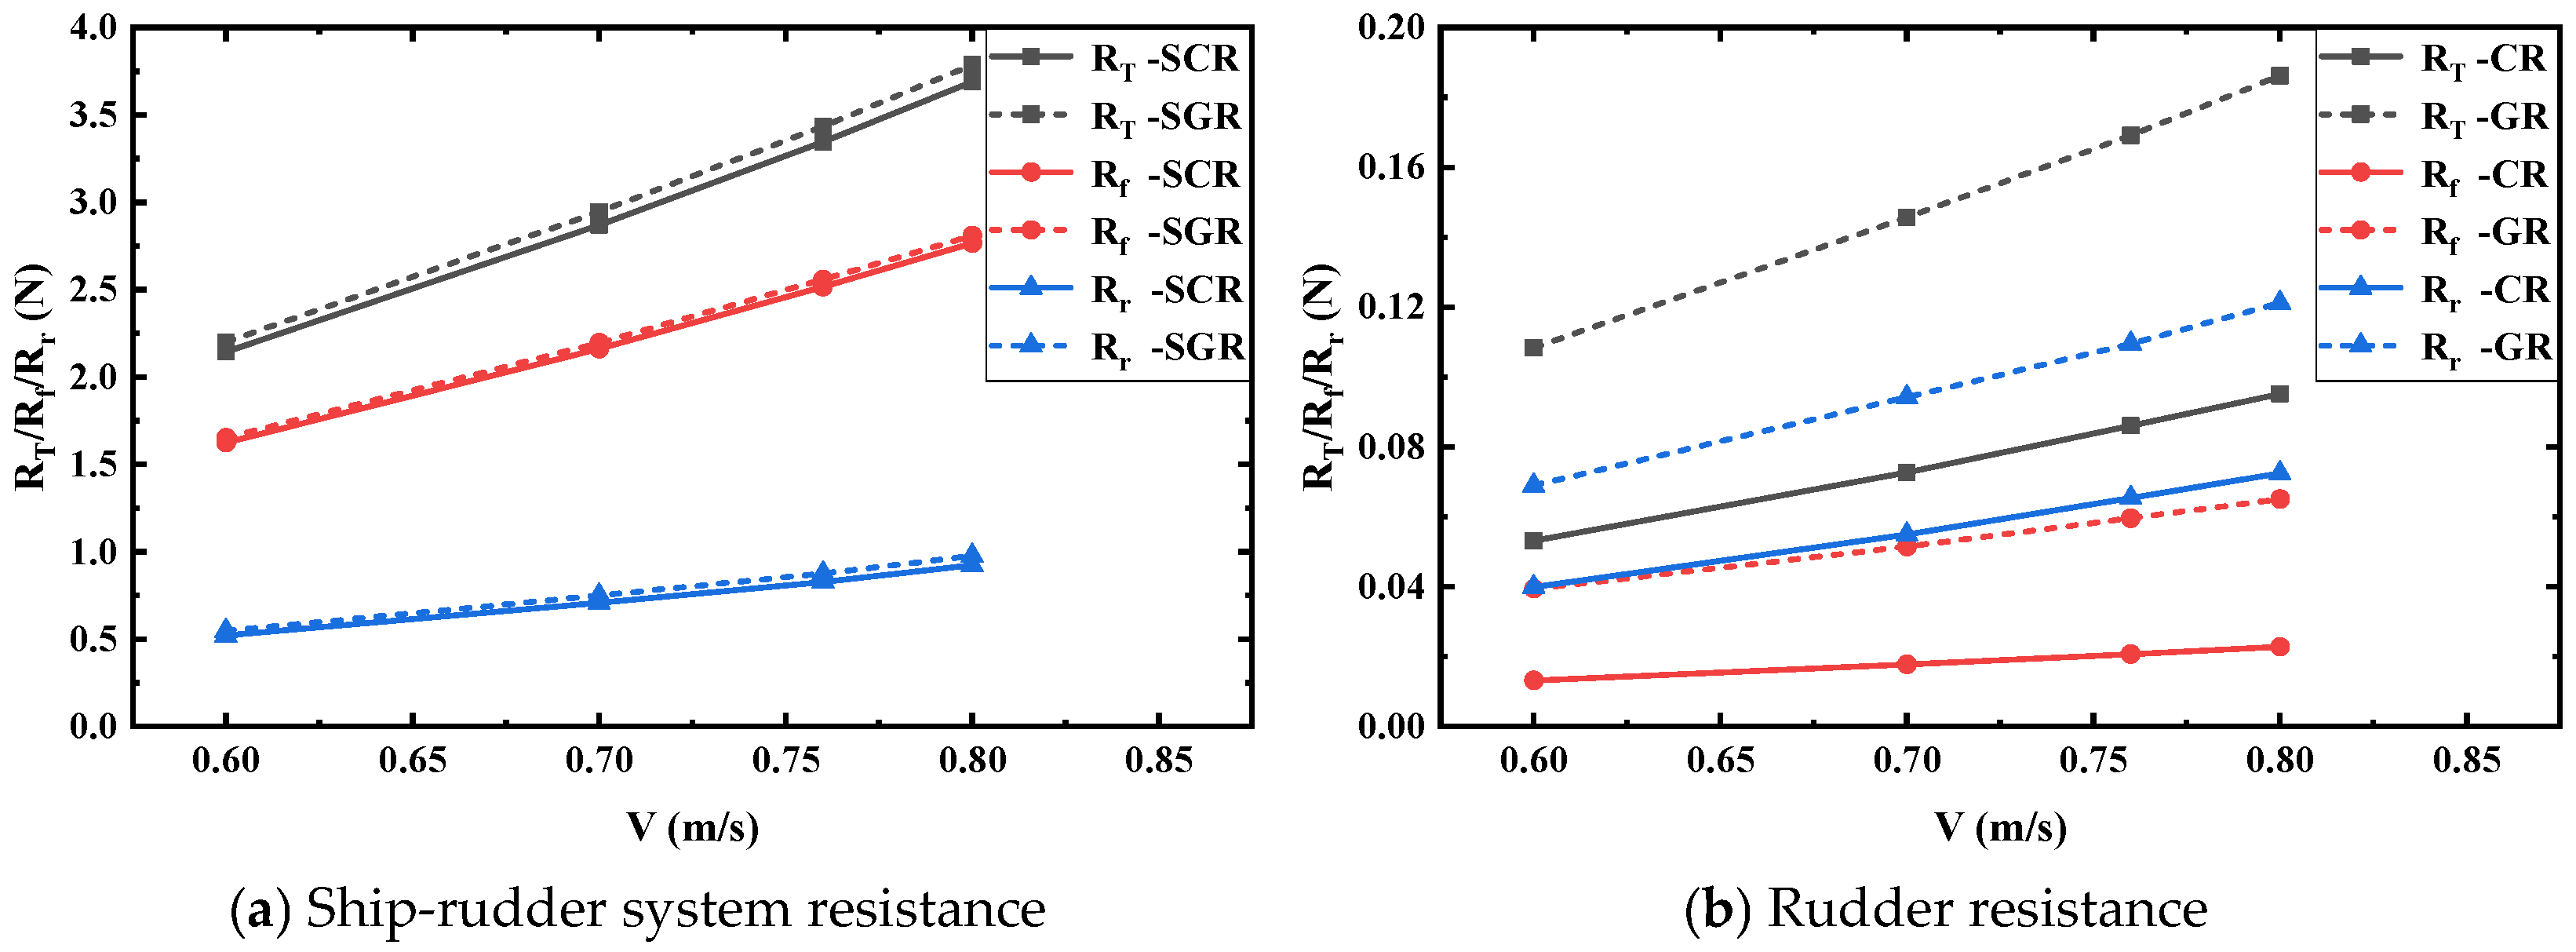
6.1.1. Resistance Characteristics
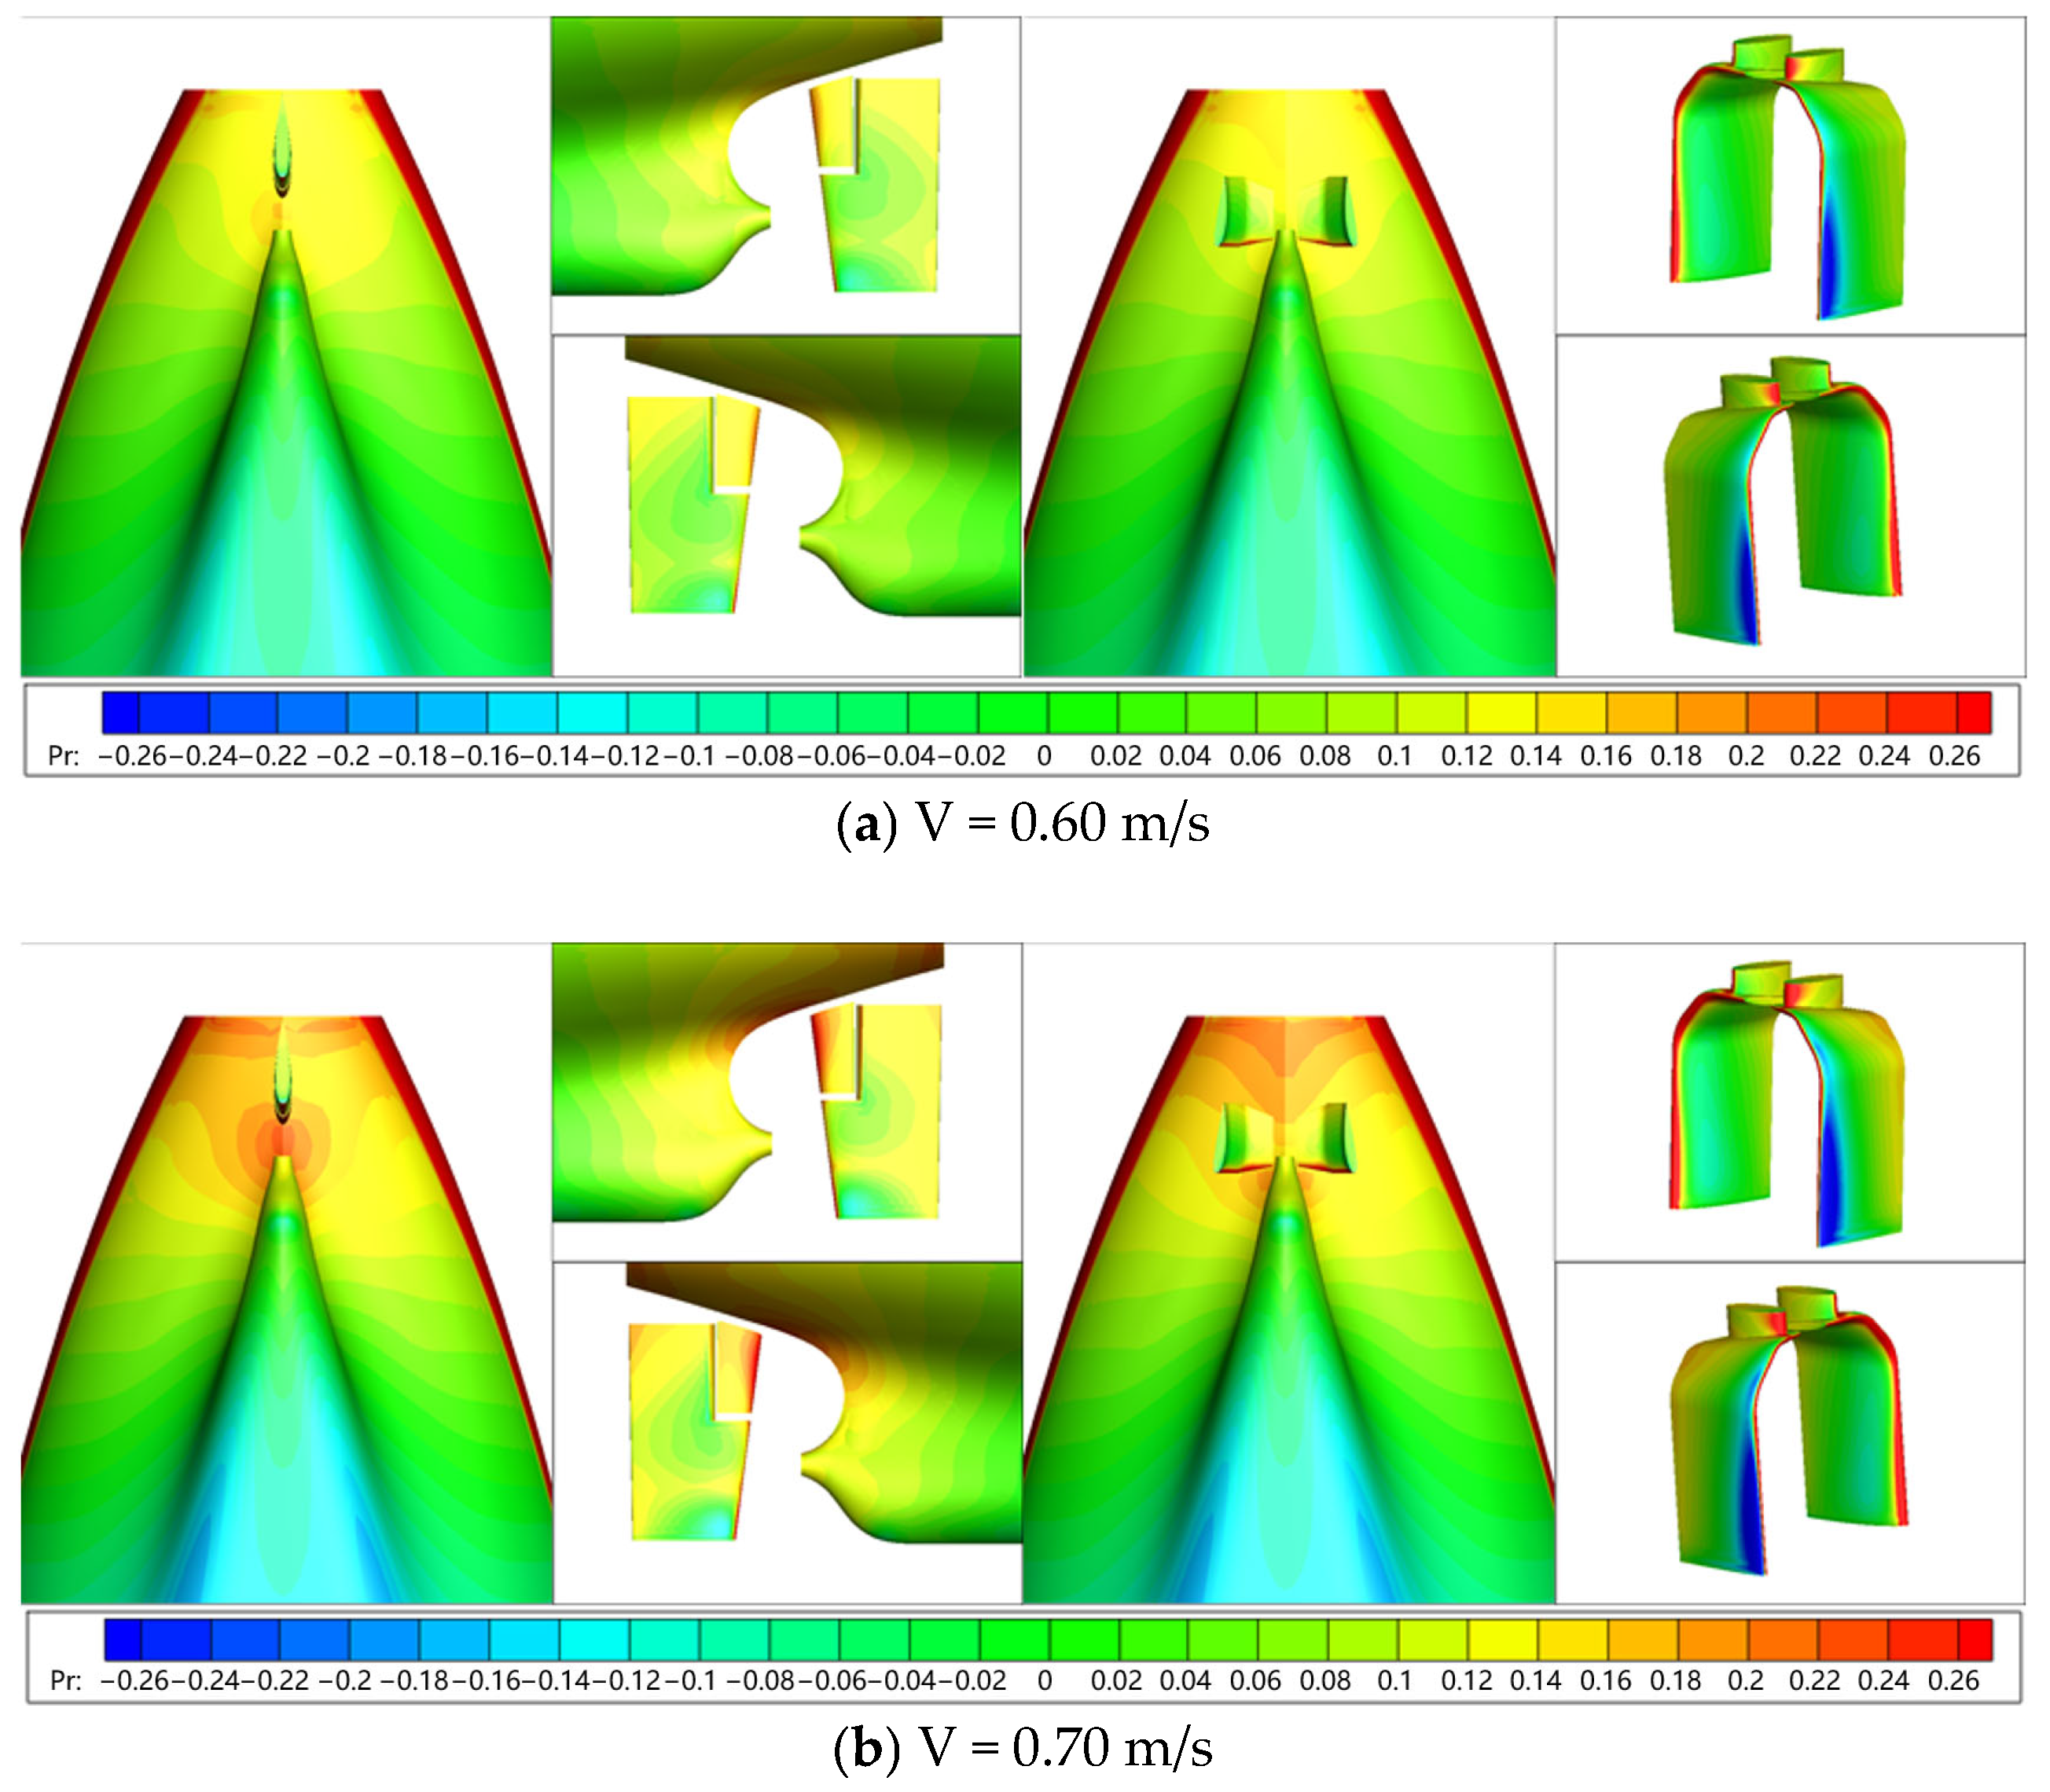
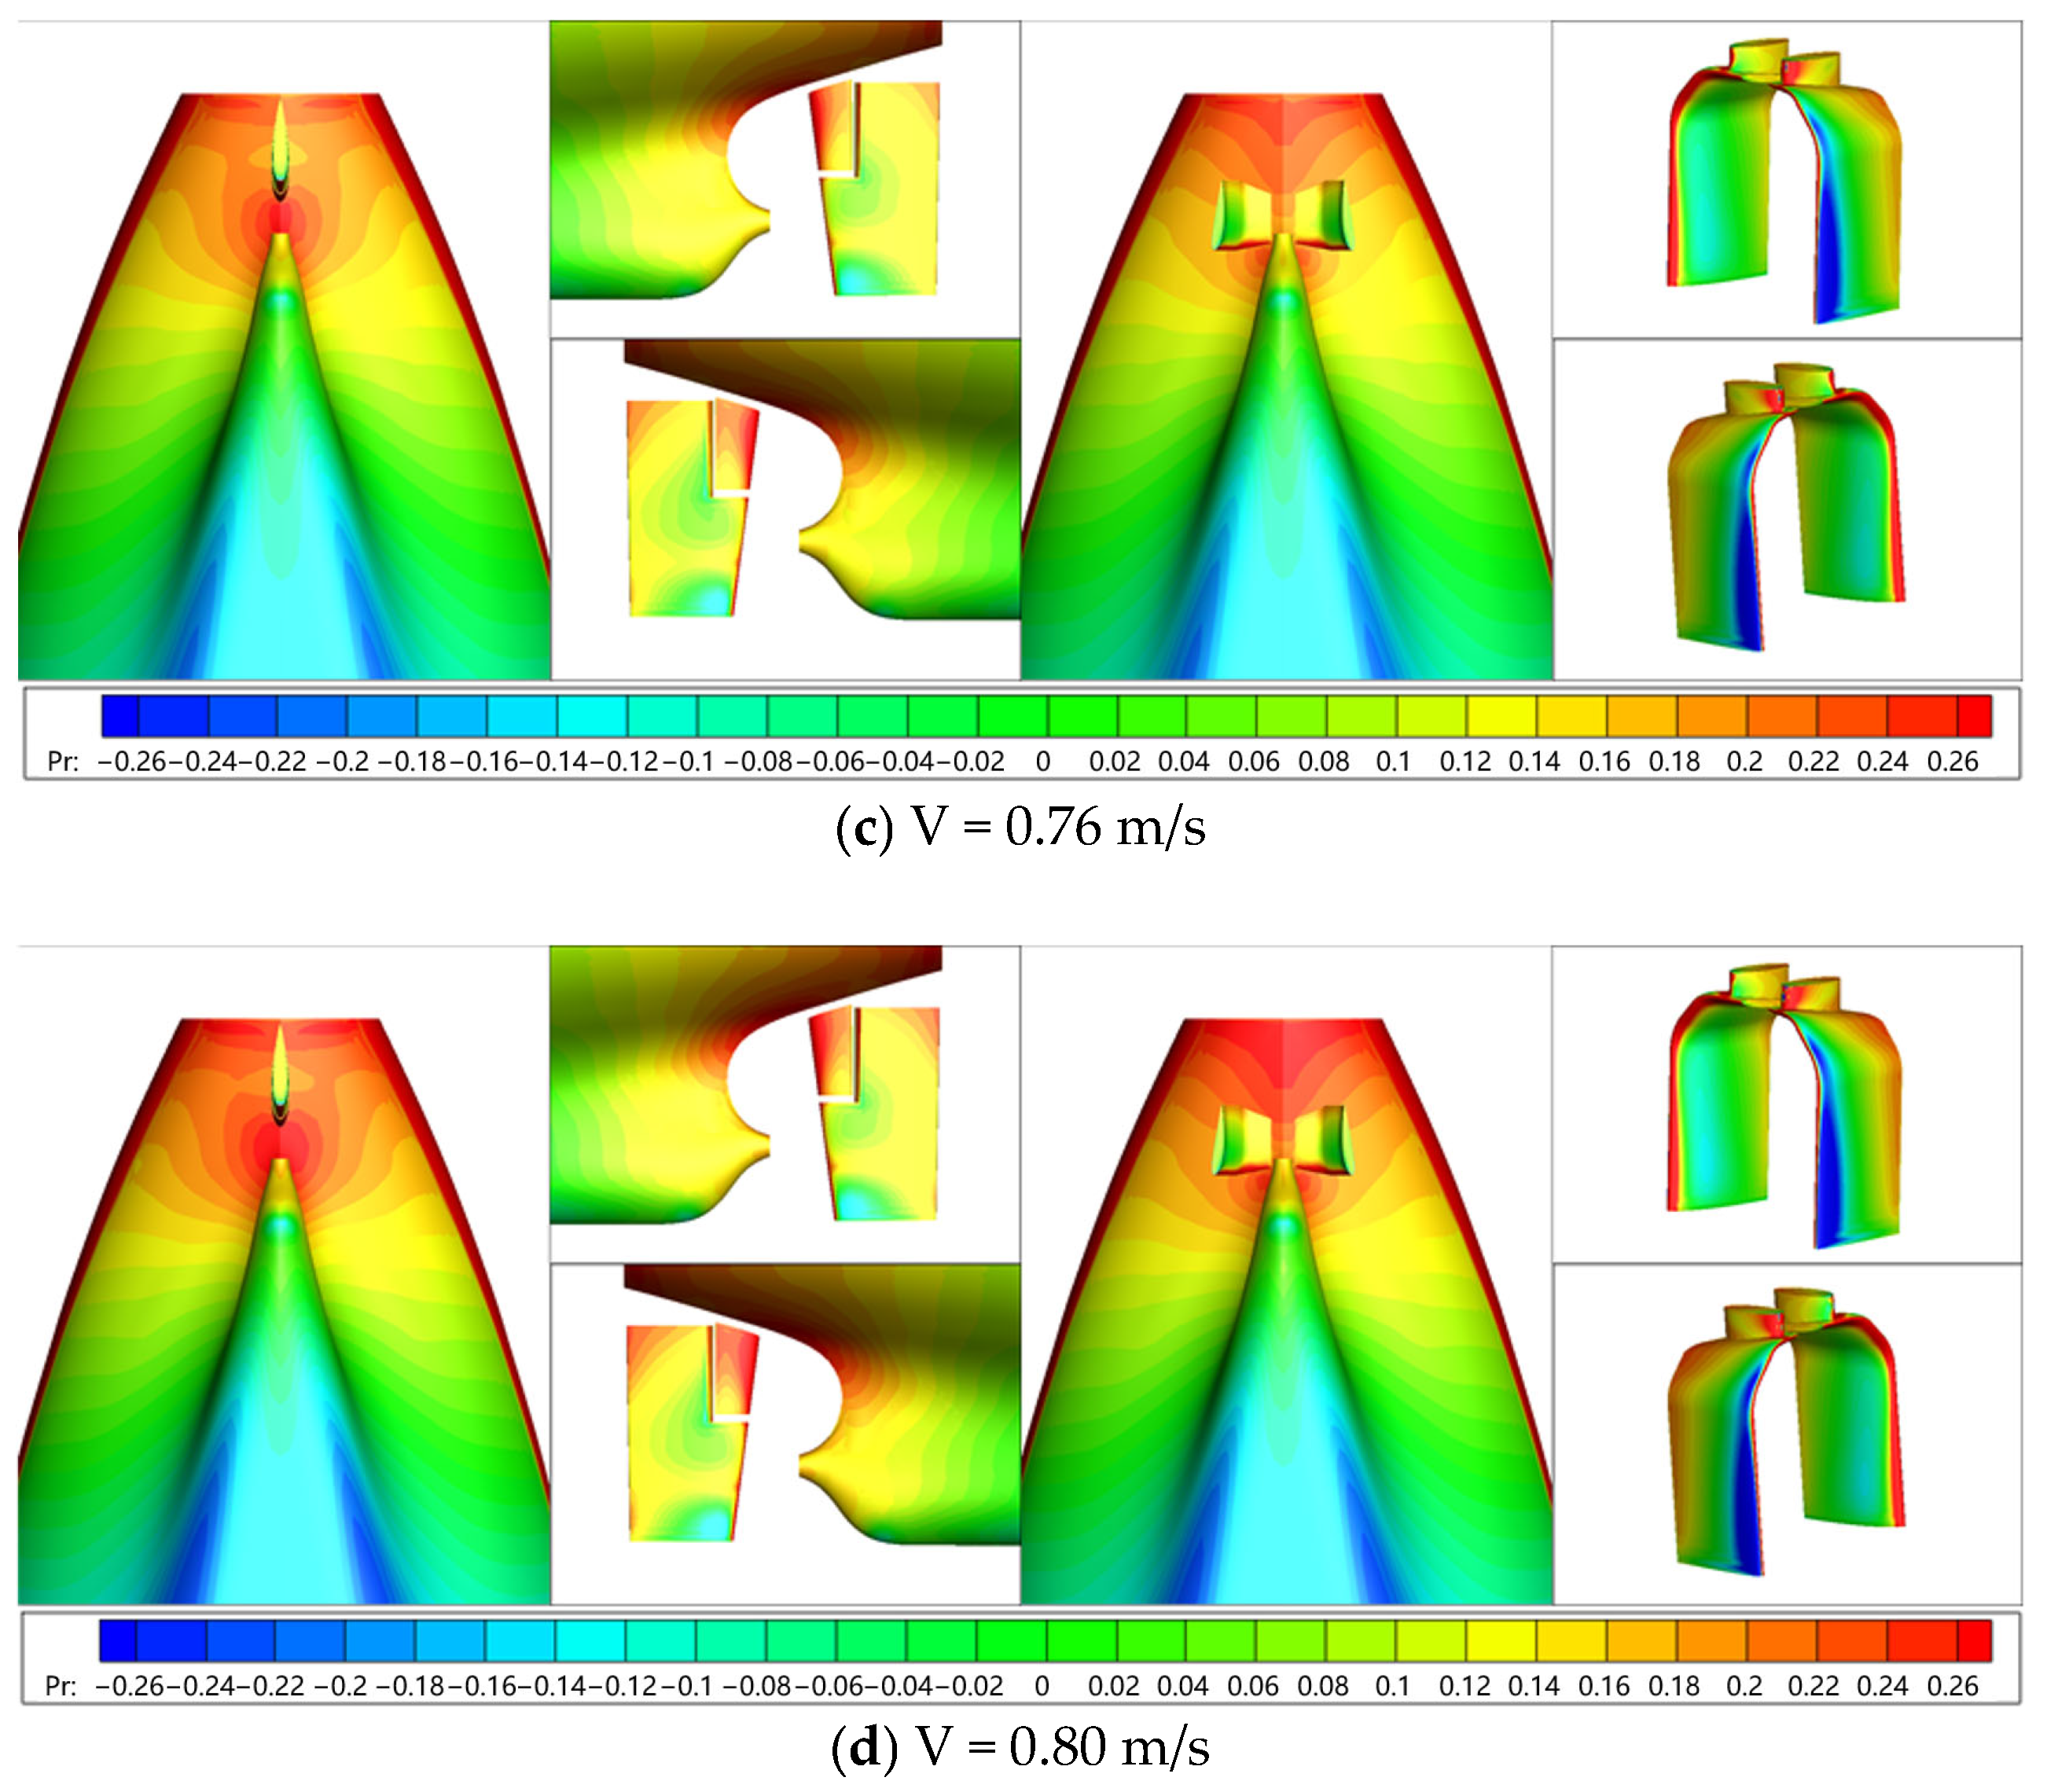
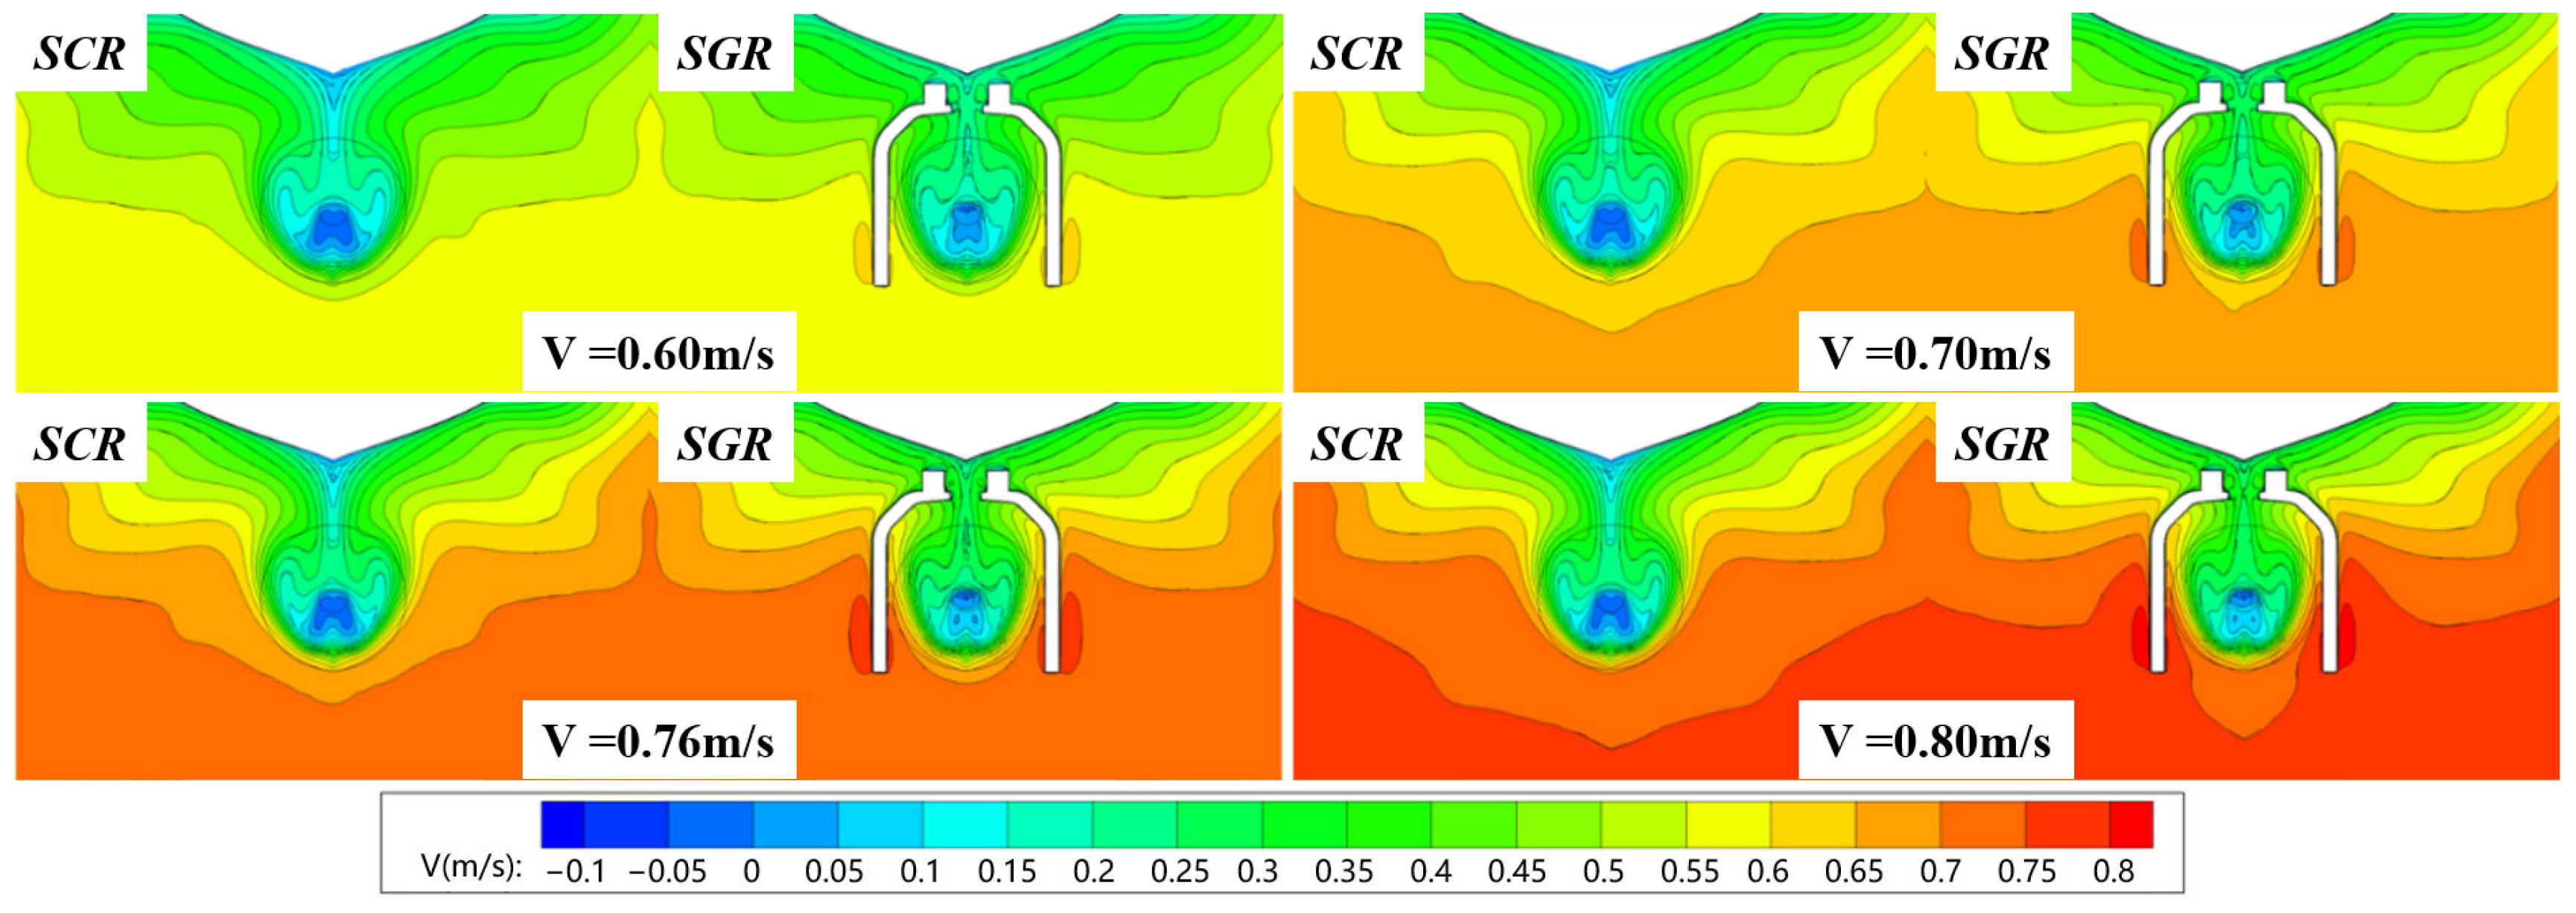
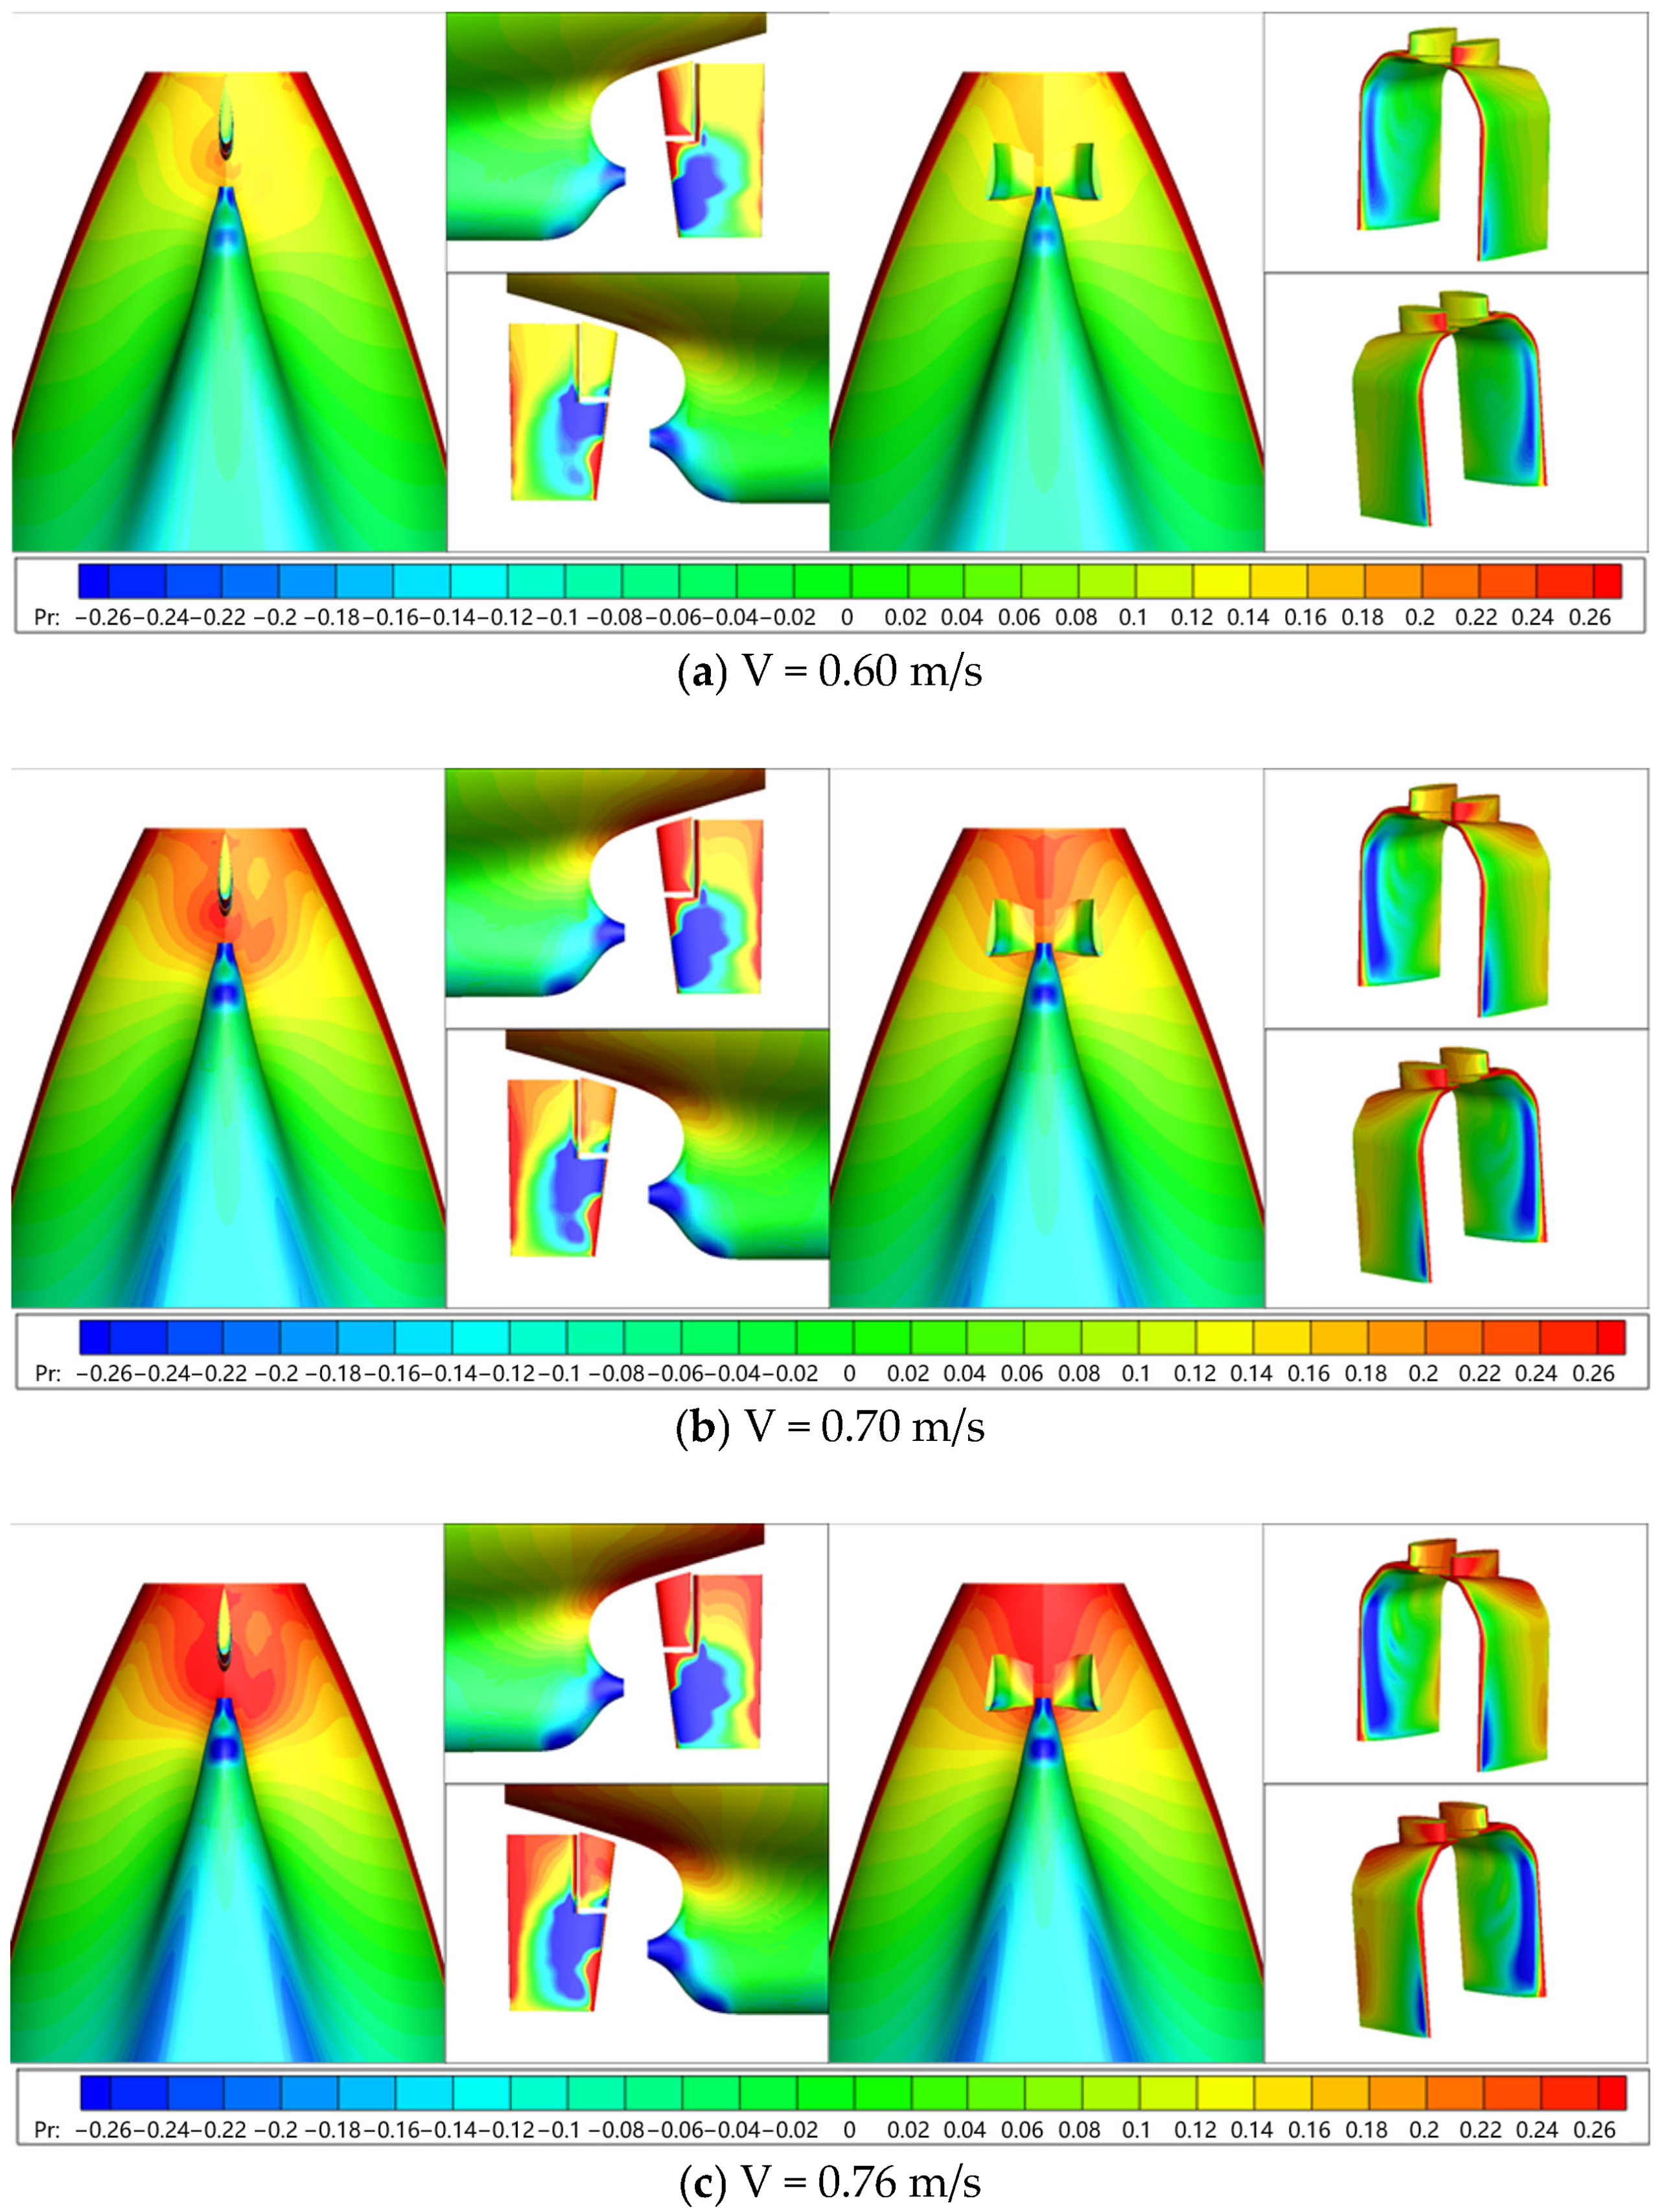
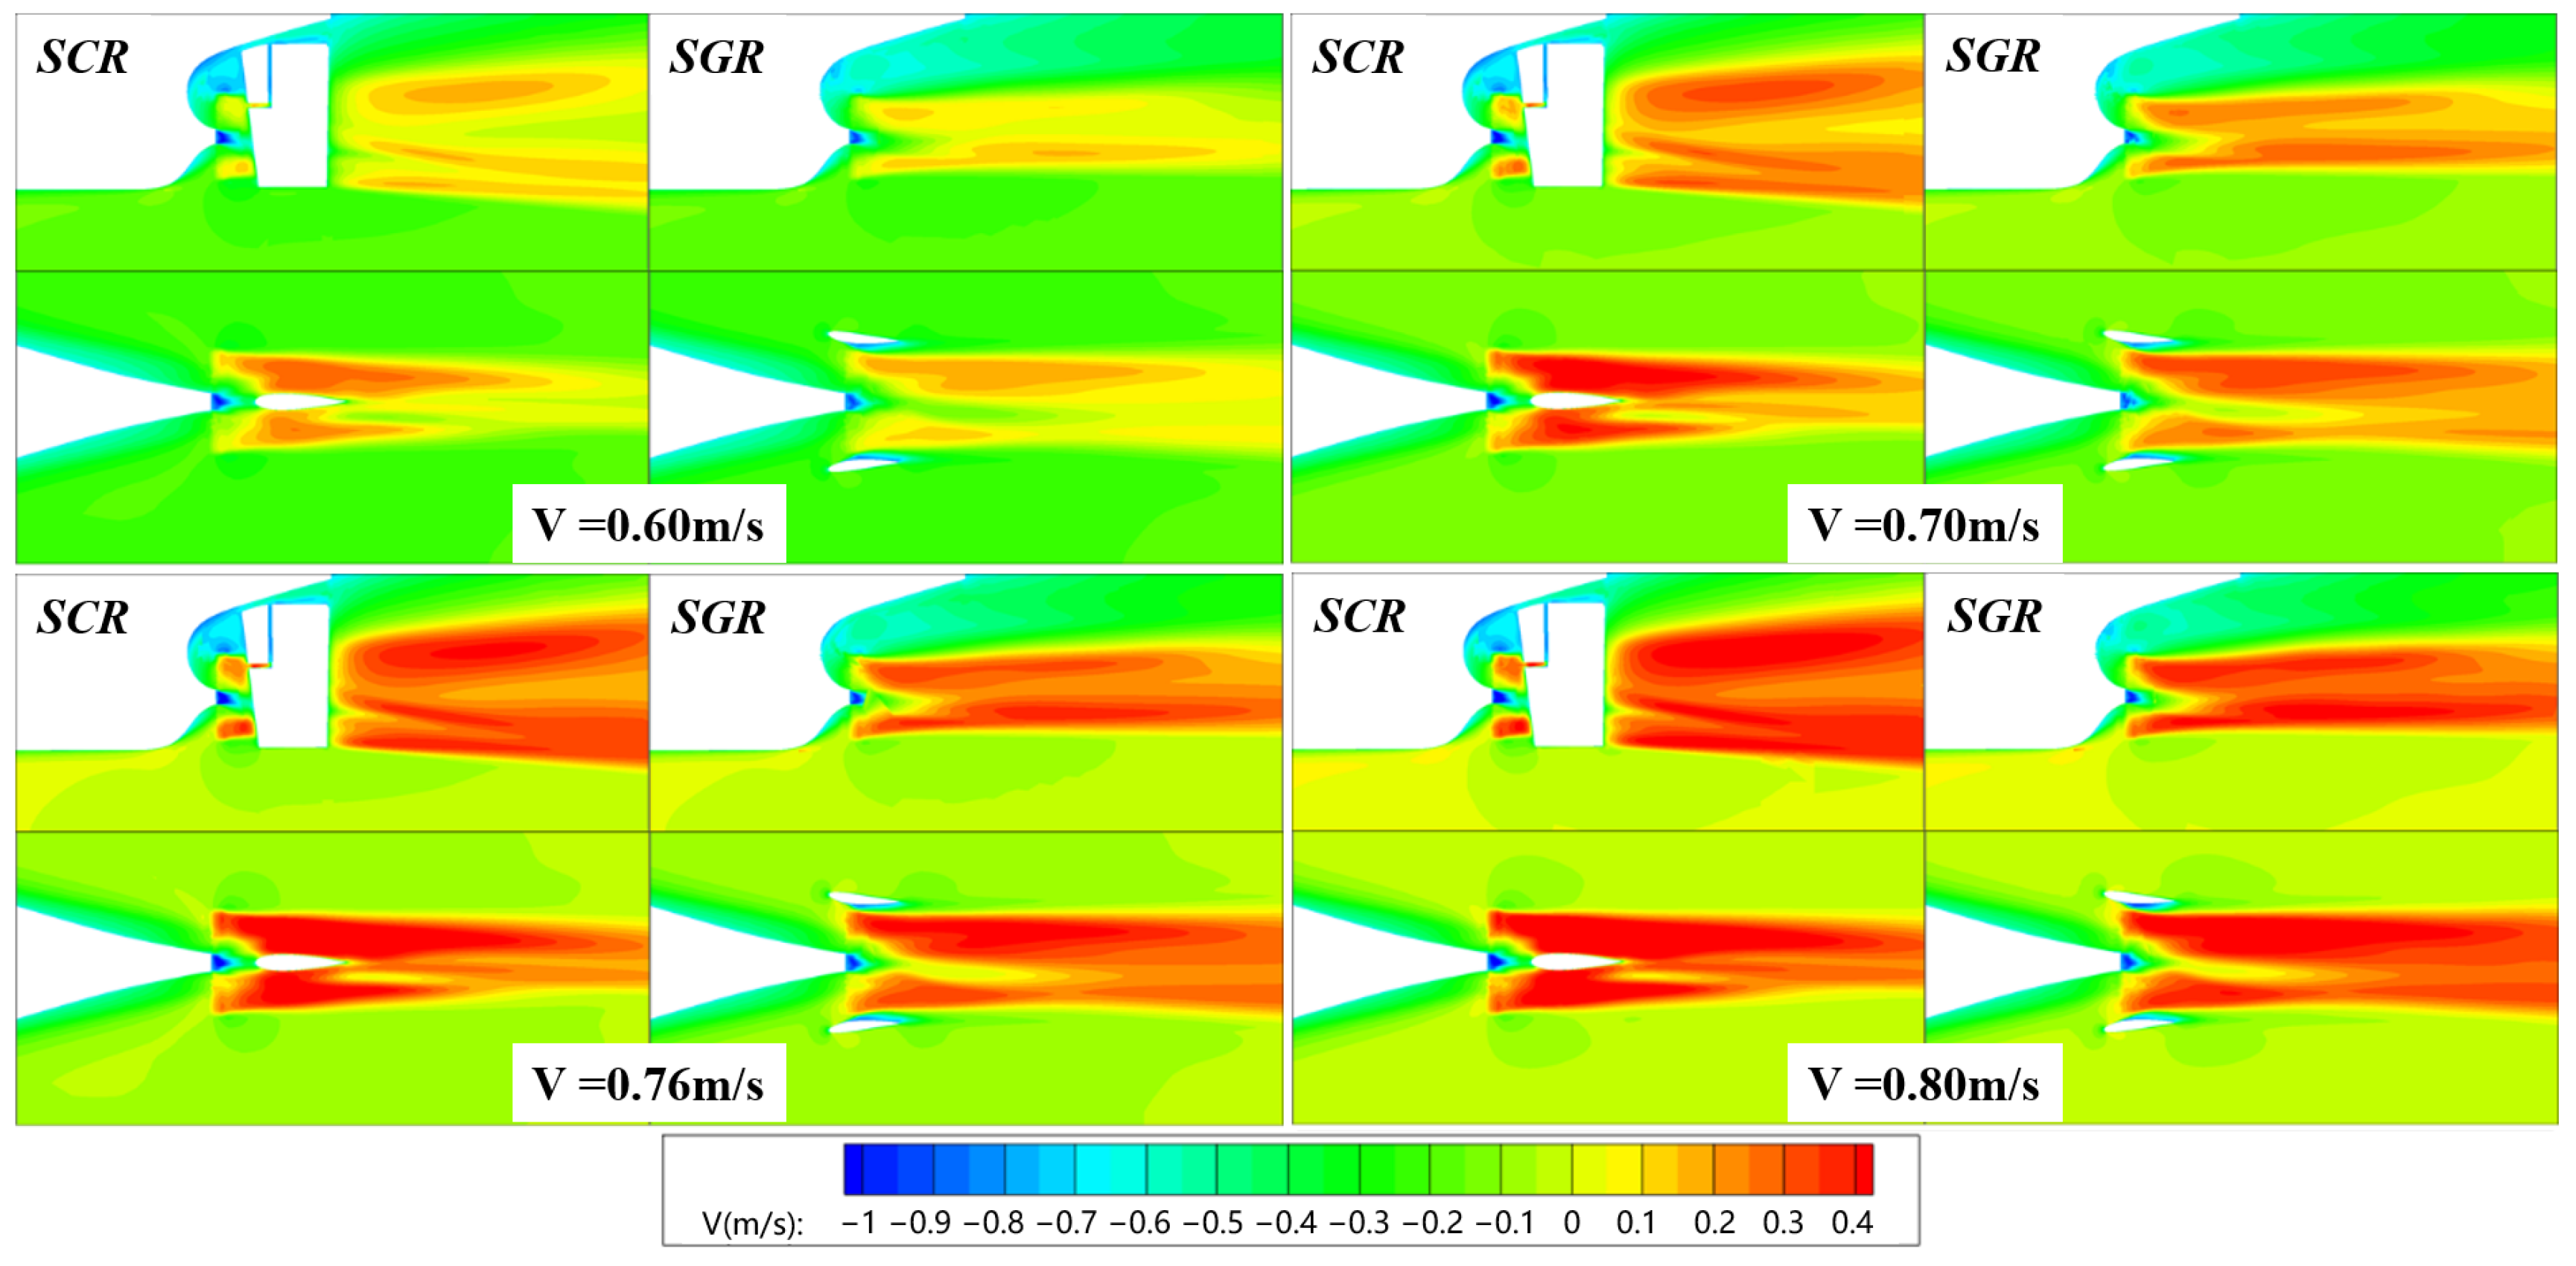
6.1.2. Flow Field Characteristics
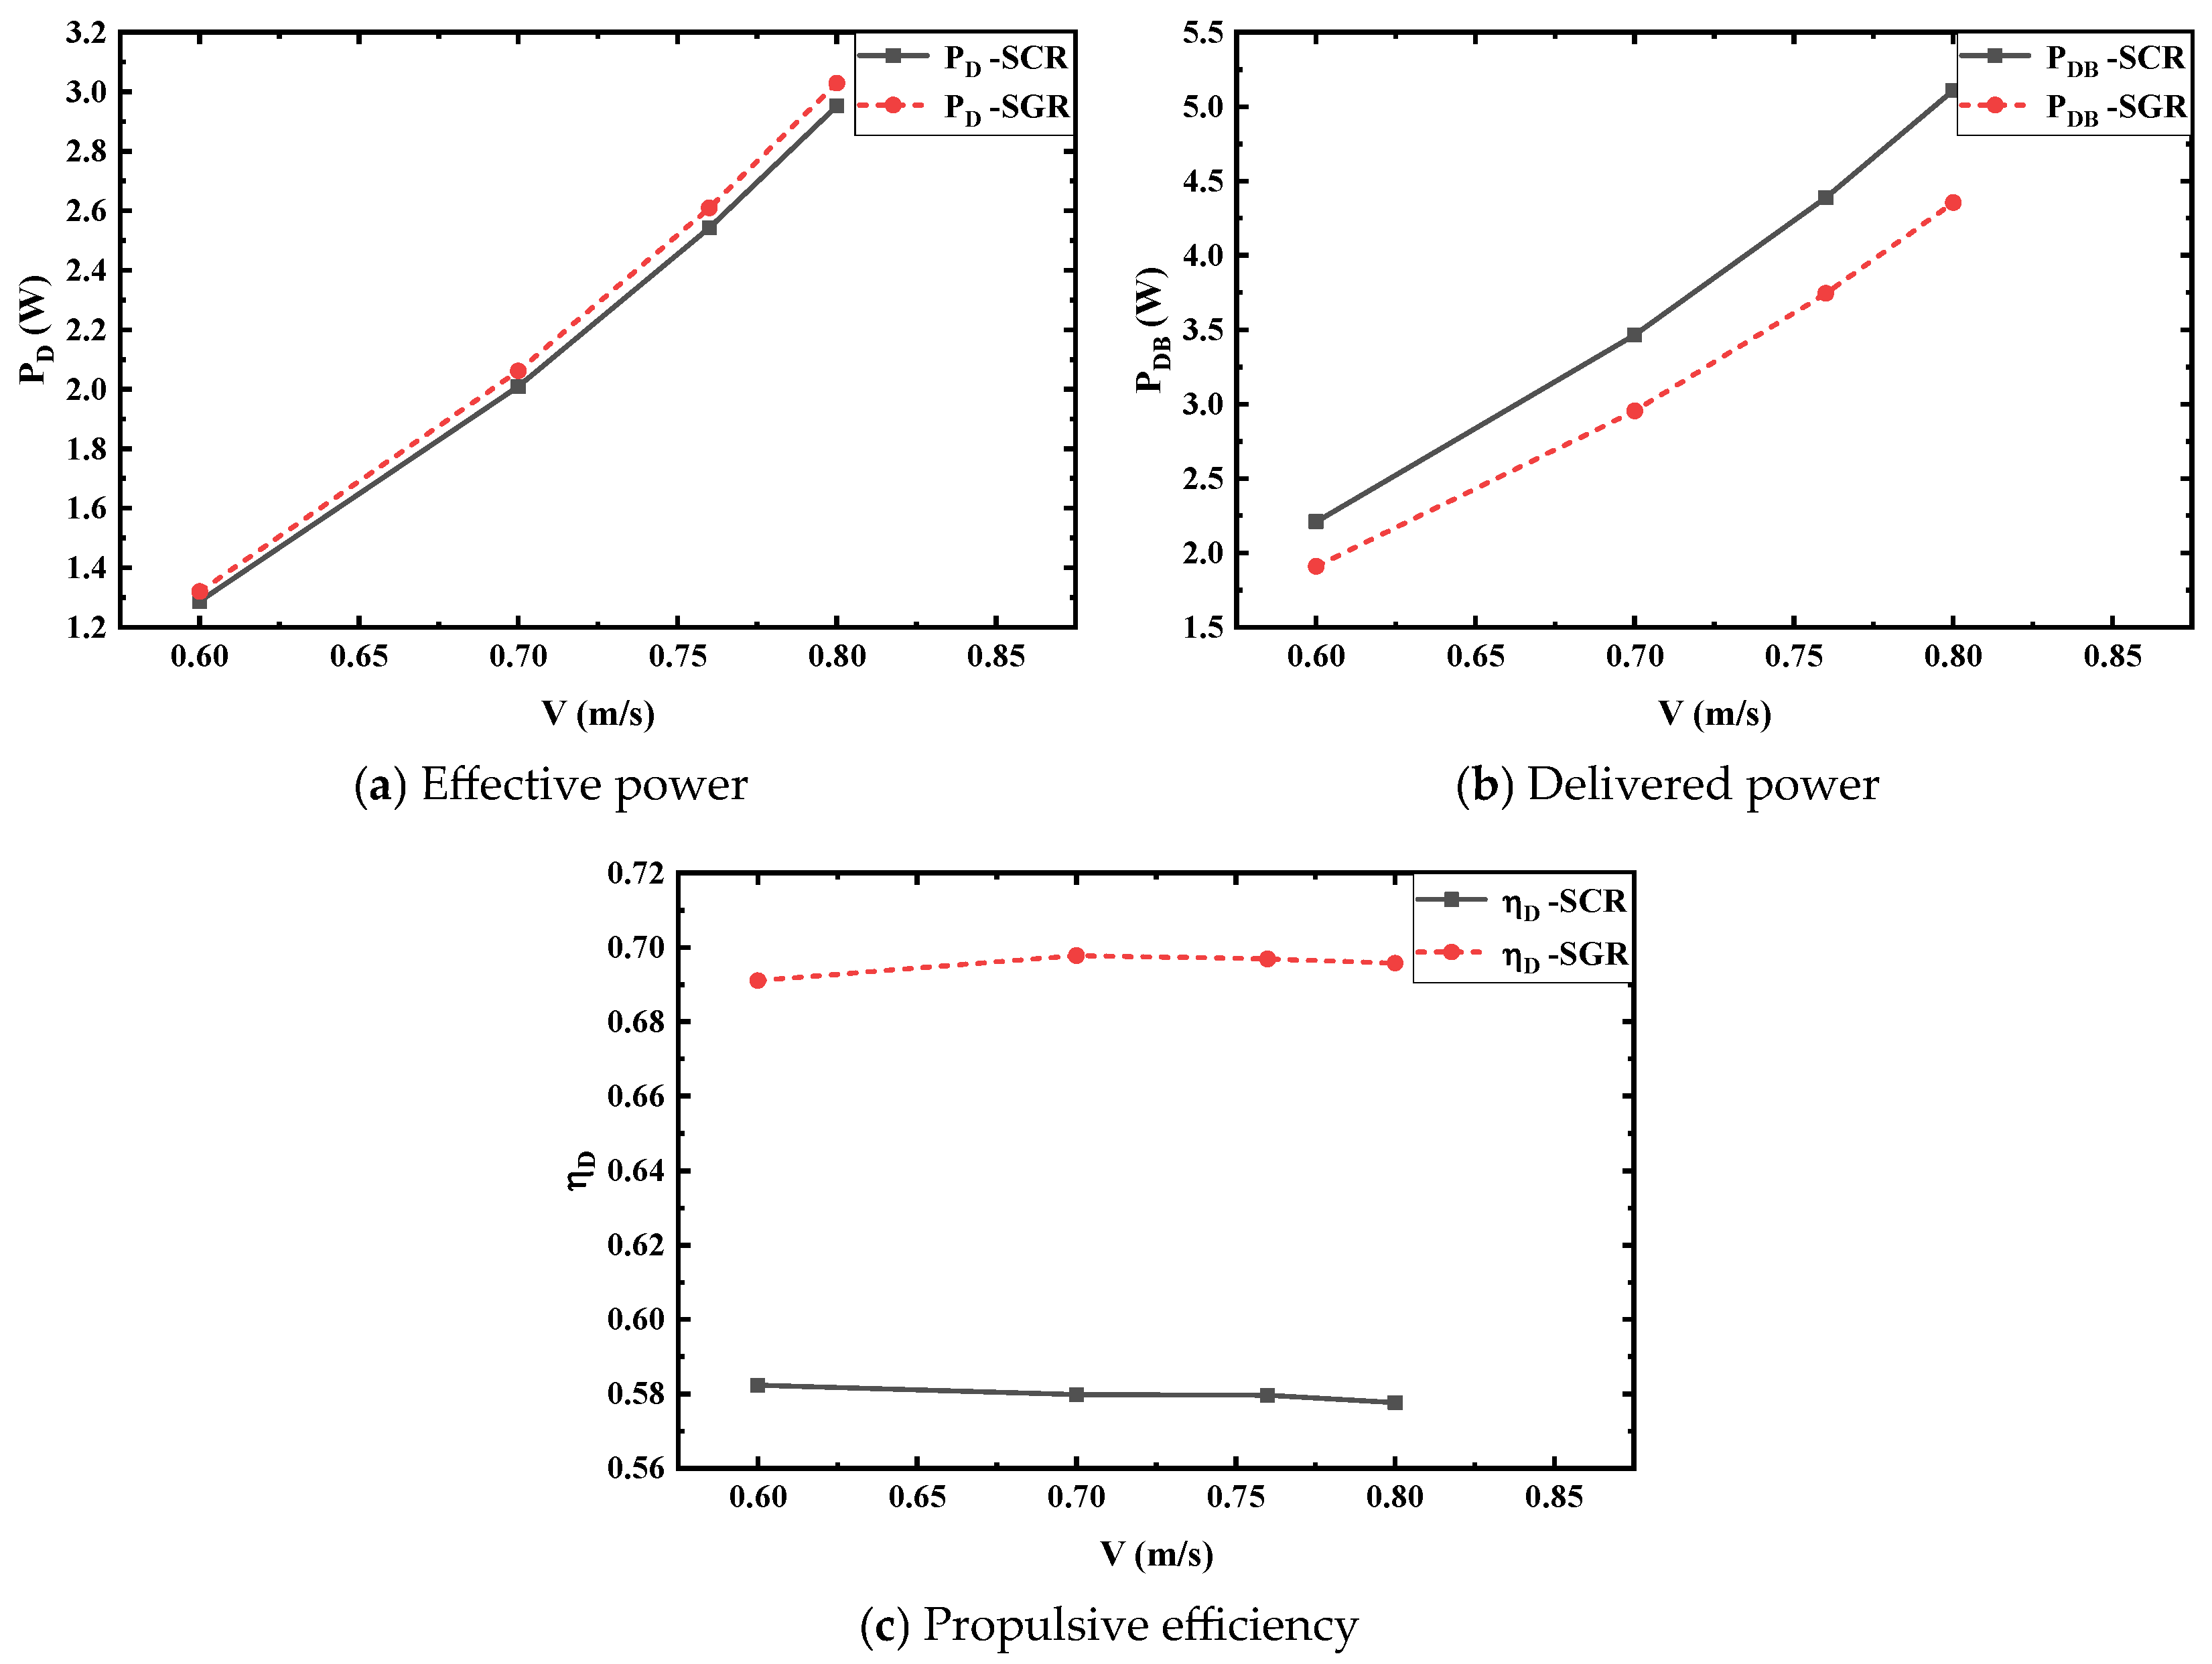
6.2. Results of Ship Self-Propulsion Performance
6.2.1. Self-Propulsion Characteristics
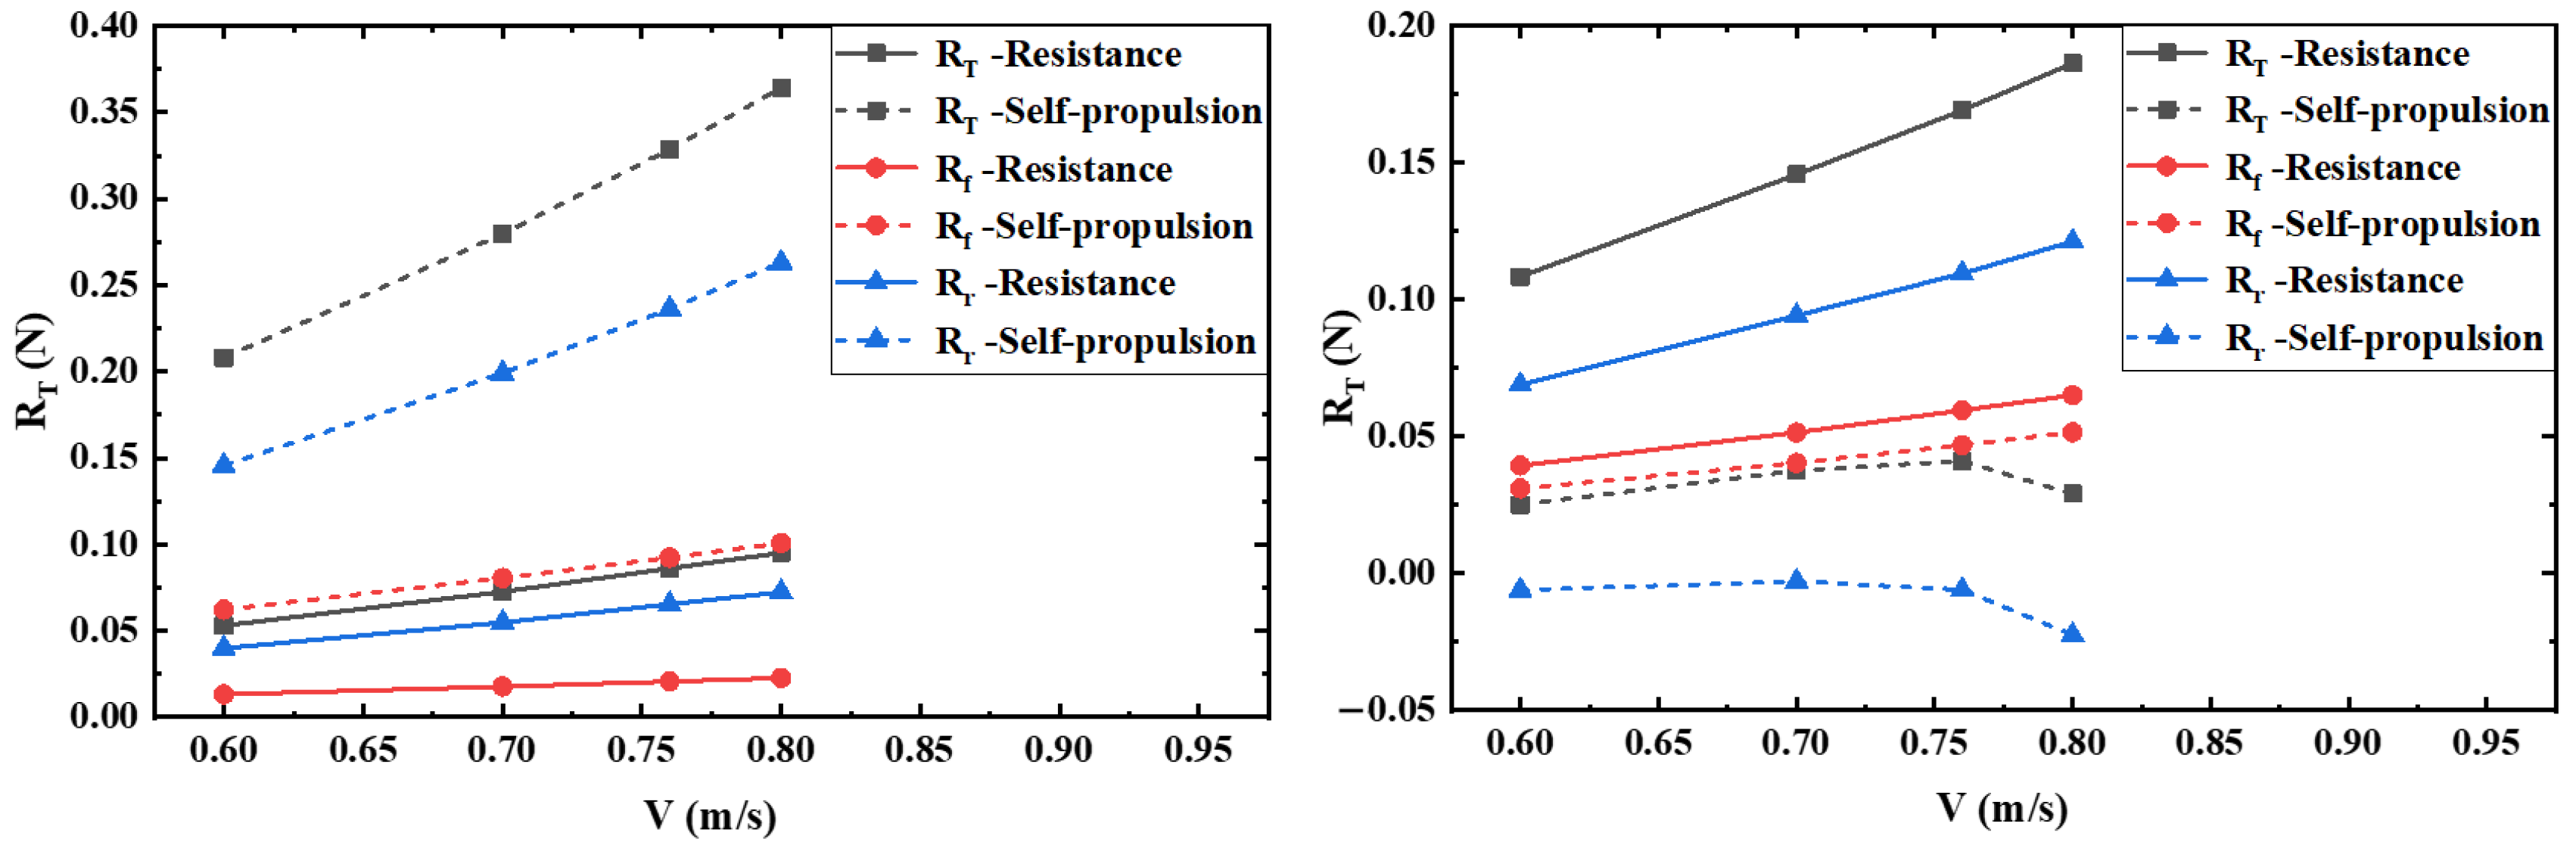
6.2.2. Resistance Components
6.2.3. Flow Field Characteristics
7. Conclusions
Author Contributions
Funding
Data Availability Statement
Conflicts of Interest
References
- Li, L.; Yu, L.; Cai, Z.; Liu, J.; Fan, Q.; Wang, Y. Multi-step optimization with operational scenarios for hull form and propulsor design for pod-driven cruise ships. Heliyon 2024, 10, e40954. [Google Scholar] [CrossRef] [PubMed]
- Zhang, Y. Study on Hydrodynamic Performance of Paddle Rudder Combined Energy-Saving Device Based on CFD Technology. Master’s Thesis, Dalian University of Technology, Dalian, China, 2020. [Google Scholar]
- Nguyen, V.-T.; Chandar, D. Ship specific optimization of pre-duct energy saving devices using reduced order models. Appl. Ocean. Res. 2023, 131, 103449. [Google Scholar] [CrossRef]
- Mewis, F. A Novel Power-Saving Device for Full-Form Vessels. In Proceedings of the First International Symposium on Marine Propulsors, Trondheim, Norway, 22–24 June 2009. [Google Scholar]
- Schneekluth, H. The Wake Equalising Duct. In Proceedings of the International Maritime and Shipping Conference (IMAS ’89), London, UK, 17–28 April 1989; Volume 103, pp. 147–150. [Google Scholar]
- Lu, H.; Li, K.; Dong, L.; Chen, M.; Wang, Y. Optimization design of ship energy-saving duct based on response surface method. J. Dalian Univ. Technol. 2024, 64, 516–525. [Google Scholar]
- Koushan, K.; Krasilnikov, V.; Nataletti, M.; Sileo, L.; Spence, S. Experimental and Numerical Study of Pre-Swirl Stators PSS. J. Mar. Sci. Eng. 2020, 8, 47. [Google Scholar] [CrossRef]
- Gaggero, S.; Martinelli, M. Pre- and post-swirl fins design for improved propulsive performances. Ship Technol. Res. 2021, 69, 31–49. [Google Scholar] [CrossRef]
- Trimulyono, A.; Mulyatno, I.P.; Rachmat, A.F. The Effect of Mewis Duct Energy Saving Device to Propeller Performance. IOP Conf. Ser. Earth Environ. Sci. 2022, 1098, 012076. [Google Scholar] [CrossRef]
- Guiard, T.; Leonard, S.; Mewis, F. The Becker Mewis Duct®-Challenges in Full-Scale Design and new Developments for Fast Ships. In Proceedings of the Symposium on Marine Propulsors 2013, Launceston, Tasmania, Australia, 5–8 May 2013. [Google Scholar]
- Nowruzi, H.; Najafi, A. An experimental and CFD study on the effects of different pre-swirl ducts on propulsion performance of series 60 ship. Ocean. Eng. 2019, 173, 491–509. [Google Scholar] [CrossRef]
- Kang, J.-G.; Kim, M.-C.; Shin, Y.-J. Study on Compact Pre-Swirl Duct for Slender Aft-Body Crude Oil Carrier. J. Mar. Sci. Eng. 2022, 10, 396. [Google Scholar] [CrossRef]
- Mizzi, K.; Demirel, Y.K.; Banks, C.; Turan, O. Design optimisation of Propeller Boss Cap Fins for enhanced propeller performance. Appl. Ocean. Res. 2017, 62, 210–222. [Google Scholar] [CrossRef]
- Zhu, X.; Huang, S.; Guo, C.; Shan, T. Design and performance of a skew rudder behind a propeller. J. Harbin Eng. Univ. 2008, 2, 126–129. [Google Scholar]
- Sasaki, N. ZEUS and NOAH Projects of NMRI. In Proceedings of the Third International Symposium on Marine Propulsors smp’13, Launceston, Tasmania, Australia, 5–8 May 2013. [Google Scholar]
- Sasaki, N.; Kuribayashi, S.; Fukazawa, M.; Atlar, M. Towards a Realistic Estimation of the Powering Performance of a Ship with a Gate Rudder System. J. Mar. Sci. Eng. 2020, 8, 43. [Google Scholar] [CrossRef]
- Sasaki, N.; Atlar, M.; Kuribayashi, S. Advantages of twin rudder system with asymmetric wing section aside a propeller: The new hull form with twin rudders utilizing duct effects. J. Mar. Sci. Technol. 2016, 21, 297–308. [Google Scholar] [CrossRef]
- Sasaki, N.; Atlar, M. Investigation into the propulsive efficiency characteristics of a ship with the Gate Rudder propulsion. In Proceedings of the A. Yücel Odabas¸ı Colloquium Series 3rd International Meeting on Progress in Propeller Cavitation and Its Consequences: Experimental and Computational Methods for Predictions, Istanbul, Turkey, 15–16 November 2018; pp. 99–107. [Google Scholar]
- Sasaki, N.; Kuribayashi, S.; Atlar, M.; Co, K. Gate Rudder. In Proceedings of the INT-NAM2018, Istanbul, Turkey, 23–25 April 2018. [Google Scholar]
- Tacar, Z.; Sasaki, N.; Atlar, M.; Korkut, E. An investigation into effects of Gate Rudder® system on ship performance as a novel energy-saving and manoeuvring device. Ocean. Eng. 2020, 218, 108250. [Google Scholar] [CrossRef]
- Hussain, M.D.; Karim, M.M.; Sasaki, N. Numerical assessment of the scale effects on the propulsive performance of a ship with gate rudder system. Ocean. Eng. 2022, 249, 110889. [Google Scholar] [CrossRef]
- Uyan, E.; Atlar, M.; Gürsoy, O. Energy Use and Carbon Footprint Assessment in Retrofitting a Novel Energy Saving Device to a Ship. J. Mar. Sci. Eng. 2024, 12, 1879. [Google Scholar] [CrossRef]
- Turkmen, S.; Fukazawa, M.; Sasaki, N.; Atlar, M. Cavitation Tunnel Tests and Full-Scale Review of the First Gate Rudder System Installed on the 400TEU Container Ship. In Proceedings of the A. Yücel Odabaşı Colloquium Series: 3rd International Meeting, Istanbul, Turkey, 15–16 November 2018. [Google Scholar]
- Turkmen, S.; Carchen, A.; Sasaki, N.; Atlar, M. A New Energy Saving Twin Rudder System-Gate Rudder. In Proceedings of the International Conference on Shipping in Changing Climates, Newcastle, UK, 10–11 November 2016. [Google Scholar]
- Yilmaz, N.; Türkmen, S.; Aktas, B.; Fitzsimmons, P.; Sasaki, N.; Atlar, M. Tip Vortex Cavitation Simulation of a Propeller in a Gate Rudder System. In Proceedings of the A. Yücel Odabaşı Colloquium Series 3rd International Meeting, Istanbul, Turkey, 15–16 November 2018. [Google Scholar]
- Menter, F.R. Two-equation eddy-viscosity turbulence models for engineering applications. AIAA J. 1994, 32, 1598–1605. [Google Scholar] [CrossRef]
- Howell, L.H.; Bell, J.B. An Adaptive Mesh Projection Method for Viscous Incompressible Flow. SIAM J. Sci. Comput. 1997, 18, 996–1013. [Google Scholar] [CrossRef]
- Sethian, J.A.; Smereka, P. Level set methods for fluid interfaces. Annu. Rev. Fluid Mech. 2003, 35, 341–372. [Google Scholar] [CrossRef]
- Tokgoz, E. A CFD Study on the Propeller-Hull Interaction Flow in Waves Using Body-Force Distribution Model. Ph.D. Thesis, Osaka University, Suita, Japan, 2015. [Google Scholar]
- Yu, J.; Feng, D.; Liu, L.; Yao, C.; Wang, X. Assessments of propulsion models for free running surface ship turning circle simulations. Ocean. Eng. 2022, 250, 110967. [Google Scholar] [CrossRef]
- Yu, J.; Yao, C.; Liu, L.; Zhang, Z.; Feng, D. Assessment of full-scale KCS free running simulation with body-force models. Ocean. Eng. 2021, 237, 109570. [Google Scholar] [CrossRef]
- Feng, D.; Yu, J.; He, R.; Zhang, Z.; Wang, X. Improved body force propulsion model for ship propeller simulation. Appl. Ocean. Res. 2020, 104, 102328. [Google Scholar] [CrossRef]
- Liu, L.; Zhang, Z.; Wang, Q.; Feng, D. Parametric Modelling Method of Numerical Tank for Ship Resistance and Propulsion Performance Prediction. In Proceedings of the 31st National Symposium on Hydrodynamics, Xiamen, China, 13–17 January 2020. [Google Scholar]
- International Towing Tank Conference (ITTC) Recommendations. ITTC-Recommended Procedures and Guidelines, Uncertainty Analysis in CFD, Verification and Validation Methodology and Procedures. 2021. 7.5-03-01-01. Available online: https://www.ittc.info/media/9765/75-03-01-01.pdf (accessed on 20 January 2024).
- Xing, T.; Stern, F. Factors of Safety for Richardson Extrapolation. J. Fluids Eng. 2010, 132, 061403. [Google Scholar] [CrossRef]
- SIMMAN. Workshop on Verification and Validation of Ship Manoeuvring Simulation Methods. 2014. Available online: https://www.simman2020.kr/ (accessed on 20 January 2024).
- Luca, D.; Fabio Mancini Simone Miranda Salvatore Pensa, C. An Extended Verification and Validation Study of CFD Simulations for Planing Hulls. J. Ship Res. 2017, 60, 101–118. [Google Scholar] [CrossRef]
- Eça, L.; Hoekstra, M. A procedure for the estimation of the numerical uncertainty of CFD calculations based on grid refinement studies. J. Comput. Phys. 2014, 262, 104–130. [Google Scholar] [CrossRef]
- Naz, N. Numerical Simulation of Flow Around Ship Hull Considering Rudder-Propeller Interaction. Master of Science in Naval Architecture and Marine Engineering. 2017. Available online: https://www.researchgate.net/publication/332886649_NUMERICAL_SIMULATION_OF_FLOW_AROUND_SHIP_HULL_CONSIDERING_RUDDER-PROPELLER_INTERACTION_MASTER_OF_SCIENCE_in_NAVAL_ARCHITECTURE_AND_MARINE_ENGINEERING (accessed on 20 January 2024).


| Parameters | Symbol | Units | Full-Scale | Model-Scale |
|---|---|---|---|---|
| Scale ratio | λ | - | 1 | 110 |
| Length of perpendicular | m | 320 | 2.9091 | |
| Depth | D | m | 30 | 0.2727 |
| Draft | T | m | 20.8 | 0.1891 |
| Displacement | ∆ | m3 | 312,622 | 0.2349 |
| Wetted surface area | Sw | m2 | 27194 | 2.2475 |
| Distance from center of buoyancy to midship | LCB | - | 3.48 | 3.48 |
| Distance from center of gravity to midship | LCG | m | 11.1 | 0.101 |
| Inertia radius about x-axis | ixx/ | - | 0.4 | 0.4 |
| Inertia radius about y and z-axis | iyy, izz/Lpp | - | 0.25 | 0.25 |
| Rudder total wetted area | SR | m2 | 273.3 | 0.0226 |
| Rudder rate | - | deg/s | 2.32 | 24.5 |
| Parameters | Symbol | Units | Full-Scale | Model-Scale |
|---|---|---|---|---|
| Scale ratio | λ | - | 1 | 110 |
| Propeller diameter | DP | m | 9.86 | 0.0896 |
| Pitch ratio (0.7R) | P/D (0.7R) | - | 0.721 | 0.721 |
| Area ratio | Ae/A0 | - | 0.431 | 0.431 |
| Rotation | - | - | Right Hand | Right Hand |
| Hub ratio | - | - | 0.155 | 0.155 |
| Case | Velocity (m/s) | Rudder | Simulation |
|---|---|---|---|
| 1 | 0.60 | Conventional rudder | Resistance |
| 2 | 0.70 | ||
| 3 | 0.76 | ||
| 4 | 0.80 | ||
| 5 | 0.60 | Gate rudder | Resistance |
| 6 | 0.70 | ||
| 7 | 0.76 | ||
| 8 | 0.80 | ||
| 9 | 0.60 | Conventional rudder | Self-propulsion |
| 10 | 0.70 | ||
| 11 | 0.76 | ||
| 12 | 0.80 | ||
| 13 | 0.60 | Gate rudder | Self-propulsion |
| 14 | 0.70 | ||
| 15 | 0.76 | ||
| 16 | 0.80 |
| Grid | Coarse | Medium | Fine | EFD |
|---|---|---|---|---|
| Size (M) | 1.55 | 4.18 | 11.70 | - |
| (N) | 3.239 | 3.345 | 3.358 | 3.389 |
| Diff. (%) | −4.43 | −1.29 | −0.92 | - |
| 0.116 | ||||
| Convergence | Monotonic | |||
| P | 3.104 | |||
| ) | 1.740 | |||
| Time-Step | Coarse | Medium | Fine | EFD |
|---|---|---|---|---|
| Size (s) | 0.01913 | 0.00957 | 0.00478 | - |
| (N) | 3.260 | 3.345 | 3.355 | 3.389 |
| Diff. (%) | −3.81 | −1.29 | −1.02 | - |
| 0.116 | ||||
| Convergence | Monotonic | |||
| P | 1.621 | |||
| ) | 0.371 | |||
| 1.779 | 1.000 | 2.041 | −1.29 |
| Velocity (m/s) | (N) | (N) | (N) | ||||||
|---|---|---|---|---|---|---|---|---|---|
| SCR | SGR | Δ(%) | SCR | SGR | Δ(%) | SCR | SGR | Δ(%) | |
| 0.60 | 2.144 | 2.200 | 2.612 | 1.625 | 1.652 | 1.662 | 0.520 | 0.548 | 5.385 |
| 0.70 | 2.870 | 2.946 | 2.648 | 2.161 | 2.196 | 1.620 | 0.709 | 0.750 | 5.783 |
| 0.76 | 3.345 | 3.434 | 2.661 | 2.517 | 2.558 | 1.629 | 0.828 | 0.876 | 5.797 |
| 0.80 | 3.689 | 3.787 | 2.657 | 2.766 | 2.809 | 1.555 | 0.923 | 0.977 | 5.850 |
| Velocity (m/s) | -CR (m2) | -CR (N) | -CR (N) | -CR (N) | -S (N) | -S (N) | -S (N) | (%) |
|---|---|---|---|---|---|---|---|---|
| 0.60 | 0.0265 | 0.0531 | 0.0132 | 0.0399 | 2.0912 | 1.6115 | 0.4797 | 2.48 |
| 0.70 | 0.0727 | 0.0178 | 0.0549 | 2.7974 | 2.1435 | 0.6539 | 2.53 | |
| 0.76 | 0.0861 | 0.0207 | 0.0654 | 3.2594 | 2.4967 | 0.7627 | 2.57 | |
| 0.80 | 0.0952 | 0.0228 | 0.0724 | 3.5942 | 2.7432 | 0.8510 | 2.58 |
| Velocity (m/s) | -GR (m2) | -GR (N) | -GR (N) | -GR (N) | -S (N) | -S (N) | -S (N) | (%) |
|---|---|---|---|---|---|---|---|---|
| 0.60 | 0.0354 | 0.1084 | 0.0394 | 0.0690 | 2.0916 | 1.6126 | 0.4790 | 4.93 |
| 0.70 | 0.1457 | 0.0515 | 0.0942 | 2.7999 | 2.1446 | 0.6553 | 4.95 | |
| 0.76 | 0.1691 | 0.0596 | 0.1095 | 3.2645 | 2.4980 | 0.7665 | 4.92 | |
| 0.80 | 0.1862 | 0.0651 | 0.1212 | 3.6005 | 2.7442 | 0.8563 | 4.92 |
| Velocity (m/s) | SCR | SGR | ||
|---|---|---|---|---|
| Heave (×10−3 m) | Trim (deg) | Heave (×10−3 m) | Trim (deg) | |
| 0.60 | −1.800 | −0.0747 | −1.799 | −0.0748 |
| 0.70 | −2.487 | −0.1037 | −2.485 | −0.1040 |
| 0.76 | −2.951 | −0.1242 | −2.951 | −0.1243 |
| 0.80 | −3.287 | −0.1387 | −3.279 | −0.1388 |
| Velocity (m/s) | n(rps) | T(N) | Q(N × m) | ||||||
|---|---|---|---|---|---|---|---|---|---|
| SCR | SGR | Δ(%) | SCR | SGR | Δ(%) | SCR | SGR | Δ(%) | |
| 0.60 | 14.54 | 13.59 | −6.56 | 2.690 | 2.483 | −7.71 | 0.0242 | 0.0224 | −7.49 |
| 0.70 | 16.93 | 15.74 | −7.07 | 3.605 | 3.306 | −8.30 | 0.0326 | 0.0299 | −8.24 |
| 0.76 | 18.34 | 17.05 | −7.02 | 4.203 | 3.856 | −8.26 | 0.0381 | 0.0350 | −8.20 |
| 0.80 | 19.31 | 17.95 | −7.01 | 4.642 | 4.243 | −8.58 | 0.0421 | 0.0386 | −8.37 |
| Velocity (m/s) | (N) | ||||
|---|---|---|---|---|---|
| SCR | SGR | SCR | SGR | Δ(%) | |
| 0.60 | 0.546 | 0.283 | 0.203 | 0.114 | −43.86 |
| 0.70 | 0.735 | 0.360 | 0.204 | 0.109 | −46.53 |
| 0.76 | 0.858 | 0.422 | 0.204 | 0.109 | −46.34 |
| 0.80 | 0.952 | 0.457 | 0.205 | 0.108 | −47.56 |
| Velocity (m/s) | (W) | (W) | |||||||
|---|---|---|---|---|---|---|---|---|---|
| SCR | SGR | Δ(%) | SCR | SGR | Δ(%) | SCR | SGR | Δ(%) | |
| 0.60 | 1.287 | 1.320 | 2.60 | 2.210 | 1.910 | −13.56 | 0.5823 | 0.6911 | 18.69 |
| 0.70 | 2.009 | 2.062 | 2.63 | 3.465 | 2.955 | −14.73 | 0.5798 | 0.6978 | 20.35 |
| 0.76 | 2.543 | 2.610 | 2.63 | 4.388 | 3.745 | −14.65 | 0.5796 | 0.6969 | 20.25 |
| 0.80 | 2.952 | 3.029 | 2.64 | 5.110 | 4.354 | −14.80 | 0.5776 | 0.6958 | 20.46 |
| Velocity (m/s) | (N) | -S (N) | -CR (N) | (N) | -S (N) | -CR (N) | (N) | -S (N) | -CR (N) | (%) |
|---|---|---|---|---|---|---|---|---|---|---|
| 0.60 | 2.690 | 2.482 | 0.2080 | 1.687 | 1.624 | 0.0622 | 1.004 | 0.858 | 0.1457 | 7.73 |
| 0.70 | 3.605 | 3.325 | 0.2797 | 2.240 | 2.159 | 0.0806 | 1.365 | 1.166 | 0.1991 | 7.76 |
| 0.76 | 4.203 | 3.874 | 0.3287 | 2.608 | 2.515 | 0.0924 | 1.595 | 1.359 | 0.2363 | 7.82 |
| 0.80 | 4.642 | 4.278 | 0.3640 | 2.865 | 2.764 | 0.1009 | 1.777 | 1.514 | 0.2631 | 7.84 |
| Velocity (m/s) | (N) | -S (N) | -GR (N) | (N) | -S (N) | -GR (N) | (N) | -S (N) | -GR (N) | (%) |
|---|---|---|---|---|---|---|---|---|---|---|
| 0.60 | 2.483 | 2.458 | 0.0251 | 1.656 | 1.625 | 0.0311 | 0.827 | 0.833 | −0.0060 | 1.01 |
| 0.70 | 3.306 | 3.268 | 0.0376 | 2.201 | 2.160 | 0.0404 | 1.105 | 1.108 | −0.0029 | 1.14 |
| 0.76 | 3.856 | 3.815 | 0.0411 | 2.563 | 2.516 | 0.0469 | 1.293 | 1.298 | −0.0059 | 1.07 |
| 0.80 | 4.243 | 4.214 | 0.0291 | 2.816 | 2.764 | 0.0516 | 1.427 | 1.450 | −0.0224 | 0.69 |
| Velocity (m/s) | SCR | SGR | ||
|---|---|---|---|---|
| Heave (×10−3 m) | Trim (deg) | Heave (×10−3 m) | Trim (deg) | |
| 0.60 | −1.843 | −0.0682 | −1.841 | −0.0678 |
| 0.70 | −2.538 | −0.0952 | −2.533 | −0.0951 |
| 0.76 | −3.016 | −0.1140 | −3.009 | −0.1140 |
| 0.80 | −3.356 | −0.1273 | −3.352 | −0.1272 |
Disclaimer/Publisher’s Note: The statements, opinions and data contained in all publications are solely those of the individual author(s) and contributor(s) and not of MDPI and/or the editor(s). MDPI and/or the editor(s) disclaim responsibility for any injury to people or property resulting from any ideas, methods, instructions or products referred to in the content. |
© 2025 by the authors. Licensee MDPI, Basel, Switzerland. This article is an open access article distributed under the terms and conditions of the Creative Commons Attribution (CC BY) license (https://creativecommons.org/licenses/by/4.0/).
Share and Cite
Cui, H.; Zhang, D.; Kong, Y.; Wang, X. Numerical Study of the Energy-Saving Effect of the Gate Rudder System. J. Mar. Sci. Eng. 2025, 13, 968. https://doi.org/10.3390/jmse13050968
Cui H, Zhang D, Kong Y, Wang X. Numerical Study of the Energy-Saving Effect of the Gate Rudder System. Journal of Marine Science and Engineering. 2025; 13(5):968. https://doi.org/10.3390/jmse13050968
Chicago/Turabian StyleCui, Hujia, Donglei Zhang, Yuan Kong, and Xianzhou Wang. 2025. "Numerical Study of the Energy-Saving Effect of the Gate Rudder System" Journal of Marine Science and Engineering 13, no. 5: 968. https://doi.org/10.3390/jmse13050968
APA StyleCui, H., Zhang, D., Kong, Y., & Wang, X. (2025). Numerical Study of the Energy-Saving Effect of the Gate Rudder System. Journal of Marine Science and Engineering, 13(5), 968. https://doi.org/10.3390/jmse13050968