Article

Spatio-Temporal Dynamics of Particulate Organic Carbon and Its Response to Climate Change: Evidence of the East China Sea from 2003 to 2022

College of Harbour and Coastal Engineering, Jimei University, Xiamen 361021, China
*
Authors to whom correspondence should be addressed.
J. Mar. Sci. Eng. 2025, 13(5), 963; https://doi.org/10.3390/jmse13050963
Submission received: 22 April 2025 / Revised: 13 May 2025 / Accepted: 13 May 2025 / Published: 15 May 2025
(This article belongs to the Section Marine Ecology)

Abstract

:
Particulate organic carbon (POC) plays a crucial role in oceanic climate change. However, existing research is limited by several factors, including the scarcity of long-term data, extensive datasets, and a comprehensive understanding of POC dynamics. This study utilizes monthly average POC remote sensing data from the MODIS/AQUA satellite to analyze the spatiotemporal variations of POC in the East China Sea from 2003 to 2022. Employing correlation analysis, spatial autocorrelation models, and the Geodetector model, we explore responses to key influencing factors such as climatic elements. The results indicate that POC concentrations are higher in the western nearshore areas and lower in the eastern offshore regions of the East China Sea (ECS). Additionally, concentrations are observed to be lower in southern regions compared to northern ones. From 2003 to 2022, POC concentrations exhibited a fluctuating downward trend with an average annual concentration of 121.05 ± 4.57 mg/m3. Seasonally, monthly average POC concentrations ranged from 105.48 mg/m3 to 158.36 mg/m3; notably higher concentrations were recorded during spring while summer showed comparatively lower levels. Specifically, POC concentrations peaked in April before rapidly declining from May to June—reaching a minimum—and then gradually increasing again from June through December. Correlation analysis revealed significant influences on POC levels by particulate inorganic carbon (PIC), sea surface temperature (SST), chlorophyll (Chl), and photosynthetically active radiation (PAR). The Geodetector model further elucidated that these factors vary in their impact: Chl was identified as having the strongest influence (q = 0.84), followed by PIC (q = 0.75) and SST (q = 0.64) as primary influencing factors; PAR was recognized as a secondary factor with q = 0.30. This study provides new insights into marine carbon cycling dynamics within the context of climate change.

1. Introduction

The oceanic carbon cycle is a vital component of the global carbon cycle, exerting profound effects on climate change worldwide. Through processes of carbon absorption, storage, and release, the ocean carbon cycle significantly influences marine ecosystems. Additionally, it plays an essential role in maintaining global carbon balance and regulating climate systems [1,2,3]. Particulate organic carbon (POC), as a key reservoir of carbon in the ocean, plays a central role in these processes: changes in POC concentrations and transport efficiency directly influence the ocean’s capacity to sequester atmospheric CO2, a process critical for mitigating greenhouse gas-driven warming [4,5]. Elevated POC fluxes enhance carbon burial in deep-sea sediments, thereby reducing atmospheric CO2 levels, while declines in POC export may amplify climate instability by leaving more carbon in the atmosphere [6,7]. POC refers to organic particulate matter containing carbon in seawater, transported from surface waters to deeper layers via biological and physical pumps. In the East China Sea, biological and physical processes efficiently transport POC to deeper layers. Diatoms like Skeletonema costatum enhance POC formation via extracellular calcification, accelerating particle sedimentation due to increased density [8]. Concurrently, mesoscale eddies (e.g., cyclonic eddies in the Kuroshio Extension) act as physical pumps by upwelling nutrients and promoting vertical mixing, facilitating POC advection from surface to mesopelagic zones for long-term sequestration. This synergy highlights marginal sea carbon sequestration mechanisms [9]. This process effectively sequesters atmospheric CO2 in the deep ocean. POC represents one of the major reservoirs of carbon within the ocean and serves as a key parameter in research related to the marine carbon cycle [10].
In recent years, significant advancements have been made in estimating POC concentration through remote sensing data inversion [11,12,13,14]. Currently utilized remote sensing data sources include MODIS (Moderate Resolution Imaging Spectroradiometer), SeaWiFS (Sea-viewing Wide Field-of-view Sensor), and VIIRS (Visible Infrared Imaging Radiometer Suite). These sources provide high temporal and spatial resolution surface observations that encompass global marine areas. Remote sensing inversion algorithms for surface POC concentration can be broadly categorized into three types: ① empirical relationships based on chlorophyll concentration, suspended matter, and POC; this approach indirectly estimates POC by utilizing remote sensing inversions of chlorophyll and suspended matter concentrations; ② empirical relationships between apparent optical properties (AOP) and POC; AOP encompasses upward and downward irradiance as well as remote sensing reflectance and water-leaving radiance—parameters that vary with lighting conditions [15]; ③ empirical relationships between inherent optical properties of seawater and POC [16]. NASA’s algorithm for estimating POC effectively derives global ocean surface POC concentrations [11], yielding high-resolution remote sensing products that serve as valuable resources for ongoing research into POC dynamics [17].
The East China Sea, situated off the eastern coast of China, is a marginal sea of the northwest Pacific Ocean. It is bordered to the north by the Yellow Sea, to the east by the Pacific Ocean, and it connects with the South China Sea to the south [18]. Due to its distinctive geographical location and complex hydrometeorological conditions, this marine area exhibits rich biodiversity and a multifaceted ecosystem. Although the East China Sea accounts for less than 10% of the global ocean area, it is one of the most productive marginal seas in the world. It makes a significant contribution to the global carbon cycle, accounting for approximately 9% of the total carbon burial in marine sediments [19,20]. The hydrological environment of the East China Sea is significantly influenced by monsoons, while inputs from major rivers such as the Yangtze River contribute to highly intricate material cycles and energy flows. This results in unique spatiotemporal variability in POC distribution. POC demonstrates correlations with various factors including total suspended particulate concentration, chlorophyll concentration, optical properties of particulates, and watercolor spectra; these relationships form a theoretical foundation for remote sensing inversions aimed at estimating marine POC concentrations [10]. Extensive research has been conducted on both spatial and temporal variations in POC concentrations [11,12,13]. Zhao et al. explored dynamics related to dissolved and particulate organic matter within both the Changjiang (Yangtze River) Estuary and the adjacent East China Sea shelf [21]. Wang et al. investigated biogeochemical processes involving organic matter and biomarkers present in these regions [22]. Hung et al. examined fluxes of POC during summer months in the East China Sea, focusing specifically on transport mechanisms that facilitate movement from riverine systems and coastal areas into open waters [23]. Shi et al. analyzed spatial-temporal distribution patterns along with influencing factors affecting POC levels within both the Yellow Sea and the East China Sea during autumn [24].
Past research on POC flux has faced significant challenges, including high costs, complex instrumentation, inconsistent sampling methods, environmental variability, and a lack of standardized methodologies. These issues have hindered the acquisition of accurate and comparable long-term global-scale data [25,26,27]. Early studies often concentrated on limited time frames and geographic areas, with insufficient analysis of long-term and large-scale data. This limitation has restricted a comprehensive understanding of POC dynamics in the East China Sea [21,22,23]. To address these shortcomings, it is essential to integrate satellite observations with in situ data. Remote sensing offers short revisit cycles and extensive coverage that facilitate continuous global ocean monitoring, effectively compensating for the limitations inherent in field observations [28]. The study conducted by Chen et al. focused on the spatial and temporal variability of POC in the East China Sea using satellite observations from 2001 to 2011 [10]. While this research provides valuable insights into POC dynamics during that period, its relatively short time span limits its ability to capture long-term trends. Over the past decade, significant changes have occurred in the East China Sea due to climate change, increased anthropogenic activities along coastal zones, and variations in Yangtze River discharge [29]. These factors are likely contributing to further spatiotemporal differentiation of POC; however, their long-term impacts remain unclear due to the limited observation period covered by Chen et al.’s study [10]. Our study significantly extends the data series from 2003 to 2022, surpassing their 2011 cutoff. This enables the identification of long-term POC trends, interannual and multiyear fluctuation characteristics, as well as trend inflection points. Furthermore, we introduce the Geodetector model to quantify driver interactions and spatial heterogeneity, surpassing traditional correlation analyses. We further employ Moran’s I to delineate the spatial aggregation patterns of POC and uncover the underlying spatial mechanisms driving this phenomenon. Notably, we integrate PIC, Chl, PAR, and SST into our framework to explore POC drivers. This methodological advancement effectively addresses the limitations of prior studies regarding temporal scope, analytical rigor, and data reliability. Our findings provide a valuable reference for examining long-term large-scale variations in POC as well as carbon cycling within the marginal seas of the East China Sea.

2. Materials and Methods

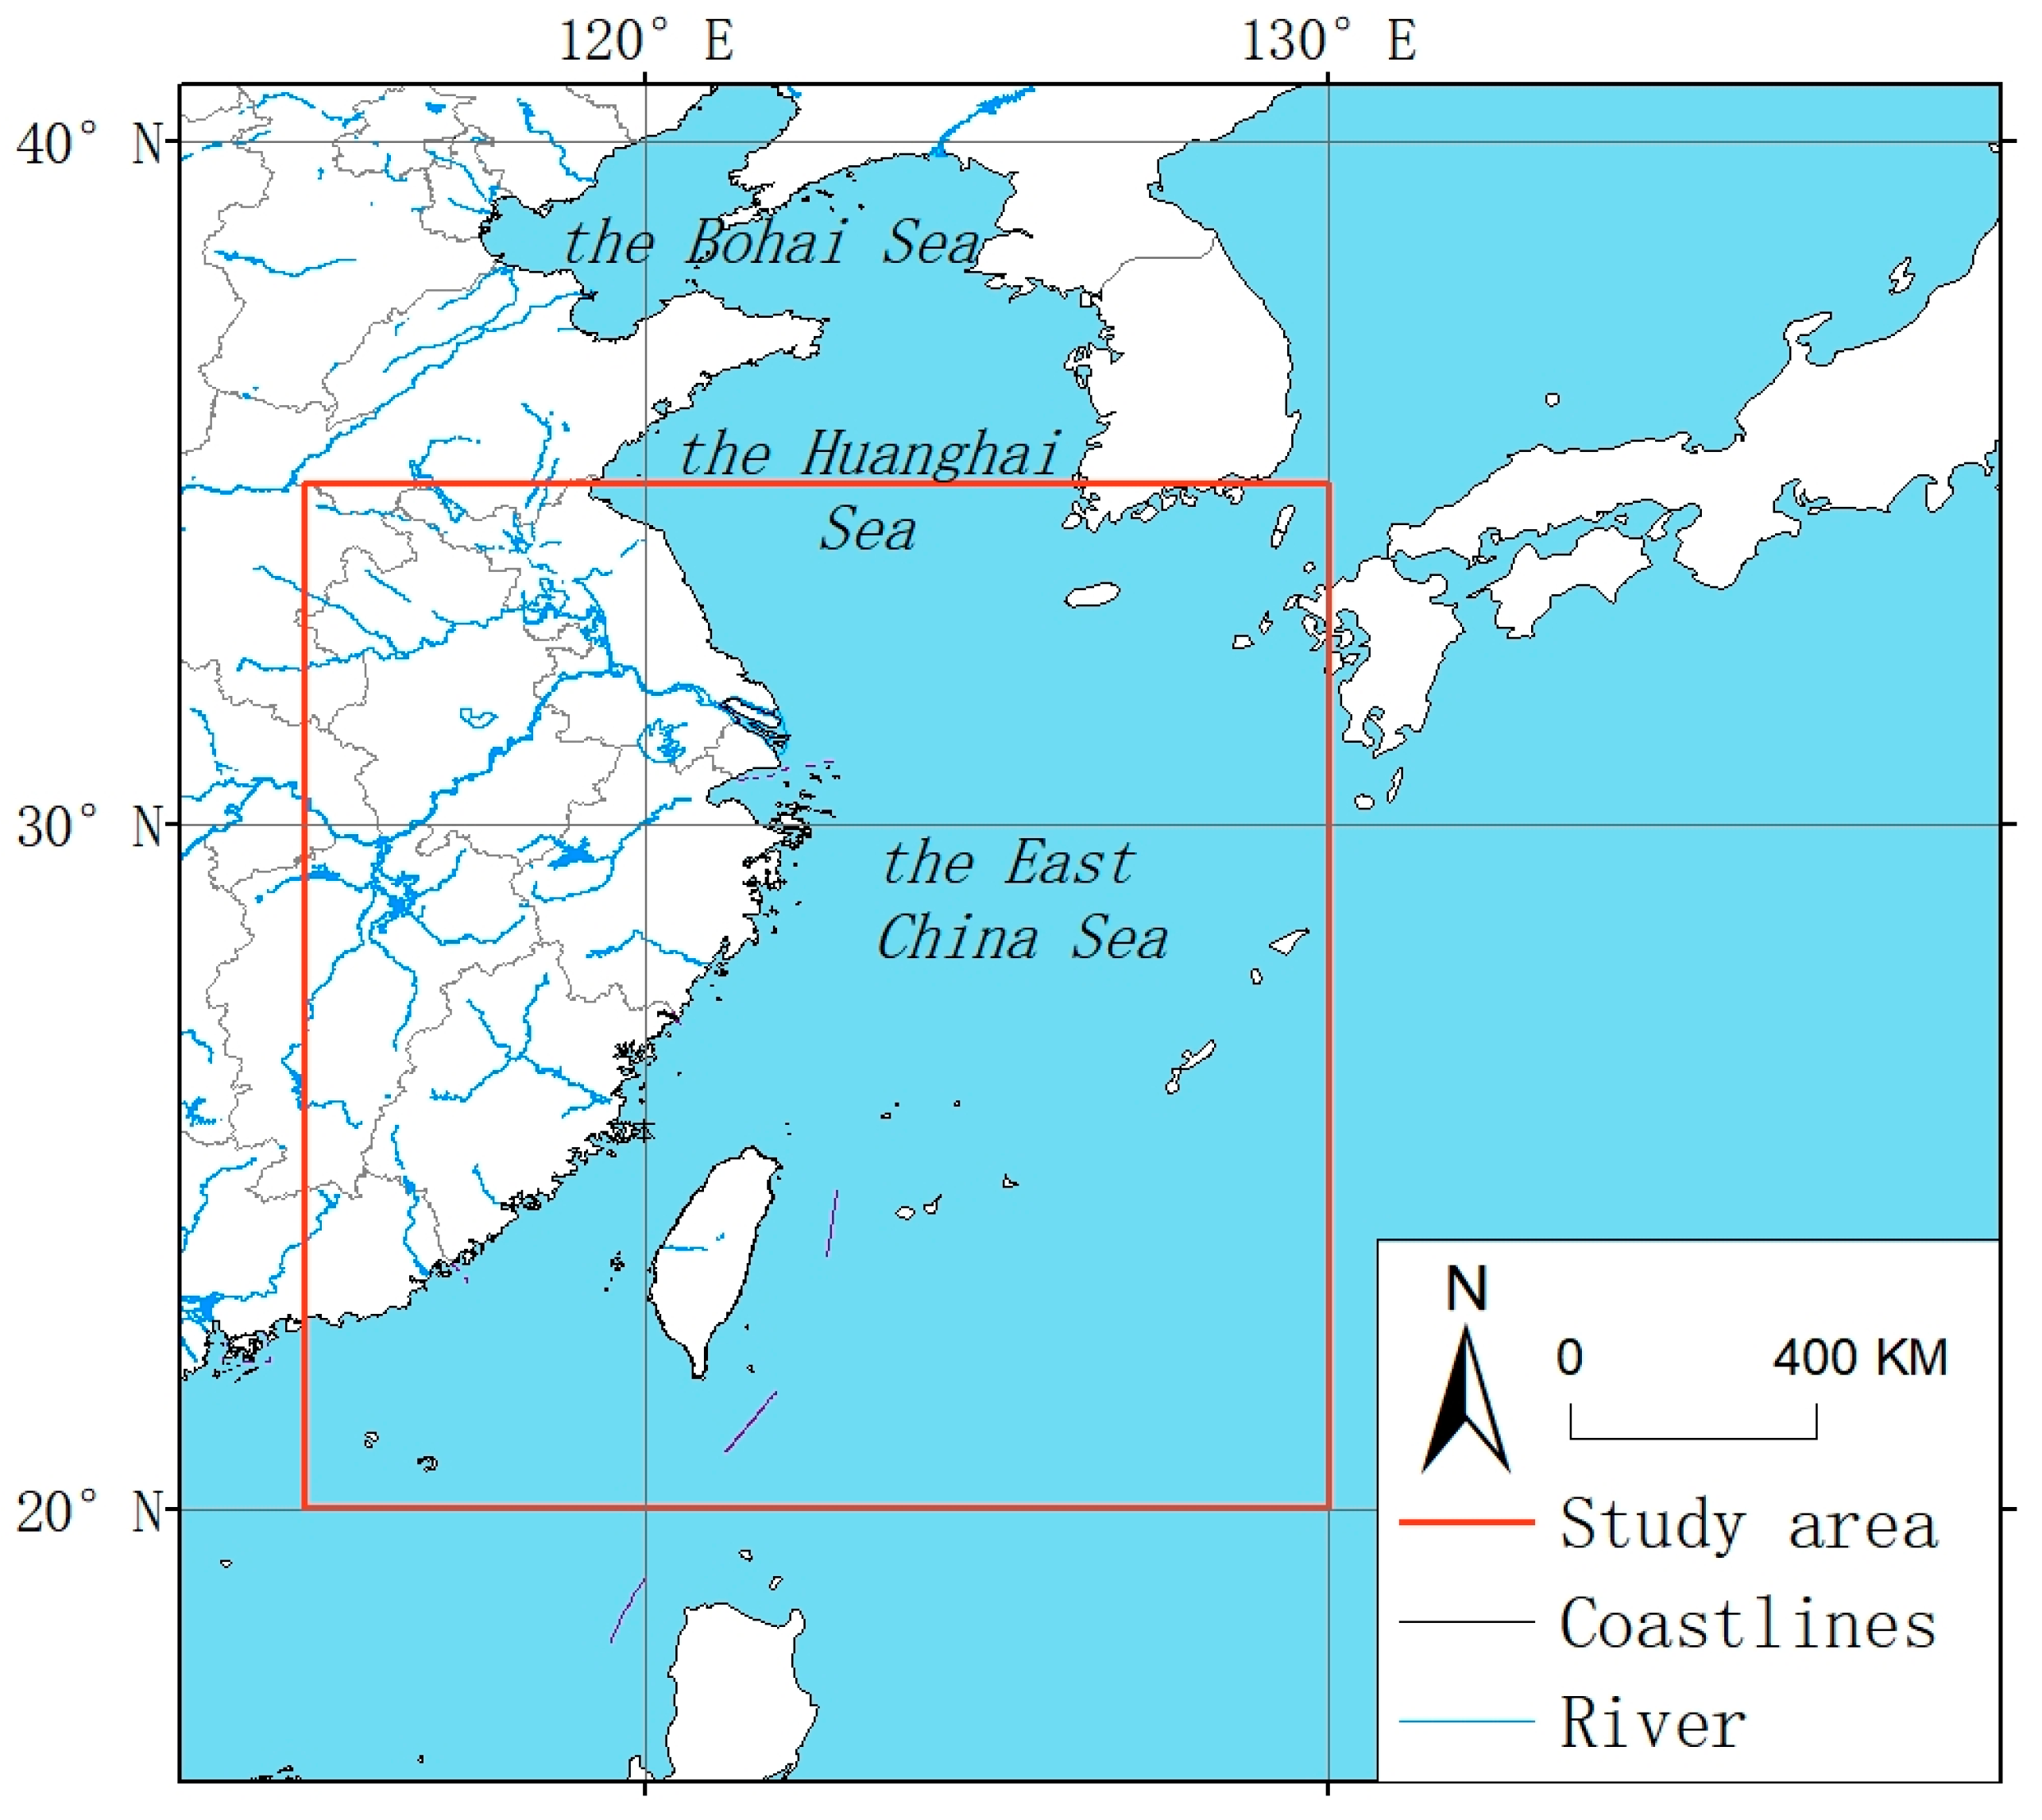
2.1. Overview of the Study Area

The East China Sea, covering an area of 7.7 × 10⁵ km2, ranks as the 11th largest marginal sea globally [18]. It extends from the Bohai Sea in northeastern China to the southern tip of Tsushima Island in the Korea Strait, southward to the Taiwan Strait, and southeastward to the Ryukyu Islands [30]. To the northeast, it connects with the Japan Sea, while facing the Philippine Sea to the east (Figure 1). The Yangtze River, China’s longest river, empties into the East China Sea, forming the economically vibrant and highly industrialized Yangtze River Delta, one of the most dynamic regions in China characterized by intensive human [31].
The East China Sea extends across both temperate and subtropical zones, primarily governed by subtropical and temperate monsoon climates. During summer, the region is predominantly influenced by southwest monsoons and experiences frequent typhoons, whereas in winter, it is marked by northwest monsoons and occasional storm surges.

2.2. Research Data

This study employs annual and monthly average data from 2003 to 2022 for POC, PIC, SST, PAR, and Chl obtained via Aqua MODIS. These data are sourced from the Ocean Color website (http://oceancolor.gsfc.nasa.gov/, accessed on 19 May 2024), which is renowned for its high accuracy and stability in estimating global marine POC concentrations [32]. It performs reliably across both open ocean waters and nutrient-rich nearshore regions [33]. The measured POC data are provided by the National Earth System Science Data Center, part of China’s National Science & Technology Infrastructure (http://www.geodata.cn, accessed on 9 July 2024) [34]. These data focus on the Yangtze River Estuary region, specifically spanning latitudes of 30.35° N to 31.88° N and longitudes of 120.97° E to 124.00° E.
Analysis of multi-year East China Sea chlorophyll remote sensing data, extracted using masking techniques, indicates that Chl concentrations in this area are predominantly below 10 mg/m3, with only a few locations exhibiting concentrations between 10–20 mg/m3, and isolated cases reaching up to 90 mg/m3. Long-term monitoring confirms that typical phytoplankton blooms in the East China Sea exhibit peak Chl of 3–8 mg/m3, with values > 10 mg/m3 strongly linked to abnormal events like harmful algal blooms (e.g., 2019 Noctiluca scintillans blooms reaching 78 mg/m3), extreme riverine inputs, or short-lived upwelling intrusions, which disrupt normal ecological dynamics [35,36,37]. To exclude the influence of anomalous climate events, based on relevant literature [38], Chl concentration values indicative of phytoplankton blooms were defined within the range of 0–10 mg/m3. Concentrations exceeding 10 mg/m3 were treated as outliers and excluded from further analysis.
Additionally, some data points were missing due to cloud cover and water vapor interference during satellite observations. Given that this study relies solely on satellite data for analysis, no interpolation was conducted to preserve data integrity. Using R (Version 4.3.2) [39] programming, the dataset was processed to extract POC, Chl, PIC, SST, and PAR concentrations for the East China Sea region across different years, seasons, and months from 2003 to 2022, with all anomalous values removed.

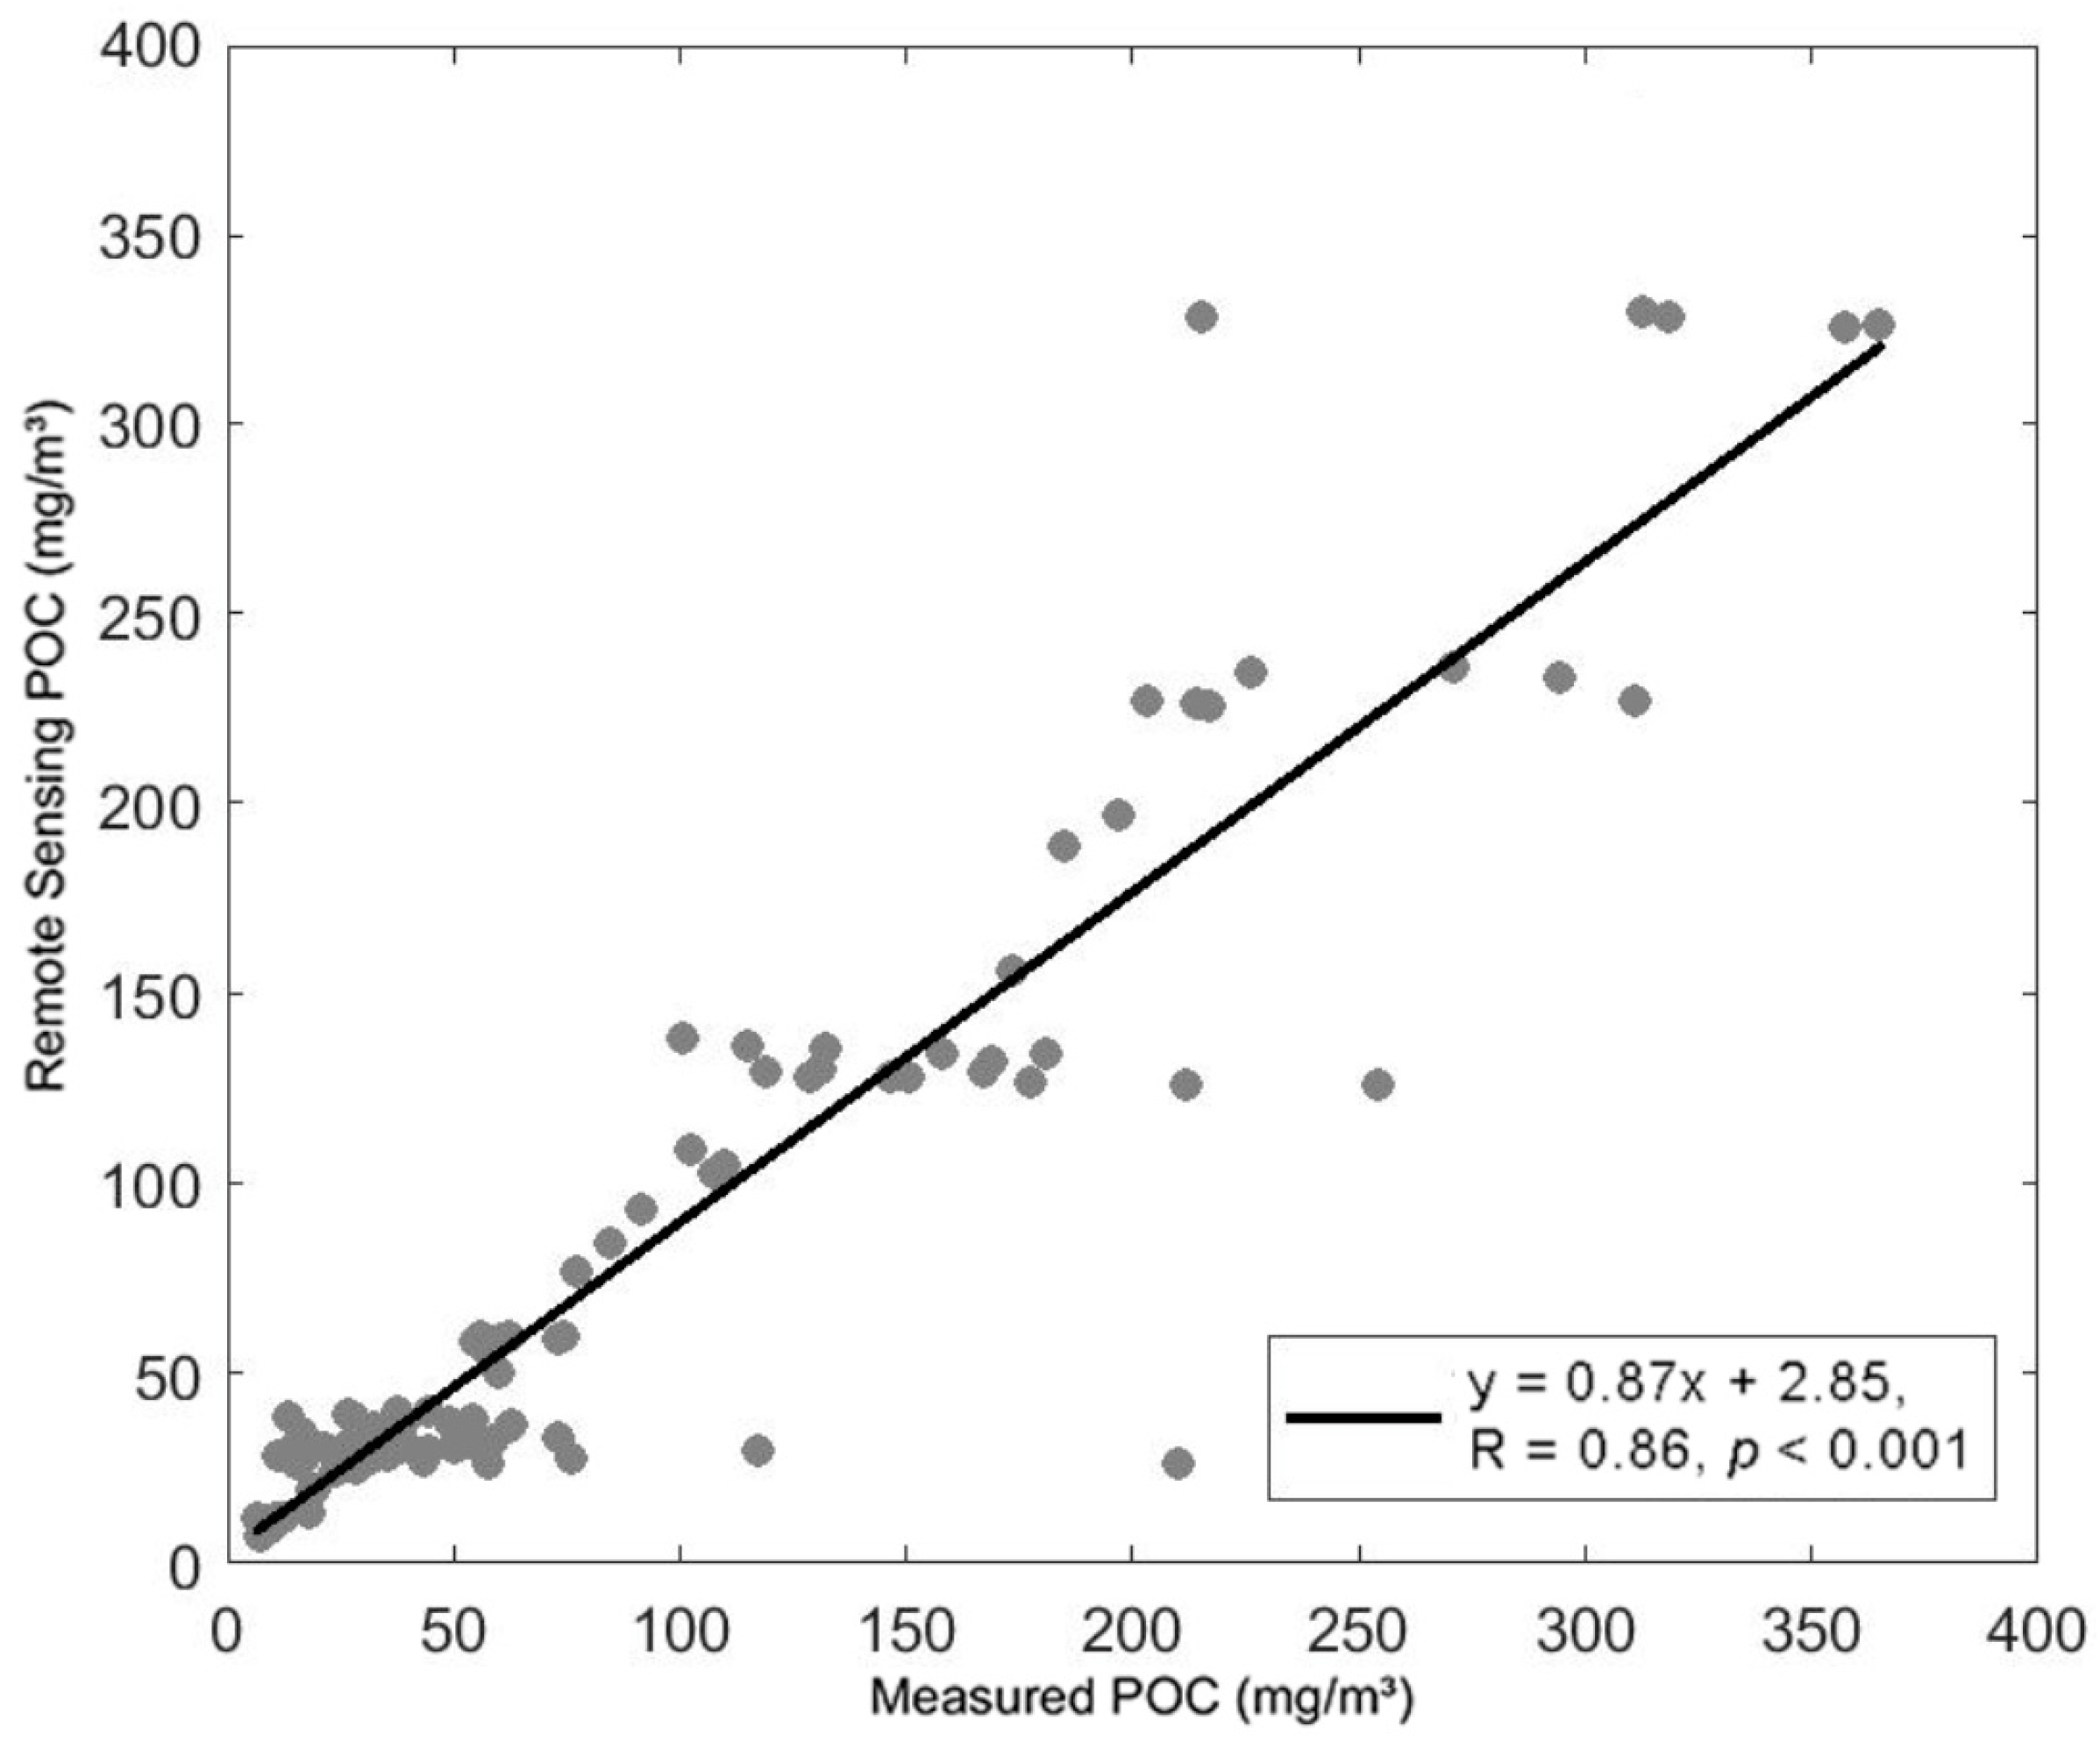
2.3. Research Methodology

The algorithms for deriving annual, seasonal, and monthly average data of POC, PIC, SST, PAR, and Chl from Aqua MODIS are detailed in the references [8,40,41,42,43]. The POC measurements were conducted using a PerkinElmer 2400 CHNS Elemental Analyzer (Waltham, MA, USA). Before the measurements, the instrument was calibrated and stabilized, and both blank and standard samples were analyzed to ensure measurement accuracy. Once the instrument’s normal operation was confirmed, the samples were analyzed sequentially. To maintain high data quality, standard samples were interspersed every 10–15 samples during the analysis process [34]. To further assess the applicability of satellite-derived data in the East China Sea (ECS) region, surface POC concentrations derived from satellite data between January and November 2011 were compared with in situ measured POC concentrations from the same period (Figure 2). A strong positive correlation was observed between the two datasets. Statistical analysis indicated an average absolute error of 11.96 mg/m3, an average relative error of 22.43%, and a root mean square error (RMSE) of 30.08 mg/m3. Furthermore, reference [44] has validated the reliability of MODIS-derived POC estimates in the ECS region.
The GeoDetector (Version 1.0-5), introduced by Wang et al. [45], serves as a robust statistical methodology for analyzing spatial data and identifying driving factors through the quantitative assessment of stratified heterogeneity. Its primary strength resides in its high sensitivity for detecting the influence of independent variables on dependent variables, making it suitable for both numerical and qualitative datasets. In this study, the factor detector module of the GeoDetector was employed to screen the driving factors influencing POC concentration in the East China Sea.
Single factor detection. Factorial detection is the detection of the spatial variability of POC concentrations in the sea area and the explanatory power of the different influences X on the dependent variable Y, as measured by the q-value, expressed as:
q = 1 h = 1 L N h σ h 2 N σ 2 = 1 S S W S S T
S S W = h = 1 L N h σ h 2 , S S T = N σ 2
where: h = 1, …, L indicates the strata (categories or regions) of the dependent variable y or factor x. Nh and N represent the number of units in stratum h and the entire region, respectively. σ h 2 and σ2 are the variances of y in stratum h and the entire region, respectively. SSW and SST are the sum of within-stratum variances and the total variance of the entire region, respectively. The q value ranges from [0, 1], with higher values indicating a stronger explanatory power of the driving factor on the geographical attribute [45]. The q-value range is [0, 1]. When the stratification is caused by the independent variable X, a larger q-value signifies a stronger explanatory power of the independent variable X to the attribute Y, and vice versa [45].

3. Results

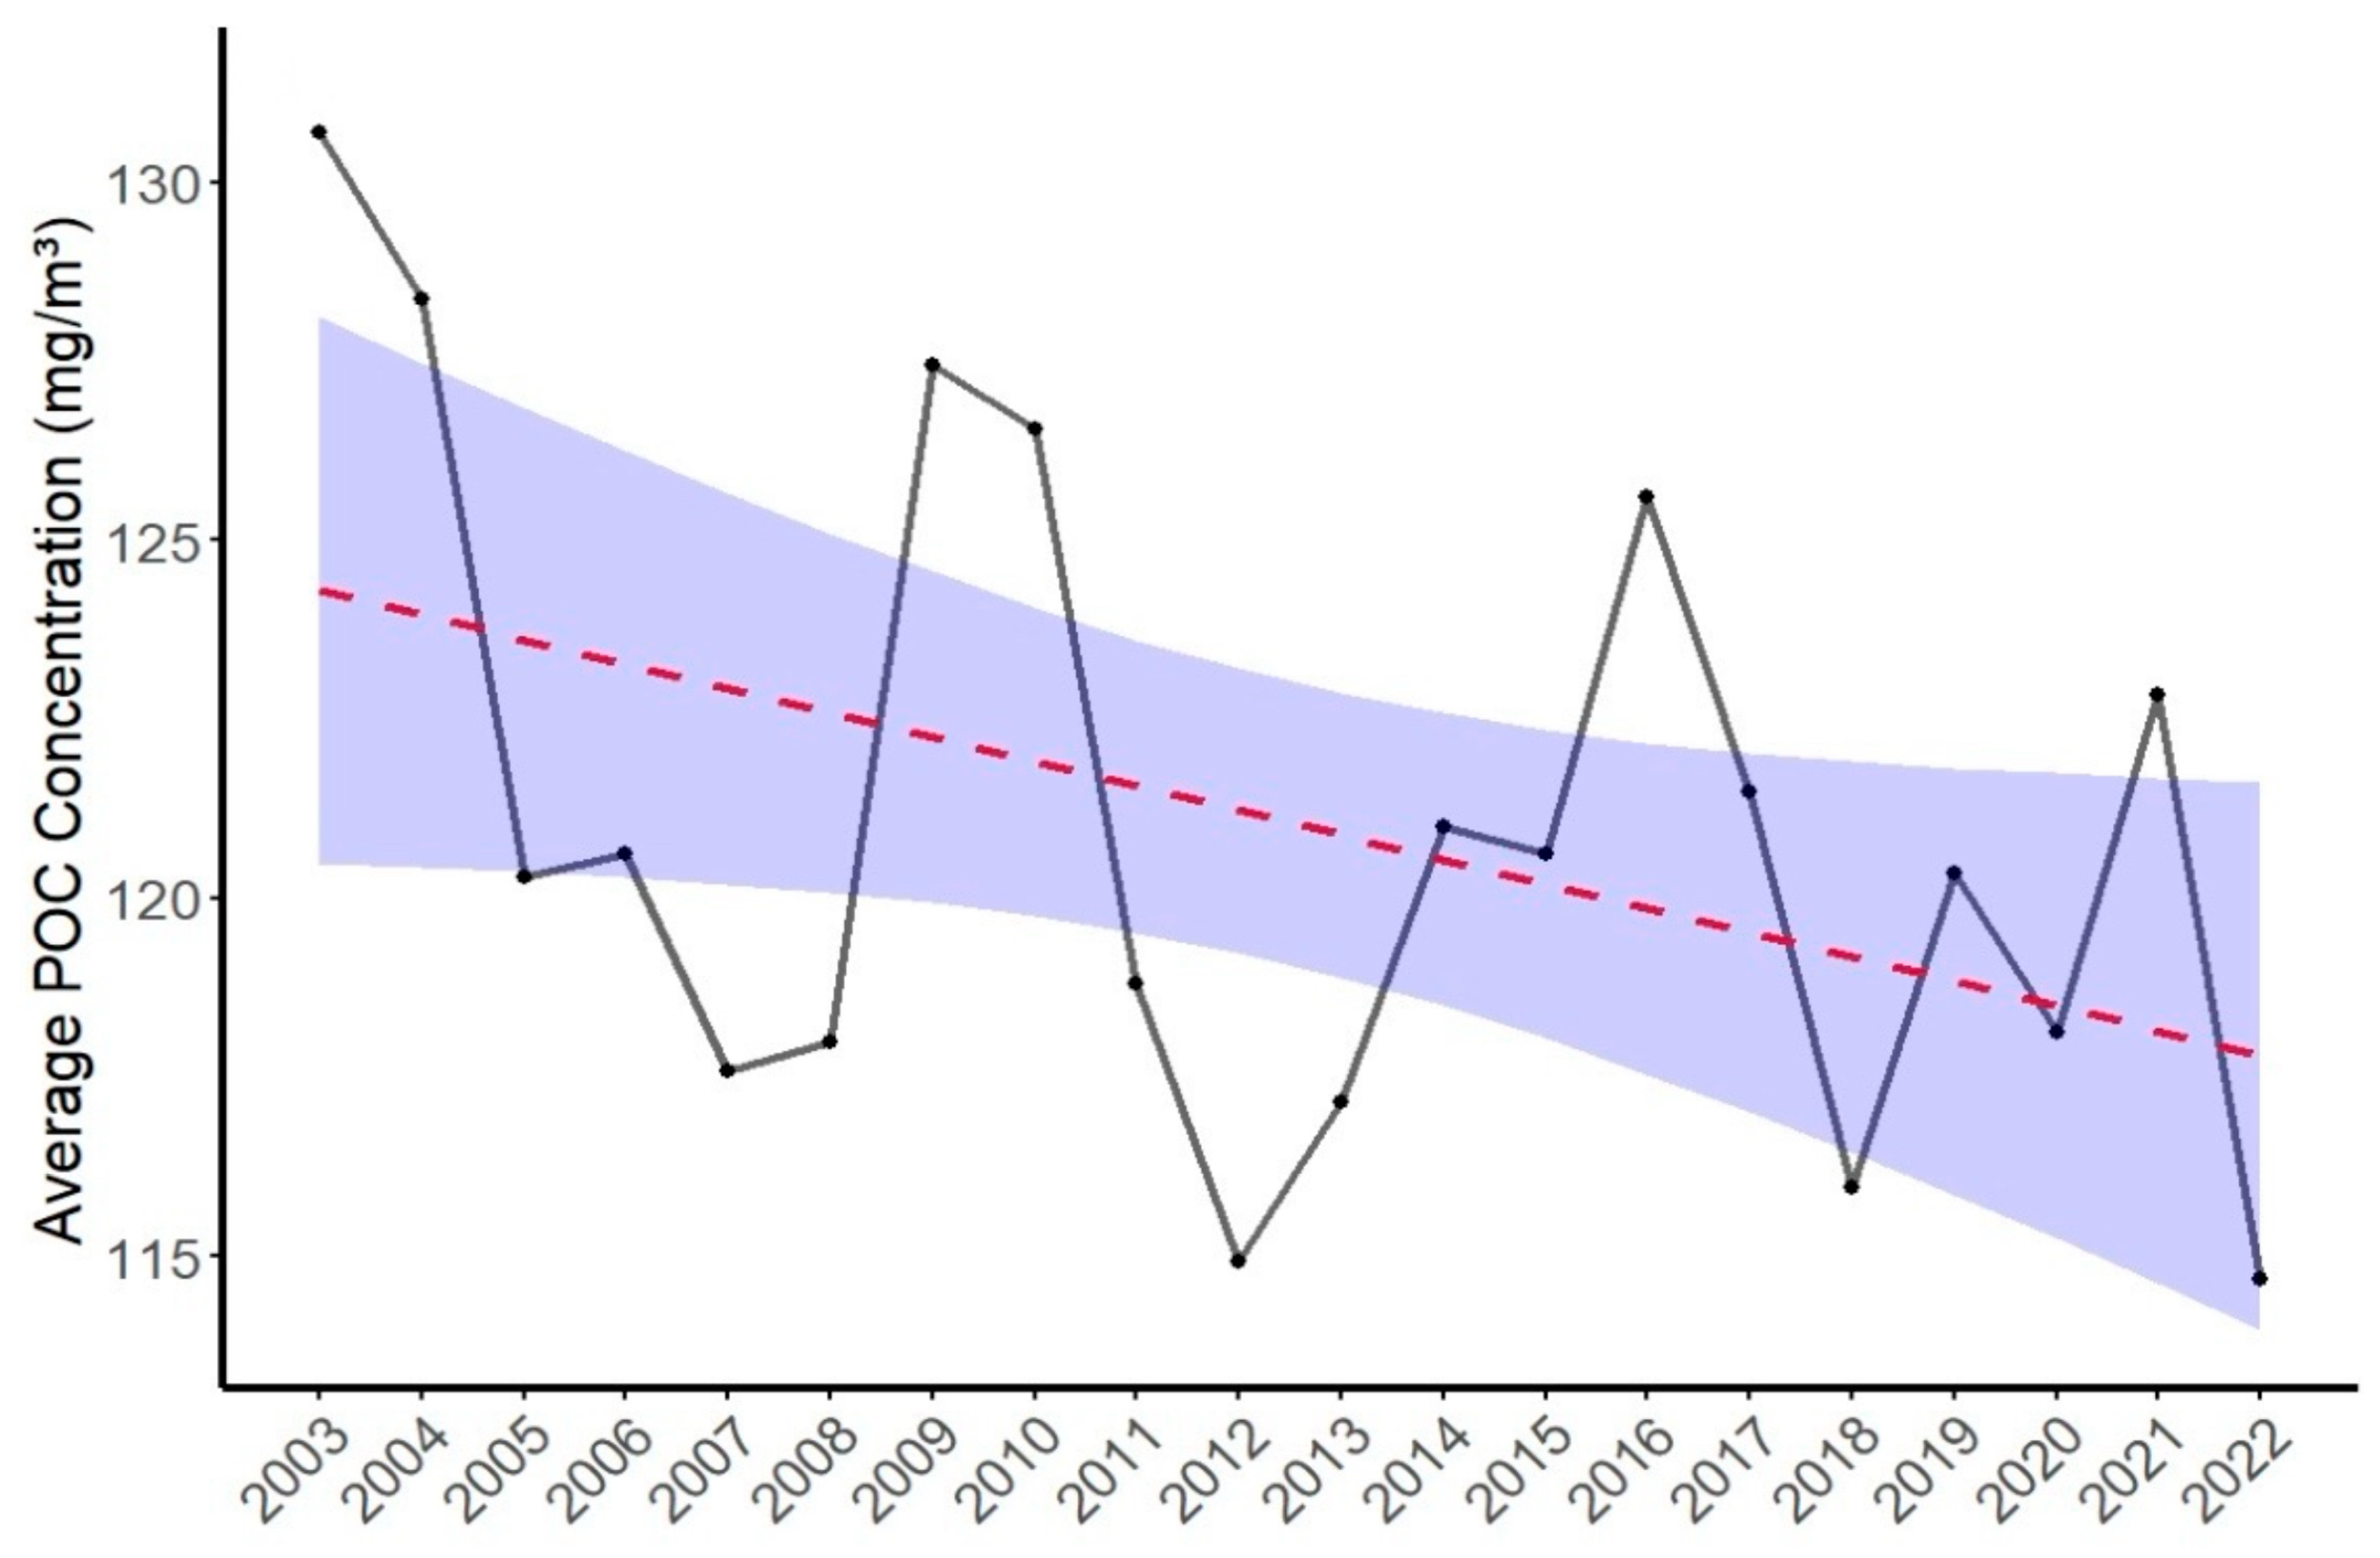
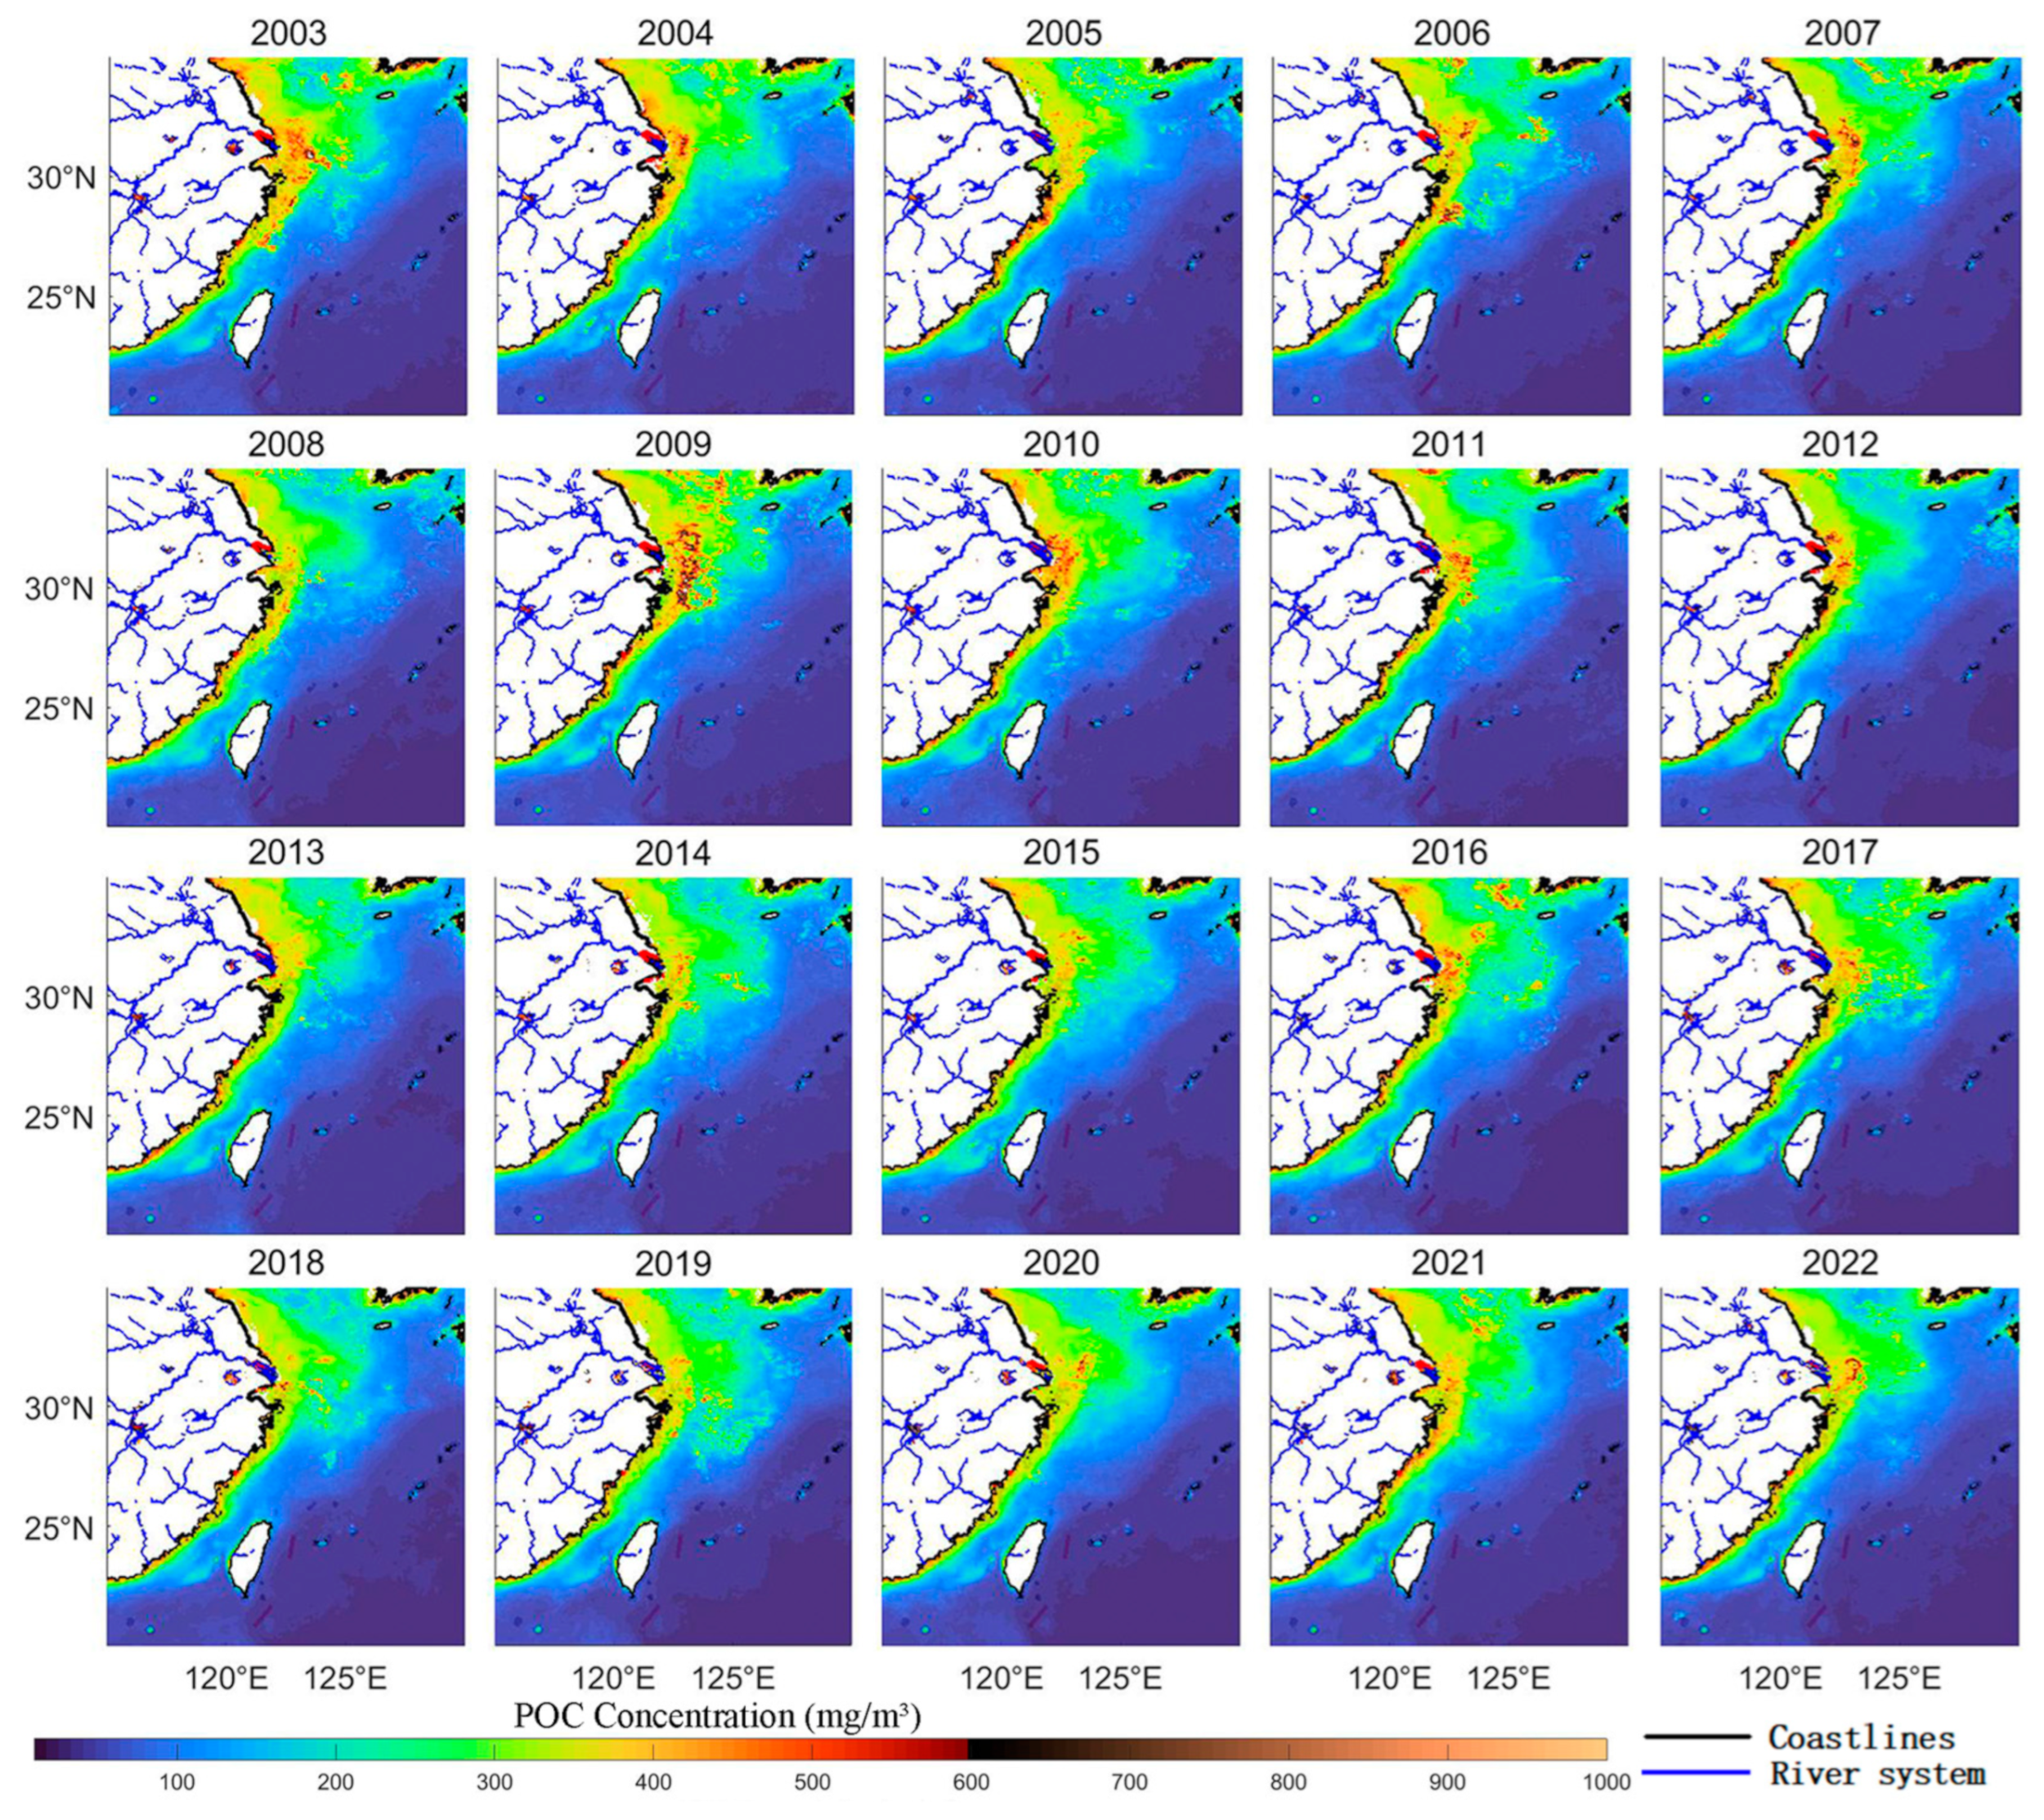
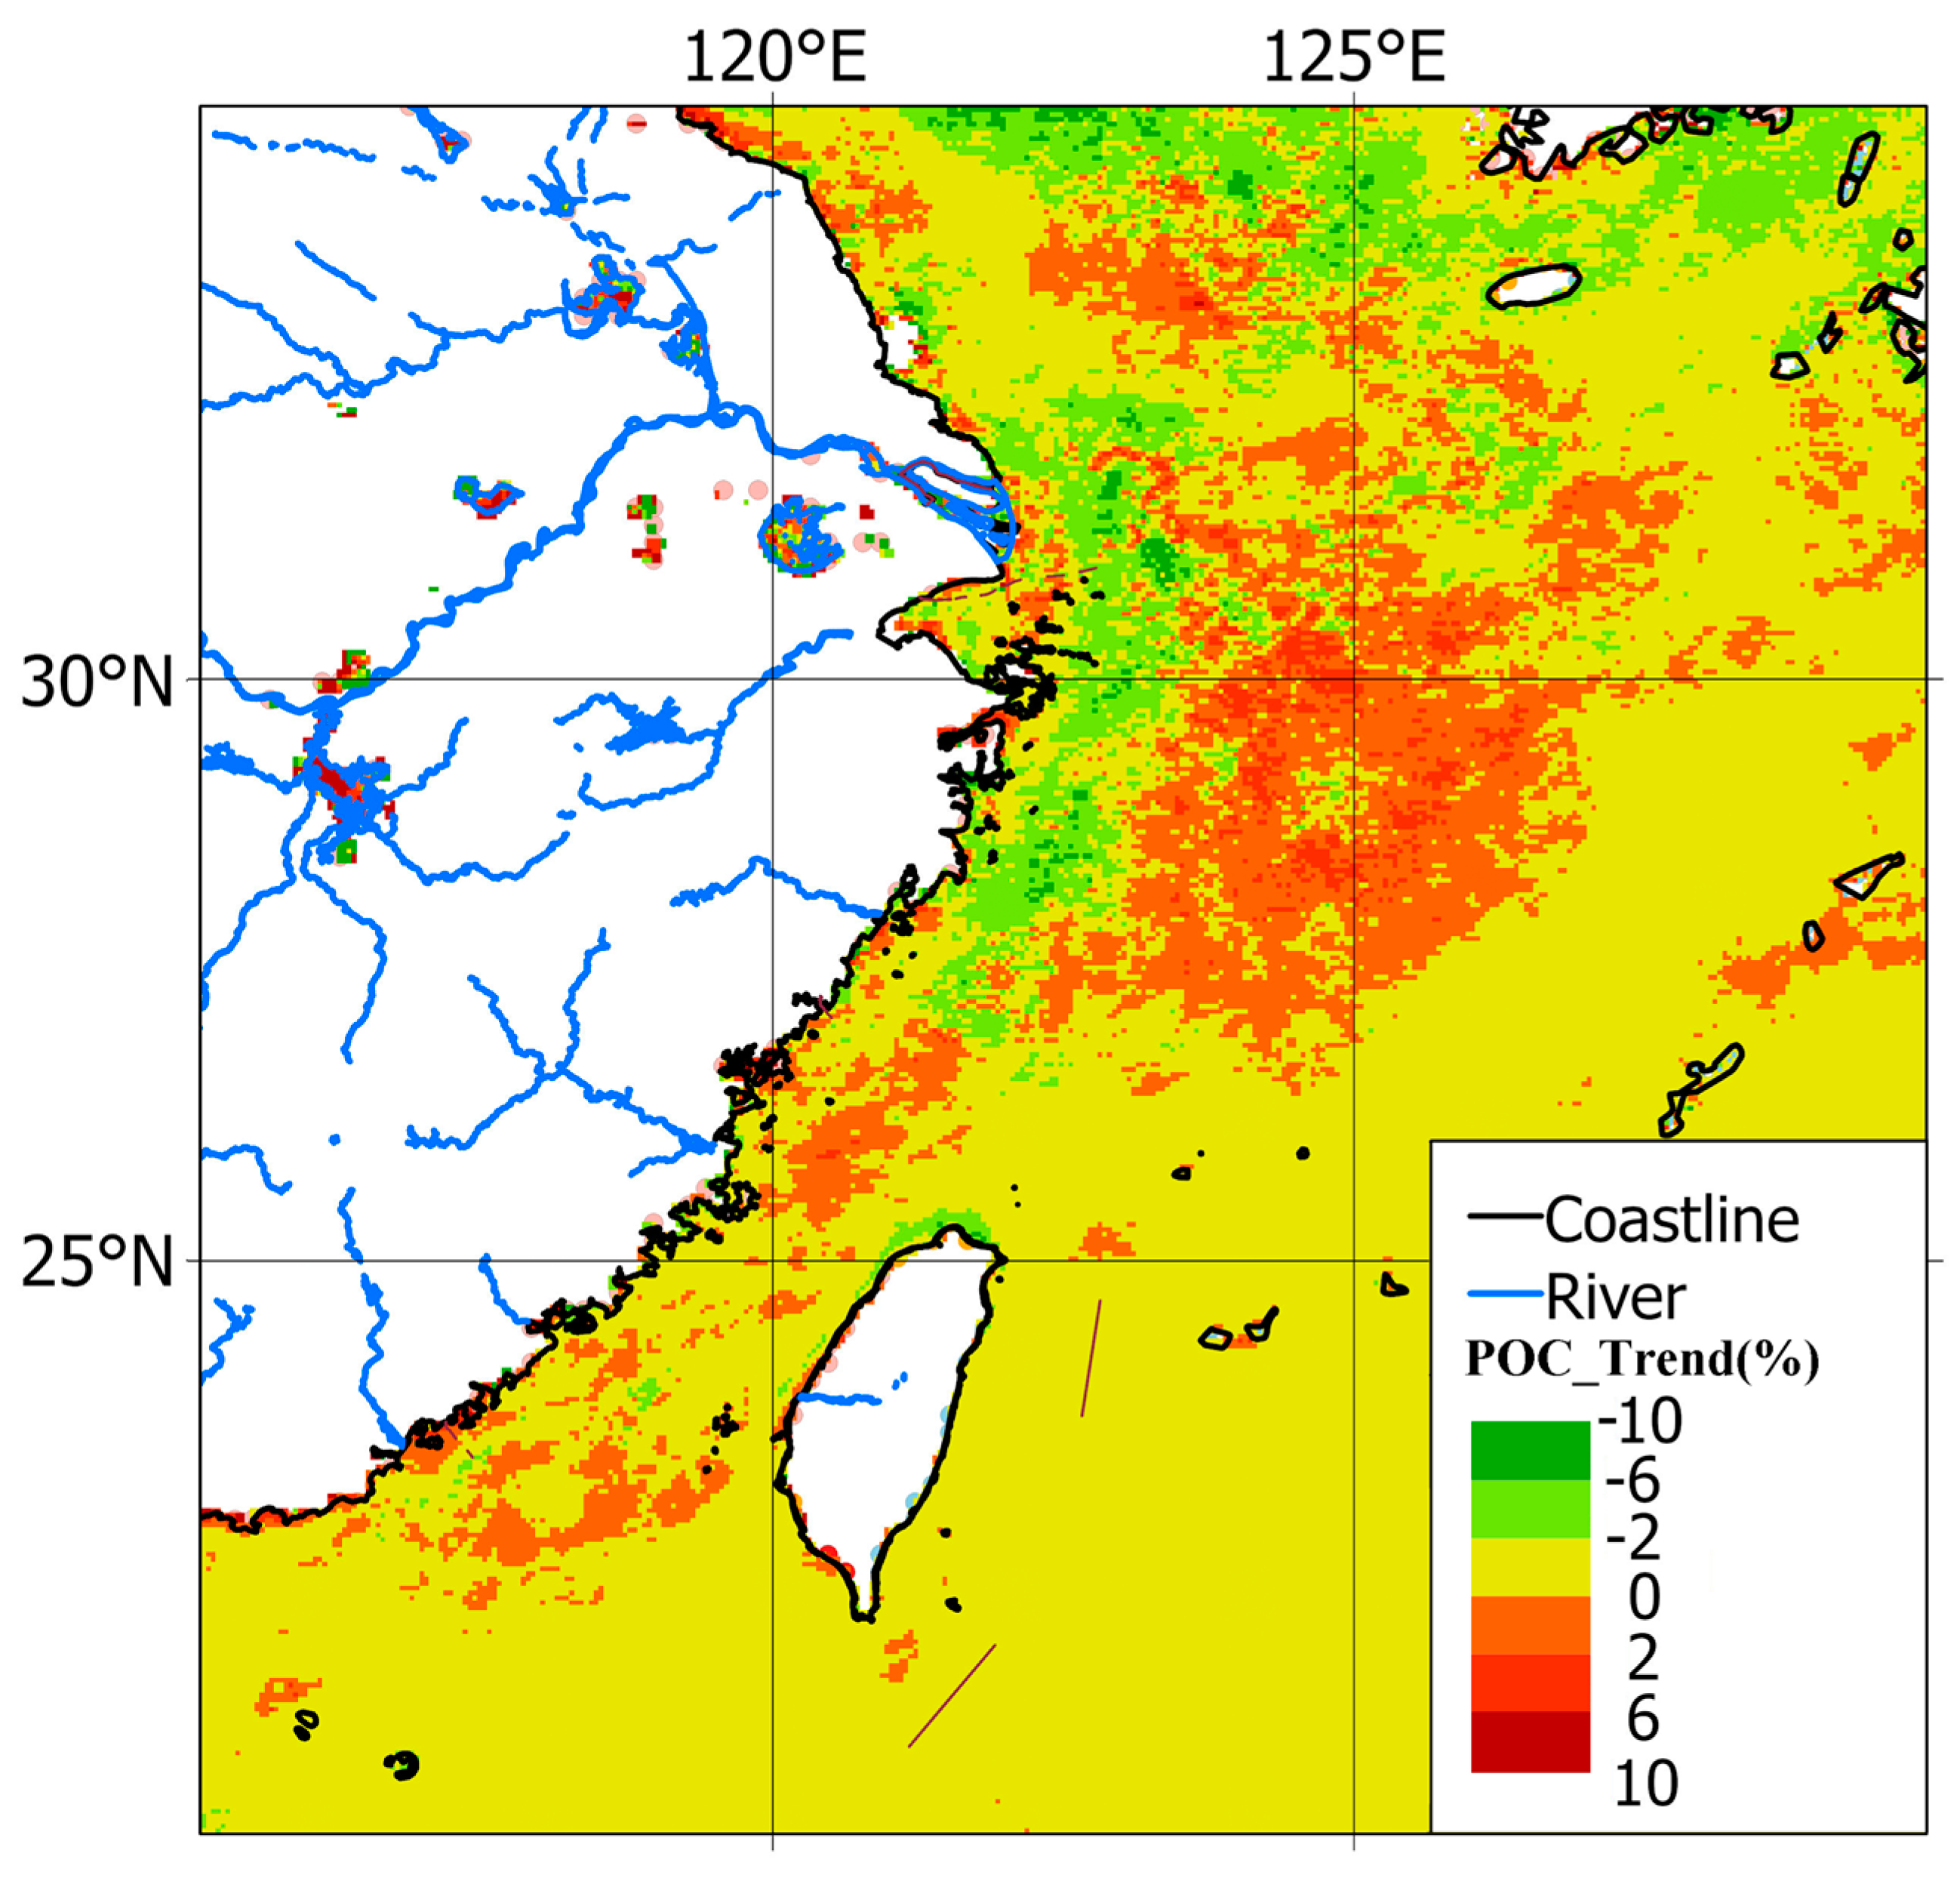
3.1. The Interannual Variation Characteristics of Particulate Organic Carbon Concentration

By analyzing the monthly average remote sensing data of POC in the East China Sea from 2003 to 2022, it was determined that the multi-year average POC concentration is 121.05 ± 4.57 mg/m3. As shown in Figure 3, the concentration exhibits a fluctuating pattern with an overall downward trend over the years.
In 2003, the East China Sea exhibited its highest annual average POC concentration at 130.69 mg/m3, whereas in 2022, it reached its lowest value of 114.69 mg/m3. Spatially, as depicted in Figure 4, the overall POC concentration in the East China Sea follows a distinct pattern: higher concentrations are observed in the western nearshore areas (308.47 mg/m3 ± 15.63 mg/m3) compared to lower concentrations in the eastern offshore regions (178.34 mg/m3 ± 15.97 mg/m3). Additionally, the northern regions show relatively high concentrations (266.53 mg/m3 ± 18.92 mg/m3), while the southern regions exhibit significantly lower values (91.50 mg/m3 ± 4.12 mg/m3). Notably, elevated POC concentrations are predominantly found along the nearshore areas and large river estuaries, with substantial interannual variability in coastal and estuarine zones. Specifically, exceptionally high POC concentrations were recorded near the Yangtze River estuary in 2003 (403.09 mg/m3), 2009 (396.61 mg/m3), 2016 (392.68 mg/m3), and 2021 (371.55 mg/m3). These concentrations exceeded the 20-year average by 27.82 ± 21.56 mg/m3, 21.33 ± 21.56 mg/m3, 17.41 ± 21.56 mg/m3, and 3.72 ± 21.56 mg/m3, respectively.

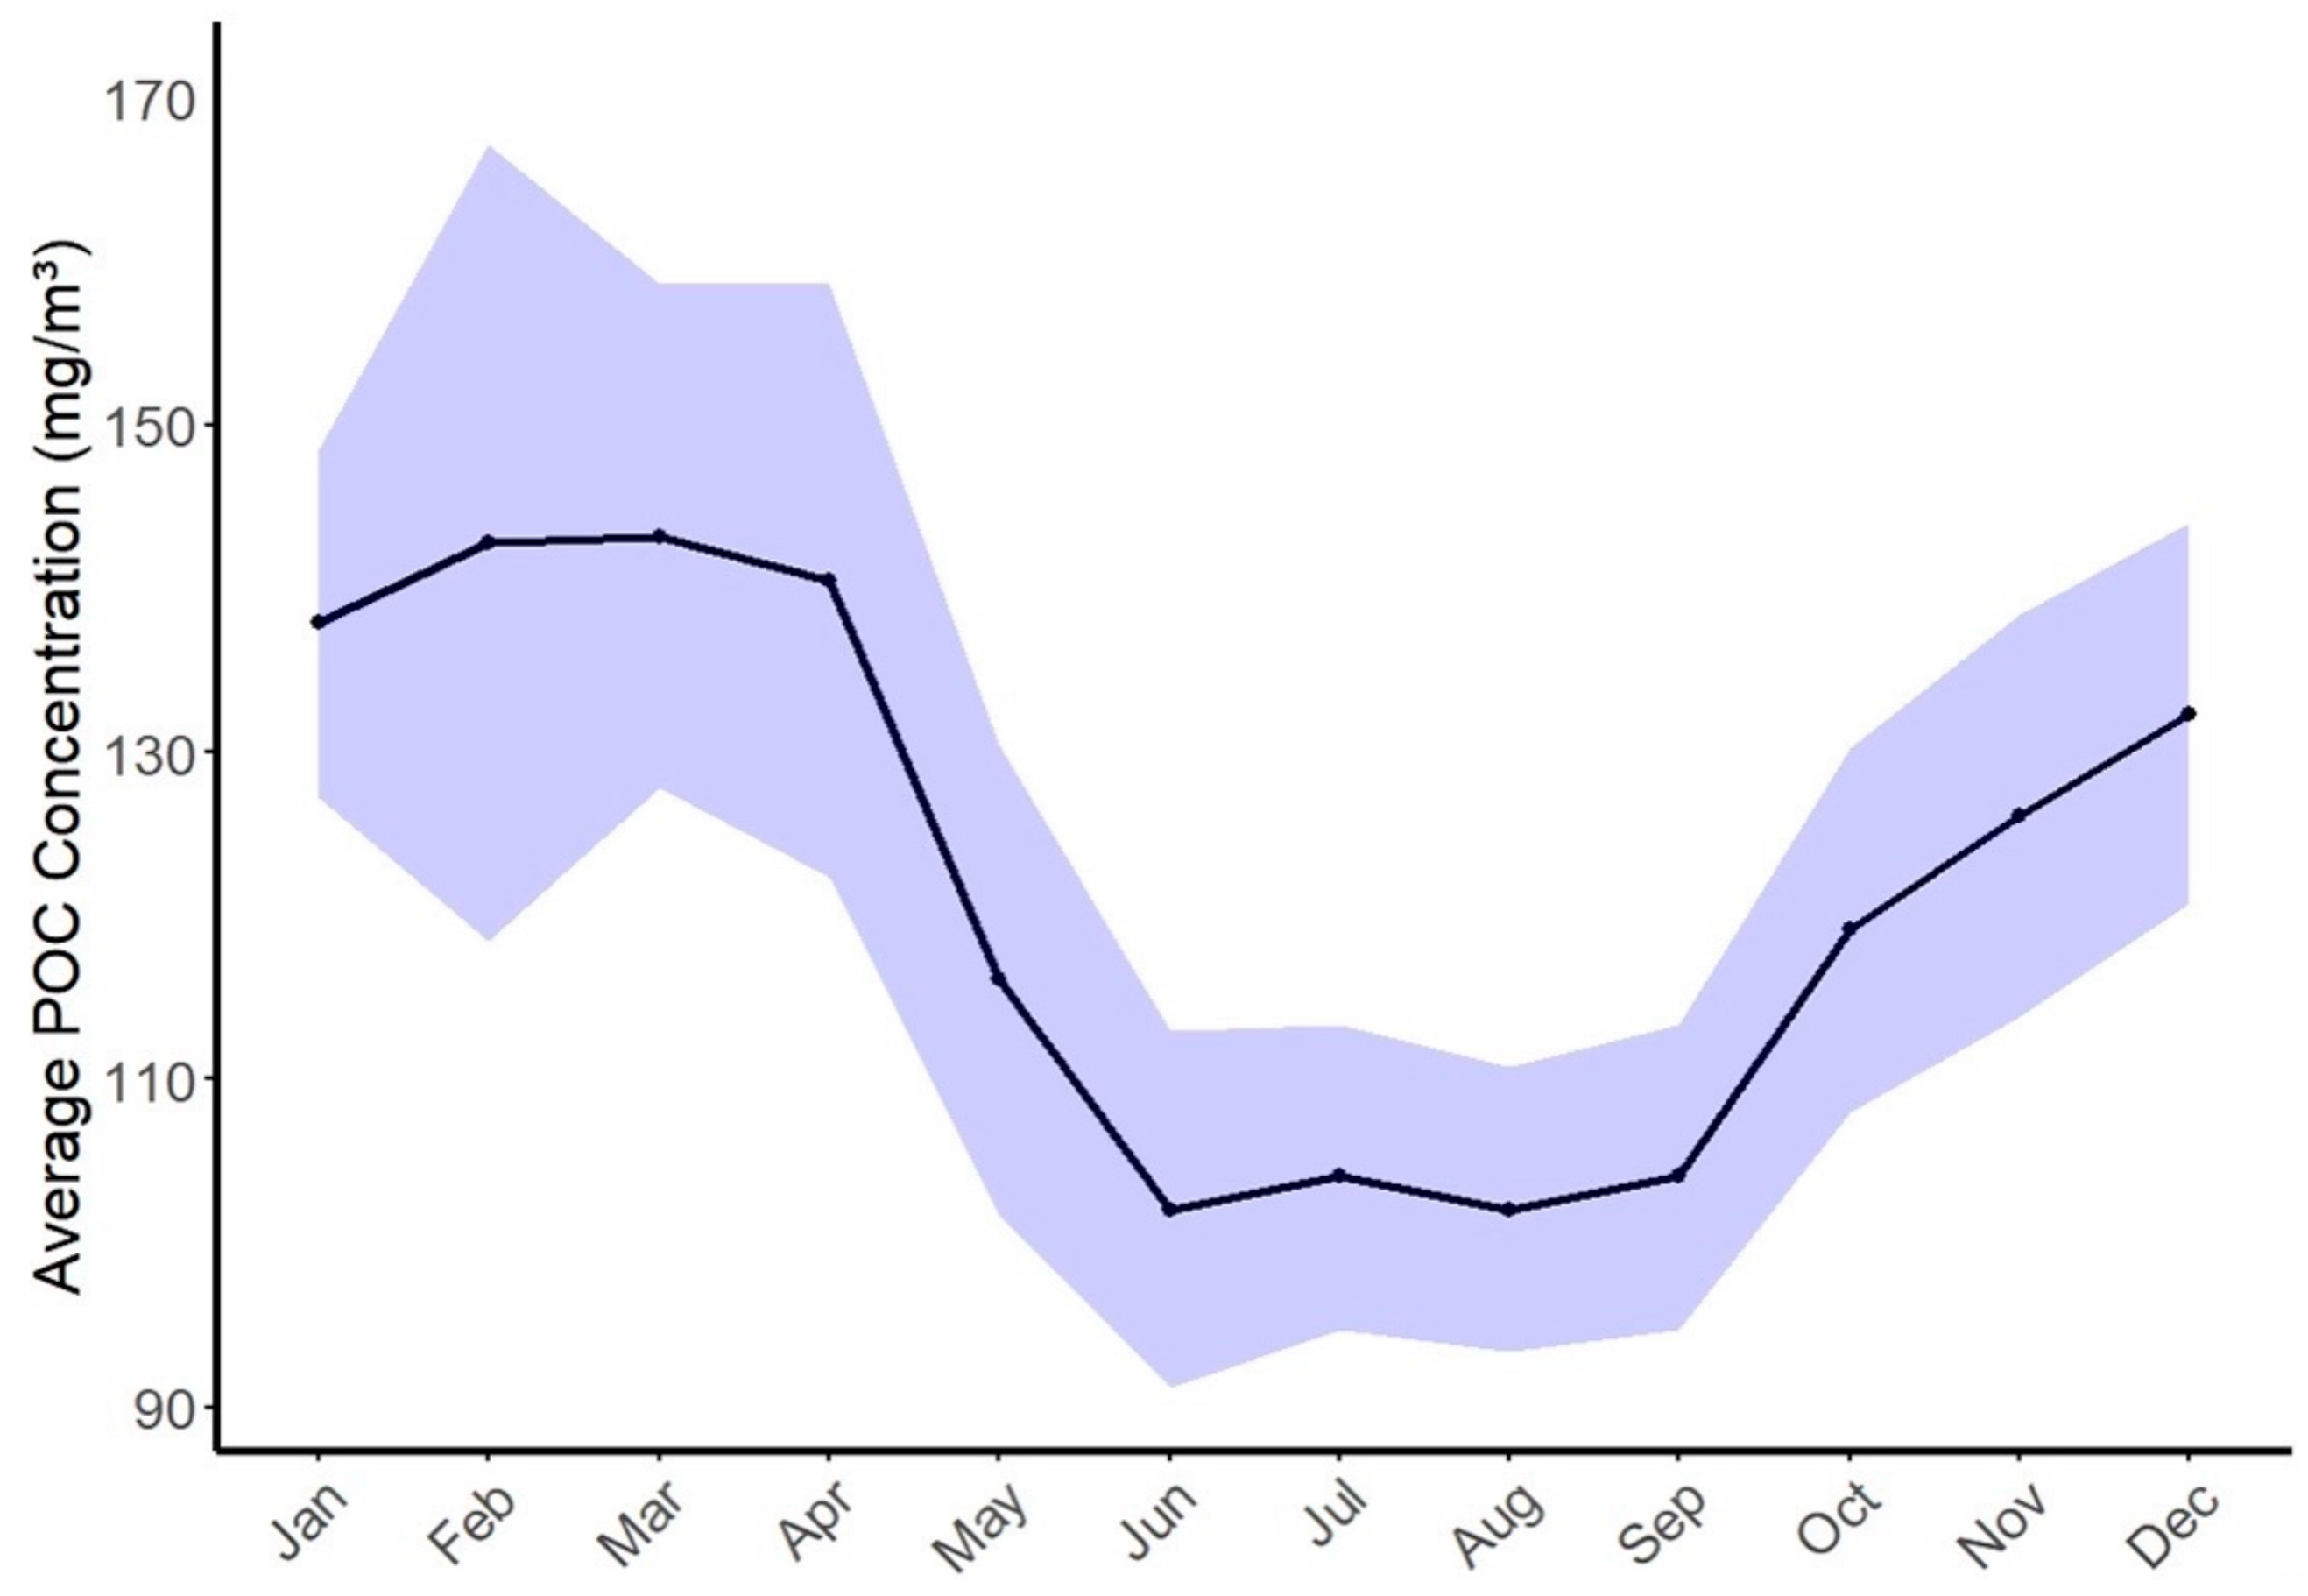
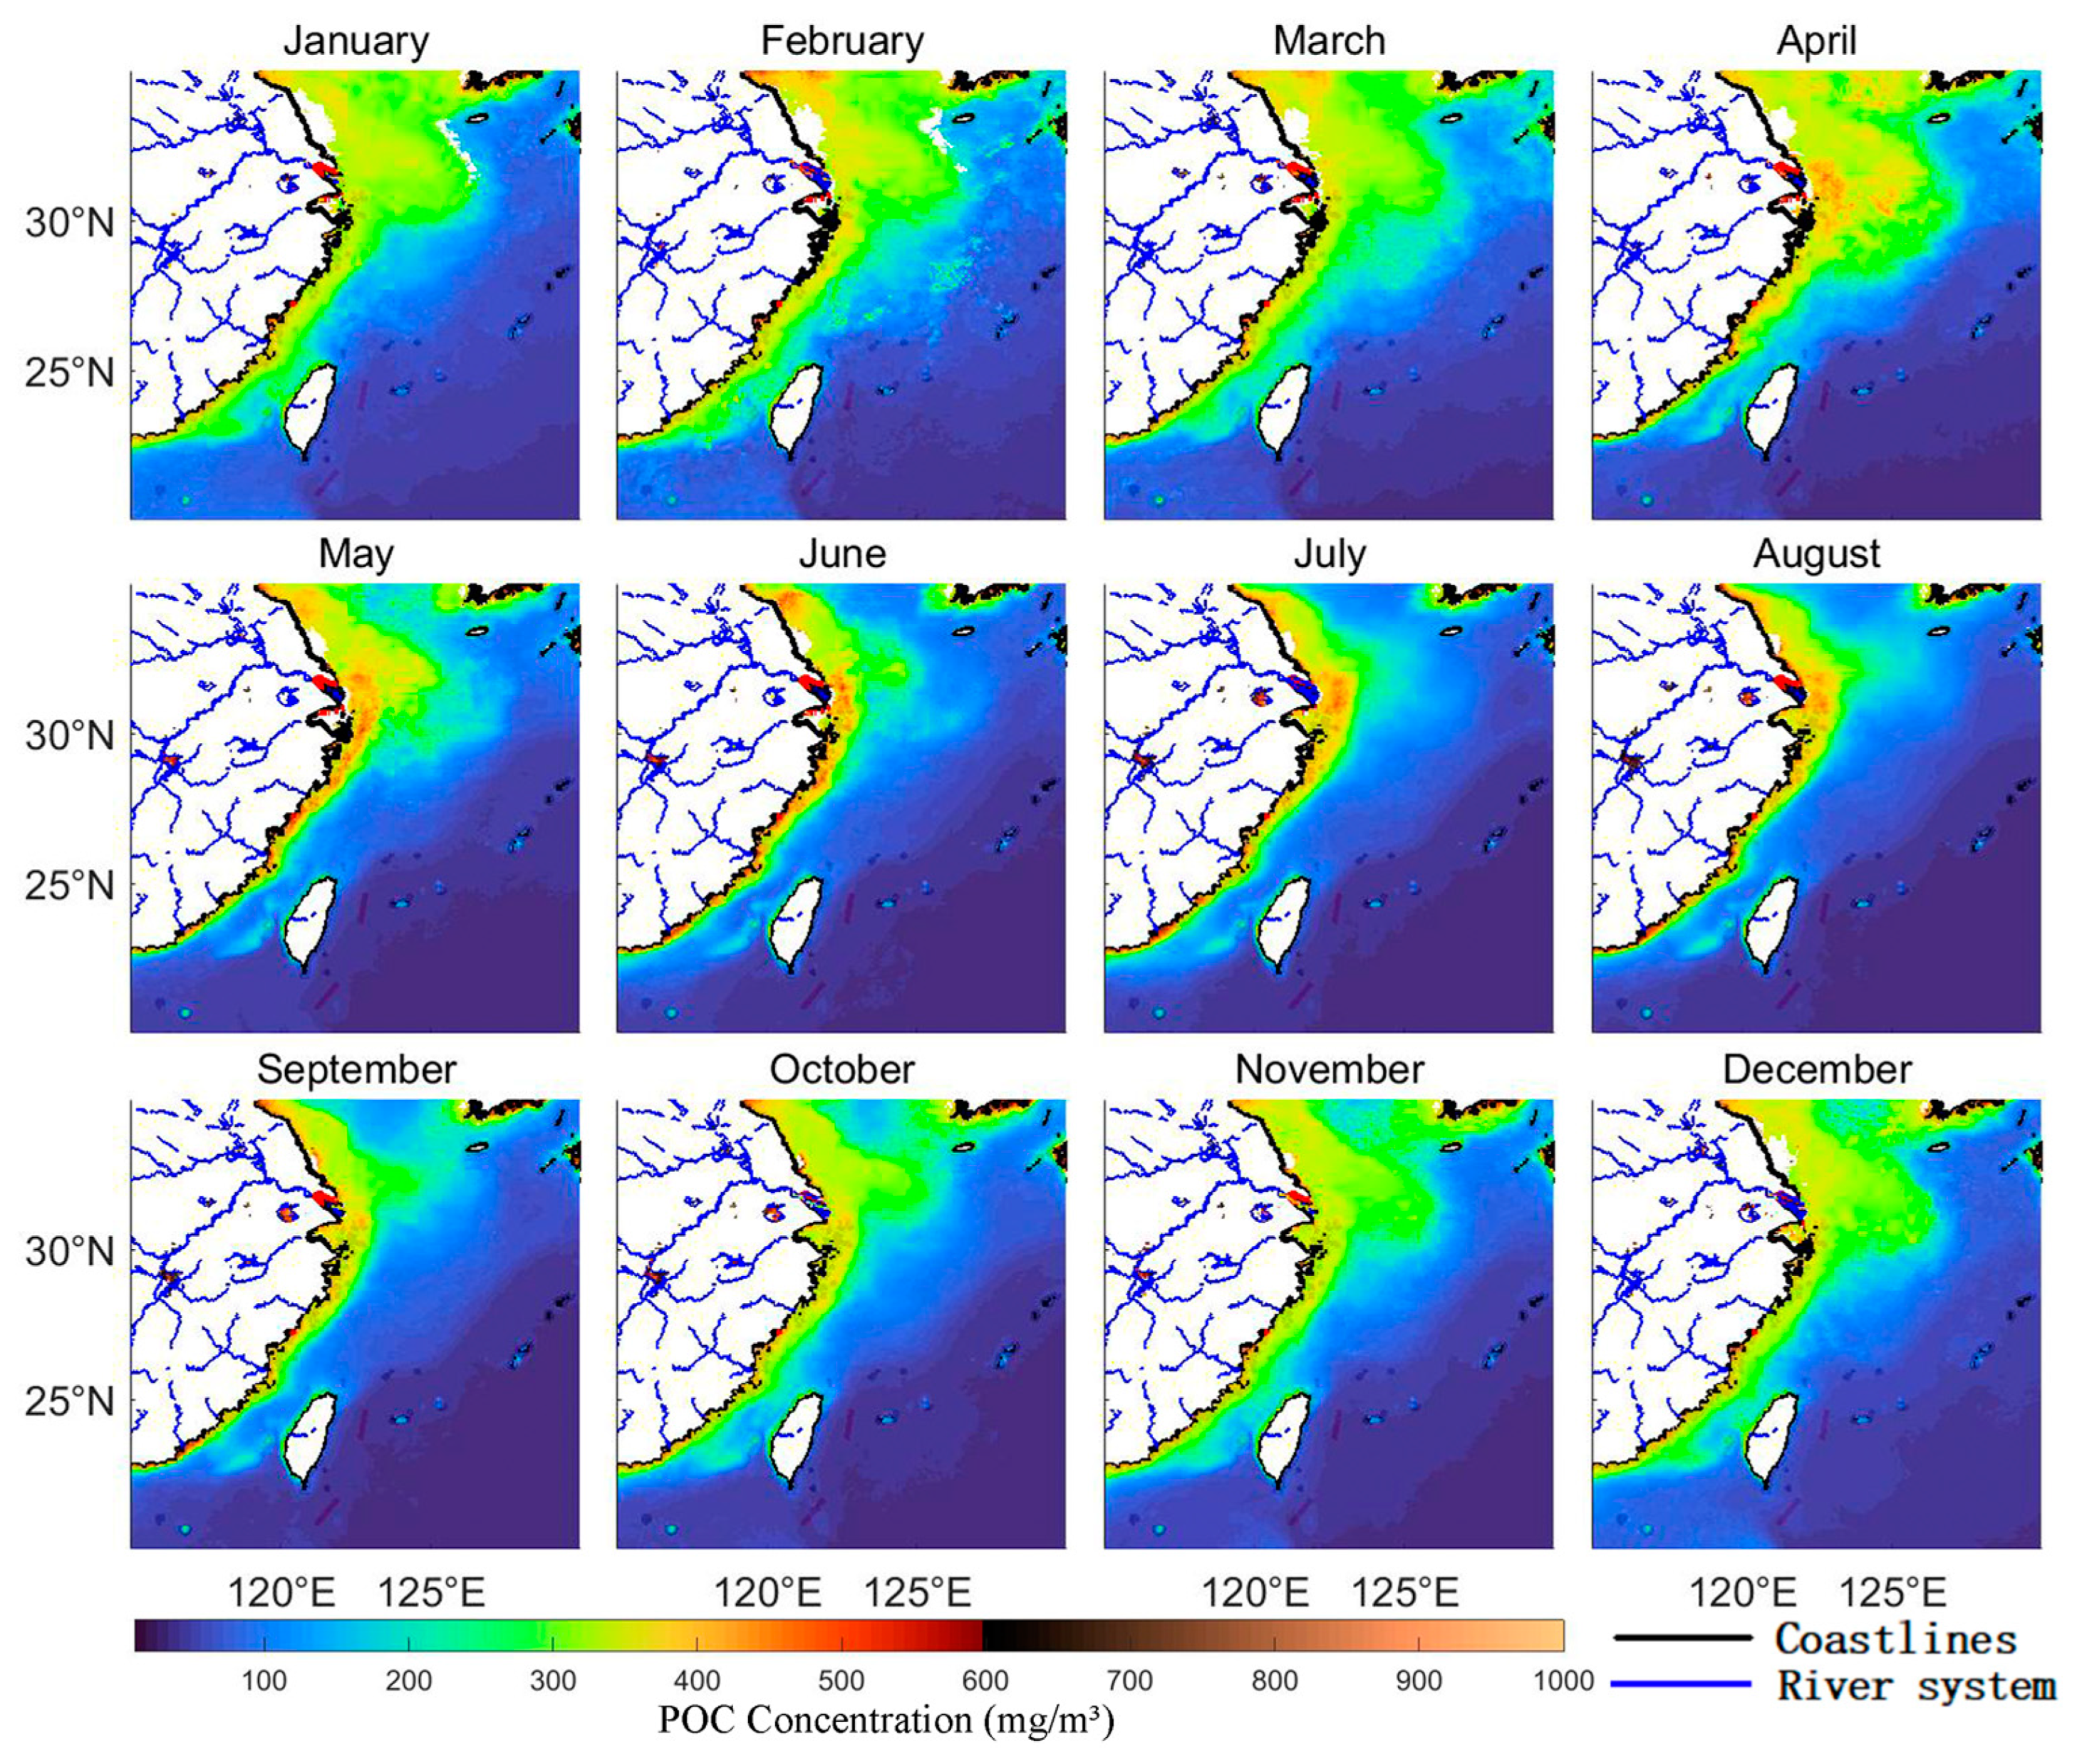
3.2. The Monthly Variation Characteristics of Particulate Organic Carbon Concentration

During the period from 2003 to 2022, the inter-monthly variation characteristics of surface POC concentration in the East China Sea exhibited a complex pattern, characterized by an initial increase, followed by a decrease (Figure 5), and then another increase. The concentration peaked in March at 143.18 mg/m3, after which it declined steadily from April to June, reaching its lowest point in June at 102.04 mg/m3. From September to December, the POC concentration gradually rebounded. In terms of spatial distribution, the POC concentration generally followed a trend of being higher near-shore and lower far-shore (Figure 6). Specifically, from January to April, the high-concentration area expanded outward from the Yangtze River estuary, gradually decreasing in intensity as it moved farther offshore. From May to June, the extent of the high POC concentration zone significantly contracted, concentrating primarily around the Yangtze River estuary. From July to September, the POC concentration remained relatively stable, with slight fluctuations but overall low values, showing a more uniform spatial distribution and no prominent high-value areas. From October to December, the POC concentration began to recover, reaching a secondary peak in December. During this period, the high-value area gradually expanded outward from the Yangtze River estuary.

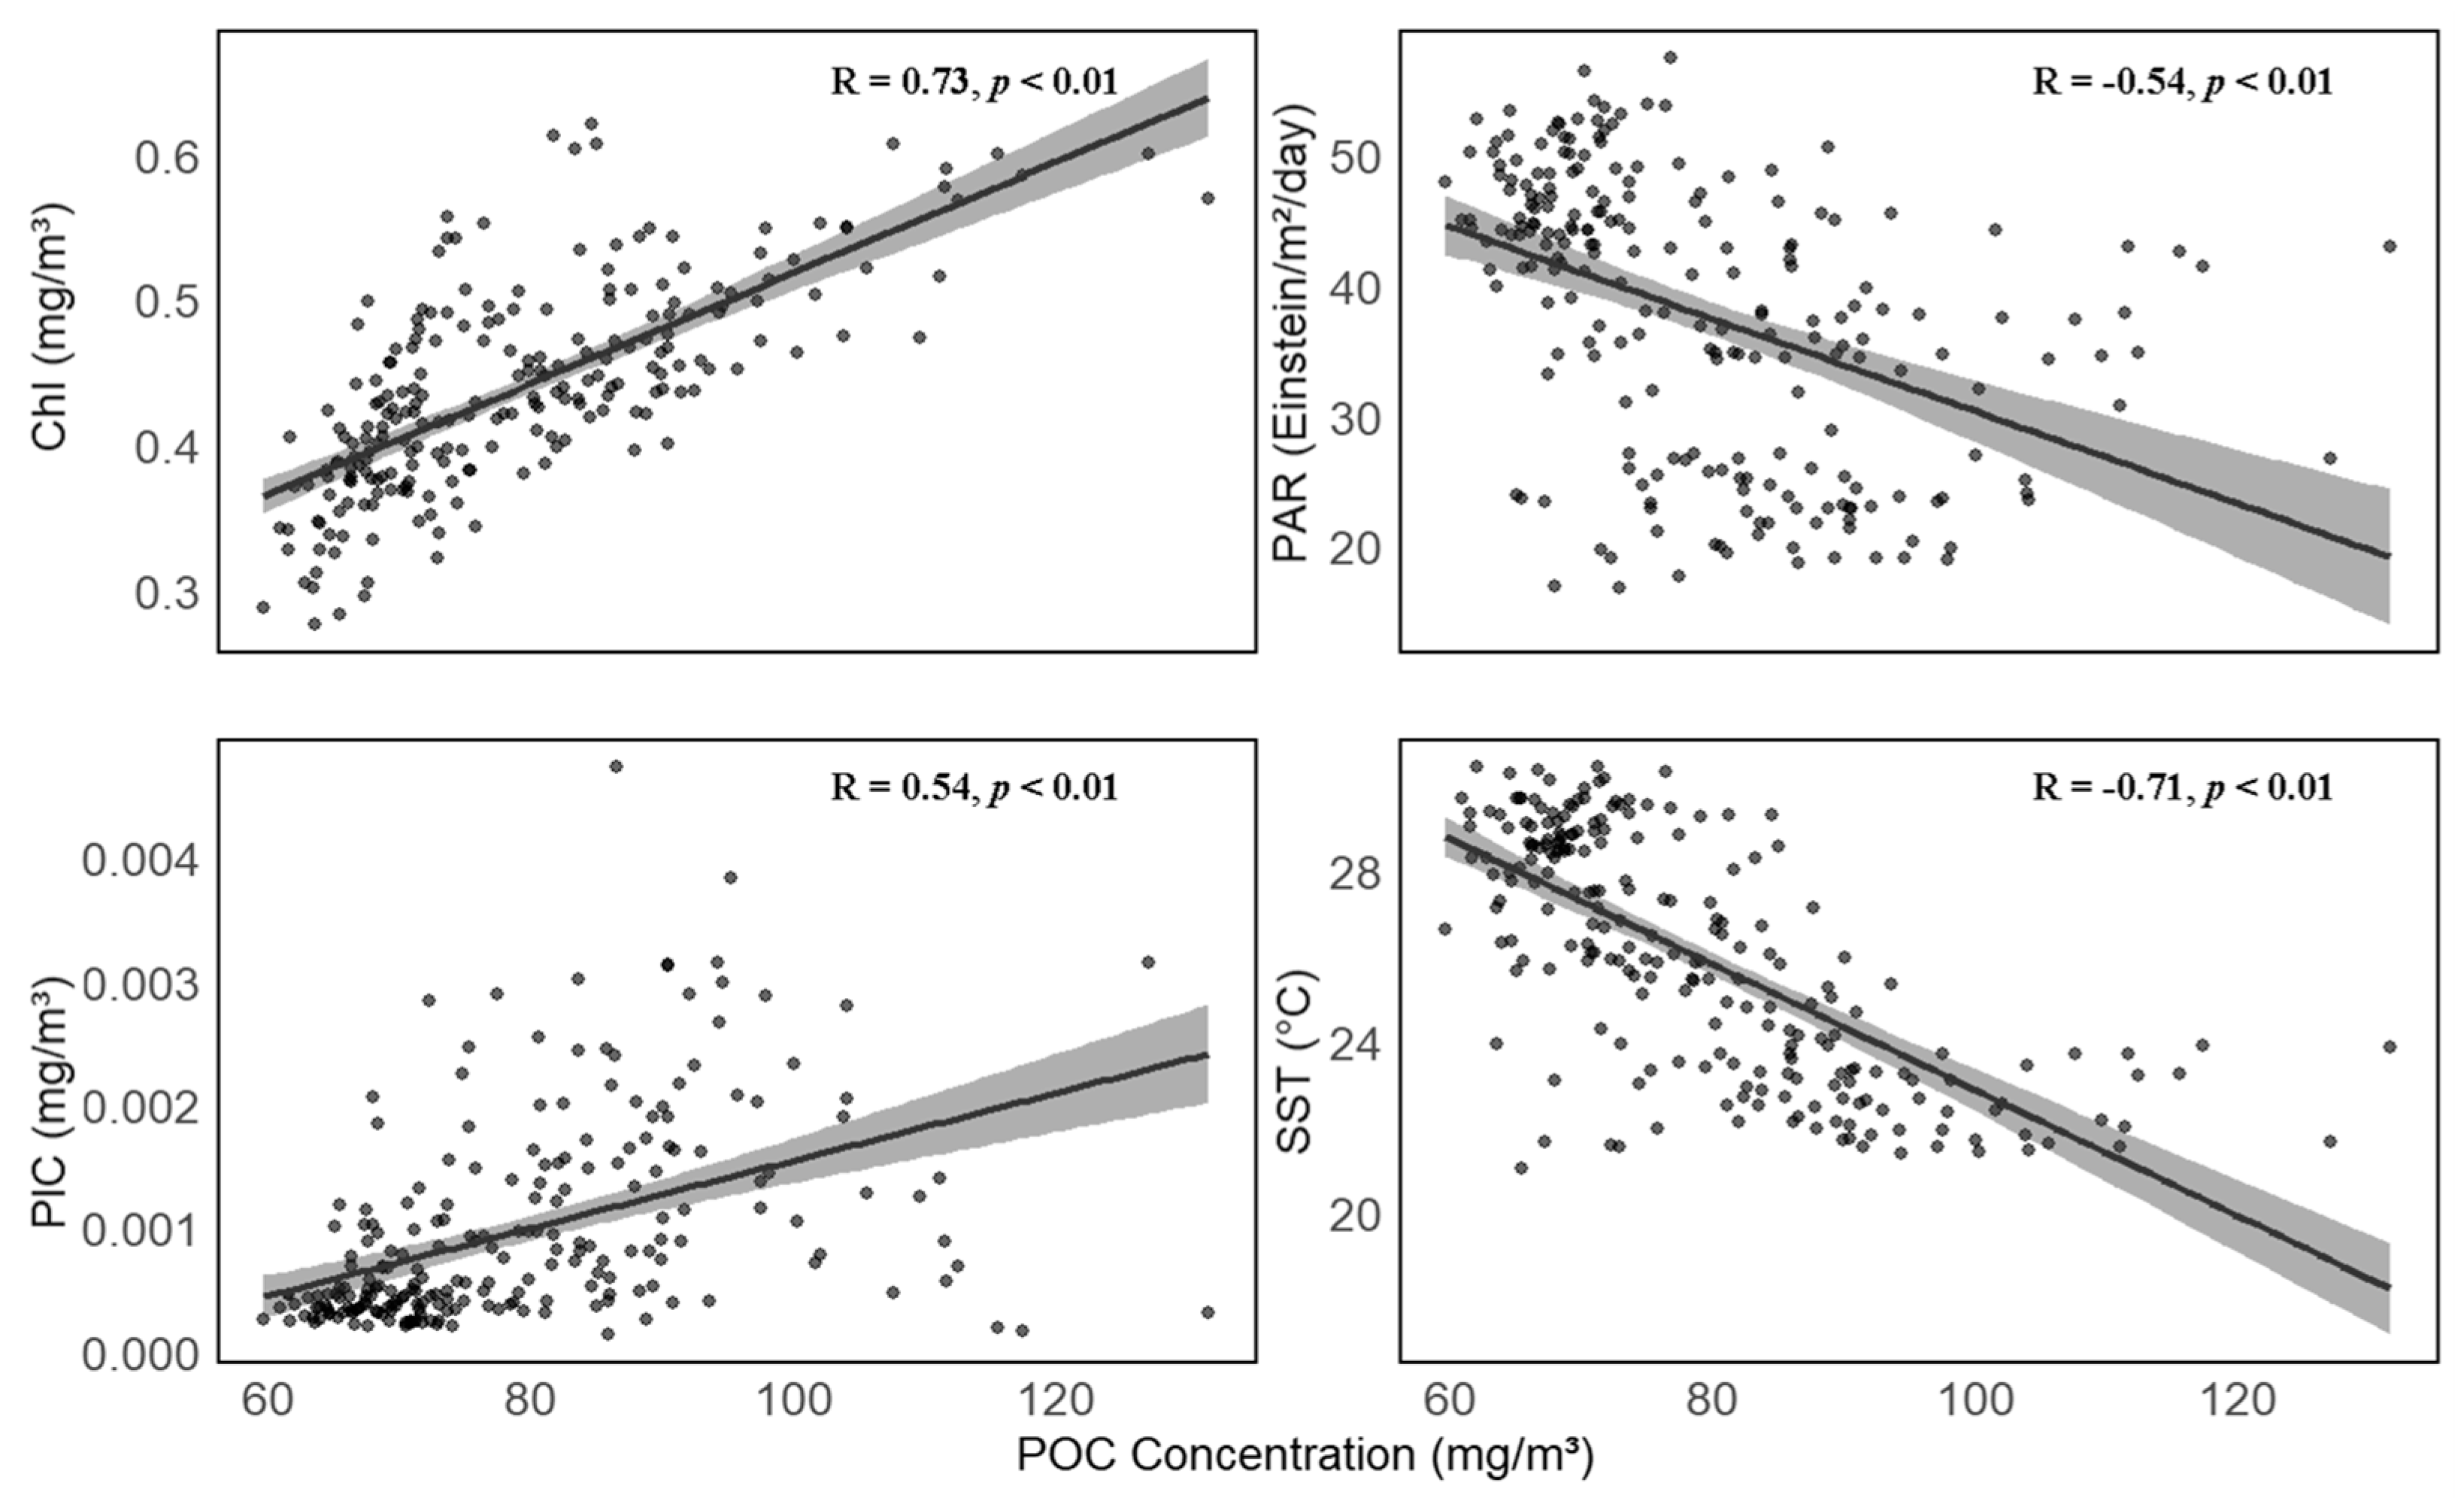
3.3. Correlation Analysis of Influencing Factors of Particulate Organic Carbon Concentration

In this study, we further analyzed the correlations among SST, PAR, PIC, Chl, and POC (Figure 7). POC exhibited a significant correlation with PIC (R = 0.54), Chl (R = 0.73), PAR (R = −0.54), and SST (R = −0.71). A strong positive correlation was observed between POC and Chl concentration, while a significant but negative correlation was found between POC and SST. These results are consistent with previous studies [33]. Additionally, POC showed less sensitivity to PAR and PIC, with moderate negative and positive correlations observed for PAR (R = −0.54) and PIC (R = 0.54), respectively.
We conducted robustness checks on the correlation analysis results (Table 1). The sub-sample analysis indicated that the correlations between each variable and POC remained consistent and significant across two different time periods. The results of the Bootstrap resampling analysis showed that the confidence intervals for the correlation coefficients of all variables did not cross zero and were relatively narrow, indicating that the correlations between these variables and POC are highly robust and consistent.
Based on the GeoDetector analysis for single-factor detection of POC (Table 2), the p-values associated with POC in relation to PIC, Chl, PAR, and SST are all significantly less than 0.001, confirming the high statistical significance of these results. Chlorophyll-a concentration exhibits strong explanatory power for the spatial variability of POC and demonstrates a significant spatial correlation with POC (q = 0.84, p < 0.01). Photosynthetically active radiation shows weak explanatory power for the spatial variability of POC (q = 0.30, p < 0.01). Sea surface temperature has moderate explanatory power for the spatial variability of POC (q = 0.64, p < 0.01). Particulate inorganic carbon demonstrates strong explanatory power for the spatial variability of POC (q = 0.75, p < 0.01).
Figure 8 illustrates the spatial distribution of correlation coefficients between surface POC and four environmental factors (PIC, Chl a, PAR, and SST) in the East China Sea. Notably, POC exhibits a very high positive correlation with Chl across the continental shelf, with many values approaching +1. The correlation between POC and PIC is significantly positive in coastal and shelf-slope regions but gradually weakens and becomes slightly negative towards the open sea. PAR shows a moderate positive correlation with POC in nearshore shallow waters, while this correlation diminishes to near zero or turns moderately negative in the open sea. Lastly, SST demonstrates a significant negative correlation with POC over a large area.

4. Discussion

4.1. The Drivers of Interannual Variability in POC Concentration

The primary sources of POC in the East China Sea are terrestrial inputs, marine biological production, and the resuspension of seabed sediments [20]. Advances in wastewater treatment, improved agricultural practices, and reduced terrestrial discharges have collectively contributed to a decline in the influx of organic matter and nutrients into the ocean. This reduction has resulted in diminished primary productivity, as evidenced by the downward trend in POC concentrations shown in Figure 3. Furthermore, climate change has substantially influenced ocean temperatures, stratification, and circulation patterns, thereby altering the distribution and availability of nutrients within marine ecosystems [46].
Riverine outflow plays a critical role in transferring carbon (POC and PIC) produced or stored on land to the ocean [47]. In the shallow nearshore regions of the East China Sea, POC concentrations are significantly influenced by terrestrial inputs and sediment resuspension induced by coastal currents. Notably, the Yangtze River delivers substantial amounts of organic matter and inorganic nutrients to the sea, resulting in elevated POC concentrations in the Yangtze River estuary. Estuarine POC consists of a complex mixture of locally produced particulates (e.g., from macrophytes and phytoplankton) and heterogeneous particles (e.g., C3 and C4 plants, soil organic carbon) originating from rivers, coastal areas, and estuarine wetlands (including mudflats and salt marshes) [48]. In offshore regions, POC concentrations are relatively low due to the greater distance from land and limited nutrient supply, which reduces primary productivity. Despite seasonal fluctuations, overall POC concentrations remain at a consistently low level. Around islands, higher POC concentrations may be attributed to local topography and water flow patterns that facilitate the accumulation of POC in surrounding waters.
We conducted a spatial autocorrelation analysis of POC concentrations in the East China Sea (Moran’s I = 0.54, z-score > 2.58, p < 0.01), which indicates a significant spatial clustering phenomenon. The positive Moran’s I value suggests that POC concentrations exhibit positive spatial autocorrelation, meaning neighboring regions tend to have similar POC concentration levels. The overall trend of change in POC concentration in the East China Sea shows a downward tendency (Figure 9). Spatial distribution patterns reveal substantial regional differences, with higher rates of change predominantly concentrated in coastal and nearshore areas. Notably, high rates of change in POC concentration are observed along the coasts of Jiangsu, Zhejiang, and Fujian provinces, which are economically developed regions characterized by dense human activities. Changes near the Yangtze River estuary are particularly pronounced, primarily due to large riverine inputs from the Yangtze River, which deliver abundant organic matter. In contrast, offshore areas exhibit lower rates of change in POC concentration, with relatively stable organic carbon concentrations. These regions are less influenced by terrestrial inputs and anthropogenic activities, indicating that the offshore ecosystem relies more on natural biogeochemical cycling processes rather than external organic matter inputs. High-High clusters (red areas) near the Yangtze River estuary represent regions with consistently high POC concentrations (Figure 10), likely attributed to sustained nutrient inputs [49]. Low-low clusters (blue areas) correspond to regions with low POC concentrations, possibly associated with low productivity or effective carbon removal processes. The presence of High-Low and Low-High outliers highlights localized anomalies where POC concentrations deviate from surrounding areas, potentially driven by unique environmental conditions or events.
Figure 11 illustrates the spatial distribution and trends of POC concentrations in relation to latitude and longitude. A consistent decline in POC concentrations is observed from south to north, potentially attributed to variations in nutrient distribution and riverine inputs, particularly the eutrophication effect from the Yangtze River estuary, which enhances POC levels in southern waters (Figure 11a). Similarly, POC concentrations decrease from west to east, driven by physical oceanographic processes such as water mass mixing and tidal movements (Figure 11b). The POC distribution in the East China Sea is influenced by a combination of factors, including riverine inputs, wind patterns, and ocean currents. Elevated POC concentrations near the Yangtze River estuary are primarily due to terrestrial material input and suspended particles. The rate of change in POC concentrations increases progressively from south to north but stabilizes at higher latitudes, indicating relatively uniform POC levels (Figure 11c,d). Conversely, the rate decreases from west to east, reflecting reduced variability in the eastern regions [48,49,50]. This analysis highlights the intricate interplay of multiple factors shaping POC distribution in the East China Sea.

4.2. The Factors Contributing to Inter-Monthly Variations in POC Concentration

From January to April, the prolongation of sunshine duration and the gradual increase in temperature provided increasingly favorable light and thermal conditions, thereby stimulating phytoplankton growth. This resulted in a substantial production of POC through photosynthesis. During spring, increased rainfall in the Yangtze River basin [51,52,53] significantly enhanced freshwater input, transporting large quantities of suspended particles, organic matter, and nutrients into the estuary and adjacent coastal areas. This process markedly elevated POC concentrations in nearshore regions. Concurrently, the vertical mixing of seawater weakened, leading to stratification. As a result, nutrients and organic carbon were retained more effectively in the light-rich surface layer, further enhancing phytoplankton photosynthesis and increasing POC concentration. Additionally, reduced wind intensity diminished surface turbulence, decreasing the downward transport of POC and contributing to higher POC concentrations in the surface layer.
As precipitation and snowmelt increase from April to May, the river discharge gradually rises [51,52,53]. The flow peaks between June and August [52], during which large-scale freshwater input significantly dilutes the POC concentration at the Yangtze River estuary. Meanwhile, the flow recorded at the Datong hydrological station increases from 16,543 m3/s during the dry season to 35,579 m3/s during the flood season. Intense rainfall [52] and increased runoff enhance vertical mixing in the Yangtze River estuary region, causing organic particulates such as phytoplankton to be transported downward into deeper water layers. As a result, the depth of the mixed layer becomes shallower.
In addition, the elevated water temperature expedited the metabolic processes of microorganisms, thereby enhancing the biodegradation rate of organic carbon and consequently reducing the concentration of POC. From July to September, phytoplankton primary productivity was relatively low, likely due to the persistent effects of heavy rainfall and river runoff. These factors caused the continuous mixing of nutrients and organic matter into deeper water layers, diminishing the accumulation of POC in the surface layer. From October to December, as sea surface temperatures declined, the vertical temperature gradient and water density differences decreased, weakening the stability of the water column. Concurrently, the northeast monsoon intensified vertical seawater mixing, deepening the mixed layer and facilitating the upward transport of nutrients from deeper waters. This process increased phytoplankton biomass in the surface layer and subsequently elevated the POC concentration in the upper water column. Moreover, reduced rainfall and river runoff diminished freshwater inputs, relatively increasing seawater salinity [54]. This change altered sediment resuspension dynamics and enabled the re-suspension of organic matter from the bottom layer into the upper water column. The decreasing water temperatures slowed the metabolic activities of marine organisms, reducing feeding and decomposition rates of POC, prolonging the residence time of organic matter in seawater, and ultimately increasing the POC concentration.

4.3. Analysis of the Influencing Factors on POC Concentration

Chl is essential for phytoplankton photosynthesis, during which absorbed carbon dioxide is converted into POC [55]. Tropical cyclones and typhoons can induce upwelling via “Ekman pumping”, where strong winds displace surface waters, enabling nutrient-rich deeper waters to rise to the surface. This influx of nutrients, including nitrogen and phosphorus, stimulates phytoplankton blooms, leading to increased Chl concentrations and contributing to higher POC levels [56,57]. As SST rises, water stratification intensifies, reducing vertical mixing. This prevents deep nutrients from reaching the surface, thereby slowing phytoplankton growth and decreasing Chl and POC concentrations [16]. Higher SST can enhance microbial metabolic rates, accelerating the decomposition of organic matter. This process reduces POC by converting it into dissolved inorganic carbon [44,58]. SST influences the species composition of phytoplankton communities, favoring smaller species such as picoplankton under warmer conditions. These smaller phytoplankton exhibit lower carbon fixation efficiencies and slower sinking rates compared to larger species. Consequently, they contribute less to POC exports since they are more likely to be recycled in the upper ocean rather than sinking to deeper layers. This shift in community composition can lead to a reduction in overall POC export, impacting the carbon cycle dynamics in marine ecosystems [59,60].
PAR is critical for photosynthesis, and its availability significantly affects phytoplankton growth rates [61]. In the East China Sea, surface waters exposed directly to sunlight mean that changes in PAR directly influence phytoplankton photosynthesis. With sufficient light, phytoplankton can efficiently photosynthesize, rapidly utilizing carbon dioxide and nutrient salts in the water to produce organic matter, part of which is converted into POC. When PAR decreases, photosynthetic efficiency declines, reducing organic carbon production. PIC, often produced by calcifying organisms such as coccolithophores, can alter ocean carbonate chemistry and indirectly influence POC dynamics [62,63]. The East China Sea, influenced by large rivers like the Yangtze, exhibits prolific phytoplankton growth. PIC production can modify seawater alkalinity, affecting CO2 solubility and availability for photosynthesis. PIC particles can enhance the sinking of organic matter by acting as ballast, facilitating the transport of POC to the ocean’s depths [64]. Physical processes such as eddies, tides, and upwelling cause the resuspension and redistribution of inorganic and organic carbon, resulting in similar distribution patterns for PIC and POC [65,66,67]. Biological mineralization of dead phytoplankton and other marine organisms converts organic carbon into inorganic carbon, influencing PIC and POC concentrations in seabed sediments [68]. Nearshore, stronger water mobility and mixing result in greater fluctuations in POC and PIC concentrations, leading to lower correlation coefficients. In intermediate sea areas, reduced current mixing stabilizes POC and PIC concentrations, increasing correlation coefficients [69]. Farther offshore, enhanced mixing due to currents and hydrodynamic processes may again decrease correlation coefficients.

4.4. Implications for Marine Carbon Management Under Climate Change

Under the backdrop of global warming, rising global temperatures are likely to increase sea surface temperatures and enhance ocean stratification, potentially suppressing nutrient upwelling in coastal areas. This suppression could reduce phytoplankton productivity and consequently limit the supply of POC [70,71]. Meanwhile, extreme precipitation events, a hallmark of climate warming, may increase land runoff, enhancing the transport of POC from rivers to coastal regions [72]. However, the dilution effect of freshwater and alterations in sedimentation processes, such as the settling of calcium carbonate, may partially offset these impacts. Thermal stress on phytoplankton communities might also alter the composition of primary producers, thereby influencing the efficiency of carbon export [71]. In island ecosystems, changes in wave dynamics and storm frequency linked to climate variability could disrupt topography-induced nutrient cycling, affecting local POC accumulation.
In the future, integrating long-term remote sensing datasets with climate models can help quantify how rising temperatures, ocean acidification, and modifications in the hydrological cycle (e.g., Yangtze River discharge) regulate the terrestrial and marine sources and sinks of POC in the East China Sea. Investigating the role of extreme weather events (e.g., typhoons, heatwaves) in periodically redistributing POC, as well as how climate-driven shifts in particulate composition (e.g., the ratio of carbonate particles to POC, microbial carbon processing) influence vertical carbon fluxes and sequestration, will be critical components for understanding the regional carbon budget.

5. Conclusions

This study employs remote sensing data to investigate the spatiotemporal distribution characteristics and influencing factors of POC concentration in the East China Sea from 2003 to 2022. Significant spatial heterogeneity is revealed, with higher surface POC concentrations near the coast primarily influenced by terrestrial inputs, marine production, and seabed sediment resuspension at river estuaries and islands and relatively stable, lower levels of the open sea due to limited nutrient availability and low primary productivity. Elevated POC concentrations around islands are attributed to enhanced nutrient supply for phytoplankton growth driven by topography and hydrodynamics. Temporally, monthly POC concentrations exhibit notable fluctuations: peaking in March–April during spring phytoplankton blooms stimulated by increased sunlight and favorable temperatures, declining sharply from May to June (reaching a minimum in June) due to freshwater dilution and reduced nutrients caused by strong stratification, and gradually recovering from September onward as enhanced vertical mixing upwells nutrients, boosting productivity through December. Correlation analysis and the GeoDetector model identify key factors influencing POC dynamics, including particulate inorganic carbon (PIC), chlorophyll (Chl), sea surface temperature (SST), and photosynthetically active radiation (PAR). A strong positive correlation between POC and Chl highlights phytoplankton photosynthesis as a major source, while a positive correlation between POC and PIC reflects physical carbon redistribution via processes like sedimentation and ballasting. Negative correlations between POC and both SST and PAR indicate that higher temperatures and reduced light hinder nutrient upwelling and phytoplankton growth, thereby decreasing POC production. Under global climate change, seawater warming and enhanced stratification may suppress nutrient vertical transport, thereby weakening offshore phytoplankton productivity and reducing POC concentrations. In contrast, increased extreme weather events could modify terrestrial inputs, potentially amplifying nearshore POC fluctuations. While higher extreme precipitation enhances the input of land-derived POC, the dilution effect of freshwater and other factors may partially offset this enhancement. Changes in storm frequency within island ecosystems can disrupt nutrient cycles and affect local POC accumulation. Extreme weather events periodically redistribute POC through resuspension and other mechanisms. Moreover, alterations in particle composition might influence vertical carbon flux and sequestration efficiency.

Author Contributions

Conceptualization, Z.L., Y.C., W.Y. and X.L.; methodology, Z.L.; data curation, Z.L.; writing-original draft preparation, Z.L.; writing-review and editing, W.Y., X.L. and Y.C.; supervision, W.Y., X.L. and Y.C. All authors have read and agreed to the published version of the manuscript.

Funding

This research was funded by the Young Scientists Fund of the National Natural Science Foundation of China (Grant No. 42201410) and the Natural Science Foundation for Young Scientists of Fujian Province (Grant No. 2021J05169), the National Science Foundation of Fujian Province, China (Grant No. 2022J01818, 2023J01797), the Education Department of the Fujian Province Science and Technology Project (Grant No. JAT200261, JAT220178), the Science Foundation of Xiamen, Fujian Province (Grant No. 3502Z20227051), the open fund for the Nansha Islands Coral Reef Ecosystem National Observation Research Station (Grant No. NSICR23201), the found of Jimei University’s Ideological and Political Course (C150571).

Data Availability Statement

Publicly available datasets were analyzed in this study. These data can be found at http://oceancolor.gsfc.nasa.gov/ (accessed on 19 May 2024) and http://www.geodata.cn (accessed on 9 July 2024).

Conflicts of Interest

The authors declare no conflicts of interest.

References

  1. DeVries, T. The ocean carbon cycle. Annu. Rev. Environ. Resour. 2022, 47, 317–341. [Google Scholar] [CrossRef]
  2. Wang, S.-J.; Cao, L.; Li, N. Responses of the ocean carbon cycle to climate change: Results from an earth system climate model simulation. Adv. Clim. Change Res. 2014, 5, 123–130. [Google Scholar] [CrossRef]
  3. Wang, A.; Zhang, M.; Chen, E.; Zhang, C.; Han, Y. Impact of seasonal global land surface temperature (LST) change on gross primary production (GPP) in the early 21st century. Sustain. Cities Soc. 2024, 110, 105572. [Google Scholar] [CrossRef]
  4. Kong, L.-F.; He, Y.-B.; Xie, Z.-X.; Luo, X.; Zhang, H.; Yi, S.-H.; Lin, Z.-L.; Zhang, S.-F.; Yan, K.-Q.; Xu, H.-K.; et al. Illuminating key microbial players and metabolic processes involved in the remineralization of particulate organic carbon in the ocean’s twilight zone by metaproteomics. Appl. Environ. Microbiol. 2021, 87, AEM0098621. [Google Scholar] [CrossRef] [PubMed]
  5. Li, H.; Feng, X.; Xiong, T.; Shao, W.; Wu, W.; Zhang, Y. Particulate organic carbon released during macroalgal growth has significant carbon sequestration potential in the ocean. Environ. Sci. Technol. 2023, 57, 19723–19731. [Google Scholar] [CrossRef]
  6. Xiu, P.; Chai, F. Impact of Atmospheric deposition on carbon export to the deep ocean in the subtropical northwest pacific. Geophys. Res. Lett. 2021, 48, 640. [Google Scholar] [CrossRef]
  7. Boscolo-Galazzo, F.; Crichton, K.A.; Ridgwell, A.; Mawbey, E.M.; Wade, B.S.; Pearson, P.N. Temperature controls carbon cycling and biological evolution in the ocean twilight zone. Science 2021, 371, 1148–1152. [Google Scholar] [CrossRef]
  8. Pan, Y.; Li, Y.; Chen, C.-T.A.; Jiang, Z.-P.; Cai, W.-J.; Shen, Y.; Ding, Z.; Chen, Q.; Di, Y.; Fan, W.; et al. New pathway of diatom-mediated calcification and its impact on the biological pump. Sci. Bull. 2023, 68, 2540–2543. [Google Scholar] [CrossRef]
  9. Lv, M.; Wang, F.; Li, Y. Eddy-Induced Subsurface Spiciness Anomalies in the Kuroshio Extension Region. J. Phys. Oceanogr. 2023, 53, 2893–2912. [Google Scholar] [CrossRef]
  10. Chen, D.; Zeng, L.; Boot, K.; Liu, Q. Satellite observed spatial and temporal variabilities of particulate organic carbon in the east China sea. Remote Sens. 2022, 14, 1799. [Google Scholar] [CrossRef]
  11. Stramska, M.; Stramski, D. Variability of particulate organic carbon concentration in the north polar Atlantic based on ocean color observations with Sea-viewing Wide Field-of-view Sensor (SeaWiFS). J. Geophys. Res. Oceans 2005, 110, 2762. [Google Scholar] [CrossRef]
  12. Stramski, D.; Reynolds, R.A.; Babin, M.; Kaczmarek, S.; Lewis, M.R.; Röttgers, R.; Sciandra, A.; Stramska, M.; Twardowski, M.S.; Franz, B.A.; et al. Relationships between the surface concentration of particulate organic carbon and optical properties in the eastern South Pacific and eastern Atlantic Oceans. Biogeosciences 2008, 5, 171–201. [Google Scholar] [CrossRef]
  13. Allison, D.B.; Stramski, D.; Mitchell, B.G. Empirical ocean color algorithms for estimating particulate organic carbon in the Southern Ocean. J. Geophys. Res. Oceans 2010, 115, 6040. [Google Scholar] [CrossRef]
  14. Hu, S.; Cao, W.; Wang, G.; Xu, Z.; Zhao, W.; Lin, J.; Zhou, W.; Yao, L. Empirical ocean color algorithm for estimating particulate organic carbon in the South China Sea. Chin. J. Oceanol. Limnol. 2015, 33, 764–778. [Google Scholar] [CrossRef]
  15. Zhao, Z.; Cai, X.; Huang, C.; Shi, K.; Li, J.; Jin, J.; Yang, H.; Huang, T. A novel semianalytical remote sensing retrieval strategy and algorithm for particulate organic carbon in inland waters based on biogeochemical-optical mechanisms. Remote Sens. Environ. 2022, 280, 113213. [Google Scholar] [CrossRef]
  16. Liu, S.; Cai, D.; Zhao, T.; Li, J.; Wu, L. Study on the spatiotemporal variation characteristics of POC concentration in the South China Sea based on satellite remote sensing. Meteorol. Sci. Technol. 2023, 51, 134–141. [Google Scholar]
  17. Kong, C.E.; Sathyendranath, S.; Jackson, T.; Stramski, D.; Brewin, R.J.W.; Kulk, G.; Jönsson, B.F.; Loisel, H.; Galí, M.; Le, C. Comparison of ocean-colour algorithms for particulate organic carbon in global ocean. Front. Mar. Sci. 2024, 11, 1309050. [Google Scholar] [CrossRef]
  18. Liu, Z.; Gan, J.; Hu, J.; Wu, H.; Cai, Z.; Deng, Y. Progress on circulation dynamics in the East China Sea and southern Yellow Sea: Origination, pathways, and destinations of shelf currents. Prog. Oceanogr. 2021, 193, 102553. [Google Scholar] [CrossRef]
  19. Cai, S.; Wu, M.; Le, C. Satellite Observation of the Long-Term Dynamics of Particulate Organic Carbon in the East China Sea Based on a Hybrid Algorithm. Remote Sens. 2022, 14, 3220. [Google Scholar] [CrossRef]
  20. Seo, J.; Kim, G.; Hwang, J. Sources and behavior of particulate organic carbon in the yellow sea and the east China sea based on 13C, 14C, and 234Th. Front. Mar. Sci. 2022, 9, 793556. [Google Scholar] [CrossRef]
  21. Zhao, L.; Gao, L. Dynamics of dissolved and particulate organic matter in the Changjiang (Yangtze River) Estuary and the adjacent East China Sea shelf. J. Mar. Syst. 2019, 198, 103188. [Google Scholar] [CrossRef]
  22. Wang, X.; Yu, J.; Fan, H. Spatial and seasonal variability of surface particulate inorganic carbon and relationship with particulate organic carbon in the Yellow-Bohai Sea. J. Oceanogr. 2020, 76, 327–339. [Google Scholar] [CrossRef]
  23. Hung, C.-C.; Tseng, C.-W.; Gong, G.-C.; Chen, K.-S.; Chen, M.-H.; Hsu, S.-C. Fluxes of particulate organic carbon in the East China Sea in summer. Biogeosciences 2013, 10, 6469–6484. [Google Scholar] [CrossRef]
  24. Shi, Y.; Zhang, T.; Zhang, C.; Cheng, J. Spatial and temporal distribution of particulate organic carbon in Yellow Sea and East China Sea. Mar. Environ. Sci. 2011, 30, 1–6. [Google Scholar]
  25. Xie, F.; Tao, Z.; Zhou, X.; Lv, T.; Wang, J. Spatial and Temporal Variations of Particulate Organic Carbon Sinking Flux in Global Ocean from 2003 to 2018. Remote Sens. 2019, 11, 2941. [Google Scholar] [CrossRef]
  26. Graff, J.R.; Nelson, N.B.; Roca-Martí, M.; Romanelli, E.; Kramer, S.J.; Erickson, Z.; Cetinić, I.; Buesseler, K.O.; Passow, U.; Zhang, X.; et al. Reconciliation of total particulate organic carbon and nitrogen measurements determined using contrasting methods in the North Pacific Ocean as part of the NASA EXPORTS field campaign. Elementa Sci. Anthr. 2023, 11, 112. [Google Scholar] [CrossRef]
  27. Puigcorbé, V.; Masqué, P.; Le Moigne, F.A.C. Global database of ratios of particulate organic carbon to thorium-234 in the ocean: Improving estimates of the biological carbon pump. Earth Syst. Sci. Data 2020, 12, 1267–1285. [Google Scholar] [CrossRef]
  28. Melet, A.; Teatini, P.; Le Cozannet, G.; Boschi, L.; Ciarletti, V.; D’Alpaos, A.; Feyen, L.; Gauer, P.; Marani, M.; Stumpf, R.P. Earth Observations for Monitoring Marine Coastal Hazards and Their Drivers. Surv. Geophys. 2020, 41, 1489–1534. [Google Scholar] [CrossRef]
  29. Wang, F.; Li, X.; Tang, X.; Wu, L.; Liu, Q.; Zhao, M.; Liu, Z. The seas around China in a warming climate. Nat. Rev. Earth Environ. 2023, 4, 535–551. [Google Scholar] [CrossRef]
  30. Wang, Z.; Yuan, C.; Zhang, X.; Liu, Y.; Fu, M.; Xiao, J. Interannual variations of Sargassum blooms in the Yellow Sea and East China Sea during 2017–2021. Harmful Algae 2023, 126, 102451. [Google Scholar] [CrossRef]
  31. Zhang, M.; Sun, X.; Hu, Y.; Chen, G.; Xu, J. The influence of anthropogenic activities on heavy metal pollution of estuary sediment from the coastal East China Sea in the past nearly 50 years. Mar. Pollut. Bull. 2022, 181, 113872. [Google Scholar] [CrossRef]
  32. Cong, P.; Qu, L.; Han, G.; Yang, X. Remotely sensed detection and application analysis of ocean particulate organic carbon. Mar. Environ. Sci. 2012, 31, 300–304. [Google Scholar]
  33. Sun, J. Organic carbon pump and carbonate counter pump of living coccolithophorid. Adv. Earth Sci. 2007, 22, 1231–1239. [Google Scholar]
  34. National Earth System Science Data Center, National Science & Technology Infrastructure of China. Earth System Science Data [Dataset]. 2025. Available online: http://www.geodata.cn (accessed on 9 July 2024).
  35. Lin, T.; He, Q.; Zhan, W.; Zhan, H. Persistent data gap in ocean color observations over the East China Sea in winter: Causes and reconstructions. Remote Sens. Lett. 2020, 11, 667–676. [Google Scholar] [CrossRef]
  36. Moon, J.; Lee, K.; Lim, W.; Lee, E.; Dai, M.; Choi, Y.; Han, I.; Shin, K.; Kim, J.; Chae, J. Anthropogenic nitrogen is changing the East China and Yellow seas from being N deficient to being P deficient. Limnol. Oceanogr. 2021, 66, 914–924. [Google Scholar] [CrossRef]
  37. He, X.; Bai, Y.; Pan, D.; Chen, C.-T.A.; Cheng, Q.; Wang, D.; Gong, F. Satellite views of the seasonal and interannual variability of phytoplankton blooms in the eastern China seas over the past 14 yr (1998–2011). Biogeosciences 2013, 10, 4721–4739. [Google Scholar] [CrossRef]
  38. Franklin, J.B.; Sathish, T.; Vinithkumar, N.V.; Kirubagaran, R. A novel approach to predict chlorophyll-a in coastal-marine ecosystems using multiple linear regression and principal component scores. Mar. Pollut. Bull. 2020, 152, 110902. [Google Scholar] [CrossRef] [PubMed]
  39. R Core Team. R: A Language and Environment for Statistical Computing; R Foundation for Statistical Computing: Vienna, Austria, 2023. [Google Scholar]
  40. Hu, C.; Feng, L.; Lee, Z.; Franz, B.A.; Bailey, S.W.; Werdell, P.J.; Proctor, C.W. Improving satellite global chlorophyll a data products through algorithm refinement and data recovery. J. Geophys. Res. Oceans 2019, 124, 1524–1543. [Google Scholar] [CrossRef]
  41. Adames, A.F.; Reynolds, M.; Smirnov, A.; Covert, D.S.; Ackerman, T.P. Comparison of Moderate Resolution Imaging Spectroradiometer ocean aerosol retrievals with ship-based Sun photometer measurements from the Around the Americas expedition. J. Geophys. Res. 2011, 116, 440. [Google Scholar] [CrossRef]
  42. Kilpatrick, K.A.; Podestá, G.P.; Evans, R. Overview of the NOAA/NASA advanced very high resolution radiometer Pathfinder algorithm for sea surface temperature and associated matchup database. J. Geophys. Res. Space Phys. 2001, 106, 9179–9197. [Google Scholar] [CrossRef]
  43. Patt, F.S. SeaWiFS Postlaunch Technical Report Series, Volume 22, Algorithm Updates for the Fourth SeaWiFS Data Reprocessing (NASA Tech. Rep. No. NASA/TM-2003-212299); National Aeronautics and Space Administration: Greenbelt, MD, USA, 2003. [Google Scholar]
  44. Hung, C.-C.; Chen, Y.-F.; Hsu, S.-C.; Wang, K.; Chen, J.F.; Burdige, D.J. Using rare earth elements to constrain particulate organic carbon flux in the East China Sea. Sci. Rep. 2016, 6, 33880. [Google Scholar] [CrossRef]
  45. Wang, J.; Xu, C. Geodetector: Principle and prospective. Acta Geogr. Sin. 2017, 72, 116–134. [Google Scholar]
  46. Doney, S.C.; Ruckelshaus, M.; Duffy, J.E.; Barry, J.P.; Chan, F.; English, C.A.; Galindo, H.M.; Grebmeier, J.M.; Hollowed, A.B.; Knowlton, N.; et al. Climate change impacts on marine ecosystems. Annu. Rev. Mar. Sci. 2012, 4, 11–37. [Google Scholar] [CrossRef] [PubMed]
  47. Liu, M.; Raymond, P.A.; Lauerwald, R.; Zhang, Q.; Trapp-Müller, G.; Davis, K.L.; Moosdorf, N.; Xiao, C.; Middelburg, J.J.; Bouwman, A.F.; et al. Global riverine land-to-ocean carbon export constrained by observations and multi-model assessment. Nat. Geosci. 2024, 17, 896–904. [Google Scholar] [CrossRef]
  48. Zhang, S.; Yager, P.L.; Liang, C.; Shen, Z.; Xian, W. Distribution and spatial-temporal variation of organic matter along the Yangtze River-ocean continuum. Elementa Sci. Anthr. 2022, 10, 34. [Google Scholar] [CrossRef]
  49. Fang, F.-T.; Zhu, Z.-Y.; Ge, J.-Z.; Deng, B.; Du, J.-Z.; Zhang, J. Reconstruction of the main phytoplankton population off the Changjiang Estuary in the East China Sea and its assemblage shift in recent decades: From observations to simulation. Mar. Pollut. Bull. 2022, 178, 113638. [Google Scholar] [CrossRef]
  50. Zhong, Q.; Huang, D.; Wang, Q.; Li, J.; Li, X.; Liu, S. Terrestrial and marine POC export fluxes estimated by 234Th–238U disequilibrium and δ13C measurements in the East China Sea shelf. Biogeochemistry 2024, 167, 807–827. [Google Scholar] [CrossRef]
  51. Cai, H.; Zhang, X.; Zhang, M.; Guo, L.; Liu, F.; Yang, Q. Impacts of Three Gorges Dam’s operation on spatial–temporal patterns of tide–river dynamics in the Yangtze River estuary, China. Ocean. Sci. 2019, 15, 583–599. [Google Scholar] [CrossRef]
  52. Wang, X.; Ma, H.; Li, R.; Song, Z.; Wu, J. Seasonal fluxes and source variation of organic carbon transported by two major Chinese Rivers: The Yellow River and Changjiang (Yangtze) River. Glob. Biogeochem. Cycles 2012, 26, 4130. [Google Scholar] [CrossRef]
  53. Xu, Z.; Ma, J.; Wang, H.; Hu, Y.; Yang, G.; Deng, W. River discharge and saltwater intrusion level study of yangtze river estuary, China. Water 2018, 10, 683. [Google Scholar] [CrossRef]
  54. Liu, D.; Bai, Y.; He, X.; Tao, B.; Pan, D.; Chen, C.-T.A.; Zhang, L.; Xu, Y.; Gong, C. Satellite estimation of particulate organic carbon flux from Changjiang River to the estuary. Remote Sens. Environ. 2019, 223, 307–319. [Google Scholar] [CrossRef]
  55. Xu, W.; Wang, G.; Jiang, L.; Cheng, X.; Zhou, W.; Cao, W. Spatiotemporal variability of surface phytoplankton carbon and carbon-to-chlorophyll a ratio in the South China Sea based on satellite data. Remote Sens. 2020, 13, 30. [Google Scholar] [CrossRef]
  56. Farfán, L.M.; D’sa, E.J.; Liu, K.-B.; Rivera-Monroy, V.H. Tropical cyclone impacts on coastal regions: The case of the Yucatán and the Baja California Peninsulas, Mexico. Estuaries Coasts 2014, 37, 1388–1402. [Google Scholar] [CrossRef]
  57. Shi, H.; Chen, Y.; Gao, H.; Zhao, H. Effects of typhoon and upwelling on Chlorophyll-a distribution in the northeastern coast of Hainan during Summer. PLoS ONE 2023, 18, e0284689. [Google Scholar] [CrossRef]
  58. Cavan, E.L.; Henson, S.A.; Boyd, P.W. The sensitivity of subsurface microbes to ocean warming accentuates future declines in particulate carbon export. Front. Ecol. Evol. 2019, 6, 230. [Google Scholar] [CrossRef]
  59. Wang, H.; Li, Y.; Li, Y.; Liu, H.; Wang, W.; Zhang, P.; Fohrer, N.; Li, B.-L.; Zhang, Y. Phytoplankton Communities’ Response to Thermal Stratification and Changing Environmental Conditions in a Deep-Water Reservoir: Stochastic and Deterministic Processes. Sustainability 2024, 16, 3058. [Google Scholar] [CrossRef]
  60. Resplandy, L.; Lévy, M.; McGillicuddy, D.J. Effects of eddy-driven subduction on ocean biological carbon pump. Glob. Biogeochem. Cycles 2019, 33, 1071–1084. [Google Scholar] [CrossRef]
  61. Dobashi, R.; Ueno, H.; Matsudera, N.; Saito, H.; Sato, Y.; Tsuji, T. Impact of mesoscale eddies on particulate organic carbon flux in the western subarctic North Pacific. J. Oceanogr. 2022, 78, 1–14. [Google Scholar] [CrossRef]
  62. Guerreiro, C.V.; Ferreira, A.; Cros, L.; Stuut, J.-B.; Baker, A.; Tracana, A.; Pinto, C.; Veloso, V.; Rees, A.P.; Cachão, M.A.P.; et al. Response of coccolithophore communities to oceanographic and atmospheric processes across the North- and Equatorial Atlantic. Front. Mar. Sci. 2023, 10, 1119488. [Google Scholar] [CrossRef]
  63. Sun, L.; Jin, X.; Su, X.; Liu, C. Coccolithophore carbonate counter pump covaried with ocean carbon cycle changes during the Mid-Miocene. Sci. Bull. 2024, 70, 600–603. [Google Scholar] [CrossRef]
  64. Naselli-Flores, L.; Padisák, J. Ecosystem services provided by marine and freshwater phytoplankton. Hydrobiologia 2023, 850, 2691–2706. [Google Scholar] [CrossRef] [PubMed]
  65. Yao, L.; Wang, X.; Zhang, J.; Yu, X.; Zhang, S.; Li, Q. Prediction of sea surface chlorophyll-a concentrations based on deep learning and time-series remote sensing data. Remote Sens. 2023, 15, 4486. [Google Scholar] [CrossRef]
  66. Omand, M.M.; D’asaro, E.A.; Lee, C.M.; Perry, M.J.; Briggs, N.; Cetinić, I.; Mahadevan, A. Eddy-driven subduction exports particulate organic carbon from the spring bloom. Science 2015, 348, 222–225. [Google Scholar] [CrossRef]
  67. Khan, M.A.; Kumar, S.; Roy, R.; Prakash, S.; Lotliker, A.A.; Baliarsingh, S.K. Tidal scale dissolved inorganic and particulate organic carbon dynamics in a tropical estuary. Mar. Chem. 2024, 267, 104451. [Google Scholar] [CrossRef]
  68. Golder, R.; Shuva, S.H.; Rouf, M.A.; Uddin, M.M.; Bristy, S.K.; Bir, J. Chlorophyll-a, SST and particulate organic carbon in response to the cyclone Amphan in the Bay of Bengal. J. Earth Syst. Sci. 2021, 130, 157. [Google Scholar] [CrossRef]
  69. Osterholz, H.; Burmeister, C.; Busch, S.; Dierken, M.; Frazão, H.C.; Hansen, R.; Jeschek, J.; Kremp, A.; Kreuzer, L.; Sadkowiak, B.; et al. Nearshore dissolved and particulate organic matter dynamics in the Southwestern Baltic Sea: Environmental drivers and time series analysis (2010–2020). Front. Mar. Sci. 2021, 8, 28. [Google Scholar] [CrossRef]
  70. Santana-Falcón, Y.; Séférian, R. Climate change impacts the vertical structure of marine ecosystem thermal ranges. Nat. Clim. Change 2022, 12, 935–942. [Google Scholar] [CrossRef]
  71. Viljoen, J.J.; Sun, X.; Brewin, R.J.W. Climate variability shifts the vertical structure of phytoplankton in the Sargasso Sea. Nat. Clim. Change 2024, 14, 1292–1298. [Google Scholar] [CrossRef]
  72. Beusen, A.H.W.; Bouwman, A.F.; Van Beek, L.P.H.; Mogollón, J.M.; Middelburg, J.J. Global riverine N and P transport to ocean increased during the 20th century despite increased retention along the aquatic continuum. Biogeosciences 2016, 13, 2441–2451. [Google Scholar] [CrossRef]
Figure 1. Study area (25° N–35° N, 115° E–130° E, 1.05 × 10⁶ km2).
Jmse 13 00963 g001
Figure 2. Remote Sensing versus In Situ POC Measurements: A scatter plot comparing remote sensing-derived POC concentrations with in situ measurements. The black line indicates the linear regression fit.
Jmse 13 00963 g002
Figure 3. Annual Trends of POC Variation from 2003 to 2022. The red dashed line denotes the interannual trend, while the purple shaded region illustrates the 95% confidence interval.
Jmse 13 00963 g003
Figure 4. Average annual distribution of POC in the East China Sea, 2003–2022.
Jmse 13 00963 g004
Figure 5. Monthly Trends of POC Variation from 2003 to 2022. The purple shaded region illustrates the 95% confidence interval.
Jmse 13 00963 g005
Figure 6. Multi-year average monthly distribution of POC in the East China Sea, 2003–2022.
Jmse 13 00963 g006
Figure 7. Scatter plots showing the correlation of POC with Chl, PAR, PIC, and SST. The R values indicate the correlation coefficients, and all data comparisons have passed the significance test (p < 0.01). The grey-shaded regions represent the 95% confidence intervals.
Jmse 13 00963 g007
Figure 8. Distribution of POC correlation with Chl, PAR, PIC, SST. This color scale legend represents the correlation coefficients between POC and Chl, PAR, PIC and SST.
Jmse 13 00963 g008
Figure 9. Trend of POC in the East China Sea, 2003–2022. The rate of change is the average of the annual rates of change from 2003 to 2023.
Jmse 13 00963 g009
Figure 10. Spatial Distribution of Anselin Local Moran’s I in the East China Sea.
Jmse 13 00963 g010
Figure 11. Multi-year average changes and change rates of POC concentrations across latitude and longitude from 2003 to 2022. Panel (a) depicts the variation in POC concentrations with respect to latitude, panel (b) illustrates the variation in POC concentrations with respect to longitude, panel (c) shows the rate of change in POC concentrations by latitude, and panel (d) presents the rate of change in POC concentrations by longitude.
Jmse 13 00963 g011
Table 1. Correlation Analysis and Robustness Test Results between Variables and POC.
VariablePeriodCorrelation (R)p-ValueBootstrap 95% Confidence Interval
Chl2003–20120.75p < 0.01(0.64, 0.77)
Chl2013–20220.72p < 0.01
PAR2003–2012−0.50p < 0.01(−0.53, −0.33)
PAR2013–2022−0.58p < 0.01
PIC2003–20120.50p < 0.01(0.30, 0.56)
PIC2013–20220.57p < 0.01
SST2003–2012−0.65p < 0.01(−0.75, −0.62)
SST2013–2022−0.77p < 0.01
Table 2. Single factor detector results.
Variableq-Statisticp-Value
Chl0.84p < 0.01
PAR0.30p < 0.01
SST0.64p < 0.01
PIC0.75p < 0.01
Disclaimer/Publisher’s Note: The statements, opinions and data contained in all publications are solely those of the individual author(s) and contributor(s) and not of MDPI and/or the editor(s). MDPI and/or the editor(s) disclaim responsibility for any injury to people or property resulting from any ideas, methods, instructions or products referred to in the content.

