Article

Performance Study of Spark-Ignited Methanol–Hydrogen Engine by Using a Fractal Turbulent Combustion Model Coupled with Chemical Reaction Kinetics

1
College of Power and Energy Engineering, Harbin Engineering University, Harbin 150001, China
2
Henan Diesel Engine Industry Co., Ltd., Luoyang 471039, China
*
Author to whom correspondence should be addressed.
J. Mar. Sci. Eng. 2025, 13(5), 959; https://doi.org/10.3390/jmse13050959
Submission received: 19 April 2025 / Revised: 9 May 2025 / Accepted: 11 May 2025 / Published: 15 May 2025

Abstract

:
Methanol, a renewable and sustainable fuel, provides an effective strategy for reducing greenhouse gas emissions when synthesized through carbon dioxide hydrogenation integrated with carbon capture technology. The incorporation of hydrogen into methanol-fueled engines enhances combustion efficiency, mitigating challenges such as pronounced cycle-to-cycle variations and cold-start difficulties. A simulation framework was developed using Python 3.13 and the Cantera 3.1.0 library to model the combustion system of a four-stroke spark-ignited (SI) methanol–hydrogen engine. This framework integrates a fractal turbulent combustion model with chemical reaction kinetics, complemented by early flame development and near-wall combustion models to address limitations during the initial and terminal combustion phases. The model was validated by using experimental data measured from a spark-ignited methanol engine. The effects of varying Hydrogen Energy Rates (HER) on engine power performance, combustion characteristics, and emissions (like formaldehyde and carbon monoxide) were subsequently analyzed under different operating loads, whilst the knock limit boundaries were established for different operational conditions. Findings demonstrate that increasing HER improves the engine power output and thermal efficiency, shortens the combustion duration, and reduces the formaldehyde and carbon monoxide emissions. Nevertheless, under high-load conditions, higher HER increases the knocking tendency, which constrains the maximum permissible HER decreasing from approximately 40% at 15% load to 20% at 100% load. The model has been developed into a Python library and will be open-sourced on Github.

1. Introduction

The shipping industry constitutes a vital component of the global economy, facilitating 80–90% of international trade [1]. Annually, it emits approximately 1.1 billion ton of C O 2 , representing 3% of global greenhouse gas emissions, alongside 2.3 million ton of S O 2 and 3.2 million ton of N O x [2,3]. For this reason, the International Maritime Organization (IMO) has established a target for the global shipping industry to reduce its GHG emissions by at least 50% by 2050 compared to 2008 levels [4]. Subsequently, in 2023, IMO released its latest strategy aiming to reduce the average carbon intensity of international shipping by at least 40% by 2030 relative to 2008 [5]. To achieve this goal, at the 76th session of the Marine Environment Protection Committee (MEPC), mandatory measures including the introduction of the Existing Energy Efficiency Index (EEXI), Carbon Intensity Index (CII), and Ship Energy Efficiency Management Plan (SEEMP) were adopted to enhance ship energy efficiency and reduce GHG emissions [6]. In terms of pollutant emissions, the MEPC approved the revised MARPOL annex VI in 2008 to impose strict restrictions on N O x emission [7].
To mitigate the environmental impact stemming from greenhouse gas (GHG) and pollutant emissions within the shipping sector, alternative fuel technologies are being actively pursued. Among these, methanol stands out due to its advantageous properties: it is renewable, boasts a high oxygen content, is cost-effective, reliable, versatile in application, and has a high octane value [8]. Furthermore, its production via C O 2 hydrogenation combined with carbon capture technology enhances its role as an effective strategy for reducing GHG emissions [9,10,11].
Research on methanol engines has demonstrated that utilizing methanol as a fuel enhances engine power performance and reduces N O x emissions [12,13], though it concurrently elevates emissions of unburned hydrocarbons, including methanol and formaldehyde [14,15]. Güdden et al. [16] investigated these effects through experiments conducted on a single-cylinder high-speed diesel engine featuring a 5 L cylinder displacement and a large cylinder diameter, employing a port fuel injection (PFI) spark-ignition (SI) methanol combustion system. Their findings revealed that, at equivalent engine displacement, the brake thermal efficiency of methanol engines, approximately 44%, surpassed that of the most advanced natural gas engines, with potential for further improvement. Additionally, without exhaust gas after-treatment, nitrogen oxide emissions, measured at less than 2 g/kWh, complied with IMO Tier III standards [17]. Nevertheless, unregulated emissions, such as unburned methanol and formaldehyde, averaging around 1 g/kWh, remained comparatively elevated. Zhang et al. [14] conducted experiments on a heavy-duty SI pure methanol engine equipped with Exhaust Gas Recirculation (EGR), finding that unconventional emissions predominantly consisted of formaldehyde ( C H 2 O ) and unburned methanol, and the concentration of formaldehyde and unburned methanol increased with the increase in EGR rate.
Owing to the substantial latent heat of methanol vaporization, methanol engines face challenges related to cold-start difficulties and combustion deterioration at low loads [18,19]. Liu et al. [20] conducted simulations for a spark-ignition direct-injection stratified-charge methanol engine employing computational fluid dynamics coupled with a chemical kinetic reaction mechanism for methanol, to evaluate formaldehyde and unburned methanol emissions. Their findings revealed that emissions of unburned methanol and formaldehyde under steady-state conditions were significantly lower than those under cold-start conditions, with reductions of 90% and 98%, respectively. They proposed that high cold-start emissions could be mitigated by adjusting the equivalence ratio and ignition timing. Yuan et al. [21] investigated the evaporation characteristics of methanol at 243–303 K via the single-droplet method. They elucidated the underlying causes of cold-start difficulties in methanol engines and demonstrated that these characteristics could be enhanced through improvements in the intake temperature, flow rate, and methanol droplet diameter.
Beyond conventional approaches, such as modulating the equivalence ratio and intake temperature to enhance cold-start performance and mitigate elevated emissions stemming from combustion deterioration in methanol engines, recent developments have increasingly adopted the blending of highly reactive fuels to offset methanol’s limitations and optimize its combustion properties [22,23,24]. The most widely implemented approach is hydrogen enrichment. Gong et al. [25] assessed the power performance, combustion, and emission characteristics of a dual-fuel spark-ignition engine equipped with an H 2 port injection and methanol direct-injection system, employing a post-injection methanol strategy. Their findings demonstrated that H 2 enrichment shortens the flame development angle and the rapid combustion angle, bringing the combustion center angle closer to the top dead center, and extends the lean-burn limit of the methanol engine from an excess air ratio of 1.6 to 2.2. Furthermore, under lean-burn conditions, B S N O x emissions were, on average, 90% lower than those at an excess air ratio of 1.0. Prasad [26] reported similar outcomes under high-load conditions. Using a four-stroke single-cylinder engine, he conducted a methanol hydrogen-enrichment experiment under wide-open throttle (WOT) conditions. His findings revealed that hydrogen enrichment reduced combustion duration and increased peak pressure and indicated mean effective pressure, while significantly reducing C O , C O 2 , and H C emissions. However, brake thermal efficiency was reduced.
A further substantial benefit of hydrogen enrichment in methanol engines lies in the fact that hydrogen can be produced through catalytic reforming of methanol and water vapor. Zhang et al. [27] developed a combined system model for on-board hydrogen production via methanol and water vapor catalytic reforming. Utilizing engine exhaust gas as the heat source, this system supports two utilization modes: direct methanol combustion and pre-combustion reforming. Moreover, Abbas [28] and Tang [29] have documented similar systems. Implementing this approach obviates the need for additional hydrogen storage tanks on the ship, thereby mitigating safety concerns related to hydrogen storage.
Nevertheless, incorporating hydrogen (or hydrogen-rich reformate) into methanol engines presents certain limitations. Owing to hydrogen’s high laminar flame speed, an excessively high hydrogen enrichment ratio in methanol engines heightens the risk of engine knocking. Wang et al. [30] performed computational fluid dynamics (CFD) simulations for a methanol–hydrogen/reformate SI engine to examine the influence of enrichment ratio on knock intensity (KI). Their findings indicated that KI escalates rapidly with rising enrichment ratios, and when the volume enrichment ratio reached 0.076, the engine’s KI attained a limit of 0.1 bar. Thus, meticulous design of hydrogen enrichment strategies is imperative to prevent engine knocking.
Marine engines typically operate across a wide range of load conditions, leading to varied in-cylinder combustion boundary conditions, including air temperature intake, manifold absolute pressure (MAP), and equivalence ratio. For methanol–hydrogen engines, combustion behavior varies under different operating conditions. Consequently, there is a need to carefully design and optimize hydrogen enrichment strategies for each operating condition, particularly to clearly define the knock threshold for hydrogen enrichment ratios to prevent excessive hydrogen enrichment from compromising engine safety. Performing these optimizations using CFD simulations would require a significant amount of time and computing resources. Conversely, a quasi-dimensional model offers rapid computation and is well-suited for parametric studies and optimization of engines. Ji et al. [31] developed a quasi-dimensional combustion model for methanol–hydrogen engines to investigate engine performance under varying hydrogen volume fractions, equivalence ratios, MAP, and rotational speeds. However, owing to its omission of chemical reaction kinetics, their model cannot predict engine emissions nor account for the effects of chemical kinetics on combustion and knocking induced by end-gas auto-ignition.
To address these limitations, a fractal turbulent combustion model integrated with a chemical reaction kinetics model was developed for the methanol–hydrogen SI engine, implemented in Python. The early flame development model and wall-burning model were incorporated to address flame initiation and completion stages, compensating for the fractal model’s deficiencies during these phases. This model was applied to the rapid multi-cycle simulation of the methanol–hydrogen engine.

2. Materials and Methods

2.1. Simulation Model

To facilitate simulation and modeling of the methanol–hydrogen engine, a simulation model was developed using Python and the Cantera chemical kinetics library. This model is primarily constructed using a fractal turbulent combustion model, supplemented by the early flame development model and the near-wall combustion model during the initial flame development and combustion completion stages, respectively, to address the limitations of the fractal turbulent combustion model. Table 1 outlines the configuration of each sub-model within the simulation framework, with detailed descriptions of each sub-model provided below.

2.1.1. Fractal Turbulent Combustion Model

The fractal turbulent combustion model, classified as a quasi-dimensional combustion model, is designed for application in SI engines. Figure 1 illustrates the structure of the fractal turbulent combustion model. This model delineates the in-cylinder region into a “burned zone” and an “unburned zone”, separated by a hypothetical spherical laminar flame front. Under turbulent conditions, the fuel–air mixture in the unburned zone is entrained into the burned zone, where combustion subsequently takes place. Concurrently, as the burned zone expands, the flame front progressively consumes the unburned zone until combustion is complete. The rate of gas transfer from the unburned to the burned zone is termed the entrainment rate, synonymous with the combustion rate. Central to this model is the calculation of the entrainment rate.
In SI engines, the turbulent flame is categorized as a “wrinkled laminar flamelet”, where turbulence primarily increases the flame’s average surface area and induces stretching. When the turbulence scale exceeds the flame thickness, it induces flame wrinkling, thereby augmenting the surface area and elevating the turbulent flame speed. This geometric relationship is depicted in Figure 1:
u T = A T A L u L
where u T is the turbulent flame speed;   A T is the turbulent flame area, which is the actual area after the flame wrinkled; A L is the laminar flame area, which is the hypothetical spherical area in the model; and A T / A L is the fractional increase in flame surface area due to the wrinkling caused by the turbulent flow field; and u L is the stretched laminar flame speed.
Consequently, the mass combustion rate, as proposed by Matthews [33], is expressed as follows:
d m b d t = ρ u A T u L = ρ u A L u T
where ρ u is the density of unburned gas.
Gouldin [37] established that fractal geometry can predict the increase in the surface area fraction, as shown in Equation (1). Substituting this expression into Equation (1) results in the following:
u T = u L L max L min D 3 2
where L m a x and L m i n are the maximum and minimum flame wrinkling scales and D 3 is the fractal dimension of a rough (or fragmented) surface in 3-dimensional topological space, which characterizes the roughness or degree of wrinkling of the flame.
Incorporating Equation (3) into Equation (2) produces the mass combustion rate expression:
d m b d t = ρ u A L u L L max L min D 3 2
Equation (4) defines the fractal turbulent combustion model. To validate this equation, the parameters A L , u L , L m a x / L m i n and D 3 must be calculated. Details of these parameter calculations and additional sub-models are provided in Appendix A.1, while cylinder wall heat transfer is addressed in Appendix A.2.

2.1.2. Early Flame Development Model

The combustion process in an SI engine comprises four stages: ignition, early flame development, fully developed turbulent combustion, and combustion completion [38]. The fractal turbulent combustion model described above effectively characterizes only the fully developed turbulent combustion phase. However, during the early flame development and combustion completion stages, the influence of near-wall combustion renders the fractal turbulent combustion model less applicable. Consequently, the model proposed by F. Bozza et al. [35] was adopted for the early flame development and combustion completion stages.
In the early flame development stage, calculations commence from a stable, spherical, smooth flame established at the conclusion of ignition, with the onset of flame wrinkling accelerating as the instantaneous flame radius and turbulence intensity proportional to engine speed increase. The following expression is proposed to compute the dimensionless flame wrinkling rate:
ω w r = r f r f , r e f n n r e f
where r f is the spherical flame radius, r f , r e f is a tunable reference radius on the order of 1 cm, and n r e f signifies the reference engine rotational speed. Subsequently, the fractal dimension D 3 is recalculated to account for its gradual increase over time, driven by intensifying flame wrinkling:
D 3 = D 3 , max u + D 3 , min S L u + S L D 3 , min = 2.05 D 3 , max = D 3 , min 1 w 1 + 2.35 w 1 w 1 = 1 exp ω w r
According to this equation, the fractal dimension during the initial combustion stage approximates its minimum value, D 3 , m i n , governing the quasi-laminar combustion phase. This adjustment offsets the elevated combustion speed during fire kernel formation, attributable to spark plug energy input.

2.1.3. Combustion Completion Model

At the combustion completion stage, the fractal turbulent combustion model ceases to be applicable once the flame front contacts the combustion chamber wall. A defining characteristic of combustion completion is the wall’s influence on the combustion process, known as near-wall combustion. The wall constrains gas expansion, impedes flow, and establishes a low-temperature solid boundary that cools the gas. These factors collectively alter the fundamental combustion behavior relative to free flame propagation within the chamber. Approximately 30% to 40% of the unburned mixture combusts under this distinct mode. The near-wall combustion rate is modeled using an exponential decay function, expressed as follows:
d m b d t w a l l– c o m b u s t i o n = m m b τ
where τ is the characteristic time scale of this process.
Thus, the total combustion rate is formulated as a weighted average of the two combustion rates:
d m b d t o v e r a l l = 1 w 2 d m b d t f r a c t a l s + w 2 d m b d t w a l l– c o m b u s t i o n
Upon reaching the transition time t t r , a gradual shift between fully developed turbulent combustion and near-wall combustion begins. t t r is defined as the moment the initial flame plume contacts the cylinder wall, given by the following:
r f + l I 2 = r c y l
The geometric interpretation of this equation is illustrated in Figure 2.
When Equation (9) is satisfied, assuming the near-wall combustion rate equals the fractal model-derived rate and substituting this into the characteristic time scale in Equation (7), the result is the following:
τ = m m b t r ρ u A T S L t r
Throughout the subsequent near-wall combustion phase, τ remains constant. The weighting factor w 2 increases linearly over time, with its rate determined by the ratio of instantaneous unburned mass ( m m b ) to the unburned mass at t t r :
w 2 = 1 m m b m m b t r
This approach ensures a seamless transition between combustion modes, with the near-wall combustion formulation requiring no additional adjustable constants.

2.1.4. Model Framework

Building upon the principles of the fractal turbulent combustion model and the early flame development and combustion completion models outlined previously, a simulation model for the methanol–hydrogen SI engine was developed using Python and the Cantera chemical reaction kinetics library. The model’s network structure is depicted in Figure 3. The model framework incorporates a combustion process model and a gas exchange/compression process model, enabling simulation of different engine operating phases. This design is based on the following rationale: During combustion, the cylinder space is divided into burned and unburned zones, with two separate reactors representing each zone—a configuration that aligns with physical reality. However, during gas exchange and compression processes where no burned/unburned distinction exists, a single reactor suffices for cylinder representation. To enable full-cycle simulation, these models require seamless transitions at critical timing points: 1. At spark timing, the gas exchange/compression model switches to the combustion model, with the former’s state recorded as initial conditions for the latter; 2. At exhaust valve opening, the combustion model transitions back to the gas exchange/compression model through thermodynamic state calculation using Dalton’s law of partial pressures for gas mixture from both reactors, which then serves as initial conditions for the single reactor in subsequent processes. Figure 4 illustrates this model transition mechanism. This methodology effectively facilitates multi-cycle engine simulation by maintaining continuity between distinct operational phases while respecting their physical characteristics.
Distinct from conventional fractal turbulent combustion models, reactor-based fractal turbulent combustion models utilizing chemical kinetic mechanisms require explicit incorporation of an ignition process to elevate burned zone temperatures to levels capable of sustaining combustion. The ignition simulation initiates the combustion process through a physically consistent methodology: the burned zone is initialized as a spherical volume matching spark plug electrode dimensions (representing the ignition kernel volume), with its thermodynamic state (temperature, species composition, etc.) inherited from the gas exchange/compression to combustion model transition. Then, a waveform-specific heat flux is then applied to the burned zone following the spark plug’s ignition pattern, igniting the gas to simulate the spark’s energy input.
The combustion and gas exchange/compression process models are both implemented as reactor networks within Cantera. The chemical reaction mechanism employed in these reactor networks, developed by Li [36], provides a detailed representation of methanol–hydrogen reactions. This mechanism comprises 21 species and 93 elementary reactions. The combustion process model centers on the burned and unburned zones. Each zone is modeled as an IdealGasReactor. Gas flow between the burned and unburned zones is regulated by a MassFlowController, with the flow rate determined using the fractal turbulent combustion model, supplemented by the early flame development and combustion completion models.

2.2. Model Validation

Experiments to validate the model were performed using an eight-cylinder, four-stroke SI engine, with specifications detailed in Table 2. Originally designed for natural gas, the engine was adapted in these experiments to operate on a fuel mixture of 85% methanol and 15% water. The engine was tested under load conditions at a constant speed of 1500 rpm, evaluating performance across four operating conditions: 100%, 75%, 50%, and 25% load, with experimental conditions as detailed in Table 3.
Model verification was conducted using the Mass Fraction Burned (MFB), with comparison plots of simulation results and experimental data generated for an initial subjective assessment. Verification outcomes are presented in Figure 5, where subfigures (a), (b), (c), and (d) depict the mass burn fraction comparisons between experimental and modeled results at 100%, 75%, 50%, and 25% load conditions, respectively. The mass burn fraction curve for the burned zone in the model exhibits a characteristic S-shape, closely aligning with experimental values. Additionally, the mass burn fraction in the unburned zone remains consistently at zero, suggesting stable combustion without knocking. Further quantitative analysis was performed by calculating the Root Mean Squared Error (RMSE) for each operating condition. RMSE values of 2.50%, 1.93%, 1.90%, and 1.94% for the respective conditions demonstrate the model’s robust applicability.
As shown in Figure 5, the largest discrepancy between simulation and experimental data occurs during the early flame development stage. This discrepancy stems from two primary factors: First, the ignition delay prediction from the reaction mechanism introduces errors, which propagate into the simulated mass fraction burned (MFB) calculation during early flame development. Second, experimental MFB values are not directly measured but calculated from pressure metrics. This indirect approach introduces uncertainties under the rapid and intense combustion conditions of early flame development, where small MFB values amplify calculation sensitivity. Nevertheless, as noted earlier, the overall combustion process demonstrates excellent agreement between simulations and experiments.
Additionally, the Indicated Mean Effective Pressure (IMEP) was computed, with results presented in Table 4. Relative IMEP errors across all operating conditions remain below 1%, underscoring the model’s strong predictive capability for engine power performance.

2.3. Setup of the Hydrogen–Methanol Simulation Model

To investigate the practical application of hydrogen–methanol engines in maritime vessels, the engine operating conditions of ferries, as studied by Saliba et al. [39], were referenced. Their study focused on round-trip ferries between Malta and Gozo, equipped with four engine-generators powering onboard systems and propulsion. These operating conditions are illustrated in Figure 6. Given that ferries predominantly operate at high load (trip state, 100% power) and low load (alighting boarding state, 15% power) conditions for extended periods, these states are critical to ferry operations. Consequently, the 100% and 15% power operating points were chosen as the basis for model simulations. Since the rated power of the engines used in experiments and simulations differs from that in Saliba’s study, the power levels were proportionally scaled to align the operating conditions between the model engine and the reference engine.
The Hydrogen Energy Rate (HER) was then defined to quantify the hydrogen proportion, calculated as follows:
H E R = Y H 2 L H V H 2 Y H 2 L H V H 2 + Y CH 3 OH L H V CH 3 OH
where Y is the mass fraction and L H V is Lower Heating Value.
Manifold Absolute Pressure (MAP) was maintained at 207 kPa for 100% power and 59 kPa for 15% power, with the excess air coefficient held constant at 1.4 (equivalence ratio φ = 0.714 ), and HER varied from 0% (pure methanol) to 30%. Simulations were performed for both conditions.

3. Results and Discussion

Utilizing the established simulation model, the performance of the methanol–hydrogen spark-ignition (SI) engine was simulated under high-load (100% power) and low-load (15% power) conditions. To isolate the effects of the hydrogen energy rate (HER), only this parameter was varied under each load condition, with all other engine parameters held constant. Simulation settings for each load condition are detailed in Table 5. Initially, engine performance under high-load conditions was evaluated, with the impact of HER on performance during high-speed ship navigation analyzed.

3.1. Engine Performance Under High Operation Load

Figure 7 displays key operational indicators for a single engine cycle, spanning 0 °CA (top dead center) to 720 °CA. The four curves represent HER values ranging from 0% to 30%.
Figure 7a illustrates the variation in in-cylinder pressure across different HER levels. Given that pressure waves propagate at the local speed of sound—approximately two to three orders of magnitude faster than the flame speed—any minor pressure differences between the burned and unburned zones are rapidly equalized, rendering the in-cylinder pressure uniform across both zones. Consequently, no pressure differential exists between the burned and unburned zones. With increasing HER, the peak in-cylinder pressure exhibits a clear upward trend, rising from 9.3 MPa at HER = 0% to 11.8 MPa at HER = 30%, an increase of 2.5 MPa. Simultaneously, the crank angle at peak pressure advances, approaching the top dead center. This elevation in peak pressure and its proximity to the top dead center enhance power performance and thermal efficiency, yet pose structural challenges, particularly with a 2.5 MPa increase. Notably, at HER = 30%, a sharp pressure inflection occurs around 382 °CA, followed by a rapid rise to a pronounced peak, indicative of knocking. This suggests abnormal combustion at HER = 30%.
Figure 7b depicts the temperature variation in the unburned zone across different HER levels. At HER = 10% and 20%, the unburned zone temperature remains largely unaffected, staying low throughout combustion. At 491 °CA, a sudden temperature increase occurs, coinciding with the exhaust valve opening at 491 °CA. At this point, the model mixes gasses from the unburned and burned zones, causing the temperature increase—a normal model behavior. However, at HER = 20% and 30%, the unburned zone temperature surges during combustion, reaching approximately 2400 K. This indicates spontaneous ignition in the unburned zone prior to flame front arrival, driving the elevated temperatures. At HER = 30%, the temperature spike aligns with the pressure spike. Intriguingly, at HER = 20%, the temperature spike does not manifest in the pressure curve, which remains smooth. This occurs because spontaneous ignition at HER = 20% is delayed compared to HER = 30%. By then, the unburned zone volume is reduced due to flame front advancement. Thus, spontaneous ignition in this smaller volume does not significantly perturb cylinder pressure.
Figure 8a illustrates the heat release rate in the burned zone. A sharp peak in heat release rate at 351 °CA reflects the fire kernel’s heat release post-spark ignition. This peak follows spark ignition at 349 °CA, with a 2 °CA ignition delay. With rising HER, the peak heat release rate (excluding the fire kernel) increases, and its corresponding crank angle shifts earlier. Additionally, the heat release duration shortens, suggesting more concentrated energy release. Figure 9 further corroborates this trend: CA 0–10, CA 10–50, and CA 50–90 progressively decrease with increasing HER. Hydrogen’s low ignition energy reduces CA 0–10 (flame development), while its high flame speed shortens CA 10–50 and CA 50–90 (flame propagation). This corroborates the observed increase and phase advance of the peak pressure in Figure 7a. Notably, at HER = 30%, the heat release rate plummets to zero at 382 °CA. This results from spontaneous combustion in the unburned zone, converting the fuel–air mixture into post-combustion exhaust gas. Consequently, gas entering the burned zone from the unburned zone cannot combust, reducing the heat release rate to near zero thereafter.
Figure 8b illustrates the heat release rate in the unburned zone. At HER = 20% and 30%, notably high peaks in the heat release rate are observed in the unburned zone, attributable to spontaneous ignition. Compared to HER = 30%, the spontaneous ignition-induced heat release rate at HER = 20% is markedly lower and occurs later, which explains the minimal pressure fluctuations observed in Figure 7a. Conversely, at HER = 0% and 10%, the heat release rate in the unburned zone remains at zero, indicating the absence of spontaneous ignition in this region.
Knocking in SI engines is widely attributed to the compression of the unburned zone by the flame front, elevating its temperature and inducing spontaneous combustion. Formaldehyde ( C H 2 O ), a product of methanol’s low-temperature reactions and a precursor to high-temperature rapid reactions, serves as an indicator of rapid methanol combustion.
Figure 10a illustrates the variations in C H 2 O and C O concentrations during combustion, while Figure 10b depicts the laminar flame speed, reflecting the flame front’s propagation speed. At HER = 20% and 30%, formaldehyde concentration surges exponentially at 381 °CA and 397 °CA, respectively, coinciding with a rapid rise in laminar flame speed. Elevated C H 2 O concentrations hasten high-temperature methanol combustion reactions, raising unburned zone temperatures, which in turn boost laminar flame speed; this accelerated flame front further compresses the unburned zone, enhancing methanol combustion reactions. These mutually reinforcing effects trigger spontaneous ignition in the unburned zone.
Concurrently, C H 2 O and C O , key pollutants from methanol engines, influence emission performance. Post knocking, concentrations of both compounds decline markedly, reducing emissions.
However, engine knock constitutes a critical abnormal combustion phenomenon that severely compromises structural integrity. Even if knock-induced power performance and emission performance appear favorable, such operational conditions remain fundamentally unacceptable in engineering practice. Consequently, under high-load conditions, excessive hydrogen enrichment readily induces knocking in methanol engines, substantially affecting their safe operation. Hence, hydrogen enrichment strategies for methanol engines under high-load conditions require meticulous design.

3.2. Engine Performance Under Low Operation Load

Subsequently, the performance of the methanol–hydrogen SI engine was assessed under low-load conditions (15% power) to evaluate the influence of the Hydrogen Energy Rate (HER) on engine performance at this operating state.
Figure 11a,b depict the in-cylinder pressure and unburned zone temperature, respectively, throughout the engine cycle under varying HER levels. The in-cylinder pressure variations mirror trends observed under high-load conditions. Peak pressure rises with increasing HER, and its timing advances, enhancing the engine’s power performance. Furthermore, given the inherently low baseline pressure under low-load conditions, the rise in peak in-cylinder pressure poses no significant structural concerns. However, unlike high-load conditions, no knocking is observed in the in-cylinder pressure as HER increases under low load. In contrast to high-load scenarios, HER increments have minimal impact on unburned zone temperature, with no evidence of knocking.
Figure 11c illustrates the heat release rates in both the burned and unburned zones. Consistent with high-load observations, the peak heat release rate in the burned zone (excluding the ignition kernel’s contribution) increases with HER, shifting closer to top dead center and indicating more concentrated heat release. Similarly, Figure 12 demonstrates that CA 0–10, CA 10–50, and CA 50–90 all exhibit varying degrees of reduction with increasing HER, indicating hydrogen concentration directly modulates flame development and propagation. Across HER values from 0% to 30%, the unburned zone heat release rate remains at zero, signifying no spontaneous ignition and normal flame propagation until all in-cylinder fuel is consumed.
Figure 11d presents the variations in total C H 2 O and C O concentrations within the cylinder, serving as indicators of engine emission levels. During combustion, rising HER correlates with elevated C H 2 O and C O concentrations, suggesting intensified methanol combustion. Post-combustion, however, increasing HER accelerates the decline in C H 2 O and C O concentrations. After combustion, these C H 2 O and C O levels reflect the engine’s actual pollutant emissions. At HER = 30%, C H 2 O concentration is approximately 1.5 orders of magnitude lower than at HER = 0%, and C O concentration is about 0.5 orders of magnitude lower. This reduction stems from HER-enhanced rapid methanol combustion, which swiftly consumes intermediates like C H 2 O and C O , thereby lowering emissions.
Figure 13 displays the variations in IMEP and indicates thermal efficiency across different HER levels. As HER increases, IMEP rises from 0.453 MPa at HER = 0% to 0.471 MPa at HER = 30%, while indicated thermal efficiency improves from 37.76% to 39.54%. This enhancement primarily results from heat release occurring nearer to top dead center with higher HER, demonstrating that HER elevation boosts power performance, thermal efficiency, and combustion efficiency under low-load conditions.

3.3. Knocking Limit of HER Under Different MAPs

Given that knocking typically occurs under high-load conditions during ship navigation, where abnormal engine combustion significantly jeopardizes navigational safety, investigating the hydrogen enrichment boundary of the engine is essential. Engine operating conditions under varying loads are typically adjusted via MAP, prompting an examination of the hydrogen enrichment boundary across different MAP and HER levels.
Knocking in SI engines is widely attributed to unburned end gas ignite spontaneously [40]; consequently, a simulation encompassing MAP ranges of 59–207 kPa (15–100% power) and HER ranges of 0–50% was conducted, evaluating 2500 operating conditions by calculating the maximum heat release rate in the unburned zone for each. Significant heat release in the unburned zone was deemed indicative of knocking.
Figure 14 illustrates the maximum heat release rate in the unburned zone across various operating conditions. This maximum heat release rate serves as the criterion for assessing unburned zone behavior. The figure distinctly delineates the unburned zone knocking limit. The HER at this knocking threshold is designated the maximum hydrogen energy replacement rate. Evidently, the maximum hydrogen energy replacement rate is strongly influenced by MAP. As MAP increases, the maximum hydrogen energy replacement rate exhibits a declining trend. At MAP = 59 kPa, the maximum hydrogen energy replacement rate reaches 40%, whereas at MAP = 207 kPa, it decreases to 20%. Furthermore, this rate’s variation gradually stabilizes as MAP rises. Within the knocking region, knocking intensity escalates with increasing HER and MAP.
The reduced hydrogen energy replacement rate at high MAP stems from the increased fuel–air mixture charged into the cylinder, where the denser mixture intensifies combustion; hydrogen’s combustion-enhancing effect becomes more pronounced, enabling even low hydrogen concentrations to trigger significantly intense combustion, thus lowering the upper limit of the hydrogen replacement rate. Additionally, knocking occurs at an earlier crank angle under high MAP. At this stage, with the flame not yet fully propagated to the unburned zone, the unburned zone retains a substantial volume and significant unburned mixture, amplifying knocking intensity when it occurs.
Consequently, hydrogen enrichment in methanol engines is constrained by the knocking limit, necessitating meticulous design of hydrogen enrichment strategies across various load conditions to ensure the safe operation of methanol–hydrogen engines.

4. Conclusions

This research employed the fractal turbulent combustion model, alongside the early flame development and combustion completion models integrated with chemical reaction kinetics, to simulate the performance of a methanol–hydrogen SI engine. Simulation code, developed using Python and Cantera, modeled the engine’s performance across varying intake Manifold Absolute Pressures (MAP) and Hydrogen Energy Rates (HER), determining the hydrogen enrichment knocking limit for each operating condition. The main findings are outlined below.
(1)
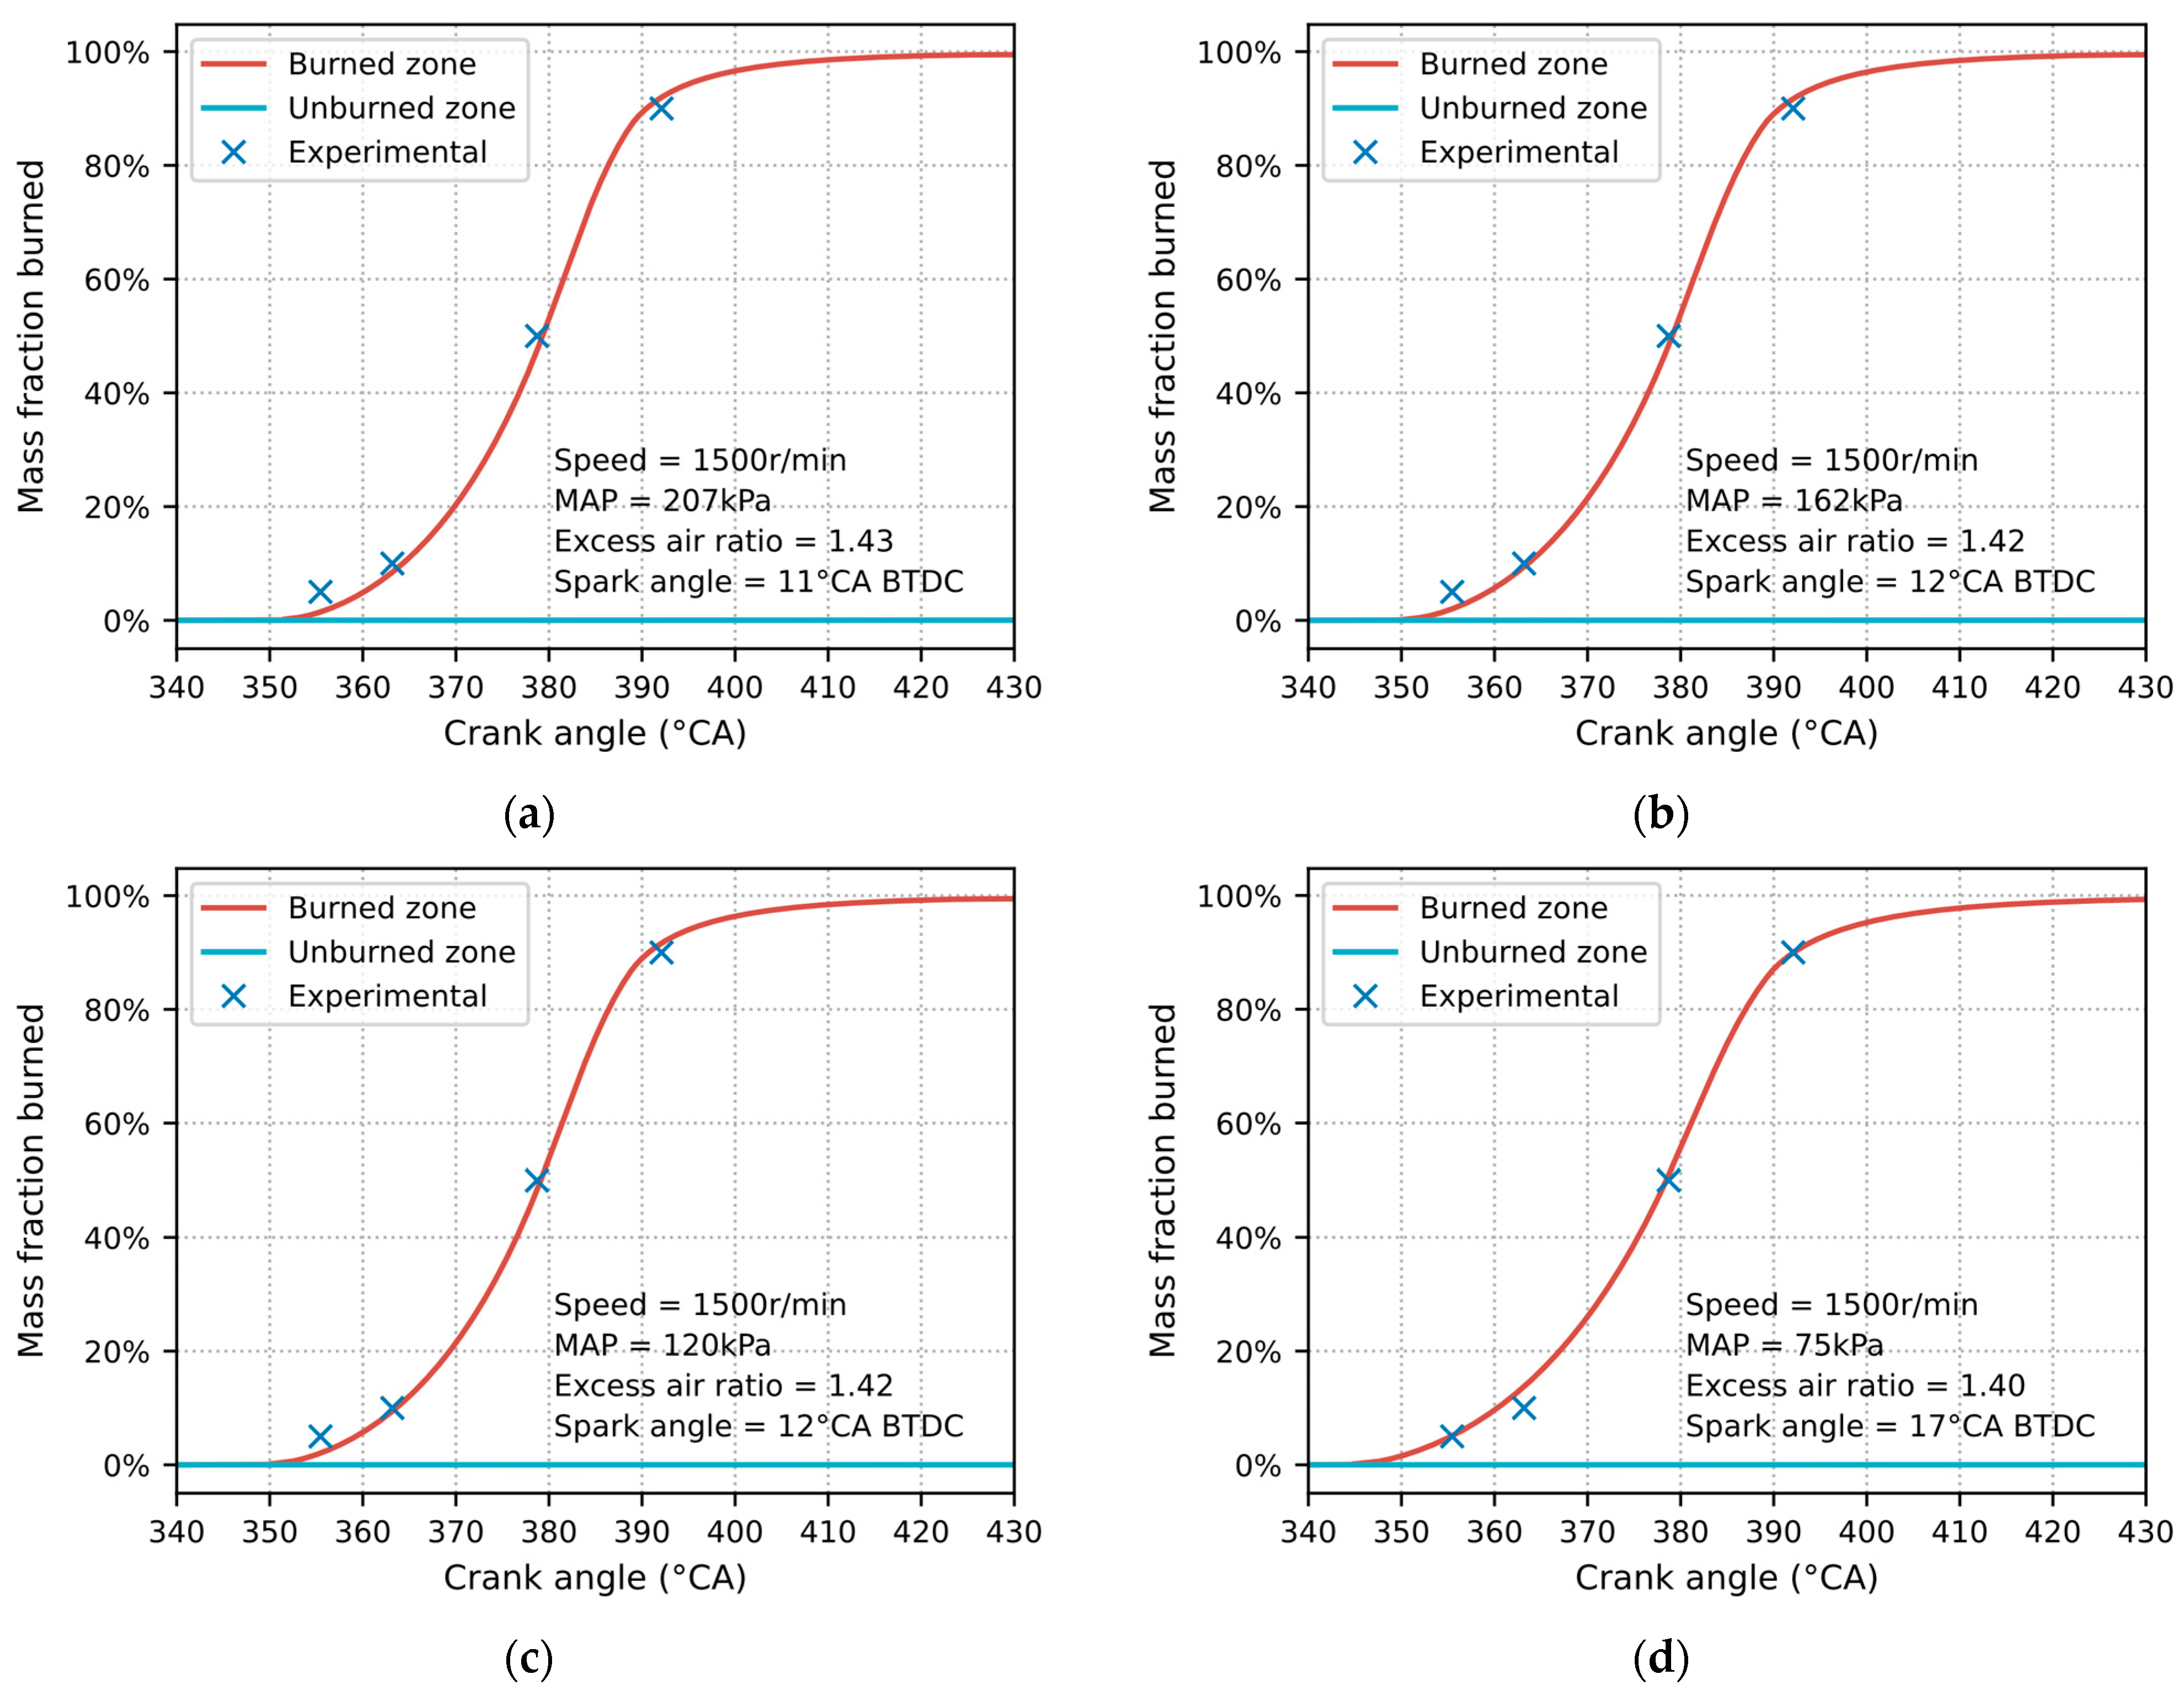
The simulation model was validated using experimental data from a spark-ignited methanol engine. Under four operating conditions (100%, 75%, 50%, and 25% load), the root mean square errors (RMSE) for the mass fraction burned were 2.50%, 1.93%, 1.90%, and 1.94%, respectively, while the relative errors for Indicated Mean Effective Pressure (IMEP) were 0.18%, 0%, 0.37%, and 0.36%, respectively, demonstrating the model’s high prediction accuracy.
(2)
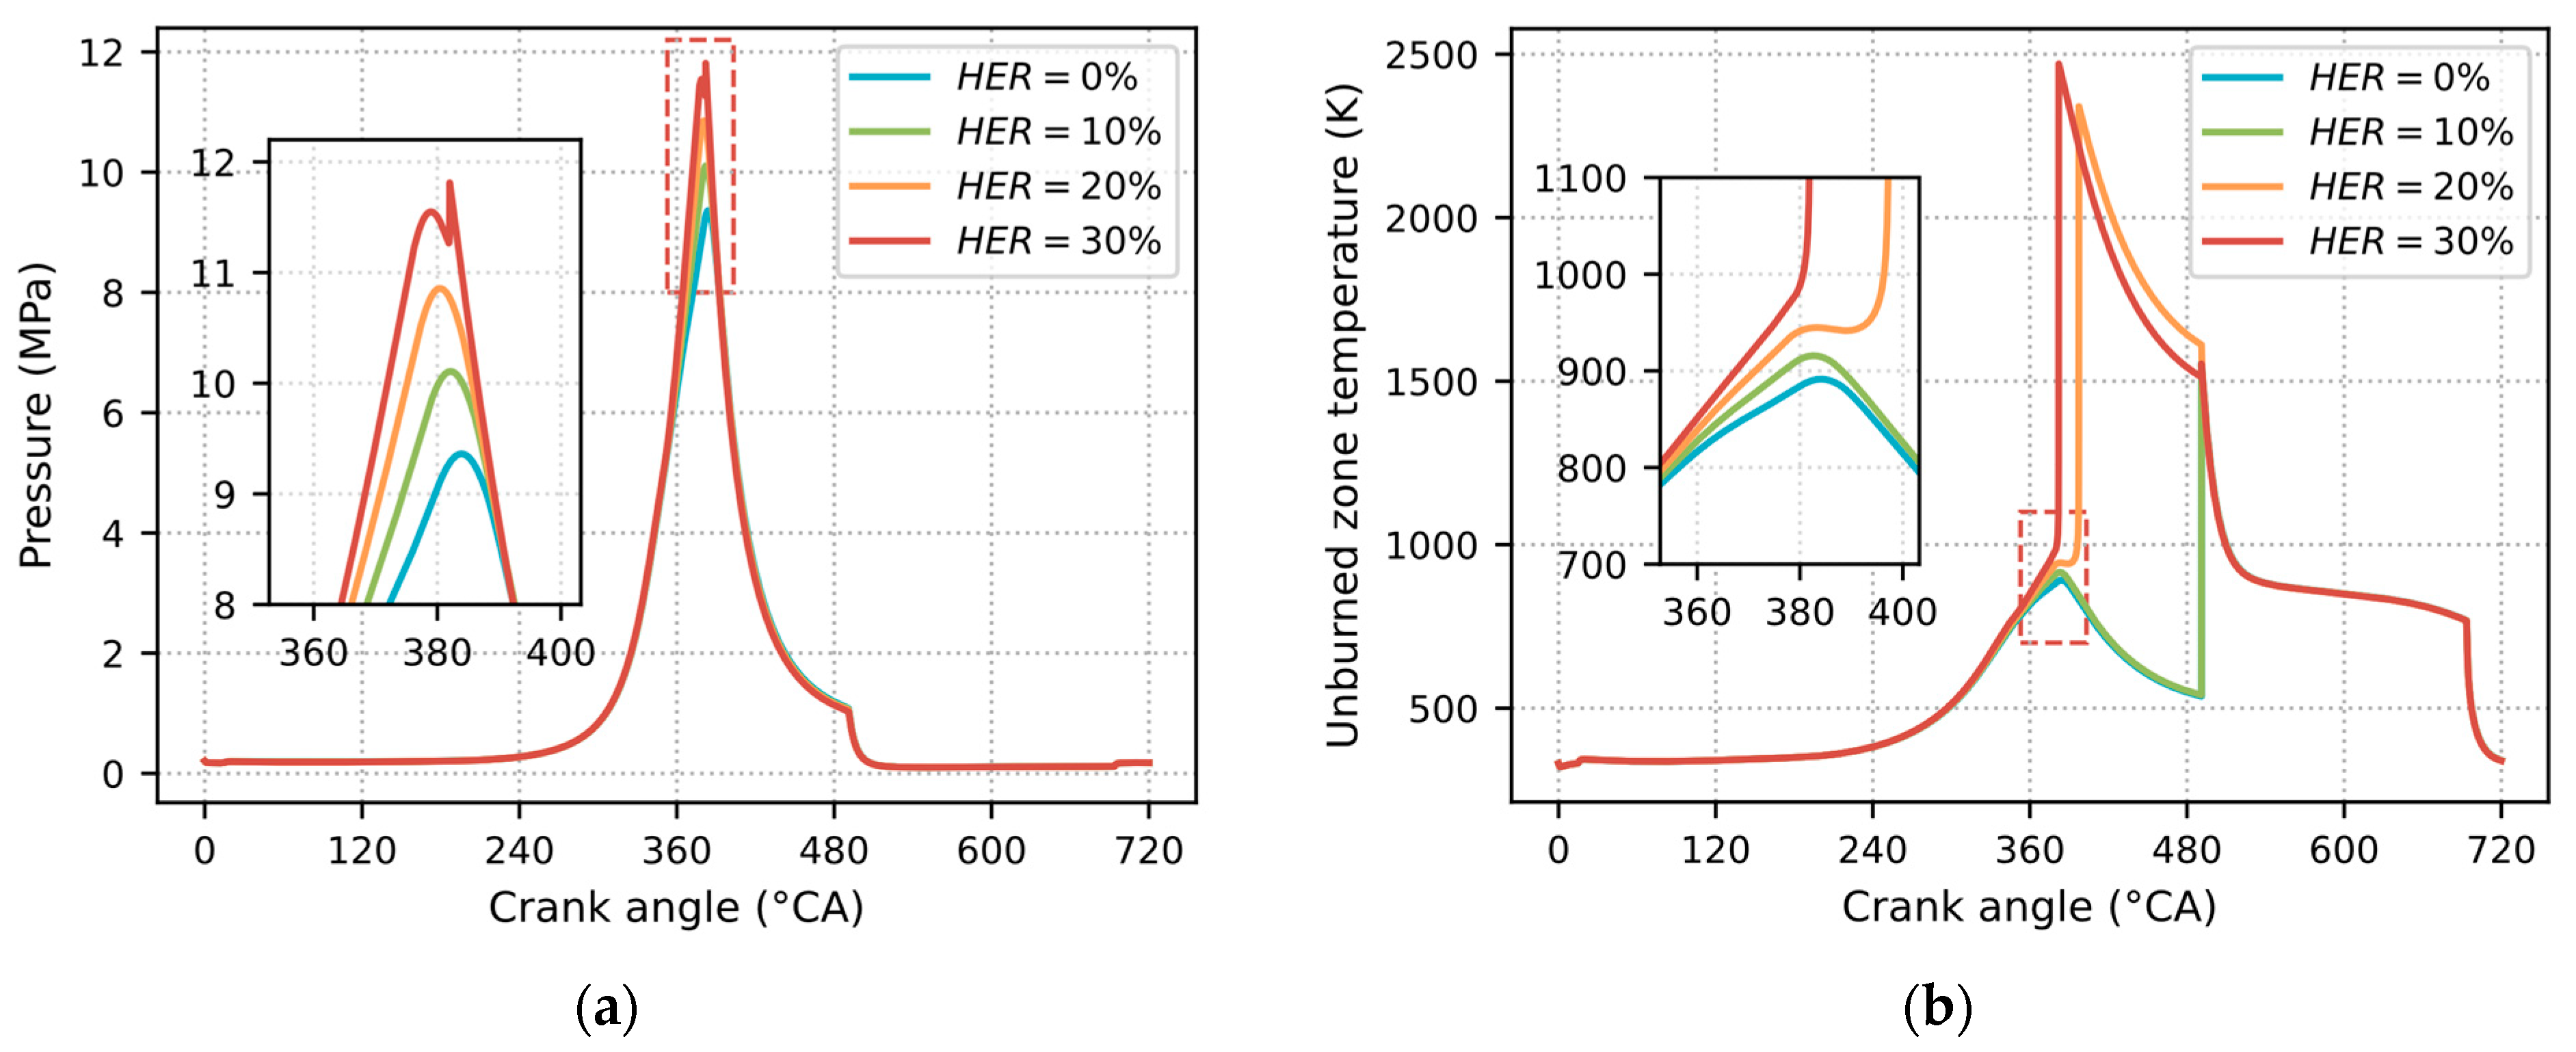
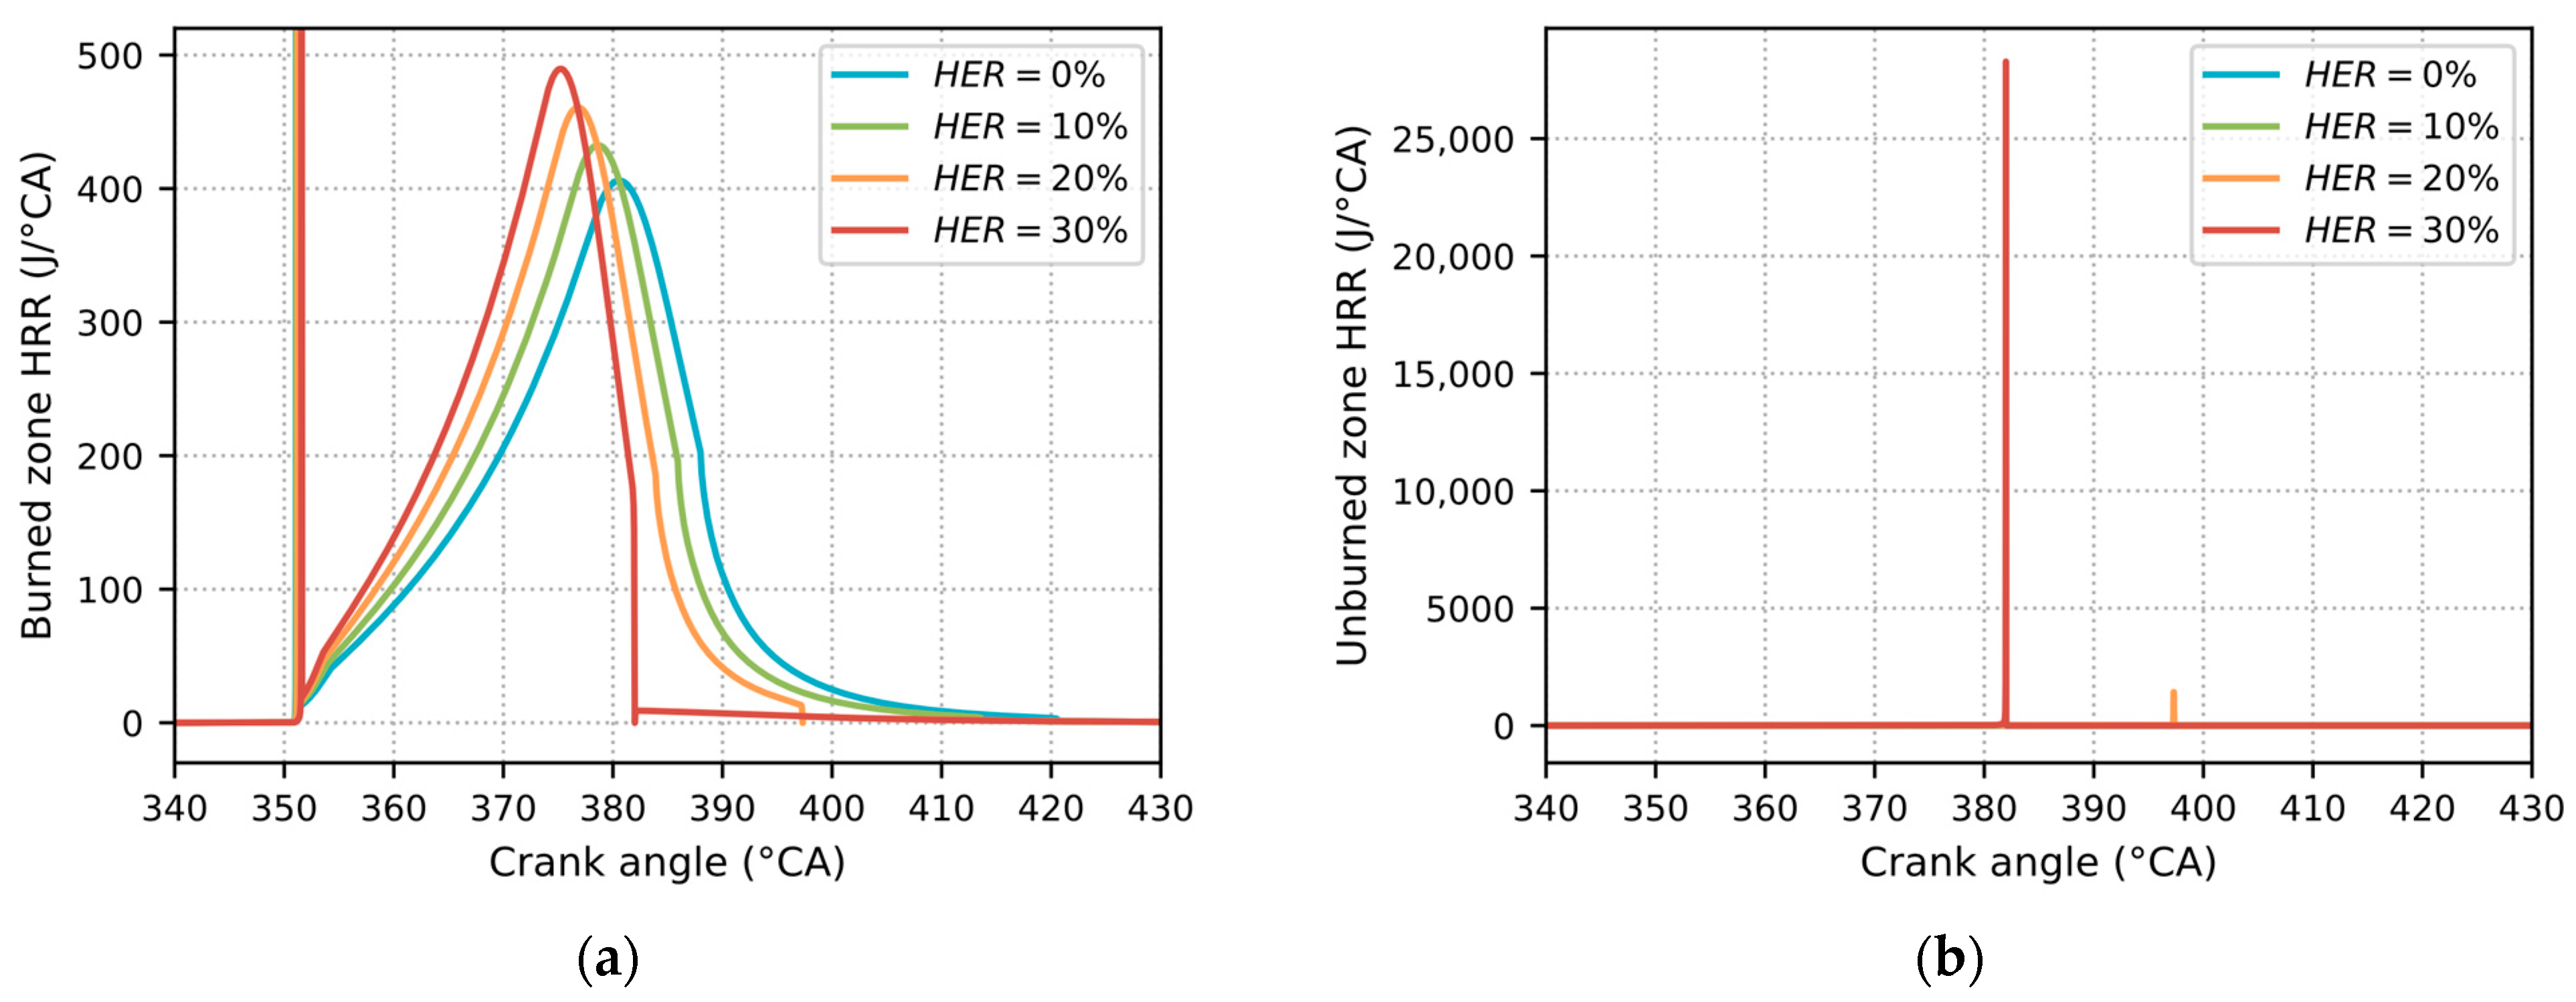
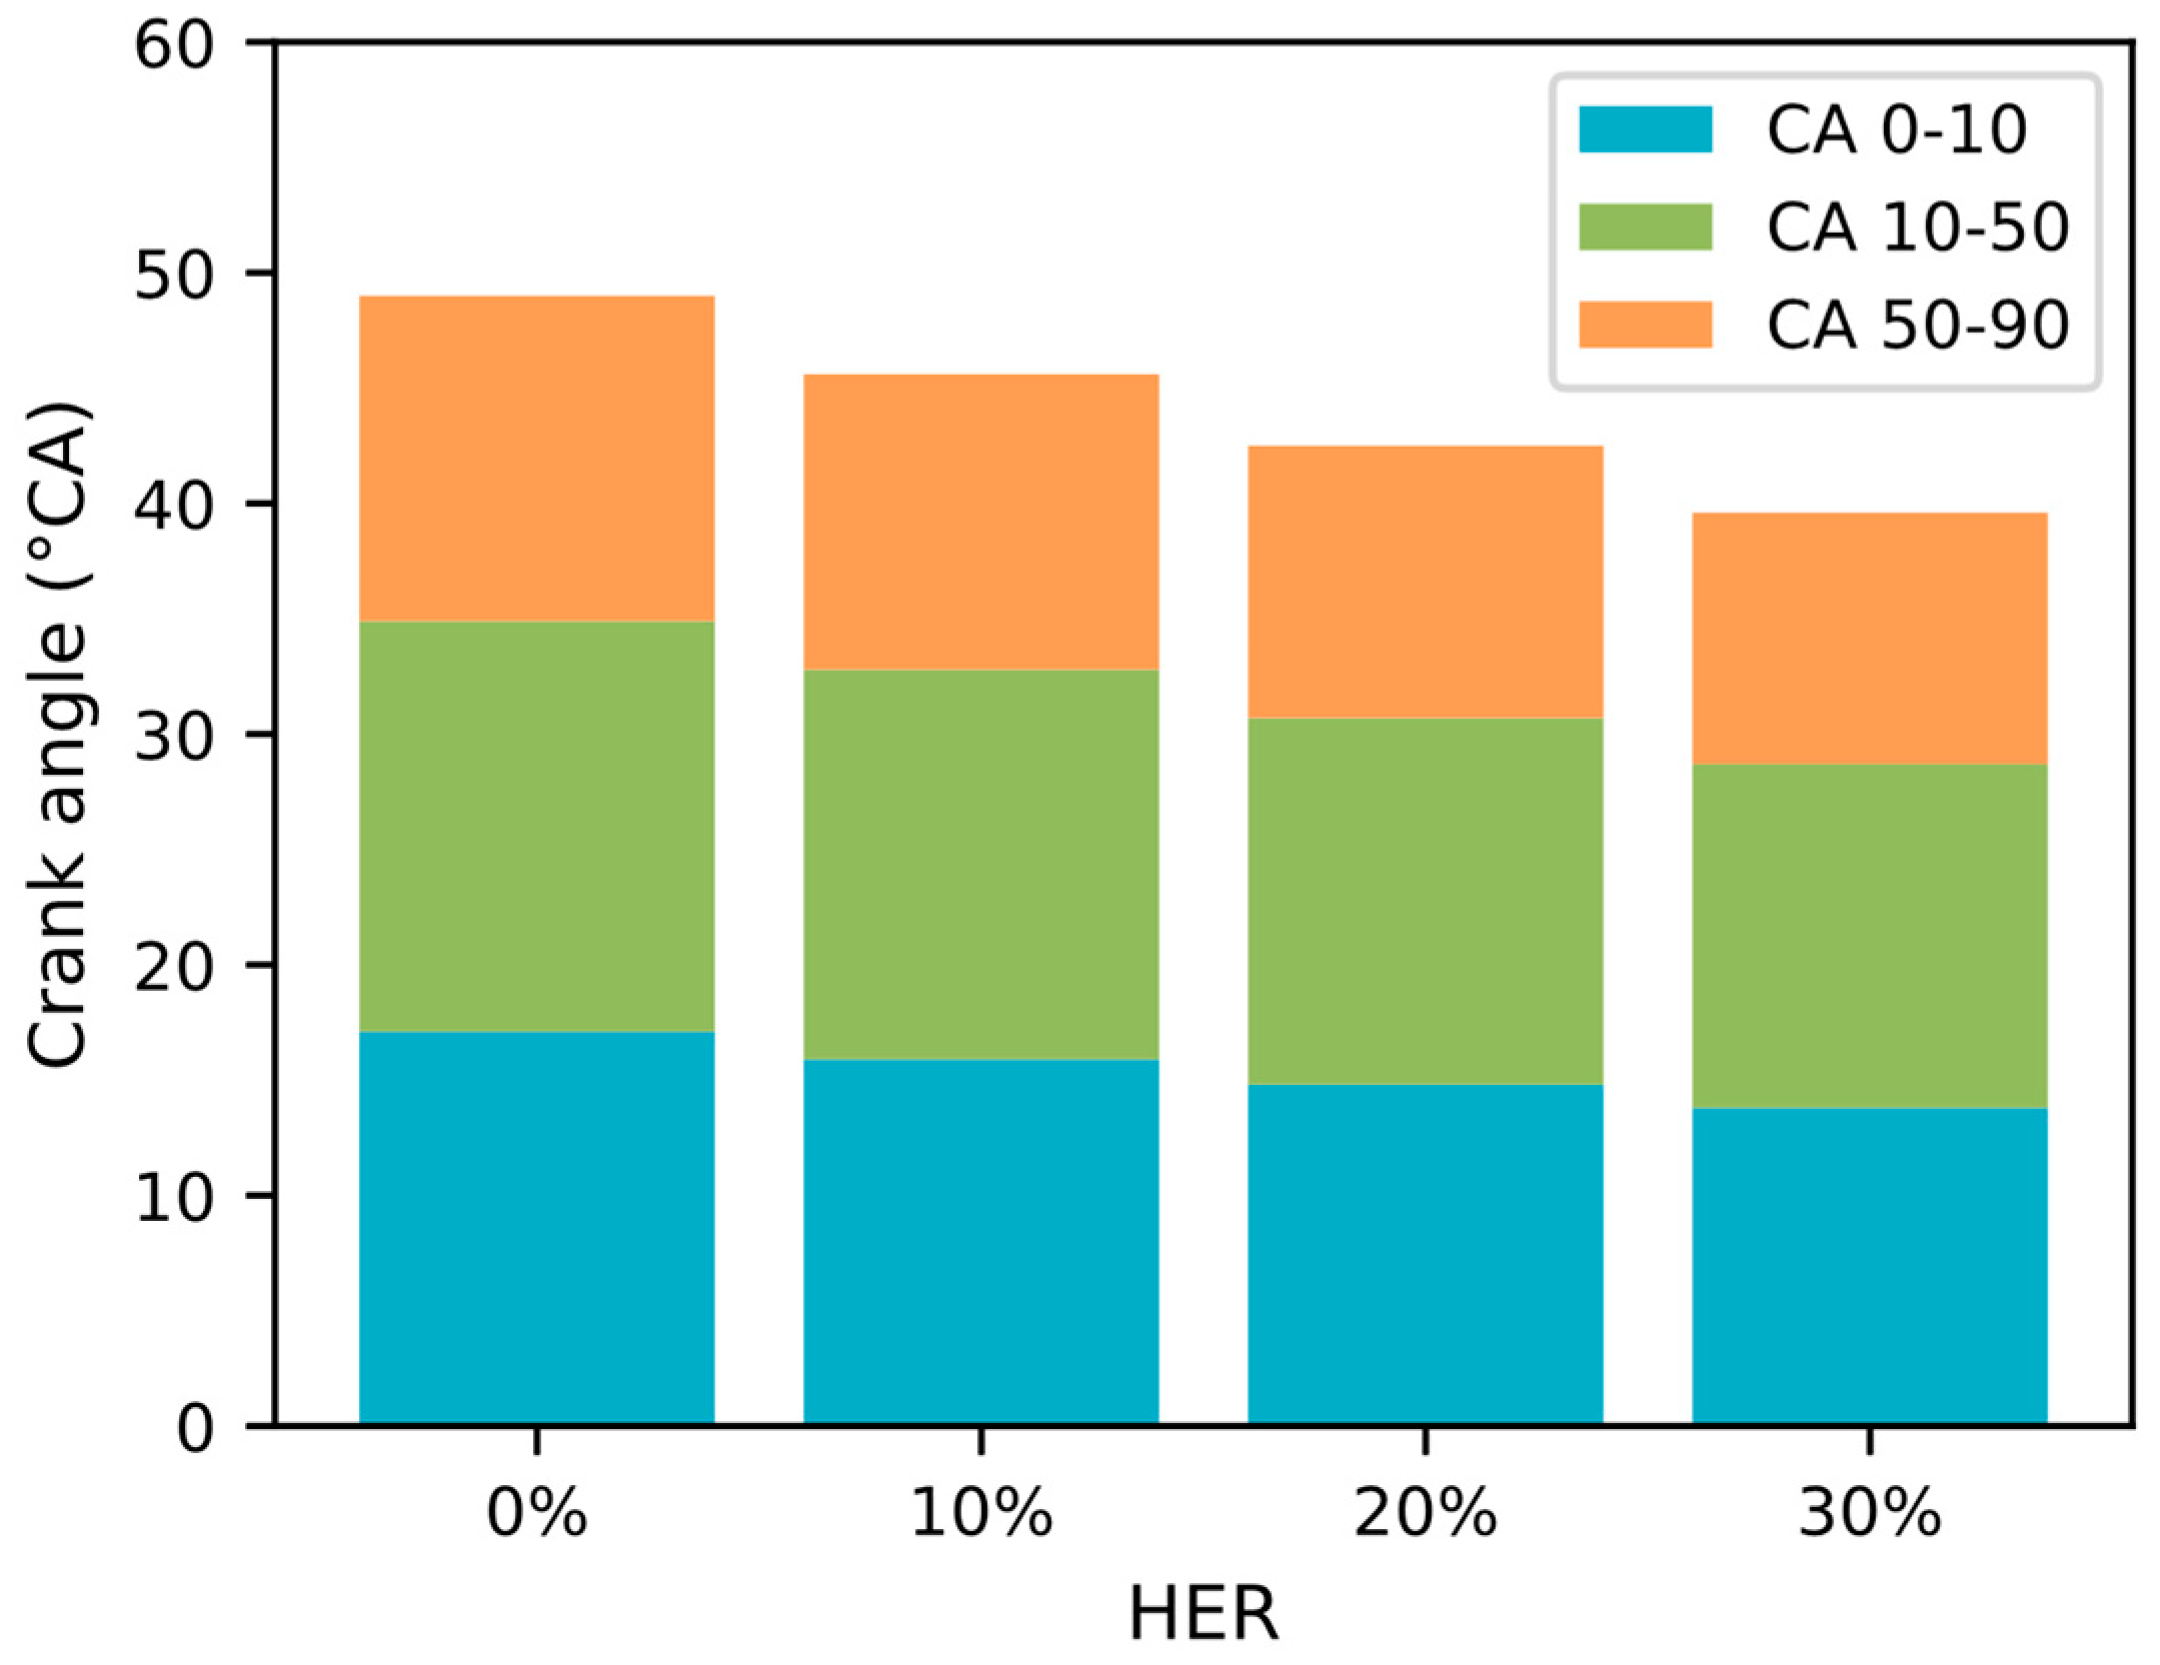
Under high-load conditions, as HER increased from 0% to 30%, the peak in-cylinder pressure rose from 9.3 MPa to 11.8 MPa, with the peak pressure angle advancing from 384 °CA to 379 °CA, and the peak heat release rate escalated from 406 J/°CA to 490 J/°CA. The heat release peak angle shifted forward from 381 °CA to 375 °CA, with a shorter duration and more concentrated heat release.
(3)
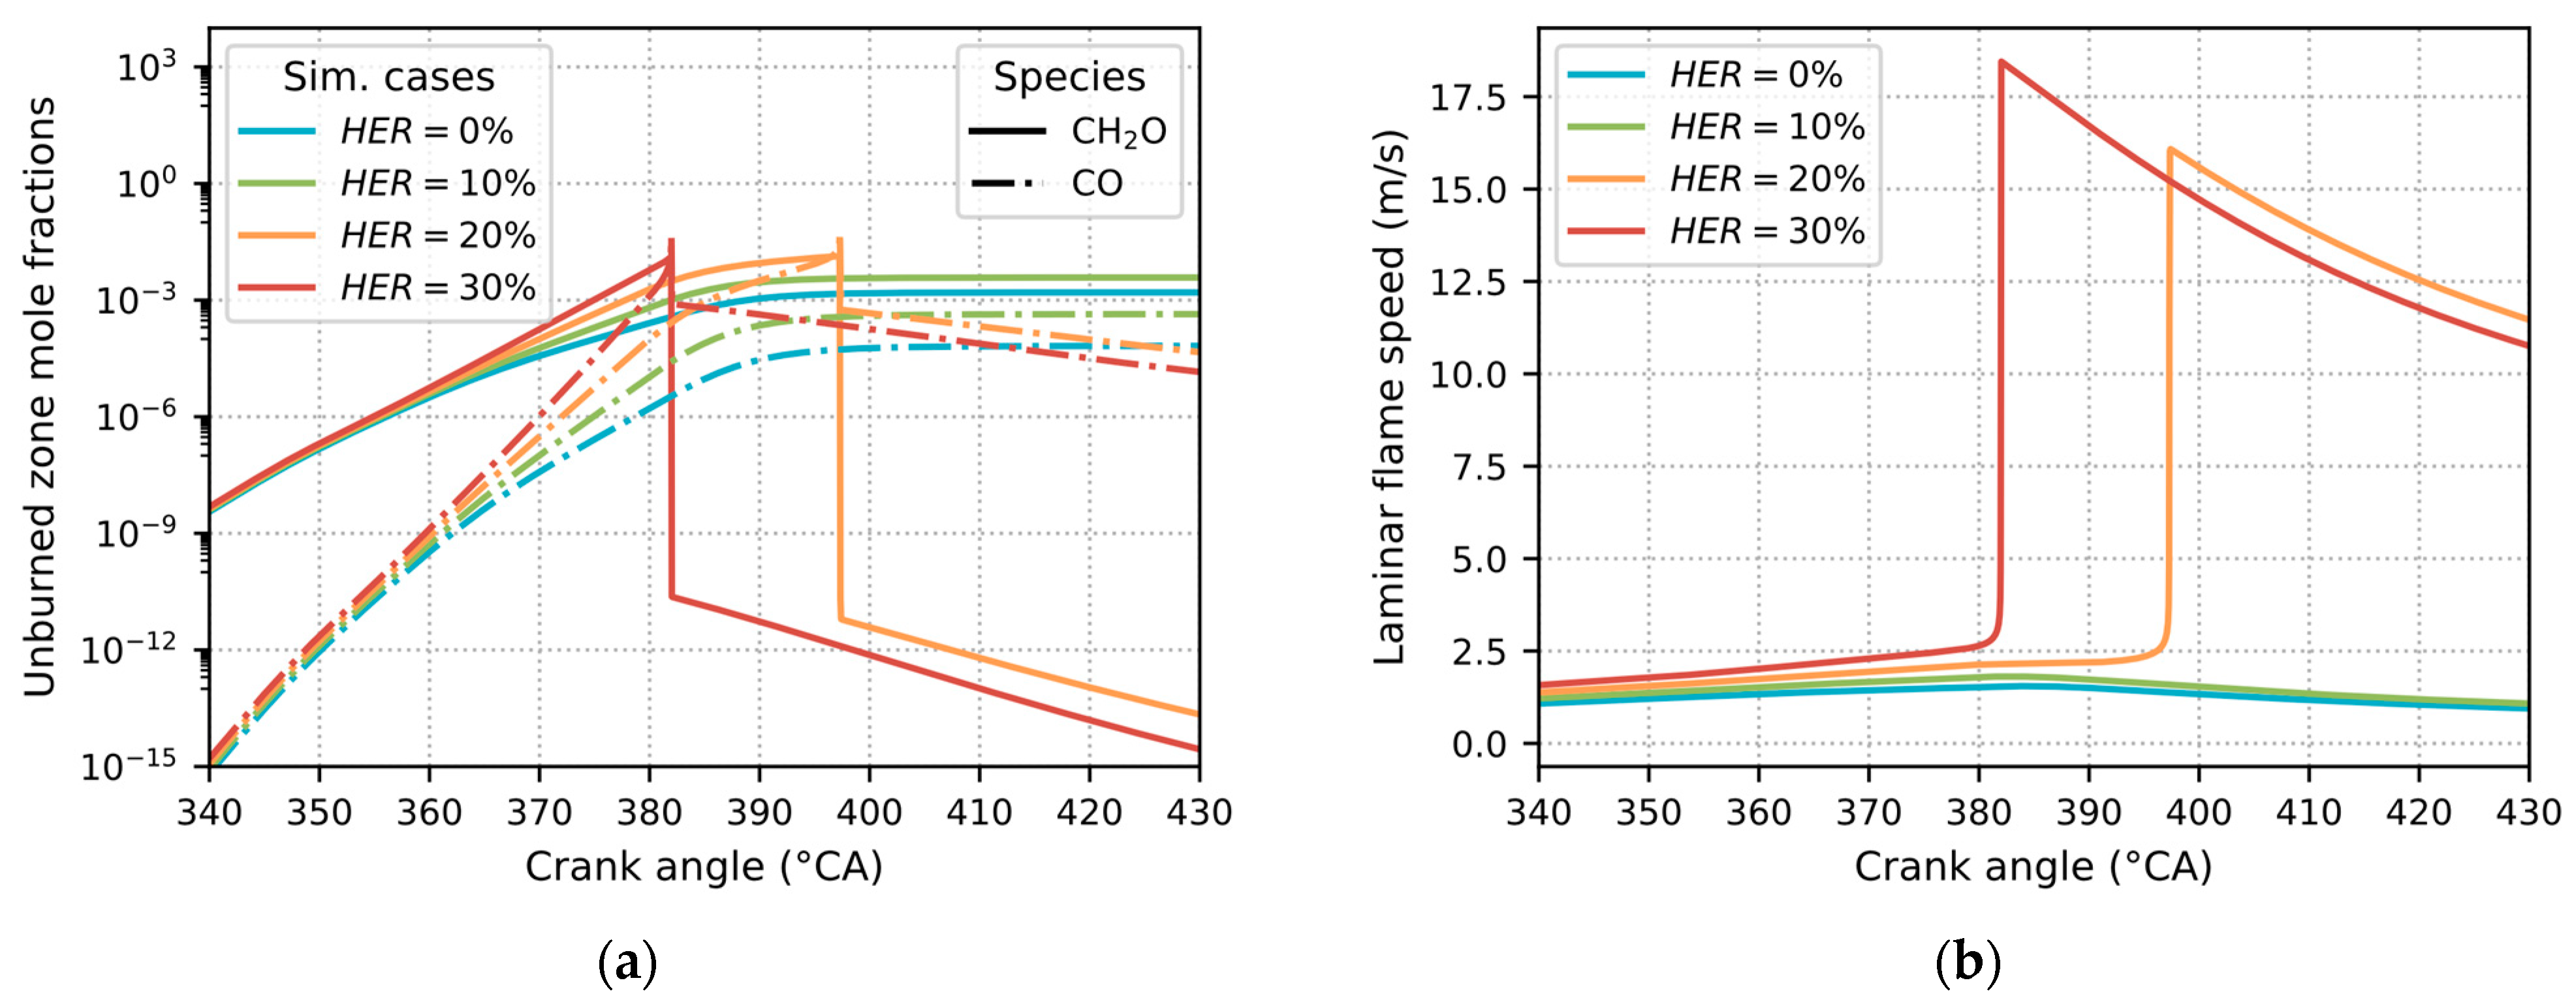
At high load, spontaneous ignition occurred in the unburned zone at HER values of 20% and 30%, indicating the onset of knocking. The unburned zone temperature reached approximately 2400 K during these events. Concurrently, elevated formaldehyde ( C H 2 O ) levels—an intermediate of methanol combustion—coincided with rapid heat release in the unburned zone and a laminar flame speed of approximately 16 m/s, suggesting rapid compression of the unburned zone by the flame front. Analysis revealed that this rapid flame front compression and temperature surge in the unburned zone triggered spontaneous ignition, resulting in knocking.
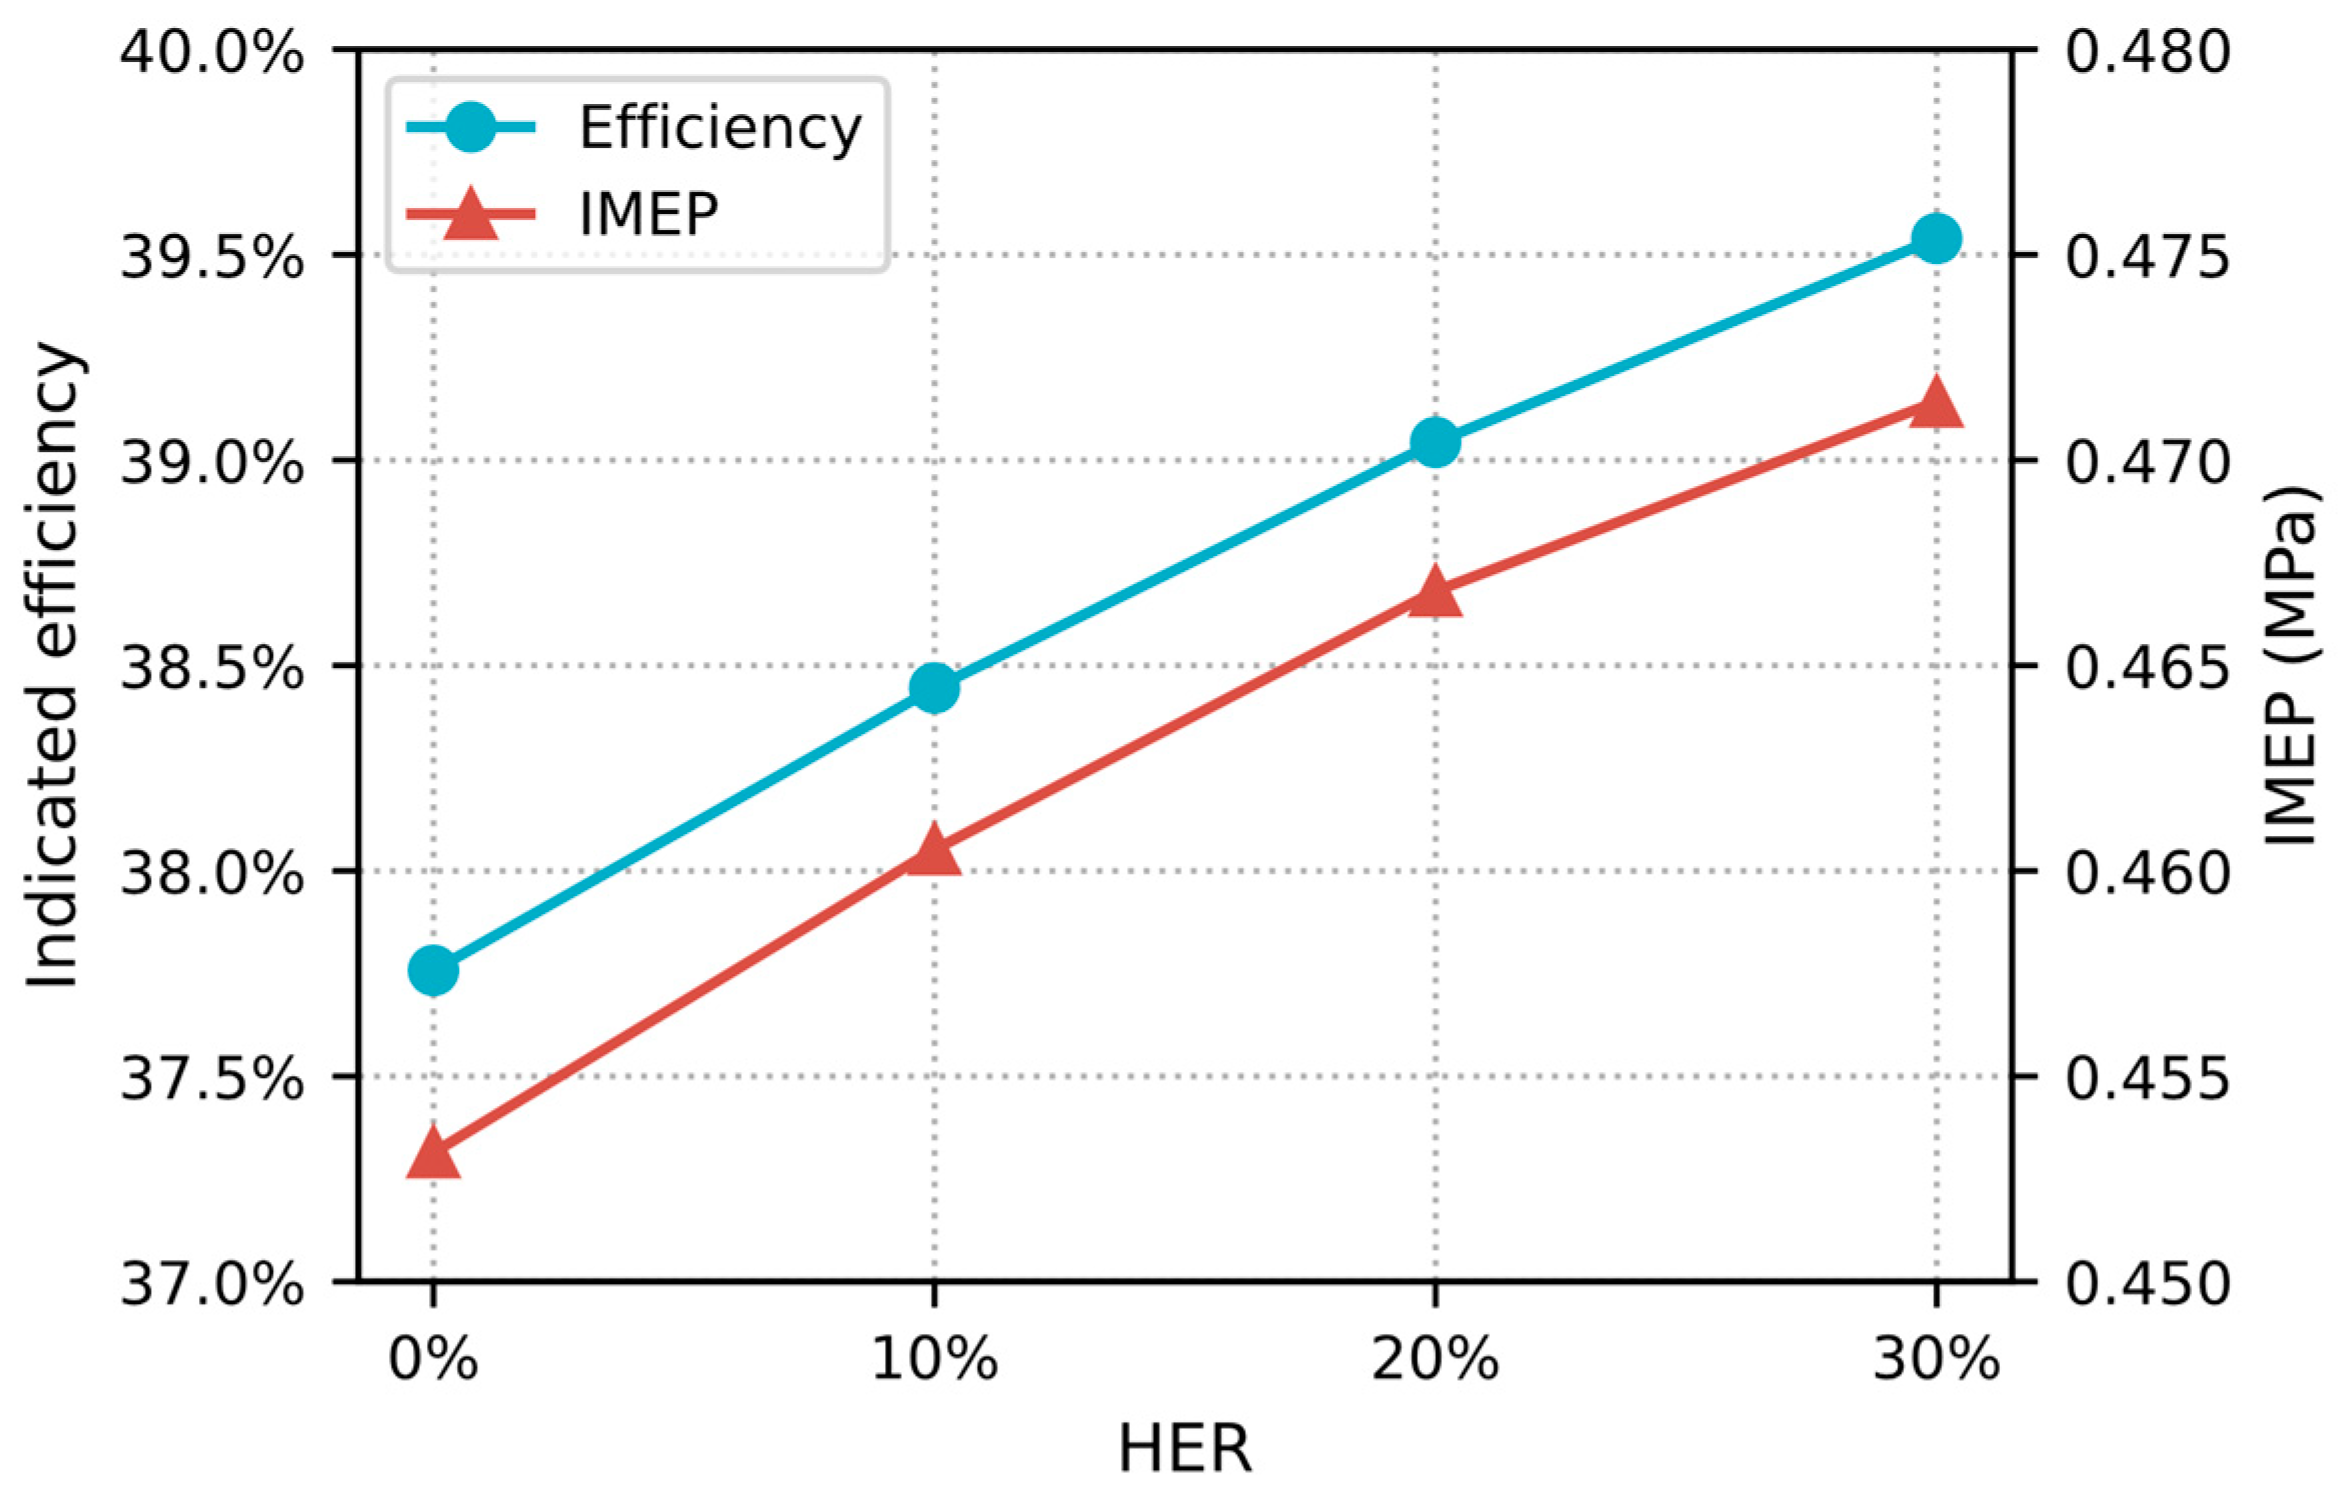
(4)
Under low-load conditions, as HER rose from 0% to 30%, peak pressure increased, heat release became more concentrated, and post-combustion mole fractions of C H 2 O and C O decreased. Additionally, IMEP rose from 0.453 MPa to 0.471 MPa. This indicated that thermal efficiency improved from 37.76% to 39.54%, underscoring that higher HER enhanced power performance.
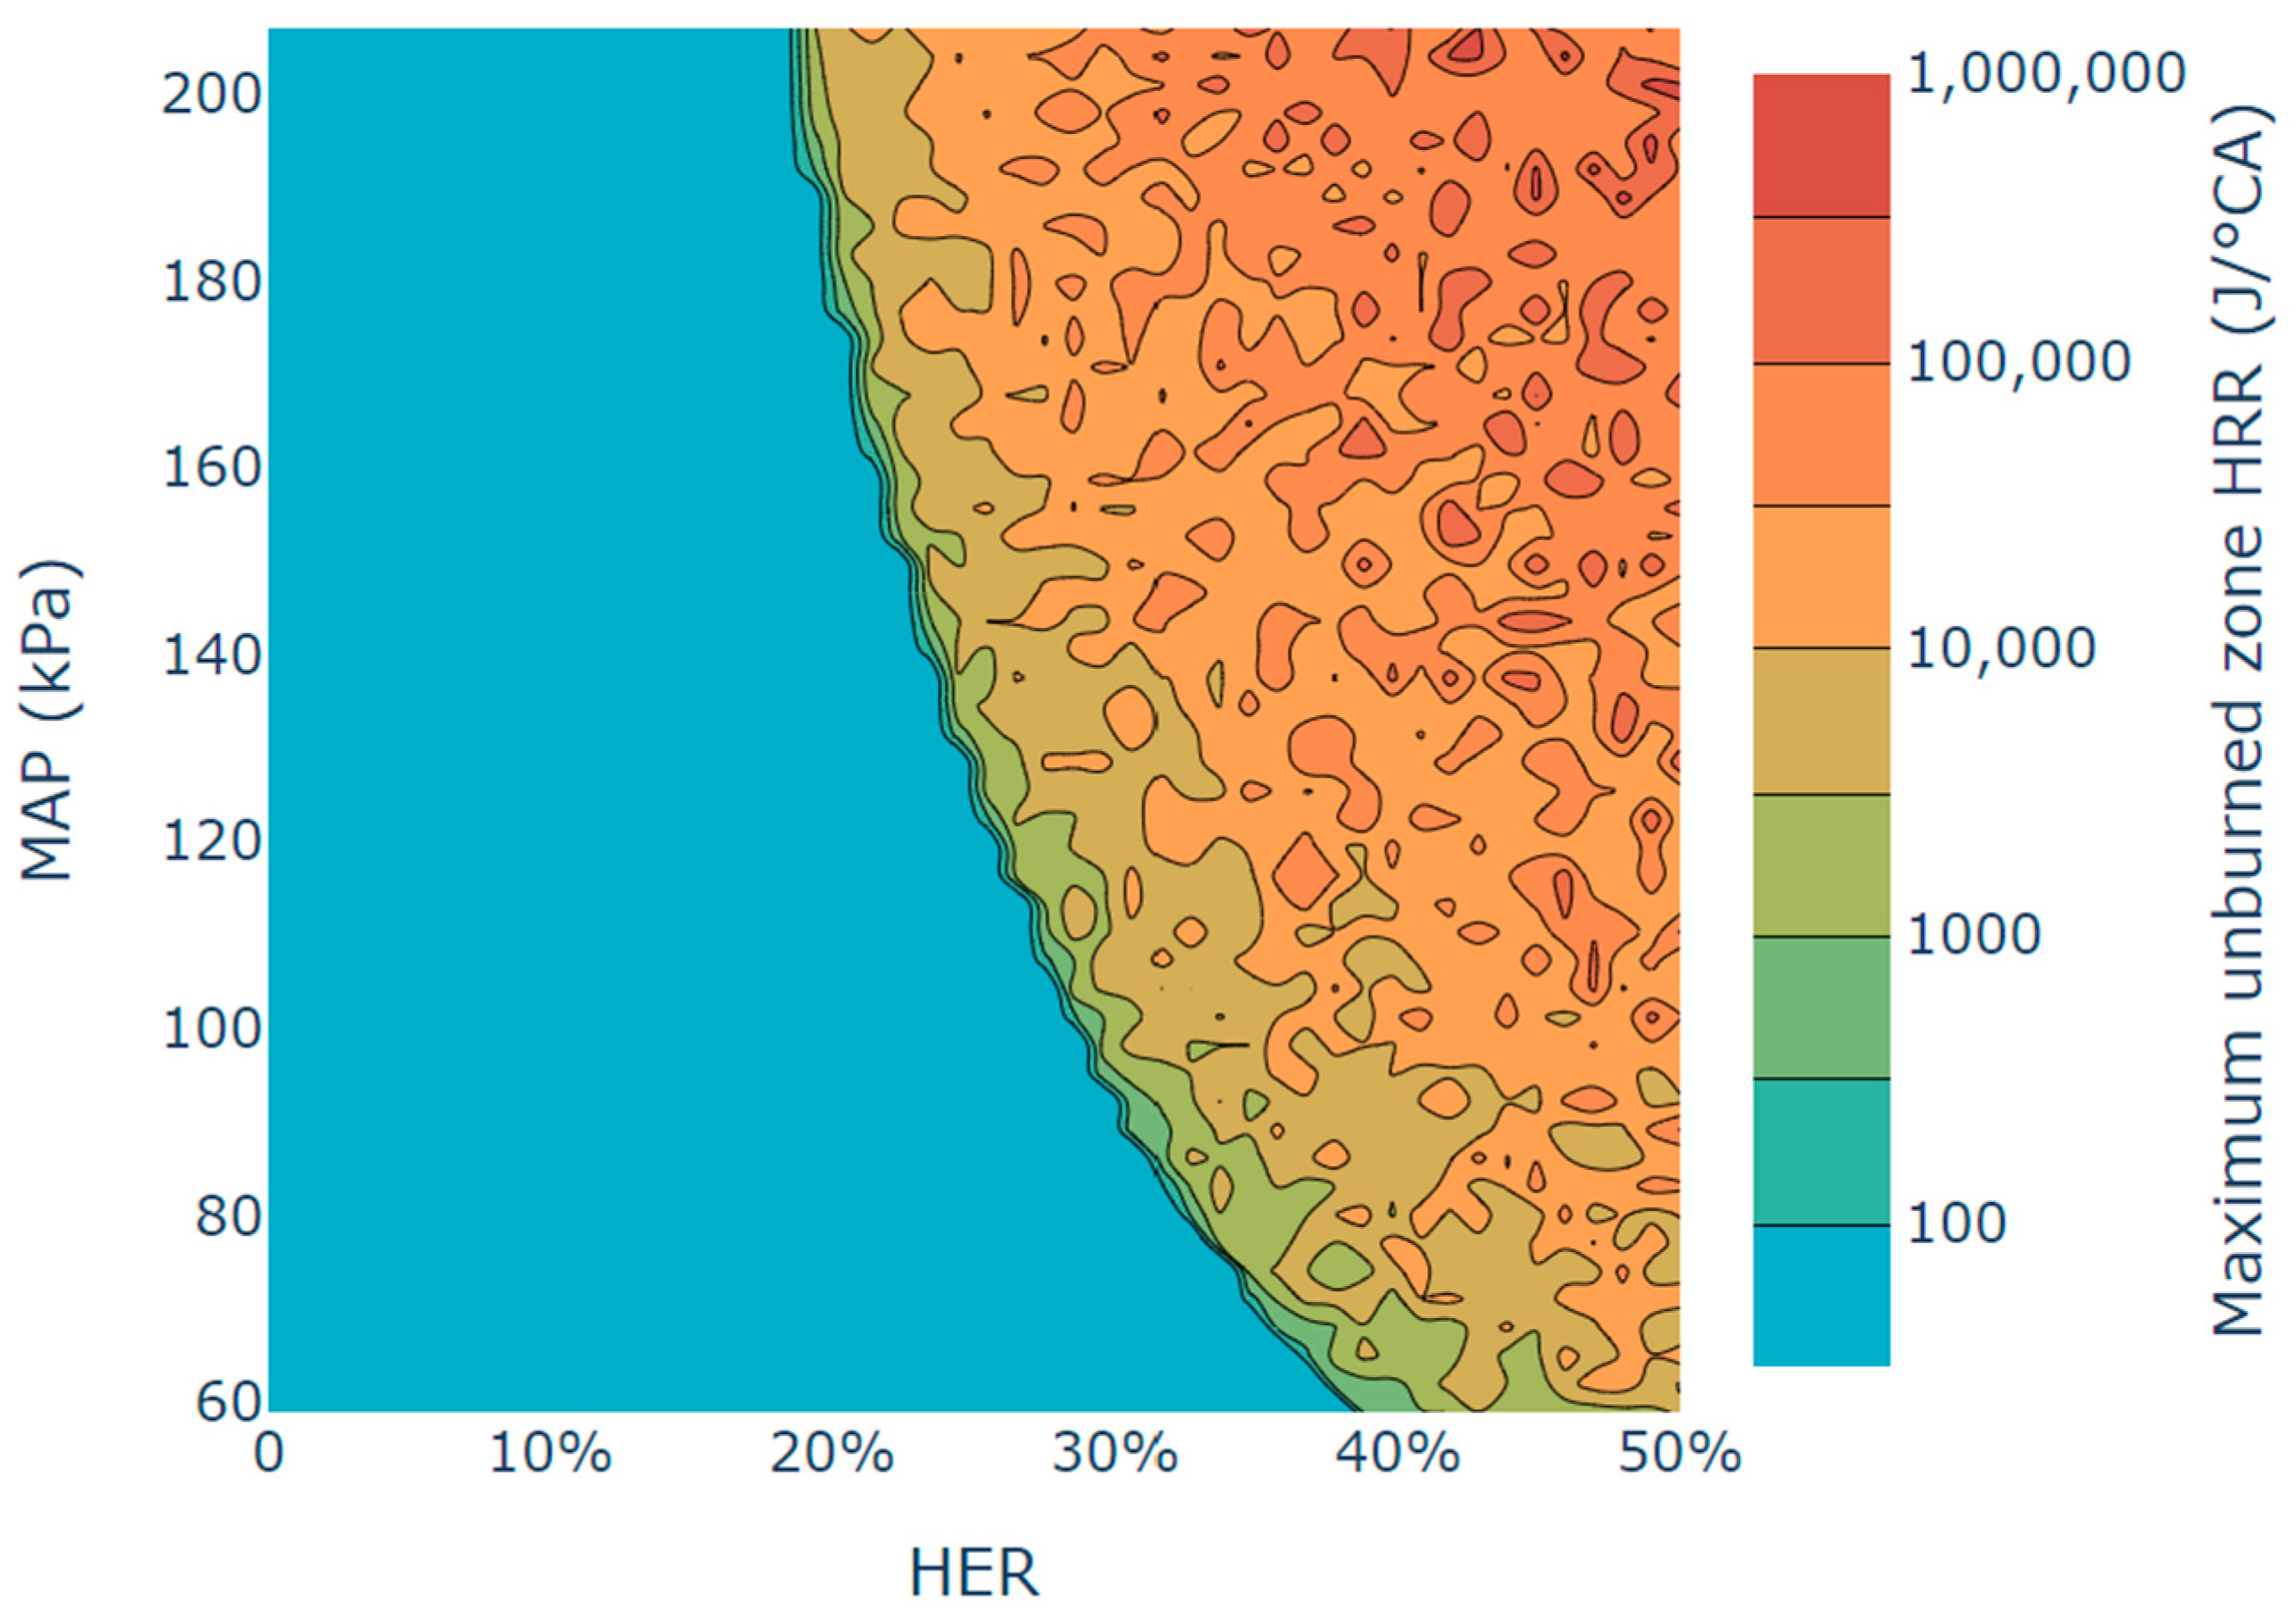
(5)
A total of 2500 operating conditions, spanning MAP from 59 to 207 kPa and HER from 0% to 50%, were simulated. The maximum heat release rate in the unburned zone served as the criterion for identifying knocking, enabling delineation of the unburned zone limit line. Higher MAP increased knocking propensity, reducing the maximum hydrogen energy replacement rate from 40% at MAP = 59 kPa to 20% at MAP = 207 kPa; within the knocking zone, elevated MAP and HER intensified knocking.
This study focused on the effects of hydrogen energy rate on a spark-ignited methanol engine, as well as the knocking boundary under different manifold absolute pressure, providing guidance for the design and operation management of methanol–hydrogen blending engines. However, certain limitations exist in this study. For example, the knocking suppression strategies were not further investigated, which might allow potential improvements in the hydrogen energy rate of methanol–hydrogen engines, achieving higher combustion efficiency and lower emissions without knocking occurrence. These aspects will be systematically investigated in a future study.

Author Contributions

Conceptualization, Y.Z. and L.X; methodology, Y.Z. and L.X; software, Y.Z.; validation, Y.Z. and X.R.; formal analysis, Y.Z. and L.X; investigation, Y.Z. and L.X; resources, Y.D. and X.R.; data curation, Y.D. and X.R.; writing—original draft preparation, Y.Z; writing—review and editing, Y.D. and L.X.; visualization, Y.Z. and X.R.; supervision, Y.D. and L.X.; project administration, Y.D. and X.R.; funding acquisition, Y.D. All authors have read and agreed to the published version of the manuscript.

Funding

This research received no external funding.

Data Availability Statement

The datasets presented in this article are not readily available because the data are part of an ongoing study. Requests to access the datasets should be directed to the corresponding author. The code can be accessed at https://github.com/MooncakeWithoutMoon/moon (accessed on 10 May 2025).

Conflicts of Interest

Author Xiaohui Ren was employed by the company Henan Diesel Engine Industry Co., Ltd. The remaining authors declare that the research was conducted in the absence of any commercial or financial relationships that could be construed as a potential conflict of interest.

Abbreviations

The following abbreviations are used in this manuscript:
ATDCAfter Top Dead Center
BTDCBefore Top Dead Center
CACrank Angle
CFDComputational Fluid Dynamics
CIICarbon Intensity Index
EEXIExisting Energy Efficiency Index
EGRExhaust Gas Recirculation
GHGGreenhouse Gas
HERHydrogen Energy Rate
HRRHeat Release Rate
IMEPIndicated Mean Effective Pressure
IMOInternational Maritime Organization
KIKnock Intensity
LHVLower Heating Value
MAPManifold Absolute Pressure
MEPCMaritime Environment Protection Committee
MFBMass Fraction Burned
PFIPort Fuel Injection
RMSERoot Mean Squared Error
SEEMPShip Energy Efficiency Management Plan
SISpark Ignition

Appendix A

Appendix A.1

To ensure the validity of the fractal turbulent combustion model equations, four key parameters must be calculated: laminar flame area A L , stretched laminar flame speed u L , flame wrinkling scale ratio L m a x / L m i n , and fractal dimension D 3 .
(a)
Laminar flame area A L
The flame area calculation employs an idealized cylindrical model, treating the cylinder as a body with flat top and bottom surfaces. The flame surface is modeled as a spherical surface truncated by the cylinder’s side and bottom surfaces. This geometric configuration is illustrated in Figure A1. The flame radius is then determined using the following equation:
V f = π 8 B 3 1 3 2 r f B 3 α 3 β 3 3 α β + 2 r f B α
where B is the bore diameter of the cylinder, V f is the volume of the already combusted area, r f is the radius of the flame, and α and β define the portions of the equivalent sphere extending beyond the cylinder:
α = 0   i f   r f B / 2 < 1   a n d   α = 1 B / 2 r f 2   i f   r f B / 2 > 1
β = 1     i f   r f h g a p < 1   a n d   β = h g a p r f   i f   r f h g a p > 1
Figure A1. Geometric calculation of the flame front.
Jmse 13 00959 g0a1
Once the flame radius is computed, the equivalent flame area is calculated with the following equation:
A f = A L = π 4 B 2 2 2 r f B 2 β α
(b)
Stretched laminar flame speed u L
The stretched laminar flame speed u L calculation is derived from Chung and Law [41]. Based on Equation 3.16 from their work, it is simplified as follows:
u L = S L 1 ν u S L 2 K
where S L is the unstretched laminar flame speed, calculated using the hydrogen–methanol mixture correlation developed by Liu et al. [32]. ν u is the laminar motion viscosity of the unburned gas, and K is the flame stretching coefficient. Chung and Law [42] believe that the flame stretching coefficient consists of two parts, one part is due to the flame curvature, and the other part is due to the tangential velocity acting on the flame surface:
K = K E + K S
where K is the total flame stretch coefficient, K E is the expansion-related stretch factor, and K S is the strain-related stretch factor from small-scale vortices.
For spherical flames expanding in a static mixture, the following has been demonstrated [43]:
K E = 2 r f d r f d t
The strain-related stretch factor for vortices at the minimum flame wrinkling scale is expressed as follows:
K S = ε ν u 1 ( C 3 ) 2 / 3
where C 3 is the proportionality constant linking the minimum flame wrinkling scale to the Kolmogorov scale (i.e., L m i n = C 3 l K ), and it is set to C 3 = 3.55 based on the average value from the burner-stabilized flame literature. ε the turbulent dissipation rate, calculated using the following equation:
ε = u 3 l I
where u is the root–mean–square turbulent velocity and l I is the integral scale.
(c)
Flame wrinkling scale ratio L m a x / L m i n
Matthews et al. [33] posited that the maximum flame wrinkling scale L m a x is constrained by the flame radius until it equals the gap between the piston and cylinder head h g a p . Thereafter, L m a x is taken as the gap h g a p . Given that the integral scale l I approximates one-third of the clearance and the minimum flame wrinkling scale L m i n is assumed to be 3.55 times the Kolmogorov scale l K , this implies that the flame wrinkling scale ratio L m a x / L m i n approximates the ratio of the integral scale to the Kolmogorov scale:
L max L min = h g a p 3.55 L K l I l K
The integral scale is calculated as follows:
l I = min r f , B 2 , h g a p
where B is the cylinder diameter.
The Kolmogorov scale is calculated using the following equation [44]:
l K = ν 3 ε 1 4
where ν is kinematic viscosity and ε is turbulent dissipation.
(d)
Fractal dimension D 3
In premixed flames propagating through laminar flow fields, the flame surface remains smooth, with a fractal dimension D 3 equal to the topological dimension of 2.0. For premixed flames in high Reynolds number flow fields, theoretical upper limits for the D 3 range from 2.33 to 2.41. Santavicca [34] established a relationship linking the fractal dimension to turbulence intensity and unstretched laminar flame speed. This model assumes that flame wrinkling arises from turbulent convective motion (characterized by u ), counteracted by combustion processes that smooth small-scale wrinkles (characterized by S L ). Their model computes a weighted average of these effects between the minimum and maximum fractal dimensions:
D 3 = 2.35 u u + S L + 2.0 S L u + S L
where u is the root–mean–square turbulent velocity, calculated based on the conservation of angular momentum:
u = u 0 ρ u 0 ρ u 1 3
where u 0 is the root-mean-square turbulent velocity at intake valve closure, ρ u 0 is the unburned zone density at that moment, and ρ u is the current unburned zone density.

Appendix A.2

Heat transfer between the in-cylinder gas and the cylinder wall is calculated using the following equation. As the cylinder space is divided into burned and unburned zones, heat transfer between each zone and the cylinder wall must be computed separately. The heat transfer areas are depicted in Figure A2.
Q · = i = 1 2 j = 1 3 α i T g a s , i T w a l l , j A i , j
where Q ˙ is the heat flux from the gas to the wall surface, α i is the heat transfer coefficient, T g a s , i is the gas temperature, T w a l l , j is the wall temperature, A i , j is the heat transfer area, i = 1 , represent the burned zone and the unburned zone, and j = 1,2 , represent the cylinder head, cylinder wall and piston crown. The heat transfer coefficient is determined using the Woschni correlation:
α = C 1 B 0.214 P 1000 0.786 T 0.525 C 3 c m + C 4 V s T 1 V 1 P 1 P P 0 0.786
where B is the cylinder diameter; P is the in-cylinder pressure Pa; T is the gas temperature K; c m is the mean piston speed m/s; V s is the swept volume m3; T 1 , V 1 , P 1 are the temperature, volume, pressure at inlet valve closure; P 0 is the motored pressure; C 1 = 3.26 ; C 3 = 6.18 (during gas exchange), C 3 = 2.28 (during combustion and expansion); C 4 = 0 (during gas exchange and compression), C 4 = 0.00324 (during combustion and expansion).
Figure A2. The heat transfer area from the gas to the wall for burned zone and unburned zone.
Jmse 13 00959 g0a2

References

  1. Miola, A.; Ciuffo, B. Estimating air emissions from ships: Meta-analysis of modelling approaches and available data sources. Atmos. Environ. 2011, 45, 2242–2251. [Google Scholar] [CrossRef]
  2. Balcombe, P.; Brierley, J.; Lewis, C.; Skatvedt, L.; Speirs, J.; Hawkes, A.; Staffell, I. How to decarbonise international shipping: Options for fuels, technologies and policies. Energy Convers. Manag. 2019, 182, 72–88. [Google Scholar] [CrossRef]
  3. IMO. Greenhouse Gas Study 2014, Executive Summary and Final Report; International Maritime Organization: London, UK, 2014; p. 480. [Google Scholar]
  4. IMO. Adoption of the initial IMO strategy on reduction of GHG emissions from ships and existing IMO activity related to reducing GHG emissions in the shipping sector. In Note by the International Maritime Organization to the UNFCCC Talanoa Dialogue; International Maritime Organization: London, UK, 2018. [Google Scholar]
  5. IMO. 2023 IMO strategy on reduction of GHG emissions from ships. In Resolution MEPC. 377 (80); International Maritime Organization: London, UK, 2023. [Google Scholar]
  6. Psaraftis, H.N. Shipping decarbonization in the aftermath of MEPC 76. Clean. Logist. Supply Chain 2021, 1, 100008. [Google Scholar] [CrossRef]
  7. Čampara, L.; Hasanspahić, N.; Vujičić, S. Overview of MARPOL ANNEX VI regulations for prevention of air pollution from marine diesel engines. SHS Web Conf. 2018, 58, 01004. [Google Scholar] [CrossRef]
  8. Zhou, F.; Yu, J.; Wu, C.; Fu, J.; Liu, J.; Duan, X. The application prospect and challenge of the alternative methanol fuel in the internal combustion engine. Sci. Total Environ. 2024, 913, 169708. [Google Scholar] [CrossRef]
  9. Reddy, V.J.; Hariram, N.; Maity, R.; Ghazali, M.F.; Kumarasamy, S. Sustainable e-fuels: Green hydrogen, methanol and ammonia for carbon-neutral transportation. World Electr. Veh. J. 2023, 14, 349. [Google Scholar] [CrossRef]
  10. Kumarasamy, S.; Selvanathan, S.P.; Ghazali, M.F. From offshore renewable energy to green hydrogen: Addressing critical questions. Clean Energy 2025, 9, 108–122. [Google Scholar] [CrossRef]
  11. Reddy, V.J.; Hariram, N.; Maity, R.; Ghazali, M.F.; Kumarasamy, S. Sustainable vehicles for decarbonizing the transport sector: A comparison of biofuel, electric, fuel cell and solar-powered vehicles. World Electr. Veh. J. 2024, 15, 93. [Google Scholar] [CrossRef]
  12. Celik, M.B.; Özdalyan, B.; Alkan, F. The use of pure methanol as fuel at high compression ratio in a single cylinder gasoline engine. Fuel 2011, 90, 1591–1598. [Google Scholar] [CrossRef]
  13. Balki, M.K.; Sayin, C.; Canakci, M. The effect of different alcohol fuels on the performance, emission and combustion characteristics of a gasoline engine. Fuel 2014, 115, 901–906. [Google Scholar] [CrossRef]
  14. Zhang, Y.; Mu, Z.; Wei, Y.; Zhu, Z.; Du, R.; Liu, S. Comprehensive study on unregulated emissions of heavy-duty SI pure methanol engine with EGR. Fuel 2022, 320, 123974. [Google Scholar] [CrossRef]
  15. Xu, C.; Zhuang, Y.; Qian, Y.; Cho, H. Effect on the performance and emissions of methanol/diesel dual-fuel engine with different methanol injection positions. Fuel 2022, 307, 121868. [Google Scholar] [CrossRef]
  16. Güdden, A.; Pischinger, S.; Geiger, J.; Heuser, B.; Müther, M. An experimental study on methanol as a fuel in large bore high speed engine applications–Port fuel injected spark ignited combustion. Fuel 2021, 303, 121292. [Google Scholar] [CrossRef]
  17. MEPC. Amendments to the Annex of the Protocol of 1997 to Amend the International Convention for the Prevention of Pollution From Ships, 1973, as Modified by the Protocol of 1978 Relating Thereto. Amendments to MARPOL Annex VI. In RESOLUTION MEPC.328(76); Marine Environment Protection Committee (MEPC): London, UK, 2011. [Google Scholar]
  18. Gong, C.; Peng, L.; Chen, Y.; Liu, J.; Liu, F.; Han, Y. Computational study of intake temperature effects on mixture formation, combustion and unregulated emissions of a DISI methanol engine during cold start. Fuel 2018, 234, 1269–1277. [Google Scholar] [CrossRef]
  19. Gong, C.; Liu, J.; Peng, L.; Liu, F. Numerical study of effect of injection and ignition timings on combustion and unregulated emissions of DISI methanol engine during cold start. Renew. Energy 2017, 112, 457–465. [Google Scholar] [CrossRef]
  20. Liu, J.; Gong, C.; Peng, L.; Liu, F.; Yu, X.; Li, Y. Numerical study of formaldehyde and unburned methanol emissions of direct injection spark ignition methanol engine under cold start and steady state operating conditions. Fuel 2017, 202, 405–413. [Google Scholar] [CrossRef]
  21. Yuan, B.; Zhao, H.; Huang, Y.; Zhang, M.; Song, Z.; Shen, Y.; Cheng, X.; Wang, Z. Investigation on cold start issues of methanol engines and its improvement from the perspective of droplet evaporation. Fuel 2025, 380, 133249. [Google Scholar] [CrossRef]
  22. Purayil, S.; Hamdan, M.O.; Al-Omari, S.; Selim, M.; Elnajjar, E. Influence of ethanol–gasoline–hydrogen and methanol–gasoline–hydrogen blends on the performance and hydrogen knock limit of a lean-burn spark ignition engine. Fuel 2024, 377, 132825. [Google Scholar] [CrossRef]
  23. Duan, X.; Chu, X.; Wang, R.; Chen, Z.; Zhou, F.; Abdellatief, T.M. The performance and emissions characteristics of the gasoline spark ignition engine fuelled with green and renewable methanol and hydrogen. Renew. Energy 2025, 240, 122184. [Google Scholar] [CrossRef]
  24. Gong, C.; Li, D.; Liu, J.; Liu, F. Numerical evaluation of ignition timing influences on performance of a stratified-charge H2/methanol dual-injection automobile engine under lean-burn condition. Energy 2024, 290, 130209. [Google Scholar] [CrossRef]
  25. Gong, C.; Li, Z.; Huang, K.; Liu, F. Research on the performance of a hydrogen/methanol dual-injection assisted spark-ignition engine using late-injection strategy for methanol. Fuel 2020, 260, 116403. [Google Scholar] [CrossRef]
  26. Prasad, B.N.; Pandey, J.K.; Kumar, G. Effect of hydrogen enrichment on performance, combustion, and emission of a methanol fueled SI engine. Int. J. Hydrogen Energy 2021, 46, 25294–25307. [Google Scholar] [CrossRef]
  27. Zhang, H.; Yang, Y.; Li, C.; Li, Q.; Liu, H.; Huang, Z. Investigation on a combined system with methanol on-board hydrogen production and internal combustion engine. Fuel 2024, 375, 132586. [Google Scholar] [CrossRef]
  28. Abbas, A.H.M.; Cheralathan, K.K.; Porpatham, E.; Arumugam, S.K. Hydrogen generation using methanol steam reforming–catalysts, reactors, and thermo-chemical recuperation. Renew. Sustain. Energy Rev. 2024, 191, 114147. [Google Scholar] [CrossRef]
  29. Tang, Y.; Long, W.; Wang, Y.; Xiao, G.; Wang, Y.; Lu, M. Multi-objective optimization of methanol reforming reactor performance based on response surface methodology and multi-objective particle swarm optimization coupling algorithm for on-line hydrogen production. Energy Convers. Manag. 2024, 307, 118377. [Google Scholar] [CrossRef]
  30. Wang, Y.; Long, W.; Tian, H.; Dong, P.; Lu, M.; Tang, Y.; Wang, Y.; Zhang, W. Research on oxidation mechanism of hydrogen/syngas-methanol and its application on engine performance prediction. Fuel 2024, 365, 131211. [Google Scholar] [CrossRef]
  31. Ji, C.; Yang, J.; Liu, X.; Zhang, B.; Wang, S.; Gao, B. A quasi-dimensional model for combustion performance prediction of an SI hydrogen-enriched methanol engine. Int. J. Hydrogen Energy 2016, 41, 17676–17686. [Google Scholar] [CrossRef]
  32. Liu, X.; Ji, C.; Gao, B.; Wang, S.; Liang, C.; Yang, J. A laminar flame speed correlation of hydrogen–methanol blends valid at engine-like conditions. Int. J. Hydrogen Energy 2013, 38, 15500–15509. [Google Scholar] [CrossRef]
  33. Matthews, R.D.; Chin, Y.-W. A fractal-based SI engine model: Comparisons of predictions with experimental data. SAE Trans. 1991, 100, 99–117. [Google Scholar]
  34. Santavicca, D.A.; Liou, D.; North, G.L. A fractal model of turbulent flame kernel growth. SAE Trans. 1990, 99, 90–98. [Google Scholar]
  35. Bozza, F.; Gimelli, A.; Merola, S.S.; Vaglieco, B. Validation of a fractal combustion model through flame imaging. SAE Trans. 2005, 114, 973–987. [Google Scholar]
  36. Li, J.; Zhao, Z.; Kazakov, A.; Chaos, M.; Dryer, F.L.; Scire Jr, J.J. A comprehensive kinetic mechanism for CO, CH2O, and CH3OH combustion. Int. J. Chem. Kinet. 2007, 39, 109–136. [Google Scholar] [CrossRef]
  37. Gouldin, F.C. An application of fractals to modeling premixed turbulent flames. Combust. Flame 1987, 68, 249–266. [Google Scholar] [CrossRef]
  38. Verhelst, S.; Sheppard, C. Multi-zone thermodynamic modelling of spark-ignition engine combustion—An overview. Energy Convers. Manag. 2009, 50, 1326–1335. [Google Scholar] [CrossRef]
  39. Saliba, A.T.; Agius, E.; Scerri, K.; Farrugia, M. Simulation of operation and control of LNG and diesel dual fuel engine for marine application. In Proceedings of the 7th Offshore Energy & Storage Symposium (OSES 2023), St. Julian’s, Malta, 12–14 July 2023; pp. 349–356. [Google Scholar]
  40. Zhen, X.; Wang, Y.; Xu, S.; Zhu, Y.; Tao, C.; Xu, T.; Song, M. The engine knock analysis—An overview. Appl. Energy 2012, 92, 628–636. [Google Scholar] [CrossRef]
  41. Chung, S.; Law, C. An integral analysis of the structure and propagation of stretched premixed flames. Combust. Flame 1988, 72, 325–336. [Google Scholar] [CrossRef]
  42. Chung, S.H.; Law, C. An invariant derivation of flame stretch. Combust. Flame 1984, 55, 123–125. [Google Scholar] [CrossRef]
  43. Law, C. Dynamics of stretched flames. In Symposium (International) on Combustion; Elsevier: Amsterdam, The Netherlands, 1989; pp. 1381–1402. [Google Scholar]
  44. Wu, C.; Roberts, C.; Matthews, R.D.; Hall, M. Effects of engine speed on combustion in SI engines: Comparisons of predictions of a fractal burning model with experimental data. SAE Trans. 1993, 102, 2277–2291. [Google Scholar]
Figure 1. Schematic diagram of the fractal turbulent combustion model.
Jmse 13 00959 g001
Figure 2. The first flame plume arrival at cylinder wall, beginning of near-wall combustion mode.
Jmse 13 00959 g002
Figure 3. Model network for combustion and gas exchange/compression process, in parentheses are the Cantera modules used: (a) combustion process model; (b) gas exchange/compression process model.
Jmse 13 00959 g003
Figure 4. The transition between combustion process model and the gas exchange/compression process model.
Jmse 13 00959 g004
Figure 5. Model validation for mass burned percentage under different operating conditions: (a) 100% load; (b) 75% load; (c) 50% load; (d) 25% load.
Jmse 13 00959 g005
Figure 6. Power generated by a single gen-set during a Round-Trip Voyage (RTV).
Jmse 13 00959 g006
Figure 7. In-cylinder pressure and unburned zone temperature under different hydrogen energy rate at MAP = 207 kPa and excess air ratio = 1.4: (a) in-cylinder pressure throughout the cycle; (b) unburned zone temperature throughout the cycle.
Jmse 13 00959 g007
Figure 8. Heat release rate under different hydrogen energy rate for burned zone and unburned zone with MAP = 207 kPa and excess air ratio = 1.4: (a) burned zone heat release rate during the combustion process; (b) unburned zone heat release rate during the combustion process.
Jmse 13 00959 g008
Figure 9. CA 0–10, CA 10–50, CA 50–90 in different HER with MAP = 207 kPa and excess air ratio = 1.4.
Jmse 13 00959 g009
Figure 10. Unburned zone species and turbulent flame speed under different hydrogen energy rate with MAP = 207 kPa and excess air ratio = 1.4: (a) evolution of CH2O and CO during the combustion process for unburned zone; (b) laminar flame speed.
Jmse 13 00959 g010
Figure 11. Engine parameters characteristic under different hydrogen energy rate with MAP = 59 kPa and excess air ratio = 1.4: (a) in-cylinder pressure; (b) unburned zone temperature; (c) heat release rate for burned and unburned zone; (d) evolution of total CH2O and CO during the combustion process.
Jmse 13 00959 g011
Figure 12. CA 0–10, CA 10–50, CA 50–90 in different HER with MAP = 59 kPa and excess air ratio = 1.4.
Jmse 13 00959 g012
Figure 13. Indicated efficiency and IMEP under different hydrogen energy rates with MAP = 59 kPa and excess air ratio = 1.4.
Jmse 13 00959 g013
Figure 14. Maximum unburned zone heat release rate for MAP = 59~207 kPa and HER = 0~50%.
Jmse 13 00959 g014
Table 1. Sub-models of simulation model.
ModelSub-ModelMethod or Proposed Scholar
Fractal turbulent combustion modelFlame front geometryIdeal cylinder
Laminar flame speedMethanol–hydrogen flame speed [32]
Flame wrinkling scaleProposed by Matthews [33]
Fractal dimensionProposed by Santavicca [34]
Early flame development and combustion completionEarly flame developmentProposed by F. Bozza [35]
Combustion completionProposed by F. Bozza [35]
Chemical reaction kineticsChemical reaction mechanismLi [36]
ReactorCantera IdealGasReactor
Wall heat transfer-Woschni
Table 2. Specifications of the experimental engine.
Engine TypeSI Engine, V-Type 8-Cylinder,
Turbo Charging, 4-Stroke
Rated Speed1500 r/min
Rated power320 kW
Bore128 mm
Stroke140 mm
Compression ratio12
Connecting rod length255 mm
Inlet valve opening/closure26.5 °CA BTDC/133.5 °CA BTDC
Exhaust valve opening/closure131 °CA ATDC/15 °CA ATDC
Fuel type 85 % wt .   C H 3 O H   +   15 % wt .   H 2 O
Table 3. Experimental conditions under 100%, 75%, 50%, and 25% load.
Load100%75%50%25%
Speed (r/min)1500150015001500
Torque (N·m)2040.071568.301019.64520.81
Power (kW)320.06246.07160.1181.74
Fuel flow rate (kg/h)140.8323110.267477.3388245.08454
Air flow rate (kg/h)1474.0421134.464787.1447.614
MAP (kPa)20716212075
Inlet air relative humidity (%)28.3429125.4702523.8476224.03501
Post-intercooler charge air temperature (°C)57.6153.2950.4350.35
Excess air coefficient1.431.421.421.40
Spark timing (°CA BTDC)11121217
Table 4. Model validation for IMEP under different operating conditions.
Operating Conditions 100% Load75% Load50% Load25% Load
Experimental IMEP2.057 MPa1.588 MPa1.151 MPa0.640 MPa
Calculation IMEP2.054 MPa1.588 MPa1.155 MPa0.637 MPa
Relative error0.18%0%0.37%0.36%
Table 5. Summary of model setup under high load and low load.
PowerSpeedMAPSpark AngleExcess Air RatioHER
100%1500 r/min207 kPa11 °CA BTDC1.40~30%
15%1500 r/min59 kPa15 °CA BTDC1.40~30%
Disclaimer/Publisher’s Note: The statements, opinions and data contained in all publications are solely those of the individual author(s) and contributor(s) and not of MDPI and/or the editor(s). MDPI and/or the editor(s) disclaim responsibility for any injury to people or property resulting from any ideas, methods, instructions or products referred to in the content.

