1. Introduction
The use of green energy in port ecosystems is crucial to reduce greenhouse gas emissions, improve air quality and reduce the environmental impact of ports, as in any other industry [
1]. The amount of water and air pollution is related to port activities and the types and quantities of energy used [
2,
3].
A basic understanding of current energy consumption, which allows ports to understand current energy consumption patterns, is usually based on habits, traditions and long-standing practices [
2,
3,
4]. Such knowledge of the types and quantities of energy consumed by ports is an important starting point for improving port activities and optimizing energy consumption and implementing new, more environmentally friendly types of energy [
1,
5].
An accurate assessment of the current port situation from an energy transformation perspective allows ports to identify the possibility of integrating renewable energy sources, such as solar, wind, or hydropower, into their activities, assessing the possibilities of installing renewable energy infrastructure [
6,
7].
By assessing current energy consumption and green energy opportunities, ports can conduct a cost–benefit analysis, evaluating the initial investment costs against the long-term savings from lower energy costs and potential government incentives or subsidies [
8]. A comprehensive assessment of current energy costs at a port provides data to assess the return on investment (ROI) of various green energy projects and can help prioritize which projects related to green transformation need to be implemented first. The assessment should ensure that ports comply with local, national and international environmental requirements, avoiding possible fines and penalties [
9]. The assessment of the current situation can also help ports initiate new or adjust existing legislation, stimulating more active application of green transformation implementation opportunities.
Ports can use an accurate assessment of the current situation, from a green transformation perspective, to align their green energy use with long-term strategic goals, such as becoming carbon neutral or enhancing port sustainability [
8,
10]. This process also helps engage stakeholders, including customers, investors and the community, by providing transparent data on energy use and environmental impacts, thereby supporting the port’s sustainability initiatives and improving its reputation among port customers and the public. An accurate assessment of the current situation helps manage risks by identifying vulnerabilities in current energy sources and developing strategies for diversifying energy supply, for example, by using renewable energy to reduce dependence on fossil fuels [
11]. It also helps ports improve their resilience to climate change, such as rising sea levels or extreme weather events, that may affect port operations [
12].
The development of green transformation methods and their application in port operations is important from the following points of view: the assessment process often reveals areas where innovative solutions can be applied, for example, using smart grids, energy storage systems or electric vehicles. Ports that use green energy can gain a competitive advantage by offering greener services to shipping companies and other stakeholders who prioritize sustainability [
13,
14]. In summary, it can be said that the application of green transformation in ports and an accurate assessment of the current situation are necessary to understand current practices, identify opportunities for improvement, ensure regulatory compliance, plan strategically, manage risks and increase innovation and competitiveness.
Small and medium-sized ports, i.e., serving up to 100,000 passengers and processing up to 2–5 million tons of cargo, often have limited human and financial capabilities to implement new technologies and at the same time have a significant environmental impact [
1,
6,
7,
13,
14].
The process of implementing green transformation in ports provides the basis for effective and sustainable green energy initiatives that can significantly reduce the environmental impact of port activities [
15]. At the same time, it should be noted that during the assessment, significant fluctuations in results are possible due to different qualifications of assessors, different understanding of similar phenomena in individual cases and other similar phenomena. In order for the assessments of different ports to be similar and correlated with each other, it is necessary to develop a filtering mechanism for data assessment, and it is also very important to have (use) a methodology for calculating pollutant emissions that can be easily applied in ports.
Thus, the aim of this article is to develop a methodology for assessing ports from a green transformation perspective, which would allow for an accurate assessment of the emissions generated in the port, taking into account the types and amounts of energy consumed. Having an accurate estimate of the amount and causes of pollutants generated in the port, it is necessary to develop scientifically based and practically acceptable green transformation methods, which would allow for identifying ways to reduce the amount of emissions. Due to the fact that port activities are quite individual and include a number of areas of activity (passenger service, cargo handling, accumulation and storage, etc.), it is very important to develop an assessment methodology that would allow not only assessing the amounts of generated pollutants but also comparing them with other ports. Since ports are unique and special, the methodology must be based on relative green transformation indicators, for example, the amount of pollutants generated per passenger served in the port and per tonne of cargo processed in the port.
Currently, ports are usually compared based on their turnover, area occupied, etc. However, ports are different, so comparing ports, especially from the perspective of green transformation, in absolute terms, is incorrect. The article presents a methodology for creating relative comparisons based on specific factors, which is more accurate and practically acceptable compared to existing port assessment methodologies.
The novelty and innovation of the work are associated with the development of a benchmark index methodology for the green transformation of ports and its application. The novelty of the benchmark index assessment methodology is based on the main factors of green transformation of ports; therefore, the benchmark index, a universal tool for assessing the implementation of green transformation of ports, is used. When calculating the benchmark index, the main factors can be taken into account, as well as additional factors, such as the level of technical services, the possibilities of providing ships with renewable energy and other factors.
The developed methodology allows ports to self-assess their compliance with existing national and international environmental requirements and to quickly adapt to new and changing requirements.
Based on the calculated emissions, a methodology for comparing ports has been developed based on conditional emission values per tonne of cargo handled at the port and per passenger served at the port.
The article includes an analysis of the literature and the current situation in ports, the creation of a mathematical model, the application of the created model to selected ports, a discussion and conclusions.
The developed methodology can be used to evaluate other transport means, adapting them to specific conditions.
2. Literature Review of Port Green Transformation and Possible Indicators of Port Green Transformation
In order to meet the conditions of the green transformation, ports must be oriented towards recognized standards and regulations and their strategy towards realistic goals, such as those described in the “Fit for 55” legislative package [
16], the United Nations Sustainable Development Goals (SDGs), which are set out in the annexes to the MARPOL-73 Convention, and other international requirements and recommendations [
17,
18]. Ports should focus on the types of energy used and planned that would reduce the impact on the environment [
19]. At the same time, the assessment is not always objective, therefore it is very important to develop a methodology for filtering assessment data, for example, the Kalman filter or other similar instruments [
20,
21], which would allow filtering existing and incoming data in order to objectively assess the obtained indicators and compare them between different ports.
Ports not only serve passengers and handle cargo but also perform a wide range of additional functions. These include shipbuilding and repair, tourism, freight forwarding, customs operations, port and ship agency services, logistics, pilotage, towing, and other related services [
22]. Some ports even have free economic zones.
When analysing the indicators of green port transformation and performing their qualitative assessment, it is first necessary to agree on the main indicators (factors). The main factors of green port transformation are as follows: level of port strategy; level of port management; level of port cargo handling (passenger service) operations (level of port activity); level of additional port services; and level of service activities of companies serving the port from the point of view of green transformation.
The port green transformation strategy is of particular importance; therefore, these are the main reasons that encourage ports to develop a green transformation strategy, which should take into account the following elements: the need to adapt to international and regional regulations; the need to adapt to national rules; energy savings in port operations; pressures arising from increasing public awareness; and new market challenges [
16,
17,
18]. The green transformation strategy includes the main goals and objectives for achieving the green transformation of the port, a strategy implementation program, and realistic plans for the necessary resources. The strategy assessment (in points) includes the justification of the indicated elements.
A port’s green transformation strategy is an important element, and most ports have such documents prepared to some extent; therefore. It is very important that these strategies are implemented. It is important to note that there must be a good understanding of the significance of green transformation and the necessity of its implementation at the port management level [
23].
At the port management level, the attitude towards green transformation is positive, but for various reasons, not all port managers actively implement the elements of green transformation, including being unaware of the real situation of their companies. Thus, the development of green transformation assessment methodologies that would allow assessing the real situation of ports from the perspective of green transformation and their help in identifying port opportunities and implementation prospects is of great importance.
The operational level of the ports covers the productive activities of the port, i.e., port cargo reception, storage, loading and unloading from/into ships, and other operations, such as passenger services.
Due to the large differences in the activities carried out by ports, especially small and medium-sized ones (in many cases, these are multifunctional ports), in order to identify differences in terms of green transformation, it is appropriate to use relative values, such as energy consumed and emissions generated per passenger served and per tonne of cargo processed [
10,
13,
24].
It is very important to define the main factors of the green transformation of ports as precisely as possible, so that they are understandable and easily applicable to port conditions. Based on the analysis of the literature and other sources [
24], the main factors of green transformation are as follows: the port’s green transformation strategy, i.e., a package of documents that must clearly define the goals and objectives of green transformation, including the use of green energy sources. Human and financial resources are required to achieve the goals and solve the tasks of green transformation, as well as the green transformation implementation program, i.e., port green transformation management is the availability of human resources and the readiness to implement green transformation, and the readiness and willingness of managers to realize the goals and objectives of green transformation, especially the implementation of new green energy sources in the port [
23,
24].
The adaptation of the port infrastructure to the goals and objectives of green transformation entail the possibilities of using green energy, i.e., have their own wind and solar power plants or the ability to connect to them, technical capabilities to apply green energy, for example, new types of fuel (LNG, methanol, ammonium and hydrogen fuel), and the ability to connect other users’ vehicles, usually ships, to green energy sources [
25]. Preparation of the port superstructure for green transformation entails carrying out passenger service and cargo loading operations using green energy (passenger service and loading equipment using green energy). Additional services provided by external port participants involve participants serving or participating in port activities as follows: sea and inland waterway vessels, rail and road transport, importing and exporting passengers and cargo to/from the port, and orientation towards the goals of green transformation [
25,
26,
27]. Identification of indicators for the assessment of the green transformation of ports could be described as follows: existing or planned approved green transformation strategy of the port; understanding and willingness of the port management level to implement the green transformation; planning and implementation of the green transformation at the operational level; additional operations performed at the port; and orientation of companies serving the port towards the principles of green transformation [
28,
29].
When assessing the situation and potential of green transformation in ports, it is very important to use a clear and understandable assessment system. Various assessment systems can be found in the literature [
30,
31], but given the great diversity, which is typical of ports due to their different complexity, it is important to have a well-understood assessment system for ports.
The green transformation of ports is important for states, ports and port terminals, and it depends on the contribution of all key participants to this process. State institutions are responsible for the preparation of the legal framework and its implementation and control; port administrations are responsible for the optimal preparation of infrastructure and ensuring shipping safety and the implementation of environmental protection processes; and port terminals must guarantee the optimal acquisition and use of the port superstructure. The work of all participants in the process and a positive attitude towards the processes carried out in the port and their implementation are the basis for the implementation of green transformation in the port.
Existing methods for assessing the green transformation of ports focus on port activities as a whole, while ports differ significantly in their types of activities and capacities, and the equipment and technologies used [
1,
4,
6,
19,
23]. This article presents a methodology developed using a factor comparative index and relative emission parameters, which allow for an objective comparison of the green transformation situation of ports, identifying weak points and applying good port practices for the implementation of green transformation elements in a specific port.
The proposed factors (indicators) and their evaluation will allow an objective assessment of the port’s situation from the perspective of green transformation and find optimal ways to achieve the implementation and performance of the port’s green transformation while reducing the impact on the environment.
3. Port Green Transformation Data Filtering and Green Transformation Element Assessments
To assess the situation and opportunities of green transformation, it is appropriate to develop a methodology that would first assess the current green transformation situation and identify possible and optimal ways to achieve the goals of green transformation. Such a methodology should include processing of green transformation statistical data, assessment of the green transformation situation and environmental impact (emissions).
A score or ratio system may be adopted for the evaluation of a port’s green transformation. In connection with the fact that the dispersion of the assessment can be very large, it is appropriate to adopt a five-point system [
3,
24,
30,
32]: one point—nothing has really been achieved, but there are only wishes and obligations set by the international agents and the administration of a specific country regarding green transformation; two points—the primary elements of green transformation are actually implemented, but their influence is insignificant; three points—the primary and separate elements of advanced green transformation are implemented and have an impact on port activities, reducing the impact on the environment; four points—all the necessary legal documents necessary for green transformation are present, and most of them are implemented and have a significant impact on reducing the impact on the environment; and five points—all necessary legal documents for green transformation are present, and all necessary measures are implemented and the port has a minimal impact on the environment.
The Kalman filter or maximal distribution methods [
20,
21] can be used to filter the green transformation current situation analysis data set, or, when the data set is not infinitely large, it is possible to limit oneself to a simpler method, i.e., the variance (dispersion) method [
33].
The dispersion method can be used for statistical data filtering, with the help of which a band of data deviations (errors) is obtained, and the obtained statistical data can be further filtered. The band of the variance can be calculated using the following formula [
33]:
where
denotes dispersion or density of the statistical data;
denotes quantity of statistical data;
denotes statistical data of the concrete respondent’s (port) (
is thenumber of statistical data); and
denotes the average statistical data, which can be calculated as follows:
The size of the error bar can be calculated as follows:
In this way, the deviation bar could be received as follows:
Using Formulas (1)–(4), the probability of the green transformation results obtained is 63–68%, which is acceptable for this type of data. In this way, all the main directions of green transformation should be assessed and finally, using a comparative method, the entire situation of the port can be assessed and compared with other ports.
The statistical data obtained during the research, processed using dispersion [
33] or other possible statistical data processing methods, allow us to assess the possible limits of deviations from the average values and thereby assess the quality of the obtained data. In the event that the data deviation is greater than 20% from the average value, it is appropriate to filter the statistical data, for example, using the Kalman filter [
20], or not to evaluate them. The port green transformation factors, their descriptions and applicability conditions in ports of various sizes are presented in
Table 1.
A mathematical benchmark model was developed to assess key factors influencing a port’s green transformation. These include the port’s strategic direction, the readiness and awareness of management, the preparedness of infrastructure, the suitability of passenger service and cargo handling equipment, the engagement of partners and customers in applying green transformation principles, and other relevant aspects, such as the potential for regulatory restrictions. The overall concept of green transformation performance based on these factors can be expressed by the following formula:
where
denotes the correlation coefficient;
denotes the port’s green transformation strategy;
denotes port management readiness to implement green transformation tasks;
denotes port infrastructure related to green transformation;
denotes terminal equipment (superstructure) related to green transformation tasks;
denotes additional services provided by external port participants readiness to follow green transformation tasks;
,
,
,
,
are ideal (best) ports green transformation factors; and
,
,
,
,
are factor weight coefficients.
To assess the factor weighting coefficients, over 50 ports were surveyed and audited for digitalization and green shipping [
34]. Based on the survey results, ports were grouped into small, medium and large and their potential in terms of key green transformation factors was assessed.
The weighting coefficients of the main factors can be calculated using the matrix method if there is a large database, or expert methods can be used [
32]. Expert evaluations were processed with the dispersion method [
33] and, as an example, adopted as follows: the port’s green transformation strategy was 15–20% (because it is pressured by EU and government regulations); the attitude of the port management bodies to green transformation and opportunities was 20–25% (because it largely depends on the mentality of the managers); the development, application and use of port infrastructure related to green transformation was 15–20% (this depends on the port’s capacities and actions); additional port activities, such as cargo handling and passenger service activities, focused on achieving green transformation results was 15–20% (this depends on the types of equipment used and terminal equipment); and additional services provided by external port participants, such as road transport, railways and water transport, linked to port activities, the pursuit of green transformation was 10–15% (depends little on the port and mainly on International Maritime Organization (IMO), EU (regional) and government regulations and strategies).
The green transformation benchmark index allows not only to assess the level of green transformation implementation in a specific port, but also to compare different ports in terms of green transformation implementation. To assess the level of green transformation implementation in ports, it is appropriate to create an assessment mechanism that would allow a clearer and more accurate assessment of the real green transformation situation in ports and make it easier to predict the “weak” areas of ports in terms of green transformation and to look for specific actions to implement green transformation in ports.
To develop an effective green transformation mechanism, it is essential to identify distinct port sectors where green transformation goals can be pursued either individually or in combination. For the purpose of benchmarking ports and setting clear transformation objectives, it is appropriate to categorize ports into the following sectors: the presence of a green transformation strategy and its alignment with the
Fit for 55 legislative package [
16] and regional or national regulatory requirements (for example, those of the EU and national administrations); the readiness and commitment of port managers and specialists to implement green transformation initiatives; the condition of port infrastructure and its suitability for achieving transformation objectives; the technology and equipment used for cargo handling and/or passenger services, assessed from a green transformation perspective; and the attitude and practices of port users, such as maritime, road, rail, and inland waterway transport companies, with respect to green transformation principles.
The green transformation mechanism is important for ports in order to assess the current situation or conduct an independent audit and find optimal green transformation methods to achieve minimal environmental impact. As an example, one of the ports is analysed, the data of which are as follows: the port has a developed strategy, which is rated five points. The port transformation strategy includes the main goals and objectives for achieving the green transformation of the port, a strategy implementation program, and realistic plans for the necessary resources.
Port managers and specialists are interested in implementing green transformation and have the necessary competencies, but they have limited financial and human resources for the implementation of green transformation. This factor is rated three points. Port management, from a green transformation perspective, includes general and special education and practical work experience of port management level personnel, knowledge of the importance of green transformation and implementation methods, and port activity compatibility options.
The port infrastructure is partially prepared and operating from the perspective of the green transformation, rated three points. The port infrastructure from the perspective of green transformation includes planned and actual opportunities to use renewable and more environmentally friendly energy sources, plans and real opportunities for connecting to external more friendly energy sources.
The vast majority of port facilities use oil fuel, and due to limited financial capabilities, its replacement is unlikely, at least in the next few years, rated two points from the perspective of the green transformation. The green transformation of equipment used in port operations includes planning and actual use of green energy from alternative energy sources, plans and real possibilities for upgrading equipment to more environmentally friendly ones.
The port’s customer road transport mainly uses petroleum fuel, railway transport is electrified, arriving ships use petroleum fuel, and ships moored at the port’s quays cannot connect to the shore power grid (there is no technical possibility), which are rated three points from the perspective of green transformation. The green transformation of road, rail and inland waterway transport used by port users includes the planning and actual use of green energy from renewable energy sources and more environmentally friendly energy sources, as well as plans and real possibilities to upgrade vehicles to make them more environmentally friendly.
A graphical representation of the green transformation mechanism is shown in
Figure 1. In the green transformation mechanism sectors, it means that the port has a prepared green transformation strategy (sector 1); 2, that port managers and specialists are well aware of and understand the methods and possibilities of implementing green transformation; 3, the port infrastructure is prepared and meets the goals and requirements (recommendations) of green transformation; 4, the port’s passenger service and/or loading equipment meets the requirements (recommendations) of green transformation; and 5, port customers and partners meet the requirements (recommendations) of green transformation.
Summarizing the port’s green transformation situation and the assessments and weighting coefficients of each factor indicated in the example above, the overall port indicator in the analysed sample is 3.2 out of a possible 5.0.
Having a green transformation mechanism in place, a port can more easily navigate how to achieve better green transformation results and, depending on available resources and capabilities and what methods and approaches can be used to achieve minimal environmental impact.
The ultimate goal of the green transformation mechanism is to quantify the environmental impact of each sector and the port as a whole. The specified goal can be assessed in terms of the amount of emissions of the port, calculating, for example, the amount of emissions generated per tonne of cargo handled or per passenger served. It is necessary to develop a methodology that would allow assessing the amount of emissions of the port and emissions per conditional unit, depending on the amount of energy (fuel) consumed and the power and operating time of the mechanisms [
6,
7,
8,
23].
To reduce energy consumption and emissions from shipping activities, it is essential to clearly understand the operational processes of ships and the sources of emissions. These sources include not only the ships themselves but also transport vehicles and port equipment used in logistics operations. It is also important to evaluate the suitability of different fuel types for various types of machinery, apply principles of holistic port and terminal design, and recognize the importance of highly qualified port personnel and ship crews.
In many companies, including ports and port terminals, the use of modern technologies enables accurate recording of fuel and energy consumption, as well as equipment and machinery operating hours (motor hours). With this data—covering energy use, equipment capacity, and actual operating time—it becomes possible to calculate the emissions generated by specific equipment and mechanisms. This allows for the assessment of the green transformation status within individual sectors, specific terminals, and the port as a whole. Moreover, such data facilitate the identification of opportunities for improvement and enables comparative analysis of green transformation progress across different ports.
Ships, like other machines and mechanisms, must be supplied with energy to operate, i.e., any fuel (petrol, diesel, natural gas, coal, etc.) or other forms of energy (wind, solar, etc.). Modern engines are complex and use relatively little fuel. It should be noted that there are average values according to which it is possible to determine how much fuel any engine consumes to generate the required power. For internal combustion engines (petrol and diesel), the following indicative reference values can be accepted: for low-power engines (up to 1000 kW), the relative fuel consumption is from 0.2 to 0.3 kg/kWh, and for high-power engines, especially engines of large ships, the relative fuel consumption is from 0.15 to 0.25 kg/kWh [
35,
36,
37]. The relative fuel consumption of a specific engine is indicated in the engine manufacturer’s specification, but most often it falls within the limits indicated above.
The power used by ships and port equipment and mechanisms in ports is in many cases lower than the nominal; therefore, having the nominal engine power and relative fuel consumption and the actual amount of fuel consumed and the working time (engine hours), the actual average engine power and other request parameters can be calculated using the following relationship [
38,
39]:
where
N denotes average engine power, kW;
denotes fuel consumption over time
t, kg;
denotes relative fuel consumption, kg/kWh; and
t is engine working time in hours.
Having the average engine power and fuel consumption and the engine operating time in hours, the relative engine fuel consumption can be calculated as follows:
Due to the fact that the engines of ships are quite powerful, ships consume significant amounts of fuel. Ships use much fuel while sailing and somewhat less when moored in ports or anchorages, i.e., in the approaches to ports. The amount of fuel consumed by an engine is often calculated per day or over another period. In general, fuel consumption (
) can be calculated as follows:
where
denotes the total average power of the main and auxiliary engines at the time
.
Having information on the fuel consumption and operating time (engine hours) of ships and port (terminal) machinery and mechanisms, as well as relative fuel consumption, it is possible to calculate the average power of machines and mechanisms.
The amount of pollutants emitted from ships and other vehicles directly depends on the quantity and quality of fuel used and the power used and the operating time (engine hours). The main emissions from ships and port terminals or ports are carbon dioxide (), nitrogen oxides (), carbon monoxide (), sulphur oxides () and particulate matter ().
Carbon dioxide and sulphur oxide emissions depend on the amount and quality of fuel used and can be calculated as follows:
where
is the carbon dioxide coefficient, which depends on fuel quality (for the high-quality diesel fuel (DF) coefficient, which is between 3.0 and 3.2 and for the LNG (liquefied natural gas) fuel coefficient, which is between 2.5 and 2.9);
is the sulphur oxide coefficient, which depends on the fuel quality (sulphur percentage in fuel), and for
in control areas it is 0.001 for diesel fuel [
40,
41] and 0.0 for the LNG fuel; and
is the quantity of fuel during, for example, ship sailing, which can be estimated as follows:
where
is the coefficient, which depends on the type of engine [
40,
41];
is the relative consumption of fuel for the definite engine (kg/kWh); and
is the ship’s engine’s average power during the time period (kW), which can be calculated using the following equation:
where
is the instantaneous engine power (kW); and
is the engine working time.
Emissions of nitrogen oxides, carbon monoxide and particulate matter depend on the actual engine power, fuel type and quality, and operating time and can be assessed as follows:
where
is the carbon monoxide coefficient, which depends on fuel quality and engine condition. For high-quality diesel fuel and modern engines, it varies between 0.005 kg/kWh for diesel fuel and 0.003 kg/kWh for LNG fuel [
42,
43,
44].
is the nitrogen oxides coefficient, which also depends on fuel quality and the engine state; for the high-quality diesel fuel and modern engines it is in the range of 0.008–0.0012 kg/kWh for diesel oil and 0.003–0.004 kg/kWh for LNG fuel [
42,
43,
44].
is the particulate matter coefficient, which depends on fuel quality and the engine; for high-quality diesel fuel and modern engines it varies between 0.0005 and 0.0006 kg/kWh for diesel oil and about 0.0001 kg/kWh for LNG fuel [
42,
43,
44].
Depending on the engine power, the values of
,
and
emission generation coefficients corresponding to the EURO standard, for example, for the ships’ engines are presented in
Table 2 [
42,
44]. For port equipment and other machinery engines, emission calculations can be based on data from [
45,
46] or other sources, depending on the purpose, power, and year of manufacture and manufacturer of the engines.
The dependence of
,
and
emission generation coefficients, depending on the type of fuel for the ships and port equipment, as an example, is presented in
Table 3 [
42,
44,
45].
After assessing the conditions for the main emissions, a methodology for assessing the resulting emissions was developed, and with its help, it is possible to calculate the emissions of machines and equipment.
The obtained total emissions of the port (terminal), including ships entering the port, allow determining the relative emissions and comparing them with the processed cargo volumes and the number of passengers served, as follows:
where
denotes the total amount (tons) of a specific type of emission generated in a port per unit of time, for example, per year; and
denotes the total amount of cargo (tons) handled by the port (terminal) or the number of people served per unit of time, such as a year, which can be calculated (for example
emissions) as follows:
where
denotes total amount of
emissions generated by ships arriving at the port (terminal), for example, per year;
denotes amount of
emissions generated by vehicles arriving at the port (terminal) (railway locomotives, road transport, etc.), for example, per year; and
denotes amount of
emissions generated by terminal equipment and mechanisms, for example, per year.
In order to assess the green transformation situation in a port, it is necessary to compare the relative emissions generated by ports, as it is quite difficult to create equal conditions in all or several ports. For comparison, the situation can be calculated using a benchmark index as follows:
where
denotes total or specific emissions generated by the each separate port; and
denotes total or specific emissions of the least generated port.
The comparative index is important, but at the same time, what should be considered are the ideal factors and ultimately, an ideal port. When assessing the standards and recommendations related to the reduction of environmental impact, for example, those specified in [
16,
17,
18,
19] and other sources, it can be stated that the ideal port in terms of environmental impact would be a port that fully complies with environmental impact standards, uses renewable energy sources in most cases. The ships calling at the port and the vehicles entering are equipped with power plants of the highest available standard and that use environmentally friendly fuels.
The main conditions and the main parameters necessary to assess the implementation of the green transformation in the port per unit of time, for example per day, per month, and per year (the optimal period is a year, since annual reports are provided in many countries), are as follows: it is necessary to assess the current situation of a specific port (terminal) from the point of view of green transformation; it is necessary to determine what types of energy are used by specific port (terminal); it is necessary to assess the equipment and mechanisms available and used by a specific port (terminal); it is necessary to have accurate data on the amount of fuel consumed by each device or mechanism; it is necessary to have accurate data on the working time of equipment and mechanisms (motor hours); it is necessary to have accurate data on the type of fuel used by each mechanism and equipment; it is necessary to have accurate amounts of electricity consumption and electricity production information, how much electricity was used (thermal power plant, wind, solar, etc.); it is necessary to have information on the number of passengers served; and it is necessary to have information on how much cargo has been processed. Based on the information available in this way, using the methodology presented in this section, it is possible to accurately estimate the amount of emissions generated per unit of time, and the amount of emissions per passenger served and/or per tonne of cargo processed, for example.
The developed port green transformation method provides for the first collection of statistical data on the measures implemented in the port for the implementation of the port’s green transformation, taking into account the main factors (strategy, management level, infrastructure, operation, port partners’ situation). After collecting statistical data, they are processed by variance [
33] or other methods [
20,
21], and the reliability of the data is assessed. In the event that the data are reliable, the situation of individual factors of the port is assessed using a scoring system, and directions (factors) that need to be developed are determined. After collecting data on the equipment used in the port and its level of use (engine hours), types and costs of energy used and port productivity (the amount of passengers served and cargo processed, for example, per year), emissions generated in the port and their absolute and relative values are calculated.
In this way, the green transformation methodology allows carrying out the port green transformation and assessing the current situation, determining which of the green transformation factors are underdeveloped and, on that basis, looking for ways to achieve the best green transformation effect.
4. Case Study of the Ports’ Green Transformation
To assess the green transformation situation of ports and multifunctional terminals, the level of implementation of green transformation in several ports and a comparison between ports were carried out. Multifunctional, relatively small ports were adopted for the assessment of green transformation of ports, which receive ships up to PANAMAX size type and which use various port handling equipment.
For the assessment of green transformation and a comparison of ports from the perspective of green transformation, several conditional ports were selected, where loading operations and other shipping-related activities are carried out. To assess the accuracy of the methodology presented in
Section 3 and to verify it, ports with similar operating conditions were selected. Seaports are important to many countries around the world, and the activities carried out in them affect the overall environmental impact; therefore, reducing their environmental impact and increasing the use of green energy are very important. The best way to assess the environmental impact of ports is the relative emissions per unit of port work output, i.e., per unit of cargo processed in the port or per passenger served.
Estimating the emissions generated by ports is very important in order to have reference points and at the same time see positive shifts on the basis of green transformation. For that purpose, it is very important to preliminarily assess not only the current situation, but also to clearly see changes and opportunities to compare ports with each other after the introduction and use of new types of energy based on green transformation.
Ports carry out different activities and have different performances, so the relative comparative results of the environmental impact depending on performance are very important. The methods presented in this article, which allow estimating the emissions generated by ports as a whole and the relative emissions that are generated by ports for each factor (according to the green transformation methodology) per unit of activity (per unit of processed cargo or passenger served), are a real stimulus for the introduction of new green technologies and new types of fuel, to minimize the impact on the environment.
Ports’ environmental impact assessment based on emission generation and their assessment is possible using the methodology in
Section 3 of this article, after submitting the amount of fuel consumed by ships, entering the port and the port equipment, mechanisms and working hours. By changing the types of fuel used by ships, port mechanisms, and equipment, it is possible to estimate the change in emissions generated.
The main conditions and parameters for the application of green energy transformation in ports are based on the possibilities of developing their own or join the green energy production capacities being developed by countries (solar energy fields, wind farms, hydropower development, etc.) in accordance with the legal framework of a specific country and the financial and technical capabilities of each port, as well as the available human resources (specialists).
As an example, from more than 50 analysed ports [
34], four similar multifunctional ports and their main parameters, where passengers are served and cargo is processed, were selected. For the case study, multifunctional ports (with passenger service and cargo processing terminals) were selected, with similar passenger service and cargo processing volumes, technologies and navigational conditions (port entrances and internal navigation channels). The data on the main green transformation factors of the selected ports and the assessment of the best, from the point of view of green transformation, as a benchmark, using the methodology presented in
Section 3, are presented in
Table 4.
The results obtained for the four analysed ports showed that the green transformation rating of the selected ports is between 2.85 and 3.85 points (using a five-point system).
The main activities of the ports selected for the analysis are similar, meaning that the ports process cargo and serve passengers. The ports receive cargo and passenger ships from the sea, and cargo is transported to and from the port by trains (about 30% of all cargo) and by road (about 70% of all cargo). Ports use various equipment and machines to load cargo and use electricity to perform various operations. Key port and transport data related to green transformation include the following:
- -
annual passenger and cargo handling turnover of the port per year;
- -
average number of incoming ships in port and their average deadweight (DWT);
- -
sailing time of ships in the port channels and water area and time of berthing at the quay for passenger service and cargo loading;
- -
average power of ships’ power plants during sailing in the port channels and water area and while berthing at the quay;
- -
number of trains entering the ports per year, their time in the ports and average of locomotive power plants;
- -
number of road transport units (lorries and trucks) per year, their time in the port and average engine power;
- -
number of port equipment, their average engine power, and number of operating hours per year.
- -
The amount of electricity consumed per year and other parameters are presented in
Table 5.
Ports use ships of similar deadweight, ships enter and leave ports in similar times, i.e., from 4 to 6 h, and the presence of trains (locomotives) and road transport (tractors) in the port is similar, amounting to from 2 to 4 h.
Ships, trains, road transport and port equipment and machines use mainly diesel fuel and electricity. The average relative engine fuel consumption are as follows: ships—0.20 kg/kWh; train locomotives—0.25 kg/kWh; road transport (trucks)—0.25 kg/kWh; and port equipment—0.30 kg/kWh. Electricity is generated by natural gas, and average relative gas consumption is about 0.15 kg/kWh. The selected ports main data for green transformation are presented in
Table 6.
The emissions from passenger services in the port are calculated only from ships. The colorimetric value of LNG fuel is about 15% higher than that of diesel fuel.
The total amounts of
and
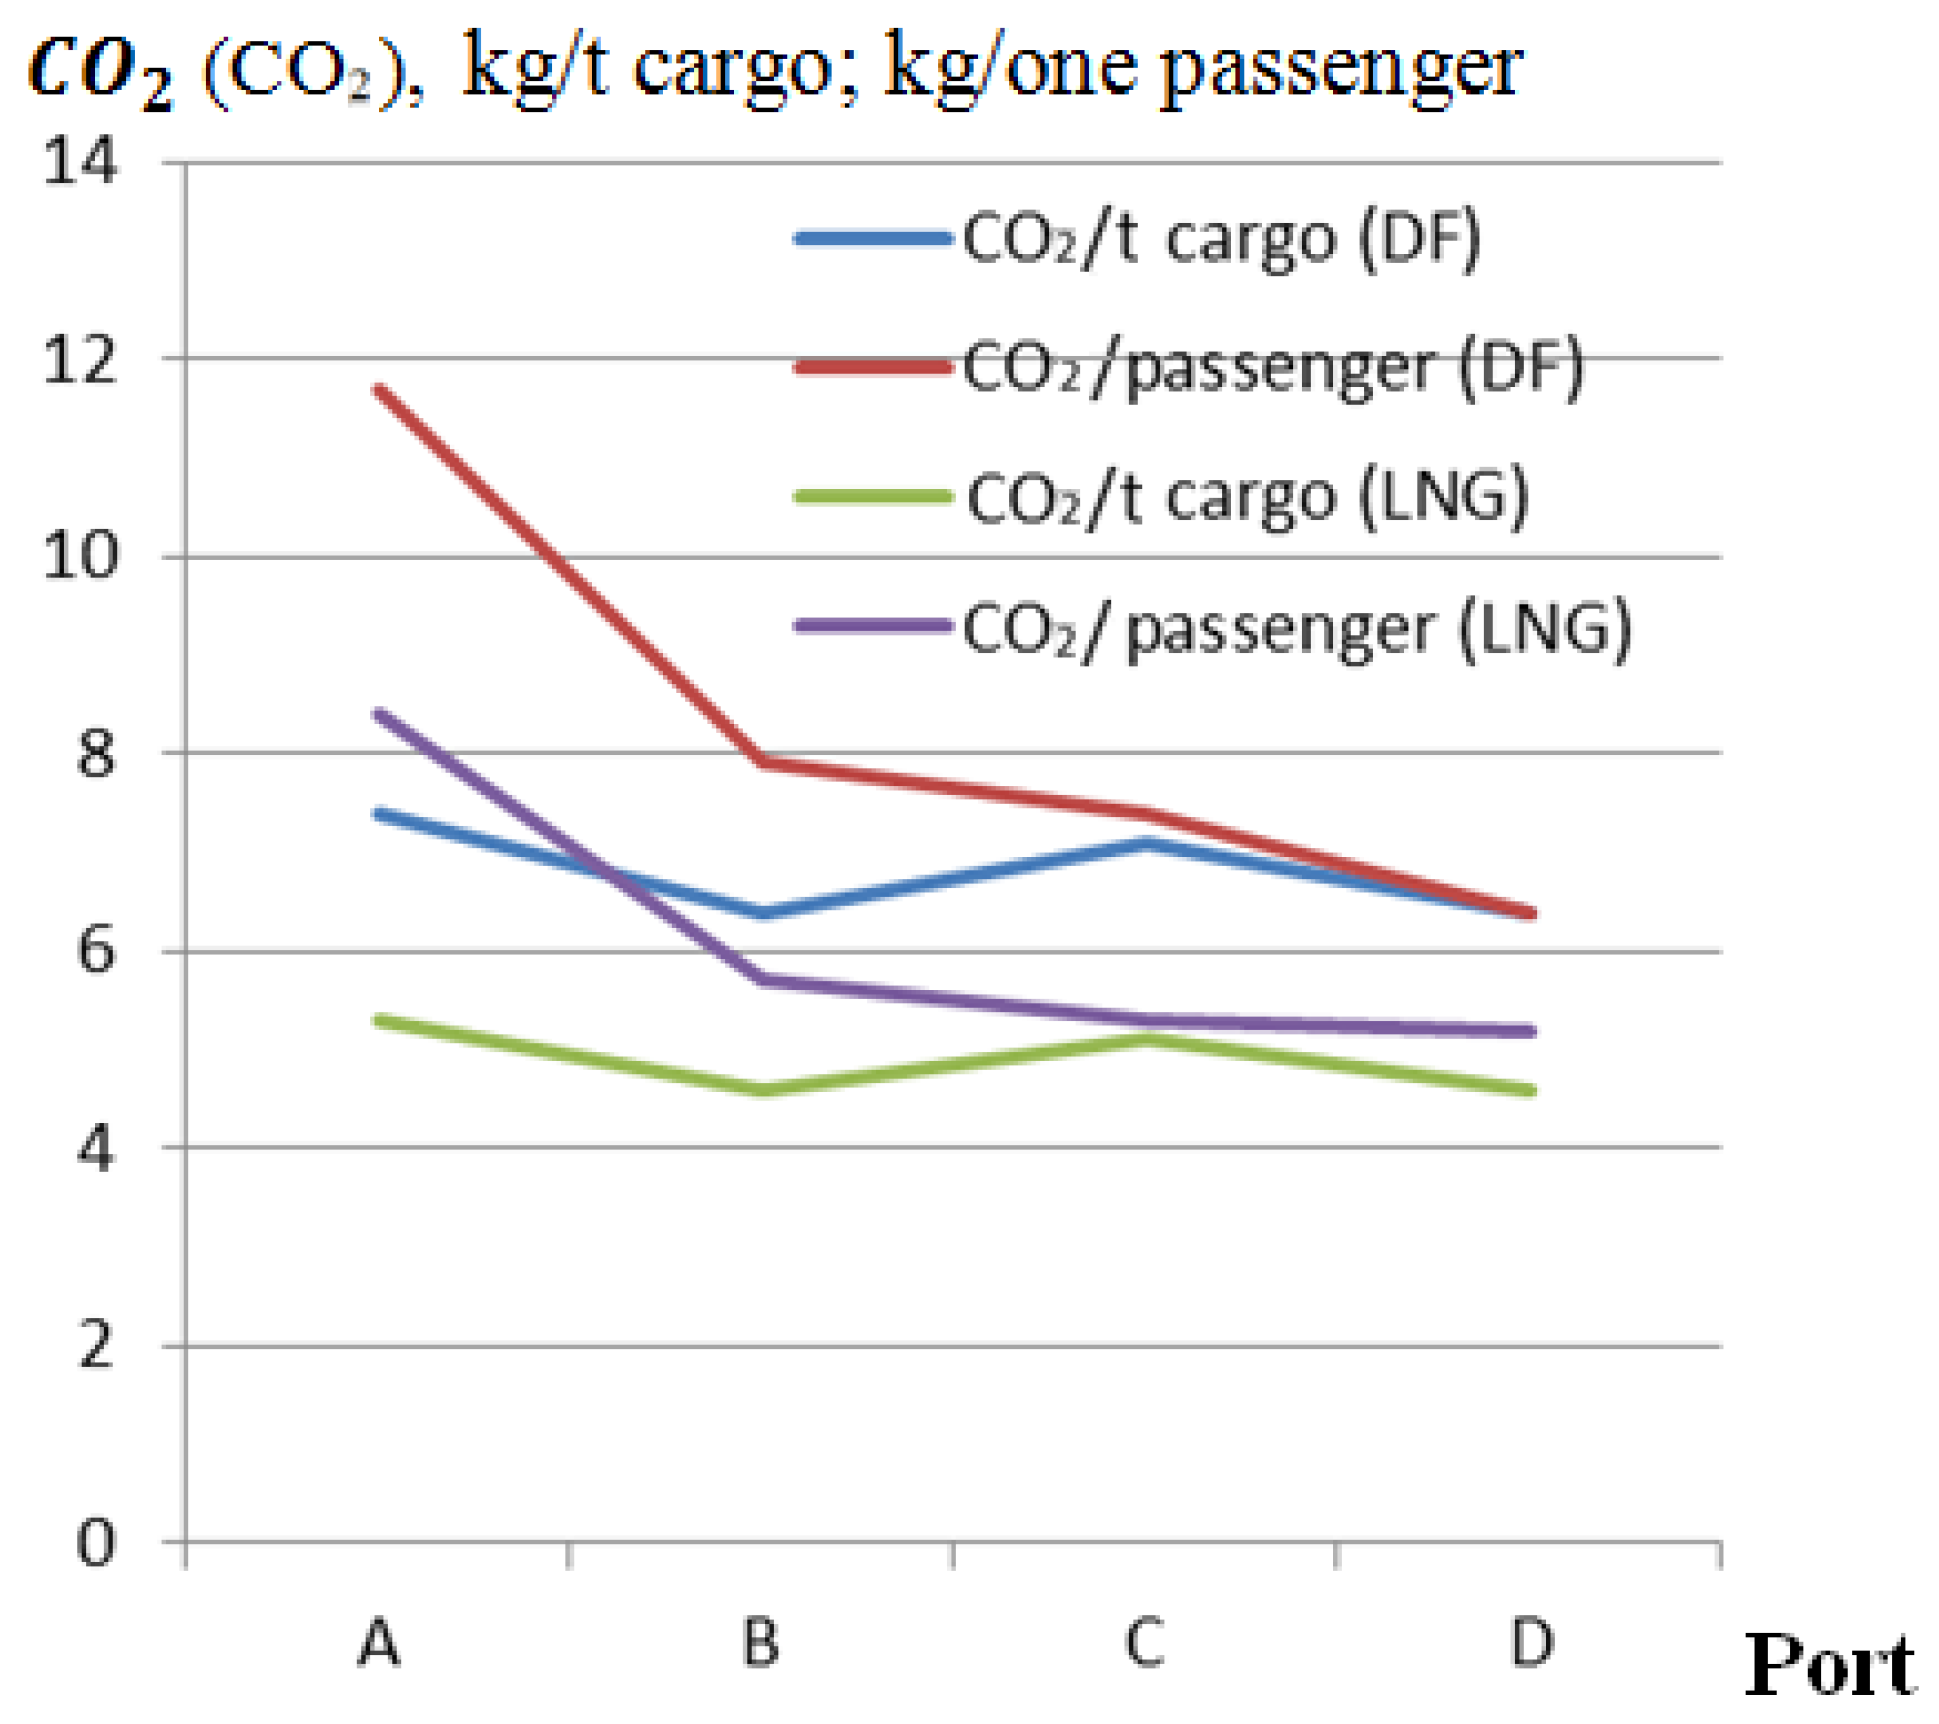
emissions generated in ports are important, but they do not fully reveal the similarities or differences in the environmental impact of ports. In order to be able to compare the similarities in the environmental impact of ports, it is appropriate to use relative emission values, for example, the amounts of emissions generated per tonne of cargo handled in the port and per passenger served. This can better and more clearly show the correlation between the level of transformation implemented and the relative emissions generated (per tonne of cargo handled and per passenger served). For the selected ports, the relative amounts of
and
emissions, which depend on the amount and quality of fuel consumed, per tonne of cargo handled in the port and per passenger served in the port, are presented in
Figure 2 and
Figure 3.
Reducing the amount of emissions generated in ports is possible in several ways, i.e., by using new fuels, such as LNG (in the transition period), methanol, ammonia fuels, and in the future hydrogen, and by maximally electrifying port equipment, especially when using “green” electricity, i.e., from renewable energy sources.
Reducing the amount of emissions generated in ports is possible by using fuels that do not contain sulphur components, i.e., LNG and other more environmentally friendly fuels, and, analogously, to reducing emissions by maximally electrifying port equipment and processes with minimal or no use of fossil fuels.
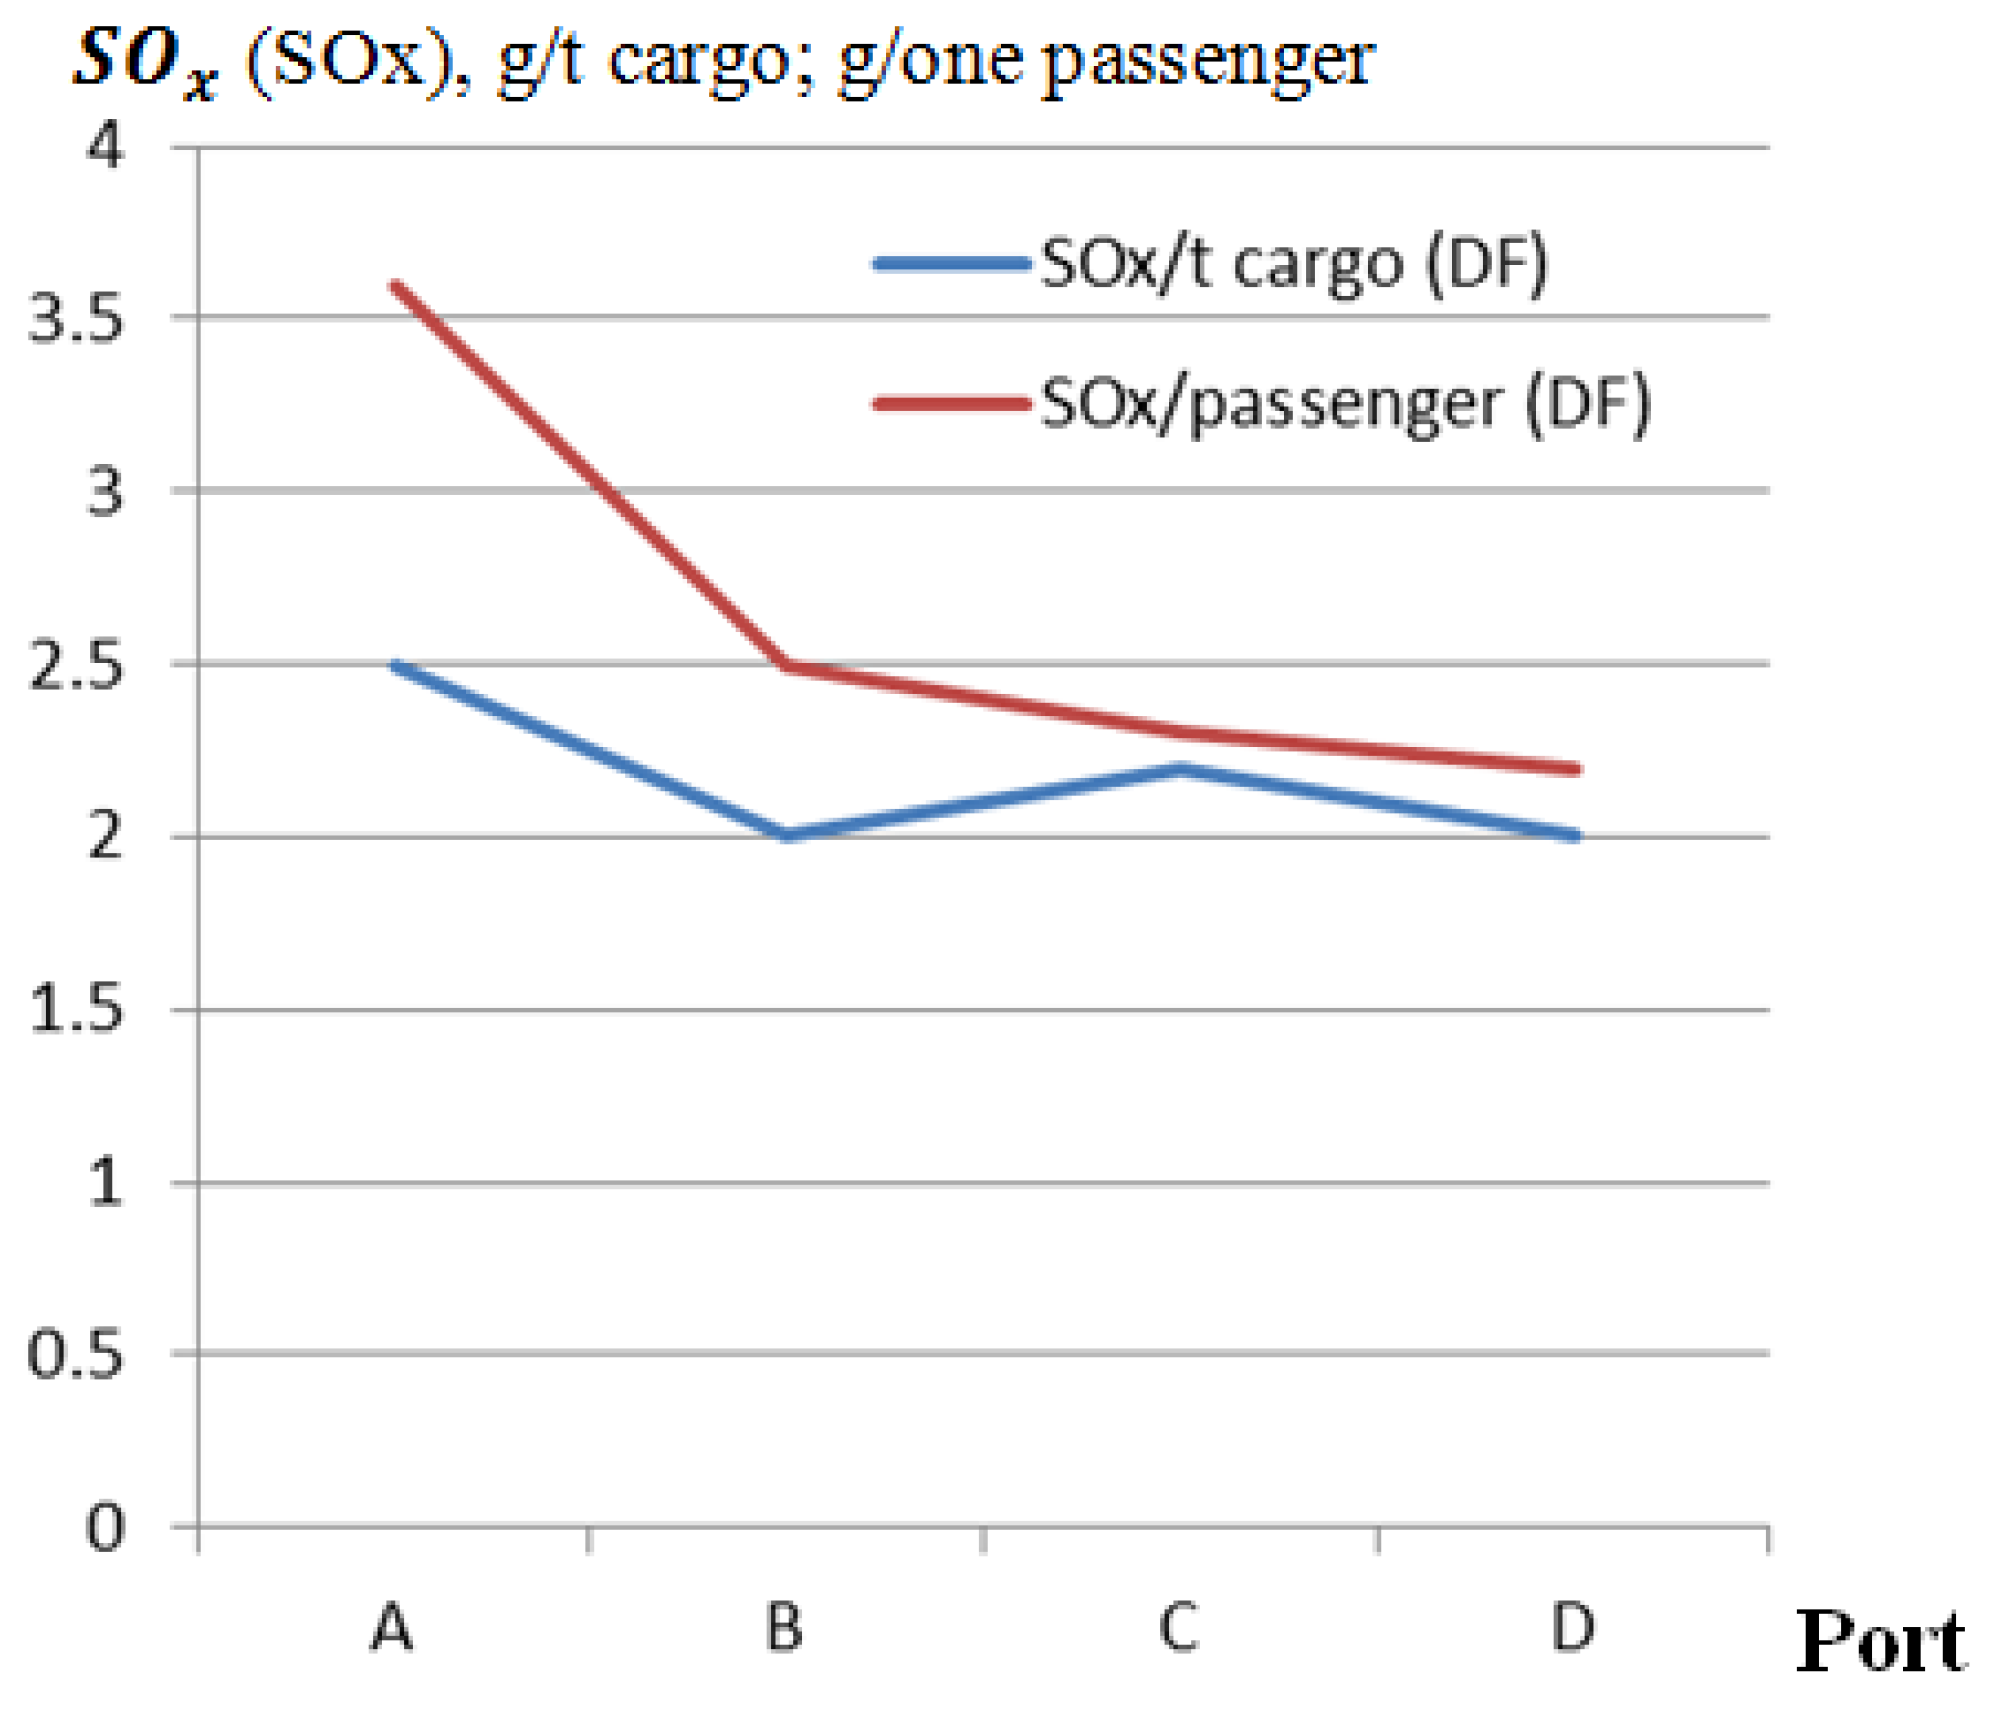
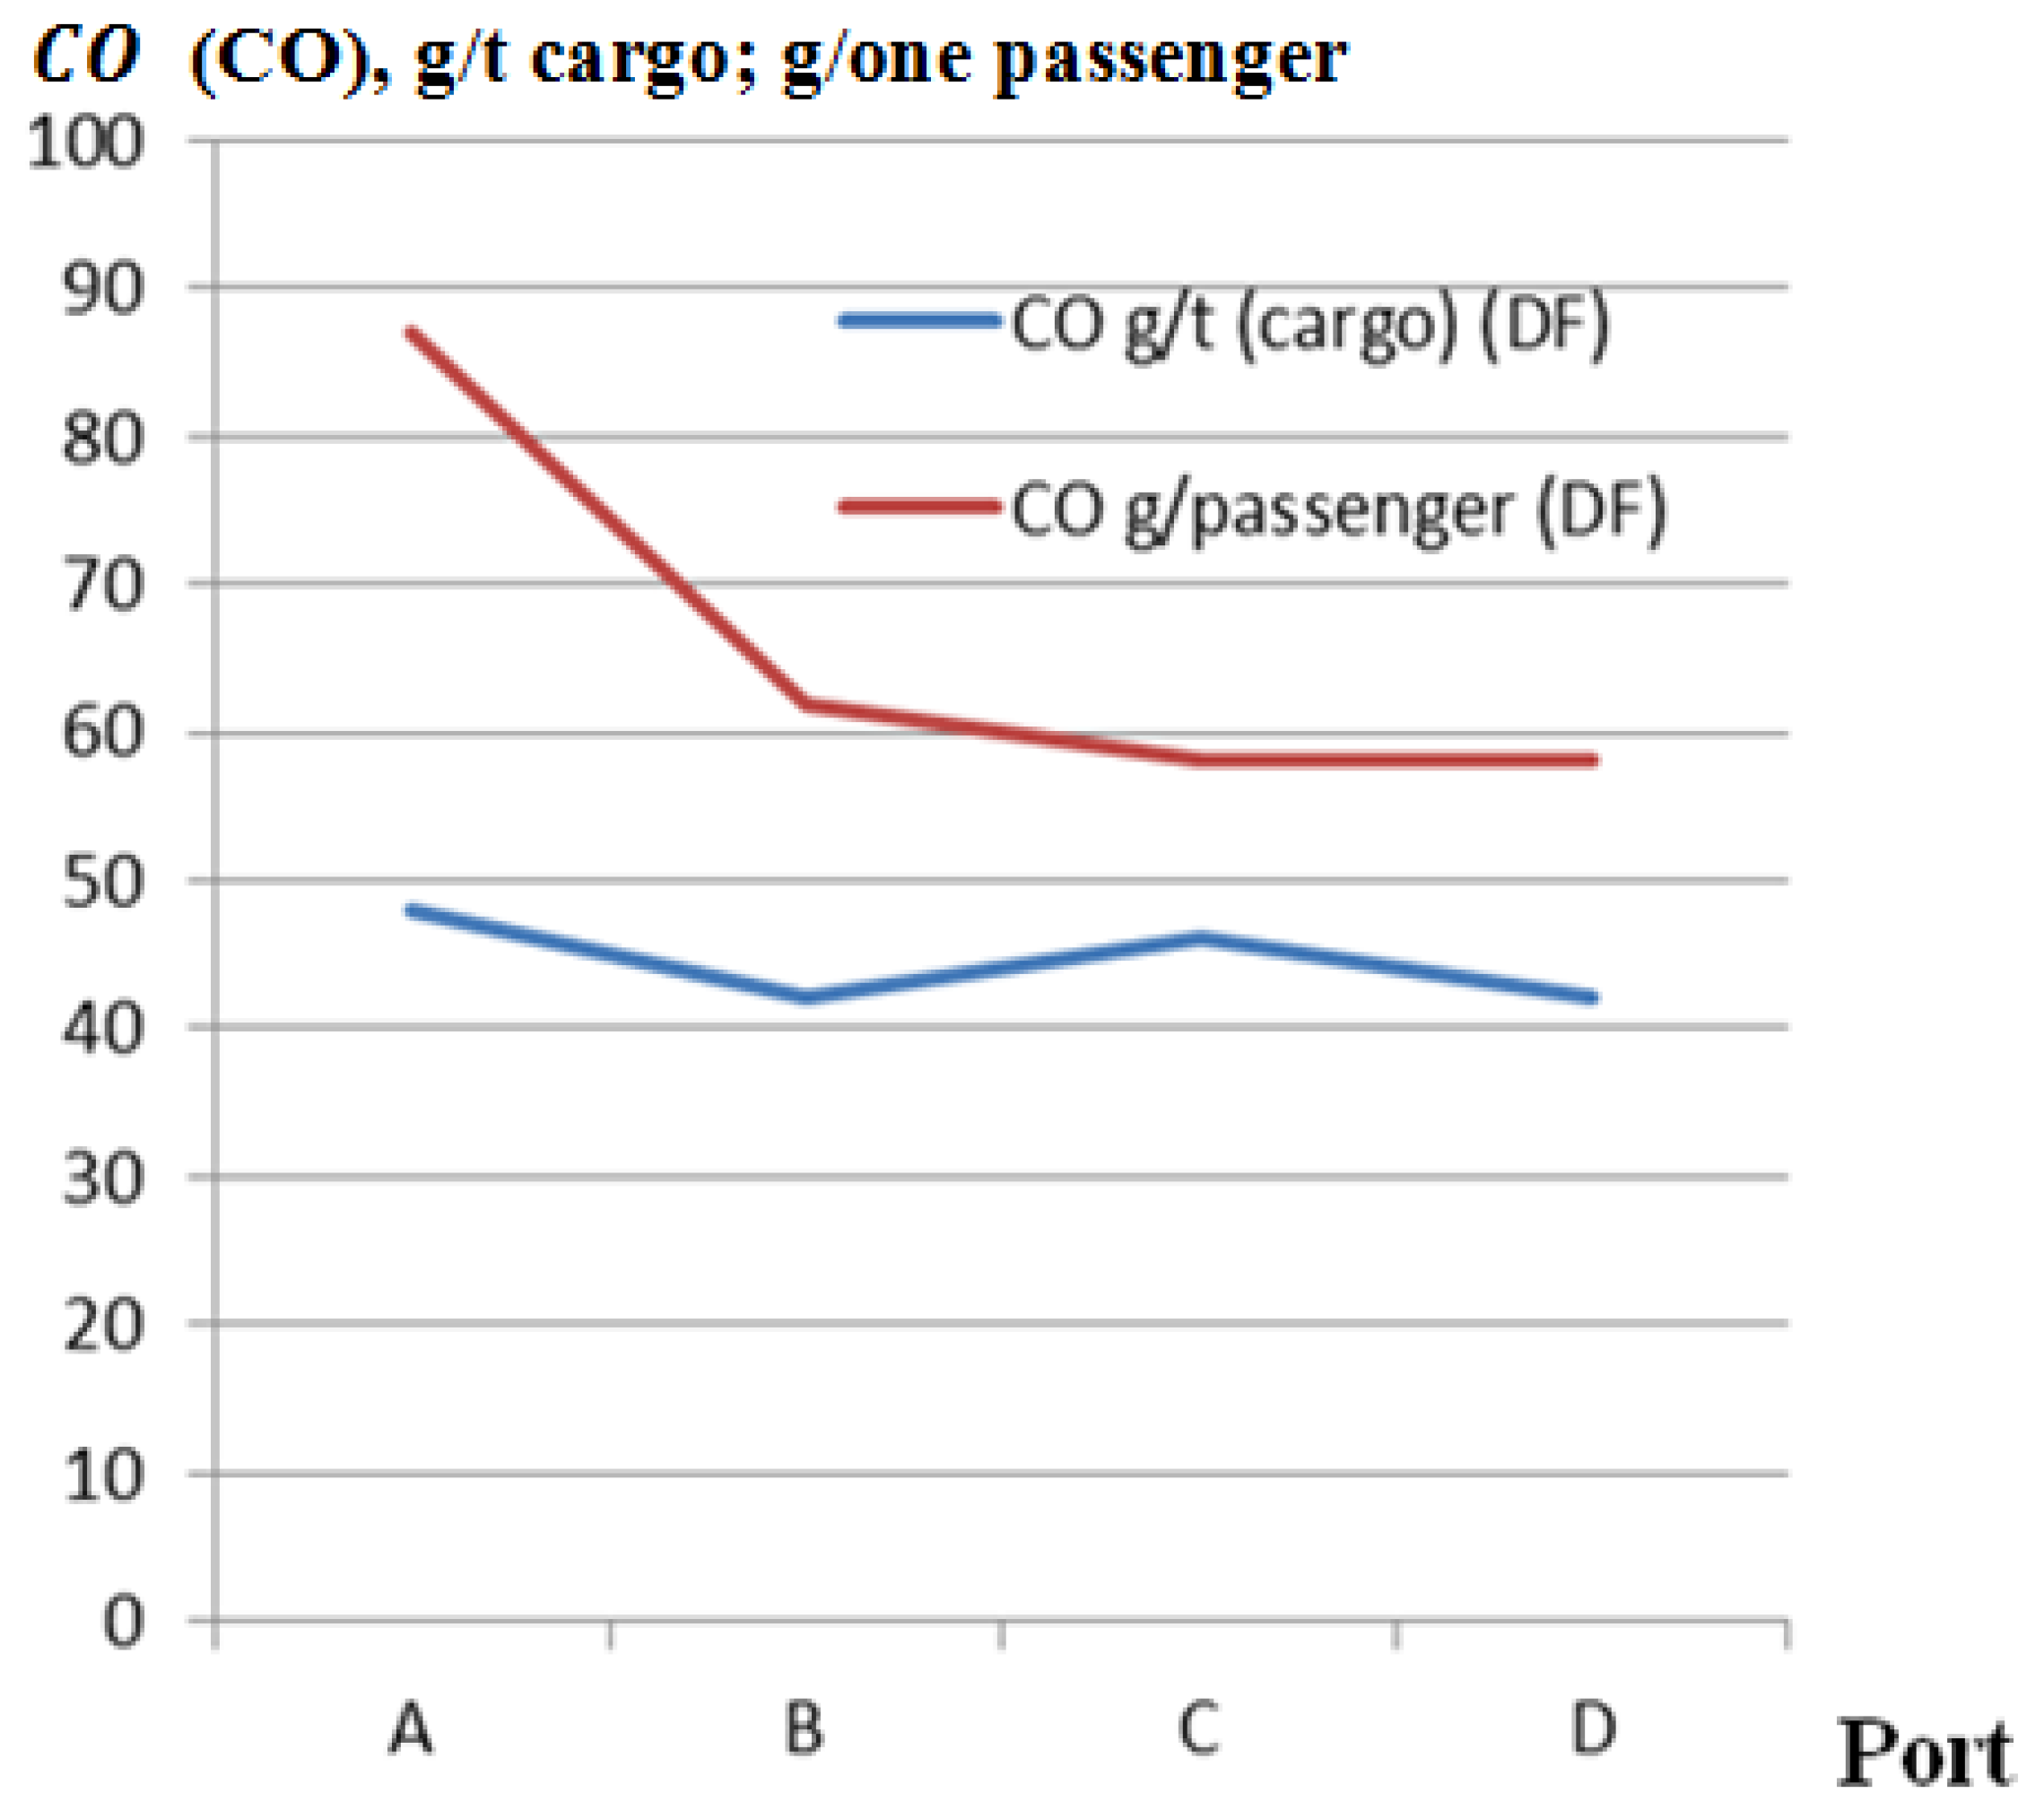
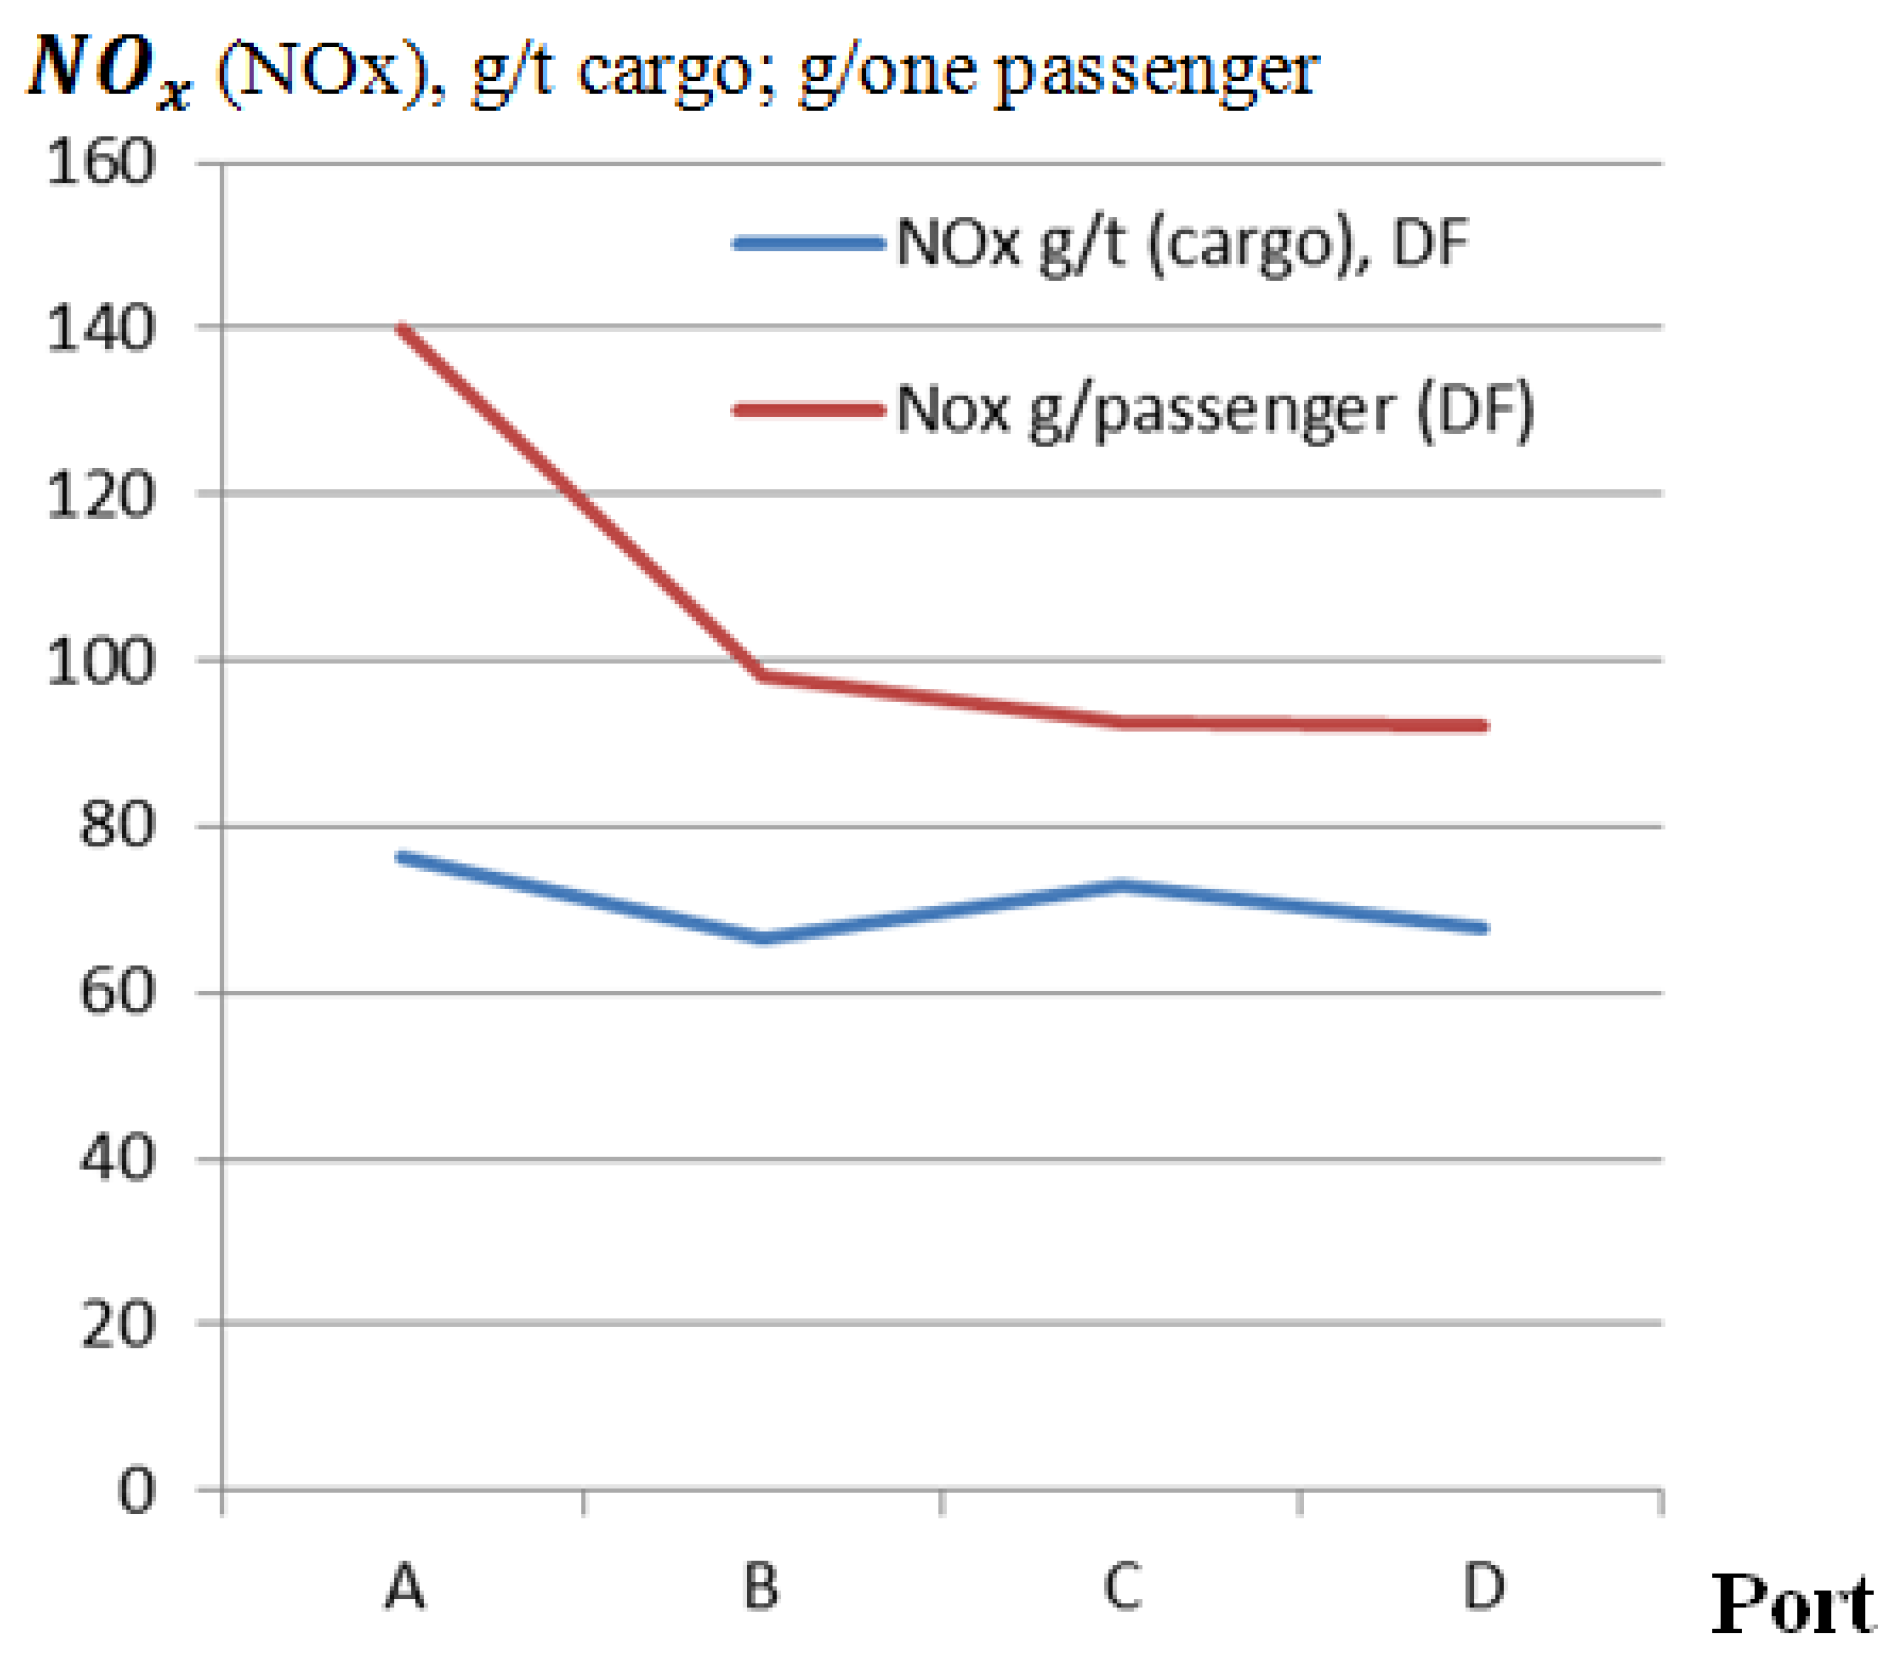
Other generated emissions (
,
and
) are related to the average used power of engines, engine quality, working hours (motor hours) and generated emission coefficients. The product of vehicle power and time (kWh) in millions of units and the total generated
,
and
emissions in the analysed ports are presented in
Table 7.
For the assessment of green transformation in ports, it is more convenient to use relative quantities, for example, data for each tonne of cargo processed and per passenger served in the port. For the selected ports, analogously to the
and
ratios for estimating emission quantities, the amounts of
,
and
generated emissions per tonne of cargo processed and per passenger served are presented in
Figure 4,
Figure 5 and
Figure 6.
Reducing emissions generated in ports can be achieved in the following ways: by improving the quality of the engines used, for example, currently in many European ports newly purchased port machinery must comply with a minimum of the EURO 4 standard and by using more environmentally friendly fuels and electricity in equipment and machinery.
The quality of the engines used, the use of environmentally friendly fuels, and the electrification of equipment and processes, especially the use of “green” electricity obtained from renewable energy sources, i.e., wind, solar, hydro, waves, etc., are of great importance in reducing the amount of emissions generated in ports.
The amount of emissions generated in ports can be reduced in various ways, for example, by using LNG fuel in internal combustion engines and boiler houses, when, in practice, no is generated. Also, as for the reduction of other generated emissions, more environmentally friendly fuels and electrification of equipment and mechanisms can be used.
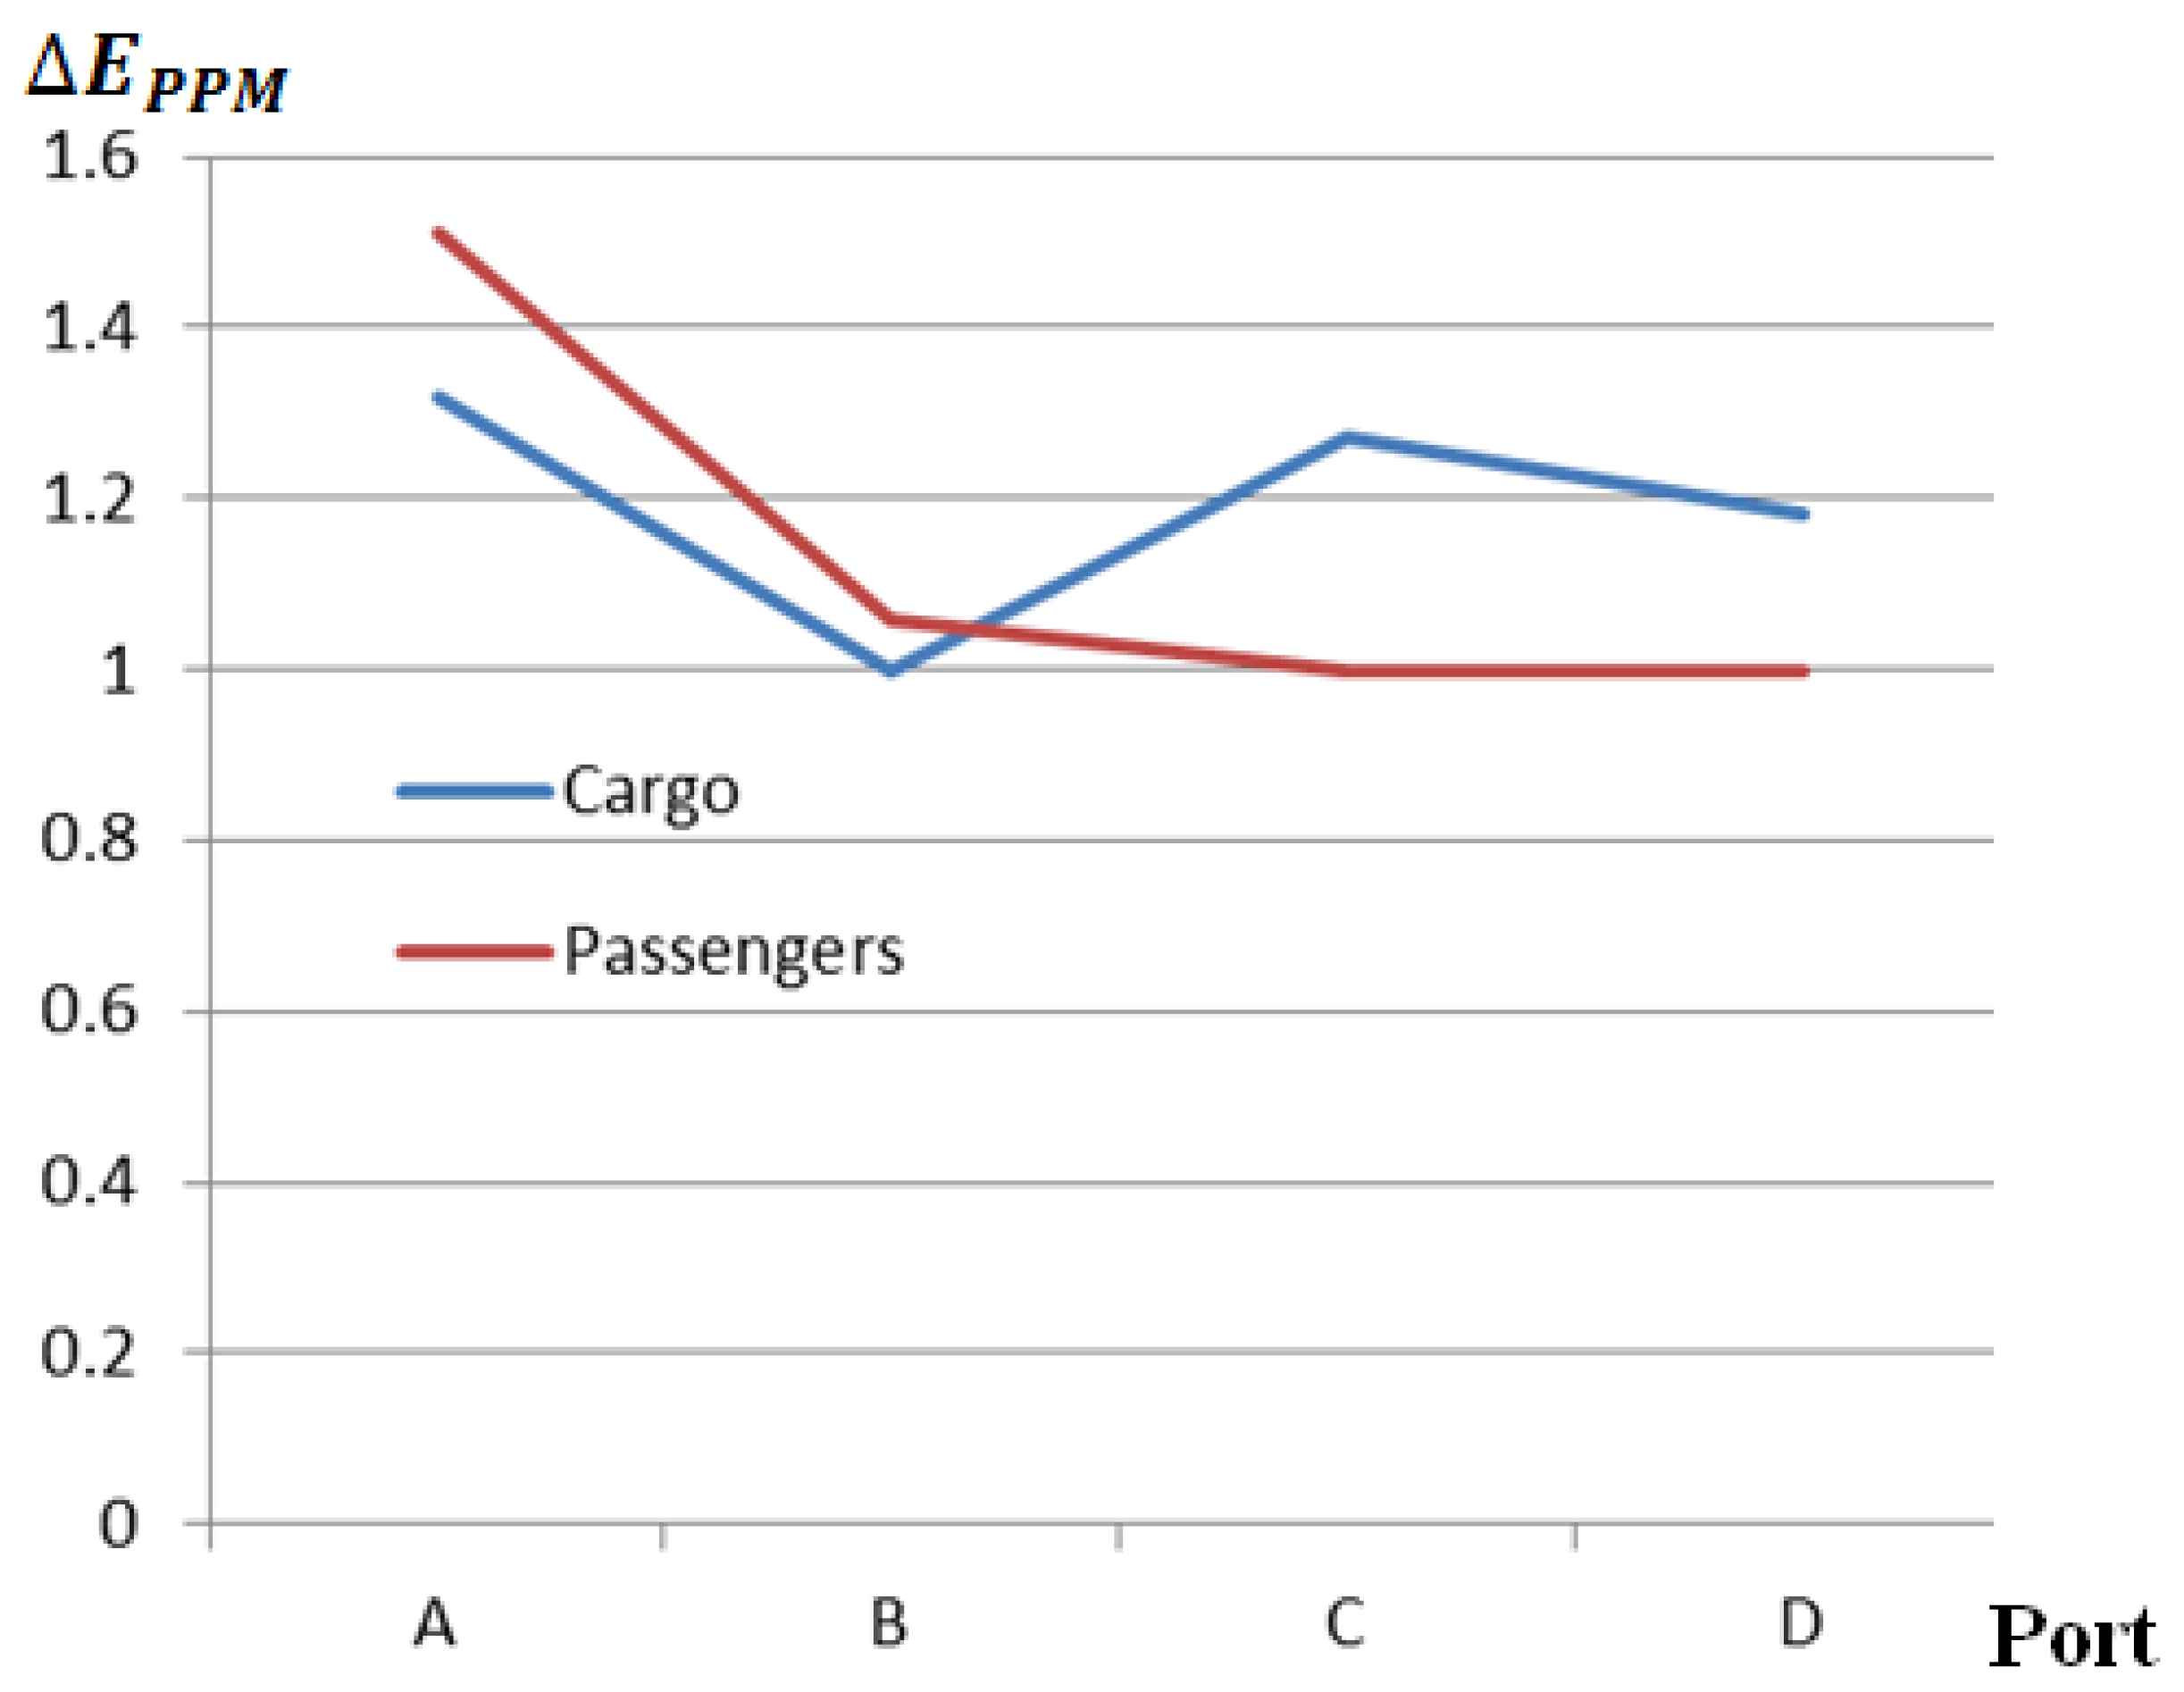
For the mutual comparison of the green transformation situation of ports, it is very important (when comparing the same parameters), using conditional units, to assess the real situation of ports among themselves and at the same time to find ways and means to reduce the impact on the environment. The comparative method is also very important, because it would be possible to adopt good practices from one port to another and to develop scientifically based assessment and environmental impact reduction methodologies and practical options. Using the methodology presented in
Section 3, mutual assessments of ports were carried out using relative amounts of generated emissions per tonne of cargo processed and per passenger served in the port. The benchmark index results for the analysed ports are presented in
Figure 7,
Figure 8,
Figure 9,
Figure 10 and
Figure 11.
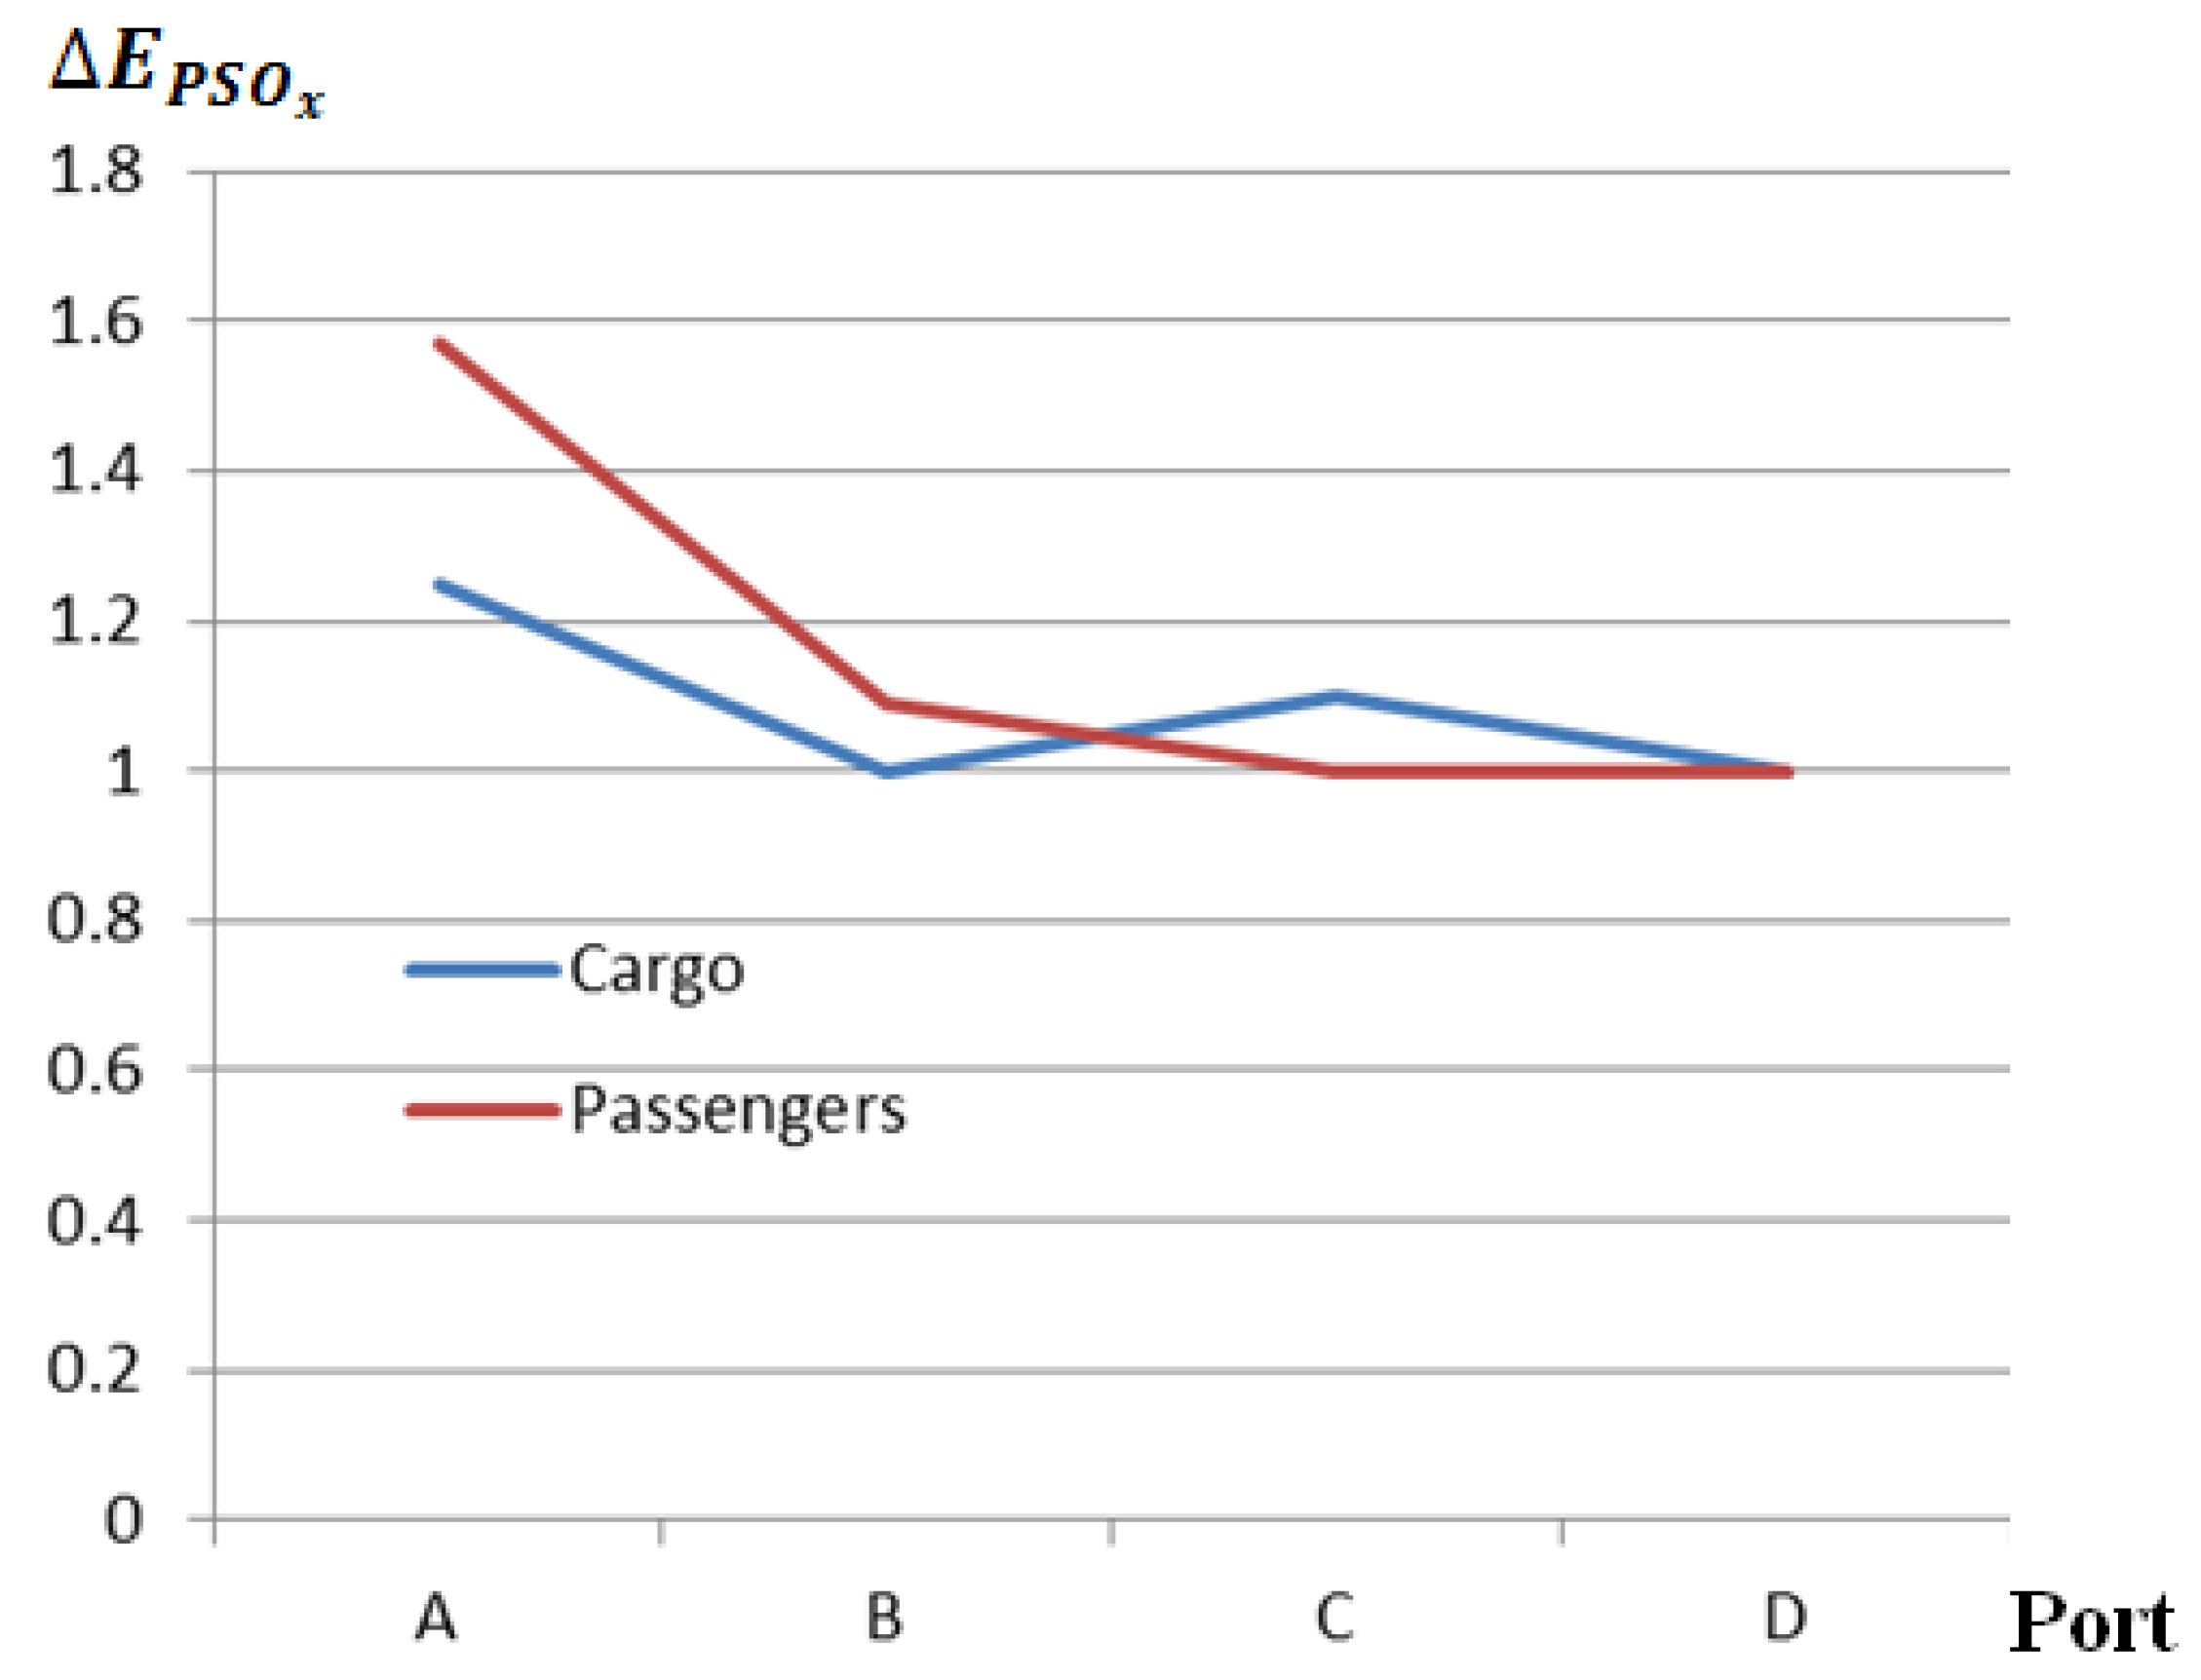
As can be seen from the comparative results of the generated in ports, the relative size of these emissions generated in port A when serving passengers is about 50% higher compared to ports C and D, which orients the installation of equipment and technologies with less environmental impact, as well as “adopting” the good experience of ports C and D. Since emissions generated from ships were assessed when serving passengers, it is very important that ships install more environmentally friendly types of fuel, such as LNG, and that ships transporting passengers are connected to shore power grids when they are at the port.
The emissions of generated in Port A during cargo processing and passenger service are significantly higher than in other ports; therefore, it is very important for Port A to adopt the “good” experience of other ports and to seek technologies and methods for implementing more environmentally friendly forms of energy.
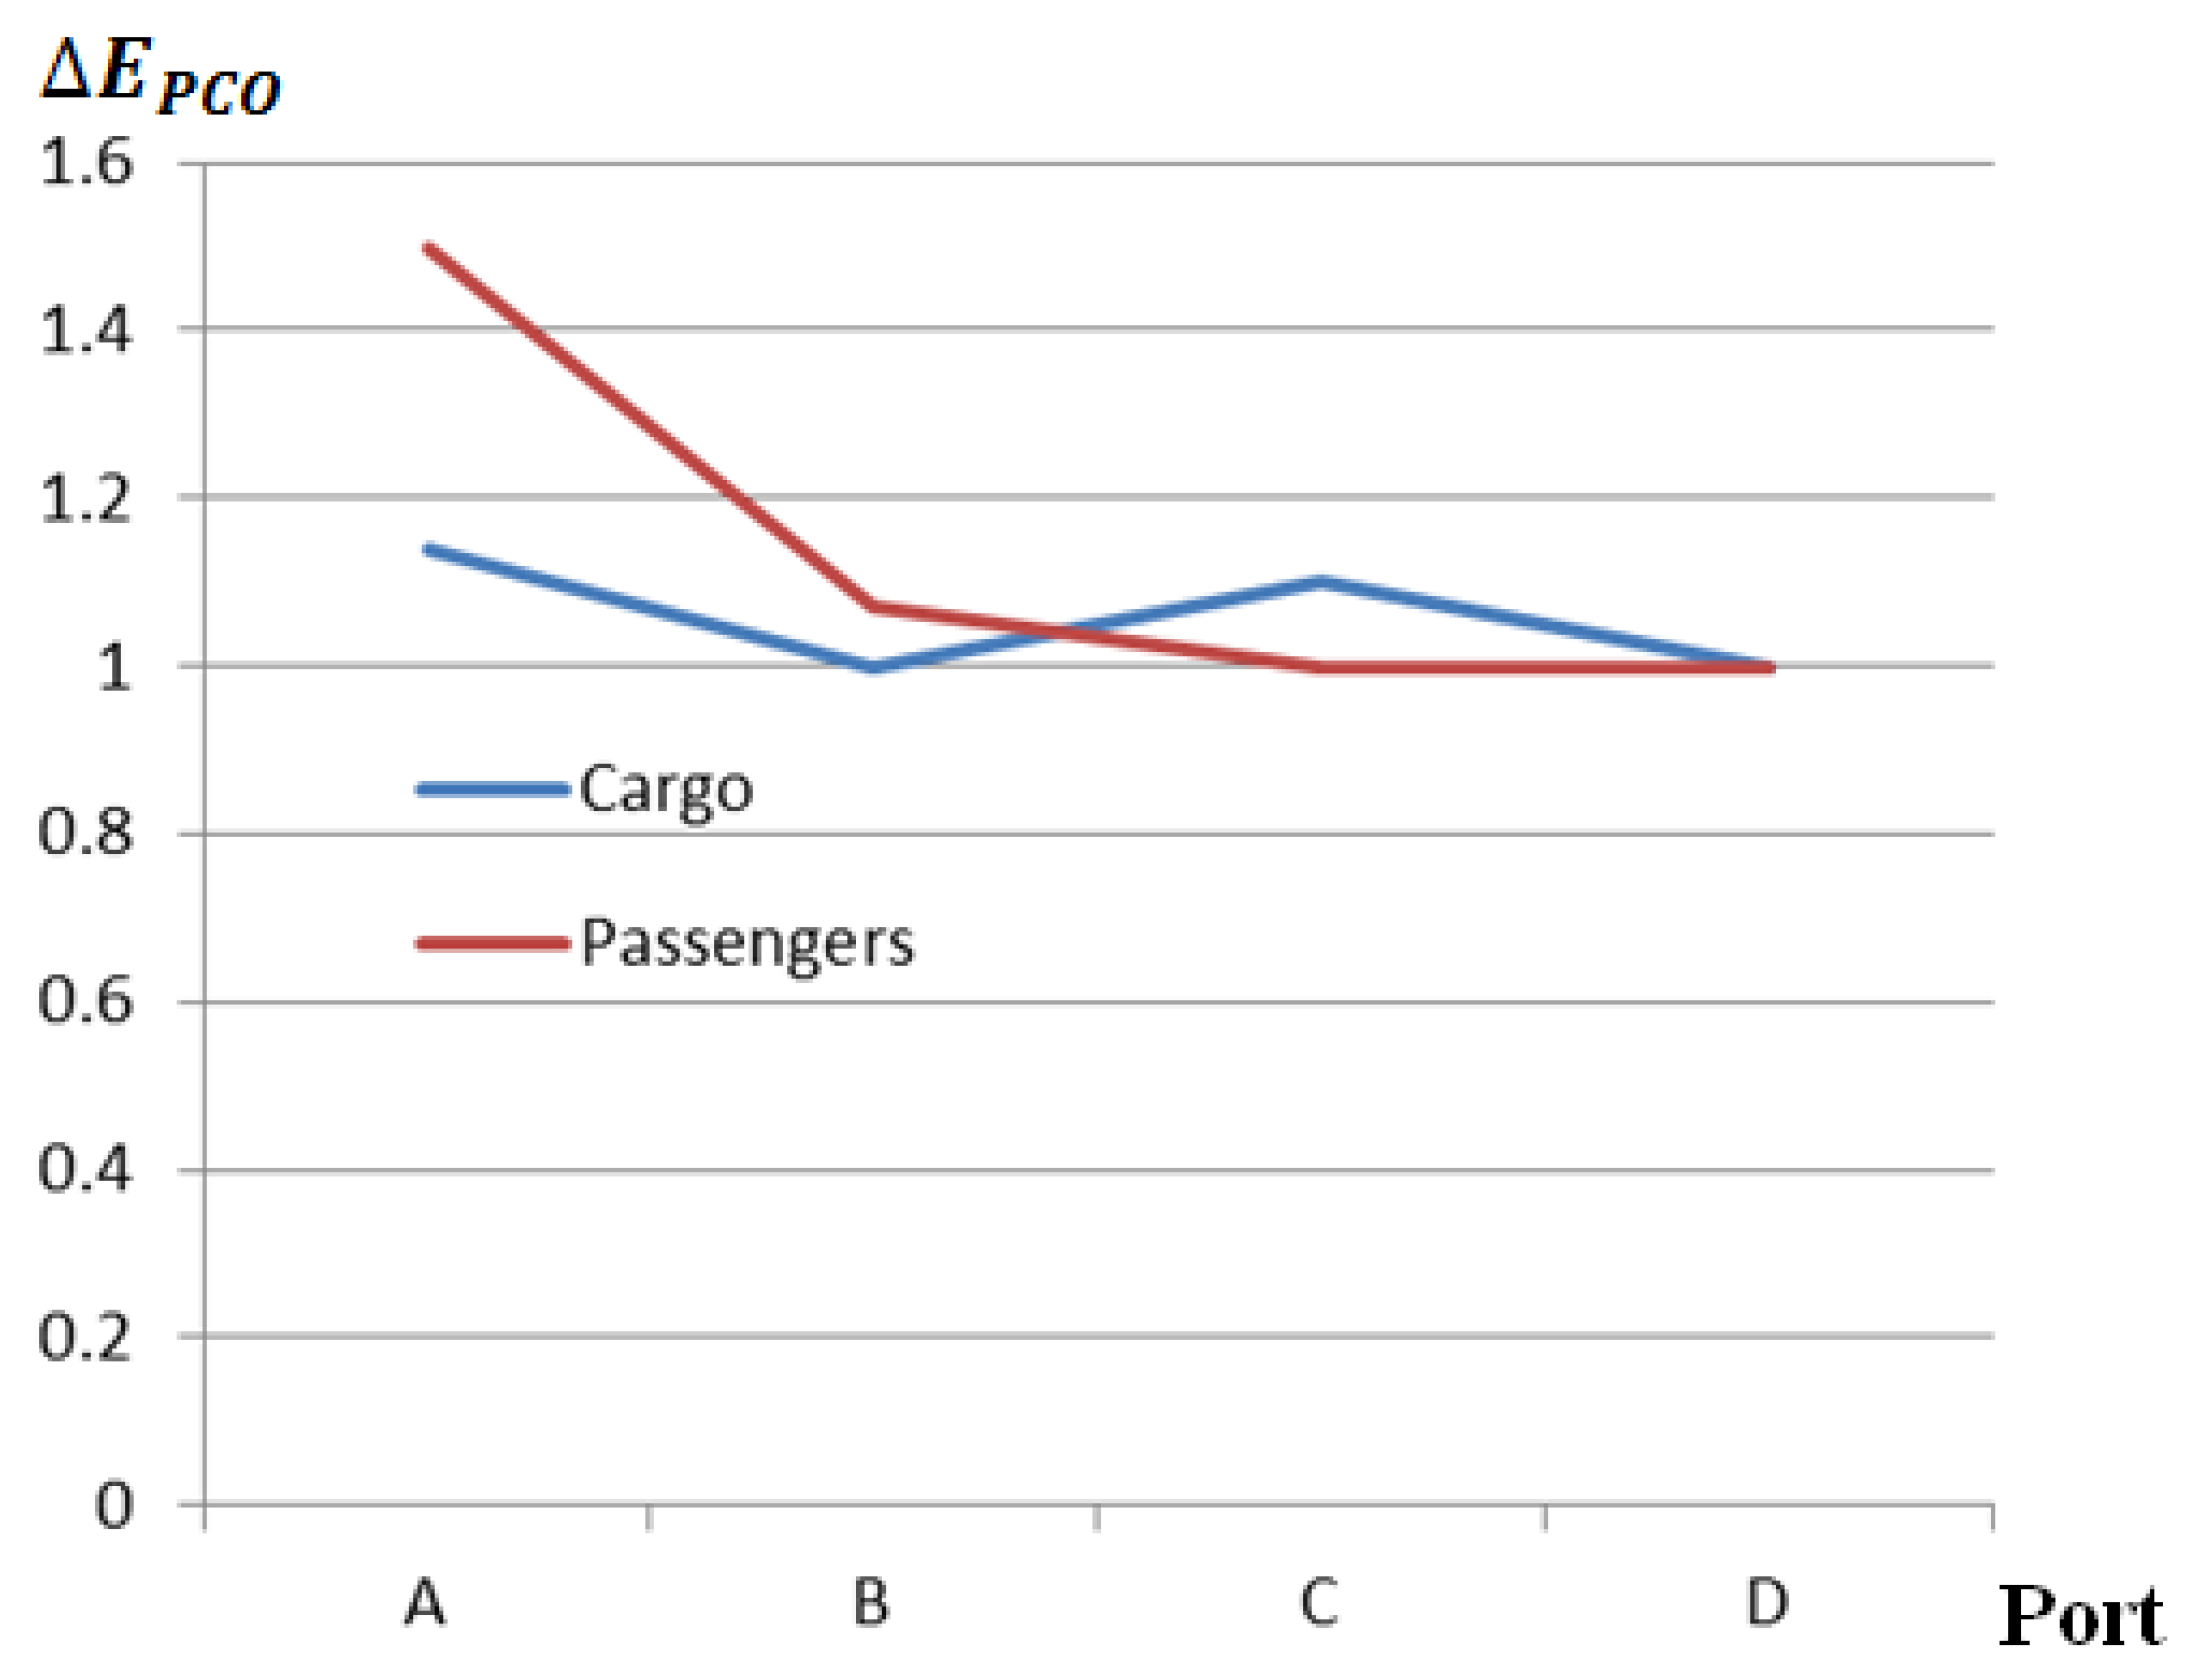
The relative emissions generated in the analysed ports during passenger service differ significantly in different ports, i.e., when comparing Port A and the other ports under study, the difference is about 1.5 times. Since only ships are used for passenger service in the assessment, the reduction of generated emissions, including , can be achieved by changing the energy types of passenger ships, i.e., by using LNG or other more environmentally friendly fuels.
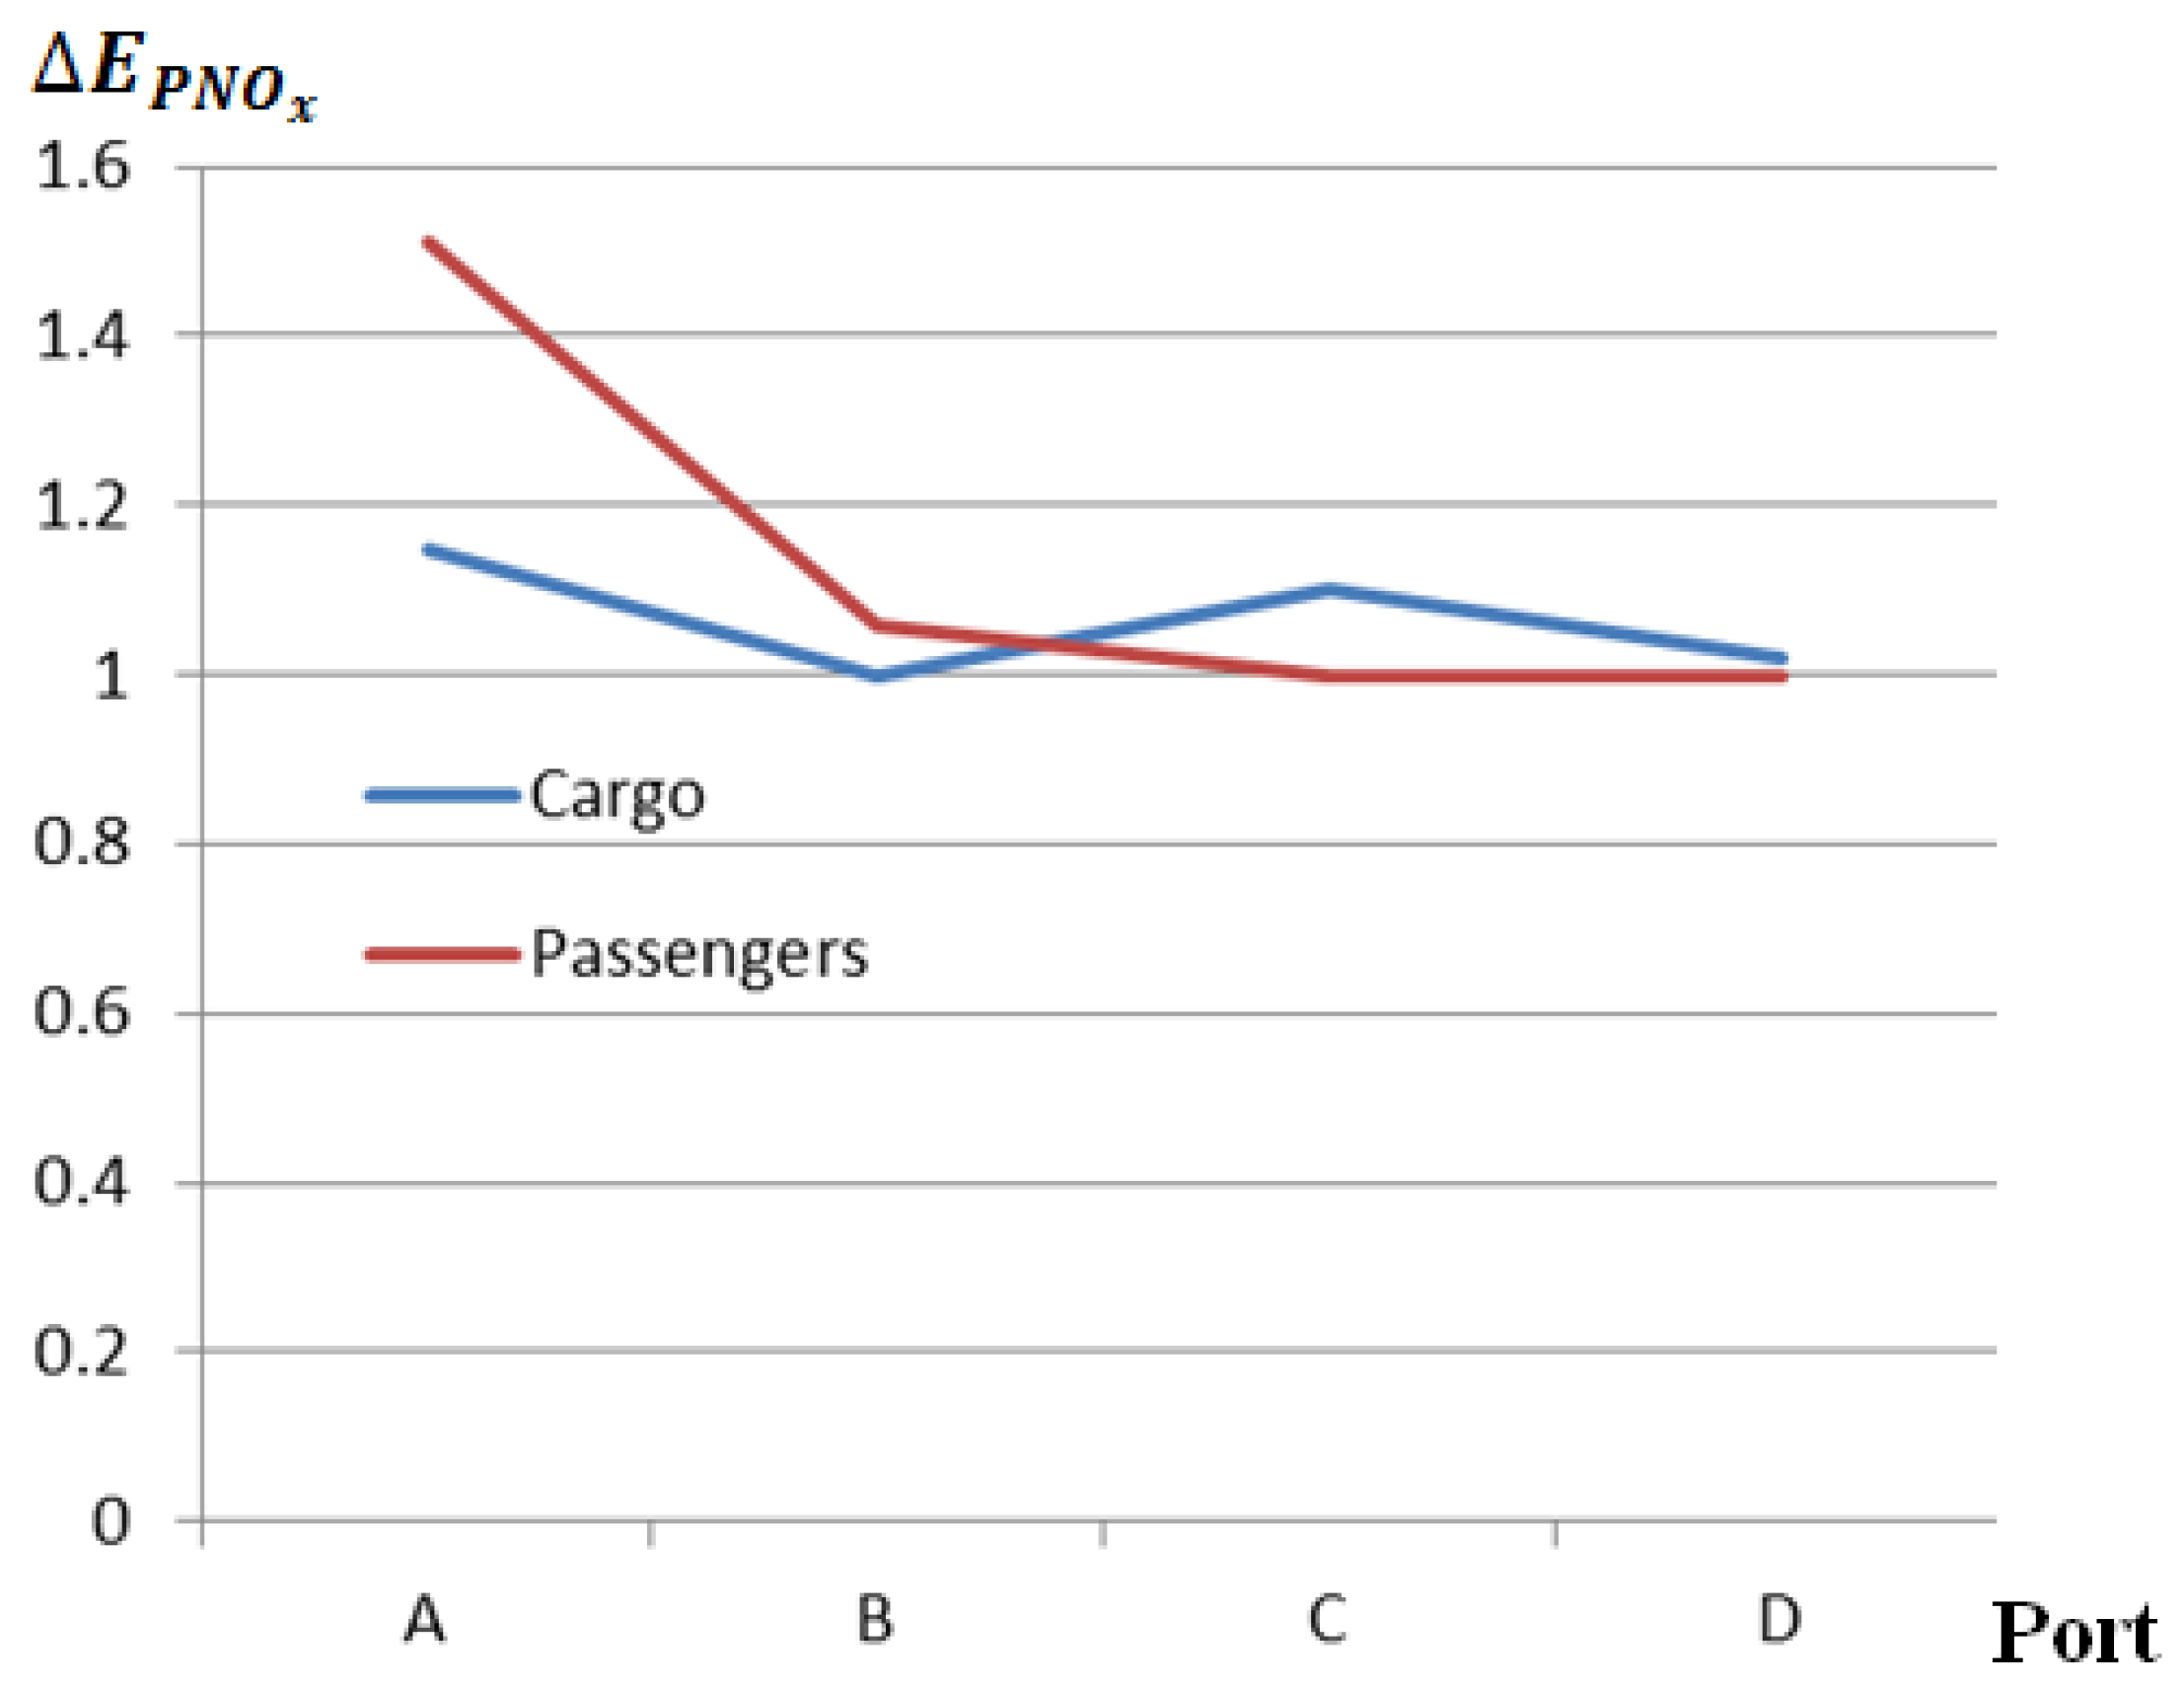
Nitrogen oxide emissions generated in the analysed ports have a particularly negative impact on the environment and, as can be seen from the obtained relative values of , about 50% more is generated per passenger service in the analysed port A compared to the other analysed ports. To reduce nitrogen oxide emissions, more environmentally friendly fuels and new and more efficient ship and other equipment engines can be used.
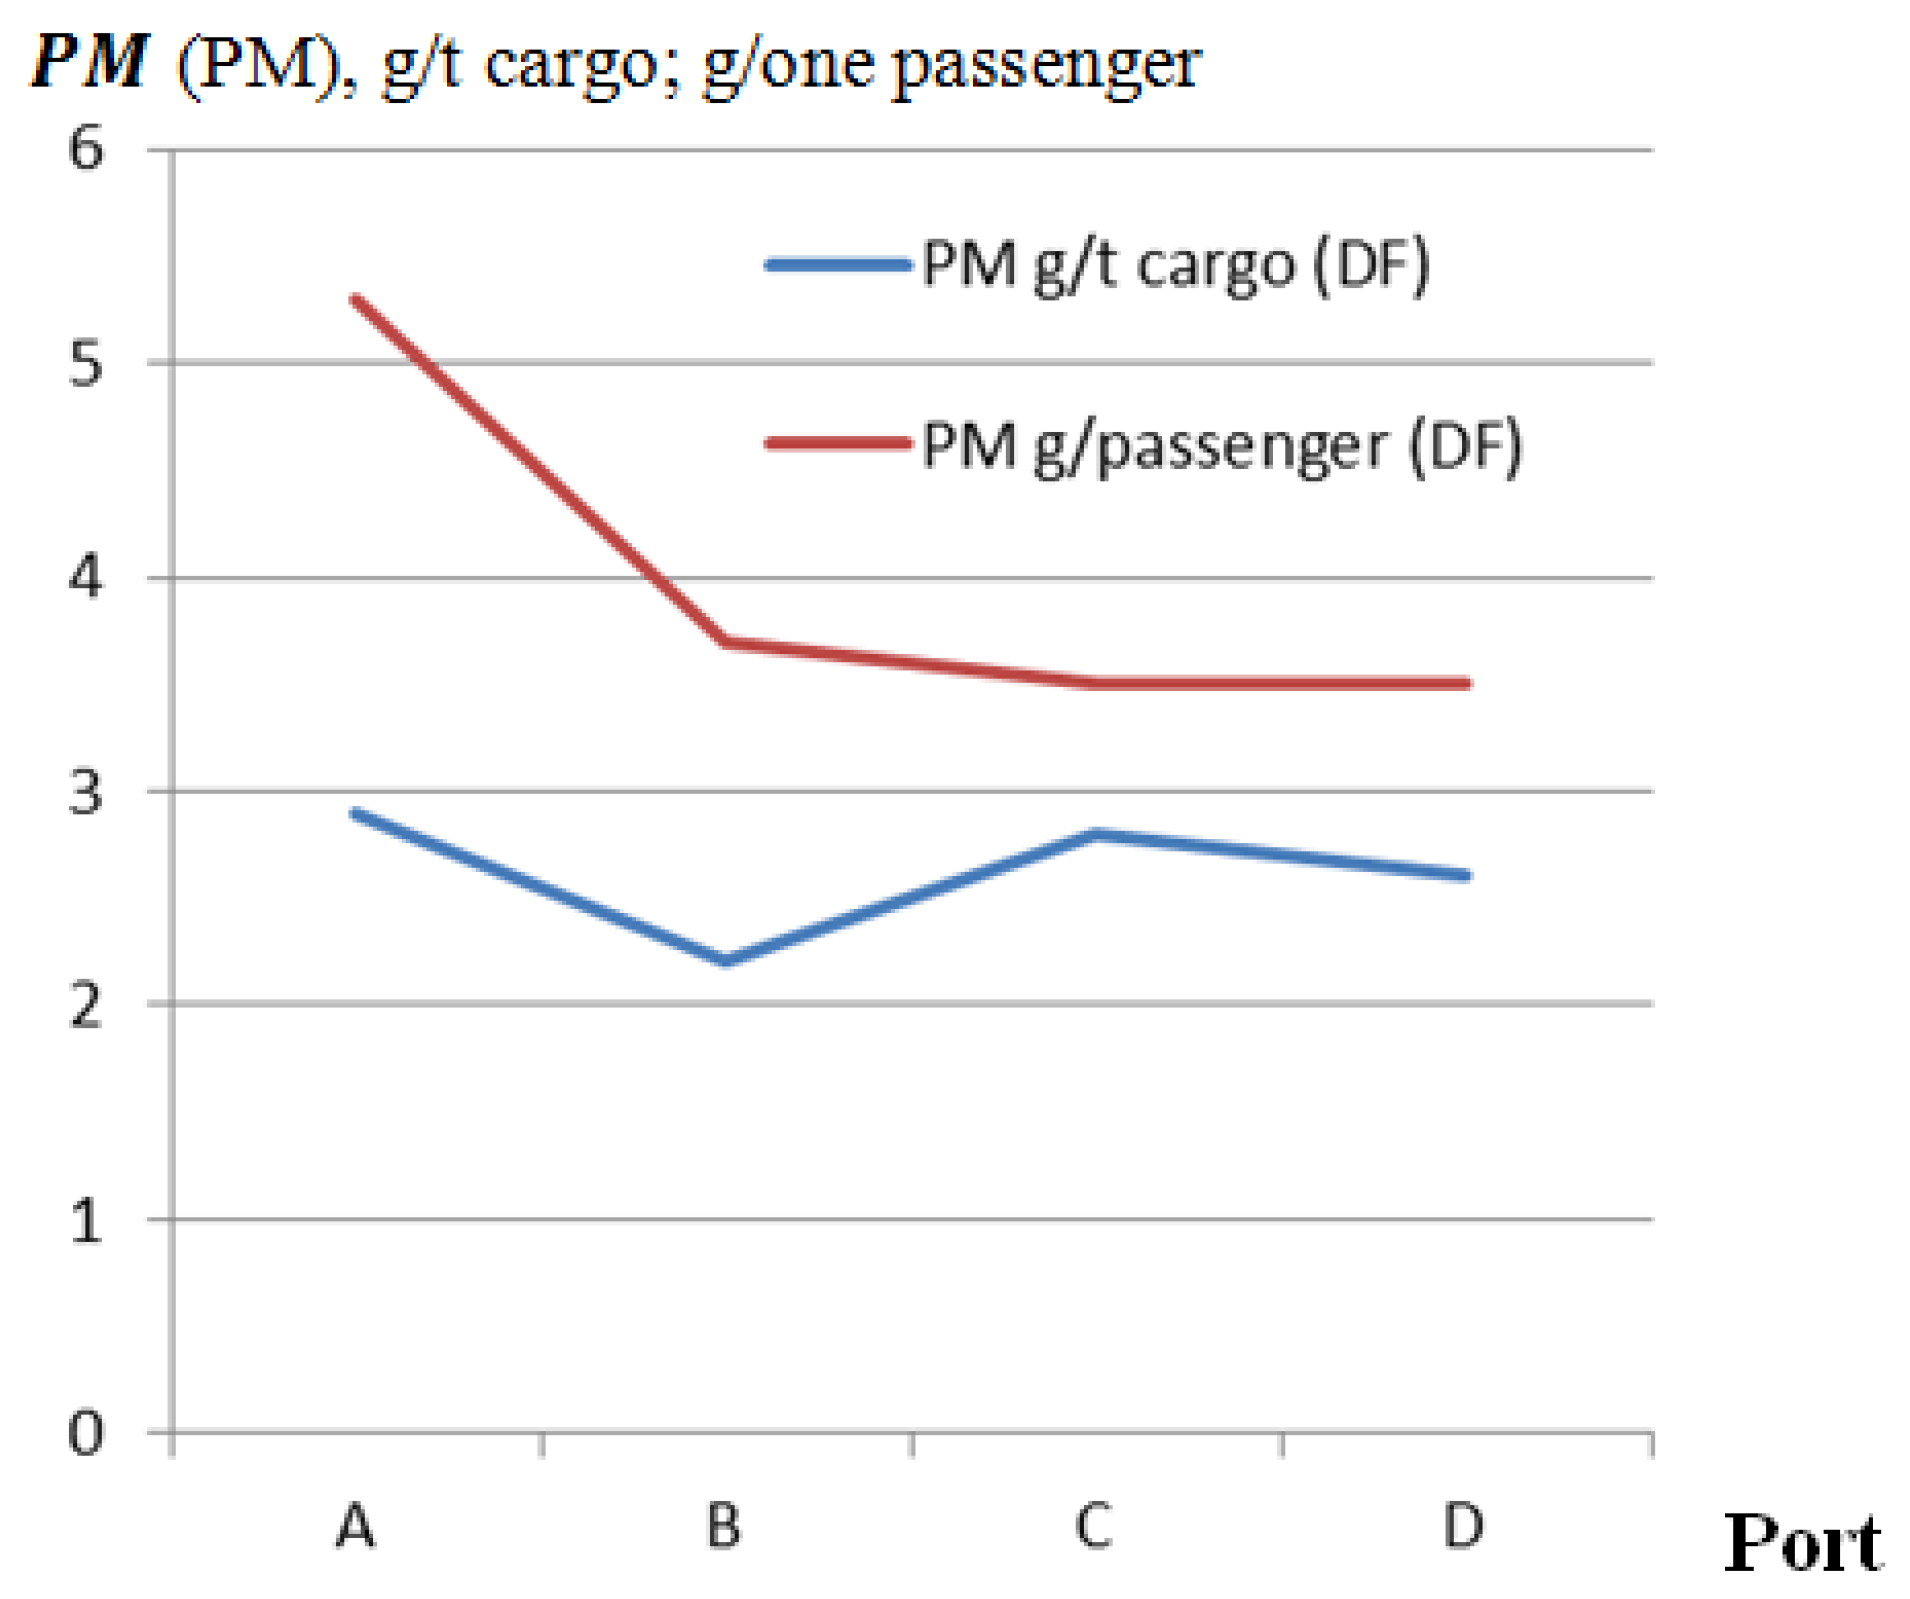
Particulate matter () emissions in the analysed ports A and C are significantly higher compared to the PM emissions generated in the analysed ports B and D. In this way, the good practices of ports B and D can be used to reduce particulate matter emissions.
The developed methodology for the green transformation of ports allows assessing the readiness of ports (port authorities and port terminals) and the implementation of green transformation. The introduction of mandatory taxes for generated emissions, for example, the amount of generated forces port authorities and terminals to implement new, more environmentally friendly types of energy and new technologies.
The comparative indices of the ports selected for the study clearly show which of the ports is in a better green transformation situation and what ports should do to improve their situation in terms of environmental impact.


